Embed Size (px)
Citation preview

Anexos
389
VII. ANEXOS


Anexos
391
VII.1. Abreviaturas
(24S)-HC: (24S)-hidroxicolesterol
-CE: colesterol-5 ,6 -epóxido
-CE: colesterol-5 ,6 -epóxido
27-HC: 27-hidroxicolesterol.
7 -HC: 7 -hidroxicolesterol
7 -HC: 7 -hidroxicolesterol
7-CC: 7-cetocolesterol
A : radical antioxidante
a.ol.: alto en ácido oleico
AFNOR: Association Française de Normalisation
AG: Ácidos grasos
AGI: Ácidos grasos insaturados
AGL: Ácidos grasos libres
AGPI: Ácido grasos poliinsaturados
AGPI: Ácidos grasos poliinsaturados
AGS: Ácidos grasos saturados
AH: antioxidante
ANOVA: analysis of variance
AOAC: Association of Official Analytical Chemists
AOCS: American Oil Chemists´ Society
AOM: Active oxygen method
ASTM: American Society for Testing and Materials
ATB: Ácido 2-tiobarbitúrico
b.er: bajo en ácido erúcico
BHA: Butilhidroxianisol
BHT: Butilhidroxitolueno
BOE: Boletín Oficial del Estado
BSI: British Standard Internacional
CCF: Cromatografía en capa fina
CD: Constante Dieléctrica
CEE: Comunidad Europea

Anexos
392
CG: Cromatografía de gases
CHP: Hidroperóxido de cumeno
CLAE: Cromatografía líquida de alta eficacia
CP: Compuestos Polares
CT: colestantriol
CV: Coeficiente de variación
d.i.: diámetro interno
DC: Dienos conjugados
DG: Diacilgliceroles
DGF: Deutsche Gesellschaft für Fettwissenschaft
Dim: Dímeros
DMSO: Dimetilpolisiloxano
EDTA: ácido etilendiaminotetracético
EM: Ésteres metílicos
ENV: Envasado
ET: Extracto de tocoferol
Euro Fed Lipid: European Federation for the Science and Technology of Lipids
FAME: ésteres metílicos de los ácidos grasos
FID: flame ionization detector
FOS: Food Oil Sensor
FOX: Ferrous oxidation xylenol orange
FTIR: Fourier Transform Infrared Spectroscopy
GC/MS: Cromatografía de gases/Espectrometría de masas
HMG-CoA: Hydroxametilglutaril coenzima A
HPL: Hidroperóxidos lípidicos
GA: grado de acidez
IA: índice de acidez
IAn: índice de p-anisidina
IC: índice de carbonilos
II: índice de yodo
IP: índice de peróxidos
IR: índice de refracción
ISO: Internacional Standard Organization
IUPAC: International Union of Pure and Applied Chemistry

Anexos
393
JOCS: Japan Oil Chemists´ Society
L : radical alquilo
LD: Dosis Letal
LDL: Low-density Lipoprotein
LH: molécula lipídica
LO : radical alcoxilo
LOO : radical peroxilo
LOOH: hidroperóxido lipídico
MANOVA: multifactor analysis of variance
MC: Monómeros cíclicos
MDA: Malondialdehído
MG: Monoacilgliceroles
MOE: Margen de exposición
NCPA: National Cottonseed Products Association
NOAEL: Non Observed Adverse Effects Level
OSET: Oxidative stability at elevated temperature
PA: Palmitato de ascorbilo
POL: Polímeros
TA: Tiempo de almacenamineto
TBHQ: tert-butilhidroxiquinona
TC: Trienos conjugados
TCA: Tricloroacético
TEP: 1,1,3,3- tetraethoxypropane
TFRIT: Tiempo de fritura
TG: Triacilgliceroles
THF: Tetrahidrofurano
TPP: Trifenilfosfina
UNE: Una Norma Española
UV: Ultravioleta
Vis: Viscosidad

Anexos
394
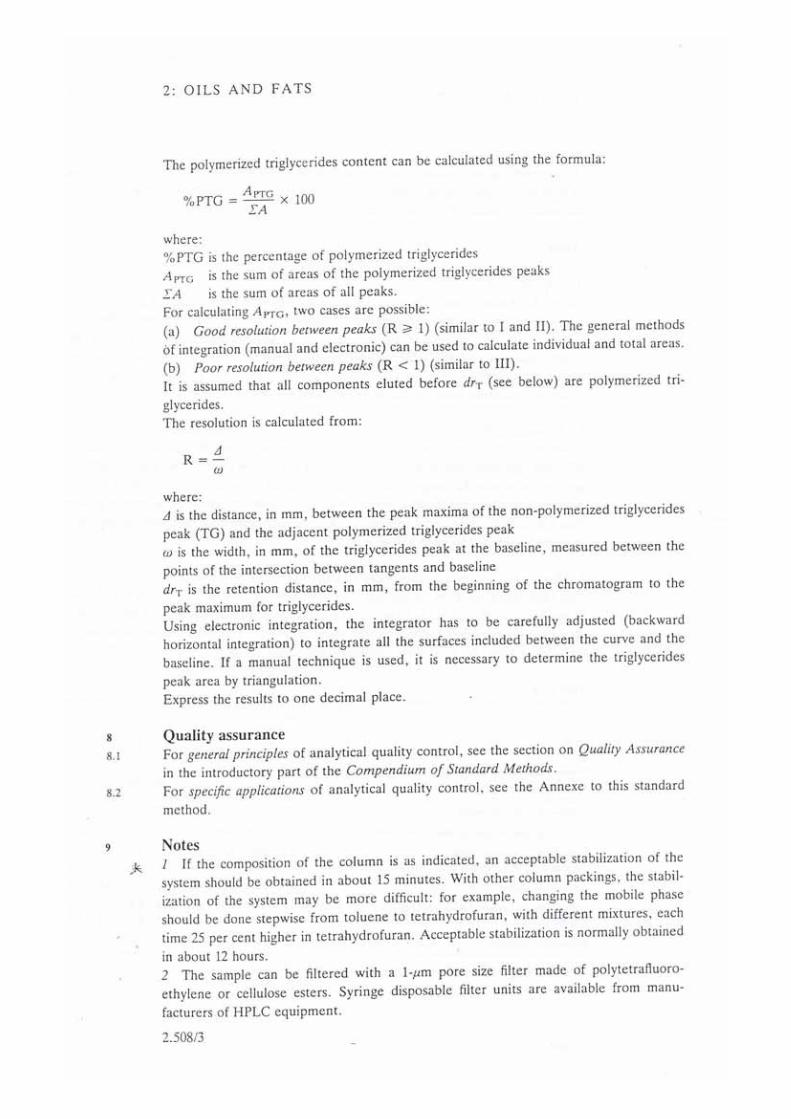
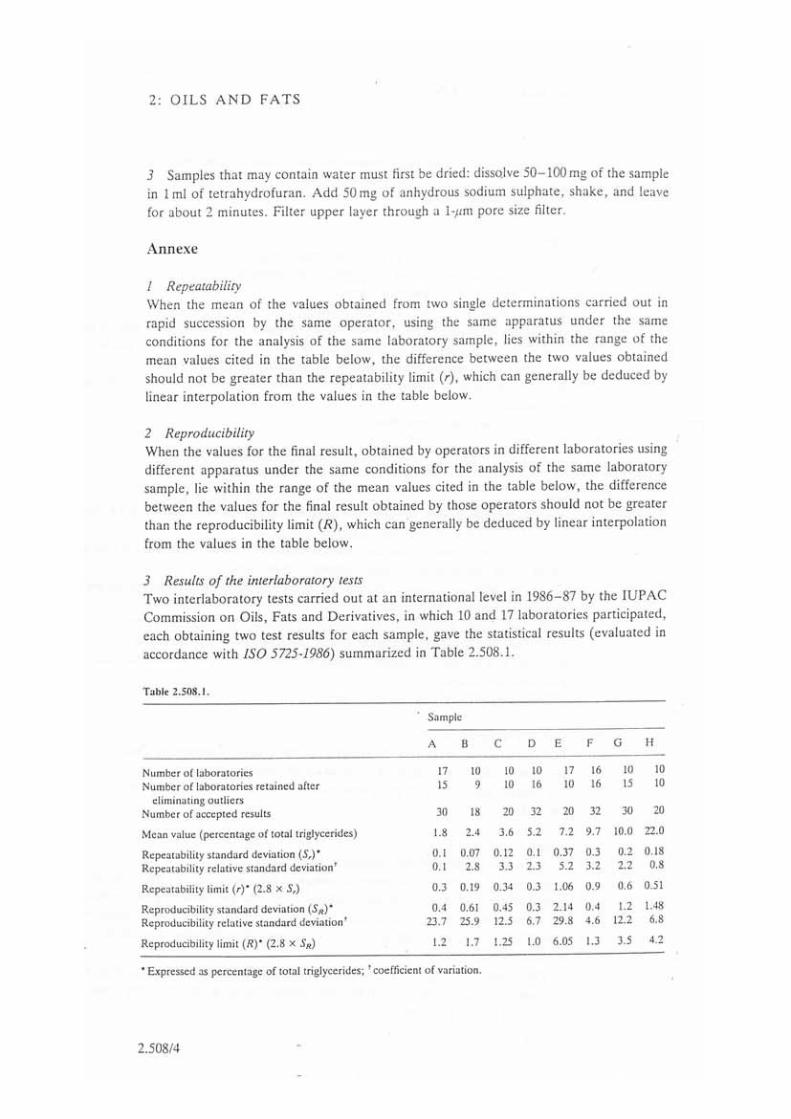
VII.2. Métodos Oficiales


Anexos
413
VII.3. Comunicaciones en congresos

A.Tres, J.A. Navas, F. Guardiola, R. Bou and R. CodonyUniversity of Barcelona, Faculty of Pharmacy, Nutrition and Food Science Department- CeRTA.
Av. Joan XXIII s/n, 08028 Barcelona. Spain. [email protected]
LIPID HYDROPEROXIDE DETERMINATION IN SNACKS FRIED IN VEGETABLE OILS THROUGH A MODIFIED FERROUS OXIDATION-XYLENOL ORANGE METHOD
We first applied a slightly modified FOX method, as described by Grau et al. (2000) to the lipid extracts from various snacks; however when the sample was added to the reaction medium, turbidity became evident at very low lipid extract
concentrations.
INTRODUCTIONThe stability of fried foods is affected by lipid oxidation, which yields both primary and secondary oxidation compounds. Determination of lipid hydroperoxides (primary oxidation compounds) is used to monitor lipid
oxidation in fried foods. Several ferrous-xylenol orange (FOX) methods have been used to measure lipid hydroperoxide (LHP) content in foods and biological samples. In these methods, ferrous ions are oxidized by LHPsto ferric ions, which bind xylenol orange (XO) and develop a blue-purple complex with an absorbance maximum of 550-600 nm. In certain conditions, the FOX methods that use alcohol-based reaction media show turbidity when applied to vegetable oils and lipid extracts. Turbidity occurs as a consequence of the precipitation of certain lipids when the sample is added to the FOX reaction medium. In some cases, a centrifugation step is used
to clarify the reaction mixture prior to the spectrophotometric reading; however, this is a time-consuming procedure. If the polarity of the reaction medium decreases the lipids do not precipitate. Thus, when using chloroform:methanol (7:3, v/v) as the main solvents in the FOX reaction medium, Shantha and Decker (1994) did not observe turbidity when the method was applied to fats and oils. However, the response obtained using
alcohol-based media is 1.5 times greater than when chloroform:methanol (7:3, v/v) is used as the base for the medium.
OBJECTIVESThe main objective of this study is to set up a FOX method that will determine LHP in lipid extracts from snacks fried in vegetable oils, but which, unlike
methods that rely on alcohol reaction media, avoids turbidity without losing sensitivity.
MATERIAL AND METHODSReagents and standardsXylenol orange (XO) (ACS grade) and ethanol (96%, HPLC grade) were purchased from Scharlau (Barcelona, Spain). Cumene hydroperoxide (CHP) was from Sigma (St. Louis, MO, USA). Triphenilphosphine (TPP) was from Aldrich (Steinheim, Germany), and hydrochloric acid (35%), sulfuric acid (96%) and ammonium ferrous sulfate hexahydrate (analytical grade) were from Panreac (Barcelona, Spain). All other solvents used (HPLC grade) were from SDS (Peypin, France). Distilled deionized water was used throughout.Lipid extractionLHPs were determined in lipid extracts from several snack foods, which had been fried in soybean oil, sunflower oil, palm olein, palm olein/sunflower oil blends, and palm olein/soybean oil blends. Lipid extraction was performed using a high-speed homogenizatorwith chloroform:methanol (2:1, v/v).
1) 500 L of 1 mM aqueous ferrous ammonium sulfate
5) 200 L of the lipid extract dissolved in ethanol2) 200 L of 0.25 M
methanolic H2SO4
3) 200 L of 1 mMmethanolic XO
4) 900 L of methanol
Figure 1. Grau et al. (2000) method
(In the original method the peroxide
extract was dissolved in methanol,
which is unable to dissolve lipid
extracts)
In order to avoid precipitation of the lipid extracts in the reaction medium, water content of the medium was reduced to
100 L, whilst the same concentration of ferrous ions in the final reaction mixture was maintained. Any further reduction of the water content produced a loss of
sensitivity.
However, turbidity still occurred at concentrations of 0.5 and 0.6 mg of lipid extract/mL reaction medium (lipid extracts from snacks fried in palm olein and sunflower oil, respectively) (Figure 6). The
concentration of LHP in these quantities of lipid extracts was not enough to ensure optimal absorbance [0.7-0.8, as recommended by Grau et al. (2000)]. Thus, a further decrease of the polarity
of the reaction medium was necessary to avoid the precipitation of certain lipids.
For all the FOX reaction conditions assayed in this study, incubation was carried out in glass cuvettes with Teflon caps for 30 minutes.
1) 100 L of 5 mM aqueous ferrous ammonium sulfate
2) 200 L of 0.25 M methanolic H2SO4
3) 200 L of 1 mMmethanolic XO
4) 1300 L of methanol
5) 200 L of the lipid extract dissolved in
dichloromethane:ethanol(3:2,v/v)
Figure 2. Methanol modified method
In a further attempt to avoid turbidity we decreased the polarity of the medium by experimenting with less polar solvents as substitutes for methanol. None of the several solvents used
[dichloromethane:methanol (7:3, v/v) (D/M 7:3), dichloromethane:ethanol (3:2, v/v) (D/E 3:2) and chloroform:methanol (7:3, v/v) (C/M 7:3)], showed problems of turbidity at a concentration of 20 mg
of lipids extracted from a snack fried in palm olein/ mL reaction medium. However, for some of these solvents a great reduction in response was observed. We thus tested the response obtained with
the same solvents using a known concentration of CHP and using methanol (M) and ethanol (E) as controls for the response (Figure 3).
0,0
0,2
0,4
0,6
0,8
M E D/M
7:3
D/E
3:2
C/M
7:3
Figure 3. Absorbance obtained using FOX media with different solvent compositions. Reaction media consisted of 100 L of 5 mM aqueous ferrous ammonium sulfate, 200 L of
0.25 M methanolic H2SO4, 200 L of 1mM methanolic XO, 1300 L of solvent and 200 L of a solution of CHP in the
corresponding solvent (final CHP concentration was 11nmols/ mL reaction medium).
Shantha and Decker (1994) also proposed using HCl instead of H2SO4 in the FOX reaction medium.
Hydroperoxide presence in solvents
When ethyl acetate, butanol or 2-propanol were used instead of methanol, blank cuvettes turned blue after 30 minutes incubation. When these solvents were incubated for 30 minutes with TPP prior to the
FOX reaction, the blue colour disappeared. Thus, this blue colour developed as a consequence of non-H2O2 hydroperoxides. This would seem to indicate that even if some authors (e.g., Nourooz-Zadeh et al. 1995, Södergren et al. 1998, Yildiz et al. 2003) have used them, these three solvents are not suitable for
FOX reactions.
“Methanol modified method”
ba
Wavelenghts
Absorb
ance Figure 4. Absorbance spectra obtained using the FOX method after 30 minutes
incubation of 2-propanol with (a) and without (b) TPP. (a) 350 L of 2-propanol and 150 Lof 10 mM methanolic TPP and (b) 350 L of 2-propanol and 150 L methanol were
incubated for 30 minutes. After incubation, 1500 L of FOX reagent was added to both solutions (100 L of 5 mM aqueous ferrous ammonium sulfate, 200 L of 0.25M methanolic
H2SO4, 200 L of 1mM methanolic XO, 1000 L of methanol), which were incubated for a further 30 minutes. Blank cuvettes contained 500 L of methanol without TPP.
From the previous results it can be concluded that the reaction medium containing dichloromethane:ethanol (3:2, v/v) as the main solvents shows good sensitivity and avoids lipid
precipitation even when large quantities of sample are used. Thus, the FOX reaction medium finally chosen to determine the LHPs in lipid extracts from snacks fried in vegetable oils
consisted of:
Absorbance should be measured between 0.3 and 0.8 at 560 nm, otherwise the maximum appears at other wavelengths (Figure 8).
“Dichloromethane:ethanol (3:2, v/v) method”
Figure 8. Comparison of maximum absorbance and absorbance at 560 nm for the “dichloromethane:ethanol (3:2, v/v) method” using different quantities of lipid extracts from snacks fried in
sunflower oil and palm olein.
Comparison of dichloromethane:ethanol and dichloromethane:methanol reaction media
Figure 5. Response (absorbance/nmols CHP) obtained using FOX media with different solvent compositions. Reaction media consisted of 100 L of 5 mM aqueous ferrous ammonium sulfate, 200 L of 0.25 M methanolic H2SO4, 200 L of 1mM methanolic XO,
1300 L of the solvent mixture and 200 L of a CHP solution in the corresponding solvent mixture (final CHP concentration was 11nmols/mL reaction medium)
When dichloromethane:ethanol (3:2, v/v) was used, the response to CHP was of the same order as when methanol was used (Figures 3 and 5); furthermore, no precipitation problems occurred at the concentrations experimented with (up to 25 mg/ml) for any of the lipid extracts assayed
(lipid extracts from snacks fried in sunflower oil, palm olein, soybean oil palm olein/sunflower oil blends and palm olein/soybean oil blends) (Figure 6). Figure 5 shows how media richer in
dichloromethane responded more poorly than methanol.
Several mixtures of dichloromethane:methanol and dichloromethane:ethanol at different proportions were assayed. When proportions of dichloromethane:ethanol at 2:3 and 1:1 (v/v)
were used, the response to CHP was greater than when methanol was used (Figure 5). However, these solvent mixtures were not able to prevent the precipitation of some lipids in
the reaction medium (20 and 25 mg lipids extracted from snacks fried in palm olein/mLreaction mixture of dichloromethane:ethanol at 2:3 and 1:1 (v/v) respectively).
Figure 6. Absorbance obtained using the “modified methanol method” and the “dichloromethane:ethanol (3:2, v/v) method” based on different quantities of lipid extracts
from snacks fried in sunflower oil and palm olein. Note that in the “methanol modified method” turbidity occurred at concentrations of 0.6 mg (sunflower oil) and 0.5 mg (palm
olein) of lipid extract/mL reaction medium.
0,04
0,05
0,06
0,07
0,08
0:1 2:3 1:1 3:2 7:4 2:1 7:3
Dichloromethane: methanol
Dichloromethane: ethanol
CONCLUSION
The proposed “dichloromethane:ethanol (3:2, v/v) method” is suitable for determining LHP in lipid extracts from snacks fried in vegetable oils. This reaction medium shows a high sensitivity which permits nanomolar concentrations of LHP to be determined. It is therefore particularly useful for
samples with a low LHP content, since in this case large quantities of lipid extract (we have assayed up to 25 mg of lipid extract/mL of reaction medium) are needed to obtain an absorbance value of between
0.3 and 0.8.
This method gives similar results for vegetable oils.
•Gay, C., Collins, J., Gebicki, J. M. Anal. Biochem, 1999; 273 (2):149-155.
•Grau, A., Codony, R., Rafecas, M., Barroeta, A. C., Guardiola, F. J. Agric. Food Chem., 2000; 48 (9):4136-
4143.
•Nourooz-Zadeh, J., Tajaddini-Sarmadi, J., Birlouez-Aragon, I., Wolff, S. P. J. Agric. Food Chem., 1995; 4
(1):17-21.
•Shantha, N. C., Decker, E. A. J. AOAC Int., 1994; 77 (2):421-424.
•Södergren, E., Nourooz-Zadeh, J., Berglund, L., Vessby, B. J. Biophys. Methods, 1998; 37:137-146.
•Yildiz, G., Wehling, R. L., Cuppett, S. L. JAOCS, 2003; 80 (2):103-107.
REFERENCES
FOX reaction medium
Absorbance at 560nm/ sample concentration in mg/mL reaction medium
Precision C.V.(%)
with H2SO4 0.88 1.4
with HCl 0.56 3.6
Table 1. Precision (CV) obtained for lipid extracts from snacks fried in sunflower oil (n=8). The reaction medium consisted of 100 L of 5 mM aqueous ferrous ammonium sulfate,
200 L of 0.5M HCl or 0.25M H2SO4 in chloroform:methanol (7:3, v/v), 200 L of 1mM methanolic XO, 1300 L chloroform:methanol (7:3, v/v) and 200 L of sample in
chloroform:methanol (7:3, v/v).
Chloroform:methanol (7:3, v/v) has been used in some FOX methods (e.g., Shantha and Decker, 1994). Although this solvent did not cause turbidity problems, the response obtained for CHP and for lipid
extracts was greater for methanol and dichloromethane:ethanol (3:2, v/v) (Figure 3).
Other solvents assayed
Figure 7. Dichloromethane:ethanol (3:2, v/v) method
1) 100 L of 5 mM aqueous ferrous ammonium sulfate
2) 200 L of 0.25 M methanolic H2SO4
3) 200 L of 1 mMmethanolic XO
4) 1300 L of dichloromethane:ethanol
(3:2, v/v)
5) 200 L of the lipid extract dissolved in
dichloromethane:ethanol(3:2,v/v)
Lipid extract from snacks
fried in: LHP value ( mols CHP/ mg lipid extract)
Precision C.V.(%)
Sunflower oil 20 1.0
Palm olein 2.4 1.1
Table 2. Precision (CV) under these conditions (n=8)
RESULTS AND DISCUSSION
Solvents
Absorb
ance
0
3
6
9
12
15
0 0,5 1 1,5 2
Methanol Dichloromethane:ethanol (3:2, v/v)
0
0,20,4
0,60,8
11,2
0 0,5 1 1,5 2
Sam
ple
am
ou
nt
(mg
lip
id e
xtr
act /
mL
reactio
n m
ediu
m)
AbsorbanceAbsorbance
Sunflower Palm olein
Ab
so
rban
ce
/
nm
ols
CH
P
Solvent composition (v,v)
0
3
6
9
12
15
0 0,2 0,4 0,6 0,8 1 1,2 1,4 1,6 1,8
abs max
abs 560
0
0,2
0,4
0,6
0,8
1
1,2
0 0,2 0,4 0,6 0,8 1 1,2 1,4
Absorbance
Sam
ple
am
ou
nt
(mg
lip
id e
xtr
act /
mL
reactio
n m
ediu
m)
Absorbance
Sunflower Palm olein
This would indicate that not only was sensitivity improved using sulfuric acid but greater precision was obtained.

Alteration variables measured in the lipid fraction extracted from these fried snacks and its overall acceptability are shown inTable 2. As for the frying medium, ascorbyl palmitate prevented the lipid oxidation of fried snacks. Thus, the addition of this antioxidant significantly decreased (P 0.05) various oxidation variables (K232, lipid hidroperoxide content and polymer content). Citric acid and tocopherol extract showed no antioxidant activity at the tested conditions, as determined by different measurements (Tables 1 and 2).
On the other hand, K232 and LHP values increased significantly during storage at room temperature, while consumer acceptability decreased (Table 2 and Figures 4, 6 and 7). The increase of lipid absorbance at 232 nm and LHP values at room temperature occurs because oxidation of polyunsaturated fatty acids is accompanied by an increase in lipid ultraviolet absorption at 232 nm due to formation of conjugated diene hydroperoxides (Gwo et al., 1985). Both analytical methods are commonly used to evaluate the presence of these primary oxidation products (Dobarganes and Velasco, 2002). Furthermore, the interaction between ascorbyl palmitate addition and storage time (P 0.05) showed that the K232 only increased in fried snacks with the storage time when ascorbyl palmitate was not added (Figure 4).
In addition, anisidine value slightly decreased with storage time, but these differences were not significant (Figure 5). This fact could be due to a decrease of some aldehydes in the fried products, because the - -aldehydes (mainly 2-alkenals) can break down to lower molecular weight compounds (Warner and Eskin, 1995).
J.A. Navas, A. Tres, R. Codony, and F. GuardiolaUniversity of Barcelona, Faculty of Pharmacy, Nutrition and Food Science Department- CeRTA.
Av. Joan XXIII s/n, 08028 Barcelona. Spain. [email protected]
INFLUENCE OF VARIOUS ANTIOXIDANT COMBINATIONS ON THE QUALITY OF OILS AND SNACKS PRODUCED BY CONTINUOUS DEEP FRYING
INTRODUCTIONOxidative deterioration of edible oils and fatty foods is of great concern because it affects the development of rancidity as well as the decay of nutritional value and food safety. For these reasons, antioxidants are added to fats and oils to prevent lipid oxidation during deep frying.Therefore, in this study, three antioxidants have been chosen according to their different action mechanism. Citric acid prolongs the induction period of free radical formation by chelating metals present in fats and oils, tocopherols inhibit free radical chain reactions because they are capable of accepting a radical from oxidizing free radical species, while ascorbyl palmitate lengthen the induction period by its oxygen scavenging ability (Gwo, et al., 1985; Yanishlieva and Marinova, 2001).
OBJECTIVESThe main objective of this study is to evaluate the effect of several antioxidants on the alteration of the frying medium, and the oxidative stability and sensory acceptability of the fried products
through several quality variables, which, in our previous studies, have been shown to be the most suitable for the quality control of the continuous frying of snacks.
METHODSLipid extractionSeveral alteration variables were determined in the frying medium and lipids extracted from snack foods, which had been fried in palm olein. Lipid extraction was performed using a high-speed homogenizer with chloroform:methanol (2:1, v/v).DeterminationsAcid Value (AV) and anisidine value (AnV) were determined by AOCS official methods, Cd 3d-63 and Cd 18-90 respectively. Lipid ultraviolet absorption was measured at 232, 270 and 280 nm according to the by a double-beam spectrophotometer (Shimadzu UV-160 A; Kyoto, Japan). Triacylglycerol polymers (POL) were determined by HPLC according to the IUPAC standard method 2.508. Lipid hydroperoxides (LHP) content was determined by a FOX method according to Navas et al. (2003). Fatty acid profile of the oil was determined according to Guardiola et al. (1994) with addition of methyl pentadecanoate as internal standard. The ratio C18:2n-6/C16:0 was calculated from fatty acid composition with the aid of experimental calibration curves. Consumer acceptability was tested after 0, 8 and 16 months of storage at room temperature. Panellists were asked to rank the acceptability of the product using a 9-point scale (1=very bad; 9= very good).
Among the assayed antioxidants, ascorbyl palmitate is the only one that prevents the increase of anisidine value and the formation of polymerized triacylglycerols in the frying medium. In addition, this antioxidant prevents the increase of the K232 and LHP content in fried snacks stored for long periods of time at room temperature, which is very relevant because these two oxidation values are very useful to monitor the oxidative evolution of the fried products during storage and their increase is accompanied by a decrease in the sensory acceptability scores, assessed by test panels.Furthermore, when fried snacks are stored for long periods of time, at the tested conditions, there is no synergistic effect between the ascorbyl palmitate and the rest of antioxidants assayed.
•Gwo, YY., Flick, GJ. Dupuy, HP. (1985). J. Am. Oil Chem. Soc. 62: 1666-1671
•Yanishlieva, NV., Marinova, EM. ( 2001). Eur. J. Lpid Sci. Technol. 103: 752-757
•Navas, JA., Tres, ,A.., Codony, R., Boatella, J., Bou, R., Guardiola, F. (2004). Eur.J. Lipid Sci. Technol. 106: 688-696
•Guardiola , F., Codony, R., Rafecas, M., López, A. (1994). J. Food. Comp. Anal. 7: 171-188
•Gordon, MH., Kourimska, L. (1995). Food Chem. 52: 175-177
•Dobarganes, MC., Velasco, J. (2002). Eur. J. Lpid Sci. Technol. 104: 420-428
• Warner, K., Eskin, NAM. (1995). AOCS Press. Champaign, IL.
REFERENCES
RESULTS AND DISCUSSION
DirectHeating system
33 secondsFrying time
6 h 12’Turnover rate
81 kg/hOil consumption
350 kg/hProduction rate of the snacks
200 ºCFrying temperature
500 LCapacity
Continuous electric fryer
Foodtech
Fryer
FRYING CONDITONS
The effect of various antioxidant combinations on the quality of frying medium (palm olein) and snacks (potato pellets) produced by continuous industrial deep frying was studied through the following factorial design (2 x 2 x 3 x 2 or 3): citric acid (0 or 200 mg/L), ascorbyl palmitate (0 or 500 mg/L), tocopherolextract (0, 250 or 500 mg/L) and frying time for palm olein (3 or 45 min) or storage time at room temperature for fried snacks (0, 8 or 16 months). The antioxidants were added to the frying medium at 120 ºC and rotatory shovel helped to reach complete homogeneity of antioxidants in frying oil. Afterwards, the temperature was increased up to 195ºC (frying temperature). Palm olein samples were taken after 3 and 45 minutes of deep fat frying. Snacks products produced between 10 and 12 min of frying were packed into bags of metallic polypropylene (Polibol, Zaragoza, Spain).
EXPERIMENTAL DESIGN
Multifactor analyses of variance (MANOVAs) were performed to determine whether any significant effects were produced by the studied factors (antioxidants and frying or storage times) on the responses (C18:2n-6/C16:0, AV, lipid UV absorption , AnV, POL, LHP, sensory acceptability). In all cases, P values 0.05 were considered significant.
STATISTICAL ANALYSIS
Acid value (% oleic)
0,00 0,10 0,20 0,30 0,40 0,50 0,60
AC 0, PA 0, ET 0
AC 0, PA 0, ET 250
AC 0, PA 0, ET 500
AC 0, PA 500, ET 0
AC 0, PA 500, ET 250
AC 0, PA 500, ET 500
AC 250, PA 0, ET 0
AC 250, PA 0, ET 250
AC 250, PA 0, ET 500
AC 250, PA 500, ET 0
AC 250, PA 500, ET 250
AC 250, PA 500, ET 500
t 45 min
t 3min
Lipid UV absorption (K232)
2,8 2,9 3,0 3,1 3,2 3,3 3,4
AC 0, PA 0, ET 0
AC 0, PA 0, ET 250
AC 0, PA 0, ET 500
AC 0, PA 500, ET 0
AC 0, PA 500, ET 250
AC 0, PA 500, ET 500
AC 250, PA 0, ET 0
AC 250, PA 0, ET 250
AC 250, PA 0, ET 500
AC 250, PA 500, ET 0
AC 250, PA 500, ET 250
AC 250, PA 500, ET 500
t 45 min
t 3min
Frying medium Snack products
Oxidation variables such as anisidine value, lipid UV absorptions and triacylglycerol polymer content increased during frying (P 0.05) (Table 1 ).Anisidine value and polymer content clearly decreased (P 0.05) in palm olein when the ascorbyl palmitate was added to the frying medium (Table 1). In fact, other authors (Gordon and Kourimska, 1995) reported that this antioxidant prevents oxidation and dimmer formation during deep fat frying.
Figure 1 shows that no differences were found for the acid value between initial (t=3min) and final times (t=45min). This could be due to the fact that extruded snack products used in this study contained much lower moisture before frying (10% w/w) than fresh potatoes (70% w/w). Low sensitivity of acid value could be explained because possibly hydrolytic reactions are less important than oxidative reactions in the frying medium at the tested conditions. Moreover, Figures 2 and 3 show the suitability of anisidine value and lipid absorption at 232 nm to evaluate alteration in our experimental conditions. Both oxidation variables increased with frying time (Table 1). From this results and previous studies it can be concluded that oxidation variables are more reliable than acid value to monitor alteration in continuous frying.
Citric Acid
(mg/mL)
Ascorbyl
palmitate
(mg/mL)
Tocopherol extract
(mg/mL)
Frying Time
(min)
0 250 0 500 0 250 500 3 45
C18:2 n-6/
C16:01 0.482 0.48 0.48 0.48 0.48 0.48 0,48 0.48 0.48
AV 0.11a3 0.13b 0.10a 0.14b 0.12 0.12 0,12 0.12 0.12 K232 3.18 3.14 3.16 3.16 3.13a 3.14ab 3,20b 3.12a 3.20b K270 0.66 0.66 0.67 065 0.65a 0.65a 0,67b 0.63a 0.68b K280 0.53 0.53 0.54 0.52 0.52 0.52 0,55 0.51a 0.55b
AnV4 6.42 6.36 7.44a 5.34b 6.68b 5.98a 6,52b 5.37a 7.42b
POL 1.01 1.02 1.07a 0.96b 1.01 1.00 1,04 0.97 1.07
1 C18:2n-6/C16:0 (linoleic acid/palmític acid ratio), AV (acid value), K232, K270, K280 (specific absorbances at 232, 270 y 280 nm), AnV (anisidine value), POL (% triacylglycerol polymer content), 2 Values given in this table correspond to least-squares means obtained from MANOVA (n=24).3 Means corresponding to a certain factor with different letters differ significantly (P 0.05). Means for the factors having a significant effect were separated using the Scheffé´s test.4 Interaction between ascorbyl palmitate and tocopherol extract significant at P 0.05.
Table 1. Effect of the studied factors on the alteration of the frying medium.
Figure 1. Influence of antioxidants on
acid value of palm olein.
Figure 3. Influence of antioxidants on K232
of palm olein.
CONCLUSION
AC =Citric acid, PA =Ascorbyl palmitate, ET = Tocopherol extract
Concentrations of antioxidants: 0 mg/L, 250 mg/L, 500 mg/L
Anisidine value
0,0 2,0 4,0 6,0 8,0 10,0
AC 0, PA 0, ET 0
AC 0, PA 0, ET 250
AC 0, PA 0, ET 500
AC 0, PA 500, ET 0
AC 0, PA 500, ET 250
AC 0, PA 500, ET 500
AC 250, PA 0, ET 0
AC 250, PA 0, ET 250
AC 250, PA 0, ET 500
AC 250, PA 500, ET 0
AC 250, PA 500, ET 250
AC 250, PA 500, ET 500
t 45 min
t 3min
Figure 2. Influence of antioxidants on
anisidine value of palm olein.
AC =Citric acid, PA =Ascorbyl palmitate, ET = Tocopherol extract
Concentrations of antioxidants: 0 mg/L, 250 mg/L, 500 mg/L
AC =Citric acid, PA =Ascorbyl palmitate, ET = Tocopherol extract
Concentrations of antioxidants: 0 mg/L, 250 mg/L, 500 mg/L Figure 6. Influence of storage on lipid
hidroperoxide content of fried snacks.
Anisidine value
0,0 2,0 4,0 6,0 8,0 10,0
AC 0, PA 0, ET 0
AC 0, PA 0, ET 250
AC 0, PA 0, ET 500
AC 0, PA 500, ET 0
AC 0, PA 500, ET 250
AC 0, PA 500, ET 500
AC 250, PA 0, ET 0
AC 250, PA 0, ET 250
AC 250, PA 0, ET 500
AC 250, PA 500, ET 0
AC 250, PA 500, ET 250
AC 250, PA 500, ET 500
t= 16 months
t= 8 months
t= 0 months
Figure 7. Influence of storage on sesnsory
acceptability of fried snacks.
Figure 5. Influence of storage on
anisidine value of fried snacks .
AC =Citric acid, PA =Ascorbyl palmitate, ET = Tocopherol extract. Concentrations of antioxidants: 0 mg/L, 250 mg/L, 500 mg/L
Decrease of sensory scores for acceptability agreed with the increase in K232 and lipid hydroperoxide content (Figures 4, 6 and 7). The consumer acceptability scores found for freshly produced snacks, were significantly higher (P 0.05) compared to snacks stored for 8 and 16 months at room temperature. These results could be due to the increase of rancid notes and moisture during storage. Finally, it is interesting to remark that there are no statistically significant first-order interactions between the antioxidants added. Thus, we can conclude that when fried snacks are stored for long periods of time at the tested conditions there is no synergistic effect between these antioxidants.
Citric Acid
(mg/mL)
Ascorbyl
palmitate
(mg/mL)
Tocopherol extract
(mg/mL)
Storage
(months)
0 250 0 500 0 250 500 0 8 16
C18:2 n-6/
C16:01 0.492 049 0.49 0.50 0.49 0.50 0.49 0.49 0.49 0.49
K2324 3.16 3.19 3.59a3 2.77b 3.10 3.23 3.21 2.81a 3.25b 3.48b
K270 0.65 0.66 0.67 0.65 0.64 0.67 0.67 0.66 0.64 0.68 K280 0.57 0.58 0.58 0.57 0.55 0.58 0.59 0.58 0.55 0.59 AnV 5.85 6.02 6.48 5.39 5.82 5.83 6.16 6.11 5.93 5.76
POL 1.05 1.00 1.07a 0.98b 0.99 1.02 1.06 1.03 1.06 0.98
LHP4 3737 3689 6805a 621b 3593 3676 3869 446a 2663b 8030c
SA 4.54 4.44 4.64 4.34 4.3 4.5 4.6 5.8a 4.2b 3.5c 1 C18:2n-6/C16:0 (linoleic acid/palmític acid ratio), K232, K270, K280 (specific absorbance at 232, 270 y 280 nm), AnV (anisidinevalue), POL (% triacylglycerol polymer content), LHP (lipid hydroperoxide content), SA (Sensory acceptability). 2 Values given in this table correspond to least-squares means obtained from MANOVA (n=36).3 Means corresponding to a certain factor with different letters differ significantly (P 0.05). Means for the factors having a significant effect were separated using the Scheffé´s test. 4 Interaction between ascorbyl palmitate and storage time significant at P 0.05.
Table 2. Effect of studied factors on the alteration of fried snacks.
08
16
500 mg/L
0 mg/L
0
0,5
1
1,5
2
2,5
3
3,5
4
4,5
storage (months)
ascorbyl palmitate
Lipid UV Absorption (K232)
Figure 4. Effect of the Interaction between
storage time and ascorbyl palmitate on
K232 value of fried snacks.
Lipid hidroperoxide content (nmoles de CHP/g of lipid extract)
0 5000 10000 15000 20000
AC 0, PA 0, ET 0
AC 0, PA 0, ET 250
AC 0, PA 0, ET 500
AC 0, PA 500, ET 0
AC 0, PA 500, ET 250
AC 0, PA 500, ET 500
AC 250, PA 0, ET 0
AC 250, PA 0, ET 250
AC 250, PA 0, ET 500
AC 250, PA 500, ET 0
AC 250, PA 500, ET 250
AC 250, PA 500, ET 500
t= 16 months
t= 8 months
t= 0 months
Sensory Acceptability(Score)
0,0 1,0 2,0 3,0 4,0 5,0 6,0 7,0
AC 0, PA 0, ET 0
AC 0, PA 0, ET 250
AC 0, PA 0, ET 500
AC 0, PA 500, ET 0
AC 0, PA 500, ET 250
AC 0, PA 500, ET 500
AC 250, PA 0, ET 0
AC 250, PA 0, ET 250
AC 250, PA 0, ET 500
AC 250, PA 500, ET 0
AC 250, PA 500, ET 250
AC 250, PA 500, ET 500
t= 16 months
t= 8 months
t= 0 months

Anexos
416
VII.4. Publicaciones en revistas científicas

José A. NavasAlba TresRafael CodonyJosep BoatellaRicard BouFrancesc Guardiola
Nutrition and Food ScienceDepartment-CeRTA,Faculty of Pharmacy,University of Barcelona,Barcelona, Spain
Modified ferrous oxidation-xylenol orange methodto determine lipid hydroperoxides in fried snacks
A modified ferrous oxidation-xylenol orange (FOX) method was adapted to measurelipid hydroperoxides (LHP) in lipid extracts from snack foods fried in vegetable oils.First, a methanol-based FOX reaction medium was assayed, but this became turbidupon addition of the lipid extracts dissolved in ethanol. To avoid the precipitation oflipids, the polarity of the reaction medium was reduced by lowering its water contentand by replacing the methanol as the basis of the medium for less polar solvents. Someof the solvents used instead of methanol yielded a lower FOX reaction response. Of thereaction media assayed, the one based on dichloromethane/ethanol (3:2, vol/vol) wasnot turbid at high lipid extract concentrations (assayed at up to 25 mg of lipid extract/mL reaction medium) and provided the same response level as the methanol-basedmedium. Thus, this FOX method shows high sensitivity and is particularly useful forlipid extracts with low LHP content. This method was also successfully applied toedible oils. Solvents such as 2-propanol, ethyl acetate and butanol were discarded,because they easily produce hydroperoxides, which interfere in the FOX reaction.Xylenol orange preparations from a number of suppliers were tested, and some differ-ences affecting the sensitivity of the reaction were observed.
Keywords: Xylenol orange method, lipid hydroperoxide determination, fried snacks invegetable oils, edible oils.
1 Introduction
The stability of fried foods is affected by lipid oxidation,which yields both primary and secondary oxidation com-pounds. Primary oxidation compounds, such as lipidhydroperoxides (LHP), are formed in an initial stage oflipid oxidation, increasing in level as oxidation advances,until reaching a plateau, and later decreasing because ofdegradation into secondary oxidation compounds (suchas aldehydes, ketones and hydrocarbons) [1, 2] or inter-action with other food components [3]. Thus, lipid oxida-tion leads to several oxidation compounds with variousundesirable biological effects and also implies a loss ofnutritional value [4–7] and sensory quality [8–11]. Snackfoods are prone to undergo lipid oxidation during storagebecause of their high lipid content and high surface areaand porosity [11].
There are several methods available to monitor lipid oxi-dation in foods through the determination of LHP [12].These methods show different performance character-istics, which should be taken into account in order to
choose the most adequate method to consistently deter-mine LHP, depending on the analytical situation (e.g. kindof sample, number of samples to be analysed, methodquality parameters required). In addition, in order toproperly assess lipid oxidation in a certain food sample,the LHP measurement should be accompanied by thedetermination of the appropriate secondary oxidationproducts [12]. The official techniques of the AOAC [13]and the AOCS [14] to measure LHP, both based on iodo-metric titrations, are most commonly used, although theypresent several interferences and a lack of sensitivity [15].Some potentiometric and iodine spectrophotometricmethods have been developed to improve sensitivity [16–18]. Moreover, chromatographic methods (HPLC and GC)have been proposed as alternatives; but despite theirhigh sensitivity and specificity, their application to routineanalysis with a large number of samples is not easy [12,19]. A successful and useful option for routine analysis ofedible oils is the Fourier transform infrared (FTIR) spec-trometry method described by van de Voort et al. [20] andimproved by Ma et al. [21].
Spectrophotometric techniques such as ferrous oxida-tion-xylenol orange (FOX) or the International Dairy Fed-eration-ferric thiocyanate method are simple, reproduci-ble and sensitive and can also be successfully applied toroutine analysis [15, 22–25]. In these methods, ferrous
Correspondence: Francesc Guardiola, Nutrition and FoodScience Department-CeRTA, Faculty of Pharmacy, University ofBarcelona, Avinguda Joan XXIII s/n, E-08028 Barcelona, Spain.Phone: +34-93-4024508, Fax: +34-93-4035931; e-mail: [email protected]
688 DOI 10.1002/ejlt.200400987 Eur. J. Lipid Sci. Technol. 106 (2004) 688–696
© 2004 WILEY-VCH Verlag GmbH & Co. KGaA, Weinheim www.ejlst.de
Res
earc
hP
aper

Eur. J. Lipid Sci. Technol. 106 (2004) 688–696 Determination of lipid hydroperoxides in fried snacks 689
ions are oxidised by LHP to ferric ions, which bind xylenolorange (XO) or thiocyanate and develop a chromophore.The FOX method has been applied to fish fillet, chickenmeat, edible oils, butterfat, lipid extracts from meats,plant tissues, and biological samples [15, 23, 25–32].However, the solvent composition of the reaction mediaand the extraction steps used differ depending on theauthor. When Hermes-Lima et al. [27], Grau et al. [15] andEymard and Genot [23] applied the FOX method to animaltissue, chicken meat and fish fillet samples, a methanol-or water-based reaction medium was used, with previoushydroperoxide extraction with methanol. Nourooz-Zadehet al. [29, 31] also used a methanol-based medium tomeasure hydroperoxides in plasma, with previousextraction with ethyl acetate, and in edible oils, dissolvingthe sample in 1-propanol. In both cases, a centrifugationstep before the spectrophotometric reading was used inorder to remove turbidity and flocculated materials; how-ever, this is a time-consuming procedure. Solubility prob-lems were also encountered by Shantha and Decker [25]when they applied a FOX methanol-based medium todetermine hydroperoxides in fats and oils. To overcomethis drawback, these authors proposed a chloroform/methanol-based reaction medium; however, the re-sponse obtained using alcohol-based media is 1.5 timesgreater.
This manuscript describes how a highly sensitive FOXmethod was set up to determine LHP in lipid fractionsextracted from snacks fried in vegetable oils, avoidingturbidity in the reaction medium. In addition, the suitabilityfor the FOX method of XO from three suppliers was stud-ied, as some authors have reported differences in behav-iour depending on the XO supplier and batch, for instancein sensitivity, colour development, spectrum shape andwavelength of maximum absorbance [15, 33].
2 Materials and methods
2.1 Reagents and standards
XO (ACS grade) was from Sigma (St Louis, MO, USA),Aldrich (Steinheim, Germany) or Scharlau (Barcelona,Spain). The XO supplied by Scharlau was used, unlessotherwise indicated. Cumene hydroperoxide (CHP) wasfrom Sigma and triphenylphosphine (TPP) from Aldrich.Ethanol (96%, HPLC grade) was purchased from Schar-lau. Hydrochloric acid (35%), sulphuric acid (96%),ammonium ferrous sulphate hexahydrate (analyticalgrade) were purchased from Panreac Química (Barce-lona, Spain). All other solvents (HPLC grade) were fromSDS (Peypin, France), and double-deionised water wasused throughout.
2.2 Samples
The snack foods (chips, and corn- and potato-extrudedsnacks) used to optimise the FOX method were providedby six large-scale Spanish producers. These snack foodswere fried in soybean oil, sunflower oil, palm olein, palmolein/sunflower oil blend (60:40, vol/vol), or palm oil/soy-bean oil blend (50:50, vol/vol). Lipid hydroperoxides werealso determined in some edible oils (sunflower oil, palmolein and soybean oil) using the FOX method finally pro-posed.
2.3 Lipid extraction
Lipid extraction was performed as follows: 70 g of snackwas weighed out, ground and transferred to a specialglass extraction vessel (GS 50, Kinematica, Lucerne,Switzerland); 350 mL chloroform/methanol (2:1, vol/vol)was added, and the mixture was homogenised for 40 s at20,000 rpm using a Polytron PT 3100 (Kinematica). Theextract was decanted and filtered through Whatman nº1filter paper, and the residue was re-extracted twice: firstwith 250 mL chloroform/methanol (2:1, vol/vol) and thenwith 100 mL chloroform. All the filtrates were pooled,gently shaken and divided into ten 100-mL screw-captubes. Then, 10 mL of 8% (wt/vol) aqueous sodium chlo-ride were added to each tube. All tubes were agitated andcentrifuged at 400�g for 20 min. The ten chloroformextracts were pooled, and 100 g anhydrous sodium sul-phate was added. After 15 min, the mixture was filteredthrough Whatman no1 filter paper into a round-bottomflask, and the solvent was evaporated to near dryness in avacuum rotatory evaporator at 35 �C. Solvent evaporationwas completed by placing the round-bottom flask in avacuum desiccator at 10 mm Hg overnight. The lipidextract was distributed to various vials, filling them almostcompletely and leaving a small headspace. Then, thevials were stored at �20 �C for less than 15 d until the FOXvalue was determined. Later, this frozen lipid extract wasused to determine other quality and composition param-eters.
2.4 FOX methods
For all the FOX methods assayed, incubation was per-formed in 1-cm glass cuvettes with Teflon caps for 30 minat room temperature under attenuated light. Absorbancewas measured using a Shimadzu UV-160A spectro-photometer (Shimadzu, Kyoto, Japan). Absorbancevalues were measured at 560 and 590 nm. Spectrarecording conditions were as follows: spectrum range,400–700 nm; scan speed, 480 nm/min. LHP content insamples was expressed as �mol CHP equivalents/g lipid
© 2004 WILEY-VCH Verlag GmbH & Co. KGaA, Weinheim www.ejlst.de

690 J. A. Navas et al. Eur. J. Lipid Sci. Technol. 106 (2004) 688–696
extract, with reference to calibration curves obtainedusing CHP as standard (2–17 nmol CHP/mL reaction me-dium) in the corresponding reaction media.
2.4.1 Method 1
The FOX method proposed by Grau et al. [15] for darkchicken meat, based on the method described byHermes-Lima et al. [27], was applied with slight mod-ification to the lipid extracts from snacks. The reactionmedium consisted of 500 �L 1 mM aqueous ferrousammonium sulphate, 200 �L 0.25 M methanolic H2SO4,200 �L 1 mM methanolic XO, 900 �L methanol, and 200 �Lethanol containing the lipid extract. In the original meth-od, the sample was dissolved in methanol, which doesnot completely dissolve the lipid extracts.
2.4.2 Method 2
The reaction medium consisted of 100 �L 5 mM aqueousferrous ammonium sulphate, 200 �L 0.25 M methanolicH2SO4, 200 �L 1 mM methanolic XO, 1300 �L methanol,and 200 �L dichloromethane/ethanol (3:2, vol/vol) con-taining the lipid extract.
2.4.3 Effect of the acid used in the reactionmedia
Most authors use sulphuric acid to acidify the FOX reac-tion medium, but Shantha and Decker [25] used hydro-chloric acid. The effect of the acid was assessed using areaction medium similar to that described by theseauthors. The reaction medium consisted of 100 �L 5 mMaqueous ferrous ammonium sulphate, 200 �L 0.5 M HClor 0.25 M H2SO4 in chloroform/methanol (7:3, vol/vol),200 �L 1 mM methanolic XO, 1300 �L chloroform/metha-nol (7:3, vol/vol), and 200 �L chloroform/methanol (7:3,vol/vol) containing the lipid extract. Eight aliquots of a lipidextract from snacks fried in sunflower oil were used toassess the precision (RSD %) and sensitivity of each FOXmethod.
2.4.4 Effect of the solvent used as the basis ofthe reaction media
A number of reaction media based on several solventswere assayed: chloroform/methanol (7:3, vol/vol), as pre-viously used by Burat and Bozkurt [22] and Shanta andDecker [25]; dichloromethane/methanol (2:3, 1:1, 3:2, 7:4,2:1, and 7:3; vol/vol); and dichloromethane/ethanol (2:3,1:1, 3:2, 7:4, 2:1, and 7:3; vol/vol). The capacity of thesesolvents to prevent lipid precipitation in the medium was
tested with lipid extracts from snacks fried in palm olein,the low LHP content of which entailed a larger sampleamount to obtain an optimal absorbance value. The re-sponse developed in each of these reaction media wasevaluated with CHP as standard, in a final concentrationof 11 nmol/mL reaction medium. The responses obtainedin the methanol- and ethanol-based reaction media wereused as controls for the FOX reaction responses obtainedin the rest of reaction media. Reaction media consisted of100 �L 5 mM aqueous ferrous ammonium sulphate,200 �L 0.25 M methanolic H2SO4, 200 �L 1 mM metha-nolic XO, 1300 �L solvent, and 200 �L of the correspond-ing solvent containing CHP or increasing amounts of thelipid extract.
2.4.5 Method 3 (final method proposed)
The reaction medium consisted of 100 �L 5 mM aqueousferrous ammonium sulphate, 200 �L 0.25 M methanolicH2SO4, 200 �L 1 mM methanolic XO, 1300 �L dichlor-omethane/ethanol (3:2, vol/vol), and 200 �L dichlor-omethane/ethanol (3:2, vol/vol) containing the lipidextract.
The linear relationship between sample amount and ab-sorbance value was tested at 560 and 590 nm for lipidextracts from snacks fried in sunflower oil (from 0.1 to1 mg/mL reaction medium) and in palm olein (from 0.5 to12 mg/mL reaction medium).
Precision (RSD%) of the method was measured by ana-lysing eight aliquots of lipid extracts from snacks fried insunflower oil, soybean oil and palm olein. The precision ofthis method for edible oil analysis was also assessedusing sunflower oil, soybean oil and palm olein samples(n = 8).
2.5 Hydroperoxides in solvents
2.5.1 Presence of hydroperoxides in solvents
The FOX reaction was performed with 2-propanol, ethylacetate or butanol in the reaction medium. Before thisreaction, these solvents were incubated (a) with and (b)without TPP as follows: (a) 350 �L solvent and 150 �L10 mM methanolic TPP or (b) 350 �L solvent and 150 �Lmethanol were incubated for 30 min at room temperature.After incubation, 1500 �L FOX reagent (100 �L 5 mMaqueous ferrous ammonium sulphate, 200 �L 0.25 Mmethanolic H2SO4, 200 �L 1 mM methanolic XO, 1000 �Lmethanol) was added to both solutions, which were thenincubated for a further 30 min at room temperature.Blanks contained 500 �L methanol without TPP and1500 �L FOX reagent.
© 2004 WILEY-VCH Verlag GmbH & Co. KGaA, Weinheim www.ejlst.de

Eur. J. Lipid Sci. Technol. 106 (2004) 688–696 Determination of lipid hydroperoxides in fried snacks 691
2.5.2 Formation of hydroperoxides in solvents
LHP were measured in 2-propanol from different bottles:a bottle that had just been opened (used in blanks), abottle opened 1 month before, and a bottle opened 3months before. The first two bottles were from the samebatch and the third from an older batch. The FOX reactionwas performed as follows: 100 �L 5 mM aqueous ferrousammonium sulphate, 200 �L 0.25 M H2SO4 in the corre-sponding 2-propanol, 200 �L 1 mM methanolic XO (fromSigma), and 1500 �L of the corresponding 2-propanol.
In addition, the three types of 2-propanol were incubatedfor 30 min with TPP prior to the FOX reaction, as descri-bed above.
2.6 Differences between XO suppliers
XO from three suppliers was used: Scharlau, Sigma andAldrich. The comparison was done by means of the cali-bration curves obtained using the corresponding XO andCHP as standard (0.3–10.6 nmol CHP/mL reaction medi-um for Sigma XO; 2–13 nmol CHP/mL reaction mediumfor Aldrich and Scharlau XO) under the reaction condi-tions described in section 2.4.2.
3 Results and discussion
3.1 FOX methods
3.1.1 Methods 1 and 2
First, method 1 was assayed with lipid extracts fromsnacks fried in vegetable oils; however, upon addition ofthe sample dissolved in ethanol to the reaction medium,turbidity was evident at very low lipid extract concentra-tions, causing interference with spectrophotometricmeasurements. Similar solubility problems were reportedby Shantha and Decker [25] when the methanol-basedFOX reaction medium described by Jiang et al. [28, 34]was applied to fats and edible oils. Grau et al. [15] suc-cessfully applied the method 1 to methanolic extractsfrom poultry meat and did not encounter problems relatedto turbidity, but the ethanolic solutions used in the presentstudy had a higher lipid content.
In method 2, to prevent precipitation of the lipid extracts inthe reaction medium, water content was reduced to100�L, whilst the same concentration of ferrous ions in thefinal reaction mixture was maintained. Any further reduc-tion of water content produced a loss of sensitivity (datanot shown). Moreover, in this method, lipid extracts weredissolved in dichloromethane/ethanol (3:2, vol/vol) insteadof ethanol and then added to the reaction medium.
Despite this reduction in polarity, turbidity still occurred atconcentrations of 0.5 and 0.6 mg lipid extract/mL reactionmedium (lipid extracts from snacks fried in palm olein andsunflower oil, respectively), and the concentrations ofLHP in these amounts of extracts were sometimes toolow to ensure optimal absorbance (0.7–0.8, as recom-mended by Grau et al. [15]). Thus, a further decrease inthe polarity of the reaction medium was necessary toprevent the precipitation of certain lipids.
3.1.2 Effect of the acid used in the reactionmedia
Sulphuric acid [15, 23, 27–30] and hydrochloric acid [22,25] have been proposed to achieve the conditionsrequired for the development of the reaction.
A higher sensitivity was observed for LHP determinationin snacks fried in sunflower oil when sulphuric acid wasused instead of hydrochloric acid to acidify the FOXreaction medium, which agrees with previously reportedresults for LHP determination in chicken meat using asubstantially different FOX method [15]. In addition, abetter precision was obtained for this acid (RSD = 1.4%, n= 8, absorbance at 560 nm/sample concentration in thereaction medium in mg�mL�1 = 0.88) compared withhydrochloric acid (RSD = 3.6%, n = 8, absorbance at560 nm/sample concentration in the reaction medium inmg�mL�1 = 0.56).
3.1.3 Effect of the solvent used as the basis ofthe reaction media
A suitable solvent for the FOX reaction medium shoulddissolve the lipid extracts from the snacks and allow thedevelopment of the colourimetric reaction with high sen-sitivity. As the decrease of the water volume to 100 �L andthe dissolution of the sample in dichloromethane/ethanol(3:2, vol/vol) instead of ethanol did not prevent turbidity,the polarity of the medium was decreased by experi-menting with less polar solvents as substitutes for meth-anol to complete the final volume of the reaction mediumat up to 2 mL.
First, dichloromethane/methanol- (7:3, vol/vol), dichlor-omethane/ethanol- (3:2, vol/vol) and chloroform/metha-nol-based (7:3, vol/vol) reaction media were assayed,because the latter was reported to prevent precipitationof lipids in the FOX reaction medium when fats and oilswere analysed [25]. None of these solvent mixturesshowed turbidity at a concentration of 25 mg lipidsextracted from a snack fried in palm olein/mL reactionmedium. Then, the response obtained with the same sol-vents using a known concentration of CHP (11 nmol/mL
© 2004 WILEY-VCH Verlag GmbH & Co. KGaA, Weinheim www.ejlst.de

692 J. A. Navas et al. Eur. J. Lipid Sci. Technol. 106 (2004) 688–696
reaction medium) was tested, and methanol- and etha-nol-based reaction media were used as controls for theresponse. However, only the dichloromethane/ethanol-based (3:2, vol/vol) medium developed a response of thesame order as methanol or ethanol (Fig. 1).
Fig. 1. Absorbance at 560 nm obtained using FOX mediawith distinct solvent compositions (n = 2). Reaction mediaconsisted of 100 �L 5 mM aqueous ferrous ammoniumsulphate, 200 �L 0.25 M methanolic H2SO4, 200 �L 1 mMmethanolic XO, 1300 �L solvent and 200 �L of a solution ofCHP in the corresponding solvent (the final concentrationof CHP was 11 nmol/mL reaction medium). Solvents:ethanol (E), methanol (M), dichloromethane/methanol (7:3,vol/vol) (DM 7:3), dichloromethane/ethanol (3:2, vol/vol)(DE 3:2) and chloroform/methanol (7:3, vol/vol) (CM 7:3).
These results led us to test a set of proportions ofdichloromethane/ethanol and dichloromethane/metha-nol. When proportions of the former at 2:3 and 1:1 (vol/vol)were used, the response to CHP was greater than forethanol or methanol (Fig. 2). However, these solvent mix-tures did not prevent the precipitation of some lipids in the
Fig. 2. Response (absorbance at 560 nm/nmol CHP, n =2) obtained using FOX media with distinct solvent pro-portions (dichloromethane/methanol in squares, dichlor-omethane/ethanol in triangles). Reaction media consistedof 100 �L 5 mM aqueous ferrous ammonium sulphate,200 �L 0.25 M methanolic H2SO4, 200 �L 1 mM metha-nolic XO, 1300 �L of the solvent mixture and 200 �L of asolution of CHP in the corresponding solvent mixture (finalconcentration of CHP, 11 nmol/mL reaction medium).
reaction medium at concentrations of 20 and 25 mg lipidsextracted from snacks fried in palm olein/mL reactionmixture of dichloromethane/ethanol at 2:3 and 1:1, vol/vol, respectively.
When dichloromethane/ethanol (3:2, vol/vol) was used,the response to CHP was of the same order as for meth-anol or ethanol (Figs. 1 and 2); furthermore, no precipita-tion occurred at the concentrations tested (up to 25 mg/mL) for any of the lipid extracts assayed (lipid extractsfrom snacks fried in sunflower oil, palm olein, soybean oil,palm olein/sunflower oil blend, and palm oil/soybean oilblend). Media richer in dichloromethane yielded a lowerresponse than methanol- or ethanol-based media (Fig. 2).
3.1.4 Method 3 (final method proposed)
On the basis of the previous results, it was concluded thatthe reaction medium containing dichloromethane/ethanol(3:2, vol/vol) as the main solvent showed good sensitivityand prevented lipid precipitation even when large quan-tities of sample were used (Fig. 3). Thus, method 3 waschosen to determine the LHP in lipid extracts from snacksfried in vegetable oils.
A linear relationship between the sample amount in theFOX reaction medium and the absorbance value hasbeen previously reported [15, 23, 27]. In this study, forlipid extracts from snack foods fried in sunflower oil or inpalm olein, the correlation coefficient (r) between sampleamount and absorbance value was higher for readings at560 nm than at 590 nm. The correlation coefficients (r)were 0.9992 at 560 nm and 0.9988 at 590 nm for sun-flower oil samples, and 0.9997 at 560 nm and 0.9962 at590 nm for palm olein samples. These results are inagreement with those previously reported for fish filletsamples [23]. Moreover, readings of absorbance valuesabove 0.9–1.1 at 560 nm resulted in a loss of linearity,which does not occur if the absorbance values are alwaysmeasured at the absorbance maximum of the spectra(Fig. 4). However, as the wavelength of the absorbancemaximum mainly depends on LHP concentration, butalso on sample and reaction media composition (data notshown), the latter option entails to record the spectrum foreach sample, which is quite time consuming. Therefore,for method 3, taking into account these results and theresults discussed in section 3.3., it is recommended tomeasure the absorbance under 0.8 at 560 nm.
Precision (RSD %) of method 3 was determined by ana-lysing aliquots of lipid extracts from snacks fried in sun-flower oil (RSD = 1.0%, n = 8, LHP value = 20 �mol CHPequivalents/g lipid extract), soybean oil (RSD = 1.0%, n =8, LHP value = 21 �mol CHP equivalents/g lipid extract),
© 2004 WILEY-VCH Verlag GmbH & Co. KGaA, Weinheim www.ejlst.de

Eur. J. Lipid Sci. Technol. 106 (2004) 688–696 Determination of lipid hydroperoxides in fried snacks 693
Fig. 3. Absorbance at560 nm obtained (n = 2) bymethod 2 (squares) andmethod 3 (triangles) using arange of amounts of lipidextracts from snacks friedin sunflower oil (A) and palmolein (B). Reaction mediaconsisted of 100 �L 5 mMaqueous ferrous ammo-nium sulphate, 200 �L
0.25 M methanolic H2SO4, 200 �L 1 mM methanolic XO, 1300 �L methanol or dichloromethane/ethanol (3:2, vol/vol), andthe lipid extracts dissolved in dichloromethane/ethanol (3:2, vol/vol). Note that in method 2, turbidity, which carries a sharpincrease of the absorbance, occurred at concentrations of 0.6 mg (sunflower oil) and 0.5 mg (palm olein) lipid extract/mLreaction medium.
Fig. 4. Comparison of themaximum absorbance (tri-angles) and the absorbanceat 560 nm (squares)obtained (n = 2) with meth-od 3 using differentamounts of lipid extractsfrom snacks fried in sun-flower oil (A) and palm olein(B).
and palm olein (RSD = 1.1%, n = 8, LHP value = 2.4 �molCHP equivalents/g lipid extract). Precision of this methodfor edible oil analysis was similar: sunflower oil (RSD =1.0%, n = 8, LHP value = 4.2 �mol CHP equivalents/g oil),soybean oil (RSD = 1.0%, n = 8, LHP value = 4.4 �molCHP equivalents/g oil) and palm olein (RSD = 1.1%, n = 8,LHP value = 0.8 �mol CHP equivalents/g oil).The preci-sion of this method is better than the precision reportedby other authors determining LHP in fats and oils by var-ious FOX methods [22, 29].
3.2 Hydroperoxides in solvents
3.2.1 Presence of hydroperoxides in solvents
Solvents such as 2-propanol and ethyl acetate have beenused in FOX methods that include BHTas antioxidant [29,31, 35]. However, when these solvents were tested with-out adding BHT to the medium, as Grau et al. [15] andEymard and Genot [23] recommended, the blanks turnedpurple after the FOX reaction instead of remaining yellowas expected. To check whether the purple colour was dueto the presence of hydroperoxides in solvents, the sol-
vents were incubated prior to the FOX reaction with TPP, aspecific hydroperoxide reductant that has no effect onH2O2 [15, 31]. When 2-propanol, ethyl acetate or butanolwere incubated with TPP, the mixtures remained yellowafter the FOX reaction and no peaks of absorbance weredetected at 560 nm (Fig. 5). This result indicates that thepurple colour developed using 2-propanol, ethyl acetateor butanol was due to non-H2O2 hydroperoxides presentin these solvents, which may interfere in the FOX reaction.This drawback was not observed when methanol orethanol was used as basis of the reaction media.
3.2.2 Formation of hydroperoxides in solvents
The formation of hydroperoxides in 2-propanol increaseswith the time elapsed since the solvent bottle wasopened. Thus, blanks (which contained 2-propanol from abottle that had just been opened) were still yellow after30 min, whereas those with 2-propanol from bottlesopened 1 or 3 months before were purple and exhibitedthe absorbance spectra shown in Fig. 6. Absorbance at560 nm was much higher for the latter.
© 2004 WILEY-VCH Verlag GmbH & Co. KGaA, Weinheim www.ejlst.de
694 J. A. Navas et al. Eur. J. Lipid Sci. Technol. 106 (2004) 688–696
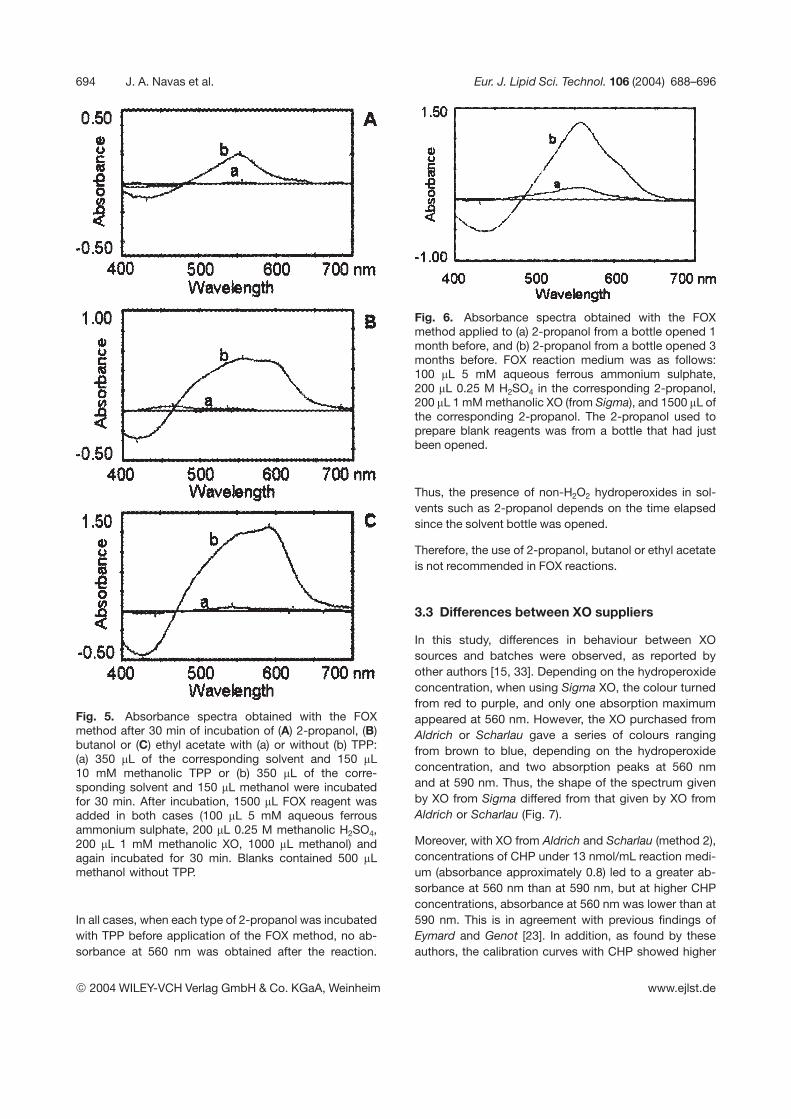
Fig. 5. Absorbance spectra obtained with the FOXmethod after 30 min of incubation of (A) 2-propanol, (B)butanol or (C) ethyl acetate with (a) or without (b) TPP:(a) 350 �L of the corresponding solvent and 150 �L10 mM methanolic TPP or (b) 350 �L of the corre-sponding solvent and 150 �L methanol were incubatedfor 30 min. After incubation, 1500 �L FOX reagent wasadded in both cases (100 �L 5 mM aqueous ferrousammonium sulphate, 200 �L 0.25 M methanolic H2SO4,200 �L 1 mM methanolic XO, 1000 �L methanol) andagain incubated for 30 min. Blanks contained 500 �Lmethanol without TPP.
In all cases, when each type of 2-propanol was incubatedwith TPP before application of the FOX method, no ab-sorbance at 560 nm was obtained after the reaction.
Fig. 6. Absorbance spectra obtained with the FOXmethod applied to (a) 2-propanol from a bottle opened 1month before, and (b) 2-propanol from a bottle opened 3months before. FOX reaction medium was as follows:100 �L 5 mM aqueous ferrous ammonium sulphate,200 �L 0.25 M H2SO4 in the corresponding 2-propanol,200 �L 1 mM methanolic XO (from Sigma), and 1500 �L ofthe corresponding 2-propanol. The 2-propanol used toprepare blank reagents was from a bottle that had justbeen opened.
Thus, the presence of non-H2O2 hydroperoxides in sol-vents such as 2-propanol depends on the time elapsedsince the solvent bottle was opened.
Therefore, the use of 2-propanol, butanol or ethyl acetateis not recommended in FOX reactions.
3.3 Differences between XO suppliers
In this study, differences in behaviour between XOsources and batches were observed, as reported byother authors [15, 33]. Depending on the hydroperoxideconcentration, when using Sigma XO, the colour turnedfrom red to purple, and only one absorption maximumappeared at 560 nm. However, the XO purchased fromAldrich or Scharlau gave a series of colours rangingfrom brown to blue, depending on the hydroperoxideconcentration, and two absorption peaks at 560 nmand at 590 nm. Thus, the shape of the spectrum givenby XO from Sigma differed from that given by XO fromAldrich or Scharlau (Fig. 7).
Moreover, with XO from Aldrich and Scharlau (method 2),concentrations of CHP under 13 nmol/mL reaction medi-um (absorbance approximately 0.8) led to a greater ab-sorbance at 560 nm than at 590 nm, but at higher CHPconcentrations, absorbance at 560 nm was lower than at590 nm. This is in agreement with previous findings ofEymard and Genot [23]. In addition, as found by theseauthors, the calibration curves with CHP showed higher
© 2004 WILEY-VCH Verlag GmbH & Co. KGaA, Weinheim www.ejlst.de

Eur. J. Lipid Sci. Technol. 106 (2004) 688–696 Determination of lipid hydroperoxides in fried snacks 695
Fig. 7. Absorbance spectra obtained after FOX reactionusing XO from three suppliers: (A) Sigma XO (10.6 nmolCHP/mLreactionmedium), (B) Scharlau XO (8.8nmolCHP/mL reaction medium), and (C) Aldrich XO (13.3 nmnol CHP/mL reaction medium). Method 2 was used in all cases.
determination coefficients (r2) when absorbance wasmeasured at 560 nm than at 590 nm for methods 2 and3 (Tab. 1). Therefore, it is recommended to use XOfrom the same supplier and batch in order to obtaincomparative results, and to measure the absorbanceat 560 nm under 0.8 when the XO from Aldrich orScharlau is used. However, reaction conditions andwavelength of reading should be checked for eachkind of sample. The XO from Sigma gave a highersensitivity at 560 nm than that purchased from Aldrichand Scharlau (Tab. 1), but this product is unfortunatelyno longer available.
4 Conclusion
Method 3, which uses dichloromethane/ethanol 3:2 (vol/vol) as the main solvent in the reaction medium, is suitablefor determining LHP in lipid extracts from snacks fried invegetable oils. This method shows high sensitivity and isparticularly useful for samples with a low LHP content,because the reaction medium allows the dissolution oflarge amounts of lipid extract (it has been assayed at up to25 mg lipid extract/mL reaction medium), which aresometimes required to obtain an optimum absorbancevalue. This method was also successfully applied toedible oils.
Acknowledgements
This work was funded in part by research grants fromthe Instituto Nacional Investigación y Tecnología Agrariay Alimentaria (INIA) and the Ministerio de Educación,Cultura y Deporte (MECD). The authors thank the com-panies that provided the fried snack food samples: Fri-travich, Risi, El Castillo, Grupo Siro, Industrias Ali-mentarias de Montilla and SyC Diversificación.
Tab. 1. Calibration curves obtained for XO from distinct suppliers at two wavelengths (X = nmol CHP/mL reaction medium; Y = absorbance).
XOsupplier
Reactionmedium
Wavelengthreading
Calibration curve r2
Sigma Method 2 560 nm Y = 9.24�10�2 X � 3.04�10�2 0.9946Aldrich Method 2 560 nm Y = 5.88�10�2 X � 4.72�10�3 0.9998Aldrich Method 2 590 nm Y = 6.27�10�2 X � 3.39�10�2 0.9928Scharlau Method 2 560 nm Y = 5.85�10�2 X � 8.63�10�4 0.9998Scharlau Method 2 590 nm Y = 6.32�10�2 X � 4.83�10�2 0.9929Scharlau Method 3 560 nm Y = 5.86�10�2 X � 4.70�10�3 0.9993Scharlau Method 3 590 nm Y = 5.40�10�2 X � 2.57�10�2 0.9939
© 2004 WILEY-VCH Verlag GmbH & Co. KGaA, Weinheim www.ejlst.de

696 J. A. Navas et al. Eur. J. Lipid Sci. Technol. 106 (2004) 688–696
References
[1] E. N. Frankel: Lipid Oxidation. The Oily Press, Dundee (UK)1998.
[2] K. Moore, J. Roberts: Measurement of lipid peroxidation.Free Radic. Res. 28 (1998) 659–671.
[3] H. W. Gardner: Lipid hydroperoxide reactivity with proteinsand amino acids: a review. J. Agric. Food Chem. 27 (1979)220–229.
[4] H. Esterbauer, R. F. Schaur, H. Zollner: Chemistry and bio-chemistry of 4-hydroxynonenal, malonaldehyde and relatedaldehydes. Free Radic. Biol. Med. 11 (1991) 81–128.
[5] F. Guardiola, P. C. Dutta, R. Codony, G. P. Savage (Eds.):Cholesterol and Phytosterol Oxidation Products: Analysis,Occurrence, and Biological Effects. AOCS Press, Cham-paign, IL. (USA) 2002.
[6] C. K. Chow: Biological effects of oxidized fatty acids. In:Fatty Acids in Foods and their Health Implications. Ed. C. K.Chow, Marcel Dekker Inc., New York (USA) 1992, pp. 689–705.
[7] G. Spiteller: Linoleic acid peroxidation – the dominant lipidperoxidation process in low density lipoprotein – and itsrelationship to chronic diseases. Chem. Phys. Lipids 95(1998) 105–162.
[8] R. Przybylski, N. A. M. Eskin: Methods to measure com-pounds and the flavor signifiance of volatile compounds. In:Methods to Assess Quality and Stability of Oils and Fat-Containing Foods. Eds. K. Warner, N. A. M. Eskin, AOCSPress, Champaign, IL (USA) 1995, pp. 107–133.
[9] A. De Winne, P. Dirinck: Studies on vitamin E and meatquality. 2. Effects of feeding high vitamin E levels on chickenmeat quality. J. Agric. Food Chem. 44 (1996) 1691–1696.
[10] P. Pangloli, S. L. Melton, J. L. Collins, M. P. Penfield, A. M.Saxton: Flavor and storage stability of potato chips fried incottonseed and sunflower oils and palm olein/sunflower oilblends. J. Food Sci. 67 (2002) 97–103.
[11] K. Robards, A. F. Kerr, E. Patsalides: Rancidity and itsmeasurement in edible oils and snack foods. A review. Ana-lyst 113 (1988) 213–224.
[12] M. C. Dobarganes, J. Velasco: Analysis of lipid hydroper-oxides. Eur. J. Lipid Sci. Technol. 104 (2002) 420–428.
[13] AOAC: Method 41.1.16. In: Official methods of Analysis ofAOAC International. 17th ed. AOAC International, Gaithers-burg, MD (USA) 2000.
[14] AOCS: Method Cd 8–53. In: Official Methods and Recom-mended Practices of the AOCS. 5th ed. American OilChemist’s Society, Champaign, IL (USA)1998.
[15] A. Grau, R. Codony, M. Rafecas, A. C. Barroeta, F. Guar-diola: Lipid hydroperoxide determination in dark chickenmeat through a ferrous oxidation-xylenol orange method. J.Agric. Food Chem. 48 (2000) 4136–4143.
[16] M. Hicks, J. M. Gebicki: A spectrophotometric method forthe determination of lipid hydroperoxides. Anal. Biochem.99 (1979) 249–253.
[17] A. Lezerovich: Determination of peroxide value by conven-tional difference and difference-derivative spectro-photometry. J. Am. Oil Chem. Soc. 62 (1985) 1495–1500.
[18] M. Oishi, K. Onishi, M. Nishijima, K. Nakagomi, H. Nakazawa,S. Uchiyama, S. Suzuki: Rapid and simple coulometricmeasurements of peroxide value in edible oils and fats. J.AOAC Int. 75 (1992) 507–510.
[19] G. C. Yang: Detection of lipid hydroperoxides by high-per-formance liquid chromatography coupled with post-columnreaction. Trends Food Sci. Technol. 3 (1992) 15–18.
[20] F. R. Van de Voort, A. A. Ismael, J. Sedman, J. Dubois, T.Nicodemo: The determination of peroxide value by Fouriertransform infrared spectroscopy. J. Am. Oil Chem. Soc. 71(1994) 921–926.
[21] K. Ma, F. R. van de Voort, J. Sedman, A. A. Ismail: Stoichio-metric determination of hydroperoxides in fats and oils byFourier transform infrared spectroscopy. J. Am. Oil Chem.Soc. 74 (1997) 897–906.
[22] K. M. Burat, O. Bozkurt: Improvement of calibration curve fordetermining peroxide values of food lipids by the modifiedferrous oxidation-xylenol orange method. J. AOAC Int. 79(1996) 995–997.
[23] S. Eymard, C. Genot: A modified xylenol orange method toevaluate formation of lipid hydroperoxides during storageand processing of small pelagic fish. Eur. J. Lipid Sci. Tech-nol. 105 (2003) 497–501.
[24] C. A. Gay, J. M. Gebicki: Measurement of protein and lipidhydroperoxides in biological systems by the ferric-xylenolorange method. Anal. Biochem. 315 (2003) 29–35.
[25] N. C. Shantha, E. A. Decker: Rapid, sensitive, iron-basedspectrophotometric methods for determination of peroxidevalues of food lipids. J. AOAC Int. 77 (1994) 421–424.
[26] M. DeLong, R. K. Prange, D. M. Hodges, C. F. Forney, M. C.Bishop, M. Quilliam: Using a modified ferrous oxidation-xylenol orange (FOX) assay for detection of lipid hydroper-oxides in plant tissue. J. Agric. Food Chem. 50 (2002) 248–254.
[27] M. Hermes-Lima, W. G. Willmore, K. B. Storey: Quantifica-tion of lipid peroxidation in tissue extracts based on Fe(III)-xylenol orange complex formation. Free Radic. Biol. Med.19 (1995) 271–280.
[28] Z. Y. Jiang, A. C. S. Woollard, S. P. Wolff: Lipid hydroper-oxide measurement by oxidation of Fe2 in the presence ofxylenol orange. Comparison with the TBA assay and aniodometric method. Lipids 26 (1991) 853–856.
[29] J. Nourooz-Zadeh, J. Tajaddini-Sarmadi, I. Birlouez-Aragon,S. P. Wolff: Measurement of hydroperoxides in edible oilsusing the ferrous oxidation in xylenol orange assay. J. Agric.Food Chem. 43 (1995) 17–21.
[30] J. Nourooz-Zadeh, J. Tajaddini-Sarmadi, E. K. L. Ling, S. P.Wolff: Low-density lipoprotein is the major carrier of lipidhydroperoxides in plasma. Relevance to determination oftotal plasma lipid hydroperoxide concentrations. Biochem.J. 313 (1996) 781–786.
[31] J. Nourooz-Zadeh, J. Tajaddini-Sarmadi, S. P. Wolff: Meas-urement of plasma hydroperoxide concentrations by theferrous oxidation-xylenol orange assay in conjunction withtriphenylphosphine. Anal. Biochem. 220 (1994) 403–409.
[32] E. Södergren, J. Nourooz-Zadeh, L. Berglund, B. Vessby:Re-evaluation of the ferrous oxidation in xylenol orangeassay for the measurement of plasma lipid hydroperoxides.J. Biochem. Biophys. Methods 37 (1998) 137–146.
[33] J. Gay, J. Collins, J. M. Gebicki: Determination of iron insolutions with the ferric-xylenol orange complex. Anal. Bio-chem. 273 (1999) 143–148.
[34] Z. Y. Jiang, J. V. Hunt, S. P. Wolff: Ferrous ion oxidation in thepresence of xylenol orange for detection of lipid hydroper-oxide in low density lipoprotein. Anal. Biochem. 202 (1992)384–389.
[35] G. Yildiz, R. L. Wehling, S. L. Cuppett: Comparison of fouranalytical methods for the determination of peroxide value inoxidized soybean oils. J. Am. Oil Chem. Soc. 80 (2003) 103–107.
[Received: April 22, 2004; accepted: July 26, 2004]
© 2004 WILEY-VCH Verlag GmbH & Co. KGaA, Weinheim www.ejlst.de

Name /food/69_116 09/26/2005 01:26PM Plate # 0-Composite pg 102 # 1
Allen Press • DTPro System GALLEY 102 File # 16ee
Journal of Food Protection, Vol. 69, No. 1, 2006, Pages 000–000Copyright �, International Association for Food Protection
Polycyclic Aromatic Hydrocarbons in Frying Oils and Snacks
GIORGIA PURCARO,1 JOSE A. NAVAS,2 FRANCESC GUARDIOLA,2 LANFRANCO S. CONTE,1
AND SABRINA MORET1*
1Department of Food Science, University of Udine, Via Marangoni 97, 33100 Udine, Italy; and 2Department of Food Science and Nutrition, CeRTA,University of Barcelona, Avinguda Joan XXII, E-08028 Barcelona, Spain
MS 05-212: Received 30 April 2005/Accepted 8 August 2005
ABSTRACT
The high incidence of lung cancer observed among Chinese women has been associated with exposure to fumes fromcooking oil. Polycyclic aromatic hydrocarbons (PAHs) are a class of potentially mutagenic substances emitted from cookingoils heated at high temperatures. The objective of this study was to investigate whether deep frying with different oils underdifferent conditions leads to the development of PAHs either in the oil or in the fried product (snacks). PAH analysis wascarried out with solid-phase extraction followed by reverse-phase high-performance liquid chromatography and spectrofluo-rometric detection. Different oils were used to fry chips and extruded snacks in different industrial plants (continuous frying)at temperatures between 170 and 205�C, and peanut oil was used to fry French fries and fish (discontinuous frying) attemperatures between 160 and 185�C. No appreciable differences in PAH load was observed in the same oil before and afterfrying. Both before and after frying, the benzo[a]pyrene concentration in oils ranged from trace to 0.7 ppb. All the analyzedsamples, including oils from fried snacks, had benzo[a]pyrene concentrations well below the 2 ppb limit recently proposed bythe European Community.
Polycyclic aromatic hydrocarbons (PAHs) are an im-portant class of contaminants formed through incompletecombustion of organic matter (15). Heavy PAHs, formedby four to six benzene fused rings, are carcinogenic andcan be assimilated by humans through ingestion, inhalation,or skin contact (11).
PAHs can contaminate food through two main routes:food processing at high temperatures (e.g., grilling, roast-ing, and smoking) and atmospheric deposition of dust andparticulates containing large quantities of pyrolitically gen-erated PAHs on the surface of foods (16). Because of thelipophilic nature of PAHs, oils and lipid matrices can con-tain high concentrations of these compounds (18). The ma-jor contributors to PAH intake in the average diet are oilsand fats, cereals, and vegetables (7).
Commission regulation (EC) 208/2005 (8) has recentlyset a maximum level of 2 ppb for benzo[a]pyrene (BaP) inoils and fats intended for direct consumption or for use asan ingredient in foods. BaP is used as a marker of the oc-currence and effect (toxic potential) of the whole class ofgenotoxic heavy PAHs.
The optimal temperatures for the formation of PAHsare between 660 to 740�C (2); however, several authors (17,21, 25) have studied the PAH concentration in cooking oilfumes (180 to 270�C). Frying is an important cooking prac-tice that leads to the formation of substances that improvefood taste and smell and of compounds that negatively af-fect the quality of foods (9). The production of these com-pounds is influenced by a number of variables, includingthe kind of oil or fat, frying temperature, frying method
* Author for correspondence. Tel: +39 0432 590725; Fax: +39 0432590719; E-mail: [email protected].
(continuous or discontinuous), and type of vessel. Contin-uous frying is used for large volumes of product. The pro-cess usually is automated, and fresh oil is added continu-ously to the frying kettle while the food is moved throughthe cooking oil on a conveyor. The oil is heated continu-ously, and the heat supply is regulated by a thermostat sothat the oil does not cool when food or fresh oil is added.Oil always circulates, and food particles that burn duringthe process are eliminated continuously by filtering. In dis-continuous (batch) frying, which is used for smaller quan-tities of product, fresh oil is added periodically, and burntfragments stay in the oil longer because the oil is filteredonly once at the end of the process day.
Several epidemiological studies conducted in Taiwanand China revealed that Asian women ranked highest in theworld for lung cancer, probably because of the exposure tofumes from cooking oil (10, 14, 24). Ko et al. (14) foundthat the risk of lung cancer was higher from stir frying thanfrom deep frying. Some authors (3, 6) suggested that theincreased cancer risk observed among people exposed tooil fumes is correlated with the presence of PAHs in thefumes of heated oils. Heterocyclic aromatic amines (5, 22)and volatile decomposition products such as 1,3 butadiene,benzene, acrolein, and formaldehyde have been suggestedto be responsible for the mutagenic properties of the fumesfrom cooking oils (20). Chen and Chen (4), in a study ofmodel lipids and different vegetable oils (soybean, canola,and sunflower oils), found that the degree of unsaturationof fatty acids affects the variety and amount of PAHsformed in the fumes; soybean oil, which had the highestdegree of unsaturation, produced the most PAHs.
Most studies of PAHs have been focused on oil cook-
?1

Name /food/69_116 09/26/2005 01:26PM Plate # 0-Composite pg 103 # 2
J. Food Prot., Vol. 69, No. 1 PAHS IN FRYING OILS AND SNACKS
Allen Press • DTPro System GALLEY 103 File # 16ee
TA
BL
E1.
PA
Hco
ncen
trat
ions
inoi
lsa
mpl
esfr
omco
ntin
uous
and
disc
onti
nuou
sfr
ying
Sam
ple
code
aFr
ying
oilb
Frie
dpr
oduc
t
PHA
conc
entr
atio
n(p
pb)c
Na
Ac
FPa
AFl
PL
-PA
HB
aAC
hB
ePB
bFB
kFB
aPD
Bah
AB
ghiP
IPH
-PA
H
CF1
(b)
CF1
(a)
CF1
(p)
po/s
o(6
0/40
)Po
tato
chip
s6.
13.
513
.5
tr tr 0.2
0.7
0.6
2.0
2.2
1.7
12.2
0.1
0.1
0.3
0.2
0.7
1.9
1.1
0.9
3.2
4.3
4.0
19.5
0.3
0.3
0.5
0.5
0.3 tr
0.2
0.2
0.3
0.1
0.1
0.1
0.2
0.2
0.2
tr0.
20.
3 tr
0.1
0.1
0.1
1.5
1.4
1.2
CF2
(b)
CF2
(a)
CF2
(p)
paC
orn-
extr
uded
snac
ks7.
84.
29.
3
0.3
0.1 tr
1.0
1.0
1.2
4.5
3.9
4.8
0.6
0.5
0.4
2.7
2.6
2.3
3.6
4.2
4.4
12.4
12.3
13.2
1.1
1.3
1.0
0.1
0.2
0.3
0.1
0.4
0.6
0.5
0.3
0.2
0.2
0.7
0.7
0.6
tr
0.4
0.4
0.5
0.3
0.2
0.3
3.4
3.6
3.5
CF3
(b)
CF3
(a)
CF3
(p)
soPo
tato
chip
s7.
24.
3N
Q
tr tr 0.1
1.5
0.4
1.5
8.4
5.0
5.7
1.0
0.5
0.4
3.9
3.1
2.6
5.3
4.7
5.0
20.1
13.6
15.3
0.8
0.7
1.2
0.2
0.6
0.7
0.1 tr
0.9
0.7
0.8
0.2
0.2
0.3
0.3
0.3
0.5
tr
0.1
0.2
0.4
2.7
2.6
3.9
CF4
(b)
CF4
(a)
CF4
(p)
sbo
Pota
toch
ips
5.9
4.7
NQ
tr tr 0.1
0.6
0.5
4.2
2.3
1.8
7.8
0.2
0.1
0.3
2.0
1.5
2.1
3.7
2.6
4.5
8.7
6.5
19.0
0.3
0.2
0.3
0.1
0.1
0.3
0.1 tr
0.1 tr 0.4
0.1
0.1
0.1
0.1 tr 0.1
tr 0.1
tr 0.1
0.1
0.8
0.6
1.4
CF5
(b)
CF5
(a)
CF5
(p)
sbo
Pota
to-e
xtru
ded
snac
ks4.
24.
320
.1
tr tr tr
0.9
1.7
2.4
1.8
0.9
5.7
0.1
0.1
0.3
2.1
2.2
2.8
2.6
4.3
5.8
7.5
9.3
17.1
0.2
0.2
0.4
0.1
0.1
0.2
0.1
NQ
NQ
0.1
0.2
0.4
tr 0.1
0.2
tr NQ
0.2
tr 0.2
0.1
0.5
0.7
1.4
CF6
(b)
CF6
(a)
CF6
(p)
po/s
bo(5
0/50
)Po
tato
chip
s5.
45.
816
.9
tr tr tr
0.6
1.3
1.8
2.3
3.0
5.8
0.1 tr 0.3
0.8
0.8
1.1
1.9
2.2
2.3
5.7
7.3
11.3
0.2
0.4
0.2
0.1 tr 0.1
0.1
0.2
0.1
0.1
0.1
0.1
0.1
0.1
0.1
tr 0.1
tr
0.1
0.6
0.9
0.6
DF1
(b)
DF1
(a)
t�
2h)
DF1
(a)
(t�
2h)
pno
Fren
chfr
ies,
fish
tr 0.8
2.2
tr tr 0.0
0.0
0.5
0.4
0.6
2.1
0.8
0.1
0.1
0.1
1.1
1.0
0.9
1.1
1.7
1.5
2.9
5.4
3.6
0.3
0.3
0.3
0.3
0.1
0.1
0.1
0.1
0.3
0.4
0.4
0.2
0.1
0.1
0.2
0.2
0.2
tr 0.1
0.3
0.4
0.2
0.2
0.3
0.3
1.9
2.1
1.7
DF2
(b)
DF(
2)(a
)(t
�8h
)pn
oFr
ench
frie
s2.
31.
7tr tr
0.2
0.1
0.6
0.9
tr tr0.
50.
30.
50.
31.
81.
60.
20.
2tr tr
tr tr0.
20.
2D
F3(b
)D
F3(a
)(t
�6h
)D
F3(a
)(t
�2
h)
pno
Fren
chfr
ies,
fish
4.4
3.6
7.2
tr tr 0.3
0.6
0.7
2.0
1.8
3.2
4.5
0.1
0.1
0.2
0.9
0.9
1.1
1.3
1.0
1.1
4.7
5.8
8.9
0.4
0.3
0.1
tr tr 0.2
0.1 tr 0.1
0.2
0.2
0.3
0.1
0.3
0.1
0.1
0.2
0.1
tr
tr tr tr
0.1
0.3
0.2
1.0
1.4
1.2
aC
F,co
ntin
uous
fryi
ng;
DF,
disc
ontin
uous
fryi
ng;
b,oi
lbe
fore
fryi
ng;
a,oi
laf
ter
fryi
ng;
p,oi
lfr
omfr
ied
prod
uct;
t,du
ratio
n(h
)of
fryi
ng.
DF1
and
DF2
wer
eta
ken
from
the
sam
eU
nive
rsity
cant
een.
bpo
,pa
lmoi
l;so
,su
nflow
eroi
l;sb
o,so
ybea
noi
l;pn
o,pe
anut
oil.
cN
a,na
phth
alen
e;A
c,ac
enap
hthe
ne;
F,flu
oren
e;Pa
,ph
enan
thre
ne;
A,
anth
race
ne;
Fl,
fluor
anth
ene;
P,py
rene
;L
-PA
H,
sum
oflig
htPA
Hs
from
Fto
P;B
aA,b
enzo
[a]a
nthr
acen
e;C
h,ch
ryse
ne;
BeP
,be
nzo[
e]py
rene
;B
bF,
benz
o[b]
fluor
anth
ene;
BkF
,be
nzo[
k]flu
oran
then
e;B
aP,
benz
o[a]
pyre
ne;
DB
ahA
,di
benz
[a,h
]ant
hrac
ene;
Bgh
iP,
benz
o[g,
h,i]
pery
lene
;IP
,in
deno
[1,2
,3-c
,d]p
yren
e;H
-PA
H,
sum
ofhe
avy
PAH
sfr
omB
aAto
IP.
tr,tr
ace
[�0.
05pp
b);
NQ
,no
tqu
antifi
edbe
caus
eof
inte
rfer
ence
.

Name /food/69_116 09/26/2005 01:26PM Plate # 0-Composite pg 104 # 3
J. Food Prot., Vol. 69, No. 1PURCARO ET AL.
Allen Press • DTPro System GALLEY 104 File # 16ee
FIGURE 1. PAH concentrations in olive oil contaminated withboth light and heavy PAHs after different frying times at 180�C(oil was used to prepare French fries in an electrically heatedfryer). Na, naphthalene; Ac, acenaphthene; F, fluorene; Pa, phen-anthrene; A, anthracene; Fl, fluoranthene; P, pyrene; L-PAH, sumof light PAHs from F to P; BaA, benzo[a]anthracene; Ch, chry-sene; BeP, benzo[e]pyrene; BbF, benzo[b]fluoranthene; BkF,benzo[k]fluoranthene; BaP, benzo[a]pyrene; DBahA, di-benz[a,h]anthracene; BghiP, benzo[g,h,i]perylene; IP, in-deno[1,2,3-c,d]pyrene; H-PAH, sum of heavy PAHs from BaA toIP.
TA
BL
E2.
PA
Hco
ncen
trat
ions
inoi
lex
trac
ted
from
frie
dsn
acks
Sam
ple
code
Fryi
ngoi
laFr
ied
prod
uct
PHA
conc
entr
atio
n(p
pb)b
Na
Ac
FPa
AFl
PL
-PA
HB
aAC
hB
ePB
bFB
kFB
aPD
Bah
AB
ghiP
IPH
-PA
H
S1 S2 S3 S4 S5
pno
pno
pno
pno
pno
Pota
toch
ips
Pota
toch
ips
Pota
toch
ips
Pota
toch
ips
Pota
toch
ips
7.9
9.2
3.7
9.6
5.6
0.2 tr tr 0.1 tr
1.0
0.4
0.1
0.6
0.6
1.3
1.5
1.2
2.1
4.5
0.0
0.1 tr 0.1
0.2
0.6
2.9
0.3
0.9 tr
0.8
2.2
0.1
1.4
5.9
3.8
7.1
1.7
5.0
11.2
0.8 tr tr 0.3
0.1
1.0
0.3 tr
0.2
0.2
1.2 tr 0.1
0.3
0.1
0.4 tr tr
0.1
0.6 tr tr 0.2
0.2 tr 0.1 tr
0.5 tr tr
0.1
0.3 tr 0.1
0.4
0.9
4.8
0.4
0.4
1.1
S6 S7 S8 S9 S10
pno
pno
pno
pno
hvo
Pota
toch
ips
Pota
toch
ips
Pota
toch
ips
Pota
toch
ips
Pota
toch
ips
5.9
6.1
3.1
9.2
24.9
0.1 tr tr tr tr
1.1
0.3
0.5
0.1
1.3
5.2
1.6
4.2
1.6
10.4
0.1
0.1
0.1
0.1
0.4
0.8
1.0
1.7 tr 1.9
1.5
3.9
4.9
1.8
NQ
8.8
6.9
11.4 3.6
14.0
0.1
0.2
0.7
0.2
0.4
0.1
0.4
0.1
1.2
0.2
0.4
0.2 tr 0.5
0.8
0.1
0.1 tr 0.3 tr
0.4
0.1
0.5
0.3
0.3
tr tr 0.6 tr
0.1 tr 0.3
0.2 tr 0.4
0.2
0.1
1.3
0.4
2.5
3.1
2.1
S11
S12
S13
S14
pno
pno
pno
pno
Pota
toch
ips
Cor
nex
trud
edW
heat
extr
uded
Cer
eal
mix
extr
uded
20.4
14.3
24.5 4.7
tr 0.1 tr 0.3
1.0
1.3
2.4
0.4
4.4
3.3
9.5
1.0
0.3
0.1
0.9
0.1
tr 0.8
1.6
0.5
5.1
1.3
NQ tr
10.7 6.8
14.3 2.0
0.8
0.5
0.4
0.2
0.8
0.3
0.5
0.1
0.1 tr
0.7
0.7
0.5
0.2
0.3
0.2
0.1
0.1
1.2
0.3
0.5
0.1
tr tr tr 0.4
1.0
0.1
0.3
1.3
0.8
0.2
0.2
6.1
3.1
2.4
1.4
apn
o,pe
anut
oil;
hvo,
hydr
ogen
ated
vege
tabl
eoi
l.b
Na,
naph
thal
ene;
Ac,
acen
apht
hene
;F,
fluor
ene;
Pa,
phen
anth
rene
;A
,an
thra
cene
;Fl
,flu
oran
then
e;P,
pyre
ne;
L-P
AH
,su
mof
light
PAH
sfr
omF
toP;
BaA
,ben
zo[a
]ant
hrac
ene;
Ch,
chry
sene
;B
eP,
benz
o[e]
pyre
ne;
BbF
,be
nzo[
b]flu
oran
then
e;B
kF,
benz
o[k]
fluor
anth
ene;
BaP
,be
nzo[
a]py
rene
;D
Bah
A,
dibe
nz[a
,h]a
nthr
acen
e;B
ghiP
,be
nzo[
g,h,
i]pe
ryle
ne;
IP,
inde
no[1
,2,3
-c,d
]pyr
ene;
H-
PAH
,su
mof
heav
yPA
Hs
from
BaA
toIP
.tr,
trac
e[�
0.05
ppb)
;N
Q,
not
quan
tified
beca
use
ofin
terf
eren
ce.
ing fumes, but only a few have involved PAH concentra-tions in the frying medium. Siegmann and Sattler (21)found that when different vegetable oils were heated up to260�C, PAH concentrations in the oil aerosol are very highcompared with those reported by other authors in liquid oil.PAH concentration in the oil aerosol was estimated to beabout 1,000-fold higher than that in the liquid oil. Barrancoet al. (1) reported increased PAH concentrations in oliveoil used to cook eggs, but only a slight increase in lightPAHs was observed when peppers were fried. The sameauthors suggested that fat (cholesterol) present in eggs fa-vored the formation of PAHs.
The aim of this work was to investigate whether deepfrying with different frying methods (continuous and batchfrying) can lead to formation of important PAHs. Differentvegetable oils used for frying snacks, French fries, and fishwere collected during the frying process and analyzed. Oilsamples extracted from fried snacks were also analyzed toassess PAH contribution from these products. PAH analysiswas carried out with a rapid solid phase extraction methodpreviously set up for PAH determination in vegetable oils(19) followed by high-performance liquid chromatography(HPLC) and spectrofluorometric detection.
MATERIALS AND METHODS
Reagents and chemicals. Hexane, dichloromethane, acetone,and acetonitrile were HPLC grade (Baker, Deventer, The Nether-lands). Water was purified with a Milli-Q System (Millipore, Bed-ford, Mass.).
The standard 610 M PAH mixture in 1 ml of methanol-di-chloromethane (Supelco, Bellefonte, Pa.) consisted of acenaphthe-ne (1,000 �g/ml), fluoranthene (200 �g/ml), naphthalene (1,000�g/ml), benzo[a]anthracene (100 �g/ml), benzo[b]fluoranthene(200 �g/ml), BaP (100 �g/ml), benzo[k]fluoranthene (100 �g/ml),chrysene (100 �g/ml), acenaphthylene (2,000 �g/ml), anthracene(100 �g/ml), benzo[g,h,i]perylene (200 �g/ml), fluorene (F; 200�g/ml), phenanthrene (Pa; 100 �g/ml), dibenz[a,h]anthracene
?4

Name /food/69_116 09/26/2005 01:26PM Plate # 0-Composite pg 105 # 4
J. Food Prot., Vol. 69, No. 1 PAHS IN FRYING OILS AND SNACKS
Allen Press • DTPro System GALLEY 105 File # 16ee
(200 �g/ml), indeno[1,2,3-c,d]pyrene (100 �g/ml), and pyrene (P;100 �g/ml). This mixture was added to benzo[e]pyrene (SigmaAldrich, St. Louis, Mo.).
All the glassware was carefully washed and rinsed with dis-tilled solvent (acetone or hexane) before use.
Apparatus. A model 9010 HPLC gradient pump (Varian,Palo Alto, Calif.) equipped with a Rheodyne 7161 injector witha 20-�l loop was used for analytical determination. The C18 re-versed phase column (Supelcosil LC-PAH) was 250 by 3 mminside diameter with 5-�m particle size (Supelco) and was regu-lated by thermostat to 38�C. The mobile phase consisted of ace-tonitrile and water at a flow rate of 1 ml/min. The gradient elutionprogram started with 40% acetonitrile (isocratic for 5 min) andcontinued linearly to 100% acetonitrile (total run time of 40 min).
The eluted compounds were detected with two spectrofluo-rometric detectors connected on line. The first was a program-mable spectrofluorometer (model FP 1520, Jasco, Cremella,Como, Italy), whose wavelength changes have been reported else-where (19), and the second was a Varian spectrofluorometer (mod-el 9070) set at 280 to 490 nm to improve sensitivity for ben-zo[e]pyrene.
Sampling. To investigate the effect of temperature (normaltemperature reached during frying) on PAH content, four 10-mlaliquots of an olive oil sample rich in both light and heavy PAHsand a peanut oil sample with a low PAH content were heated at180�C for various times up to 25 h in test tubes with screw caps.
Oils and fried products (chips and corn- or potato-extrudedsnacks) were collected from six large-scale Spanish frying plantsthat performed continuous frying. Frying temperature, which wasmonitored in the frying plants, ranged from 170 to 205�C. Threehomogeneous samples were collected from each plant at the mid-dle of the daily productive cycle: 250 ml of fresh oil (sampled atambient temperature), 250 ml of oil after frying (sampled at fryingtemperature), and 250 g of the fried product.
Peanut oil samples (about 250 ml) were collected from twoUniversity canteens in Udine (Italy) before and after discontinuousfrying of potatoes and fish in an electrical fryer (25-liter capacity).Frying temperatures were set at 185�C for potato chips and at 160to 180�C for fish. About 50 to 60 kg of potatoes and 20 to 30 kgof fish were fried during each frying cycle (2.0 to 2.5 h). For thefish, the oil was discarded immediately after the first cycle offrying, but for the potatoes the oil was filtered and used for a newfrying cycle after adding fresh oil. Depending on oil conditions,the oil was discarded after the second frying cycle or was usedfor a third cycle. Different frying cycles were performed on dif-ferent days, and the same oil was used for a maximum of 6 to 8h. Oil samples were collected after different frying cycles 1, 2,and 3, corresponding to different frying times (2 to 8 h). Beforesamples were removed, the oil was well mixed to assure an ho-mogeneous sample.
The same heavily contaminated olive oil sample previouslyused for the heating test was also used to fry potato chips withan electrical fryer (1.0 to 1.2 liter capacity). The oil was used tofry four portions of potatoes during 4 h (one 250-g portion perh). The frying time was 8 min, and the oil was held at 180�Cduring the entire trial period.
Fried products (potato chips and corn- and potato-extrudedsnacks) were purchased from the Italian market.
Sample preparation. A representative amount of each friedsnack (about 50 g) was ground into small pieces with a mortarand pestle. A 10-g sample was then extracted with 30 ml of hex-ane in an ultrasound bath for 1 h. The mixture was then filtered
through paper, and the solvent was evaporated with rotavapor(40�C).
The oil samples so obtained and oil samples collected beforeand after frying were processed according to the procedure sug-gested by Moret and Conte (19). A 0.250-g sample of oil wasloaded into a 5-g silica solid phase extraction cartridge (20 ml;Mega Bond Elut, Varian) previously washed with 20 ml of di-chloromethane, dried completely by vacuum, and conditionedwith 20 ml of n-hexane. The PAHs were eluted with 8 ml of amixture of n-hexane and dichloromethane (70:30 vol/vol) afterhaving discharged the first 8-ml fraction containing aliphatic hy-drocarbons. The PAH fraction was concentrated to a few micro-liters with a vacuum evaporator (Uniequip System, Martinsrieder,Munich, Germany) consisting of a centrifuge (Univapo 100 H)and a refrigerated aspirator (Uniject II) system or a nitrogenstream. The residual solvent was allowed to evaporate spontane-ously at room temperature to minimize volatile PAH losses. Theresidue was dissolved in 100 �l of acetonitrile and injected intothe HPLC apparatus.
RESULTS AND DISCUSSION
Some preliminary trials were carried out to investigatethe fate of PAHs when oil was heated to frying tempera-tures. Aliquots of olive oil and peanut oil with differentPAH loads (8.3 and 0.1 ppb BaP, respectively) were heatedat 180�C for various times. No appreciable variations inPAH concentrations were observed for either oil type, evenfor longer heating times (25 h).
These results are in contrast with those found by Kimet al. (12), who reported that when soybean oil was heatedto 180 and 200�C, BaP concentration increased about four-to sixfold, reaching a maximum after 10 to 20 h, and thendecreased again after 50 h. However, Barranco et al. (1)heated olive oil at two different temperatures (150 and200�C) for different times and found no significant differ-ences even after 45 min of heating (light PAHs decreasedslightly, likely by volatilization).
Table 1 lists the concentrations of each PAH and thesums of light PAHs (from F to P) and heavy PAHs (frombenzo[a]anthracene to indeno[1,2,3-c,d]pyrene) in oil sam-ples taken from six large-scale Spanish frying plants andfrom two University canteens (Udine, Italy). Because oftheir high volatility and consequent low recoveries, naph-thalene and acenaphthene were not included in the sum oflight PAHs.
All oil samples from the continuous frying plants (CF)had low PAH concentrations, with BaP concentrations wellbelow the European Commission limit of 2 ppb (from traceto 0.7 ppb) and total heavy PAHs of 0.5 to 3.9 ppb. Peanutoil samples taken from two University canteens had a max-imum BaP concentration of 0.2 ppb and total heavy PAHsconcentrations between 0.2 and 2.1 ppb. Among lightPAHs, the highest concentrations were found for Pa (mean,3.6 ppb) and/or P (mean, 2.7 ppb) for oil samples fromboth continuous and discontinuous frying. Even thoughconcentrations of heavy PAHs were very low, making itdifficult to develop a profile, benzo[a]anthracene and ben-zo[b]fluoranthene were on average the prevailing heavyPAHs (Table 1).
Heat treatment did not lead to appreciable changes in

Name /food/69_116 09/26/2005 01:26PM Plate # 0-Composite pg 106 # 5
J. Food Prot., Vol. 69, No. 1PURCARO ET AL.
Allen Press • DTPro System GALLEY 106 File # 16ee
concentrations of heavy PAHs. Five different types of oilor mix were used for frying, and none of these showedmarked changes in concentrations of heavy PAHs at theend of the frying process. More variability in concentra-tions of light PAHs (especially F and Pa) were observedbefore and after frying, but these variations did not followa general trend (Pa concentration decreased after frying infive of the six continuous frying samples from large-scaleplants but increased after discontinuous frying) and couldnot be directly attributable to frying. No relationship wasfound between concentrations of light PAHs and theamount of time the oil was used for batch frying (2 to 8h).
Similar results were obtained when olive oil contami-nated with high concentrations of PAHs was used to pre-pare French fries with a domestic electrical fryer at 180�C.Figure 1 shows PAH concentrations in the olive oil beforefrying, after the first frying (heating time of 30 min), andafter the fourth frying (heating time of 4 h). Concentrationsof heavy PAHs remained nearly constant, whereas those oflight PAHs decreased slightly as heating time increased(possibly because of volatilization). These results partiallyconfirmed those reported by Barranco et al. (1), who foundthat when nonfatty foods (peppers) are fried in olive oil,heavy PAHs remained unaltered (even after 6 h), whereaslight PAHs increased slightly.
In comparisons made before and after frying, the oilextracted from potato chips and extruded snacks had higherconcentrations of light PAHs, in particular Pa and F, and insome cases higher concentrations of heavy PAHs. Thisslightly higher contamination level probably derives fromPAHs present in the air as contaminants (generated fromboth outdoor and indoor sources) that because of their li-pophilic nature can be easily trapped by a fatty product(fried snack). In some trials carried out in our laboratory,the potential of potato chips to easily absorb light PAHs(especially Pa, F, and P) from the atmosphere was clearlydemonstrated.
Vegetables can be contaminated by PAHs, in particularPa, F, and P, from atmospheric pollution and contaminatedsoil (13, 23). Because potatoes are peeled and washed be-fore processing, contamination of potato products fromthese environmental sources probably is negligible. Soil andatmospheric pollution probably have a greater effect on ce-real grains; in some cases, extruded cereal-based snacks aretoasted before frying.
Table 2 lists PAH concentrations in oils extracted from14 fried snack samples from the Italian market. The resultsobtained indicate that industrial frying is not of concern forPAH formation in fried products and that vegetable oilsused for large-scale frying have relatively low PAH con-centrations. Refining processes reduce the concentrations ofPAHs; the deodorization step reduces the concentrations oflight PAHs, and bleaching with activated carbon removesthe most of the heavy PAHs (1). With the exception ofsample S1, Pa and/or P were the most abundant light PAHs(means, 3.9 and 2.8 ppb, respectively). BaP concentrationsalso were below the current European Commission limit.The corn-extruded sample (S11) had the highest BaP con-
centration (1.2 ppb) and highest total heavy PAH concen-tration (6.1 ppb).
All results obtained indicate that for nonfatty foodsdeep frying either in continuous manner at industrial plantsor in a discontinuous manner in an electrical fryer (underthe conditions described) does not represent a risk for PAHformation in the frying oil or in the fried product. However,we cannot exclude the possibility that the frying processleads to some PAH formation in the fumes of cooking oils,as has been reported by others.
ACKNOWLEDGMENTS
The authors thank the Spanish companies that provided the friedsnack samples: Fritravich, Risi, El Castillo, Grupo Siro, Industrias Ali-mentarias de Montilla, and SvC Diversificacion.
REFERENCES
1. Barranco, A., R. M. Alonso-Salces, I. Crespo, L. A. Berrueta, B.Gallo, F. Vicente, and M. Sarobe. 2004. Polycyclic aromatic hydro-carbon content in commercial Spanish fatty foods. J. Food Prot. 67:2786–2791.
2. Bories, G. (ed.). 1988. Tossicita degli idrocarburi policiclici aroma-tici e dei prodotti di pirolisi. Tossicologia e sicurezza degli alimenti.Tecniche Nuove, Milan.
3. Chen, B. H., and Y. C. Chen. 2001. Formation of polycyclic aromatichydrocarbons in the smoke from heated model lipids and food lipids.J. Agric. Food Chem. 49:5238–5243.
4. Chen, Y. C., and B. H. Chen. 2003. Determination of polycyclicaromatic hydrocarbons in fumes from fried chicken legs. J. Agric.Food Chem. 51:4162–4167.
5. Chiang, T. A., W. P. Fen, L. S. Ying, L. F. Wang, and Y. C. Ko. 1999.Mutagenicity and aromatic amine content of fumes from heated cook-ing oils produced in Taiwan. Food Chem. Toxicol. 381:157–161.
6. Chiang, T. A., P. F. Wu, L. F. Wang, H. Lee, C. H. Lee, and Y. C.Ko. 1997. Mutagenicity and polycyclic aromatic hydrocarbon con-tent of fumes from heated cooking oils produced in Taiwan. Mutat.Res. 381:157–161.
7. European Commission. 2002. Opinion of the Scientific Committeeon Food on the risks to human health of polycyclic aromatic hydro-carbons in food. 4 December 2002. European Commission, Brussels.
8. European Commission. 2005. Commission regulation (EC) no 208/2005 of 4 February 2005 amending regulation (EC) no 466/2001 asregards polycyclic aromatic hydrocarbons. Off. J. Eur. Union L34:3.
9. Fritsch, C. W. 1981. Measurements of frying fat deterioration: a briefreview. J. Am. Oil Chem. Soc. 5:272–274.
10. Gao, Y. T., W. J. Blot, and W. Zheng. 1987. Lung cancer amongChinese women. Int. J. Cancer 40:604–609.
11. Hattermer-Frey, H. A., and C. C. Travis. 1991. Benzo(a)pyrene en-vironmental partitioning and human exposure. Toxicol. Ind. Health7:141–157.
12. Kim, I. S., M. S. Ahn, and D. K. Jang. 1993. A study on the oc-currence of benzo(a)pyrene in fats and oils by heat treatment. J.Korean Soc. Food Sci. Nutr. 9:323–328.
13. Kipopoulou, A. M., E. Manoli, and C. Samara. 1999. Bioconcentra-tion of polycyclic aromatic hydrocarbon in vegetables grown in anindustrial area. Environ. Pollut. 106:369–380.
14. Ko, Y. C., C. H. Lee, M. J. Chen, C. C. Huang, W. Y. Chang, H. J.Lin, H. Z. Wang, and P. Y. Chang. 1997. Risk factors for primarylung cancer among non-smoking women in Taiwan. Int. J. Epide-miol. 26:24–31.
15. Lee, M. L. 1981. Analytical chemistry of polycyclic aromatic com-pounds. Academic Press, N.Y.
16. Lee, M. L., M. V. Novotny, and K. D. Bartle (ed.). 1981. Analyticalchemistry of polycyclic aromatic compounds. Academic Press, Lon-don.
17. Li, S. G., D. F. Pan, and G. X. Wang. 1994. Analysis of polycyclicaromatic hydrocarbons in cooking oil fumes. Arch. Environ. Health49:119–122.
?2
?3

Name /food/69_116 09/26/2005 01:26PM Plate # 0-Composite pg 107 # 6
J. Food Prot., Vol. 69, No. 1 PAHS IN FRYING OILS AND SNACKS
Allen Press • DTPro System GALLEY 107 File # 16ee
18. Moret, S., and L. S. Conte. 2000. Polycyclic aromatic hydrocarbonsin edible fats and oils: occurrence and analytical methods. J. Chro-matogr. A 882:245–253.
19. Moret, S., and L. S. Conte. 2002. A rapid method for polycyclicaromatic hydrocarbon determination in vegetable oils. J. Sep. Sci.25:96–100.
20. Shields, P. G., G. X. Xu, W. J. Blot, J. F. Fraumeni, G. E. Trivers,D. E. Pellizzari, Y. H. Qu, Y. T. Gao, and C. C. Harris. 1995. Mu-tagens from heated Chinese and U.S. cooking oils. J. Natl. CancerInst. 87:836–841.
21. Siegmann, K., and K. Sattler. 1996. Aerosol from hot cooking oil, apossible health hazard. J. Aerosol Sci. 27:S493–S494.
22. Vainiotalo, S., and K. Matveinen. 1993. Cooking fumes as a hygienicproblem in the food and catering industries. Am. Ind. Hyg. Assoc. J.54:376–382.
23. Voutsa, D., and C. Samara. 1998. Dietary intake of trace elementsand polycyclic aromatic hydrocarbons via vegetables grown in anindustrial Greek area. Sci. Total Environ. 218:203–216.
24. Wu-Williams, A. H., X. D. Dai, W. Blot, Z. Xu, and X. W. Sun.1990. Lung cancer among women in north-east China. Br. J. Cancer62:982–987.
25. Zhu, L., and J. Wang. 2003. Sources and patterns of polycyclic ar-omatic hydrocarbons pollution in kitchen air, China. Chemosphere50:611–618.