Embed Size (px)
Citation preview
Anisotropy and order of epitaxial self-assembled quantum dots
Lawrence H. FriedmanDepartment of Engineering Science and Mechanics, Pennsylvania State University, 212 Earth and Engineering Science Building,
University Park, Pennsylvania 16802, USA�Received 24 September 2006; revised manuscript received 10 February 2007; published 2 May 2007�
Epitaxial self-assembled quantum dots �SAQDs� represent an important step in the advancement of semi-conductor fabrication at the nanoscale that will allow breakthroughs in electronics and optoelectronics. In theseapplications, order is a key factor. Here, the role of crystal anisotropy in promoting order during early stagesof SAQD formation is studied through a linear analysis of a commonly used surface evolution model. Elasticanisotropy is used as a specific example. It is found that there are two relevant and predictable correlationlengths. One of them is related to crystal anisotropy and is crucial for determining SAQD order. Furthermore,if a wetting potential is included in the model, it is found that SAQD order is enhanced when the deposited filmis allowed to evolve at heights near the critical surface height for three-dimensional film growth.
DOI: 10.1103/PhysRevB.75.193302 PACS number�s�: 81.07.Ta, 68.65.Hb, 81.15.Aa, 81.16.Dn
Epitaxial self-assembled quantum dots �SAQDs� repre-sent an important step in the advancement of semiconductorfabrication at the nanoscale that will allow breakthroughs inelectronics and optoelectronics. SAQDs are the result of lin-early unstable film growth in strained heteroepitaxial systemssuch as SixGe1−x /Si and InxGa1−xAs/GaAs and other sys-tems. SAQDs have great potential for electronic and opto-electronic applications. In these applications, order is a keyfactor. There are two types of order, spatial and size. Spatialorder refers to the regularity of SAQD dot placement, and itis necessary for nanocircuitry applications. Size order refersto the uniformity of SAQD size which determines the volt-age and/or energy level quantization of SAQDs. It has beenobserved that crystal anisotropy can have a beneficial effecton SAQD order.1 Here, the role of crystal anisotropy in pro-moting order during early stages of SAQD formation is stud-ied through a linear analysis of a commonly used surfaceevolution model.1–5
The linear analysis addresses the initial stages of SAQDformation when the nominally flat film surface becomes un-stable and transitions to three-dimensional growth. This earlystage of SAQD growth determines the initial seeds of orderor disorder in an SAQD array, and can be analyzed analyti-cally. A dispersion relation as in Refs. 2 and 6 is used, andtwo predictable correlation lengths that grow as the square-root of time �Eqs. �14� and �17�� are found. One of the cor-relation lengths results from crystal anisotropy. This lengthplays a limiting role in the initial order of SAQD arrays, andit is shown that anisotropy is crucial for creating a latticelikestructure that is most technologically useful. This method ofanalysis can be extended for use in any “nucleationless”model of SAQD growth, although here, the specific instanceof elastic anisotropy is treated as elastic anisotropy is themost easily estimated. Anisotropy of surface energy may alsoeffect SAQD order, and a similar analysis would result.
At later stages when surface fluctuations are large, non-linear dynamics come into play. At this stage, there is a natu-ral tendency of SAQDS to either order or ripen.1,6 Ripeningsystems will tend to have increased disorder as timeprogresses, while ordering systems will tend to order onlyslightly due to critical slowing down.7 Also, it is important tonote that while an ordering system might be “ordered” whencompared to other nonlinear phenomena such as convection
roles, etc.,8 the requirements for technological applicationare much more stringent. In a numerical investigation, it wasfound that SAQDs have enhanced order due to crystal aniso-tropy, but soon become disordered from ripening.1 In anycase, an understanding of the order during the initial stagesof SAQD growth is essential to further investigation of thefinal SAQD array order.
As in Refs. 1–3 and 6, a wetting energy is included in theanalysis. The wetting potential ensures that growth takesplace in the Stranski-Krastanow mode: a 3D unstable growthoccurs only after a critical layer thickness is achieved, and aresidual wetting layer persists. Although somewhat contro-versial, the physical origins and consequences of the wettingpotential are discussed in Refs. 2 and 9. The analysis pre-sented here is quite general, and one can exclude or neglectthe effect of the wetting potential by simply setting it to zero.That said, if the wetting potential is real, the present analysisshows that it beneficial to SAQD order to grow near thecritical layer thickness.
The remainder of this report is organized as follows. First,stochastic initial conditions are discussed. Second, the evo-lution of a single mode for the isotropic case is discussed.Third, the resulting correlation functions and correlationlengths are derived for the isotropic case. Fourth, the analysisis repeated for the anisotropic case using elastic anisotropyas an example. Finally, a representative numerical example ispresented using parameters appropriate for Ge dots grown onSi.
To analyze resulting SAQD order, the mathematicalmodel must include stochastic effects. For simplicity, sto-chastic initial conditions with deterministic time evolutionare used. This method of analysis yields a correlation func-tion that is used to characterize SAQD order.
In this model, the film height H is a function of lateralposition x and time t. The film height is treated as an average
film height �H� with surface fluctuations h�x , t�,
H = H + h�x,t� . �1�
In this way, H functions as a control parameter8 physicallysignifying the amount of available material per unit area toform SAQDs, and h�x , t� evolves via surface diffusion giving
PHYSICAL REVIEW B 75, 193302 �2007�
1098-0121/2007/75�19�/193302�4� ©2007 The American Physical Society193302-1
the resulting surface profile. Order is then analyzed using thespatial correlation function, �h�x , t�h�0 , t�� and the corre-sponding spectrum function �hk�t�hk��t�
*�.An initially flat surface is in unstable equilibrium, and it is
necessary to perturb it to produce SAQDs. Therefore, sto-chastic initial conditions are implemented by letting h�x ,0�in Eq. �1� be random white noise. Specifically, h�x ,0� isassumed to be sampled from a normal distribution such that
�h�x,0�� = 0, and �h�x,0�h�x�,0�� = �2�d�x − x�� ,
�2�
where � is the noise amplitude of dimension �length�1+d/2, dis the dimension of the surface, and �d�x� is thed-dimensional Dirac Delta function. Much of the followinganalysis uses the Fourier transform with the convention,hk�t�= �2��−d�ddk exp�−ik ·x�h�x , t�. The mean and two-point correlation functions for hk�0� are
�hk�0�� = 0 and �hk�0�hk��0�*� =�2
�2��d�d�k − k�� .
�3�
The deterministic evolution of a single Fourier componentis determined by surface diffusion with a diffusion potential��x , t�.2,3 This model is phenomenological in nature, butcontains the essential elements of SAQD formation. Thus, itis an adequate, but not overly complex starting point for theinvestigation of the effects of crystal anisotropy. Further-more, models of this nature can be derived from atomic scalesimulations.10 At any instant in time, the growing film isdescribed by the curve H�x , t�. Using Eq. �1� to decompose
the film height �th�x , t�=� · �D���x , t ;H��, dH /dt=Q,
where � depends on H and Q is the flux of new materialonto the surface.
The appropriate diffusion potential � must produceStranski-Krastanow growth. Thus, it must incorporate theelastic strain energy density � that destabilizes a planar sur-face, the surface energy density � that stabilizes planargrowth and a wetting potential W�H� that ensures substratewetting. The simplest form that gives the appropriate behav-ior is
� = ��� − �� + nzW��H�� �4�
similar to Refs. 1 and 4–6, where � is the atomic volume, �is the total surface curvature, and nz is the vertical compo-nent of the unit surface normal n. The strain energy density� is found using isotropic linear plane strain elasticity. Ingeneral, � is a function of x, and it is a nonlocal functional ofthe entire surface profile H�x�.
Consider first, the one-dimensional and two-dimensionalisotropic cases. Following Refs. 2, 4, and 6, the surface dif-fusion potential �Eq. �4�� is expanded to first order in the filmheight fluctuation h. The elastic energy � is calculated usinglinear isotropic elasticity. It is a nonlocal function of h�x�;thus, it is useful to work with the Fourier transform. In theisotropic case, the linearized diffusion potential �Eq. �5�� de-pends only on the wave vector magnitude k= �k�. Thus,
�k = f�k,H�hk �5�
with
f�k,H� = ��− 2M�1 + �02k + �k2 + W��H�� . �6�
In the anisotropic case, there will also be a dependence onthe wave vector direction �k.
The time dependence of the film height has a simple so-
lution if there is no additional flux of material �Q=0, and His constant�:
hk�t� = hk�0�e�kt, �7�
with
�k = − Dk2f�k,H� , �8�
where �k is the dispersion relation and depends only on thewave vector magnitude k. Modes with positive �k grow un-stably, while modes with negative values of �k decay.
The important features of �k are most easily recognizedusing a characteristic wave number is kc=2M�1+�0
2 /� anda characteristic time tc= �D��kc
4�−1:2,6
�k = tc−1 2� − 2 − �� , �9�
where the shorthand =k /kc and �=W��H� / ��kc2� is used.
The dispersion relation �9� has a peak at k0= 0kc where
0 =1
8�3 + 9 − 32�� .
Expanding �k about k0,
�k �0 −1
2�2�k − k0�2,
where
�0 =1
4tc 0
2� 0 − 2��, �2 = kc−2tc
−1�3 0 − 4�� . �10�
Thus,
hk�t� hk�0�e�0t−�1/2��2t�k − k0�2. �11�
Now, the statistical correlation functions and correlationlengths that characterize order are derived. Using Eqs. �7�and �11� along with the stochastic initial conditions �Eqs. �2�and �3��, the mean value of hk�t� is �hk�t��= �hk�0��e�kt=0, sothat the mean surface perturbation is simply 0 for all timeand all k. However, the mean-square surface perturbations ascharacterized by the second-order correlation function11 canbe large,
�hk�t�hk��t�*� = �hk�0�hk��0�*�e��k+�k��t
=�2
�2��d�d�k − k��e2�kt, �12�
using Eq. �3�. The real space correlation function can befound by taking the inverse Fourier transform of Eq. �12�,
BRIEF REPORTS PHYSICAL REVIEW B 75, 193302 �2007�
193302-2
�h�x,t�h�x�,t�*� =� ddk� ddk�eik·x−ik�·x��hk�t�hk��t�*�
=�2
�2��d � ddkeik·�x−x��e2�kt, �13�
where integration over k� is simple due to the �d�k−k�� inEq. �12�.
Using Eq. �10�,e2�kte2�0t−�1/2��2�2t��k−k02� which is peaked
at k=k0. This form suggests that the real-space correlationfunction is periodic with a Gaussian envelope that has a stan-dard deviation of
Lcor = 2�2t . �14�
Lcor is the correlation length of the film-height profile, andcharacterizes the degree of order of the SAQD array. Forexample, in one dimension �d=1�
�h�x,t�h�0,t�*� ¯ ¯
=�2
2��±�
0
�
dke2�0t−�1/2�Lcor2 �k − k0�2±ikx
¯
2�2
�2�Lcor2 �1/2e2�0t−�1/2��x/Lcor�
2cos�k0x�
an approximation that is valid if kcLcor�1. Thus, Lcor givesthe length scale over which dots will be ordered, and thisscale grows as t1/2. As t→�,
�h�x,t�h�0,t�*� =2�2
�2�Lcor2 �1/2e2�0t cos�k0x� ,
and the entire array should be perfectly ordered.The situation in two-dimensions, however, is less friendly.
As t→�, Lcor→�, and e−�1/2�Lcor2 �k−k0��2� /Lcor
2 �1/2��k−k0�
�h�x,t�h�0,t�*� ¯ =�2
�2��3/2Lcor� d2ke2�0t+ik·x��k − k0� ¯
=�2k0
�2�Lcor2 �1/2e2�0tJ0�k0 � x � � .
Thus, the two-dimensional isotropic case has statistical orderat large times, but does not yield SAQD lattices as does theone-dimensional case �see Figs. 1�a� and 1�b��.
Now, consider the effects of crystal anisotropy. For ex-ample, let the elastic energy term � have N-fold symmetrywhile the other terms are assumed isotropic. Then, thegrowth rate depends on both the wave vector magnitude k�and thus on =k /kc� and direction �k so that, �k→�k.Naturally, the anisotropic elastic energy term in the growthrate �k depends on the specific anisotropic elastic constants,but the general qualitative effect of elastic anisotropy onSAQD growth kinetics can be investigated without incorpo-rating a detailed elastic calculation at this time. Thus, thepresent work provides motivation for more detailed calcula-tion. A reasonable way to estimate how the elastic energyterm varies with direction ��k� is to assume a low orderharmonic form with the proper rotational symmetry. Thesimplest such guess is �k= tc
−1 2 �1− sin2�N�k /2��− 2
−��, where parametrizes the importance of the directionaldependence. More precise calculations using anisotropicelastic constants of real materials �similar to Ref. 12� will begiven in future work.
�k has peaks at N wave vectors kn=k0��cos �n�ex
+ �sin �n�ey� with �n=2��n−1� /N. Around each peak, k canbe decomposed in the direction parallel �k�� and perpendicu-lar �k�� to kn. Using this decomposition and expanding e2�kt
about each peak,
e2�kt �n=1
N
exp�2�nt� , �15�
2�nt = 2�0t −1
2L�
2�k� − 0kc�2 −1
2L�
2 k�2 , �16�
L� = 2�2t, and L� = �N2 0tc−1kc
−2�t . �17�
Note that L� is the same as Lcor for the isotropic case. Equa-tion �15� is valid if kcL��1, and kcL��1. Using, Eq. �13�,but noting that �k now depends on both the magnitude anddirection of k, along with Eqs. �15� and �16�,
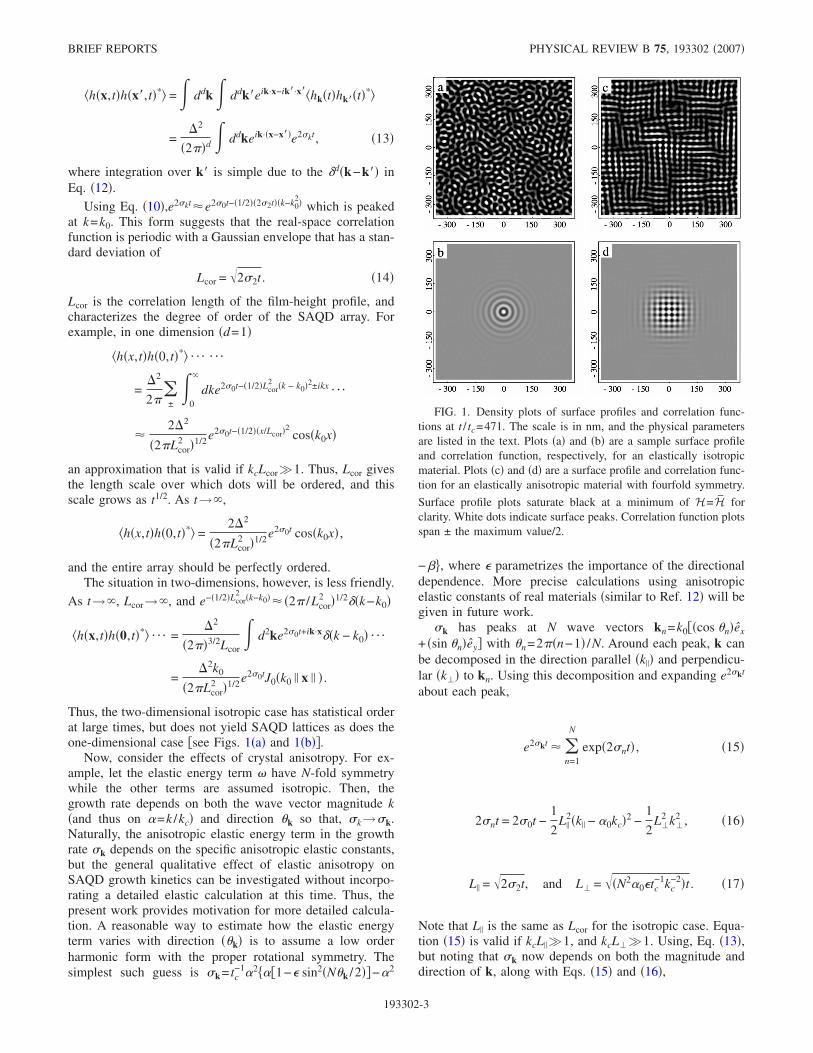
FIG. 1. Density plots of surface profiles and correlation func-tions at t / tc=471. The scale is in nm, and the physical parametersare listed in the text. Plots �a� and �b� are a sample surface profileand correlation function, respectively, for an elastically isotropicmaterial. Plots �c� and �d� are a surface profile and correlation func-tion for an elastically anisotropic material with fourfold symmetry.
Surface profile plots saturate black at a minimum of H=H forclarity. White dots indicate surface peaks. Correlation function plotsspan ± the maximum value/2.
BRIEF REPORTS PHYSICAL REVIEW B 75, 193302 �2007�
193302-3
�h�x,t�h�0,t�*� =�2
�2��2
2�
L�L�
� . . . �n=1
N/2
e2�0t−�1/2��L�−2x�
2+L�−2x�
2 �2 cos�k0x�� ,
�18�
where x� = �cos �n�x+ �sin �n�y and x�= �−sin �n�x+ �cos �n�y.Thus, the same tendency to long-range order as for the one-dimensional case is present �see Figs. 1�c� and 1�d��.
As a numerical example, consider Ge grown on Si. Boththe isotropic approximation and an estimated elastically an-isotropic case �with N=4, and =0.1� are treated. Neglectingthe difference in elastic properties of the Si substrateEGe=1.361�1012 dyne/cm2, Ge=0.198, 0=−0.0418,�=2.27�10−23 cm3, �=1927 erg/cm2, and W�H�=4.75�10−6 /H erg/cm3. The resulting biaxial modulus isM =1.697�1012 dyne/cm2, characteristic wavenumber is
kc=0.369 nm−1 and critical film height is Hc=1.132 nm
4 ML. If the film is grown to a thickness of H=Hc+0.25 ML1.203 nm, and then allowed to evolve,�=0.2078, 0=0.5664, k0=0.209 nm−1, �0=0.01206tc
−1,�2=0.867kc
−2tc−1, L� =0.746k0
−1�t / tc�1/2, andL�=0.539k0
−1�t / tc�1/2. Note that the unspecified diffusivity Dhas been absorbed into tc. The film will stay in the linearregime as long as the surface fluctuations stay small. For thispurpose, let “small” mean 1 ML=2.83�10−8 cm. Once thefluctuations become “large,” individual dots will begin toform, and a nonlinear analysis becomes necessary. It is use-ful to know the correlation lengths at this time.
To find the correlation lengths, one must choose the initialheight fluctuation intensity � and then calculate the time forfluctuations to become “large.” The initial fluctuation inten-sity is somewhat arbitrary, but �=8.02�10−16 cm2 gives anaverage fluctuation of 1 ML over a patch 1 ML2 and seemsappropriate. Next Eqs. �17� and �18� are used to find t forwhich the rms fluctuations become large hrms= ��h�0, t��2�1/2
=a0. There are two solutions, t / tc=5.53�10−3, andt / tc=471. The first solution is an artifact of the white noiseinitial conditions and occurs during an initial shrinking of thesurface height variance; thus, the second solution is taken. Att / tc=471, the correlation lengths are found using Eq. �17�,Lcor=L� =77.5 nm, and L�=56.0 nm. The smaller correlation
length gives k0L� /�=3.73, so a patch of about four dotsacross is expected to be reasonably well ordered.
A numerical simulation of linear size l=24�2� /k0�=722 nm can be easily performed. The discrete initial con-ditions hk�0� are taken from a normal distribution of zeromean and variance �hk�0�hk�
* �0��discrete= ��2 / l2��kk�, where�kk� is the Kronecker delta, and each vector component of ktakes discrete values 2�m / l with m an integer. These com-ponents then evolve via Eq. �7�. The results of an isotropicand anisotropic simulation along with the correspondingreal-space correlation functions are shown in Fig. 1. Theseplots clearly demonstrate the importance of anisotropy inproducing long range order.
Figures 1�c� and 1�d� appear to agree qualitatively withobservations of nucleationless growth of GexSi1−x nanostruc-tures on Si,13–15 although mostly with x�0.5. Typical ob-served dot arrangements appear to correspond to lower val-ues of � than 0.2078 used for the example as they arequasiperiodic but less ordered than Fig. 1�c�. Quantitativereporting of correlation lengths would assist comparison andpossibly enable better tuning of phenomenological models toexperiments. InP/ InGaP nanostructures reported in Ref. 16appear similar.
From the analysis of the isotropic model, it is clear thatlong range statistical order �long correlation lengths� requiretight distributions in reciprocal space. This long range statis-tical order is achieved in the large time limit, but this statis-tical order is insufficient to produce a well-ordered array ofSAQDs. This lack of usable order is reflected in the real-space two-point correlation function of the isotropic model.However, in the one-dimensional and two-dimensional an-isotropic cases, there is tendency to form a lattice after a longtime. In the anisotropic case, there are two correlationlengths that characterize observed SAQD array order. Ana-lytic formulas for these correlation lengths have been givenfor a model with simplified elastic anisotropy, but the generalconclusions and method of analysis should apply to anysource of anisotropy. Additionally, from a simple form of thewetting potential it is observed that at film heights just abovethe critical threshold Hc, the correlation lengths can growquickly while the height fluctuations grow slowly; thus orderis enhanced. Availability of measured SAQD correlationlengths would help to improve this analysis and to engineermore ordered quantum dot arrays.
1 P. Liu, Y. W. Zhang, and C. Lu, Phys. Rev. B 67, 165414 �2003�.2 B. J. Spencer, P. W. Voorhees, and S. H. Davis, J. Appl. Phys. 73,
4955 �1993�.3 Y. W. Zhang, A. F. Bower, and P. Liu, Thin Solid Films 424, 9
�2003�.4 W. T. Tekalign and B. J. Spencer, J. Appl. Phys. 96, 5505 �2004�.5 Lawrence H. Friedman and Jian Xu, Appl. Phys. Lett. 88, 093105
�2006�.6 A. A. Golovin, S. H. Davis, and P. W. Voorhees, Phys. Rev. E 68,
056203 �2003�.7 Yu U. Wang, Yongmei M. Jin, and Armen G. Khachaturyan, Acta
Mater. 52, 81 �2004�.
8 M. C. Cross and P. C. Hohenberg, Rev. Mod. Phys. 65, 851�1993�.
9 M. J. Beck, A. van de Walle, and M. Asta, Phys. Rev. B 70,205337 �2004�.
10 C. Haselwandter and D. V. Vedensky �unpublished�.11 Robert Zwanzig, Nonequilbrium Statistical Mechanics �Oxford
University Press, New York, 2001�.12 Y. Obayashi and K. Shintani, J. Appl. Phys. 84, 3141 �1998�.13 I. Berbezier et al., Surf. Sci. 531, 231 �2003�.14 Karl Brunner, Rep. Prog. Phys. 65, 27 �2002�.15 H. J. Gao and W. D. Nix, Annu. Rev. Mater. Sci. 29, 173 �1999�.16 J. R. R. Bortoleto et al., Appl. Phys. Lett. 82, 3523 �2003�.
BRIEF REPORTS PHYSICAL REVIEW B 75, 193302 �2007�
193302-4