Embed Size (px)
Citation preview
287
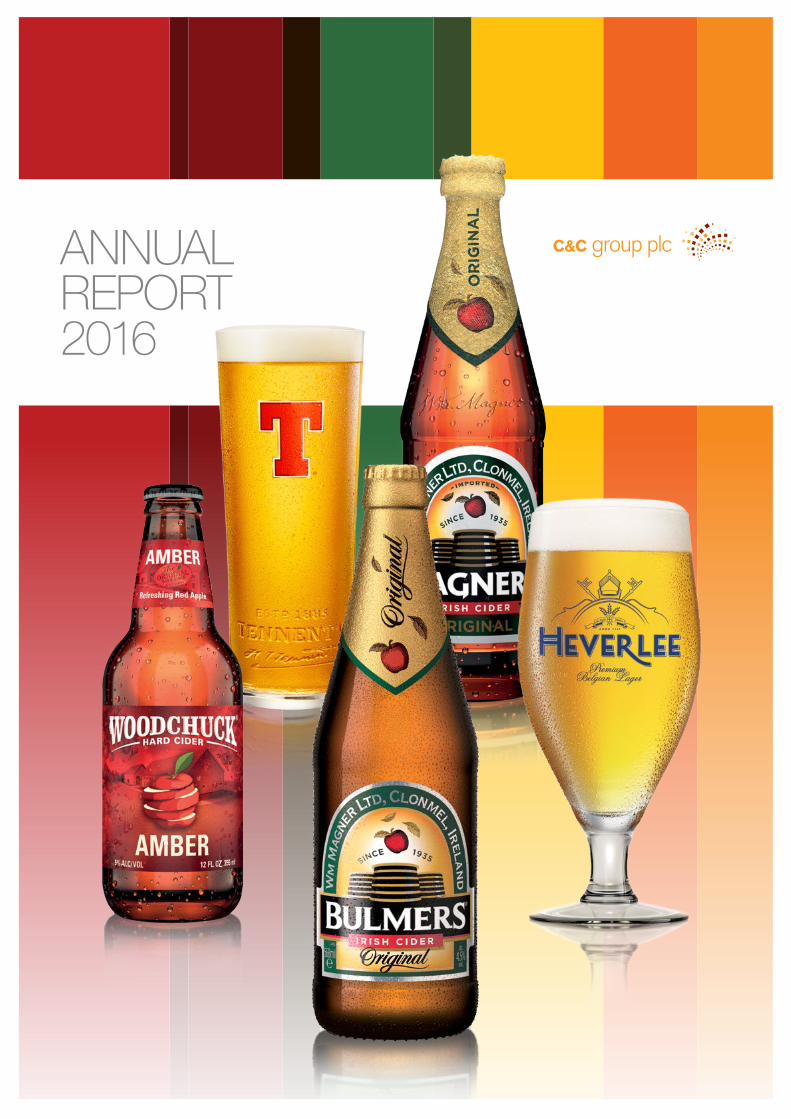
ANNUALREPORT2016
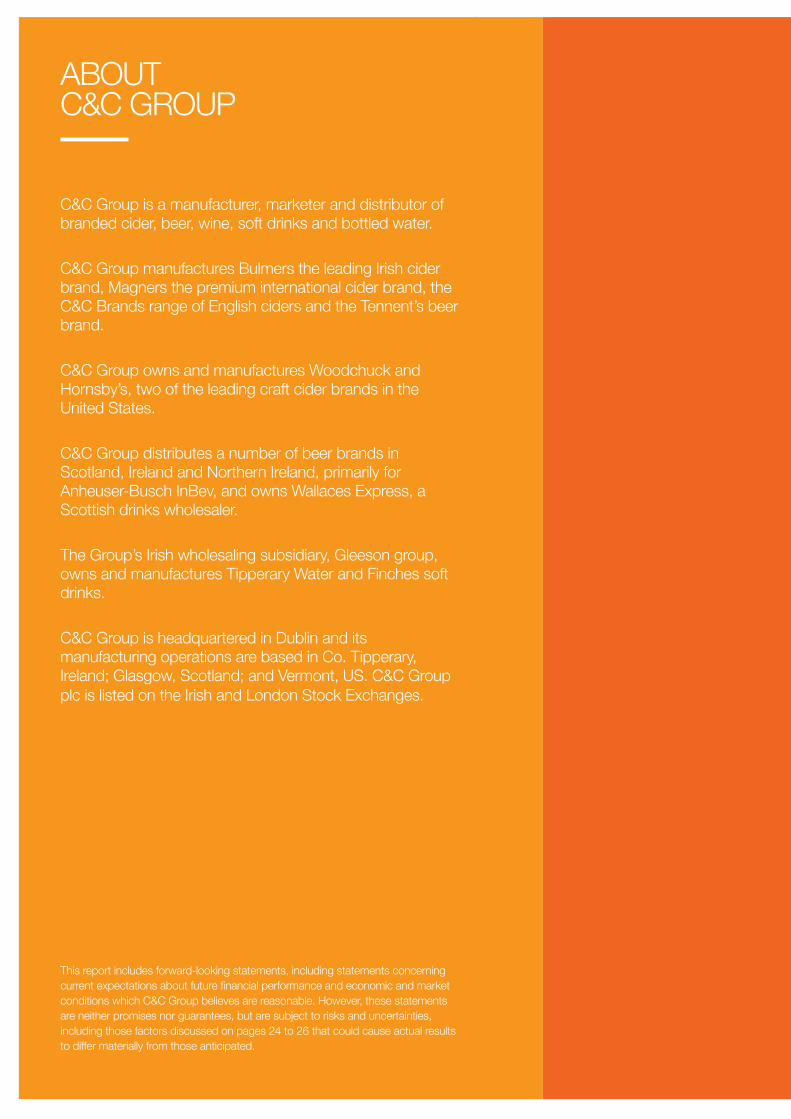
C&C Group is a manufacturer, marketer and distributor of branded cider, beer, wine, soft drinks and bottled water.
C&C Group manufactures Bulmers the leading Irish cider brand, Magners the premium international cider brand, the C&C Brands range of English ciders and the Tennent’s beer brand.
C&C Group owns and manufactures Woodchuck and Hornsby’s, two of the leading craft cider brands in the United States.
C&C Group distributes a number of beer brands in Scotland, Ireland and Northern Ireland, primarily for Anheuser-Busch InBev, and owns Wallaces Express, a Scottish drinks wholesaler.
The Group’s Irish wholesaling subsidiary, Gleeson group, owns and manufactures Tipperary Water and Finches soft drinks.
C&C Group is headquartered in Dublin and its manufacturing operations are based in Co. Tipperary, Ireland; Glasgow, Scotland; and Vermont, US. C&C Group plc is listed on the Irish and London Stock Exchanges.
This report includes forward-looking statements, including statements concerning current expectations about future financial performance and economic and market conditions which C&C Group believes are reasonable. However, these statements are neither promises nor guarantees, but are subject to risks and uncertainties, including those factors discussed on pages 24 to 26 that could cause actual results to differ materially from those anticipated.
ABOUT C&C GROUP
CONTENTS
Global Opportunity
Market Operation
Chairman’s Statement
Group Chief Executive Officer’s Review
Strategic Report – Strategy and Business Model
Strategic Report – Strategy Achievements and Priorities
Strategic Report – Key Performance Indicators
Strategic Report – Principal Risks and Uncertainties
Operations Review
Group Chief Financial Officer’s Review
Corporate Responsibility
Business & Strategy
Governance
Financial Statements
04
06
08
10
18
20
22
24
28
38
44
Board of Directors
Directors’ Report
Directors’ Statement of Corporate Governance
Report of the Remuneration Committee on Directors’ Remuneration
Statement of Directors’ Responsibilities
54
56
60
72
91
94
98
99
100
101
102
103
104
105
118
185
187
Independent Auditor’s Report
Group Income Statement
Group Statement of Comprehensive Income
Group Balance Sheet
Group Cash Flow Statement
Group Statement of Changes in Equity
Company Balance Sheet
Company Statement of Changes In Equity
Statement of Accounting Policies
Notes Forming Part of the Financial Statements
Financial Definitions
Shareholder and Other Information
VIEW THIS REPORT ONLINEcandcgroupplc.com orcandc.annualreport16.com
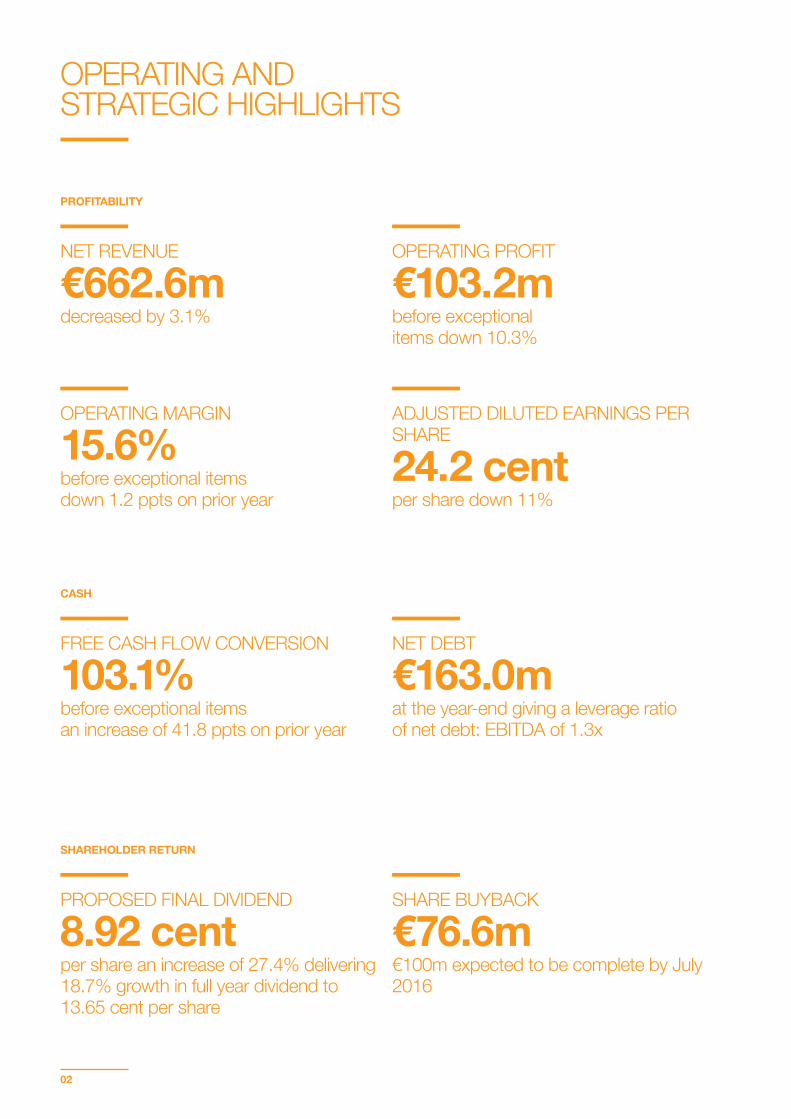
NET REVENUE
€662.6mdecreased by 3.1%
ADJUSTED DILUTED EARNINGS PER SHARE
24.2 cent per share down 11%
OPERATING AND STRATEGIC HIGHLIGHTS
OPERATING PROFIT
€103.2mbefore exceptional items down 10.3%
PROPOSED FINAL DIVIDEND
8.92 centper share an increase of 27.4% delivering 18.7% growth in full year dividend to 13.65 cent per share
OPERATING MARGIN
15.6%before exceptional itemsdown 1.2 ppts on prior year
FREE CASH FLOW CONVERSION
103.1%before exceptional items an increase of 41.8 ppts on prior year
NET DEBT
€163.0mat the year-end giving a leverage ratio of net debt: EBITDA of 1.3x
SHARE BUYBACK
€76.6m€100m expected to be complete by July 2016
PROFITABILITY
CASH
SHAREHOLDER RETURN
02
Business & Strategy
For the next year, we look forward to the continuing strong performance of our export business; renewed growth in the US; a sustained recovery for Magners in our C&C Brands business; and a stronger performance in both Scotland and Ireland.
Read more in the Chairman’s Statement on page 8
...the Group’s long term strategy of strong domestic brand geographic combinations providing the foundation to participate in international cider growth remains unchanged.
Read more in the Group Chief Executive Officer’s Review on page 10
IN THIS SECTION
Global Opportunity
Market Operation
Chairman’s Statement
Group Chief Executive Officer’s Review
Strategic Report – Strategy and Business Model
Strategic Report – Strategy Achievements and Priorities
Strategic Report – Key Performance Indicators
Strategic Report – Principal Risks and Uncertainties
Operations Review
Group Chief Financial Officer’s Review
Corporate Responsibility
04
06
08
10
18
20
22
24
28
38
44

Exportingto over 60 markets globallyAlbaniaAndorraAustraliaAustriaAzerbaijanBahamasBahrainBelgiumBermudaBrazilBulgariaBritish Virgin IslandsCambodiaCanadaCayman IslandsChinaCosta RicaCyprusCzech Republic DenmarkEstoniaFinland
FranceGermanyGhanaGibraltarGreeceHong KongHungaryIndiaIsraelItalyJapanLatviaLithuaniaLuxembourgMalaysiaMaltaNetherlandsNew ZealandNorwayPhilippinesPolandPortugalPuerto Rico
QatarRomaniaRussiaSingaporeSouth AfricaSouth KoreaSpainSri LankaSt. LuciaSt. MaartenSwedenSwitzerlandTaiwanThailandTrinidad & TobagoTurkeyUAEUkraineUnited KingdomUSUS Virgin IslandsVietnam
GLOBAL OPPORTUNITY
04
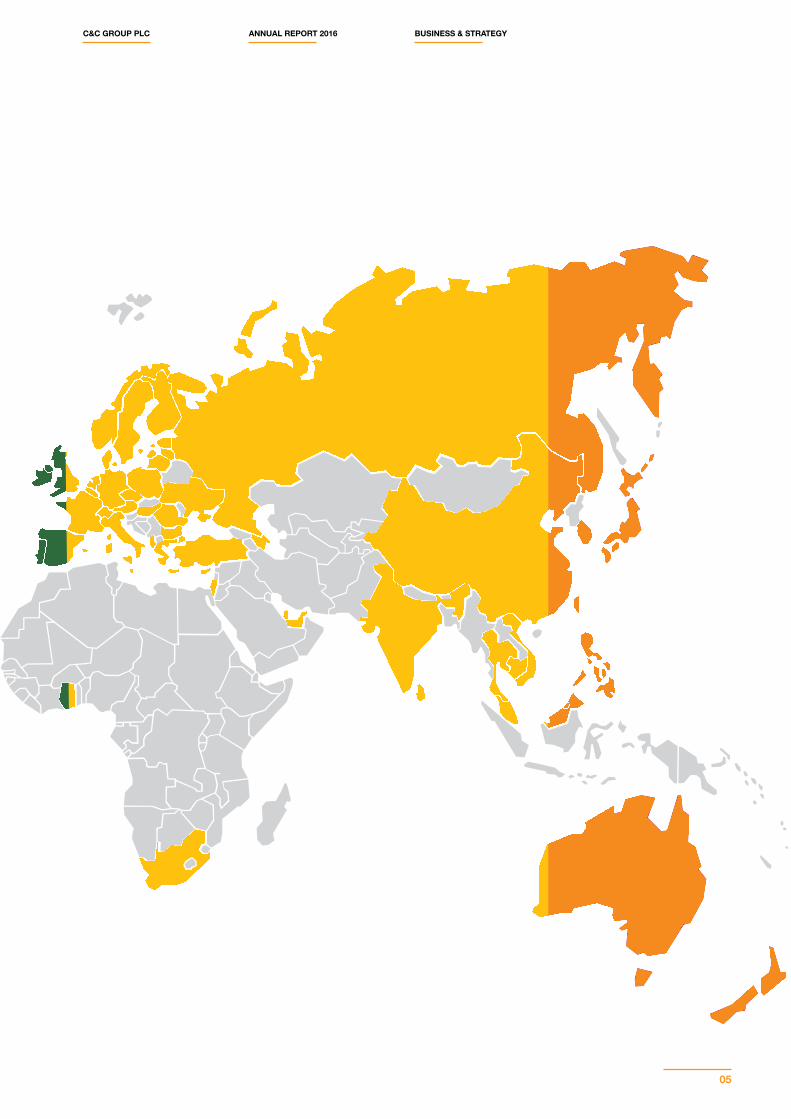
Exportingto over 60 markets globally
C&C GROUP PLC ANNUAL REPORT 2016 BUSINESS & STRATEGY
05

Export
NorthAmerica
C&CBrands
Brands
Brands
Brands
DistributionRights
ScotlandBrands
DistributionRights
IrelandBrands
DistributionRights
Bulmers is ROI only. Magners is NI only.
Budweiser is NI only.
MARKET OPERATION
06
Export
NorthAmerica
C&CBrands
Brands
Brands
Brands
DistributionRights
ScotlandBrands
DistributionRights
IrelandBrands
DistributionRights
Bulmers is ROI only. Magners is NI only.
Budweiser is NI only.
IRISH CIDER BRANDSBulmers Original is a premium, traditional blend of Irish cider with an authentic clean and refreshing taste.
Magners is a premium, traditional blend of Irish cider with a crisp, refreshing flavour and a natural authentic character.
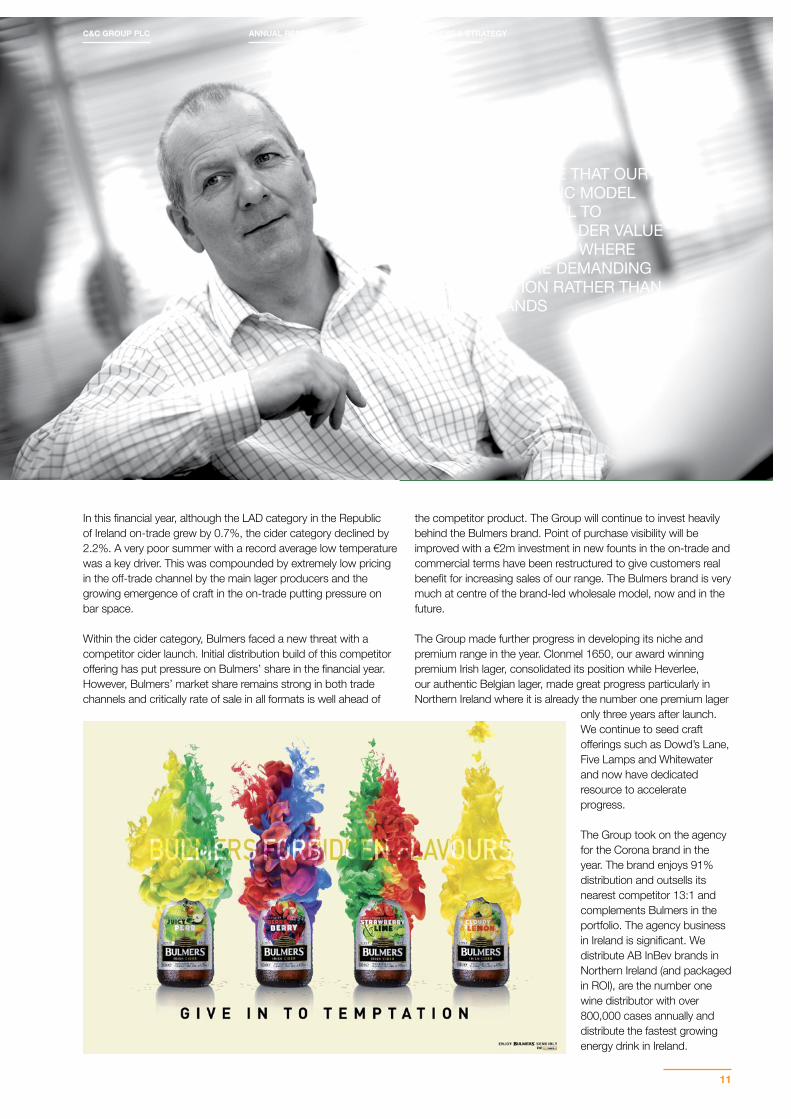
Also in the range are the Bulmers and Magners Forbidden flavours range which includes Cloudy Lemon, Strawberry & Lime, Juicy Pear and Berry.
ENGLISH CIDER BRANDSGaymers is a clean, crisp, easy drinking medium cider made using the finest English apples.
Blackthorn is a West Country legend and one of the country’s best known and widely drunk ciders due to its secret blend of bittersweet English cider apples. The range includes Blackthorn Gold, Blackthorn Dry and Black ‘n Black.
Ye Olde English is a traditional medium dry cider made using a unique blend of dessert and cider apples to deliver a deliciously refreshing taste.
Addlestones is a naturally cloudy premium cider that is twice fermented but never filtered to deliver its unique, smooth taste.
Chaplin & Cork’s is an award winning range of exquisite ciders made using pure juice from the finest English cider apples. The range includes Somerset Gold and Somerset Reserve.
K cider is a full strength, premium cider expertly pressed with a unique blend of English cider apples to deliver a full bodied flavour and rich golden colour.
Other English cider brands include Natch, Special VAT and Taunton Traditional.
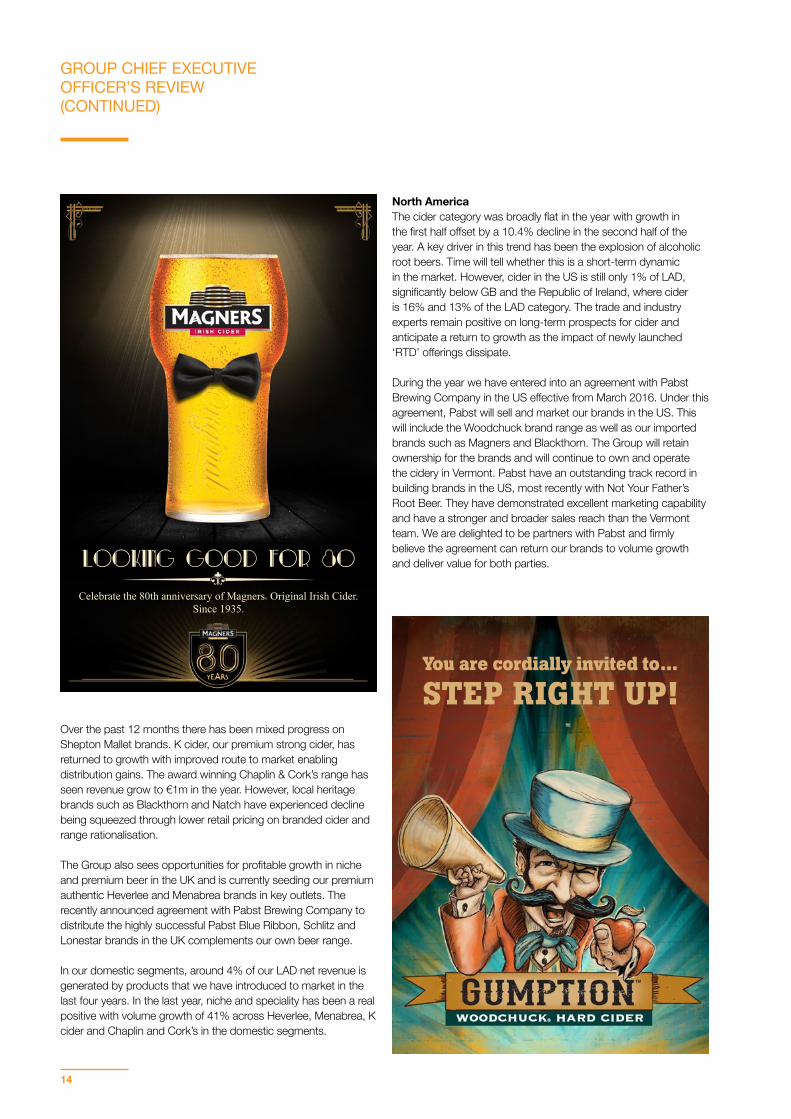
AMERICAN CIDER BRANDS Woodchuck Hard Cider is a premium hard cider handcrafted in Vermont, US from the highest quality ingredients while offering an innovative range of ciders. Gumption is the newest style in our Woodchuck family and pairs the fresh juice of common eating apples with dry European bittersweet cider apples. The bold packaging and active lifestyle delivers a new energy to the Woodchuck brand family.
Wyder’s Hard Cider was formulated in 1987 by cider master Ian Wyder and is now available throughout the central and western United States.
Hornsby’s is a cider which combines traditional cider-making techniques with an American heritage. It comes in two styles, Crisp Apple and Amber Draft.
BEER BRANDSTennent’s Lager is brewed to the highest standards to create a lager with a crisp taste and refreshingly clean finish. Tennent’s has been made with pride in the heart of Glasgow since 1885, but is famous far beyond its home city. Tennent’s Lager is Scotland’s best-selling lager.
Tennent’s Black T is brewed in Glasgow using finest natural ingredients, including 100% Scottish barley. It is a golden lager with a well-rounded flavour and a distinct smooth maltiness.
Caledonia Best is a modern, distinctive ale that is balanced, sweet and smooth, with a malty roast flavour and a pleasant hoppy bitterness.
Heverlee is a premium Belgian Beer, which is endorsed by the Abbey of the order of Prémontré, in the town of Heverlee in Leuven.
Clonmel 1650, named after one of the most historic events in the town of Clonmel, is a fine example of a pilsner style lager with a slightly fruity estery nose and a subtle hoppy character.
Other beer brands include Tennent’s Beer aged with Whisky Oak, Tennent’s Extra, Tennent’s Scotch Ale, Tennent’s 1885 and Roundstone Irish Ale.
WINE AND SPIRIT BRANDSThe Group’s portfolio of wine and spirit brands sold in the on-trade includes the Oliver & Greg’s and Moondarra wine brands, Odessa Vodka and Squires Gin.
The Group also distributes a number of wine brands in the Republic of Ireland including Santa Rita, Blossom Hill and Yellow Tail.
SOFT DRINKSTipperary Pure Irish Water is proudly bottled at source in Tipperary.
Finches is a range of premium soft drinks in orange and other flavours produced in Ireland with pure natural spring water.
JWV+ is made from natural mineral water and comes in two flavoured varieties: Mixed Berries and Mandarin & Orange. It contains a range of health intrinsics and is targeted at consumers looking for tasty refreshing alternatives to the traditional soft drink and bottled water offering.
C&C GROUP PLC ANNUAL REPORT 2016 BUSINESS & STRATEGY
07
Our performance in our core geographies of Ireland and Scotland was influenced by a number of factors outside of our direct control during the year - including poor weather, increased competition in Ireland and the impact of tighter drink driving legislation in Scotland. Our evolution to an integrated brand-led wholesale model in both core geographies has also taken longer than anticipated though the process was completed during the course of the year and we are well positioned in both territories for next year and beyond.
The competitive nature of our core geographies and the evolution of consumer preferences towards a more diverse range of drinks is the basis for our evolution to a brand-led wholesale model. This is, we believe, the right model for the long-term and will drive an improving financial performance. However, despite the confidence we have in this model, we have to continue to streamline our operations and cost base to ensure we are able to compete against our peers – many of whom are larger with greater scale, reach and financial resource.
As a consequence, we took the difficult decision to reduce our workforce across our operations in Ireland, Scotland and in the C&C Brands business during the year. These changes are regrettable and we have worked hard to re-deploy affected employees in Ireland at our Clonmel site and to seek a buyer for our assets in Shepton Mallet which would, in turn, sustain employment for some of the affected employees at that site.
Our C&C Brands business continues to show steady recovery and investment behind the Magners brand in England and Wales this year should sustain that recovery.
In Export markets, Magners and Tennent’s continue to perform strongly. We delivered in the year 22% growth in our own branded volume and believe this rate of growth is sustainable for
CHAIRMAN’S STATEMENT
the coming twelve months. We have recently put in place new distribution arrangements across a range of markets including New Zealand, South Africa and Thailand with further countries in Asia and Africa being added. Some of these arrangements have been in development for a number of years and we are only now seeing the benefit of our investment in Export markets over a multi-year period.
Our performance in the US market over the past number of years has not met our expectation. However, we are confident about the prospects for the business following our new sales and marketing arrangement with Pabst Brewing Company. We believe we now have the right partner to drive the performance of our brands in the US market. We are also pleased to have agreed the exclusive distribution rights for the Pabst brands in Ireland and the UK, which will add further depth to our growing brand portfolio.
ECONOMIC AND INDUSTRY BACKGROUNDClearly it is generally acknowledged that this is a period of significant political and economic volatility. Whether it is the European dimension or changes in the view of economies formerly regarded as the BRICS on which much of the world economic growth was anticipated as being dependent. All are subject to reappraisal and reassessment. It is all too easy to allow these vagaries to obscure fundamentals, certainly from a business perspective. Our conviction remains that a strategy of consolidation in core territories coupled with international brand expansion is fundamentally attractive from a business and shareholder perspective.
A notable consolidation in our industry with a likely combination of two of the major participants has probably in the short-term led to a corporate and business reassessment by many. Our perspective has not altered. As opportunities arise as a consequence of this consolidation, or indeed other market developments, and are
OPERATING RESULTS The last financial year has been a challenging one for the C&C business. While the financial outcome represents a reduction on the prior year, we have however made substantial operational progress within the business and are positioned for a more consistent financial performance and business development in the coming year.
08
attractive for our shareholders we will consider them. The ultimate determinant as to their attraction will be whether they enhance our shareholders’ value.
CAPITAL ALLOCATIONReflecting both the strength of the Group’s balance sheet and free cash flow characteristics during the year we spent €77 million in purchasing the Company’s shares as part of our share buyback programme. Our strong cash generation means there has been effectively no increase in the Group’s net debt despite this substantial return of capital to shareholders. We are also proposing to pay a final dividend of 8.92 cent per share, subject to shareholder approval. If approved, this will bring the Group’s full dividend to 13.65 cent, a 18.7% increase on last year, and is consistent with our commitment to provide certainty of value in the form of a progressive dividend stream. A scrip dividend alternative will also be available.
At the AGM, we will again seek authority from shareholders for the Company to repurchase its own shares. This authority will be exercised if the Board considers it would be in the best interests of shareholders generally.
GOVERNANCE & CORPORATE RESPONSIBILITYThe Board and senior management team are committed to maintaining the highest standards of governance and ethical behaviour throughout the business. A statement of our main Governance principles and practice is provided on pages 60 to 71 and reflect the requirements of the 2014 UK Corporate Governance Code and the Irish Corporate Governance Annex.
We take corporate responsibility seriously and our Corporate Responsibility Statement on pages 44 to 52 sets out our work this year in this area. Recognising the importance of shareholder
engagement, I have also recently completed a series of meetings, focused principally on corporate governance, with a number of the Group’s largest institutional shareholders – a practice which I now engage in annually. Consistent with the principles of the UK Corporate Governance Code, I have ensured that feedback from these meetings has been shared with the Board as a whole.
Continued refreshment and development of the Board is an ongoing process. As indicated in last year’s Annual Report, John Hogan retired from the Board at the end of FY2016. Tony Smurfit has also stepped down from the Board following his appointment as Chief Executive Officer of Smurfit Kappa Group. I would like to thank John and Tony for the significant contribution they have made to the Group. Vincent Crowley and Rory Macnamara both joined the Board in January and each brings invaluable experience to the Board across a range of markets and sectors. We look forward to their contribution in the years ahead.
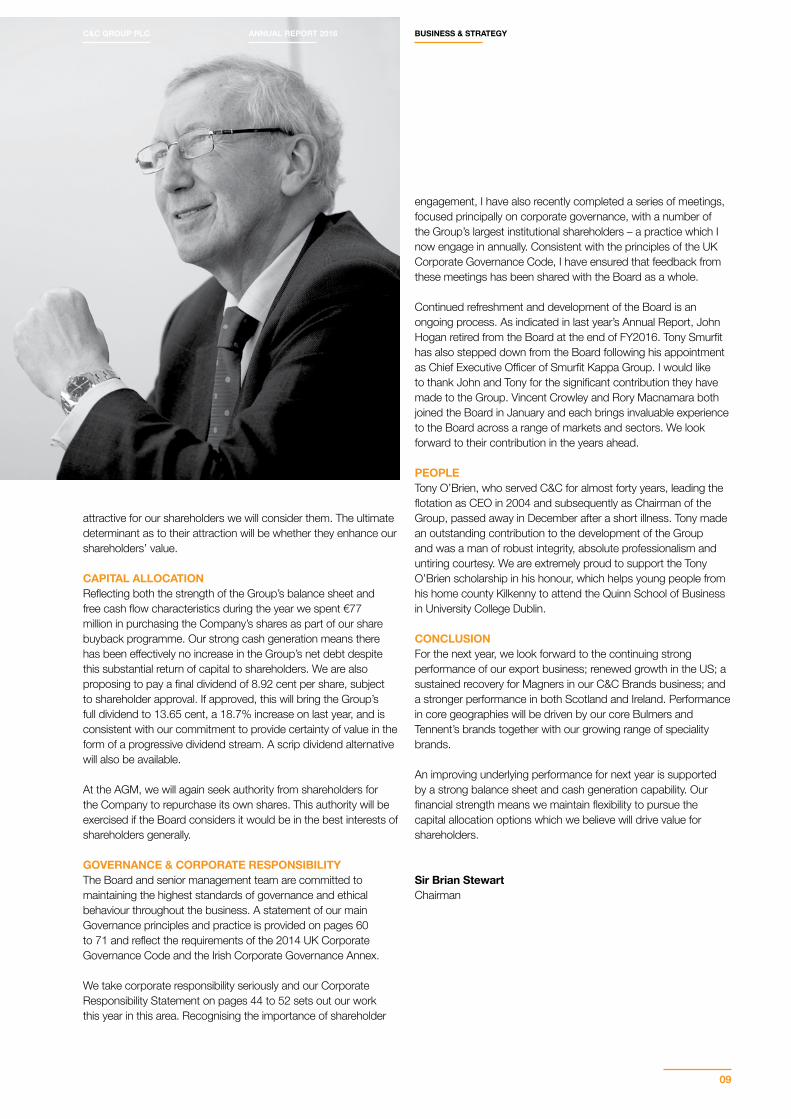
PEOPLETony O’Brien, who served C&C for almost forty years, leading the flotation as CEO in 2004 and subsequently as Chairman of the Group, passed away in December after a short illness. Tony made an outstanding contribution to the development of the Group and was a man of robust integrity, absolute professionalism and untiring courtesy. We are extremely proud to support the Tony O’Brien scholarship in his honour, which helps young people from his home county Kilkenny to attend the Quinn School of Business in University College Dublin.
CONCLUSION For the next year, we look forward to the continuing strong performance of our export business; renewed growth in the US; a sustained recovery for Magners in our C&C Brands business; and a stronger performance in both Scotland and Ireland. Performance in core geographies will be driven by our core Bulmers and Tennent’s brands together with our growing range of speciality brands.
An improving underlying performance for next year is supported by a strong balance sheet and cash generation capability. Our financial strength means we maintain flexibility to pursue the capital allocation options which we believe will drive value for shareholders.
Sir Brian StewartChairman
C&C GROUP PLC ANNUAL REPORT 2016
09
BUSINESS & STRATEGY
During the year, the Group delivered an operating profit of €103.2 million which was an €11.8 million reduction on the previous year. The reduction in operating profit is largely due to challenging trading conditions in our Ireland and Scotland businesses. Our cash conversion in the year was exceptional with a 103% conversion of EBITDA pre exceptional costs compared to 61% in the previous year. This enabled the Group to continue share buyback activity with a minimal increase to net debt. During the year, the Group repurchased 6% of the issued share capital for a cash cost of €77 million at an average price of €3.63 per share. We remain cash generative and our preference is to invest in the business and adjacent assets but pricing has been challenging, and in our view the optimum form of capital deployment has been share buybacks. Looking forward, the Group will continue to take a disciplined approach to capital allocation in the long-term interests of shareholders, assessing strategic opportunities against returning value to shareholders.
There are undoubtedly some emerging trends in consumer behaviour with a shift away from global, homogenous brands in favour of local brands with heritage, provenance and quality. This is evident in the long alcoholics drinks (LAD) category and many other sectors, and is part of the reason for the growth of craft beer. It is clear to the Group that these trends create value opportunities for differentiated brands in niche and premium segments. This is very much front of mind as we make portfolio and business model choices.
Against this backdrop, the Group’s long-term strategy of strong domestic brand geographic combinations providing the foundation to participate in international cider growth remains unchanged. During the year we completed the integration of the wholesale businesses of Gleeson and Wallaces Express in Ireland and Scotland respectively, to create brand-led wholesale platforms. Whilst integration has proved challenging, the resulting business
GROUP CHIEF EXECUTIVE OFFICER’S REVIEW
models provide an unrivalled brand portfolio and customer reach in these segments. We firmly believe this is the right model to meet customer and consumer needs.
In the highly competitive C&C Brands segment, the Group has transitioned to a lower cost commercial model with sharper portfolio focus. Magners Original has regained volume momentum during the year and we believe now is the time to invest behind the brand.
Good progress has been made in laying the foundations for further international growth with long-term distribution agreements concluded in a number of countries including Thailand and New Zealand. We have commenced exporting our brands to South Africa and are positive on the prospects of further growth in Africa. Finally, we have concluded a deal with Pabst Brewing Company in the US which we believe will be the catalyst to return our US cider portfolio to growth.
The Group also announced a major cost reduction plan during the year. Initiatives are progressing well and an element of savings will be delivered in the coming financial year. Unfortunately, this will result in the loss of a number of jobs and the Group continues to seek redeployment opportunities and provide full support to impacted employees. The changes are absolutely essential for the Group to retain a competitive cost position and provide funds for reinvestment in our brands.
REVIEW BY OPERATING SEGMENTIrelandFrom a macro perspective, key economic measurements continue to improve in Ireland. Recovery is more prevalent in the key cities with slower progress in the more rural areas. A “no vote” in the UK referendum on remaining in the European Union may have an impact on macro economic performance particularly in the short-term as trade arrangements are concluded.
OVERVIEWThis has been a challenging year for your Company in terms of financial performance with the core segments facing a number of headwinds. However, much hard work has been done to place the business on a stronger footing for the future.
10
WE FIRMLY BELIEVE THAT OUR CUSTOMER CENTRIC MODEL IS THE RIGHT MODEL TO OPTIMISE SHAREHOLDER VALUE IN AN ENVIRONMENT WHERE CONSUMERS ARE DEMANDING DIFFERENTIATION RATHER THAN GLOBAL BRANDS
In this financial year, although the LAD category in the Republic of Ireland on-trade grew by 0.7%, the cider category declined by 2.2%. A very poor summer with a record average low temperature was a key driver. This was compounded by extremely low pricing in the off-trade channel by the main lager producers and the growing emergence of craft in the on-trade putting pressure on bar space.
Within the cider category, Bulmers faced a new threat with a competitor cider launch. Initial distribution build of this competitor offering has put pressure on Bulmers’ share in the financial year. However, Bulmers’ market share remains strong in both trade channels and critically rate of sale in all formats is well ahead of
the competitor product. The Group will continue to invest heavily behind the Bulmers brand. Point of purchase visibility will be improved with a €2m investment in new founts in the on-trade and commercial terms have been restructured to give customers real benefit for increasing sales of our range. The Bulmers brand is very much at centre of the brand-led wholesale model, now and in the future.
The Group made further progress in developing its niche and premium range in the year. Clonmel 1650, our award winning premium Irish lager, consolidated its position while Heverlee, our authentic Belgian lager, made great progress particularly in Northern Ireland where it is already the number one premium lager
only three years after launch. We continue to seed craft offerings such as Dowd’s Lane, Five Lamps and Whitewater and now have dedicated resource to accelerate progress.
The Group took on the agency for the Corona brand in the year. The brand enjoys 91% distribution and outsells its nearest competitor 13:1 and complements Bulmers in the portfolio. The agency business in Ireland is significant. We distribute AB InBev brands in Northern Ireland (and packaged in ROI), are the number one wine distributor with over 800,000 cases annually and distribute the fastest growing energy drink in Ireland.
C&C GROUP PLC ANNUAL REPORT 2016 BUSINESS & STRATEGY
11
GROUP CHIEF EXECUTIVE OFFICER’S REVIEW (CONTINUED)
We have also made great progress in enhancing the brand-led wholesale model. The sales force has been realigned and upweighted during the year and our customer service centre is now fully operational covering the Island of Ireland. Importantly we have also made a number of changes to strengthen the management team which is already paying dividends.
Ultimately, the ambition for our Irish business is to be the pre-eminent brand-led wholesaler in the Island of Ireland with unrivalled range, enhanced customer service and geographic coverage such that we become the drinks supplier of choice to the licensed on and off-trade. We firmly believe that our customer centric model is the right model to optimise shareholder value in an environment where consumers are demanding differentiation rather than global brands.
ScotlandEconomically, the Scottish economy is in reasonable health. There is some evidence of a slow down in recent months with data suggesting higher unemployment partly due to troubles in the oil sector, but consumer confidence remains relatively high. However, the introduction of new “drink drive” legislation in December
2014 has had an adverse impact on LAD consumption in the on-trade. Industry body analysis suggests a decline of 6% in lager consumption in the year since implementation. Trends have normalised in recent months for both the market and our business following annualisation of the legislation.
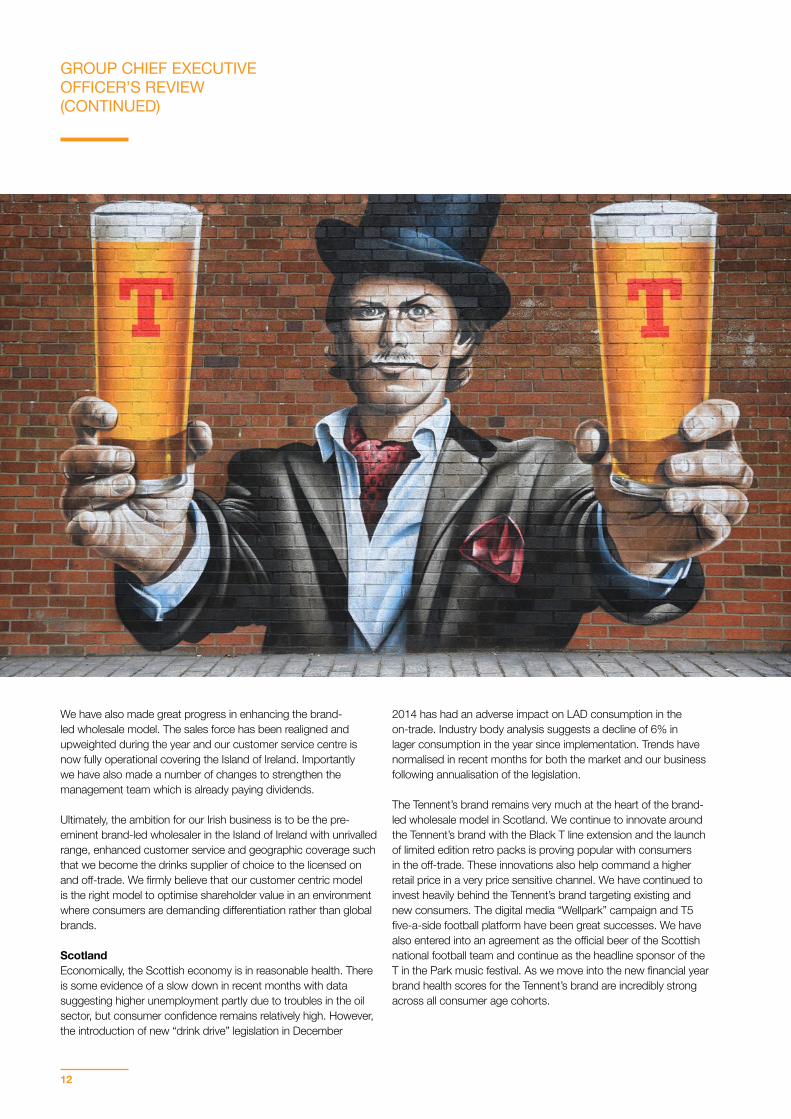
The Tennent’s brand remains very much at the heart of the brand-led wholesale model in Scotland. We continue to innovate around the Tennent’s brand with the Black T line extension and the launch of limited edition retro packs is proving popular with consumers in the off-trade. These innovations also help command a higher retail price in a very price sensitive channel. We have continued to invest heavily behind the Tennent’s brand targeting existing and new consumers. The digital media “Wellpark” campaign and T5 five-a-side football platform have been great successes. We have also entered into an agreement as the official beer of the Scottish national football team and continue as the headline sponsor of the T in the Park music festival. As we move into the new financial year brand health scores for the Tennent’s brand are incredibly strong across all consumer age cohorts.
12
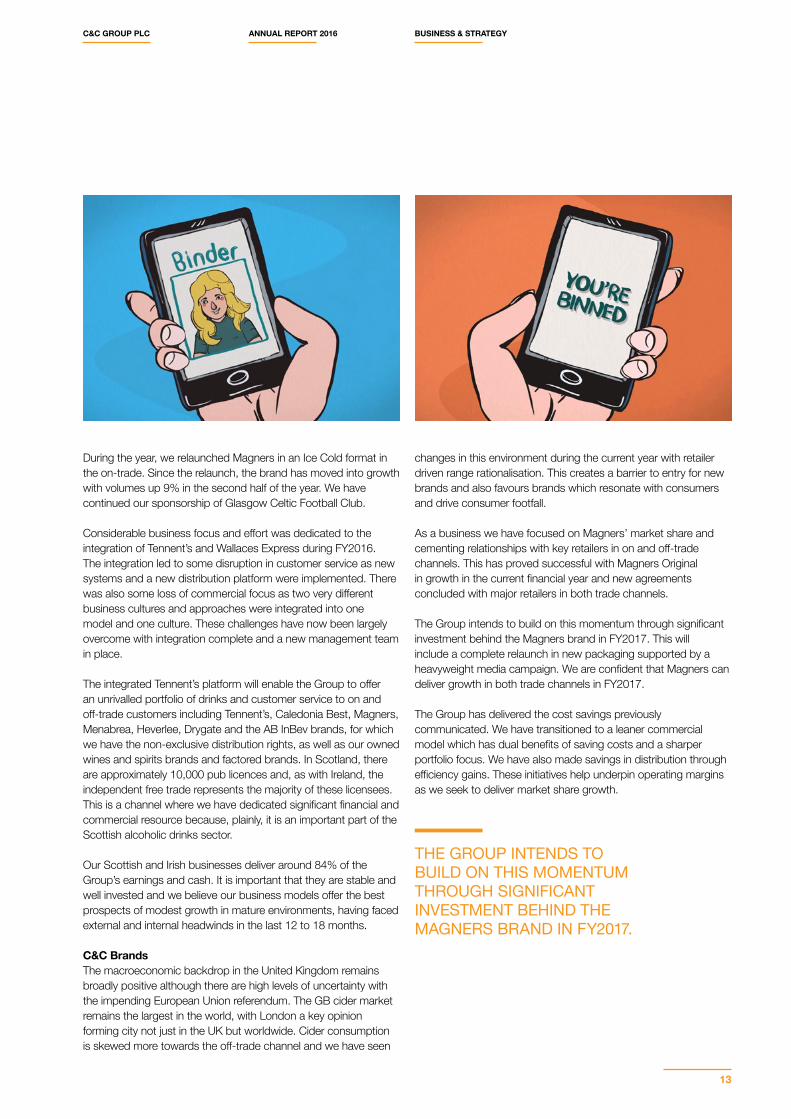
During the year, we relaunched Magners in an Ice Cold format in the on-trade. Since the relaunch, the brand has moved into growth with volumes up 9% in the second half of the year. We have continued our sponsorship of Glasgow Celtic Football Club.
Considerable business focus and effort was dedicated to the integration of Tennent’s and Wallaces Express during FY2016. The integration led to some disruption in customer service as new systems and a new distribution platform were implemented. There was also some loss of commercial focus as two very different business cultures and approaches were integrated into one model and one culture. These challenges have now been largely overcome with integration complete and a new management team in place. The integrated Tennent’s platform will enable the Group to offer an unrivalled portfolio of drinks and customer service to on and off-trade customers including Tennent’s, Caledonia Best, Magners, Menabrea, Heverlee, Drygate and the AB InBev brands, for which we have the non-exclusive distribution rights, as well as our owned wines and spirits brands and factored brands. In Scotland, there are approximately 10,000 pub licences and, as with Ireland, the independent free trade represents the majority of these licensees. This is a channel where we have dedicated significant financial and commercial resource because, plainly, it is an important part of the Scottish alcoholic drinks sector.
Our Scottish and Irish businesses deliver around 84% of the Group’s earnings and cash. It is important that they are stable and well invested and we believe our business models offer the best prospects of modest growth in mature environments, having faced external and internal headwinds in the last 12 to 18 months.
C&C BrandsThe macroeconomic backdrop in the United Kingdom remains broadly positive although there are high levels of uncertainty with the impending European Union referendum. The GB cider market remains the largest in the world, with London a key opinion forming city not just in the UK but worldwide. Cider consumption is skewed more towards the off-trade channel and we have seen
changes in this environment during the current year with retailer driven range rationalisation. This creates a barrier to entry for new brands and also favours brands which resonate with consumers and drive consumer footfall.
As a business we have focused on Magners’ market share and cementing relationships with key retailers in on and off-trade channels. This has proved successful with Magners Original in growth in the current financial year and new agreements concluded with major retailers in both trade channels.
The Group intends to build on this momentum through significant investment behind the Magners brand in FY2017. This will include a complete relaunch in new packaging supported by a heavyweight media campaign. We are confident that Magners can deliver growth in both trade channels in FY2017.
The Group has delivered the cost savings previously communicated. We have transitioned to a leaner commercial model which has dual benefits of saving costs and a sharper portfolio focus. We have also made savings in distribution through efficiency gains. These initiatives help underpin operating margins as we seek to deliver market share growth.
THE GROUP INTENDS TO BUILD ON THIS MOMENTUM THROUGH SIGNIFICANT INVESTMENT BEHIND THE MAGNERS BRAND IN FY2017.
C&C GROUP PLC ANNUAL REPORT 2016 BUSINESS & STRATEGY
13
GROUP CHIEF EXECUTIVE OFFICER’S REVIEW (CONTINUED)
North AmericaThe cider category was broadly flat in the year with growth in the first half offset by a 10.4% decline in the second half of the year. A key driver in this trend has been the explosion of alcoholic root beers. Time will tell whether this is a short-term dynamic in the market. However, cider in the US is still only 1% of LAD, significantly below GB and the Republic of Ireland, where cider is 16% and 13% of the LAD category. The trade and industry experts remain positive on long-term prospects for cider and anticipate a return to growth as the impact of newly launched ‘RTD’ offerings dissipate.
During the year we have entered into an agreement with Pabst Brewing Company in the US effective from March 2016. Under this agreement, Pabst will sell and market our brands in the US. This will include the Woodchuck brand range as well as our imported brands such as Magners and Blackthorn. The Group will retain ownership for the brands and will continue to own and operate the cidery in Vermont. Pabst have an outstanding track record in building brands in the US, most recently with Not Your Father’s Root Beer. They have demonstrated excellent marketing capability and have a stronger and broader sales reach than the Vermont team. We are delighted to be partners with Pabst and firmly believe the agreement can return our brands to volume growth and deliver value for both parties.
Over the past 12 months there has been mixed progress on Shepton Mallet brands. K cider, our premium strong cider, has returned to growth with improved route to market enabling distribution gains. The award winning Chaplin & Cork’s range has seen revenue grow to €1m in the year. However, local heritage brands such as Blackthorn and Natch have experienced decline being squeezed through lower retail pricing on branded cider and range rationalisation.
The Group also sees opportunities for profitable growth in niche and premium beer in the UK and is currently seeding our premium authentic Heverlee and Menabrea brands in key outlets. The recently announced agreement with Pabst Brewing Company to distribute the highly successful Pabst Blue Ribbon, Schlitz and Lonestar brands in the UK complements our own beer range.
In our domestic segments, around 4% of our LAD net revenue is generated by products that we have introduced to market in the last four years. In the last year, niche and speciality has been a real positive with volume growth of 41% across Heverlee, Menabrea, K cider and Chaplin and Cork’s in the domestic segments.
You are cordially invited to...
STEP RIGHT UP!
14
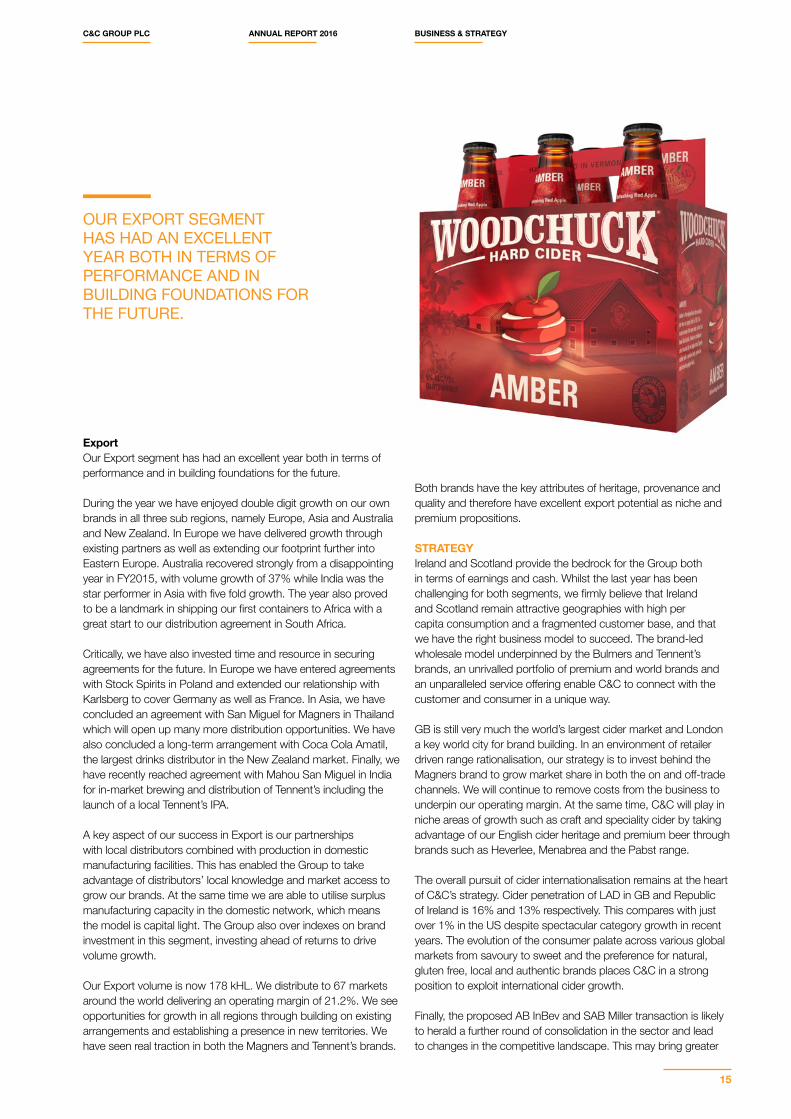
ExportOur Export segment has had an excellent year both in terms of performance and in building foundations for the future.
During the year we have enjoyed double digit growth on our own brands in all three sub regions, namely Europe, Asia and Australia and New Zealand. In Europe we have delivered growth through existing partners as well as extending our footprint further into Eastern Europe. Australia recovered strongly from a disappointing year in FY2015, with volume growth of 37% while India was the star performer in Asia with five fold growth. The year also proved to be a landmark in shipping our first containers to Africa with a great start to our distribution agreement in South Africa.
Critically, we have also invested time and resource in securing agreements for the future. In Europe we have entered agreements with Stock Spirits in Poland and extended our relationship with Karlsberg to cover Germany as well as France. In Asia, we have concluded an agreement with San Miguel for Magners in Thailand which will open up many more distribution opportunities. We have also concluded a long-term arrangement with Coca Cola Amatil, the largest drinks distributor in the New Zealand market. Finally, we have recently reached agreement with Mahou San Miguel in India for in-market brewing and distribution of Tennent’s including the launch of a local Tennent’s IPA.
A key aspect of our success in Export is our partnerships with local distributors combined with production in domestic manufacturing facilities. This has enabled the Group to take advantage of distributors’ local knowledge and market access to grow our brands. At the same time we are able to utilise surplus manufacturing capacity in the domestic network, which means the model is capital light. The Group also over indexes on brand investment in this segment, investing ahead of returns to drive volume growth.
Our Export volume is now 178 kHL. We distribute to 67 markets around the world delivering an operating margin of 21.2%. We see opportunities for growth in all regions through building on existing arrangements and establishing a presence in new territories. We have seen real traction in both the Magners and Tennent’s brands.
Both brands have the key attributes of heritage, provenance and quality and therefore have excellent export potential as niche and premium propositions.
STRATEGYIreland and Scotland provide the bedrock for the Group both in terms of earnings and cash. Whilst the last year has been challenging for both segments, we firmly believe that Ireland and Scotland remain attractive geographies with high per capita consumption and a fragmented customer base, and that we have the right business model to succeed. The brand-led wholesale model underpinned by the Bulmers and Tennent’s brands, an unrivalled portfolio of premium and world brands and an unparalleled service offering enable C&C to connect with the customer and consumer in a unique way.
GB is still very much the world’s largest cider market and London a key world city for brand building. In an environment of retailer driven range rationalisation, our strategy is to invest behind the Magners brand to grow market share in both the on and off-trade channels. We will continue to remove costs from the business to underpin our operating margin. At the same time, C&C will play in niche areas of growth such as craft and speciality cider by taking advantage of our English cider heritage and premium beer through brands such as Heverlee, Menabrea and the Pabst range.
The overall pursuit of cider internationalisation remains at the heart of C&C’s strategy. Cider penetration of LAD in GB and Republic of Ireland is 16% and 13% respectively. This compares with just over 1% in the US despite spectacular category growth in recent years. The evolution of the consumer palate across various global markets from savoury to sweet and the preference for natural, gluten free, local and authentic brands places C&C in a strong position to exploit international cider growth.
Finally, the proposed AB InBev and SAB Miller transaction is likely to herald a further round of consolidation in the sector and lead to changes in the competitive landscape. This may bring greater
OUR EXPORT SEGMENT HAS HAD AN EXCELLENT YEAR BOTH IN TERMS OF PERFORMANCE AND IN BUILDING FOUNDATIONS FOR THE FUTURE.
C&C GROUP PLC ANNUAL REPORT 2016 BUSINESS & STRATEGY
15
competition to a number of our segments, hence the need for focus on growth and cost reduction. However, it may also bring opportunities, which is why we have preserved conservative leverage despite share buyback activity.
CASH AND BALANCE SHEETOur balance sheet remains in robust health with a net debt to EBITDA ratio of 1.3x at the year-end. The Group finished the year with a net debt position of €163 million which is broadly in line with last year. This is after absorbing a €77 million share repurchase programme.
Free cashflow conversion in the year was 103% of EBITDA (excluding cash outflow from exceptional items) which is a 42 ppts improvement on the previous year. Cash conversion benefitted from a new receivables securitisation agreement which enabled participation by a higher percentage of debtors at a lower finance cost. Ultimately, the Group’s balance sheet and cash generation profile provide flexibility to invest in bolt-on acquisitions and capital projects with attractive returns, as well as consider options for return of value to shareholders.
PEOPLEAt C&C the model that we operate is that the Board allocates resources and assesses performance of the business divisions with the support of a head office of not more than 20 people, whilst each business division is equipped with the relevant people assets to ensure that we operate effectively in the market. Accordingly, each of our businesses has a local MD who has the associated capability to implement the agreed strategy and make day to day operational decisions for that business. In areas like procurement, planning and manufacturing, we seek to optimise our capability and run on a functional basis.
Our remuneration philosophy focuses on stakeholder participation through equity participation, to align employee interests with those of shareholders. Management remain largely incentivised through equity and we have employee-wide schemes in Ireland and the UK with significant participation levels amongst eligible employees. Bonus arrangements for managers and employees focus on local objectives that are relevant for the creation of long-term sustainable shareholder value. All employees have the opportunity of participating in performance related bonus schemes.
On a sad note, Tony O’Brien, the former CEO and Chairman of the Group passed away earlier this year. Tony served C&C for almost forty years and made an outstanding contribution to the development of the Group. His legacy lives on in the Tony O’Brien scholarship to help young people from his home county Kilkenny to attend the Quinn School of Business in University College Dublin.
Finally, we recently announced the rationalisation of the Shepton Mallet Cider Mill and Borrisoleigh sites which results in the loss of a number of jobs. This was a difficult decision for the Board and was not taken lightly but was absolutely necessary to protect
GROUP CHIEF EXECUTIVE OFFICER’S REVIEW (CONTINUED)
our competitive position. I would like to take this opportunity to personally thank our Shepton and Borrisoleigh teams for their commitment and support to the business over the years.
CORPORATE RESPONSIBILITYOver the last 12 months we have continued to develop our Corporate Social Responsibility (CSR) agenda. This includes implementing a number of initiatives that are industry-leading. Taking an active lead on CSR and working with our communities and stakeholders is essential to our business.
Our goal is to improve the lives of our communities and the environments in which we operate. Over the last 12 months we have made significant progress. We became the first drinks company in the UK and in Ireland to display calorie information on our packaging. This was a voluntary initiative and we hope other producers follow suit quickly. We decided to communicate calorie information as we believe strongly in the principal that consumers should have information about the products they are consuming in order to make appropriate choices. We are proud of this initiative which we launched jointly with the Scottish Government.
Another example of how we aim to help communities is through our support of minimum unit pricing. Governments now have plans for this important initiative in Scotland, Ireland and Northern Ireland. Helping reduce the harm caused by the strong cheap alcohol targeted by minimum unit pricing is an important step in balancing the relationship some of our community has with alcohol.
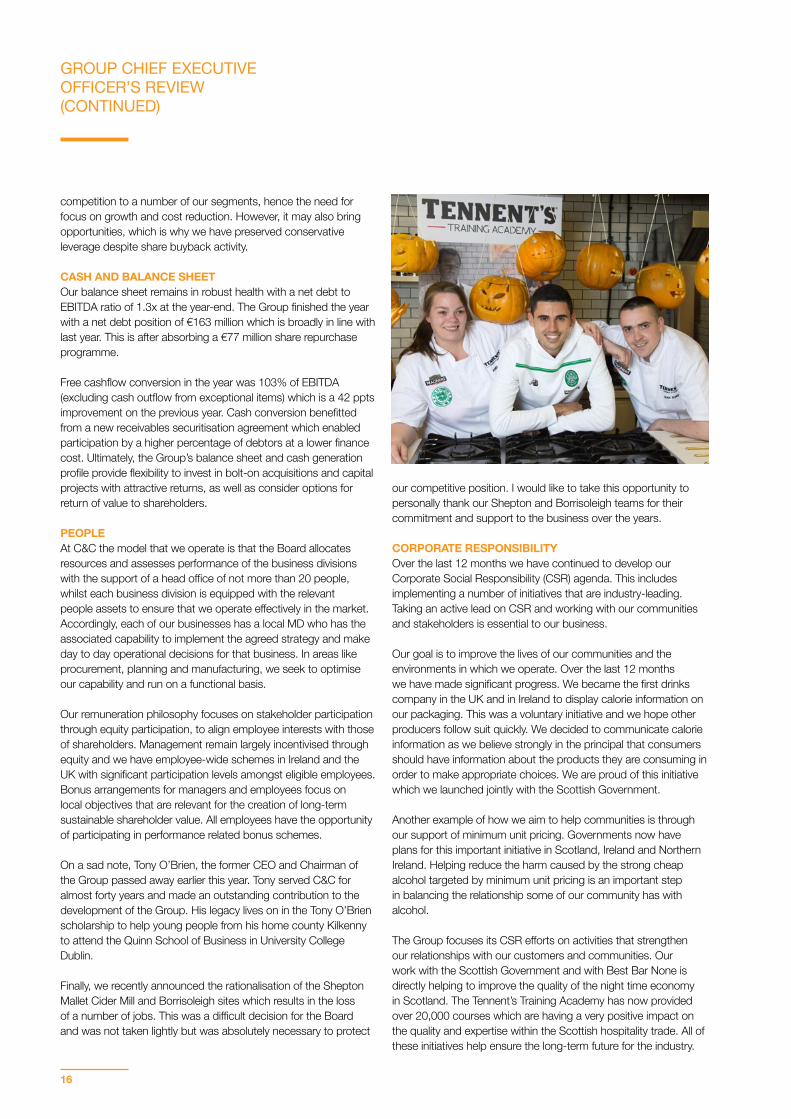
The Group focuses its CSR efforts on activities that strengthen our relationships with our customers and communities. Our work with the Scottish Government and with Best Bar None is directly helping to improve the quality of the night time economy in Scotland. The Tennent’s Training Academy has now provided over 20,000 courses which are having a very positive impact on the quality and expertise within the Scottish hospitality trade. All of these initiatives help ensure the long-term future for the industry.
16
We support a wide range of charitable causes across the Group, big and small. These range from activities linked to our brands such as the “Celtic Cash for Goals” initiative and Tipperary Water supporting the children’s ambulance, BUMBLEance; to lower profile but equally important charitable activity such as our support for KidsOut, Govan & Creighton immigration network, the initiative for prevention of suicide in Northern Ireland and Barretstown Kids Camps in Ireland. Where possible, we aim to work closely with our communities to create a positive difference.
The Group has also delivered a great range of environmental initiatives. During the last year we reduced our energy consumption at our manufacturing sites by 6% per hectolitre. Also, our waste management strategy is delivering good results with no waste being sent to landfill at our two largest production sites.
Our commitment to the environment is central to our business. We are a producer that relies on high-quality agricultural products. Despite the difficult decision to close the Shepton Mallet Cider Mill we have maintained our commitment to apple growers and will continue to press fruit on the site. In fact, last year across our manufacturing sites we pressed 83,000 tonnes of fruit and we continue to source all of our malt used in our Wellpark Brewery from Scottish farmers. I am personally very proud of the work undertaken by employees to ensure that we nurture our environment and the communities in which we operate.
OUTLOOK Despite the challenging financial performance in the current year, we believe we continue to take actions in the best interests of long-term shareholder value. Brand-led wholesale models in core segments should provide the financial stability to allow for continued investment in our growing international business.
Considerable time and effort was spent on completing the integration of the Gleesons and Wallaces businesses in the last financial year. This is now done and the businesses in Ireland and Scotland are very much on the front foot commercially as we enter the new financial year. The Group is confident that it can continue sales momentum in C&C Brands and Export and that the new Pabst Brewing Company agreement can re-ignite brand growth in the US.
During the year, the Group announced a €15m cost reduction plan and is progressing implementation of these changes. The changes are essential for the business to remain competitive in our industry as well as providing essential funds for re-investment in our brands.
We are intensely proud of our core brands and emerging niche and premium brand portfolio. C&C cannot match headline investment levels of the global brewers and will therefore need to invest smartly to engage the consumer. Digital media, local sponsorship platforms and visibility at the point of purchase remain key areas of investment.
In addition, we have demonstrated real capability in our ability to manage agencies in LAD and multi-beverage. The wine business in Ireland is making real progress working effectively with multiple brand owners and in beer we have successfully taken on Corona in Ireland, Menabrea in domestic markets, and look forward to working with the Pabst portfolio. We also continue to deliver volume performance ahead of market trends on brands in our long-term agency agreement in Ireland and Scotland.
There are positive signs in the early part of the new financial year with improving trading conditions in core segments and continued sales growth in the Export and C&C Brands segments. This sales momentum supported by focussed brand investment and underpinned by cost savings give the Group confidence of earnings growth in the coming financial year. Our balance sheet remains conservatively geared providing scope for future investment focused on long-term value creation or return of value to shareholders.
Stephen Glancey Group Chief Executive Officer
THE GROUP FOCUSES ITS CSR EFFORTS ON ACTIVITIES THAT STRENGTHEN OUR RELATIONSHIPS WITH OUR CUSTOMERS AND COMMUNITIES.
C&C GROUP PLC ANNUAL REPORT 2016 BUSINESS & STRATEGY
17
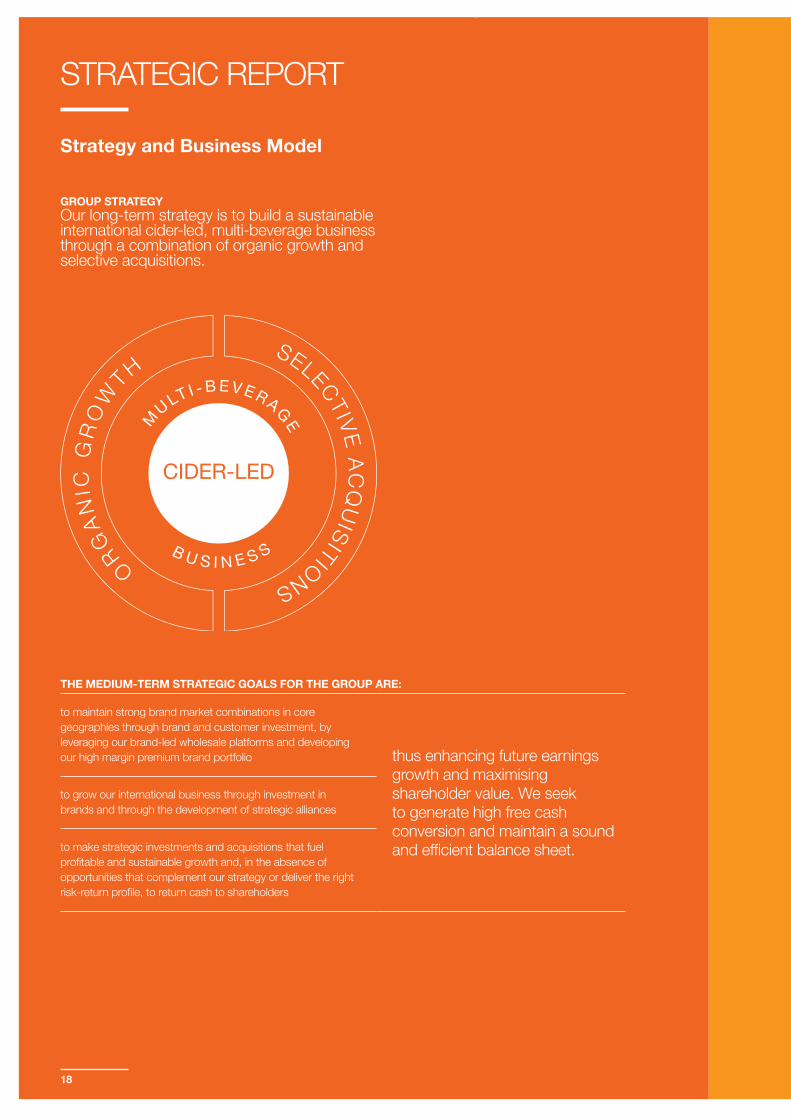
GROUP STRATEGYOur long-term strategy is to build a sustainable international cider-led, multi-beverage business through a combination of organic growth and selective acquisitions.
STRATEGIC REPORT
Strategy and Business Model
THE MEDIUM-TERM STRATEGIC GOALS FOR THE GROUP ARE:
to maintain strong brand market combinations in core geographies through brand and customer investment, by leveraging our brand-led wholesale platforms and developing our high margin premium brand portfolio thus enhancing future earnings
growth and maximising shareholder value. We seek to generate high free cash conversion and maintain a sound and efficient balance sheet.
to grow our international business through investment in brands and through the development of strategic alliances
to make strategic investments and acquisitions that fuel profitable and sustainable growth and, in the absence of opportunities that complement our strategy or deliver the right risk-return profile, to return cash to shareholders
18
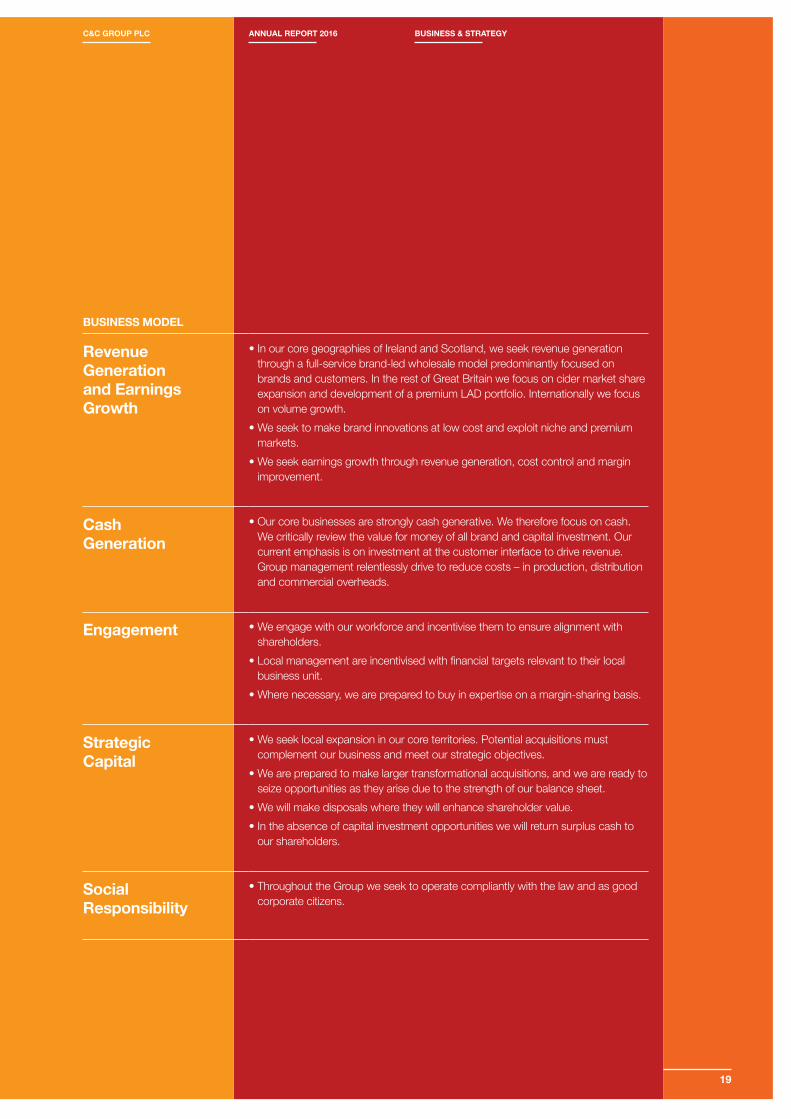
BUSINESS MODEL
Revenue Generation and Earnings Growth
• In our core geographies of Ireland and Scotland, we seek revenue generation through a full-service brand-led wholesale model predominantly focused on brands and customers. In the rest of Great Britain we focus on cider market share expansion and development of a premium LAD portfolio. Internationally we focus on volume growth.
• We seek to make brand innovations at low cost and exploit niche and premium markets.
• We seek earnings growth through revenue generation, cost control and margin improvement.
Cash Generation
• Our core businesses are strongly cash generative. We therefore focus on cash. We critically review the value for money of all brand and capital investment. Our current emphasis is on investment at the customer interface to drive revenue. Group management relentlessly drive to reduce costs – in production, distribution and commercial overheads.
Engagement • We engage with our workforce and incentivise them to ensure alignment with shareholders.
• Local management are incentivised with financial targets relevant to their local business unit.
• Where necessary, we are prepared to buy in expertise on a margin-sharing basis.
Strategic Capital
• We seek local expansion in our core territories. Potential acquisitions must complement our business and meet our strategic objectives.
• We are prepared to make larger transformational acquisitions, and we are ready to seize opportunities as they arise due to the strength of our balance sheet.
• We will make disposals where they will enhance shareholder value. • In the absence of capital investment opportunities we will return surplus cash to
our shareholders.
Social Responsibility
• Throughout the Group we seek to operate compliantly with the law and as good corporate citizens.
C&C GROUP PLC ANNUAL REPORT 2016 BUSINESS & STRATEGY
19
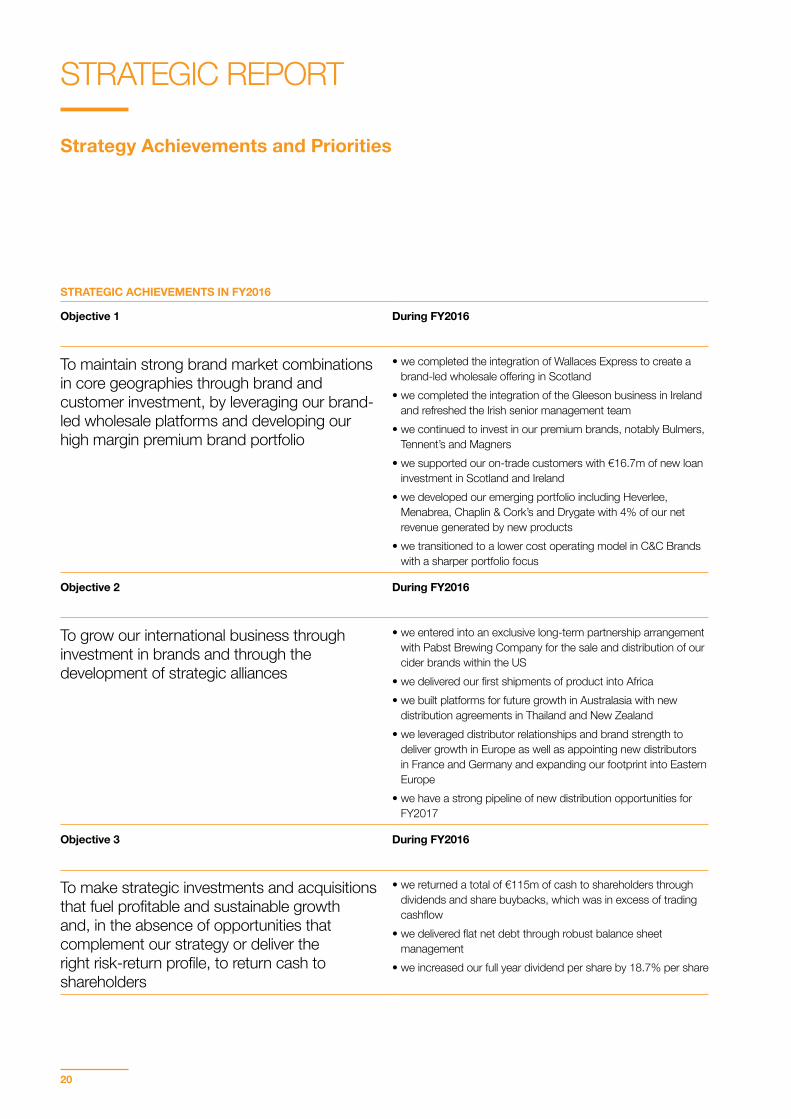
STRATEGIC ACHIEVEMENTS IN FY2016
Objective 1 During FY2016
To maintain strong brand market combinations in core geographies through brand and customer investment, by leveraging our brand-led wholesale platforms and developing our high margin premium brand portfolio
• we completed the integration of Wallaces Express to create a brand-led wholesale offering in Scotland
• we completed the integration of the Gleeson business in Ireland and refreshed the Irish senior management team
• we continued to invest in our premium brands, notably Bulmers, Tennent’s and Magners
• we supported our on-trade customers with €16.7m of new loan investment in Scotland and Ireland
• we developed our emerging portfolio including Heverlee, Menabrea, Chaplin & Cork’s and Drygate with 4% of our net revenue generated by new products
• we transitioned to a lower cost operating model in C&C Brands with a sharper portfolio focus
Objective 2 During FY2016
To grow our international business through investment in brands and through the development of strategic alliances
• we entered into an exclusive long-term partnership arrangement with Pabst Brewing Company for the sale and distribution of our cider brands within the US
• we delivered our first shipments of product into Africa• we built platforms for future growth in Australasia with new
distribution agreements in Thailand and New Zealand• we leveraged distributor relationships and brand strength to
deliver growth in Europe as well as appointing new distributors in France and Germany and expanding our footprint into Eastern Europe
• we have a strong pipeline of new distribution opportunities for FY2017
Objective 3 During FY2016
To make strategic investments and acquisitions that fuel profitable and sustainable growth and, in the absence of opportunities that complement our strategy or deliver the right risk-return profile, to return cash to shareholders
• we returned a total of €115m of cash to shareholders through dividends and share buybacks, which was in excess of trading cashflow
• we delivered flat net debt through robust balance sheet management
• we increased our full year dividend per share by 18.7% per share
STRATEGIC REPORT
Strategy Achievements and Priorities
20
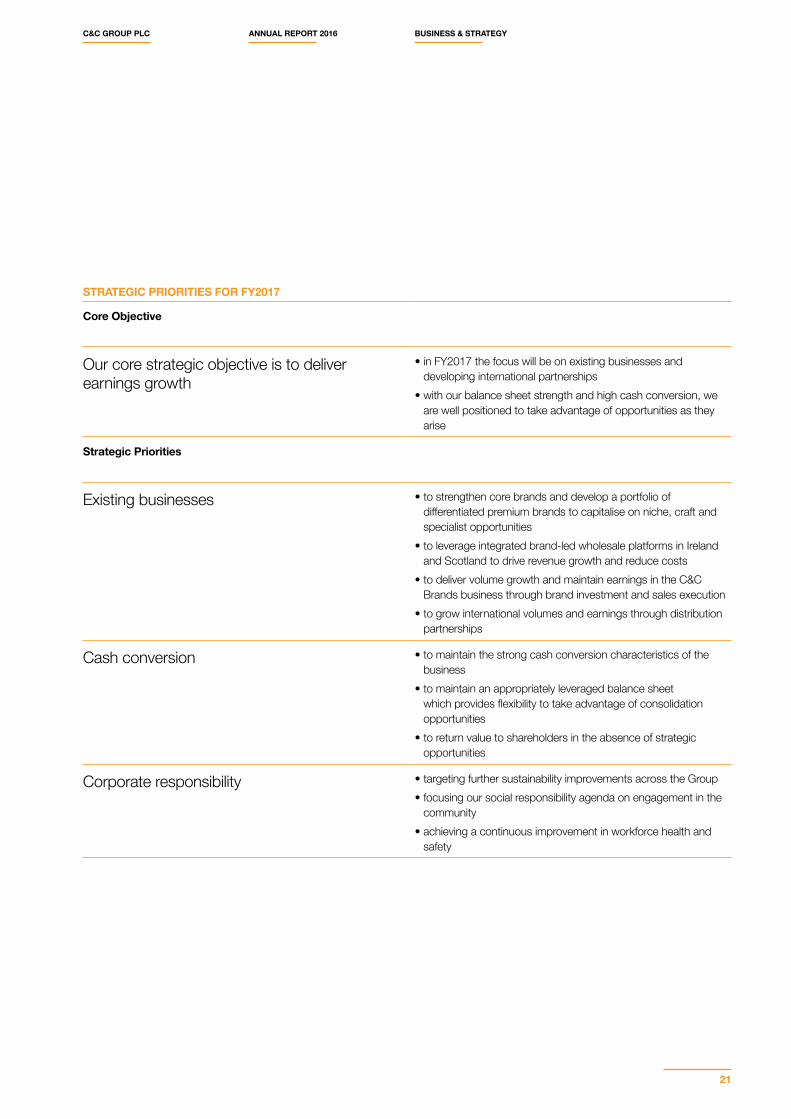
STRATEGIC PRIORITIES FOR FY2017
Core Objective
Our core strategic objective is to deliver earnings growth
• in FY2017 the focus will be on existing businesses and developing international partnerships
• with our balance sheet strength and high cash conversion, we are well positioned to take advantage of opportunities as they arise
Strategic Priorities
Existing businesses • to strengthen core brands and develop a portfolio of differentiated premium brands to capitalise on niche, craft and specialist opportunities
• to leverage integrated brand-led wholesale platforms in Ireland and Scotland to drive revenue growth and reduce costs
• to deliver volume growth and maintain earnings in the C&C Brands business through brand investment and sales execution
• to grow international volumes and earnings through distribution partnerships
Cash conversion • to maintain the strong cash conversion characteristics of the business
• to maintain an appropriately leveraged balance sheet which provides flexibility to take advantage of consolidation opportunities
• to return value to shareholders in the absence of strategic opportunities
Corporate responsibility • targeting further sustainability improvements across the Group• focusing our social responsibility agenda on engagement in the
community • achieving a continuous improvement in workforce health and
safety
C&C GROUP PLC ANNUAL REPORT 2016 BUSINESS & STRATEGY
21
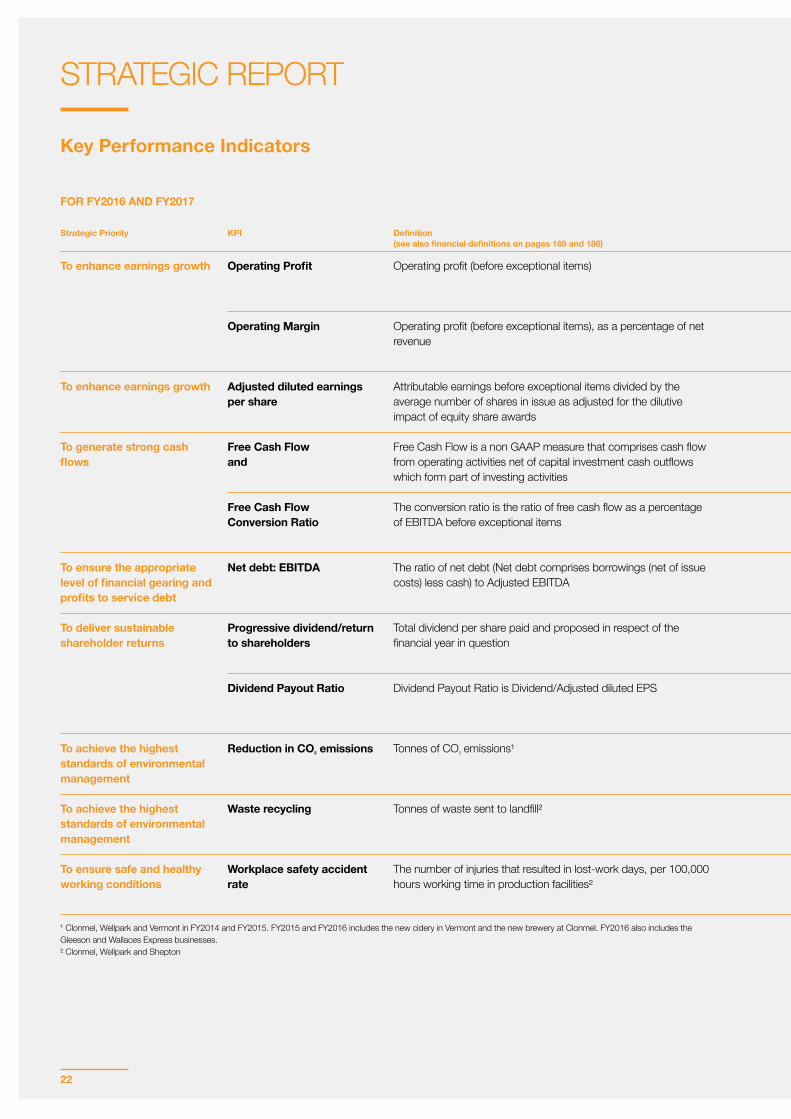
FOR FY2016 AND FY2017
Strategic Priority KPI Definition (see also financial definitions on pages 185 and 186)
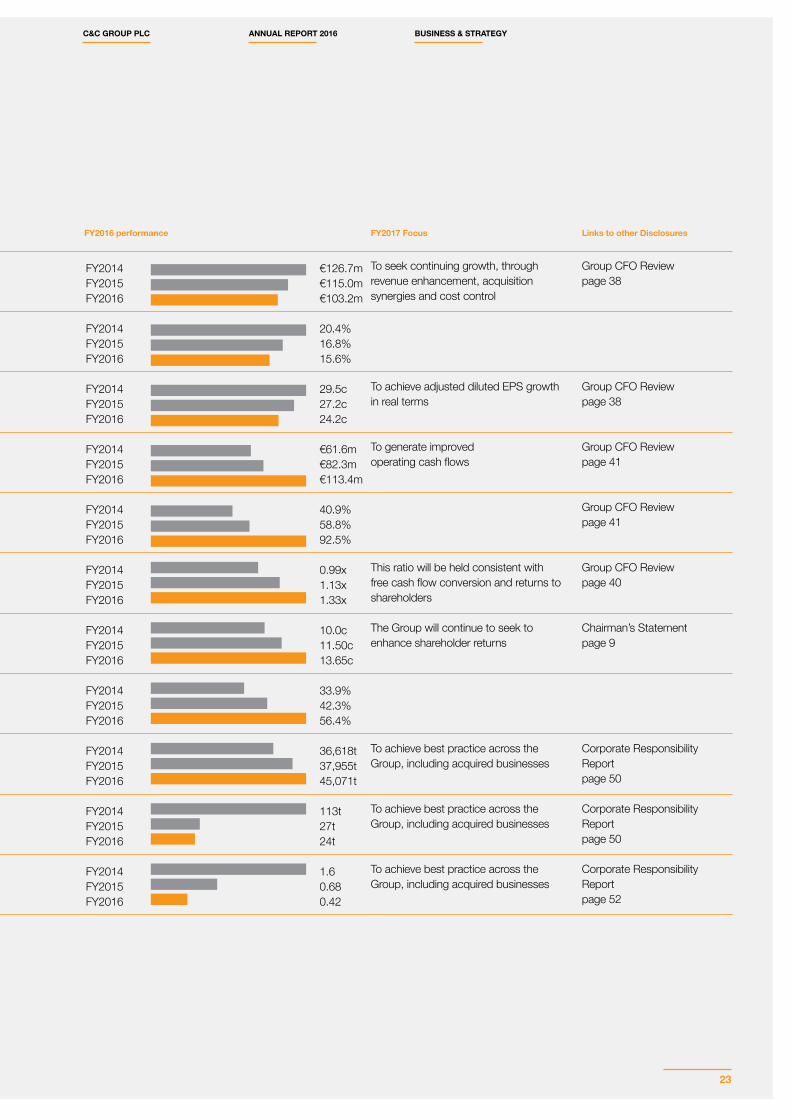
FY2016 performance FY2017 Focus Links to other Disclosures
To enhance earnings growth Operating Profit Operating profit (before exceptional items) To seek continuing growth, through revenue enhancement, acquisition synergies and cost control
Group CFO Review page 38
Operating Margin Operating profit (before exceptional items), as a percentage of net revenue
To enhance earnings growth Adjusted diluted earnings per share
Attributable earnings before exceptional items divided by the average number of shares in issue as adjusted for the dilutive impact of equity share awards
To achieve adjusted diluted EPS growth in real terms
Group CFO Review page 38
To generate strong cash flows
Free Cash Flowand
Free Cash Flow is a non GAAP measure that comprises cash flow from operating activities net of capital investment cash outflows which form part of investing activities
To generate improved operating cash flows
Group CFO Review page 41
Free Cash Flow Conversion Ratio
The conversion ratio is the ratio of free cash flow as a percentage of EBITDA before exceptional items
Group CFO Review page 41
To ensure the appropriate level of financial gearing and profits to service debt
Net debt: EBITDA The ratio of net debt (Net debt comprises borrowings (net of issue costs) less cash) to Adjusted EBITDA
This ratio will be held consistent with free cash flow conversion and returns to shareholders
Group CFO Review page 40
To deliver sustainable shareholder returns
Progressive dividend/return to shareholders
Total dividend per share paid and proposed in respect of the financial year in question
The Group will continue to seek to enhance shareholder returns
Chairman’s Statementpage 9
Dividend Payout Ratio Dividend Payout Ratio is Dividend/Adjusted diluted EPS
To achieve the highest standards of environmental management
Reduction in CO² emissions Tonnes of CO² emissions¹ To achieve best practice across the Group, including acquired businesses
Corporate Responsibility Report page 50
To achieve the highest standards of environmental management
Waste recycling Tonnes of waste sent to landfill² To achieve best practice across the Group, including acquired businesses
Corporate Responsibility Report page 50
To ensure safe and healthy working conditions
Workplace safety accident rate
The number of injuries that resulted in lost-work days, per 100,000 hours working time in production facilities²
To achieve best practice across the Group, including acquired businesses
Corporate Responsibility Report page 52
¹ Clonmel, Wellpark and Vermont in FY2014 and FY2015. FY2015 and FY2016 includes the new cidery in Vermont and the new brewery at Clonmel. FY2016 also includes the Gleeson and Wallaces Express businesses. ² Clonmel, Wellpark and Shepton
STRATEGIC REPORT
Key Performance Indicators
22
FOR FY2016 AND FY2017
Strategic Priority KPI Definition (see also financial definitions on pages 185 and 186)
FY2016 performance FY2017 Focus Links to other Disclosures
To enhance earnings growth Operating Profit Operating profit (before exceptional items) To seek continuing growth, through revenue enhancement, acquisition synergies and cost control
Group CFO Review page 38
Operating Margin Operating profit (before exceptional items), as a percentage of net revenue
To enhance earnings growth Adjusted diluted earnings per share
Attributable earnings before exceptional items divided by the average number of shares in issue as adjusted for the dilutive impact of equity share awards
To achieve adjusted diluted EPS growth in real terms
Group CFO Review page 38
To generate strong cash flows
Free Cash Flowand
Free Cash Flow is a non GAAP measure that comprises cash flow from operating activities net of capital investment cash outflows which form part of investing activities
To generate improved operating cash flows
Group CFO Review page 41
Free Cash Flow Conversion Ratio
The conversion ratio is the ratio of free cash flow as a percentage of EBITDA before exceptional items
Group CFO Review page 41
To ensure the appropriate level of financial gearing and profits to service debt
Net debt: EBITDA The ratio of net debt (Net debt comprises borrowings (net of issue costs) less cash) to Adjusted EBITDA
This ratio will be held consistent with free cash flow conversion and returns to shareholders
Group CFO Review page 40
To deliver sustainable shareholder returns
Progressive dividend/return to shareholders
Total dividend per share paid and proposed in respect of the financial year in question
The Group will continue to seek to enhance shareholder returns
Chairman’s Statementpage 9
Dividend Payout Ratio Dividend Payout Ratio is Dividend/Adjusted diluted EPS
To achieve the highest standards of environmental management
Reduction in CO² emissions Tonnes of CO² emissions¹ To achieve best practice across the Group, including acquired businesses
Corporate Responsibility Report page 50
To achieve the highest standards of environmental management
Waste recycling Tonnes of waste sent to landfill² To achieve best practice across the Group, including acquired businesses
Corporate Responsibility Report page 50
To ensure safe and healthy working conditions
Workplace safety accident rate
The number of injuries that resulted in lost-work days, per 100,000 hours working time in production facilities²
To achieve best practice across the Group, including acquired businesses
Corporate Responsibility Report page 52
¹ Clonmel, Wellpark and Vermont in FY2014 and FY2015. FY2015 and FY2016 includes the new cidery in Vermont and the new brewery at Clonmel. FY2016 also includes the Gleeson and Wallaces Express businesses. ² Clonmel, Wellpark and Shepton
FY2014FY2015FY2016
€126.7m€115.0m€103.2m
FY2014FY2015FY2016
20.4%16.8%15.6%
FY2014FY2015FY2016
29.5c27.2c24.2c
FY2014FY2015FY2016
€61.6m€82.3m€113.4m
FY2014FY2015FY2016
40.9%58.8%92.5%
FY2014FY2015FY2016
0.99x1.13x1.33x
FY2014FY2015FY2016
10.0c11.50c13.65c
FY2014FY2015FY2016
33.9%42.3%56.4%
FY2014FY2015FY2016
36,618t37,955t45,071t
FY2014FY2015FY2016
113t27t24t
FY2014FY2015FY2016
1.60.680.42
C&C GROUP PLC ANNUAL REPORT 2016 BUSINESS & STRATEGY
23
Under Irish company law (Statutory Instrument 116/2005 European Communities (International Financial Reporting Standards and Miscellaneous Amendments) Regulations 2005), the Group and the Company are required to give a description of the principal risks and uncertainties which they face.
The principal risks and uncertainties faced by the Group are set out below. The Group considers that currently the most significant risks to its results and operations over the short-term are (a) strategic failures, (b) the potential for consumer preferences to change in our core geographies, and (c) failure to attract and retain high-performing employees.
Risks and Uncertainties Mitigation
RISKS AND UNCERTAINTIES RELATING TO STRATEGIC GOALS
• The Group’s strategy is to focus upon earnings growth through organic growth, acquisitions and joint ventures and entry into new markets. These opportunities may not materialise or deliver the benefits or synergies expected and may present new management risks and social and compliance risks.
The Group seeks to mitigate these risks through due diligence, careful investment and continuing monitoring and management post-acquisition.
RISKS AND UNCERTAINTIES RELATING TO REVENUE AND PROFITS
• Consumers may shift away from larger brands towards more localised, premium and niche products.
Through diversification, innovation and strategic partnerships, we are developing our product portfolio to enhance our offering of niche and premium products to satisfy changing consumer requirements.
• Seasonal fluctuations in demand, especially an unseasonably bad summer in Ireland could materially affect demand for the Group’s cider products.
The Group seeks to mitigate this risk through geographical and brand diversification.
• Consumer preference may change in our core geographies, new competing brands may be launched and competitors may increase their marketing or change their pricing policies.
The Group has a programme of brand investment, innovation and product diversification to maintain and enhance the relevance of its products in the market. The Group also operates a brand-led model in both geographies with a comprehensive range to meet consumer needs.
• The GB off-trade and increasingly the GB on-trade continues to be highly competitive, driven by consumer pressure, customer buying power and the launch of heavily-invested competing products.
The Group seeks to mitigate the impact on volumes and margins through developing a focused portfolio approach, innovation, strategic partnerships, the introduction of brand propositions that are in tune with shifting consumer and customer needs and through seeking cost efficiencies.
• Customers, particularly in the on-trade where the Group has exposure through advances to customers, may experience financial difficulties.
The Group monitors the level of its exposure carefully.
STRATEGIC REPORT
Principal Risks And Uncertainties
24
Risks and Uncertainties Mitigation
RISKS AND UNCERTAINTIES RELATING TO COSTS AND PRODUCTION
• Input costs may be subject to volatility and inflation and the continuity of supply of raw materials may be affected by the weather and other factors.
The Group seeks to mitigate some of these risks through long-term or fixed price supply agreements. The Group does not seek to hedge its exposure to commodity prices by entering into derivative financial instruments.
• Circumstances such as the loss of a production or storage facility or disruptions to its supply chains or critical IT systems may interrupt the supply of the Group’s products.
The Group seeks to mitigate the operational impact of such an event by the availability of multiple production facilities, fire safety standards and disaster recovery protocols, and the financial impact of such an event through business interruption and other insurances.
FINANCIAL RISKS AND UNCERTAINTIES
• The Group’s reporting currency is the Euro but it transacts in foreign currencies and consolidates the results of non-Euro reporting foreign operations. Fluctuations in value between the Euro and these currencies including, in the case of Sterling, resulting from the heightened risk of the UK leaving the European Union, may affect the Group’s revenues, costs and operating profits.
The Group seeks to mitigate currency risks, where appropriate, through hedging and structured financial contracts to hedge a portion of its foreign currency transaction exposure. It has not entered into structured financial contracts to hedge its translation exposure on its foreign acquisitions.
• The solvency of the Group’s defined benefit pension schemes may be affected by a fall in the value of their investments, market and interest rate volatility and other economic and demographic factors. Each of these factors may require the Group to increase its contribution levels.
The Group seeks to mitigate this risk by continuous monitoring, taking professional advice on the optimisation of asset returns within agreed acceptable risk tolerances and implementing liability-management initiatives such as an enhanced transfer value exercise which the Group conducted in FY2016 in relation to its Irish defined benefit pension schemes.
FISCAL, REGULATORY AND POLITICAL RISKS AND UNCERTAINTIES
• The Group may be adversely affected by changes in excise duty or taxation on cider and beer in Ireland, the UK, the US and other territories.
The Group seeks to mitigate this risk by playing an active role in industry bodies and engaging with governmental tax and regulatory authorities. In Ireland, we engage with the Government in relation to excise duty reductions in support of domestic producers. In the UK, the Group is a board member of the National Association of Cider Makers and a steering committee member of the all-party Parliamentary beer group. In the US, we are active in the United States Association of Cider Makers, which recently has worked to have legislation passed in Washington that implements a revised definition for cider in the US allowing higher carbonation more aligned to European levels.
• The Group may be adversely affected by changes in government regulations affecting alcohol pricing, sponsorship or advertising, and product types.
Within the context of supporting responsible drinking initiatives, the Group supports the work of its trade associations to present the industry’s case to government.
• In June 2016 a referendum on UK membership of the European Union is to be held. At the date of this report the outcome cannot be predicted. The economic implications for the Group of a vote in favour of the UK leaving the European Union cannot yet be quantified, but are likely to be mixed. A lengthy period of uncertainty would be unhelpful for forward investment.
The Group is carefully monitoring the debate on relevant issues and will monitor its strategy accordingly.
C&C GROUP PLC ANNUAL REPORT 2016 BUSINESS & STRATEGY
25
Risks and Uncertainties Mitigation
LIABILITY-RELATED RISKS AND UNCERTAINTIES
• The Group’s operations are subject to extensive regulation, including stringent environmental, health and safety and food safety laws and regulations and competition law. Legislative non-compliance or adverse ethical practices could lead to prosecutions and damage to the reputation of the Group and its brands.
The Group has in place a permanent legal and compliance monitoring and training function and an extensive programme of corporate responsibility.
• The Group is vulnerable to contamination of its products or base raw materials, whether accidental, natural or malicious. Contamination could result in a recall of the Group’s products, damage to brand image and civil or criminal liability.
The Group has established protocols and procedures for incident management and product recall and mitigates the financial impact by appropriate insurance cover.
• Fraud, corruption and theft against the Group whether by employees, business partners or third parties are risks, particularly as the Group develops internationally.
The Group maintains appropriate internal controls and procedures to guard against economic crime and imposes appropriate monitoring and controls on subsidiary management.
EMPLOYMENT-RELATED RISKS AND UNCERTAINTIES
• The Group’s continued success is dependent on the skills and experience of its executive Directors and other high-performing personnel, including those in newly acquired businesses, and could be affected by their loss or the inability to recruit or retain them.
The Group seeks to mitigate this risk through appropriate remuneration policies and succession planning.
• Whilst relations with employees are generally good, work stoppages or other industrial action could have a material adverse effect on the Group.
The Group seeks to ensure good employee relations through engagement and dialogue.
STRATEGIC REPORT PRINCIPAL RISKS AND UNCERTAINTIES (CONTINUED)
26
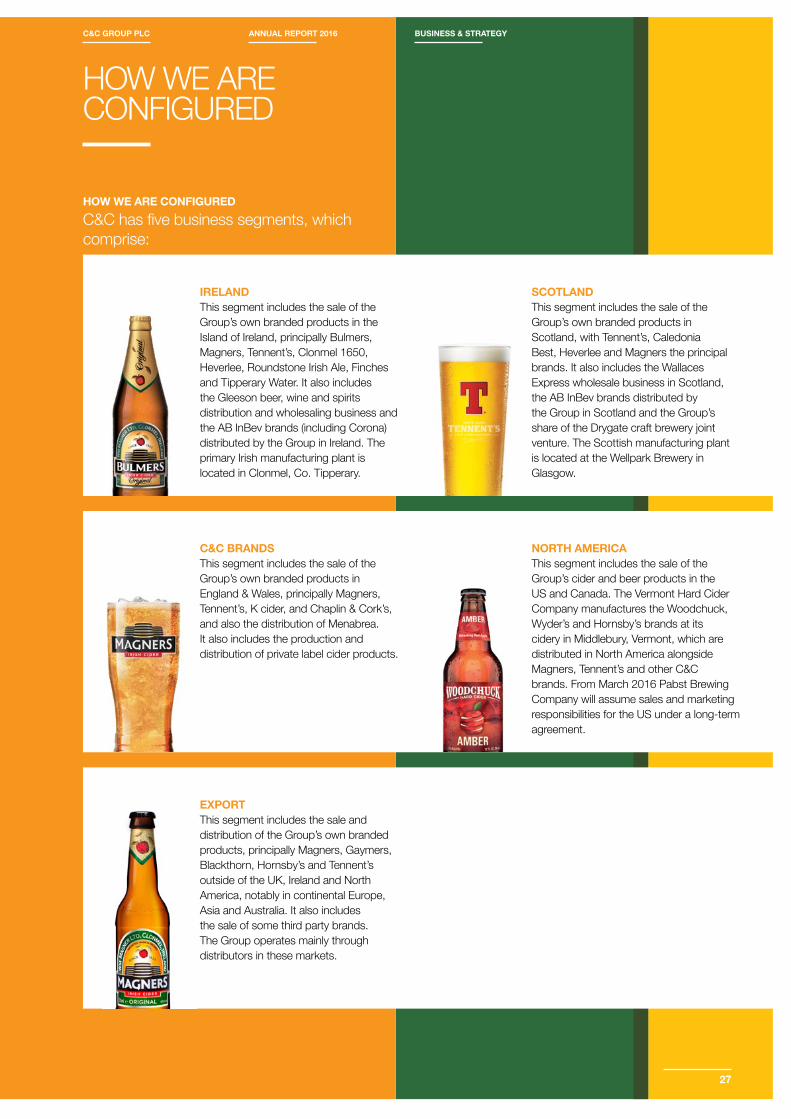
IRELANDThis segment includes the sale of the Group’s own branded products in the Island of Ireland, principally Bulmers, Magners, Tennent’s, Clonmel 1650, Heverlee, Roundstone Irish Ale, Finches and Tipperary Water. It also includes the Gleeson beer, wine and spirits distribution and wholesaling business and the AB InBev brands (including Corona) distributed by the Group in Ireland. The primary Irish manufacturing plant is located in Clonmel, Co. Tipperary.
SCOTLANDThis segment includes the sale of the Group’s own branded products in Scotland, with Tennent’s, Caledonia Best, Heverlee and Magners the principal brands. It also includes the Wallaces Express wholesale business in Scotland, the AB InBev brands distributed by the Group in Scotland and the Group’s share of the Drygate craft brewery joint venture. The Scottish manufacturing plant is located at the Wellpark Brewery in Glasgow.
EXPORTThis segment includes the sale and distribution of the Group’s own branded products, principally Magners, Gaymers, Blackthorn, Hornsby’s and Tennent’s outside of the UK, Ireland and North America, notably in continental Europe, Asia and Australia. It also includes the sale of some third party brands. The Group operates mainly through distributors in these markets.
HOW WE ARE CONFIGURED
HOW WE ARE CONFIGUREDC&C has five business segments, which comprise:
C&C BRANDSThis segment includes the sale of the Group’s own branded products in England & Wales, principally Magners, Tennent’s, K cider, and Chaplin & Cork’s, and also the distribution of Menabrea. It also includes the production and distribution of private label cider products.
NORTH AMERICAThis segment includes the sale of the Group’s cider and beer products in the US and Canada. The Vermont Hard Cider Company manufactures the Woodchuck, Wyder’s and Hornsby’s brands at its cidery in Middlebury, Vermont, which are distributed in North America alongside Magners, Tennent’s and other C&C brands. From March 2016 Pabst Brewing Company will assume sales and marketing responsibilities for the US under a long-term agreement.
C&C GROUP PLC ANNUAL REPORT 2016 BUSINESS & STRATEGY
27
OPERATIONS REVIEW
Constant Currency(i)FY2016
€mFY2015
€mChange
%
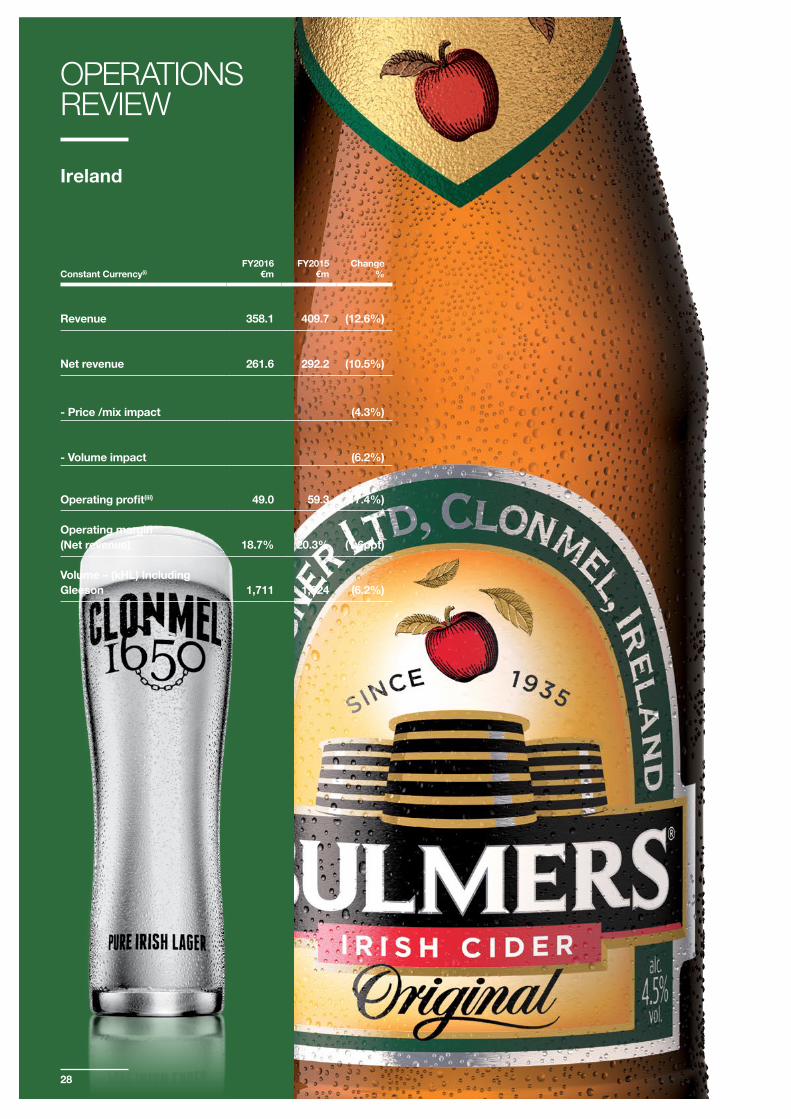
Revenue 358.1 409.7 (12.6%)
Net revenue 261.6 292.2 (10.5%)
- Price /mix impact (4.3%)
- Volume impact (6.2%)
Operating profit(iii) 49.0 59.3 (17.4%)
Operating margin (Net revenue) 18.7% 20.3% (1.6ppt)
Volume – (kHL) Including Gleeson 1,711 1,824 (6.2%)
Ireland
28
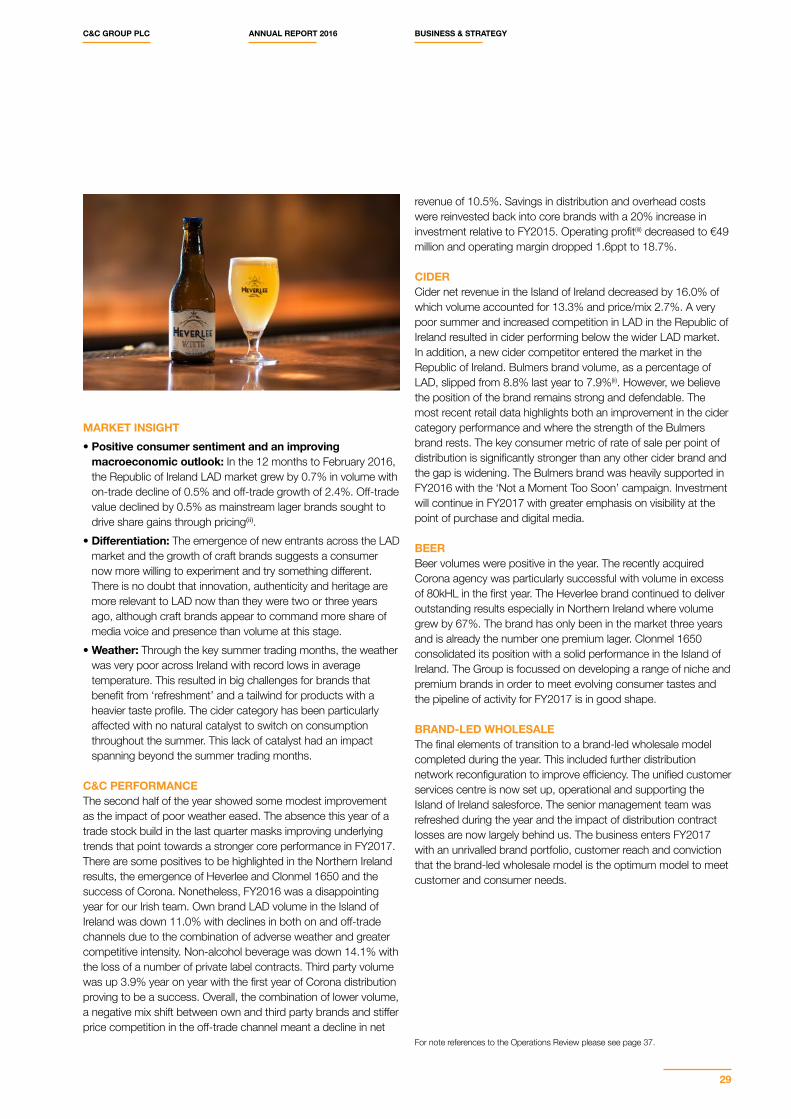
MARKET INSIGHT • Positive consumer sentiment and an improving
macroeconomic outlook: In the 12 months to February 2016, the Republic of Ireland LAD market grew by 0.7% in volume with on-trade decline of 0.5% and off-trade growth of 2.4%. Off-trade value declined by 0.5% as mainstream lager brands sought to drive share gains through pricing(ii).
• Differentiation: The emergence of new entrants across the LAD market and the growth of craft brands suggests a consumer now more willing to experiment and try something different. There is no doubt that innovation, authenticity and heritage are more relevant to LAD now than they were two or three years ago, although craft brands appear to command more share of media voice and presence than volume at this stage.
• Weather: Through the key summer trading months, the weather was very poor across Ireland with record lows in average temperature. This resulted in big challenges for brands that benefit from ‘refreshment’ and a tailwind for products with a heavier taste profile. The cider category has been particularly affected with no natural catalyst to switch on consumption throughout the summer. This lack of catalyst had an impact spanning beyond the summer trading months.
C&C PERFORMANCEThe second half of the year showed some modest improvement as the impact of poor weather eased. The absence this year of a trade stock build in the last quarter masks improving underlying trends that point towards a stronger core performance in FY2017. There are some positives to be highlighted in the Northern Ireland results, the emergence of Heverlee and Clonmel 1650 and the success of Corona. Nonetheless, FY2016 was a disappointing year for our Irish team. Own brand LAD volume in the Island of Ireland was down 11.0% with declines in both on and off-trade channels due to the combination of adverse weather and greater competitive intensity. Non-alcohol beverage was down 14.1% with the loss of a number of private label contracts. Third party volume was up 3.9% year on year with the first year of Corona distribution proving to be a success. Overall, the combination of lower volume, a negative mix shift between own and third party brands and stiffer price competition in the off-trade channel meant a decline in net
revenue of 10.5%. Savings in distribution and overhead costs were reinvested back into core brands with a 20% increase in investment relative to FY2015. Operating profit(iii) decreased to €49 million and operating margin dropped 1.6ppt to 18.7%.
CIDERCider net revenue in the Island of Ireland decreased by 16.0% of which volume accounted for 13.3% and price/mix 2.7%. A very poor summer and increased competition in LAD in the Republic of Ireland resulted in cider performing below the wider LAD market. In addition, a new cider competitor entered the market in the Republic of Ireland. Bulmers brand volume, as a percentage of LAD, slipped from 8.8% last year to 7.9%(ii). However, we believe the position of the brand remains strong and defendable. The most recent retail data highlights both an improvement in the cider category performance and where the strength of the Bulmers brand rests. The key consumer metric of rate of sale per point of distribution is significantly stronger than any other cider brand and the gap is widening. The Bulmers brand was heavily supported in FY2016 with the ‘Not a Moment Too Soon’ campaign. Investment will continue in FY2017 with greater emphasis on visibility at the point of purchase and digital media.
BEER Beer volumes were positive in the year. The recently acquired Corona agency was particularly successful with volume in excess of 80kHL in the first year. The Heverlee brand continued to deliver outstanding results especially in Northern Ireland where volume grew by 67%. The brand has only been in the market three years and is already the number one premium lager. Clonmel 1650 consolidated its position with a solid performance in the Island of Ireland. The Group is focussed on developing a range of niche and premium brands in order to meet evolving consumer tastes and the pipeline of activity for FY2017 is in good shape. BRAND-LED WHOLESALEThe final elements of transition to a brand-led wholesale model completed during the year. This included further distribution network reconfiguration to improve efficiency. The unified customer services centre is now set up, operational and supporting the Island of Ireland salesforce. The senior management team was refreshed during the year and the impact of distribution contract losses are now largely behind us. The business enters FY2017 with an unrivalled brand portfolio, customer reach and conviction that the brand-led wholesale model is the optimum model to meet customer and consumer needs.
For note references to the Operations Review please see page 37.
C&C GROUP PLC ANNUAL REPORT 2016 BUSINESS & STRATEGY
29
Constant Currency(i)FY2016
€mFY2015
€mChange
%
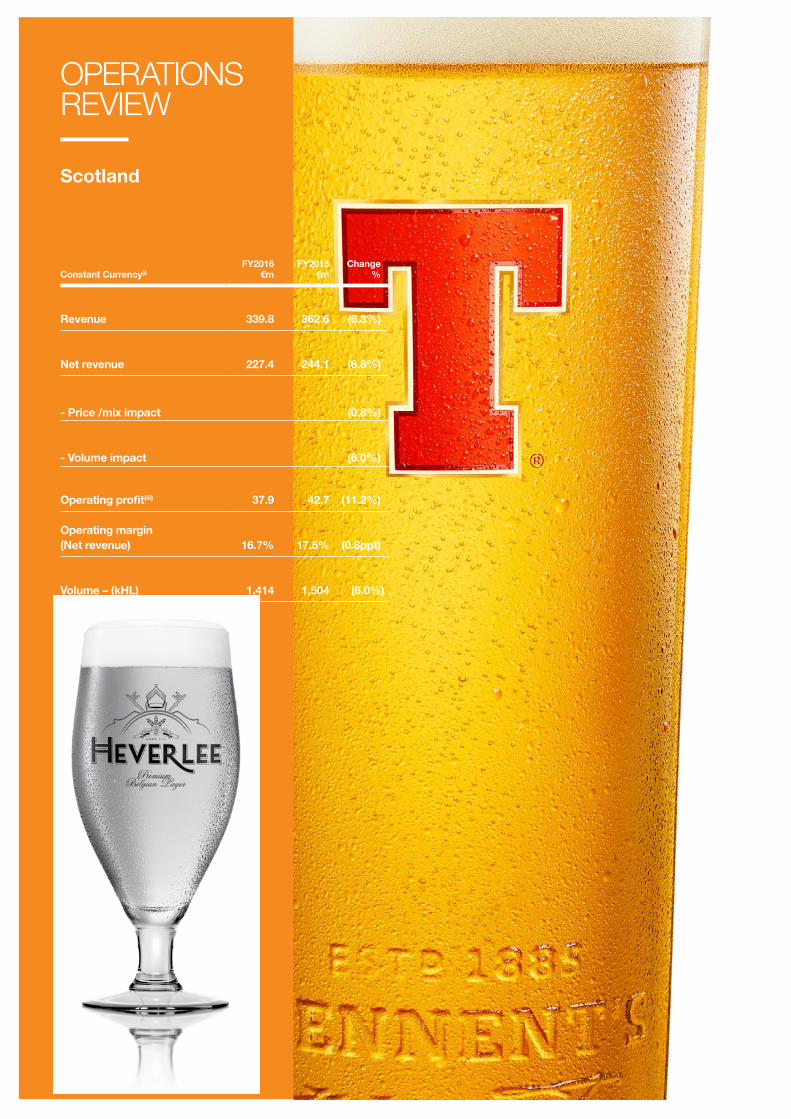
Revenue 339.8 362.6 (6.3%)
Net revenue 227.4 244.1 (6.8%)
- Price /mix impact (0.8%)
- Volume impact (6.0%)
Operating profit(iii) 37.9 42.7 (11.2%)
Operating margin (Net revenue) 16.7% 17.5% (0.8ppt)
Volume – (kHL) 1,414 1,504 (6.0%)
OPERATIONS REVIEW
Scotland
30
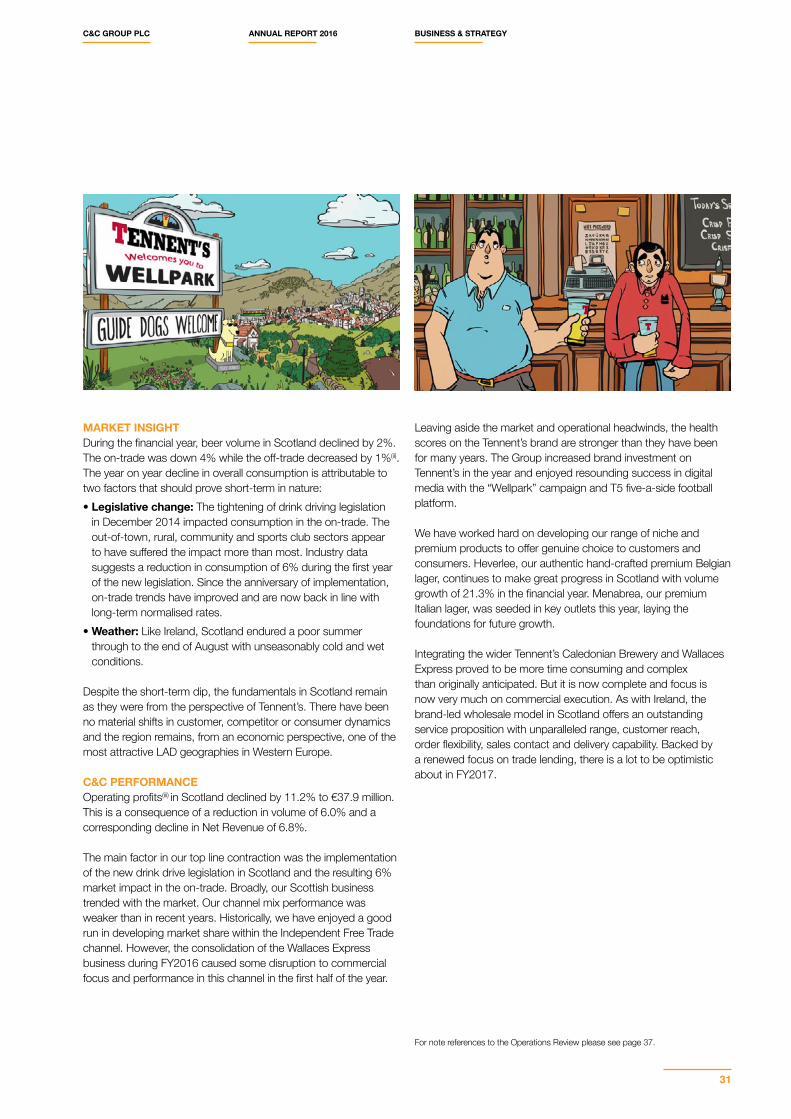
MARKET INSIGHTDuring the financial year, beer volume in Scotland declined by 2%. The on-trade was down 4% while the off-trade decreased by 1%(ii). The year on year decline in overall consumption is attributable to two factors that should prove short-term in nature: • Legislative change: The tightening of drink driving legislation
in December 2014 impacted consumption in the on-trade. The out-of-town, rural, community and sports club sectors appear to have suffered the impact more than most. Industry data suggests a reduction in consumption of 6% during the first year of the new legislation. Since the anniversary of implementation, on-trade trends have improved and are now back in line with long-term normalised rates.
• Weather: Like Ireland, Scotland endured a poor summer through to the end of August with unseasonably cold and wet conditions.
Despite the short-term dip, the fundamentals in Scotland remain as they were from the perspective of Tennent’s. There have been no material shifts in customer, competitor or consumer dynamics and the region remains, from an economic perspective, one of the most attractive LAD geographies in Western Europe.
C&C PERFORMANCEOperating profits(iii) in Scotland declined by 11.2% to €37.9 million. This is a consequence of a reduction in volume of 6.0% and a corresponding decline in Net Revenue of 6.8%.
The main factor in our top line contraction was the implementation of the new drink drive legislation in Scotland and the resulting 6% market impact in the on-trade. Broadly, our Scottish business trended with the market. Our channel mix performance was weaker than in recent years. Historically, we have enjoyed a good run in developing market share within the Independent Free Trade channel. However, the consolidation of the Wallaces Express business during FY2016 caused some disruption to commercial focus and performance in this channel in the first half of the year.
Leaving aside the market and operational headwinds, the health scores on the Tennent’s brand are stronger than they have been for many years. The Group increased brand investment on Tennent’s in the year and enjoyed resounding success in digital media with the “Wellpark” campaign and T5 five-a-side football platform.
We have worked hard on developing our range of niche and premium products to offer genuine choice to customers and consumers. Heverlee, our authentic hand-crafted premium Belgian lager, continues to make great progress in Scotland with volume growth of 21.3% in the financial year. Menabrea, our premium Italian lager, was seeded in key outlets this year, laying the foundations for future growth.
Integrating the wider Tennent’s Caledonian Brewery and Wallaces Express proved to be more time consuming and complex than originally anticipated. But it is now complete and focus is now very much on commercial execution. As with Ireland, the brand-led wholesale model in Scotland offers an outstanding service proposition with unparalleled range, customer reach, order flexibility, sales contact and delivery capability. Backed by a renewed focus on trade lending, there is a lot to be optimistic about in FY2017.
For note references to the Operations Review please see page 37.
C&C GROUP PLC ANNUAL REPORT 2016 BUSINESS & STRATEGY
31
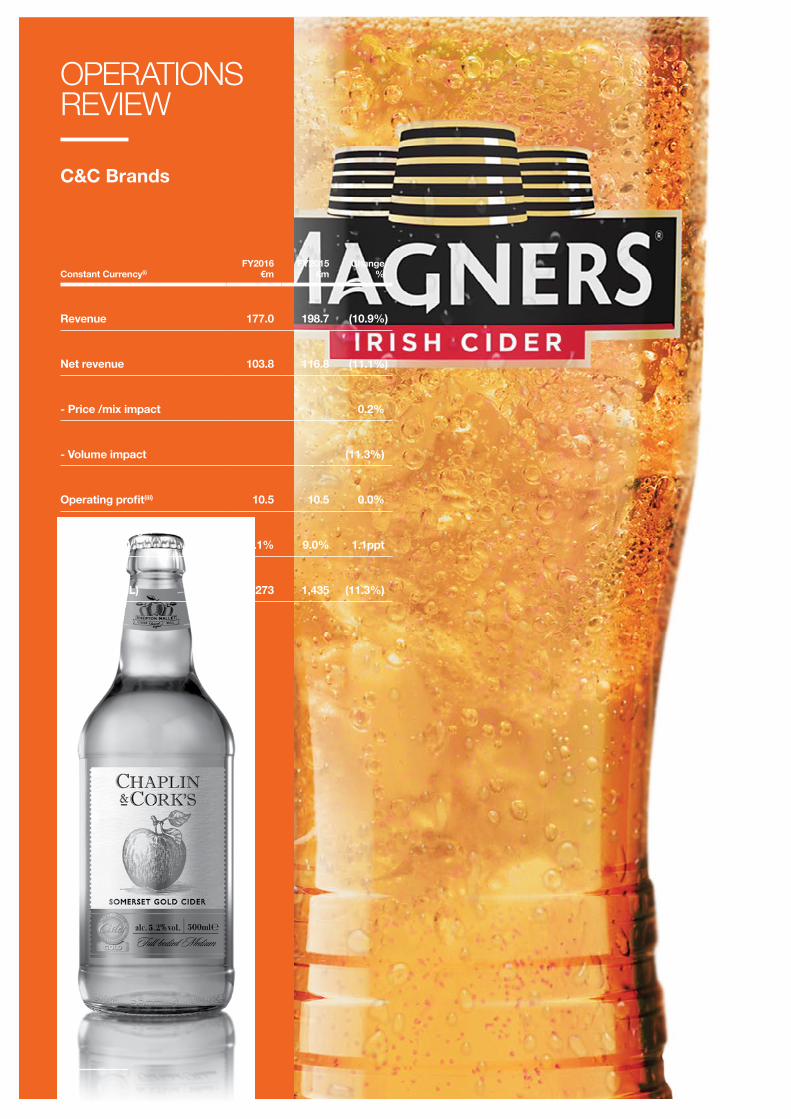
Constant Currency(i)FY2016
€mFY2015
€mChange
%
Revenue 177.0 198.7 (10.9%)
Net revenue 103.8 116.8 (11.1%)
- Price /mix impact 0.2%
- Volume impact (11.3%)
Operating profit(iii) 10.5 10.5 0.0%
Operating margin (Net revenue) 10.1% 9.0% 1.1ppt
Volume – (kHL) 1,273 1,435 (11.3%)
OPERATIONS REVIEW
C&C Brands
32
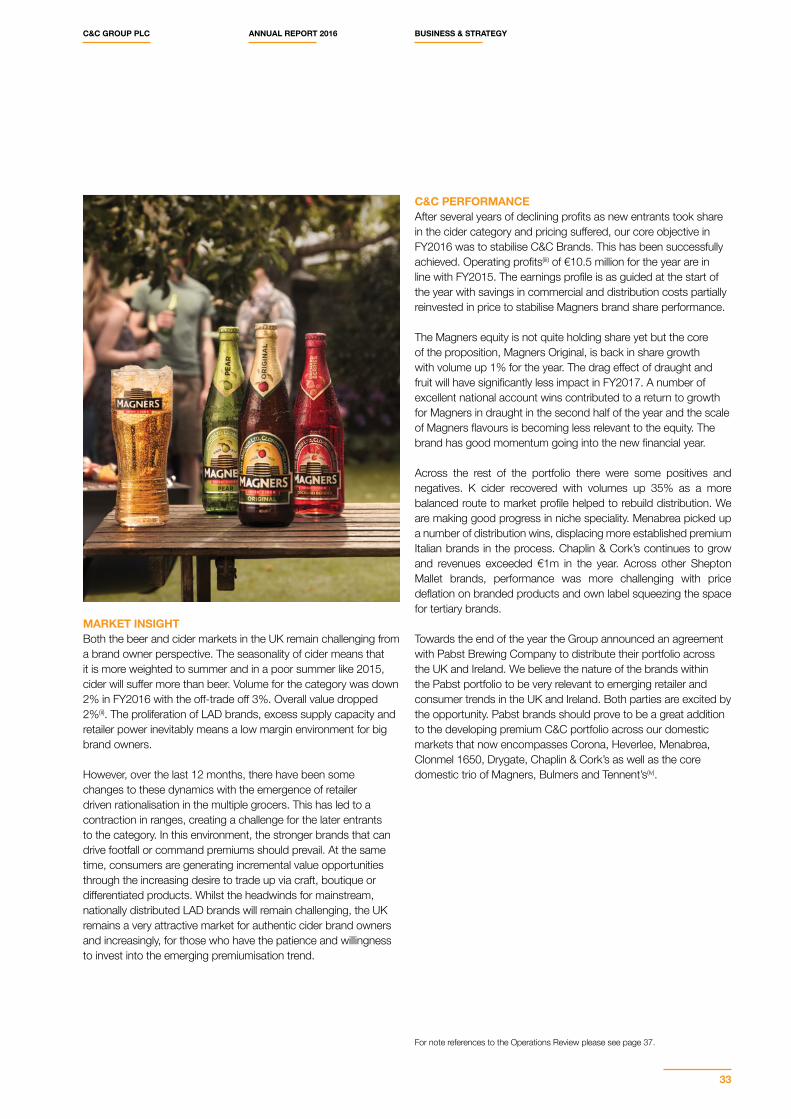
MARKET INSIGHTBoth the beer and cider markets in the UK remain challenging from a brand owner perspective. The seasonality of cider means that it is more weighted to summer and in a poor summer like 2015, cider will suffer more than beer. Volume for the category was down 2% in FY2016 with the off-trade off 3%. Overall value dropped 2%(ii). The proliferation of LAD brands, excess supply capacity and retailer power inevitably means a low margin environment for big brand owners.
However, over the last 12 months, there have been some changes to these dynamics with the emergence of retailer driven rationalisation in the multiple grocers. This has led to a contraction in ranges, creating a challenge for the later entrants to the category. In this environment, the stronger brands that can drive footfall or command premiums should prevail. At the same time, consumers are generating incremental value opportunities through the increasing desire to trade up via craft, boutique or differentiated products. Whilst the headwinds for mainstream, nationally distributed LAD brands will remain challenging, the UK remains a very attractive market for authentic cider brand owners and increasingly, for those who have the patience and willingness to invest into the emerging premiumisation trend.
C&C PERFORMANCEAfter several years of declining profits as new entrants took share in the cider category and pricing suffered, our core objective in FY2016 was to stabilise C&C Brands. This has been successfully achieved. Operating profits(iii) of €10.5 million for the year are in line with FY2015. The earnings profile is as guided at the start of the year with savings in commercial and distribution costs partially reinvested in price to stabilise Magners brand share performance.
The Magners equity is not quite holding share yet but the core of the proposition, Magners Original, is back in share growth with volume up 1% for the year. The drag effect of draught and fruit will have significantly less impact in FY2017. A number of excellent national account wins contributed to a return to growth for Magners in draught in the second half of the year and the scale of Magners flavours is becoming less relevant to the equity. The brand has good momentum going into the new financial year.
Across the rest of the portfolio there were some positives and negatives. K cider recovered with volumes up 35% as a more balanced route to market profile helped to rebuild distribution. We are making good progress in niche speciality. Menabrea picked up a number of distribution wins, displacing more established premium Italian brands in the process. Chaplin & Cork’s continues to grow and revenues exceeded €1m in the year. Across other Shepton Mallet brands, performance was more challenging with price deflation on branded products and own label squeezing the space for tertiary brands.
Towards the end of the year the Group announced an agreement with Pabst Brewing Company to distribute their portfolio across the UK and Ireland. We believe the nature of the brands within the Pabst portfolio to be very relevant to emerging retailer and consumer trends in the UK and Ireland. Both parties are excited by the opportunity. Pabst brands should prove to be a great addition to the developing premium C&C portfolio across our domestic markets that now encompasses Corona, Heverlee, Menabrea, Clonmel 1650, Drygate, Chaplin & Cork’s as well as the core domestic trio of Magners, Bulmers and Tennent’s(iv).
For note references to the Operations Review please see page 37.
C&C GROUP PLC ANNUAL REPORT 2016 BUSINESS & STRATEGY
33
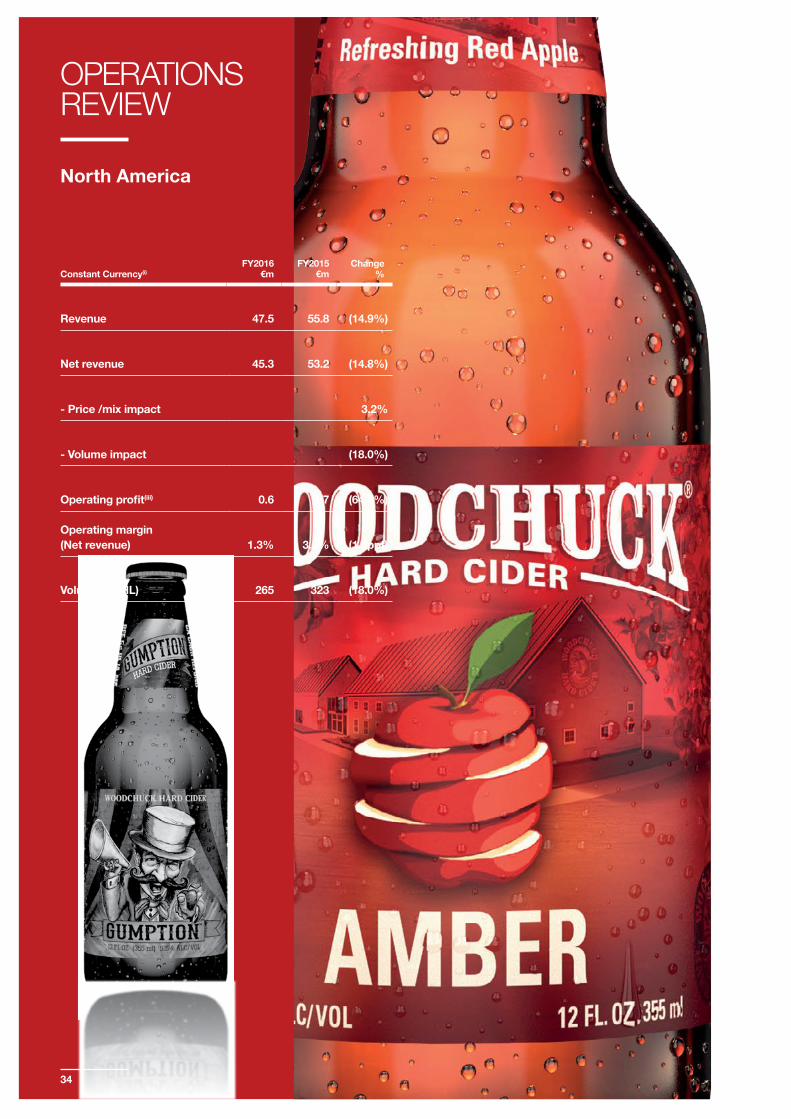
Constant Currency(i)FY2016
€mFY2015
€mChange
%
Revenue 47.5 55.8 (14.9%)
Net revenue 45.3 53.2 (14.8%)
- Price /mix impact 3.2%
- Volume impact (18.0%)
Operating profit(iii) 0.6 1.7 (64.7%)
Operating margin (Net revenue) 1.3% 3.2% (1.9ppt)
Volume – (kHL) 265 323 (18.0%)
OPERATIONS REVIEW
North America
34
MARKET INSIGHT (UNITED STATES)The cider category was broadly flat in the year with growth in the first half offset by decline in the second half of the year(ii). The key shift in dynamic within the category appears to be a loss of momentum from the commercial cider brands and the emergence of regional and local craft ciders. Directionally, this is a trend that should further premiumise the category. Retailers, distributors and regional/authentic brand owners should benefit via pricing and underlying sustainable category volume growth.
During the year a new category of Alcoholic Root Beer was created in the US which has impacted development of the cider category. Explosive growth delivered retail value slightly below the cider category. The proposition is sweeter than cider. Time will tell whether the phenomenon has any permanence. There is no doubt that it has created a distraction for the commercial cider brand owners as they switch focus onto Alcoholic Root Beer and it is probable that cider consumers are experimenting with the new products.
Anecdotally, the view from the trade appears to be that the stalling of cider growth is temporary in nature and cider will continue to build share of LAD over the long-term. Craft, authenticity, naturalness are all attributes that cider carries and these should eventually prevail over the latest disruptive ‘sweetness’ fad.
C&C PERFORMANCE (UNITED STATES)The Group’s cider brands have had a challenging year with the portfolio squeezed by slowdown in the category, the greater sales and marketing power of the major international brewers and the impact of a growing number of local craft producers. As a consequence, our share of the category has come under pressure and Woodchuck brand depletions were down 19%.
The Gumption brand proved a success in its first year with volume accounting for 14% of the total Woodchuck range. The style continued to gain listings throughout the year and the business is confident of further growth in FY2017.
Shipments of Magners declined 6% due to our two largest clients in the North East region merging, causing some operational disruption. Brand performance stabilised in the second half and we ended the year on a more positive note for Magners.
The big US news for C&C in the year was entering into a partnership agreement with Pabst. Under the new arrangements, we retain ownership of the US and import cider brands whilst Pabst take on the sales and marketing of the portfolio. Ownership of the cidery in Vermont stays with us and the brands will continue to be made there. Pabst have an option to acquire the Group’s business in the US (excluding any import brand rights) for a price based on a predetermined mechanic.
Both parties are excited by the partnership and confident in the opportunity it presents. Pabst are adding quality, premium, authentic domestic and import ciders to their growing portfolio. C&C are tapping into a significantly upweighted sales and marketing capability.
The partnership arrangement is live from March 2016.
For note references to the Operations Review please see page 37.
C&C GROUP PLC ANNUAL REPORT 2016 BUSINESS & STRATEGY
35
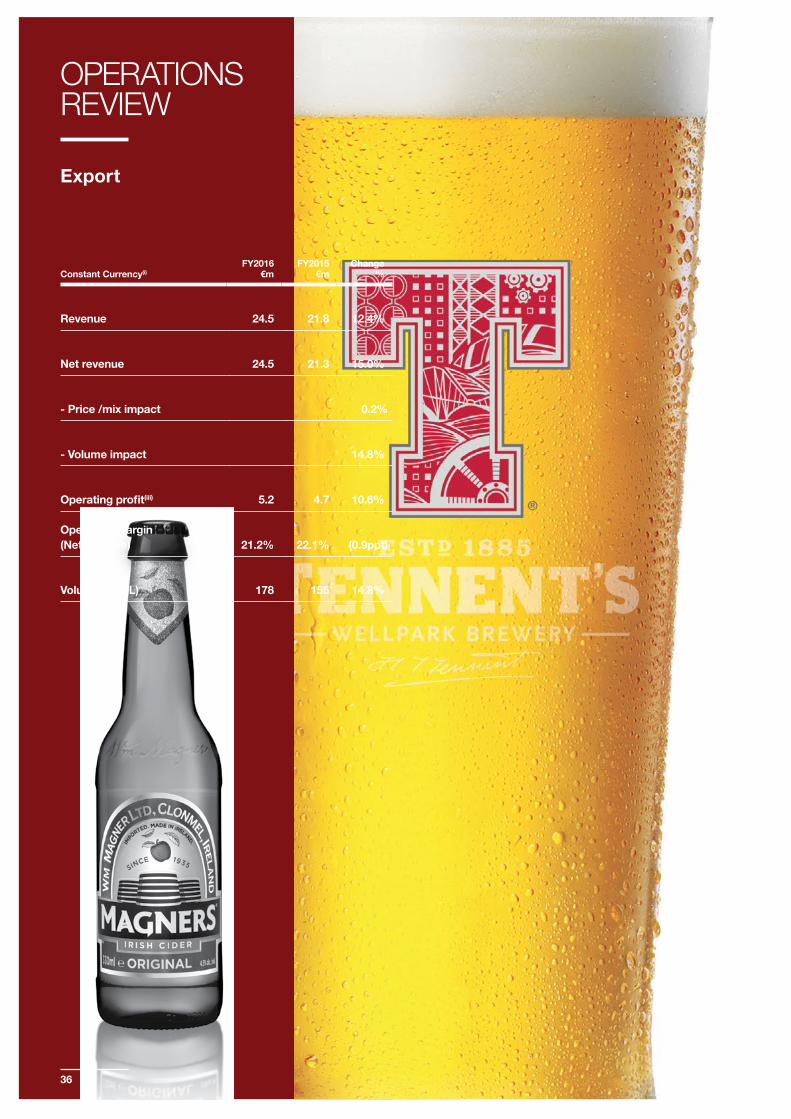
Constant Currency(i)FY2016
€mFY2015
€mChange
%
Revenue 24.5 21.8 12.4%
Net revenue 24.5 21.3 15.0%
- Price /mix impact 0.2%
- Volume impact 14.8%
Operating profit(iii) 5.2 4.7 10.6%
Operating margin (Net revenue) 21.2% 22.1% (0.9ppt)
Volume – (kHL) 178 155 14.8%
OPERATIONS REVIEW
Export
36
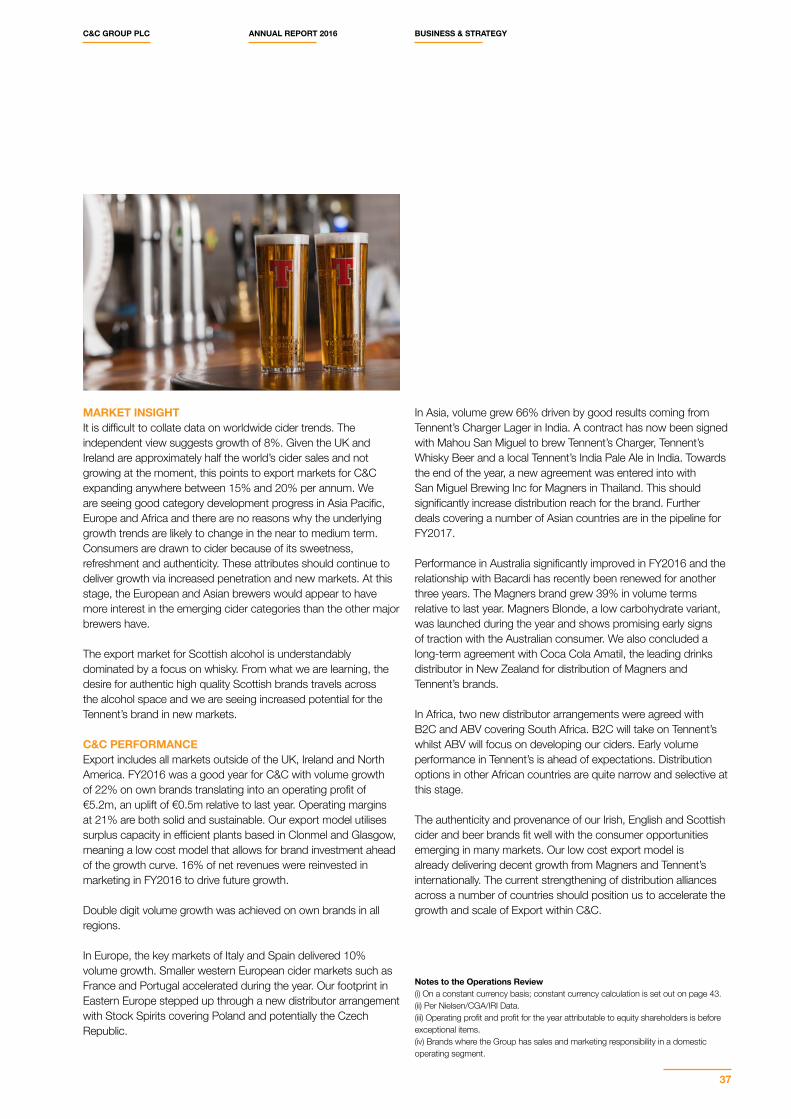
MARKET INSIGHTIt is difficult to collate data on worldwide cider trends. The independent view suggests growth of 8%. Given the UK and Ireland are approximately half the world’s cider sales and not growing at the moment, this points to export markets for C&C expanding anywhere between 15% and 20% per annum. We are seeing good category development progress in Asia Pacific, Europe and Africa and there are no reasons why the underlying growth trends are likely to change in the near to medium term. Consumers are drawn to cider because of its sweetness, refreshment and authenticity. These attributes should continue to deliver growth via increased penetration and new markets. At this stage, the European and Asian brewers would appear to have more interest in the emerging cider categories than the other major brewers have.
The export market for Scottish alcohol is understandably dominated by a focus on whisky. From what we are learning, the desire for authentic high quality Scottish brands travels across the alcohol space and we are seeing increased potential for the Tennent’s brand in new markets.
C&C PERFORMANCEExport includes all markets outside of the UK, Ireland and North America. FY2016 was a good year for C&C with volume growth of 22% on own brands translating into an operating profit of €5.2m, an uplift of €0.5m relative to last year. Operating margins at 21% are both solid and sustainable. Our export model utilises surplus capacity in efficient plants based in Clonmel and Glasgow, meaning a low cost model that allows for brand investment ahead of the growth curve. 16% of net revenues were reinvested in marketing in FY2016 to drive future growth.
Double digit volume growth was achieved on own brands in all regions.
In Europe, the key markets of Italy and Spain delivered 10% volume growth. Smaller western European cider markets such as France and Portugal accelerated during the year. Our footprint in Eastern Europe stepped up through a new distributor arrangement with Stock Spirits covering Poland and potentially the Czech Republic.
In Asia, volume grew 66% driven by good results coming from Tennent’s Charger Lager in India. A contract has now been signed with Mahou San Miguel to brew Tennent’s Charger, Tennent’s Whisky Beer and a local Tennent’s India Pale Ale in India. Towards the end of the year, a new agreement was entered into with San Miguel Brewing Inc for Magners in Thailand. This should significantly increase distribution reach for the brand. Further deals covering a number of Asian countries are in the pipeline for FY2017.
Performance in Australia significantly improved in FY2016 and the relationship with Bacardi has recently been renewed for another three years. The Magners brand grew 39% in volume terms relative to last year. Magners Blonde, a low carbohydrate variant, was launched during the year and shows promising early signs of traction with the Australian consumer. We also concluded a long-term agreement with Coca Cola Amatil, the leading drinks distributor in New Zealand for distribution of Magners and Tennent’s brands.
In Africa, two new distributor arrangements were agreed with B2C and ABV covering South Africa. B2C will take on Tennent’s whilst ABV will focus on developing our ciders. Early volume performance in Tennent’s is ahead of expectations. Distribution options in other African countries are quite narrow and selective at this stage.
The authenticity and provenance of our Irish, English and Scottish cider and beer brands fit well with the consumer opportunities emerging in many markets. Our low cost export model is already delivering decent growth from Magners and Tennent’s internationally. The current strengthening of distribution alliances across a number of countries should position us to accelerate the growth and scale of Export within C&C.
Notes to the Operations Review(i) On a constant currency basis; constant currency calculation is set out on page 43.(ii) Per Nielsen/CGA/IRI Data.(iii) Operating profit and profit for the year attributable to equity shareholders is before exceptional items. (iv) Brands where the Group has sales and marketing responsibility in a domestic operating segment.
C&C GROUP PLC ANNUAL REPORT 2016 BUSINESS & STRATEGY
37
On a constant currency basis(iii), net revenue has decreased by 8.9% with difficult trading conditions in our core segments of Ireland and Scotland. A very poor summer in terms of weather and increased competitive intensity adversely impacted sales volumes in Ireland while the impact of tougher drink drive regulation depressed LAD consumption in Scotland’s on trade. Despite growth in Magners Original, overall volume and revenue decreased in our C&C Brands segment with draught, flavours and private label a drag on performance.
During the year, we increased our marketing investment by 5.5% to €34.6m as we continue to support our brands. Marketing investment in Ireland increased by 20% as we responded to a new competitive threat in the cider category.
Clearly operational gearing magnifies the impact of net revenue decline on operating profit in percentage terms. However, the Group undertook a number of cost reduction initiatives cutting back office costs and increasing supply chain efficiency to partially mitigate the impact of revenue decline. This resulted in an operating profit of €103.2m, a decrease of 13.2% on the previous year on a constant currency basis.
Cash generation improved on last year and the business remains conservatively geared. This balance sheet strength allowed us to invest €76.6 million (including commission and related costs) in an on-market share buyback programme, purchasing 20.85 million shares at an average share price of €3.63. All shares acquired during the current financial year were subsequently cancelled.
GROUP CHIEF FINANCIAL OFFICER’S REVIEW
FY2016 was a difficult year with challenges on a number of fronts. However, a combination of recovering core markets, momentum in our brands and the building blocks put in place in FY2016 gives us confidence in our earnings prospects for the next financial year. This confidence is reflected in a proposed increase to our final dividend of 18.7% and a reaffirmation of our commitment to a progressive dividend policy.
The key financial performance indicators are set out on pages 22 and 23.
ACCOUNTING POLICIESAs required by European Union (EU) law, the Group’s financial statements have been prepared in accordance with International Financial Reporting Standards (IFRSs) as adopted by the EU, which comprise standards and interpretations approved by the International Accounting Standards Board (IASB) and the International Financial Reporting Interpretations Committee (IFRIC), applicable Irish law and the Listing Rules of the Irish Stock Exchange and the UK Listing Authority. Details of the basis of preparation and the significant accounting policies are outlined on pages 105 to 117.
FINANCE COSTS, INCOME TAX AND SHAREHOLDER RETURNSNet finance costs decreased to €8.6 million (2015: €8.8 million)(i). While the Group’s average drawn debt for the year increased on the prior year the Group benefited from a reduction in interest rates post the negotiation of the Group’s 2014 multi-currency facility. In addition, drawn debt during the current financial year was predominately drawn in Euro at more favourable interest rates than those payable in the prior financial year when the drawn debt was predominately denominated in US Dollars.
RESULTS FOR THE YEARC&C is reporting net revenue of €662.6 million (down 3.1%), operating profit(i) of €103.2 million (down 10.3%) and adjusted diluted EPS(ii) of 24.2 cent (down 11.0%).
38
Net finance costs are also inclusive of an unwind of discount on provisions charge of €0.8 million (2015: €0.9 million).
The income tax charge in the year excluding the credit in relation to exceptional items and equity accounted investees amounted to €13.8 million. This represents an effective tax rate of 14.6%, an increase of 0.9 percentage points on the prior year. The Group is established in Ireland and as a result it benefits from the 12.5% tax rate on profits generated in Ireland. The main reason for the increase in the effective tax rate year on year is due to the fact that the Group had a greater proportion of its overall profits subject to taxation outside of Ireland than in the prior financial year.
Subject to shareholder approval, the proposed final dividend of 8.92 cent per share will be paid on 13 July 2016 to ordinary shareholders registered at the close of business on 20 May 2016. The Group’s full year dividend will therefore amount to 13.65 cent per share, an 18.7% increase on the previous year. The proposed full year dividend per share will represent a payout of 56.4% (FY2015: 42.3%) of the full year reported adjusted diluted earnings per share(ii). This increase in both the dividend per share and payout ratio reflects confidence the stability of earnings and cash generation capability of the core business.
A scrip dividend alternative will be available. Total dividends paid to ordinary shareholders in FY2016 amounted to €39.6 million, of which €34.8 million was paid in cash and €4.8 million or 12.1% (FY2015: 16.2%) was settled by the issue of new shares.
As part of our capital allocation approach the Group undertook share buybacks in FY2016. We invested €76.6 million (including commission and related costs) in on market share buybacks, purchasing 20.85 million shares at an average price of €3.63. Our stockbrokers, Investec and Davy, conducted the share buyback programme. All shares acquired during the current financial year were subsequently cancelled.
Exceptional items Significant restructuring took place during the year as we moved toward a leaner operating platform in order to improve competitiveness. Costs of €38.4 million were charged in FY2016 which, due to their nature and materiality, were classified as exceptional items for reporting purposes. In the opinion of the Board, this presentation provides a more helpful analysis of the underlying performance of the Group.
The main items which were classified as exceptional include:-
(a) Restructuring costs: Restructuring costs of €18.2 million comprising severance costs of €14.5 million and other costs of €3.7 million. Severance costs primarily arose from the reduction in headcount as a consequence of the recently announced rationalisation of the Group’s manufacturing footprint and other smaller reorganisation programmes. Other costs of €3.7 million are directly associated with the restructure of the Group’s production sites and provide for anticipated closure costs at Borrisoleigh and Shepton Mallet.
FY2016 WAS A DIFFICULT YEAR WITH CHALLENGES ON A NUMBER OF FRONTS. HOWEVER, A COMBINATION OF RECOVERING CORE MARKETS, MOMENTUM IN OUR BRANDS AND THE BUILDING BLOCKS PUT IN PLACE IN FY2016 GIVES US CONFIDENCE IN OUR EARNINGS PROSPECTS FOR THE NEXT FINANCIAL YEAR.
C&C GROUP PLC ANNUAL REPORT 2016 BUSINESS & STRATEGY
39
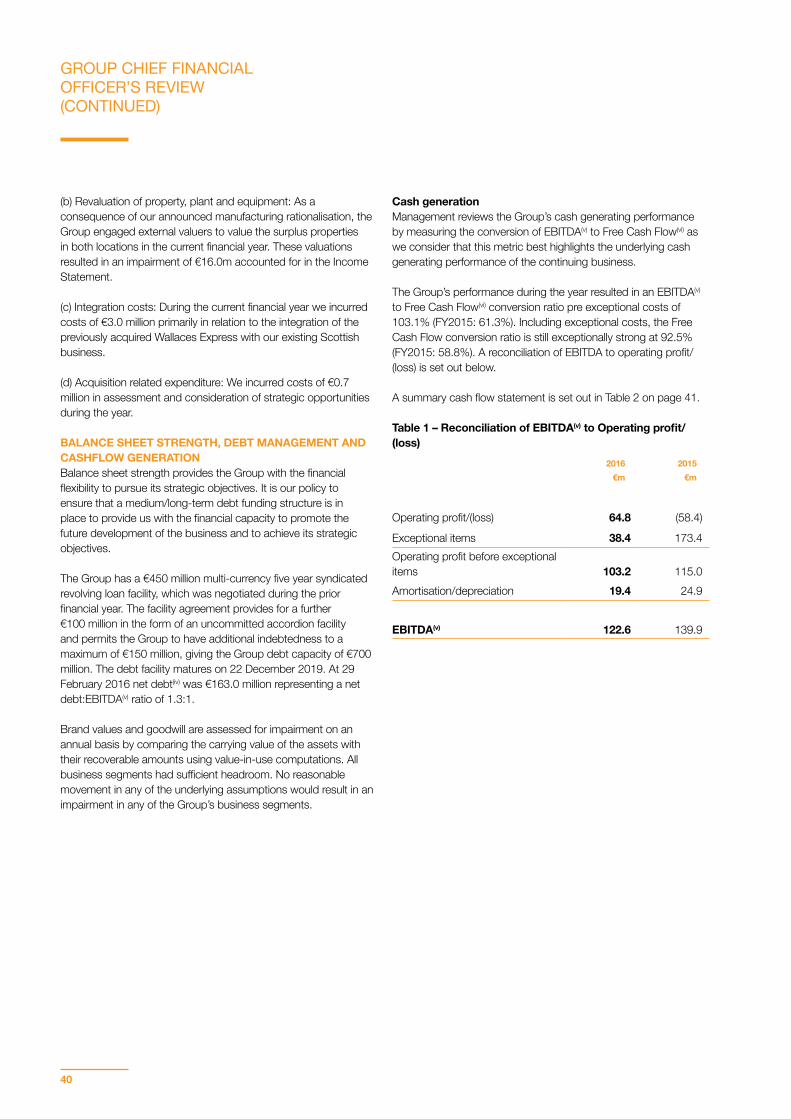
(b) Revaluation of property, plant and equipment: As a consequence of our announced manufacturing rationalisation, the Group engaged external valuers to value the surplus properties in both locations in the current financial year. These valuations resulted in an impairment of €16.0m accounted for in the Income Statement.
(c) Integration costs: During the current financial year we incurred costs of €3.0 million primarily in relation to the integration of the previously acquired Wallaces Express with our existing Scottish business.
(d) Acquisition related expenditure: We incurred costs of €0.7 million in assessment and consideration of strategic opportunities during the year. BALANCE SHEET STRENGTH, DEBT MANAGEMENT AND CASHFLOW GENERATIONBalance sheet strength provides the Group with the financial flexibility to pursue its strategic objectives. It is our policy to ensure that a medium/long-term debt funding structure is in place to provide us with the financial capacity to promote the future development of the business and to achieve its strategic objectives.
The Group has a €450 million multi-currency five year syndicated revolving loan facility, which was negotiated during the prior financial year. The facility agreement provides for a further €100 million in the form of an uncommitted accordion facility and permits the Group to have additional indebtedness to a maximum of €150 million, giving the Group debt capacity of €700 million. The debt facility matures on 22 December 2019. At 29 February 2016 net debt(iv) was €163.0 million representing a net debt:EBITDA(v) ratio of 1.3:1.
Brand values and goodwill are assessed for impairment on an annual basis by comparing the carrying value of the assets with their recoverable amounts using value-in-use computations. All business segments had sufficient headroom. No reasonable movement in any of the underlying assumptions would result in an impairment in any of the Group’s business segments.
Cash generationManagement reviews the Group’s cash generating performance by measuring the conversion of EBITDA(v) to Free Cash Flow(vi) as we consider that this metric best highlights the underlying cash generating performance of the continuing business.
The Group’s performance during the year resulted in an EBITDA(v) to Free Cash Flow(vi) conversion ratio pre exceptional costs of 103.1% (FY2015: 61.3%). Including exceptional costs, the Free Cash Flow conversion ratio is still exceptionally strong at 92.5% (FY2015: 58.8%). A reconciliation of EBITDA to operating profit/(loss) is set out below.
A summary cash flow statement is set out in Table 2 on page 41. Table 1 – Reconciliation of EBITDA(v) to Operating profit/(loss)
2016 2015€m €m
Operating profit/(loss) 64.8 (58.4)
Exceptional items 38.4 173.4Operating profit before exceptional items 103.2 115.0Amortisation/depreciation 19.4 24.9
EBITDA(v) 122.6 139.9
GROUP CHIEF FINANCIAL OFFICER’S REVIEW (CONTINUED)
40
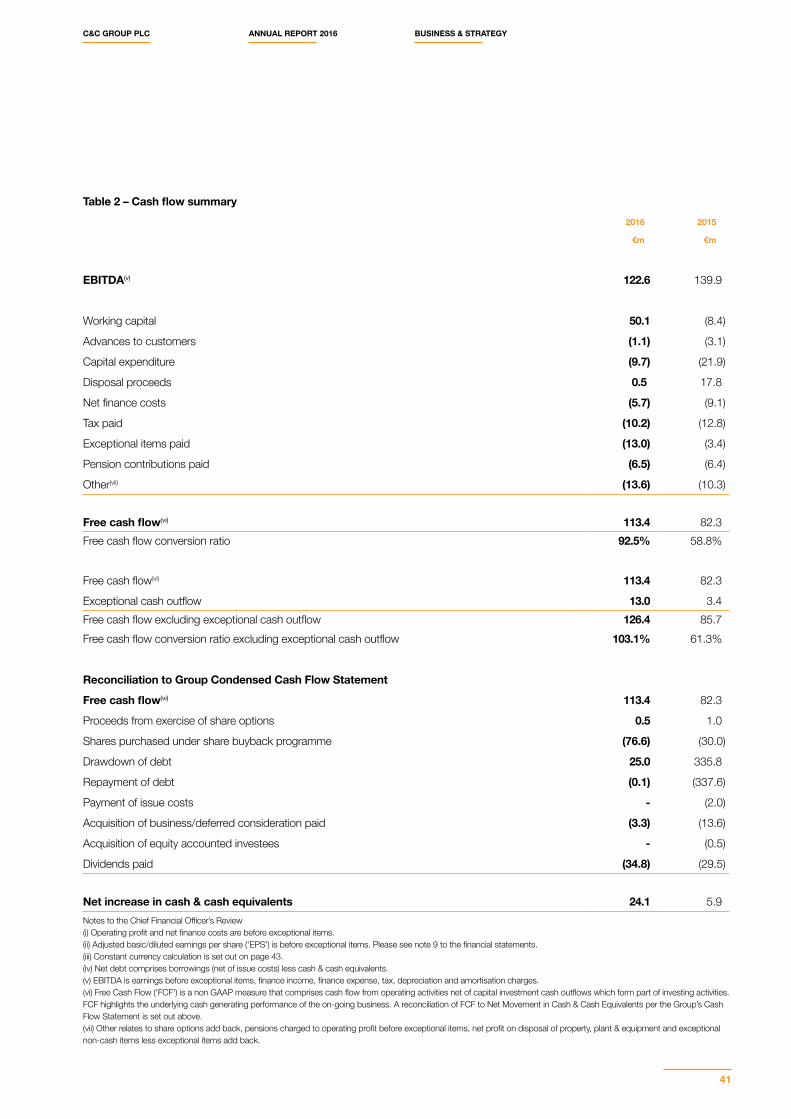
Table 2 – Cash flow summary2016 2015
€m €m
EBITDA(v) 122.6 139.9
Working capital 50.1 (8.4)
Advances to customers (1.1) (3.1)
Capital expenditure (9.7) (21.9)
Disposal proceeds 0.5 17.8
Net finance costs (5.7) (9.1)
Tax paid (10.2) (12.8)
Exceptional items paid (13.0) (3.4)
Pension contributions paid (6.5) (6.4)
Other(vii) (13.6) (10.3)
Free cash flow(vi) 113.4 82.3Free cash flow conversion ratio 92.5% 58.8%
Free cash flow(vi) 113.4 82.3
Exceptional cash outflow 13.0 3.4Free cash flow excluding exceptional cash outflow 126.4 85.7Free cash flow conversion ratio excluding exceptional cash outflow 103.1% 61.3%
Reconciliation to Group Condensed Cash Flow Statement
Free cash flow(vi) 113.4 82.3
Proceeds from exercise of share options 0.5 1.0
Shares purchased under share buyback programme (76.6) (30.0)
Drawdown of debt 25.0 335.8
Repayment of debt (0.1) (337.6)
Payment of issue costs - (2.0)
Acquisition of business/deferred consideration paid (3.3) (13.6)
Acquisition of equity accounted investees - (0.5)
Dividends paid (34.8) (29.5)
Net increase in cash & cash equivalents 24.1 5.9Notes to the Chief Financial Officer’s Review(i) Operating profit and net finance costs are before exceptional items. (ii) Adjusted basic/diluted earnings per share (‘EPS’) is before exceptional items. Please see note 9 to the financial statements.(iii) Constant currency calculation is set out on page 43.(iv) Net debt comprises borrowings (net of issue costs) less cash & cash equivalents.(v) EBITDA is earnings before exceptional items, finance income, finance expense, tax, depreciation and amortisation charges. (vi) Free Cash Flow (‘FCF’) is a non GAAP measure that comprises cash flow from operating activities net of capital investment cash outflows which form part of investing activities. FCF highlights the underlying cash generating performance of the on-going business. A reconciliation of FCF to Net Movement in Cash & Cash Equivalents per the Group’s Cash Flow Statement is set out above.(vii) Other relates to share options add back, pensions charged to operating profit before exceptional items, net profit on disposal of property, plant & equipment and exceptional non-cash items less exceptional items add back.
C&C GROUP PLC ANNUAL REPORT 2016 BUSINESS & STRATEGY
41
RETIREMENT BENEFIT OBLIGATIONSIn compliance with IFRS, the net assets and actuarial liabilities of the various defined benefit pension schemes operated by the Group companies, computed in accordance with IAS 19(R) Employee Benefits, are included on the face of the Group balance sheet as retirement benefit obligations.
In the current financial year the Group offered deferred members of its two ROI defined benefit schemes an opportunity to transfer out of the schemes, giving the deferred member greater control and flexibility over their pension arrangements. The closing liability of the two ROI defined benefit schemes as at 29 February 2016 is a deficit of €32.7 million and this includes an obligation to pay €10.0 million to deferred members who opted to transfer out of the schemes. This €10.0 million liability is classified as a current liability in the financial statements of the Group as at 29 February 2016. The NI defined benefit pension scheme is reporting a surplus of €4.7 million as at 29 February 2016.
We finalised the actuarial valuations of the defined benefit schemes in FY2016. As a result of these updated valuations new funding arrangements have been put in place. For the staff defined benefit scheme, these arrangements commit the Group to funding contributions at 22% of pensionable salaries per annum to meet the cost of future service benefits for active members. In addition, there will be a lump sum deficit funding contribution of €3.1 million per annum until the next valuation date. For the NI defined benefit pension scheme, currently in surplus, we have committed to contributions of £0.1 million per annum. Negotiations with respect to ongoing funding of the Group’s executive ROI defined benefit pension scheme are ongoing.
There are 4 active members in the NI scheme and 63 active members (less than 10% of total membership) in the ROI schemes.
At 29 February 2016, the retirement benefit obligations on the IAS 19(R) Employee Benefits basis amounted to €28.0 million gross and €24.9 million net of deferred tax (FY2015: €33.6 million gross and €29.7 million net of deferred tax). The movement in the deficit is as follows:
€m
Deficit at 1 March 2015 33.6
Employer contributions paid (6.5)
Actuarial loss 5.1
Credit to the Income Statement (4.5)
FX adjustment on retranslation 0.3Net deficit at 29 February 2016 28.0
The decrease in the deficit from €33.6 million to €28.0 million is primarily driven by the employer contributions of €6.5 million and a gain in the Income Statement of €4.5 million which primarily arises from a settlement gain with respect to deferred members who opted to transfer out of the defined benefit schemes. All other significant assumptions applied in the measurement of pension obligations at 29 February 2016 are broadly consistent with those as applied at 28 February 2015.
FINANCIAL RISK MANAGEMENTThe most significant financial market risks facing the Group continue to include foreign currency exchange rate risk, commodity price fluctuations, interest rate risk and creditworthiness risk in relation to its counterparties.
The Board of Directors set the treasury policies and objectives of the Group, the implementation of which are monitored by the Audit Committee. There has been no significant change during the financial year to the Board’s approach to the management of these risks. Details of both the policies and control procedures adopted to manage these financial risks are set out in detail in note 22 to the financial statements. Currency risk managementThe reporting currency and the currency used for all planning and budgetary purposes is the Euro. However, as the Group transacts in foreign currencies and consolidates the results of non-Euro reporting foreign operations, it is exposed to both transaction and translation currency risk.
Currency transaction exposures primarily arise on the Sterling, US, Canadian and Australian Dollar denominated sales of our Euro subsidiaries. We seek to minimise this exposure, when economically viable to do so, by maximising the value of subsidiary foreign currency input costs and creating a natural hedge. When the remaining net exposure is material, we manage it by hedging an appropriate portion for a period of up to two years ahead. Forward foreign currency contracts are used to manage this risk in a non-speculative manner. There were no outstanding forward foreign currency contracts as at the year-end date.
The effective rate for the translation of results from Sterling currency operations was €1:£0.7281 (year ended 28 February 2015: €1:£0.795) and from US Dollar operations was €1:$1.1018 (year ended 28 February 2015: €1:$1.295).
Comparisons for revenue, net revenue and operating profit for each of the Group’s reporting segments are shown at constant exchange rates for transactions by subsidiary undertakings in currencies other than their functional currency and for translation in relation to the Group’s Sterling and US Dollar denominated subsidiaries by restating the prior year at FY2016 effective rates.
GROUP CHIEF FINANCIAL OFFICER’S REVIEW (CONTINUED)
42
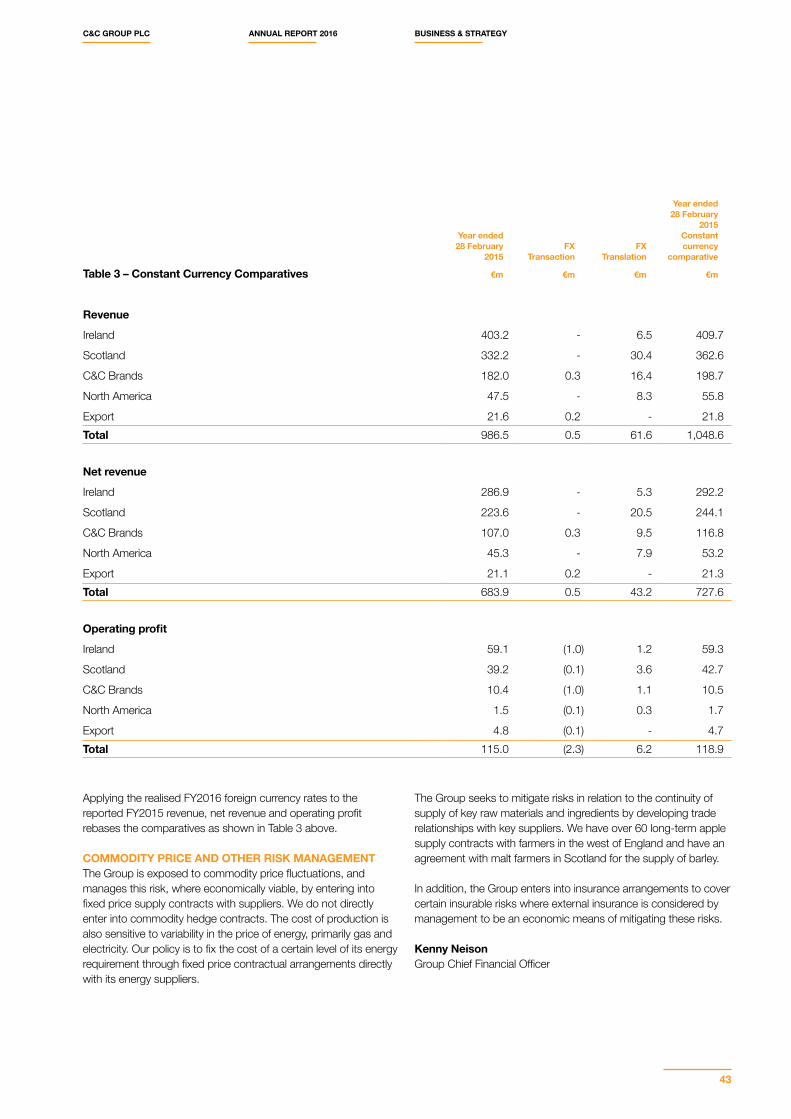
Table 3 – Constant Currency Comparatives
Year ended 28 February
2015FX
TransactionFX
Translation
Year ended 28 February
2015 Constant currency
comparative
€m €m €m €m
Revenue
Ireland 403.2 - 6.5 409.7
Scotland 332.2 - 30.4 362.6
C&C Brands 182.0 0.3 16.4 198.7
North America 47.5 - 8.3 55.8
Export 21.6 0.2 - 21.8Total 986.5 0.5 61.6 1,048.6
Net revenue
Ireland 286.9 - 5.3 292.2
Scotland 223.6 - 20.5 244.1
C&C Brands 107.0 0.3 9.5 116.8
North America 45.3 - 7.9 53.2
Export 21.1 0.2 - 21.3Total 683.9 0.5 43.2 727.6
Operating profit
Ireland 59.1 (1.0) 1.2 59.3
Scotland 39.2 (0.1) 3.6 42.7
C&C Brands 10.4 (1.0) 1.1 10.5
North America 1.5 (0.1) 0.3 1.7
Export 4.8 (0.1) - 4.7Total 115.0 (2.3) 6.2 118.9
Applying the realised FY2016 foreign currency rates to the reported FY2015 revenue, net revenue and operating profit rebases the comparatives as shown in Table 3 above.
COMMODITY PRICE AND OTHER RISK MANAGEMENTThe Group is exposed to commodity price fluctuations, and manages this risk, where economically viable, by entering into fixed price supply contracts with suppliers. We do not directly enter into commodity hedge contracts. The cost of production is also sensitive to variability in the price of energy, primarily gas and electricity. Our policy is to fix the cost of a certain level of its energy requirement through fixed price contractual arrangements directly with its energy suppliers.
The Group seeks to mitigate risks in relation to the continuity of supply of key raw materials and ingredients by developing trade relationships with key suppliers. We have over 60 long-term apple supply contracts with farmers in the west of England and have an agreement with malt farmers in Scotland for the supply of barley.
In addition, the Group enters into insurance arrangements to cover certain insurable risks where external insurance is considered by management to be an economic means of mitigating these risks.
Kenny NeisonGroup Chief Financial Officer
C&C GROUP PLC ANNUAL REPORT 2016 BUSINESS & STRATEGY
43
HIGHLIGHTS
We are supporting the implementation of minimum unit pricing in Scotland, the Republic of Ireland and Northern Ireland.
We became the first drinks company in the UK and Ireland to display calorie information on our packaging.
We communicated the calorie content of our draught products in outlets.
We are working with Governmental bodies, Drinkaware and police forces on initiatives to improve the safety of the night time economy.
C&C made a significant contribution to the new US Cider Bill which has now been passed as legislation and will help improve the quality of cider products in the US.
The Tennent’s Training Academy provides high quality hospitality industry training, now having trained over 20,000 people.
We have made significant charitable contributions at local and national level.
Efficiencies at our manufacturing sites have meant that our energy consumption per hectolitre fell by 6%.
Our two largest production sites, Clonmel and Wellpark, sent zero waste to landfill.
Health and Safety programmes have delivered a significant reduction in the number of injuries resulting in lost-work days.
Our commitment to the environment and agriculture is extremely high. During the last 12 months we pressed over 83,000 tonnes of fruit.
We pay the appropriate and required level of tax in the different countries we operate in and remit substantial amounts of alcohol duty.
CORPORATE RESPONSIBILITY
44

INTRODUCTIONEnsuring that the group operates in an environmentally and socially responsible way is one of our key values. We operate a range of policies that ensure we deliver the demands of our stakeholders.
In Northern Ireland we are on target to raise £18,000 for PIPS (Public Initiative for Prevention of Suicide and Self-Harm). We provide financial support to the on-trade sector through our lending facilities. This has enabled many customers to improve the quality of their premises, enabling them to continue to play an important role in their local communities. Additionally, we continue to recognise the importance of the wider hospitality sector through our partnership with Tourism Northern Ireland.
In the Republic of Ireland, we continue to use our brands to raise money for local charities. Our partnership between BUMBLEance, the Children’s National Ambulance Service, and Tipperary Kidz Water helps to provide a unique, child-centred professional ambulance transport service, catering for the needs of seriously ill children en-route to and from principal centres of care. We donated €10,000 to the charity to enable them to manufacture a Bumble Bee soft toy for a promotion with a large retailer. In addition we have donated in the region of €5,000 to Barrettstown Kids Camps, which host specially designed programmes where children with a serious illness can attend, have some fun and meet other children from all over Europe. We support the Musical Youth Foundation, an organisation that provides music lessons to children in disadvantaged areas. We have also donated free stock of Finches and Tipperary Water to a wide range of other local projects and charities.
We are extremely proud to be involved with the Quinn School of Business in University College Dublin where we support students with scholarships and work placements in a scheme in memory of our late chairman, Tony O’Brien. We support a number of local schools by providing student work experience opportunities at our Clonmel production site for students in technical and manufacturing subjects as well as places in our Marketing, Finance and Customer Service departments in Dublin and Belfast.
During the last year we announced the closure of our production facility in Borrisoleigh and an expansion in investment and additional jobs in Clonmel. We are working with the community in both areas to ensure that the transition is as smooth as possible.
COMMUNITY ENGAGEMENTIt is important to us that we operate as good citizens in our communities. We focus our efforts on activities that benefit our local areas. We work hard to ensure we have a positive impact on the communities in which we operate. A significant part of this is our approach to charitable activities where we support a wide range of charities particularly those that have a local impact in relation to our operating facilities.
The Group takes its responsibilities as a corporate citizen seriously. This includes respecting and complying with local tax laws and paying the required levels of tax in the different countries where we operate. We claim the allowances and deductions that we are properly entitled to, for instance, on the investment and employment that we bring to our communities. We benefit from having always been an Irish company, established in the Republic of Ireland’s low tax environment, with our major Irish cider production unit located in Clonmel and the Group headquartered in Dublin. The majority of the Group’s profits are earned in ROI and the UK, which both have competitive corporation tax rates compared with the European average. In ROI and the UK we remit substantial amounts of duty on alcohol production.
IRELANDWe support a diverse range of sporting and live music events as well as charities and community projects across Ireland.
Our partnerships with large sporting events includes horse racing, endurance events and the city marathons in Dublin and Cork. Additionally, Tennent’s NI has partnered with the Irish Football Association, supporting football at both a national and local level. We also support a number of live music events including Tennent’s Vital, which is Northern Ireland’s biggest music festival. The annual sponsorship of this and other live music events by Tennent’s NI helps bring world-class musicians to Northern Ireland. In ROI, we support the Forbidden Fruit Festival, the Kilkenny Trad Festival, Junction Festival in Clonmel and Bulmers Live at Leopardstown, which sees live music acts alongside evening racing events.
C&C GROUP PLC ANNUAL REPORT 2016 BUSINESS & STRATEGY
45
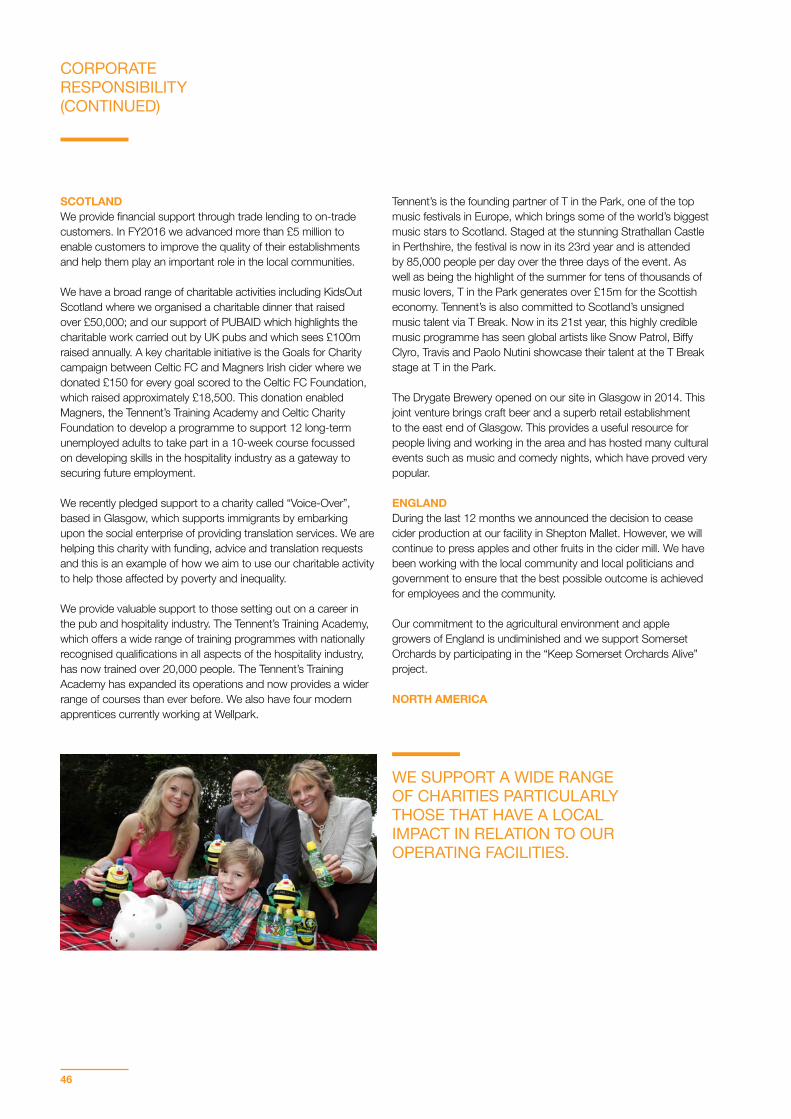
SCOTLAND We provide financial support through trade lending to on-trade customers. In FY2016 we advanced more than £5 million to enable customers to improve the quality of their establishments and help them play an important role in the local communities.
We have a broad range of charitable activities including KidsOut Scotland where we organised a charitable dinner that raised over £50,000; and our support of PUBAID which highlights the charitable work carried out by UK pubs and which sees £100m raised annually. A key charitable initiative is the Goals for Charity campaign between Celtic FC and Magners Irish cider where we donated £150 for every goal scored to the Celtic FC Foundation, which raised approximately £18,500. This donation enabled Magners, the Tennent’s Training Academy and Celtic Charity Foundation to develop a programme to support 12 long-term unemployed adults to take part in a 10-week course focussed on developing skills in the hospitality industry as a gateway to securing future employment.
We recently pledged support to a charity called “Voice-Over”, based in Glasgow, which supports immigrants by embarking upon the social enterprise of providing translation services. We are helping this charity with funding, advice and translation requests and this is an example of how we aim to use our charitable activity to help those affected by poverty and inequality. We provide valuable support to those setting out on a career in the pub and hospitality industry. The Tennent’s Training Academy, which offers a wide range of training programmes with nationally recognised qualifications in all aspects of the hospitality industry, has now trained over 20,000 people. The Tennent’s Training Academy has expanded its operations and now provides a wider range of courses than ever before. We also have four modern apprentices currently working at Wellpark.
Tennent’s is the founding partner of T in the Park, one of the top music festivals in Europe, which brings some of the world’s biggest music stars to Scotland. Staged at the stunning Strathallan Castle in Perthshire, the festival is now in its 23rd year and is attended by 85,000 people per day over the three days of the event. As well as being the highlight of the summer for tens of thousands of music lovers, T in the Park generates over £15m for the Scottish economy. Tennent’s is also committed to Scotland’s unsigned music talent via T Break. Now in its 21st year, this highly credible music programme has seen global artists like Snow Patrol, Biffy Clyro, Travis and Paolo Nutini showcase their talent at the T Break stage at T in the Park.
The Drygate Brewery opened on our site in Glasgow in 2014. This joint venture brings craft beer and a superb retail establishment to the east end of Glasgow. This provides a useful resource for people living and working in the area and has hosted many cultural events such as music and comedy nights, which have proved very popular.
ENGLANDDuring the last 12 months we announced the decision to cease cider production at our facility in Shepton Mallet. However, we will continue to press apples and other fruits in the cider mill. We have been working with the local community and local politicians and government to ensure that the best possible outcome is achieved for employees and the community.
Our commitment to the agricultural environment and apple growers of England is undiminished and we support Somerset Orchards by participating in the “Keep Somerset Orchards Alive” project.
NORTH AMERICA
CORPORATE RESPONSIBILITY (CONTINUED)
WE SUPPORT A WIDE RANGE OF CHARITIES PARTICULARLY THOSE THAT HAVE A LOCAL IMPACT IN RELATION TO OUR OPERATING FACILITIES.
46
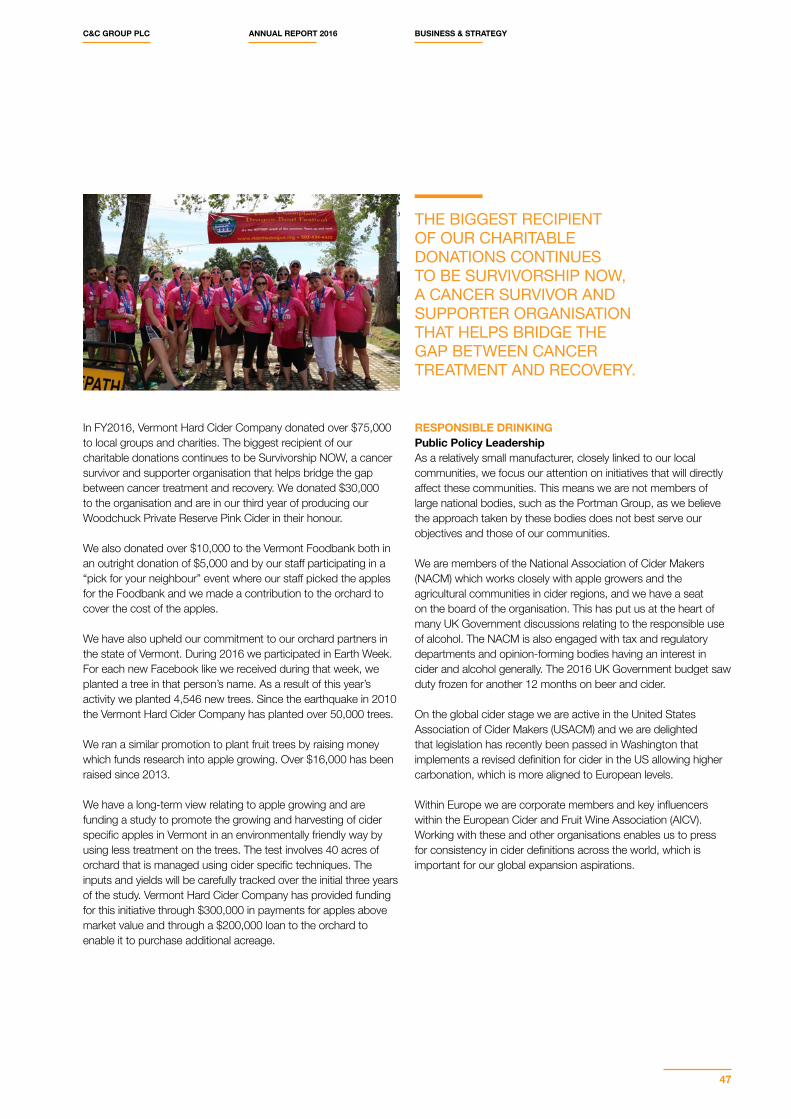
In FY2016, Vermont Hard Cider Company donated over $75,000 to local groups and charities. The biggest recipient of our charitable donations continues to be Survivorship NOW, a cancer survivor and supporter organisation that helps bridge the gap between cancer treatment and recovery. We donated $30,000 to the organisation and are in our third year of producing our Woodchuck Private Reserve Pink Cider in their honour.
We also donated over $10,000 to the Vermont Foodbank both in an outright donation of $5,000 and by our staff participating in a “pick for your neighbour” event where our staff picked the apples for the Foodbank and we made a contribution to the orchard to cover the cost of the apples.
We have also upheld our commitment to our orchard partners in the state of Vermont. During 2016 we participated in Earth Week. For each new Facebook like we received during that week, we planted a tree in that person’s name. As a result of this year’s activity we planted 4,546 new trees. Since the earthquake in 2010 the Vermont Hard Cider Company has planted over 50,000 trees.
We ran a similar promotion to plant fruit trees by raising money which funds research into apple growing. Over $16,000 has been raised since 2013.
We have a long-term view relating to apple growing and are funding a study to promote the growing and harvesting of cider specific apples in Vermont in an environmentally friendly way by using less treatment on the trees. The test involves 40 acres of orchard that is managed using cider specific techniques. The inputs and yields will be carefully tracked over the initial three years of the study. Vermont Hard Cider Company has provided funding for this initiative through $300,000 in payments for apples above market value and through a $200,000 loan to the orchard to enable it to purchase additional acreage.
RESPONSIBLE DRINKINGPublic Policy LeadershipAs a relatively small manufacturer, closely linked to our local communities, we focus our attention on initiatives that will directly affect these communities. This means we are not members of large national bodies, such as the Portman Group, as we believe the approach taken by these bodies does not best serve our objectives and those of our communities.
We are members of the National Association of Cider Makers (NACM) which works closely with apple growers and the agricultural communities in cider regions, and we have a seat on the board of the organisation. This has put us at the heart of many UK Government discussions relating to the responsible use of alcohol. The NACM is also engaged with tax and regulatory departments and opinion-forming bodies having an interest in cider and alcohol generally. The 2016 UK Government budget saw duty frozen for another 12 months on beer and cider.
On the global cider stage we are active in the United States Association of Cider Makers (USACM) and we are delighted that legislation has recently been passed in Washington that implements a revised definition for cider in the US allowing higher carbonation, which is more aligned to European levels.
Within Europe we are corporate members and key influencers within the European Cider and Fruit Wine Association (AICV). Working with these and other organisations enables us to press for consistency in cider definitions across the world, which is important for our global expansion aspirations.
THE BIGGEST RECIPIENT OF OUR CHARITABLE DONATIONS CONTINUES TO BE SURVIVORSHIP NOW, A CANCER SURVIVOR AND SUPPORTER ORGANISATION THAT HELPS BRIDGE THE GAP BETWEEN CANCER TREATMENT AND RECOVERY.
C&C GROUP PLC ANNUAL REPORT 2016 BUSINESS & STRATEGY
47
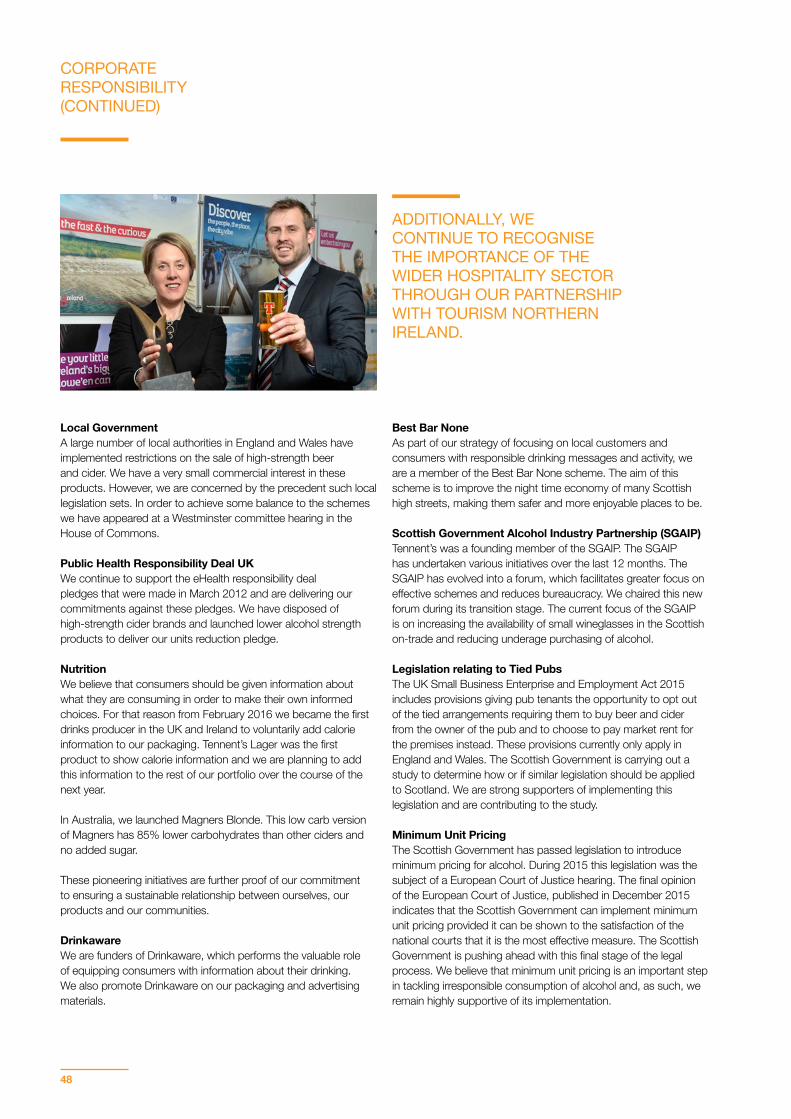
Local GovernmentA large number of local authorities in England and Wales have implemented restrictions on the sale of high-strength beer and cider. We have a very small commercial interest in these products. However, we are concerned by the precedent such local legislation sets. In order to achieve some balance to the schemes we have appeared at a Westminster committee hearing in the House of Commons.
Public Health Responsibility Deal UKWe continue to support the eHealth responsibility deal pledges that were made in March 2012 and are delivering our commitments against these pledges. We have disposed of high-strength cider brands and launched lower alcohol strength products to deliver our units reduction pledge.
NutritionWe believe that consumers should be given information about what they are consuming in order to make their own informed choices. For that reason from February 2016 we became the first drinks producer in the UK and Ireland to voluntarily add calorie information to our packaging. Tennent’s Lager was the first product to show calorie information and we are planning to add this information to the rest of our portfolio over the course of the next year.
In Australia, we launched Magners Blonde. This low carb version of Magners has 85% lower carbohydrates than other ciders and no added sugar.
These pioneering initiatives are further proof of our commitment to ensuring a sustainable relationship between ourselves, our products and our communities.
DrinkawareWe are funders of Drinkaware, which performs the valuable role of equipping consumers with information about their drinking. We also promote Drinkaware on our packaging and advertising materials.
Best Bar NoneAs part of our strategy of focusing on local customers and consumers with responsible drinking messages and activity, we are a member of the Best Bar None scheme. The aim of this scheme is to improve the night time economy of many Scottish high streets, making them safer and more enjoyable places to be.
Scottish Government Alcohol Industry Partnership (SGAIP) Tennent’s was a founding member of the SGAIP. The SGAIP has undertaken various initiatives over the last 12 months. The SGAIP has evolved into a forum, which facilitates greater focus on effective schemes and reduces bureaucracy. We chaired this new forum during its transition stage. The current focus of the SGAIP is on increasing the availability of small wineglasses in the Scottish on-trade and reducing underage purchasing of alcohol.
Legislation relating to Tied PubsThe UK Small Business Enterprise and Employment Act 2015 includes provisions giving pub tenants the opportunity to opt out of the tied arrangements requiring them to buy beer and cider from the owner of the pub and to choose to pay market rent for the premises instead. These provisions currently only apply in England and Wales. The Scottish Government is carrying out a study to determine how or if similar legislation should be applied to Scotland. We are strong supporters of implementing this legislation and are contributing to the study.
Minimum Unit Pricing The Scottish Government has passed legislation to introduce minimum pricing for alcohol. During 2015 this legislation was the subject of a European Court of Justice hearing. The final opinion of the European Court of Justice, published in December 2015 indicates that the Scottish Government can implement minimum unit pricing provided it can be shown to the satisfaction of the national courts that it is the most effective measure. The Scottish Government is pushing ahead with this final stage of the legal process. We believe that minimum unit pricing is an important step in tackling irresponsible consumption of alcohol and, as such, we remain highly supportive of its implementation.
CORPORATE RESPONSIBILITY (CONTINUED)
ADDITIONALLY, WE CONTINUE TO RECOGNISE THE IMPORTANCE OF THE WIDER HOSPITALITY SECTOR THROUGH OUR PARTNERSHIP WITH TOURISM NORTHERN IRELAND.
48
The Governments in Ireland, both in the North and in the Republic, are also proposing to implement minimum unit pricing and we are supporting these plans as well.
Responsible Drinking InitiativesWe are committed to promoting responsible drinking in all the markets in which we operate. In addition to adhering to the relevant guidelines and legislation, we have also implemented a number of additional programmes to promote responsible drinking.
The Irish Government unveiled its Alcohol Bill 2015 during the year which includes many far-reaching initiatives to tackle the harm created by the misuse of alcohol in Ireland. This includes the introduction of minimum unit pricing, restrictions on advertising and improvements in health labelling. We have welcomed these initiatives as we believe that it is important to balance consumers’ relationships with alcohol in order to maintain a sustainable business.
We also expanded the distribution for our 0% version of Tennent’s, Hee Haw, and, as part of our plan to have a wide range of alcohol free alternatives, we launched Magners 0% alcohol cider during the year.
We have further developed our non-alcoholic product range, with increased marketing and promotion behind the Finches and Tipperary brands in Ireland, and we launched our new JWV+ soft drink product.
At T in the Park, Tennent’s operated ‘Be Chilled’ at T in the Park, which comprises a facility for consumers camping at the festival to pre-order and collect chilled Tennent’s Lager to encourage trading down.
ENVIRONMENTAL IMPACT & ENERGYOur operations teams in each of the Group’s manufacturing facilities actively work to reduce our impact on the environment. Their focus is on the reduction in consumption of energy, water and other raw materials as well as waste going to landfill and greenhouse gas (GHG) emissions. We also actively review mechanisms whereby we can increase transportation efficiency. FY2016 was the first full year that our Borrisoleigh plant could be incorporated into the data for comparison.
In comparison to FY2015, the total electricity used per hectolitre of products produced in our manufacturing sites at Wellpark, Borrisoleigh and Shepton Mallet reduced by a further 6%. The factors contributing to this performance included awareness and improvement programmes on each of the sites and a range of targeted investments, most notably a €1m investment in the Wellpark Brewery refrigeration system.
Our manufacturing sites at Clonmel and Shepton Mallet are accredited with the Environmental Management Standard ISO 14001; the facility at Clonmel is also accredited to the Irish Energy Management Standard IS EN 16001:2009, and works closely with the Sustainable Energy Authority of Ireland (SEAI). Clonmel was re-accredited to the ISO 50001:2011 Energy Management Standard. These standards require us to demonstrate the systematic management of energy leading to a decline in GHG emissions. At Clonmel and Borrisoleigh 100% of the electricity provided by our electricity supplier comes from renewable sources. Our environmental management systems at Wellpark are aligned with Clonmel and Shepton Mallet and met their regulatory targets in FY2016. In the UK, we avail of the Government’s small emitters opt out scheme.
SUSTAINABLE LOGISTICS We continually review our supply chain to ensure we are optimised, both in respect of footprint and customer service.
In the past 12 months, our distribution partner in the Republic of Ireland has upgraded its fleet with 20 new tractor units. All of these units meet the requirements of the Euro 6 EU Regulations for diesel engines, meaning lower levels of harmful exhaust emissions and greater fuel efficiency. In our secondary distribution fleet through improved transport planning, we have removed a total of 14 trucks from the fleet and from contractors and have significantly reduced our road haulage mileage.
In the past 12 months our distribution partner in England and Wales has also invested in fleet efficiency, with £13m spent on new trucks and trailers and £2m invested in trailer tracking and traffic management systems.
PACKAGING We continue to benchmark our SKU’s to ensure that we take every opportunity to light-weight our packaging and make full use of recyclable materials. We work with our multinational suppliers in this area to make best use of their expertise, and we also look at efficiencies in the supply chain. For example, we are currently engaged in partnership with our main glass supplier on their continuous improvement project initiative to ensure we are achieving maximum efficiencies, value and quality on glass across all our plants, and the wider supply chain.
In line with our pledge to promote responsible drinking, all our labels contain information on alcohol units, Chief Medical Officer guidelines and health warnings. In a new initiative, we have also introduced alcohol units per serving on our newly branded Tennent’s glassware range.
We have also made a voluntary commitment to include calorie information on our products, and have already rolled this out on our Tennent’s cans.
C&C GROUP PLC ANNUAL REPORT 2016 BUSINESS & STRATEGY
49
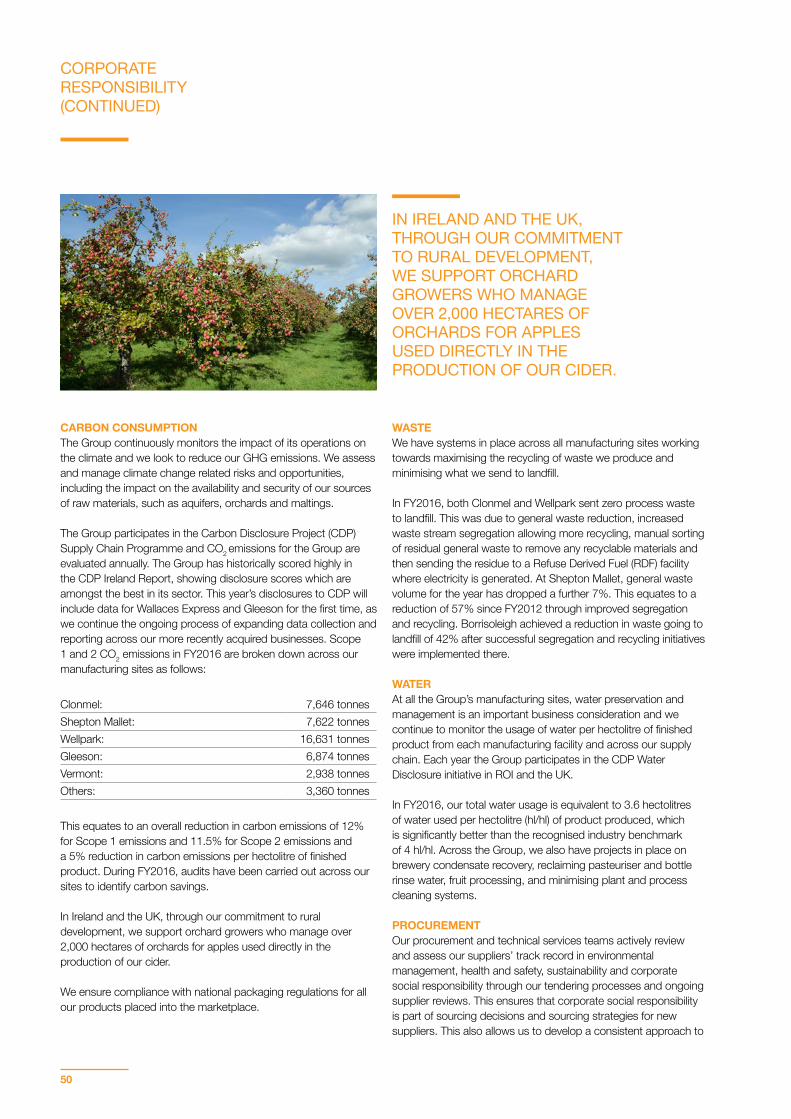
CARBON CONSUMPTIONThe Group continuously monitors the impact of its operations on the climate and we look to reduce our GHG emissions. We assess and manage climate change related risks and opportunities, including the impact on the availability and security of our sources of raw materials, such as aquifers, orchards and maltings.
The Group participates in the Carbon Disclosure Project (CDP) Supply Chain Programme and CO2 emissions for the Group are evaluated annually. The Group has historically scored highly in the CDP Ireland Report, showing disclosure scores which are amongst the best in its sector. This year’s disclosures to CDP will include data for Wallaces Express and Gleeson for the first time, as we continue the ongoing process of expanding data collection and reporting across our more recently acquired businesses. Scope 1 and 2 CO2 emissions in FY2016 are broken down across our manufacturing sites as follows:
Clonmel: 7,646 tonnesShepton Mallet: 7,622 tonnes Wellpark: 16,631 tonnes Gleeson: 6,874 tonnes Vermont: 2,938 tonnes Others: 3,360 tonnes
This equates to an overall reduction in carbon emissions of 12% for Scope 1 emissions and 11.5% for Scope 2 emissions and a 5% reduction in carbon emissions per hectolitre of finished product. During FY2016, audits have been carried out across our sites to identify carbon savings.
In Ireland and the UK, through our commitment to rural development, we support orchard growers who manage over 2,000 hectares of orchards for apples used directly in the production of our cider.
We ensure compliance with national packaging regulations for all our products placed into the marketplace.
WASTEWe have systems in place across all manufacturing sites working towards maximising the recycling of waste we produce and minimising what we send to landfill.
In FY2016, both Clonmel and Wellpark sent zero process waste to landfill. This was due to general waste reduction, increased waste stream segregation allowing more recycling, manual sorting of residual general waste to remove any recyclable materials and then sending the residue to a Refuse Derived Fuel (RDF) facility where electricity is generated. At Shepton Mallet, general waste volume for the year has dropped a further 7%. This equates to a reduction of 57% since FY2012 through improved segregation and recycling. Borrisoleigh achieved a reduction in waste going to landfill of 42% after successful segregation and recycling initiatives were implemented there.
WATERAt all the Group’s manufacturing sites, water preservation and management is an important business consideration and we continue to monitor the usage of water per hectolitre of finished product from each manufacturing facility and across our supply chain. Each year the Group participates in the CDP Water Disclosure initiative in ROI and the UK.
In FY2016, our total water usage is equivalent to 3.6 hectolitres of water used per hectolitre (hl/hl) of product produced, which is significantly better than the recognised industry benchmark of 4 hl/hl. Across the Group, we also have projects in place on brewery condensate recovery, reclaiming pasteuriser and bottle rinse water, fruit processing, and minimising plant and process cleaning systems.
PROCUREMENT Our procurement and technical services teams actively review and assess our suppliers’ track record in environmental management, health and safety, sustainability and corporate social responsibility through our tendering processes and ongoing supplier reviews. This ensures that corporate social responsibility is part of sourcing decisions and sourcing strategies for new suppliers. This also allows us to develop a consistent approach to
CORPORATE RESPONSIBILITY (CONTINUED)
IN IRELAND AND THE UK, THROUGH OUR COMMITMENT TO RURAL DEVELOPMENT, WE SUPPORT ORCHARD GROWERS WHO MANAGE OVER 2,000 HECTARES OF ORCHARDS FOR APPLES USED DIRECTLY IN THE PRODUCTION OF OUR CIDER.
50
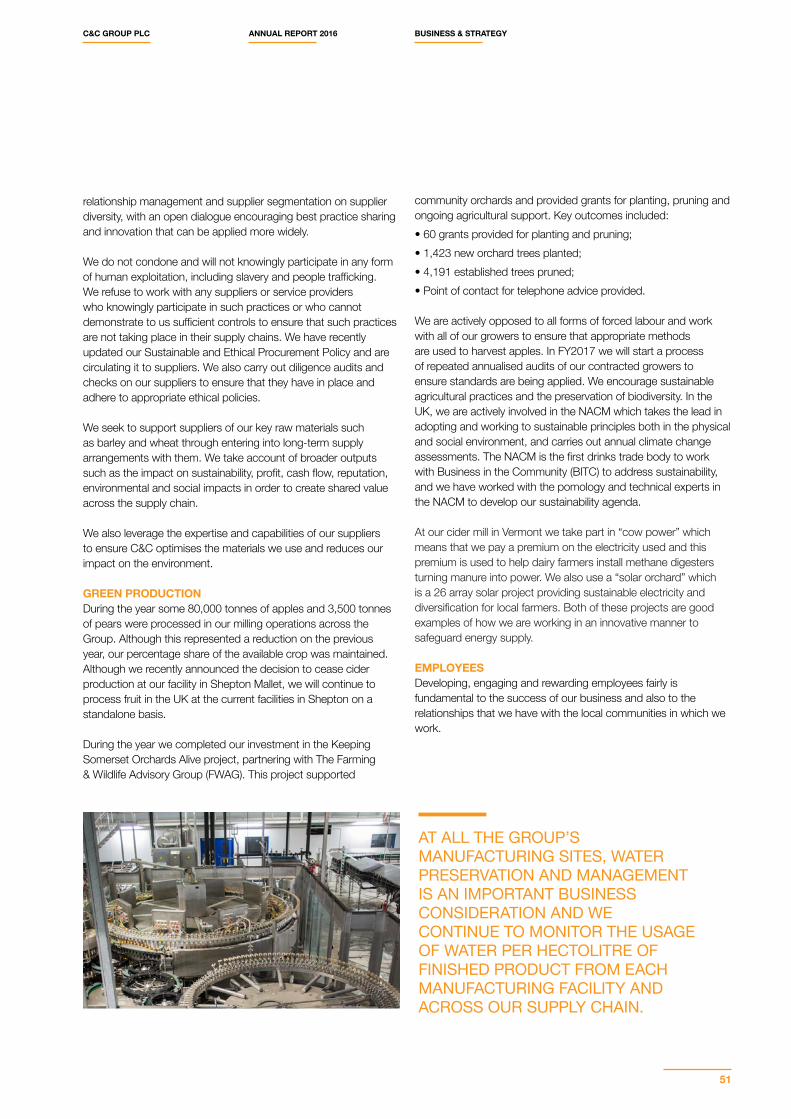
relationship management and supplier segmentation on supplier diversity, with an open dialogue encouraging best practice sharing and innovation that can be applied more widely.
We do not condone and will not knowingly participate in any form of human exploitation, including slavery and people trafficking. We refuse to work with any suppliers or service providers who knowingly participate in such practices or who cannot demonstrate to us sufficient controls to ensure that such practices are not taking place in their supply chains. We have recently updated our Sustainable and Ethical Procurement Policy and are circulating it to suppliers. We also carry out diligence audits and checks on our suppliers to ensure that they have in place and adhere to appropriate ethical policies.
We seek to support suppliers of our key raw materials such as barley and wheat through entering into long-term supply arrangements with them. We take account of broader outputs such as the impact on sustainability, profit, cash flow, reputation, environmental and social impacts in order to create shared value across the supply chain.
We also leverage the expertise and capabilities of our suppliers to ensure C&C optimises the materials we use and reduces our impact on the environment.
GREEN PRODUCTIONDuring the year some 80,000 tonnes of apples and 3,500 tonnes of pears were processed in our milling operations across the Group. Although this represented a reduction on the previous year, our percentage share of the available crop was maintained. Although we recently announced the decision to cease cider production at our facility in Shepton Mallet, we will continue to process fruit in the UK at the current facilities in Shepton on a standalone basis.
During the year we completed our investment in the Keeping Somerset Orchards Alive project, partnering with The Farming & Wildlife Advisory Group (FWAG). This project supported
community orchards and provided grants for planting, pruning and ongoing agricultural support. Key outcomes included:• 60 grants provided for planting and pruning;• 1,423 new orchard trees planted;• 4,191 established trees pruned;• Point of contact for telephone advice provided.
We are actively opposed to all forms of forced labour and work with all of our growers to ensure that appropriate methods are used to harvest apples. In FY2017 we will start a process of repeated annualised audits of our contracted growers to ensure standards are being applied. We encourage sustainable agricultural practices and the preservation of biodiversity. In the UK, we are actively involved in the NACM which takes the lead in adopting and working to sustainable principles both in the physical and social environment, and carries out annual climate change assessments. The NACM is the first drinks trade body to work with Business in the Community (BITC) to address sustainability, and we have worked with the pomology and technical experts in the NACM to develop our sustainability agenda. At our cider mill in Vermont we take part in “cow power” which means that we pay a premium on the electricity used and this premium is used to help dairy farmers install methane digesters turning manure into power. We also use a “solar orchard” which is a 26 array solar project providing sustainable electricity and diversification for local farmers. Both of these projects are good examples of how we are working in an innovative manner to safeguard energy supply.
EMPLOYEESDeveloping, engaging and rewarding employees fairly is fundamental to the success of our business and also to the relationships that we have with the local communities in which we work.
AT ALL THE GROUP’S MANUFACTURING SITES, WATER PRESERVATION AND MANAGEMENT IS AN IMPORTANT BUSINESS CONSIDERATION AND WE CONTINUE TO MONITOR THE USAGE OF WATER PER HECTOLITRE OF FINISHED PRODUCT FROM EACH MANUFACTURING FACILITY AND ACROSS OUR SUPPLY CHAIN.
C&C GROUP PLC ANNUAL REPORT 2016 BUSINESS & STRATEGY
51
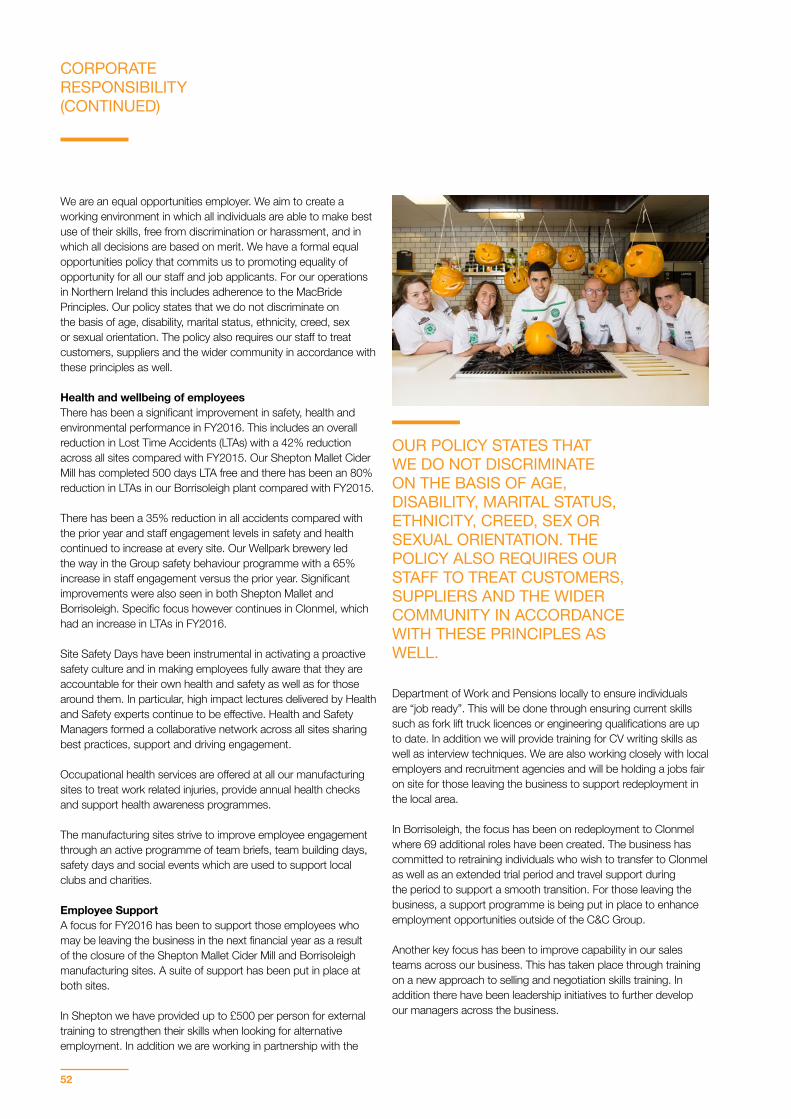
We are an equal opportunities employer. We aim to create a working environment in which all individuals are able to make best use of their skills, free from discrimination or harassment, and in which all decisions are based on merit. We have a formal equal opportunities policy that commits us to promoting equality of opportunity for all our staff and job applicants. For our operations in Northern Ireland this includes adherence to the MacBride Principles. Our policy states that we do not discriminate on the basis of age, disability, marital status, ethnicity, creed, sex or sexual orientation. The policy also requires our staff to treat customers, suppliers and the wider community in accordance with these principles as well.
Health and wellbeing of employeesThere has been a significant improvement in safety, health and environmental performance in FY2016. This includes an overall reduction in Lost Time Accidents (LTAs) with a 42% reduction across all sites compared with FY2015. Our Shepton Mallet Cider Mill has completed 500 days LTA free and there has been an 80% reduction in LTAs in our Borrisoleigh plant compared with FY2015.
There has been a 35% reduction in all accidents compared with the prior year and staff engagement levels in safety and health continued to increase at every site. Our Wellpark brewery led the way in the Group safety behaviour programme with a 65% increase in staff engagement versus the prior year. Significant improvements were also seen in both Shepton Mallet and Borrisoleigh. Specific focus however continues in Clonmel, which had an increase in LTAs in FY2016.
Site Safety Days have been instrumental in activating a proactive safety culture and in making employees fully aware that they are accountable for their own health and safety as well as for those around them. In particular, high impact lectures delivered by Health and Safety experts continue to be effective. Health and Safety Managers formed a collaborative network across all sites sharing best practices, support and driving engagement.
Occupational health services are offered at all our manufacturing sites to treat work related injuries, provide annual health checks and support health awareness programmes.
The manufacturing sites strive to improve employee engagement through an active programme of team briefs, team building days, safety days and social events which are used to support local clubs and charities.
Employee SupportA focus for FY2016 has been to support those employees who may be leaving the business in the next financial year as a result of the closure of the Shepton Mallet Cider Mill and Borrisoleigh manufacturing sites. A suite of support has been put in place at both sites.
In Shepton we have provided up to £500 per person for external training to strengthen their skills when looking for alternative employment. In addition we are working in partnership with the
Department of Work and Pensions locally to ensure individuals are “job ready”. This will be done through ensuring current skills such as fork lift truck licences or engineering qualifications are up to date. In addition we will provide training for CV writing skills as well as interview techniques. We are also working closely with local employers and recruitment agencies and will be holding a jobs fair on site for those leaving the business to support redeployment in the local area.
In Borrisoleigh, the focus has been on redeployment to Clonmel where 69 additional roles have been created. The business has committed to retraining individuals who wish to transfer to Clonmel as well as an extended trial period and travel support during the period to support a smooth transition. For those leaving the business, a support programme is being put in place to enhance employment opportunities outside of the C&C Group.
Another key focus has been to improve capability in our sales teams across our business. This has taken place through training on a new approach to selling and negotiation skills training. In addition there have been leadership initiatives to further develop our managers across the business.
CORPORATE RESPONSIBILITY (CONTINUED)
OUR POLICY STATES THAT WE DO NOT DISCRIMINATE ON THE BASIS OF AGE, DISABILITY, MARITAL STATUS, ETHNICITY, CREED, SEX OR SEXUAL ORIENTATION. THE POLICY ALSO REQUIRES OUR STAFF TO TREAT CUSTOMERS, SUPPLIERS AND THE WIDER COMMUNITY IN ACCORDANCE WITH THESE PRINCIPLES AS WELL.
52
Governance
...The Board sets the tone for the rest of the Company. We believe that effective governance is the foundation of a successful and sustainable organisation and should be based upon an appropriate level of oversight, clear communication and a commitment to transparency...
Directors’ Statement of Corporate Governance on page 60
IN THIS SECTION
Board of Directors
Directors’ Report
Directors’ Statement of Corporate Governance
Report of the Remuneration Committee on Directors’ Remuneration
Statement of Directors’ Responsibilities
54
56
60
72
91
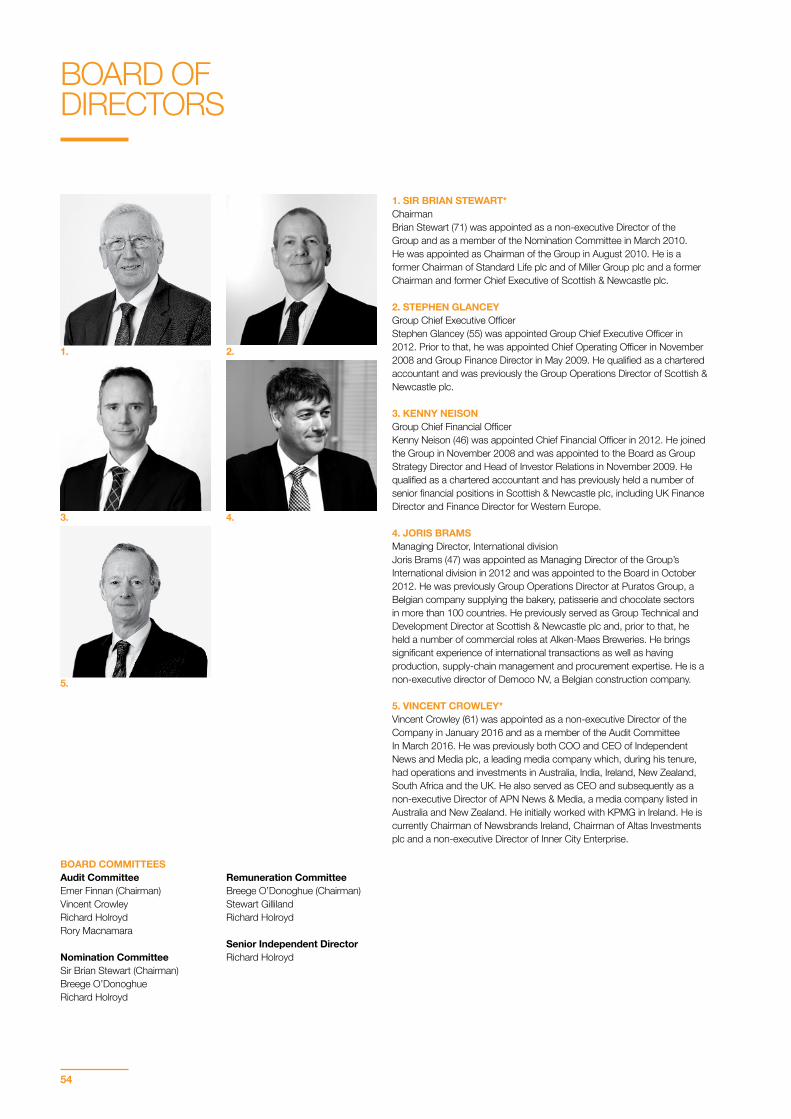
BOARD COMMITTEESAudit CommitteeEmer Finnan (Chairman)Vincent CrowleyRichard HolroydRory Macnamara
Nomination CommitteeSir Brian Stewart (Chairman)Breege O’DonoghueRichard Holroyd
Remuneration CommitteeBreege O’Donoghue (Chairman)Stewart GillilandRichard Holroyd
Senior Independent DirectorRichard Holroyd
BOARD OF DIRECTORS
1. SIR BRIAN STEWART*ChairmanBrian Stewart (71) was appointed as a non-executive Director of the Group and as a member of the Nomination Committee in March 2010. He was appointed as Chairman of the Group in August 2010. He is a former Chairman of Standard Life plc and of Miller Group plc and a former Chairman and former Chief Executive of Scottish & Newcastle plc.
2. STEPHEN GLANCEYGroup Chief Executive Officer Stephen Glancey (55) was appointed Group Chief Executive Officer in 2012. Prior to that, he was appointed Chief Operating Officer in November 2008 and Group Finance Director in May 2009. He qualified as a chartered accountant and was previously the Group Operations Director of Scottish & Newcastle plc.
3. KENNY NEISONGroup Chief Financial OfficerKenny Neison (46) was appointed Chief Financial Officer in 2012. He joined the Group in November 2008 and was appointed to the Board as Group Strategy Director and Head of Investor Relations in November 2009. He qualified as a chartered accountant and has previously held a number of senior financial positions in Scottish & Newcastle plc, including UK Finance Director and Finance Director for Western Europe.
4. JORIS BRAMSManaging Director, International division Joris Brams (47) was appointed as Managing Director of the Group’s International division in 2012 and was appointed to the Board in October 2012. He was previously Group Operations Director at Puratos Group, a Belgian company supplying the bakery, patisserie and chocolate sectors in more than 100 countries. He previously served as Group Technical and Development Director at Scottish & Newcastle plc and, prior to that, he held a number of commercial roles at Alken-Maes Breweries. He brings significant experience of international transactions as well as having production, supply-chain management and procurement expertise. He is a non-executive director of Democo NV, a Belgian construction company.
5. VINCENT CROWLEY*Vincent Crowley (61) was appointed as a non-executive Director of the Company in January 2016 and as a member of the Audit Committee In March 2016. He was previously both COO and CEO of Independent News and Media plc, a leading media company which, during his tenure, had operations and investments in Australia, India, Ireland, New Zealand, South Africa and the UK. He also served as CEO and subsequently as a non-executive Director of APN News & Media, a media company listed in Australia and New Zealand. He initially worked with KPMG in Ireland. He is currently Chairman of Newsbrands Ireland, Chairman of Altas Investments plc and a non-executive Director of Inner City Enterprise.
1.
3.
5.
2.
4.
54

6. EMER FINNAN*Emer Finnan (47) was appointed as a non-executive Director of the Company in May 2014 and became Chairman of the Audit Committee in July 2015. She is a Partner and Senior Managing Director of Kildare Partners, a private equity firm based in London and Dublin, where she is responsible for investment origination. After qualifying as a chartered accountant with KPMG, she worked in investment banking at Citibank and ABN AMRO in London and then NCB Stockbrokers in Dublin. In 2005 she joined EBS Building Society in Ireland, becoming its Finance Director in early 2010. In September 2012, Emer re-joined NCB Stockbrokers to lead a financial services team in Ireland. She joined Kildare Partners in 2013. She brings considerable financial expertise to the Board.
7. STEWART GILLILAND*Stewart Gilliland (59) was appointed as a non-executive Director of the Company and a member of the Remuneration Committee in April 2012. From 2006 to 2010 he was Chief Executive Officer of Müller Dairy (UK) Ltd. Prior to that, he held positions at Whitbread Beer Company and at Interbrew SA in markets including the UK and Ireland, Europe and Canada. He is currently Chairman of Booker Group plc and Curious Drinks Limited and a non-executive Director of Nature’s Way Foods Limited and Mitchells & Butlers. He is a former non-executive director of Tulip Ltd, Vianet Group plc and Sutton & East Surrey Water plc. He brings significant experience of the long alcohol drinks sector in international markets.
8. RICHARD HOLROYD*Richard Holroyd (69) was appointed as a non-executive Director of the Company in 2004 and is a member of the Audit Committee, the Remuneration Committee and the Nomination Committee. He was previously the managing director of Colman’s of Norwich and head of the global marketing futures department of Shell International. He has served as non-executive Director of several companies in the UK and continental Europe and was a member of the UK Competition Commission from September 2001 to April 2010. Richard Holroyd has many years’ experience in the fast moving consumer goods sector.
9. RORY MACNAMARA*Rory Macnamara (61) was appointed as a non-executive Director of the Company in January 2016 and as a member of the Audit Committee In March 2016. He was previously Vice Chairman of Deutsche Morgan Grenfell and subsequently a Managing Director of Lehman Brothers. He initially worked with PriceWaterhouse in the UK. He is currently non-executive Chairman of Dunedin Income Growth Investment Trust plc. He is also a non-executive Director of Alliance Trust plc, Augean plc and Mears Group plc. During his career, he has been Chairman of Mecom Group plc, Dragon-Ukrainian Properties & Development plc, Carpathian plc, Izodia plc and Goshawk Insurance Holdings plc. He has also served as a non-executive Director of Private Equity Investor plc, Raven Mount Group and Sportingbet plc.
10. BREEGE O’DONOGHUE*Breege O’Donoghue (71) was appointed as a non-executive Director of the Company in 2004. She was appointed the Chairman of the Remuneration Committee in December 2012 and is a member of the Nomination Committee. She is an executive director of Penneys/Primark. She is a member of the Outside Appointments Board of the Code of Standards and Behaviour for the Civil Service and a trustee of IBEC, and was previously Chair of the Labour Relations Commission and a Director of An Post and Aer Rianta. Breege has many years’ experience in the Irish and international retail sector.
For information on independence of the Directors, please see Directors’ Statement of Corporate Governance on pages 60 to 71.
* Non-executive Director
DAVID JOHNSTON Company Secretary David Johnston joined the Group in November 2014 as Company Secretary. Prior to that, he was Group General Counsel and Company Secretary for Paddy Power plc. After qualifying as a solicitor, David worked initially for McCann FitzGerald, one of Ireland’s leading law firms and subsequently for O2 Ireland, where he was Chief Legal Counsel and Company Secretary.
6.
8.
10.
7.
9.
C&C GROUP PLC ANNUAL REPORT 2016 GOVERNANCE
55
The Directors present the annual report and audited consolidated financial statements of the Group for the year ended 29 February 2016.
PRINCIPAL ACTIVITIESThe Group’s principal trading activity is the production, marketing and selling of cider and beer, wine, soft drinks and bottled water.
There has been no material change in the nature of the business of the Group.
RESULTSFor the year ended 29 February 2016, the Group reported Revenue of €946.9 million (2015: €986.5 million) and Net Revenue of €662.6 million (2015: €683.9 million). Operating profit before exceptional items amounted to €103.2 million (2015: €115.0 million).
The financial results for the year ended 29 February 2016 are set out in the Group Income Statement on page 98. Comprehensive reviews of the financial and operating performance of the Group are set out in the Operations Review on pages 28 to 37.
DIVIDENDSAn interim dividend of 4.73 cent per share for the year ended 29 February 2016 was paid on 18 December 2015. Subject to approval at the Annual General Meeting, it is proposed to pay a final ordinary dividend of 8.92 cent per share for the year ended 29 February 2016 to shareholders who are registered at close of business on 20 May 2016.
BOARD OF DIRECTORSThe names, functions and date of appointment of the current Directors, who give the responsibility statement on pages 91 and 92, are as follows:
Director Function Appointment
Sir Brian Stewart Chairman 2010Stephen Glancey Group Chief Executive Officer 2008Kenny Neison Group Chief Financial Officer 2009Joris Brams Executive Director 2012Vincent Crowley Non-executive Director 2016Emer Finnan Non-executive Director 2014Stewart Gilliland Non-executive Director 2012Richard Holroyd Non-executive Director 2004Rory Macnamara Non-executive Director 2016Breege O’Donoghue Non-executive Director 2004
John Hogan retired as a Director on 29 February 2016 and Anthony Smurfit retired as a Director on 23 March 2016.
Vincent Crowley and Rory Macnamara were appointed as Directors with effect from 1 January 2016.
INTERESTS OF DIRECTORS AND COMPANY SECRETARYInformation in relation to the beneficial and non-beneficial interests in the share capital of Group companies held by the Directors and Company Secretary who held office at 29 February 2016 is contained within the Report of the Remuneration Committee on Directors’ Remuneration on page 80.
RESEARCH AND DEVELOPMENTCertain Group undertakings are engaged in ongoing research and development aimed at improving processes and expanding product ranges.
FURTHER INFORMATION ON THE GROUPThe information required by section 327 of the Companies Act, 2014 to be included in this report with respect to:
(a) the review of the development and performance of the business and future developments is set out in the Operations Review on pages 28 to 37 and the Strategic Report on pages 18 to 27;
(b) the principal risks and uncertainties which the Company and the Group faces are set out in the Strategic Report on pages 24 to 26;
(c) the key performance indicators relevant to the business of the Group, including environmental and employee matters, are set out in the Strategic Report on pages 22 and 23 and in the Group Chief Financial Officer’s review on pages 38 to 43; and further information in respect of environmental and employee matters is set out in the Report on Corporate Responsibility on pages 44 to 52;
(d) the financial risk management objectives and policies of the Company and the Group, including hedging activities and the exposure of the Company and the Group to financial risk, are set out in the Group Chief Financial Officer’s Review on pages 38 to 43 and note 22 to the financial statements.
The Group’s Viability Statement is contained in the Directors’ Statement on Corporate Governance on page 71.
DIRECTORS’ REPORT
56
ACCOUNTING RECORDSThe measures taken by the Directors to secure compliance with the requirements of Section 282 of the Companies Act, 2014 with regard to the keeping of adequate accounting records are to employ accounting personnel with appropriate expertise and to provide adequate resources to the finance function. The books of account of the Company are maintained at Group offices in Bulmers House, Keeper Road, Crumlin, Dublin 12, D12 K702.
POLITICAL DONATIONSNo political donations were made by the Group during the year that require disclosure in accordance with the Electoral Acts, 1997 to 2002.
CORPORATE GOVERNANCEThe corporate governance statement of the Company for the year, including the main features of the internal control and risk management systems of the Group, is contained in the Directors’ Statement on Corporate Governance on pages 60 to 71.
DIRECTORS’ REMUNERATIONThe Report of the Remuneration Committee on Directors’ Remuneration, including the Company’s policy on Directors’ remuneration, is set out on pages 72 to 90.
SUBSTANTIAL HOLDINGSAs at 29 February 2016 and 11 May 2016, details of interests over 3% in the ordinary share capital carrying voting rights which have been notified to the Company are:
No. of ordinary shares held as
notified at 29 February 2016
% at 29 February 2016
No. of ordinary shares held as
notified at 11 May 2016
% at 11 May 2016
Franklin Templeton Institutional, LLC 34,269,709 10.70% 31,684,909 9.97%FMR LLC 27,324,770 8.54% 24,005,201 7.55%Wellington Management Company, LLP 23,518,363 7.35% 18,933,189 5.96%Southeastern Asset Management, Inc. 23,016,502 7.19% 26,560,969 8.36%Investec Asset Management Limited 16,403,623 5.12% 16,403,623 5.16%Brandes Investment Partners, L.P. 13,879,876 4.34% 16,510,218 5.20%Setanta Asset Management Limited 13,746,411 4.29% 13,746,411 4.33%Prudential plc 12,538,100 3.92% 12,538,100 3.95%LSV Asset Management 9,961,411 3.11% 9,961,411 3.13%As far as the Company is aware, other than as stated below, no other person or company had at 29 February 2016 or 11 May 2016 an interest in 3% or more of the Company’s share capital carrying voting rights.
SHARE PRICEThe price of the Company’s ordinary shares as quoted on the Irish Stock Exchange at the close of business on 29 February 2016 was €3.446 (28 February 2015: €3.861). The price of the Company’s ordinary shares ranged between €3.31 and €4.07 during the year. AUDITORIn accordance with Section 383(2) of the Companies Act, 2014, the auditor, KPMG, Chartered Accountants, will continue in office.
ISSUE OF SHARES AND PURCHASE OF OWN SHARESAt the Annual General Meeting held on 2 July 2015, the Directors received a general authority to allot shares. A limited authority was also granted to Directors to allot shares for cash otherwise than in accordance with statutory pre-emption rights. Resolutions will be proposed at the Annual General Meeting to be held on 7 July 2016 to allot shares to a nominal amount which is equal to approximately one-third of the issued ordinary share capital of the Company. In addition, a resolution will also be proposed to allow the Directors allot shares for cash otherwise than in accordance with statutory pre-emption rights up to an aggregate nominal value which is equal to approximately 5% of the nominal value of the issued share capital of the Company, and in the event of a rights issue. If granted, these authorities will expire at the conclusion of the Annual General Meeting in 2017 and the date 18 months after the passing of the resolution, whichever is the earlier.
C&C GROUP PLC ANNUAL REPORT 2016 GOVERNANCE
57
The Directors have currently no intention to issue shares pursuant to these authorities except for issues of ordinary shares under the Company’s share option plans and the Company’s scrip dividend scheme. At the Annual General Meeting held on 2 July 2015 authority was granted to purchase up to 10% of the Company’s Ordinary Shares (the “Repurchase Authority”). As at the date of this Report, the Group has purchased 6.86% of the Company’s Ordinary Shares pursuant to the Repurchase Authority.
The Group spent €76.6m (including commission and related costs) in the year under review in purchasing 20,846,900 of the Company’s Ordinary Shares.
Special resolutions will be proposed at the Annual General Meeting to be held on 7 July 2016 to renew the authority of the Company, or any of its subsidiaries, to purchase up to 10% of the Company’s Ordinary Shares in issue at the date of the Annual General Meeting and in relation to the maximum and minimum prices at which treasury shares (effectively shares purchased and not cancelled) may be re-issued off-market by the Company. If granted, the authorities will expire on the earlier of the date of the Annual General Meeting in 2017 and the date 18 months after the passing of the resolution. The minimum price which may be paid for shares purchased by the Company shall not be less than the nominal value of the shares and the maximum price will be 105% of the average market price of such shares over the preceding five days. The Directors will only exercise the power to purchase shares if they consider it to be in the best interests of the Company and its shareholders.
Options to subscribe for a total of 3,748,957 Ordinary Shares are outstanding, representing 1.18% of the Company’s total voting rights. If the authority to purchase Ordinary Shares were used in full, the options would represent 1.31% of the Company’s total voting rights.
DILUTION LIMITS AND TIME LIMITSAll employee share plans with the exception of the Joint Share Ownership Plan, which was specifically approved by shareholders in December 2008, contain the share dilution limits recommended in institutional guidance, namely that no awards shall be granted which would cause the number of Shares issued or issuable pursuant to awards granted in the ten years ending with the date of grant (a) under any discretionary or executive share scheme adopted by the Company (other than the Joint Share Ownership Plan) to exceed 5%, and (b) under any employees’ share scheme adopted by the Company (other than the Joint Share Ownership Plan) to exceed 10%, of the ordinary share capital of the Company in issue at that time.
In the ten year period up to the date of this report, commitments to issue new shares or re-issue treasury shares under discretionary share schemes (net of lapsed and forfeited commitments and excluding the Joint Share Ownership Plan) amounted to 2.50% of the Company’s issued ordinary share capital as at the date of this report. No additional commitments to issue shares have been made under non-discretionary schemes.
THE EUROPEAN COMMUNITIES (TAKEOVER BIDS (DIRECTIVE 2004/25/EC)) REGULATIONS 2006Structure of the Company’s share capitalAt 11 May 2016 the Company has an issued share capital of 326,773,664 ordinary shares of €0.01 each and an authorised share capital of 800,000,000 ordinary shares of €0.01 each.
At 29 February 2016 and at the date of this report the trustee of the C&C Employee Trust held 7,353,947 ordinary shares of €0.01 each in the capital of the Company, including shares held jointly by it under the terms of the C&C Joint Share Ownership Plan (further information on which is contained in note 4 (Share-Based Payments) to the financial statements). Shares held by the trustee of the C&C Employee Trust are accounted for as if they were treasury shares. These shares are, however, included in the calculation of Total Voting Rights for the purposes of Regulation 20 of the Transparency (Directive 2004/109/EC) Regulations 2007 (“TVR Calculation”).
As at 29 February 2016 and as at the date of this report, a subsidiary of the Group held 9,025,000 shares in the Company, which were acquired under the authority granted to the Company and its subsidiaries to purchase up to 10% of the Company’s ordinary shares approved at the 2015 Annual General Meeting. These shares are not included in the TVR Calculation and are accounted for as treasury shares.
Details of employee share schemes, and the rights attaching to shares held in these schemes, can be found in note 4 (Share-Based Payments) to the financial statements and the Report of the Remuneration Committee on Directors’ Remuneration on pages 72 to 90. Details of the rights attaching to shares issued under the Joint Share Ownership Plan are set out in note 4 (Share-Based Payments) to the financial statements.
The Company has no securities in issue conferring special rights with regard to control of the Company.
Details of persons with a significant holding of securities in the Company are set out on page 57.
Rights and obligations attaching to the Ordinary SharesAll Ordinary Shares rank pari passu, and the rights attaching to the Ordinary Shares (including as to voting and transfer) are as set out in the Company’s Articles of Association (“Articles”). A copy of the Articles may be obtained on request to the Company Secretary.
Holders of Ordinary Shares are entitled to receive duly declared dividends in cash or, when offered, additional Ordinary Shares. In the event of any surplus arising on the occasion of the liquidation of the Company, shareholders would be entitled to a share in that surplus pro rata to their holdings of Ordinary Shares.
Holders of Ordinary Shares are entitled to receive notice of and to attend, speak and vote in person or by proxy, at general meetings having, on a show of hands, one vote, and, on a poll, one vote for each Ordinary Share held. Procedures and deadlines for
DIRECTORS’ REPORT (CONTINUED)
58
entitlement to exercise, and exercise of, voting rights are specified in the notice convening the general meeting in question. There are no restrictions on voting rights except in the circumstances where a “Specified Event” (as defined in the Articles) shall have occurred and the Directors have served a restriction notice on the shareholder. Upon the service of such restriction notice, no holder of the shares specified in the notice shall, for so long as such notice shall remain in force, be entitled to attend or vote at any general meeting, either personally or by proxy.
Holding and transfer of Ordinary SharesThe Ordinary Shares may be held in either certificated or uncertificated form (through CREST). Save as set out below, there is no requirement to obtain the approval of the Company, or of other shareholders, for a transfer of Ordinary Shares. The Directors may decline to register (a) any transfer of a partly-paid share to a person of whom they do not approve, (b) any transfer of a share to more than four joint holders, and (c) any transfer of a certificated share unless accompanied by the share certificate and such other evidence of title as may reasonably be required. The registration of transfers of shares may be suspended at such times and for such periods (not exceeding 30 days in each year) as the Directors may determine.
Transfer instruments for certificated shares are executed by or on behalf of the transferor and, in cases where the share is not fully paid, by or on behalf of the transferee. Transfers of uncertificated shares may be effected by means of a relevant system in the manner provided for in the Companies Act, 1990 (Uncertificated Securities) Regulations, 1996 (the “CREST Regulations”) and the rules of the relevant system. The Directors may refuse to register a transfer of uncertificated shares only in such circumstances as may be permitted or required by the CREST Regulations.
Rules concerning the appointment and replacement of the Directors and amendment of the Company’s ArticlesUnless otherwise determined by ordinary resolution of the Company, the number of Directors shall not be less than two or more than 14. Subject to that limit, the shareholders in general meeting may appoint any person to be a Director either to fill a vacancy or as an additional Director. The Directors also have the power to co-opt additional persons as Directors, but any Director so co-opted is under the Articles required to be submitted to shareholders for re-election at the first Annual General Meeting following his or her co-option.
The Articles require that at each Annual General Meeting of the Company one-third of the Directors retire by rotation. However, in accordance with the recommendations of the UK Corporate Governance Code, the Directors have resolved they will all retire and submit themselves for re-election by the shareholders at the Annual General Meeting to be held this year.
The Company’s Articles may be amended by special resolution (75% majority of votes cast) passed at general meeting.
Powers of DirectorsUnder its Articles, the business of the Company shall be managed by the Directors, who exercise all powers of the Company as are not, by the Companies Acts or the Articles, required to be exercised by the Company in general meeting.
The powers of Directors in relation to issuing or buying back by the Company of its shares are set out above under “Issue of Shares and Purchase of Own Shares”.
MiscellaneousCertain of the Group’s borrowing facilities include provisions that, in the event of a change of control of the Company, could oblige the Group to repay the facilities. Certain of the Company’s customer and supplier contracts and joint venture arrangements also contain provisions that would allow the counterparty to terminate the agreement in the event of a change of control of the Company, but none of these are considered to be significant in terms of their potential impact on the business of the Group as a whole. The Company’s Executive Share Option Scheme and Long-Term Incentive Plan each contain change of control provisions which allow for the acceleration of the exercise of share options/awards in the event of a change of control of the Company.
There are no agreements between the Company and its Directors or employees providing for compensation for loss of office or employment (whether through resignation, purported redundancy or otherwise) that occurs because of a takeover bid in excess of their normal contractual entitlement.
ANNUAL GENERAL MEETINGYour attention is drawn to the letter to shareholders and the notice of meeting accompanying this report which set out details of the matters which will be considered at the Annual General Meeting.
SignedOn behalf of the Board
Sir Brian Stewart Stephen Glancey Chairman Group Chief Executive Officer11 May 2016
C&C GROUP PLC ANNUAL REPORT 2016 GOVERNANCE
59
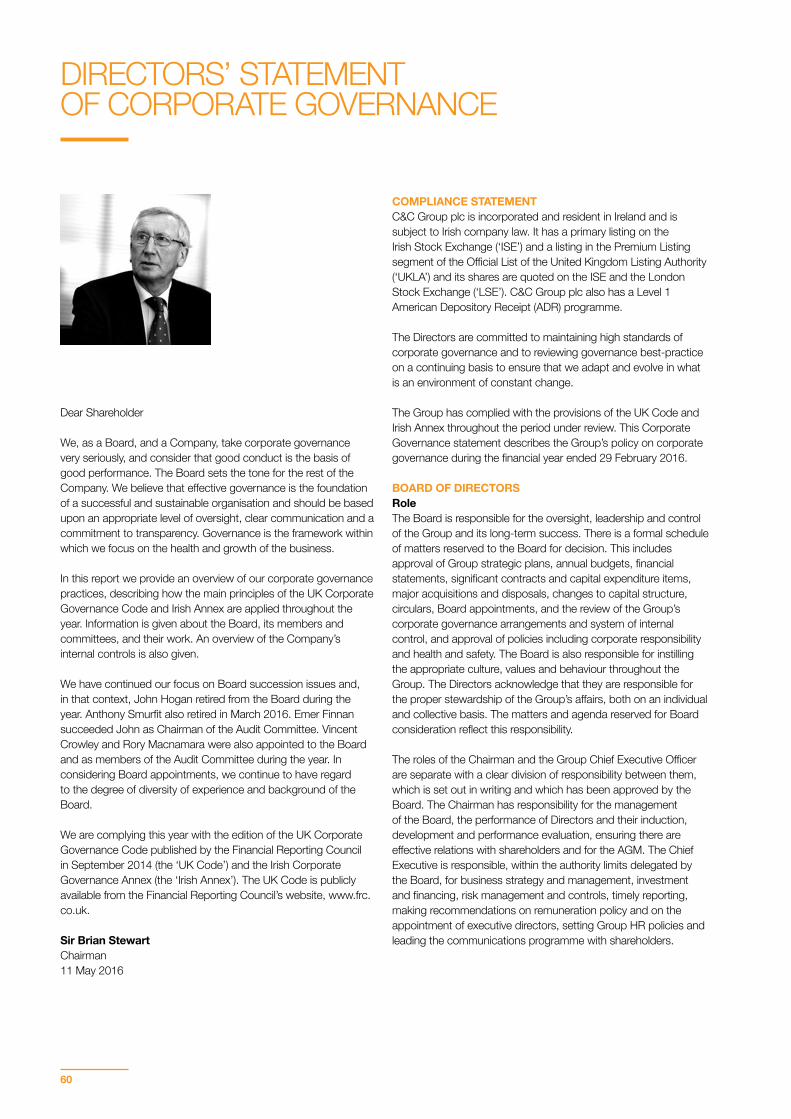
Dear Shareholder
We, as a Board, and a Company, take corporate governance very seriously, and consider that good conduct is the basis of good performance. The Board sets the tone for the rest of the Company. We believe that effective governance is the foundation of a successful and sustainable organisation and should be based upon an appropriate level of oversight, clear communication and a commitment to transparency. Governance is the framework within which we focus on the health and growth of the business.
In this report we provide an overview of our corporate governance practices, describing how the main principles of the UK Corporate Governance Code and Irish Annex are applied throughout the year. Information is given about the Board, its members and committees, and their work. An overview of the Company’s internal controls is also given.
We have continued our focus on Board succession issues and, in that context, John Hogan retired from the Board during the year. Anthony Smurfit also retired in March 2016. Emer Finnan succeeded John as Chairman of the Audit Committee. Vincent Crowley and Rory Macnamara were also appointed to the Board and as members of the Audit Committee during the year. In considering Board appointments, we continue to have regard to the degree of diversity of experience and background of the Board.
We are complying this year with the edition of the UK Corporate Governance Code published by the Financial Reporting Council in September 2014 (the ‘UK Code’) and the Irish Corporate Governance Annex (the ‘Irish Annex’). The UK Code is publicly available from the Financial Reporting Council’s website, www.frc.co.uk.
Sir Brian Stewart Chairman11 May 2016
COMPLIANCE STATEMENTC&C Group plc is incorporated and resident in Ireland and is subject to Irish company law. It has a primary listing on the Irish Stock Exchange (‘ISE’) and a listing in the Premium Listing segment of the Official List of the United Kingdom Listing Authority (‘UKLA’) and its shares are quoted on the ISE and the London Stock Exchange (‘LSE’). C&C Group plc also has a Level 1 American Depository Receipt (ADR) programme.
The Directors are committed to maintaining high standards of corporate governance and to reviewing governance best-practice on a continuing basis to ensure that we adapt and evolve in what is an environment of constant change.
The Group has complied with the provisions of the UK Code and Irish Annex throughout the period under review. This Corporate Governance statement describes the Group’s policy on corporate governance during the financial year ended 29 February 2016.
BOARD OF DIRECTORSRoleThe Board is responsible for the oversight, leadership and control of the Group and its long-term success. There is a formal schedule of matters reserved to the Board for decision. This includes approval of Group strategic plans, annual budgets, financial statements, significant contracts and capital expenditure items, major acquisitions and disposals, changes to capital structure, circulars, Board appointments, and the review of the Group’s corporate governance arrangements and system of internal control, and approval of policies including corporate responsibility and health and safety. The Board is also responsible for instilling the appropriate culture, values and behaviour throughout the Group. The Directors acknowledge that they are responsible for the proper stewardship of the Group’s affairs, both on an individual and collective basis. The matters and agenda reserved for Board consideration reflect this responsibility.
The roles of the Chairman and the Group Chief Executive Officer are separate with a clear division of responsibility between them, which is set out in writing and which has been approved by the Board. The Chairman has responsibility for the management of the Board, the performance of Directors and their induction, development and performance evaluation, ensuring there are effective relations with shareholders and for the AGM. The Chief Executive is responsible, within the authority limits delegated by the Board, for business strategy and management, investment and financing, risk management and controls, timely reporting, making recommendations on remuneration policy and on the appointment of executive directors, setting Group HR policies and leading the communications programme with shareholders.
DIRECTORS’ STATEMENT OF CORPORATE GOVERNANCE
60
The Board delegates responsibility for the management of the Group through the Group Chief Executive Officer to executive management. The Board also delegates some of its responsibilities to Board Committees, details of which are set out below. The responsibilities of the Chairman are covered in detail below.
The Chief Executive has full day-to-day operational and profit responsibility for the Group and is accountable to the Board for all authority delegated to executive management. His overall brief is to execute agreed strategy, to co-ordinate and maintain the continued profitability of the Group and to oversee senior management responsible for the day-to-day running of the business.
Non-executive Directors are expected to constructively challenge management proposals and to examine and review management performance in meeting agreed objectives and targets. In addition, they are expected to draw on their own specific experience and knowledge in respect of any challenges facing the Group and in relation to the development of proposals on strategy.
Individual Directors may seek independent professional advice at the Company’s expense where they judge it necessary to discharge their responsibilities as Directors.
The Group has a policy in place which indemnifies the Directors in respect of certain legal actions taken against them.
Board Composition, Membership and RenewalThe Board considers that, between them, the Directors bring a range of skills, knowledge and experience so as to provide leadership, control and oversight of the Group and discharge their responsibility to all shareholders. The biographical details of the current Directors are set out on pages 54 and 55. The Board regards the number of non-executive Directors currently appointed to the Board as sufficient to ensure satisfactory oversight of the Group’s management and to enable its Committees to operate without undue reliance on individual non-executive Directors. The Board has an ongoing programme for Board refreshment and renewal, recognising the need for independence and diversity, including gender diversity, on the Board.
The Board is comprised of ten Directors, of whom three are executive and seven are non-executive Directors (including the Chairman). Consistent with our commitment to Board refreshment and development, John Hogan retired from the Board during the year and Vincent Crowley and Rory Macnamara were appointed as Directors. Anthony Smurfit retired in March 2016. John was succeeded as Chairman of the Audit Committee by Emer Finnan. Emer is a qualified chartered accountant and brings considerable financial expertise to the role of Audit Committee Chairman.
Board IndependenceIn line with the UK Code, it is Board policy that at least half the Board, excluding the Chairman, shall consist of independent non-executive Directors. The Board has reviewed its composition and has determined that of the Directors as at 29 February 2016, Emer Finnan, Richard Holroyd, Breege O’Donoghue, Stewart Gilliland, Rory Macnamara and Vincent Crowley are independent.
The independence of Board members is considered annually. In determining the independence of non-executive Directors, the Board considered the principles relating to independence contained in the UK Code and the guidance provided by a number of shareholder voting agencies. Those principles and guidance address a number of factors that might appear to affect the independence of Directors, including former service as an executive of the Group, extended service to the Board and cross-directorships. However, they also make clear that a Director may be considered independent notwithstanding the presence of one or more of these factors. This reflects the Board’s view that independence is determined by a Director’s character and judgement. The Board considers that each of the non-executive Directors brings independent judgement to bear.
In the case of Richard Holroyd and Breege O’Donoghue, the Board has considered their length of service but is satisfied that their independence is not compromised. The Board also recognises that their professional experience and long-term perspective on the Group’s business is very important to the work of the Board. As part of this assessment, the Board considers that, while each of them has served on the Board of the Company since 2004, none of them has served for more than nine years concurrently with the same executive Directors. As set out in the table below, each has served on the Board concurrently with the Group’s Chief Executive Officer, the longest serving executive Director, for 7.5 years. The Board recognises the principles of the Code and guidelines on tenure but is satisfied that the objectivity, judgements and independence of each of the Directors is not compromised by tenure on the Board. The Board also has an ongoing programme of Board refreshment and renewal and has appointed three new Directors in the past two years, with two Directors also having retired in 2016.
C&C GROUP PLC ANNUAL REPORT 2016 GOVERNANCE
61

Independent/Non-Independent
Tenure (Years)
Concurrent Tenure*(Years)
Sir Brian Stewart Independent (Chairman)
6 6
Vincent Crowley Independent 0.5 0.5Joris Brams Non-Independent
(Executive)3.5 3.5
Emer Finnan Independent 2 2Stewart Gilliland Independent 4 4Stephen Glancey Non-Independent
(Executive)7.5 7.5
Richard Holroyd Independent 12 7.5Rory Macnamara Independent 0.5 0.5Kenny Neison Non-Independent
(Executive)6.5 6.5
Breege O’Donoghue Independent 12 7.5
*Note: Concurrent tenure means tenure on the Board concurrently with the Group’s Chief Executive Officer, the longest serving executive Director.
ChairmanSir Brian Stewart has been Chairman of the Group since August 2010. The Chairman is responsible for the efficient and effective working of the Board. He is responsible for ensuring that the Board considers the key strategic issues facing the Group and that the Directors receive accurate, timely, relevant and clear information. He also ensures that there is effective communication with shareholders and that the Board is apprised of the views of the Group’s shareholders. As part of this process, the Chairman recently completed a series of meetings, focused solely on corporate governance, with a number of the Group’s largest institutional shareholders.
Senior Independent DirectorRichard Holroyd is the Group’s Senior Independent Director. He is available to shareholders who have concerns for which contact through the normal channels of Chairman, Group Chief Executive Officer or Group Chief Financial Officer has failed to resolve or for which such contact is inappropriate. He is also available to meet shareholders on request.
Audit Committee Financial ExpertThe Audit Committee has determined that Emer Finnan, who also chairs the Committee, is the Audit Committee financial expert. Emer is a qualified chartered accountant and has recent and relevant financial expertise.
Company SecretaryDavid Johnston is the Company Secretary. All Directors have access to the Company Secretary, who is responsible to the Board for ensuring that Board procedures are complied with. The appointment and removal of the Company Secretary is a matter for the Board.
Appointment, Retirement and Re-electionThe non-executive Directors are engaged under the terms of letters of appointment, details of which are set out in the Report of the Remuneration Committee on Directors’ Remuneration. Copies of the letters of appointment are available on request from the Company Secretary.
The Company’s Articles of Association require that at least one-third of the Directors subject to rotation shall retire by rotation at the Annual General Meeting in every year. Directors appointed by the Board must also submit themselves for election at the first annual general meeting following their appointment. However, in accordance with the recommendations of the UK Code, the Directors have resolved that they will all retire and submit themselves for re-election by the shareholders at the Annual General Meeting this year.
Induction and DevelopmentA comprehensive tailored induction programme is arranged for each new Director. The aim of the programme is to provide the Director with a detailed insight into the Group. The programme involves meeting with the Chairman, Group Chief Executive Officer, Group Chief Financial Officer, Company Secretary and key senior executives. It covers areas such as strategy and development, organisation structure, succession planning, financing, corporate responsibility and compliance, investor relations and risk management. The Board receives regular updates from its external legal and other advisers in relation to regulatory and accounting developments. Throughout the year, Directors meet with key executives and meet with local management teams, and a site visit for all Board Directors to one of the Group’s production facilities is normally scheduled annually.
Newly-appointed members of the Audit Committee will meet with the key members of the external audit, internal audit and finance teams. New members of the Remuneration Committee will meet with the Committee’s remuneration consultants in the year of their appointment to the Committee.
External non-executive directorshipsThe Board recognises that there can be benefit if executive Directors accept a non-executive directorship with other companies to broaden their skills, knowledge and experience. Joris Brams is currently a non-executive director at Democo NV, a Belgian construction company.
DIRECTORS’ STATEMENT OF CORPORATE GOVERNANCE (CONTINUED)
62
Apart from him, currently none of the executive Directors has such an appointment. The Remuneration Committee determines whether Directors should be permitted to retain any fees paid in respect of such appointments. The Remuneration Committee has determined that Joris Brams is permitted to retain fees from his appointment.
MeetingsDuring the period under review there were seven scheduled meetings of the Board and a further four short notice meetings. Details of Directors’ attendance at these meetings are set out in the table on page 69. Several ad hoc meetings without notice were held during the year for share allotment and other administrative matters in accordance with the Board’s procedures. In addition, the members of the Board met without the executive Directors present to provide an opportunity for non-executive Directors and the Chairman to assess their performance, and a further meeting of the non-executive Directors led by the Senior Independent Director was held without the Chairman being present to assess the Chairman’s performance.
The Chairman sets the agenda for each meeting in consultation with the Group Chief Executive Officer and the Company Secretary. The agenda and Board papers, which provide the Directors with relevant information to enable them to fully consider the agenda items in advance, are circulated prior to each meeting. Directors are encouraged to participate in debate and constructive challenge. While Directors are expected to attend all scheduled meetings, in the event a Director is unable to attend a meeting, his or her view on all agenda items is sought and conveyed to the Chairman in advance of the meeting. In addition, following the meeting, matters discussed and decisions made at the meeting are conveyed to the Director.
Performance evaluationThe Board recognises the importance of a formal and rigorous evaluation of the performance of the Board and its Committees. The Chairman conducts an annual review of corporate governance and the operation and performance of the Board and its Committees. In the year under review the Chairman has reviewed the performance of individual Directors and, within the remit of the Nomination Committee, succession planning, identifying in this process the experience and qualities required by the Group for the future implementation of its strategy.
The Chairman conducts one to one discussions each year with each Director to assess his or her individual performance. Performance is assessed against a number of criteria, including his or her contribution to Board and Committee meetings; time commitments; contribution to strategic developments; and relationships with other Directors and management.
The Senior Independent Director and the other non-executive Directors review the Chairman’s performance and the Board’s performance each year, the results being reported back to the Chairman with any recommendations.
In 2015 the Board also engaged an external advisor to complete an independent evaluation of the performance and effectiveness of the Board and each of the Committees. This evaluation is in line with the recommendations of the UK Code which requires an external Board evaluation to be conducted at least once every three years. The company engaged to perform the evaluation has no business connection or relationship with the Group, its directors or senior management.
RemunerationDetails of remuneration paid to Directors (executive and non-executive) are set out in the Report of the Remuneration Committee on Directors’ Remuneration on pages 72 to 90.
Non-executive Directors are remunerated by way of a Director’s fee. Additional fees are also payable to the Chairman of the Audit Committee, Chairman of the Remuneration Committee and to the Senior Independent Director. Non-executive Directors’ fees and additional fees payable to Committee Chairmen and the Senior Independent Director have not been increased since 2008.
It is Board policy that non-executive Director remuneration does not comprise any performance-related element and, therefore, non-executive Directors are not eligible to participate in the Group’s bonus schemes, option plans or share award schemes. Non-executive Directors’ fees are not pensionable and non-executive Directors are not eligible to join any Group pension plans. Executive Directors’ remuneration is inclusive of any Director’s fee.
The current limit under the Articles on Directors’ ordinary remuneration (i.e. directors’ fees, not including executive remuneration) is €1,000,000, pursuant to a resolution passed at the 2013 Annual General Meeting.
The report of the Remuneration Committee will be presented to shareholders for the purposes of a non-binding advisory vote at the Annual General Meeting on 7 July 2016. While there is no legal obligation for the Group to put such a resolution to a vote of shareholders at the Annual General Meeting, the Board recognises that such resolutions are now considered good governance practice.
C&C GROUP PLC ANNUAL REPORT 2016 GOVERNANCE
63
Share ownership and dealingThe Company has share ownership guidelines for the executive Directors to ensure the interests of executive Directors are aligned with those of shareholders. In summary, the guidelines are that the current market value of shares in the Company held by the relevant Director should be at least two times salary for the Group Chief Executive Officer and one times salary for other executive Directors. If share ownership guidelines are not met, then individuals must retain up to 50% of vested share awards (net of tax). Further information including details of Directors’ shareholdings is set out on page 80.
The Group has a policy on dealing in shares that applies to all Directors and senior management. This policy adopts the terms of the Model Code as set out in the Listing Rules published by the UK Listing Authority and the Irish Stock Exchange. Under this policy, Directors are required to obtain clearance from the Chairman (or in the case of the Chairman himself, from the Senior Independent Director) before dealing. Directors and senior management are prohibited from dealing in the Company’s shares during close periods and at any other time when the individual is in possession of inside information.
COMMITTEESThe Board has established three permanent committees to assist in the execution of its responsibilities. These are the Audit Committee, the Nomination Committee and the Remuneration Committee. The current membership of each committee is set out on page 54. Attendance at meetings held is set out in the table on page 69.
Each of the permanent Board Committees has terms of reference under which authority is delegated to them by the Board. These terms of reference are available on the Company’s website www.candcgroupplc.com. Minutes of all Committee meetings are circulated to the entire Board.
The Chairman of each committee attends the Annual General Meeting and is available to answer questions from shareholders.
The Board has also established a Disclosure Committee comprising the Chairman, the Group Chief Executive Officer, the Group Chief Financial Officer and the Company Secretary. The Head of Investor Relations may also participate where required. The main responsibilities of the Disclosure Committee include:• determining whether information constitutes inside information;• determining a consistent approach and policy to disclosure;• reviewing and approving material announcements;• monitoring leaks, rumours, speculation and market expectations,
and taking appropriate action;• monitoring the materiality of any variance between the Group’s
performance and its own forecasts;• maintaining a record of C&C’s regulatory disclosures.
Ad hoc committees are formed from time to time to deal with other specific matters.
DIRECTORS’ STATEMENT OF CORPORATE GOVERNANCE (CONTINUED)
64
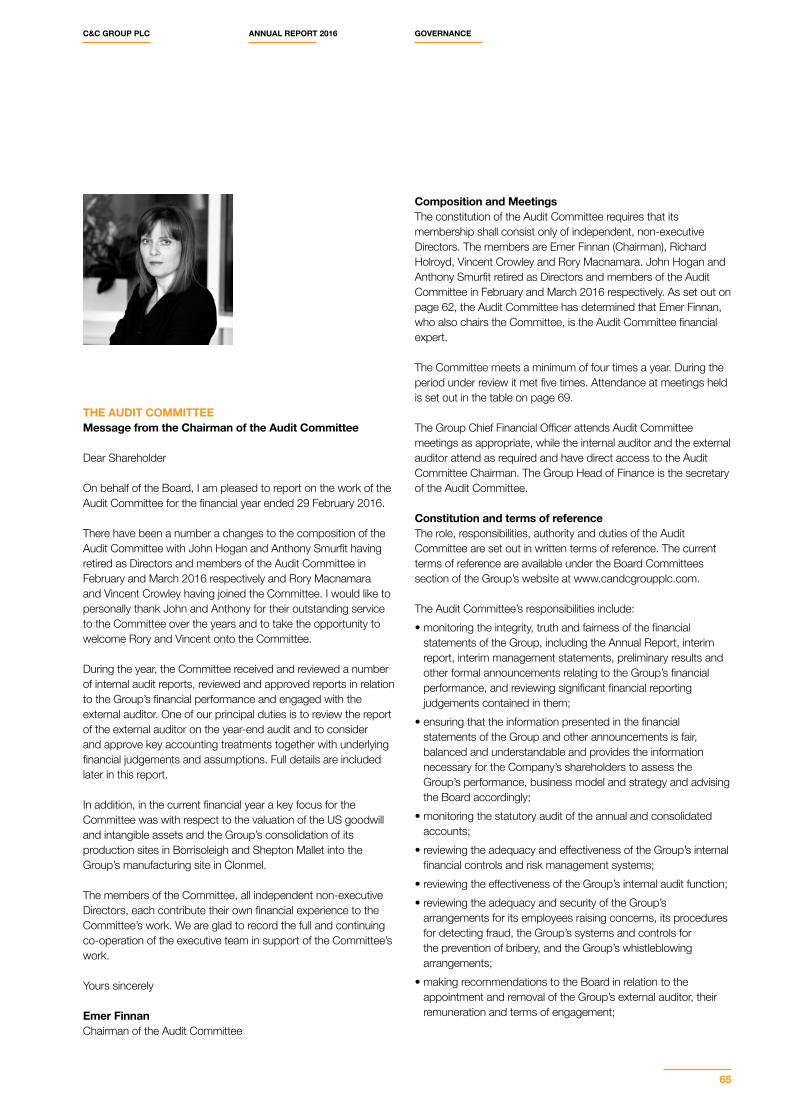
THE AUDIT COMMITTEE Message from the Chairman of the Audit Committee
Dear Shareholder
On behalf of the Board, I am pleased to report on the work of the Audit Committee for the financial year ended 29 February 2016.
There have been a number a changes to the composition of the Audit Committee with John Hogan and Anthony Smurfit having retired as Directors and members of the Audit Committee in February and March 2016 respectively and Rory Macnamara and Vincent Crowley having joined the Committee. I would like to personally thank John and Anthony for their outstanding service to the Committee over the years and to take the opportunity to welcome Rory and Vincent onto the Committee.
During the year, the Committee received and reviewed a number of internal audit reports, reviewed and approved reports in relation to the Group’s financial performance and engaged with the external auditor. One of our principal duties is to review the report of the external auditor on the year-end audit and to consider and approve key accounting treatments together with underlying financial judgements and assumptions. Full details are included later in this report.
In addition, in the current financial year a key focus for the Committee was with respect to the valuation of the US goodwill and intangible assets and the Group’s consolidation of its production sites in Borrisoleigh and Shepton Mallet into the Group’s manufacturing site in Clonmel.
The members of the Committee, all independent non-executive Directors, each contribute their own financial experience to the Committee’s work. We are glad to record the full and continuing co-operation of the executive team in support of the Committee’s work.
Yours sincerely
Emer FinnanChairman of the Audit Committee
Composition and MeetingsThe constitution of the Audit Committee requires that its membership shall consist only of independent, non-executive Directors. The members are Emer Finnan (Chairman), Richard Holroyd, Vincent Crowley and Rory Macnamara. John Hogan and Anthony Smurfit retired as Directors and members of the Audit Committee in February and March 2016 respectively. As set out on page 62, the Audit Committee has determined that Emer Finnan, who also chairs the Committee, is the Audit Committee financial expert.
The Committee meets a minimum of four times a year. During the period under review it met five times. Attendance at meetings held is set out in the table on page 69.
The Group Chief Financial Officer attends Audit Committee meetings as appropriate, while the internal auditor and the external auditor attend as required and have direct access to the Audit Committee Chairman. The Group Head of Finance is the secretary of the Audit Committee.
Constitution and terms of referenceThe role, responsibilities, authority and duties of the Audit Committee are set out in written terms of reference. The current terms of reference are available under the Board Committees section of the Group’s website at www.candcgroupplc.com.
The Audit Committee’s responsibilities include:• monitoring the integrity, truth and fairness of the financial
statements of the Group, including the Annual Report, interim report, interim management statements, preliminary results and other formal announcements relating to the Group’s financial performance, and reviewing significant financial reporting judgements contained in them;
• ensuring that the information presented in the financial statements of the Group and other announcements is fair, balanced and understandable and provides the information necessary for the Company’s shareholders to assess the Group’s performance, business model and strategy and advising the Board accordingly;
• monitoring the statutory audit of the annual and consolidated accounts;
• reviewing the adequacy and effectiveness of the Group’s internal financial controls and risk management systems;
• reviewing the effectiveness of the Group’s internal audit function;• reviewing the adequacy and security of the Group’s
arrangements for its employees raising concerns, its procedures for detecting fraud, the Group’s systems and controls for the prevention of bribery, and the Group’s whistleblowing arrangements;
• making recommendations to the Board in relation to the appointment and removal of the Group’s external auditor, their remuneration and terms of engagement;
C&C GROUP PLC ANNUAL REPORT 2016 GOVERNANCE
65
• evaluating the performance of the external auditor including their independence and objectivity;
• reviewing the annual internal and external audit plans and reviewing the effectiveness and findings of the external audit with the external auditor;
• ensuring compliance with the Group’s policy on the provision of non-audit services by the external auditor;
• reporting to the Board on how it has discharged its responsibilities; and
• reviewing the annual financial statements of the pension funds where not reviewed by the Board as a whole.
The Committee undertakes, in conjunction with the Chairman of the Board, an annual assessment of its performance and a review of the Committee’s constitution and terms of reference.
The activities undertaken by the Committee in fulfilling its key responsibilities in respect of the year ended 29 February 2016 are set out below.
Financial StatementsIn respect of the year ended 29 February 2016 the Audit Committee reviewed: • the Interim Management Statement issued in July 2015;• the Financial Report for the six months ended 31 August 2015; • the trading update for the twelve months to 29 February 2016,
issued in March 2016;• the preliminary results announcement and the Annual Report
and financial statements for the year ended 29 February 2016.
In particular the Committee addressed the going concern status of the Company and the matters referred to in the Financial Review contained in the 2016 Annual Report. It reviewed the post-audit report from the external auditor identifying any accounting or judgemental issues requiring its attention.
In carrying out these reviews, the Committee considered:• the consistency of, and any changes to, accounting policies
both on a year on year basis and across the Group;• whether the Group had applied appropriate accounting policies
and practices and made appropriate estimates and judgements, taking into account the views of the external auditor;
• the methods used to account for significant or unusual transactions where different approaches are possible;
• whether the Annual Report, taken as a whole, is fair, balanced and understandable and provides the information necessary for shareholders to assess the Group’s performance, business model and strategy;
• the clarity and completeness of disclosures and compliance with relevant financial reporting standards and corporate governance and regulatory requirements; and
• the significant areas in which judgement had been applied in preparation of the financial statements in accordance with the accounting policies.
The significant issues considered by the Committee in relation to the accounts for the year to 29 February 2016 and how these were addressed are outlined below. Each of these areas received particular focus from the external auditor, who provided detailed analysis and assessment of the matter in their report to the Committee.
Goodwill & intangible assets impairment testingThe Committee considered the carrying value of goodwill and intangible assets as at the year-end date to assess whether or not it exceeded the expected recoverable amounts for these assets. In particular the Committee considered the value-in-use financial models, including sensitivity analysis, used to support the valuation and the key assumptions and judgements used by management underlying these models. The Committee considered the outcome of the financial models and found the methodology to be robust, and in all instances concluded that the outcome was appropriate.
Valuation of property, plant & equipmentThe Group values its land and buildings and plant machinery at market value/depreciated replacement cost (DRC) and consequently carries out an annual valuation. The Group engages external valuers to value the Group’s property, plant and machinery every three years or as at the date of acquisition for assets acquired as part of a business acquisition. The Group completed an external valuation in the current financial year for the Borrisoleigh and Shepton Mallet sites as a consequence of the Group’s announced consolidation of its production sites in Borrisoleigh and Shepton Mallet into the Group’s manufacturing site in Clonmel. An internal assessment was completed for assets which were outside the scope of the external valuation.
In assessing the reasonableness of the external and internal valuations, the Committee reviewed the key assumptions and judgements underlying the valuations, in particular considering the impact of gross replacement cost price movements, depreciation rates reflecting age of asset and physical and functional obsolescence and forecast utilisation levels across the Group’s production sites included in the valuation, and is satisfied that the carrying value is appropriate.
Internal control and risk management systems The Group’s system of internal control and risk management is described below.
The terms of reference of the Audit Committee require it to conduct an annual assessment of internal financial controls and financial risk management systems. The risks facing the Group are reviewed regularly by the Audit Committee with executive management. Specific annual reviews of the risks and fundamental controls of each business unit are undertaken. The results and recommendations are reported to and analysed by the Audit Committee and a programme for action agreed with the business units. In carrying out these responsibilities during
DIRECTORS’ STATEMENT OF CORPORATE GOVERNANCE (CONTINUED)
66
the year, the Committee reviewed reports issued by both the internal audit function and the external auditor and held regular discussions with the Head of Internal Audit and representatives of the external auditor. The Committee also reviewed the outcome of an assessment of the Group’s internal financial controls which had been coordinated by the internal audit function.
Internal AuditThe Committee is responsible for monitoring and reviewing the operation and effectiveness of the internal audit function including its focus, plans, activities and resources. The Group’s internal audit function reports to the Audit Committee and the Audit Committee has approved its terms of reference. The Group’s internal auditor is engaged on a programme of work, which includes, inter alia, maintaining the Group’s risk register and examining the fundamental controls of the Group. During the year, the Committee reviewed and approved the internal audit plan for the year.
The Committee received regular reports from the Head of Internal Audit summarising findings of the team’s work and the responses from management to deal with the findings. The Committee monitors progress on the implementation of the action plans on significant findings to ensure these are completed satisfactorily.
External AuditorThe Committee manages the relationship with the Group’s external auditors on behalf of the Board. The Committee carries out an annual assessment of the external auditor including a review of the external auditor’s internal policies and procedures for maintaining independence and objectivity and consideration of their approach to audit quality. The external auditor is professionally required to rotate the audit partner responsible for the Group audit every five years. The current audit partner has been in place since 2012 and therefore partner rotation will take place during FY2017.
External audit processThe Committee also reviewed and approved the external audit plan as presented by the external auditor and assessed the qualifications and expertise of their resources. The Committee also reviewed the external auditor’s engagement letter and recommended the level of remuneration of the external auditor to the Board having reviewed the scope and nature of the work to be performed. The Committee assessed the effectiveness of the external audit process by monitoring performance against the agreed audit plan and noting the results of post-audit interviews with management and the Audit Committee Chairman.
Length of service of auditorsKPMG have been the external auditor of the Company since the Company’s formation and flotation in 2004. The UK Code recommends that listed companies of the size of the Group should put the external audit contract out to tender at least every ten years. The external audit contract was put out to tender in FY2014. The Committee concluded that KPMG continued to provide an effective audit service and there were no compelling reasons for change that would outweigh the advantages of continuity and consequently recommended the re-appointment of KPMG. The recommendation was accepted by the Board.
Hiring of former employees of auditorIn order to ensure the independence and objectivity of the external auditor, the prior approval of the Audit Committee is required before any individual is appointed to a senior managerial position in the Group, if such individual has within three years prior to such proposed appointment been employed by the external auditor.
Non-Audit Services by auditorThe Group has a policy in place governing the provision of non-audit services by the external auditor in order to ensure that the external auditor’s objectivity and independence is safeguarded.
Under this policy the auditor is prohibited from providing non-audit services if the auditor:• may, as a result, be required to audit its own firm’s work;• would participate in activities that would normally be undertaken
by management;• would be remunerated through a “success fee” structure or have
some other mutual financial interest with the Group;• would be acting in an advocacy role for the Group.
Other than above, the Company does not impose an automatic ban on the external auditor providing non-audit services. However, the external auditor is only permitted to provide non-audit services that are not, or are not perceived to be, in conflict with auditor independence and objectivity, if it has the skill, competence and integrity to carry out the work and it is considered by the Audit Committee to be the most appropriate to undertake such work in the best interests of the Group. The engagement of the external auditor to provide non-audit services must be approved in advance by the Audit Committee or entered into pursuant to pre-approved policies and procedures established by the Audit Committee and approved by the Board.
The nature, extent and scope of non-audit services provided to the Group by the external auditor and the economic importance of the Group to the external auditor are also monitored to ensure that the external auditor’s independence and objectivity is not impaired. The Audit Committee has adopted a policy that, except in exceptional circumstances with the prior approval of the Audit Committee, non-audit fees paid to the Group’s auditor should not exceed 100% of audit fees in any one financial year.
C&C GROUP PLC ANNUAL REPORT 2016 GOVERNANCE
67
During the year, KPMG provided non-audit advisory services, being advice on taxation and other related matters. In approving KPMG to provide these services the Committee was of the opinion that KPMG’s knowledge of the Group was an important factor. The Committee was also satisfied that the fees paid to KPMG for non-audit work did not compromise their independence or integrity. Details of the amounts paid to KPMG during the year for audit and other services are set out in note 2 to the financial statements.
Whistle-blowing proceduresIn line with best practice, the Group supports an independent and confidential whistle-blowing service which allows all employees to raise any concerns about business practice in a confidential manner.
THE NOMINATION COMMITTEE Composition and MeetingsThe Nomination Committee is chaired by the Group Chairman and its constitution requires it to consist of a majority of independent, non-executive Directors. The members during the year were Sir Brian Stewart (Chairman), Breege O’Donoghue and Richard Holroyd.
The Committee meets a minimum of twice a year and met twice in the year ended 29 February 2016. Attendance at meetings held is set out in the table on page 69. In addition, several ad hoc meetings were held to progress initiatives.
Constitution and terms of referenceThe Nomination Committee’s current terms of reference are available under the Board Committees section of the Group’s website at www.candcgroupplc.com. The Nomination Committee’s responsibilities include:• reviewing the structure, size and composition of the Board
(including the balance of skills, experience, independence, knowledge and diversity (including gender)) and making recommendations regarding any changes;
• overseeing succession planning for the Board and senior management and the leadership needs of the organisation;
• responsibility for the identification of suitable candidates for appointment to the Board;
• making recommendations to the Board on membership of Board Committees.
Main activities during the yearDuring the period under review the Nomination Committee considered:• potential candidates for recruitment as non-executive Directors
and recommended the appointment of Vincent Crowley and Rory Macnamara to the Board;
• longer-term succession planning for non-executive Directors, recognising the need for ongoing Board refreshment and renewal and the need for independence and diversity on the Board;
• succession plans for executive Directors and senior management.
DiversityThe Nomination Committee and the Board recognise the importance of ensuring diversity and the key role that a diversified Board plays in ensuring effectiveness. Suitable candidates are selected on the basis of their relevant experience, employment background, skills, knowledge and insight, having due regard for the benefits of diversity to the Board.
The Committee and Board further realise that diversity extends beyond the Board and in this regard seeks to ensure that all recruitment decisions are fair and non-discriminatory.
Independent consultantsThe Nomination Committee is empowered to use the services of independent consultants to facilitate the search for suitable candidates for appointment as non-executive Directors.
During the year, the Committee appointed Spencer Stuart, an independent executive search firm, to assist in a search process for non-executive Director candidates with relevant experience and skills. Spencer Stuart has no other connection with the Group.
THE REMUNERATION COMMITTEEThe Remuneration Committee comprises solely of independent, non-executive Directors. The Chairman was Breege O’Donoghue, and the other members were Richard Holroyd and Stewart Gilliland.
The Remuneration Committee meets at least twice a year. During the period under review the Remuneration Committee met five times. Attendance at meetings held is set out in the table on page 69.
The Remuneration Committee’s terms of reference, which are available on the C&C website www.candcgroupplc.com, include:• determining and agreeing with the Board the framework or
broad policy for the remuneration packages of the Chairman, Group Chief Executive Officer and other executive Directors, the Company Secretary and any other designated members of the executive management.
DIRECTORS’ STATEMENT OF CORPORATE GOVERNANCE (CONTINUED)
68
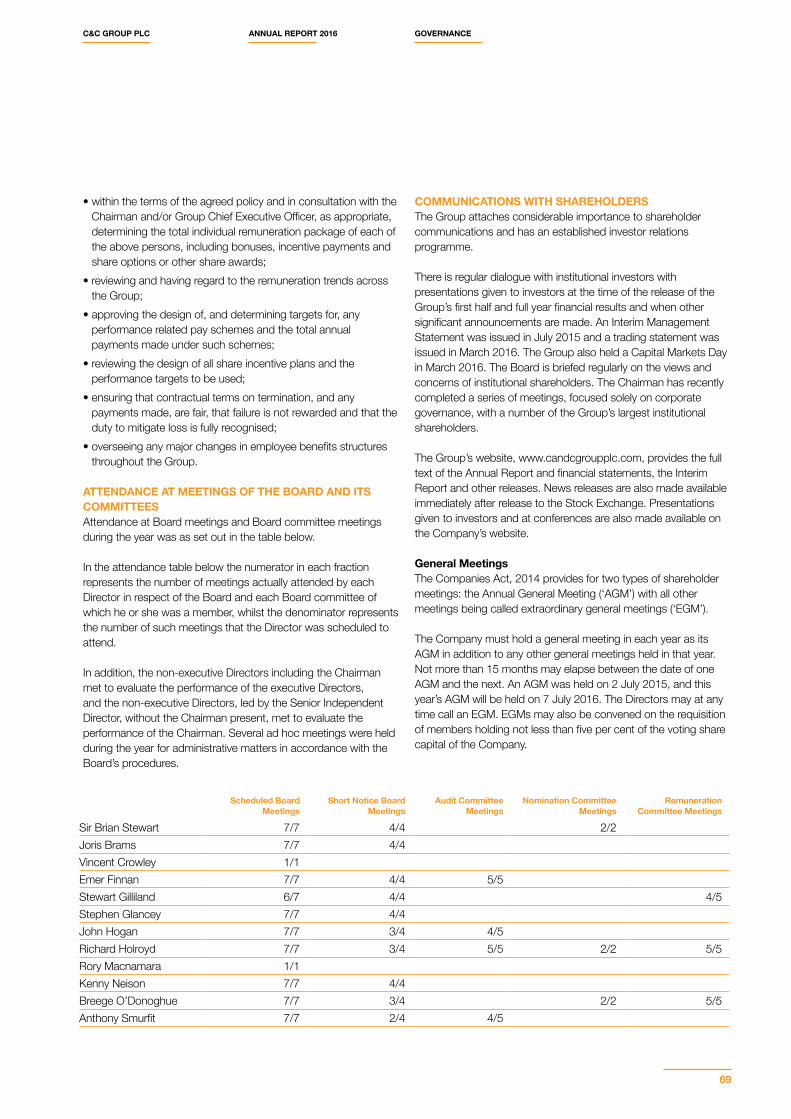
• within the terms of the agreed policy and in consultation with the Chairman and/or Group Chief Executive Officer, as appropriate, determining the total individual remuneration package of each of the above persons, including bonuses, incentive payments and share options or other share awards;
• reviewing and having regard to the remuneration trends across the Group;
• approving the design of, and determining targets for, any performance related pay schemes and the total annual payments made under such schemes;
• reviewing the design of all share incentive plans and the performance targets to be used;
• ensuring that contractual terms on termination, and any payments made, are fair, that failure is not rewarded and that the duty to mitigate loss is fully recognised;
• overseeing any major changes in employee benefits structures throughout the Group.
ATTENDANCE AT MEETINGS OF THE BOARD AND ITS COMMITTEESAttendance at Board meetings and Board committee meetings during the year was as set out in the table below.
In the attendance table below the numerator in each fraction represents the number of meetings actually attended by each Director in respect of the Board and each Board committee of which he or she was a member, whilst the denominator represents the number of such meetings that the Director was scheduled to attend.
In addition, the non-executive Directors including the Chairman met to evaluate the performance of the executive Directors, and the non-executive Directors, led by the Senior Independent Director, without the Chairman present, met to evaluate the performance of the Chairman. Several ad hoc meetings were held during the year for administrative matters in accordance with the Board’s procedures.
COMMUNICATIONS WITH SHAREHOLDERSThe Group attaches considerable importance to shareholder communications and has an established investor relations programme.
There is regular dialogue with institutional investors with presentations given to investors at the time of the release of the Group’s first half and full year financial results and when other significant announcements are made. An Interim Management Statement was issued in July 2015 and a trading statement was issued in March 2016. The Group also held a Capital Markets Day in March 2016. The Board is briefed regularly on the views and concerns of institutional shareholders. The Chairman has recently completed a series of meetings, focused solely on corporate governance, with a number of the Group’s largest institutional shareholders.
The Group’s website, www.candcgroupplc.com, provides the full text of the Annual Report and financial statements, the Interim Report and other releases. News releases are also made available immediately after release to the Stock Exchange. Presentations given to investors and at conferences are also made available on the Company’s website.
General MeetingsThe Companies Act, 2014 provides for two types of shareholder meetings: the Annual General Meeting (‘AGM’) with all other meetings being called extraordinary general meetings (‘EGM’).
The Company must hold a general meeting in each year as its AGM in addition to any other general meetings held in that year. Not more than 15 months may elapse between the date of one AGM and the next. An AGM was held on 2 July 2015, and this year’s AGM will be held on 7 July 2016. The Directors may at any time call an EGM. EGMs may also be convened on the requisition of members holding not less than five per cent of the voting share capital of the Company.
Scheduled Board Meetings
Short Notice Board Meetings
Audit Committee Meetings
Nomination Committee Meetings
Remuneration Committee Meetings
Sir Brian Stewart 7/7 4/4 2/2Joris Brams 7/7 4/4Vincent Crowley 1/1Emer Finnan 7/7 4/4 5/5Stewart Gilliland 6/7 4/4 4/5Stephen Glancey 7/7 4/4John Hogan 7/7 3/4 4/5Richard Holroyd 7/7 3/4 5/5 2/2 5/5Rory Macnamara 1/1Kenny Neison 7/7 4/4Breege O’Donoghue 7/7 3/4 2/2 5/5Anthony Smurfit 7/7 2/4 4/5
C&C GROUP PLC ANNUAL REPORT 2016 GOVERNANCE
69
No business shall be transacted at any general meeting unless a quorum is present at the time when the meeting proceeds to business. Three members present in person or by proxy and entitled to vote shall be a quorum.
Only those shareholders registered on the Company’s register of members at the prescribed record date, being a date not more than 48 hours before the general meeting to which it relates, are entitled to attend and vote at a general meeting.
Resolutions of the general meeting must be passed by the majority of votes cast (ordinary resolution) unless the Companies Act, 2014 or the Company’s Articles of Association provide for 75% majority of votes cast (special resolution). The Company’s Articles of Association provide that the Chairman has a casting vote in the event of a tie.
Any shareholder who is entitled to attend, speak and vote at a general meeting is entitled to appoint a proxy to attend, speak and vote on his or her behalf. A proxy need not be a member of the Company.
At meetings, unless a poll is demanded, all resolutions are determined on a show of hands, with every shareholder who is present in person or by proxy having one vote. On a poll every shareholder who is present in person or by proxy shall have one vote for each share of which he/she is the holder. A shareholder need not cast all votes in the same way. At the meeting, after each resolution has been dealt with, details are given of the level of proxy votes lodged for and against that resolution and also the level of votes withheld on that resolution.
The Company’s AGM gives shareholders the opportunity to question the Directors. The Company must answer any question a member asks relating to the business being dealt with at the meeting unless answering the question would interfere unduly with the preparation for the general meeting or the confidentiality and business interests of the Company, or the answer has already been given on a website in the form of an answer to a question, or it appears to the Chairman of the meeting that it is undesirable in the interests of good order of the meeting that the question be answered.
The business of the Company is managed by the Directors who may exercise all the powers of the Company unless they are required to be exercised by the Company in general meeting. Matters reserved to shareholders in general meeting include the election of Directors; the payment of dividends; the appointment of the external auditor; amendments to the Articles of Association; measures to increase or reduce the share capital; and the authority to issue shares.
MEMORANDUM AND ARTICLES OF ASSOCIATIONThe Company’s Memorandum of Association sets out the objects and powers of the Company. The Articles of Association detail the rights attaching to each share class; the method by which the Company’s shares can be purchased or reissued; the provisions
which apply to the holding of and voting at general meetings; and the rules relating to the Directors, including their appointment, retirement, re-election, duties and powers. Any amendment of the Company’s Articles of Association requires the passing of a special resolution.
Further details in relation to the purchase of the Company’s own shares are included in the Directors’ Report.
CORPORATE RESPONSIBILITYAs part of its overall remit of ensuring that effective risk management policies and systems are in place, the Board examines the significance of environmental, social and governance (ESG) matters to the Group’s business and it has ensured that the Group has in place effective systems for managing and mitigating ESG risks. It also examines the impact that such risks may have on the Group’s short and long-term value, as well as the opportunities that ESG issues present to enhance value. The Board receives the necessary information to make this assessment in regular reports from the executive management.
Corporate responsibility is embedded throughout the Group. Group policies and activities are summarised on pages 44 to 52 and the Group’s corporate responsibility report is available on the Group’s website www.candcgroupplc.com.
INTERNAL CONTROLThe Board has overall responsibility for the Group’s system of internal control, for reviewing its effectiveness and for confirming that there is a process for identifying, evaluating and managing the significant risks affecting the achievement of the Group’s strategic objectives. The process which has been in place for the entire period and up to the date the financial statements were approved accords with the FRC Guidance published in September 2014 and involves the Board considering the following:• the nature and extent of the key risks facing the Group;• the likelihood of these risks occurring;• the impact on the Group should these risks occur;• the actions being taken to manage these risks to the desired
level.
The key elements of the internal control system in operation are as follows:• clearly defined organisation structures and lines of authority;• corporate policies for financial reporting, treasury and financial
risk management, information technology and security, project appraisal and corporate governance;
• annual budgets for all business units, identifying key risks and opportunities;
• monitoring of performance against budgets on a weekly basis and reporting thereon to the Board on a periodic basis;
• an internal audit function which reviews key business processes and controls; and
• an audit committee which approves plans and deals with significant control issues raised by internal or external audit.
DIRECTORS’ STATEMENT OF CORPORATE GOVERNANCE (CONTINUED)
70
This system of internal control can only provide reasonable, and not absolute, assurance against material misstatement or loss. The terms of reference of the Audit Committee require it to monitor the effectiveness of the Group’s internal financial controls and risk management systems and at least annually carry out a review of the effectiveness of these systems. The risks facing the Group are reviewed regularly by the Audit Committee with the executive management team. Specific annual reviews of the risks and fundamental controls of each business unit are undertaken on an ongoing basis, the results and recommendations of which are reported to and analysed by the Audit Committee with a programme for action agreed by the business units.
The preparation and issue of financial reports, including consolidated annual financial statements is managed by the Group Finance function with oversight from the Audit Committee. The key features of the Group’s internal control procedures with regard to the preparation of consolidated financial statements are as follows:• the review of each operating division’s period end reporting
package by the Group Finance function; • the challenge and review of the financial results of each operating
division with the management of that division by the Group Chief Financial Officer;
• the review of any internal control weaknesses highlighted by the external auditor, by the Group Chief Financial Officer, Head of Internal Audit and the Audit Committee; and the follow up of any critical weaknesses to ensure issues highlighted are addressed.
The Directors confirm that, in addition to the monitoring carried out by the Audit Committee under its terms of reference, they have reviewed the effectiveness of the Group’s risk management and internal control systems up to and including the date of approval of the financial statements. This review had regard to all material controls, including financial, operational and compliance controls that could affect the Group’s business. The Directors considered the outcome of this review and found the systems satisfactory.
The Directors also confirm that they have carried out a robust assessment of the principal risks facing the company, including those that would threaten its business model, future performance, solvency or liquidity. As description of the Principal Risks and Uncertainties faced by the Group and how these risks are being managed and mitigated is set out on pages 24 and 26.
VIABILITY STATEMENTFor the purposes of assessing the future prospects of the Group, the Directors have selected a three year timeframe and have carried out a forward looking assessment of the Group’s viability based on this timeframe. The assessment has been made with reference to the Group’s current position and prospects, the Group’s strategy, the Board’s risk appetite and the Group’s Principal Risks and Uncertainties and how these are identified, managed and mitigated.
This assessment is based on a number of cautious assumptions concerning macro growth and stability in our key markets particularly in the context of forecasted volume growth and margins. It will be reviewed regularly by the Board through presentations from senior management on the performance of the respective business units, the assessment of market opportunities and the consideration by the Board of its ability to fund its strategic ambitions.
In making this assessment, the Directors have considered the resilience of the Group, taking account of its current position and the Group’s Principal Risks and Uncertainties and the Group’s ability to manage those risks. The risks have been identified using a top down and bottom up approach, and their potential impact was assessed having regard to the effectiveness of controls in place to manage each risk.
Based on this assessment the Directors have a reasonable expectation that the Group will be able to continue in operation and meet its liabilities as they fall due over the three year period of their assessment.
GOING CONCERNThe financial position of the Group, its cash flows, liquidity position and borrowing facilities are set out in the Group Chief Financial Officer’s Review on pages 38 to 43. A description of the business of the Group is set out in the Group Chief Executive Officer’s Review on page 10 to 17 and the Operations Review on pages 28 to 37. The principal risks and uncertainties facing the Group are set out in this report on pages 24 and 26.
An explanation of the basis on which the Group generates and preserves value over the longer term (the business model) and the strategy for delivering its objectives are set out in the Group Chief Executive Officer’s review on pages 38 to 43. A statement of the Group’s strategy is set out on pages 18 and 19. The Group’s long-term strategy is to build a sustainable cider-led multi-beverage business through a combination of organic growth and selective acquisitions. The Group’s business model seeks growth through brand/market combination combining brand investment with a focus on local markets.
The Group has significant revenues, a large number of customers and suppliers across different geographies, and considerable financial resources. For these reasons, the Directors have a reasonable expectation that the Company, and the Group as a whole, have adequate resources to continue in operational existence for the foreseeable future, being twelve months from the date of approval of the financial statements. Consequently they continue to adopt the going concern basis in preparing the financial statements.
C&C GROUP PLC ANNUAL REPORT 2016 GOVERNANCE
71
Dear Shareholder
On behalf of the Board, I am pleased to present the Report on Directors’ remuneration for the financial year ended 29 February 2016. As we included the full Policy Report in the FY2015 report and accounts and no changes are proposed to that policy, we have included those aspects of the Policy Report that we think shareholders will find most useful; the full Policy Report is included on pages 66 to 78 of the FY2015 annual report and accounts, which is available on www.candcgroupplc.com. We will again be submitting the Annual Report on Remuneration to shareholders for an advisory vote at the Company’s 2016 AGM. Last year our advisory votes received the support of over 98.6%, for the Annual Report on Remuneration, and 95.2%, for the
Directors’ Remuneration Policy, of the votes cast. Each of the new ESOS and LTIP and the amendments to the LTIP (Part 1) was approved with over 94% of the votes cast in favour. We hope that shareholders will demonstrate their support again this year.
FY2017 will be the first year in which our Directors’ Remuneration Policy is operated in accordance with the new ESOS and LTIP approved at the 2016 AGM, and we have summarised below how this will operate.
FY2016 KEY DECISIONS AND INCENTIVE OUT-TURNWe proposed new long term incentive plans and a new directors’ remuneration policy to shareholders at the 2016 AGM, and were delighted with the strong support from shareholders. Going forward, we will operate that policy and those plans (as we have the previous policy and plans) in a responsible way, ensuring that executive Directors are appropriately rewarded for the delivery of value to shareholders without encouraging inappropriate behaviours. The new plans will be operated for the first time in FY2017, and the approach to them is summarised below.
Salaries for the executive Directors were not increased for FY2016, extending to seven years the period in which the Group Chief Executive Officer and Group Chief Financial Officer did not receive a salary increase.
The executive Directors’ incentive remuneration opportunities for FY2016 were determined in accordance with the new policy, as follows:
Opportunity Performance Measures Out-turn
Annual Bonus 80% of salary (compared to a maximum under the new policy of 100%)
When setting the bonus targets for FY2016, as set out on page 79, the Committee included two targets, stretching adjusted operating profit (75% of the opportunity) and cash conversion (25% of the opportunity) recognising the importance of cash generation, which provides us with the flexibility to make appropriate investments for growth, to maintain our progressive dividend policy and to return cash to shareholders.
As described on page 40 the Company performed strongly in FY2016 in relation to cash conversion. This resulted in the maximum performance level for the cash conversion element of the bonus being exceeded and the maximum bonus for this element being earned.
The threshold level of performance for the adjusted operating profit element of the bonus was not achieved.
Further details are included on page 79.
Long-Term Incentives awarded in the year
LTIP (Part 1): 100% of salary
As set out on page 81:• EPS growth (75% of the opportunity)• Relative TSR (25% of the opportunity)
Performance will be assessed over the three year period ending with FY2018.
ESOS: 150% of salary As set out on page 81, EPS growth. We introduced a vesting schedule rather than “cliff” vesting for the ESOS awards to smooth the pay-out profile to appropriately reward incremental increases in performance above a base level, with the vesting range set around the previous vesting condition.
REPORT OF THE REMUNERATION COMMITTEE ON DIRECTORS’ REMUNERATION
72
Long term incentives vesting in respect of performance in FY2016
Joris Brams was granted LTIP (Part I) and ESOS awards in May 2013. Each of Stephen Glancey and Kenny Neison waived their entitlement to awards in FY2014 in order to facilitate larger awards to a wider population.
The performance measures for the awards granted to Joris Brams in May 2013 were not met and the awards did not vest.
FY2017 ARRANGEMENTSWe have set out below a summary of our remuneration arrangements for FY2017. Further detail is included in the implementation section on pages 75 to 77. FY2017 will be the first year in which we operate our new incentive arrangements under the plans approved at the 2015 AGM. As set out in the FY2015 directors’ remuneration report we have reduced the threshold level of vesting for the long term incentives from 30% to 25% and incorporated performance conditions based on EPS, ROCE and cash conversion (along with a performance underpin). EPS targets for the awards to be granted in FY2017 have been determined by reference to challenging internal budgets and external forecasts.
At a glance summary of our executive Director remuneration arrangements for FY2017Salary
• The executive Directors’ salaries have been increased by 1% for FY2017, reflecting the average increase across the wider workforce.
• The average increase across the wider workforce was 1%.
Benefits and Pensions
• No changes are proposed to the type of benefits provided.
• No changes will be made to the level of pension provision.
Bonus
• The maximum bonus opportunity will be 80% of salary, compared to a policy maximum of 100%.
• Vesting will be based on stretching performance conditions based on adjusted operating profit (75%) and cash conversion (25%).
• See page 76.
Long term incentives
• Awards will be granted in the form of LTIP (100% of salary) and ESOS (150% of salary) under the new plans approved at the 2015 AGM.
• Vesting will be subject to performance measures based on EPS, ROCE and cash conversion, and subject to an additional performance underpin.
• A vesting schedule, rather than cliff vesting, will continue to apply to the ESOS awards.
• See pages 76 and 77.
Malus and clawback
• As noted in the FY2015 Directors’ remuneration report, malus and clawback will apply to the annual bonus and long term incentive awards for FY2017 and future years.
• Clawback can be applied for two years following the end of the performance period in the event of material misstatement of accounts or gross misconduct.
We have also decided that Stephen Glancey and Kenny Neison should be entitled to “dividend equivalents” in respect of their vested JSOP interests, as referred to on page 75.
I hope you will find this directors’ remuneration report clear in showing our responsible approach to executive remuneration and the way in which it reflects our overall strategy.
Yours sincerely
Breege O’DonoghueChairman of the Remuneration Committee
Opportunity Performance Measures Out-turn
C&C GROUP PLC ANNUAL REPORT 2016 GOVERNANCE
73
IntroductionCOMMITTEE AND ADVISERS Composition The Committee of the Board consists solely of independent non-executive Directors.
During the year ended 29 February 2016 the Chairman of the Committee was Breege O’Donoghue. Other members of the Committee were Richard Holroyd and Stewart Gilliland.
Terms of reference of CommitteeThe Committee’s terms of reference are available on the Company’s website www.candcgroupplc.com and are summarised on pages 68 and 69.
Advice and ConsultationThe Chairman of the Board and the Group Chief Executive Officer are fully consulted on remuneration proposals but neither is present when his own remuneration is discussed.
The Committee has access to external advice from remuneration consultants on compensation when necessary. During the year ended 29 February 2016 the Committee obtained advice from Deloitte who were appointed by the Committee. Deloitte’s fees for this advice amounted to £17,350 charged on a time or fixed fee basis. During the period, separate divisions of Deloitte advised the Group on commercial contract issues.
Deloitte is a member of the UK Remuneration Consultants Group and, as such, voluntarily operates under its code of conduct. To safeguard objectivity, protocols are established to cover the basis for contact with executive management and to avoid potential conflict arising from other client relationships. The Committee is satisfied that the remuneration advice provided by Deloitte is objective and independent.
The Committee has also obtained advice from:• David Johnston, Company Secretary• Sarah Riley, Group Director of Human Resources.
SHAREHOLDERS’ VIEWS The Committee is committed to open and transparent dialogue with shareholders and consults with shareholders and governance bodies on proposals relating to remuneration structures.
REPORT OF THE REMUNERATION COMMITTEE ON DIRECTORS’ REMUNERATION (CONTINUED)
74
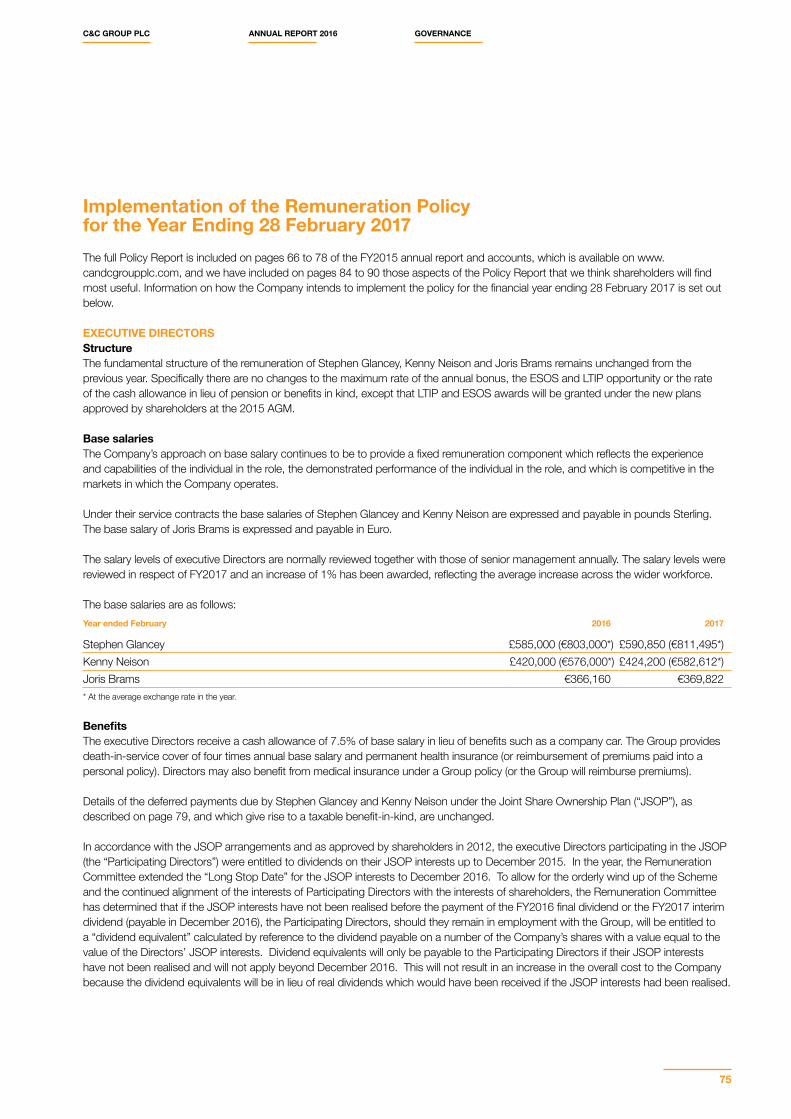
Implementation of the Remuneration Policy for the Year Ending 28 February 2017 The full Policy Report is included on pages 66 to 78 of the FY2015 annual report and accounts, which is available on www.candcgroupplc.com, and we have included on pages 84 to 90 those aspects of the Policy Report that we think shareholders will find most useful. Information on how the Company intends to implement the policy for the financial year ending 28 February 2017 is set out below.
EXECUTIVE DIRECTORSStructureThe fundamental structure of the remuneration of Stephen Glancey, Kenny Neison and Joris Brams remains unchanged from the previous year. Specifically there are no changes to the maximum rate of the annual bonus, the ESOS and LTIP opportunity or the rate of the cash allowance in lieu of pension or benefits in kind, except that LTIP and ESOS awards will be granted under the new plans approved by shareholders at the 2015 AGM.
Base salariesThe Company’s approach on base salary continues to be to provide a fixed remuneration component which reflects the experience and capabilities of the individual in the role, the demonstrated performance of the individual in the role, and which is competitive in the markets in which the Company operates.
Under their service contracts the base salaries of Stephen Glancey and Kenny Neison are expressed and payable in pounds Sterling. The base salary of Joris Brams is expressed and payable in Euro.
The salary levels of executive Directors are normally reviewed together with those of senior management annually. The salary levels were reviewed in respect of FY2017 and an increase of 1% has been awarded, reflecting the average increase across the wider workforce.
The base salaries are as follows:Year ended February 2016 2017
Stephen Glancey £585,000 (€803,000*) £590,850 (€811,495*)Kenny Neison £420,000 (€576,000*) £424,200 (€582,612*)Joris Brams €366,160 €369,822* At the average exchange rate in the year.
BenefitsThe executive Directors receive a cash allowance of 7.5% of base salary in lieu of benefits such as a company car. The Group provides death-in-service cover of four times annual base salary and permanent health insurance (or reimbursement of premiums paid into a personal policy). Directors may also benefit from medical insurance under a Group policy (or the Group will reimburse premiums).
Details of the deferred payments due by Stephen Glancey and Kenny Neison under the Joint Share Ownership Plan (“JSOP”), as described on page 79, and which give rise to a taxable benefit-in-kind, are unchanged.
In accordance with the JSOP arrangements and as approved by shareholders in 2012, the executive Directors participating in the JSOP (the “Participating Directors”) were entitled to dividends on their JSOP interests up to December 2015. In the year, the Remuneration Committee extended the “Long Stop Date” for the JSOP interests to December 2016. To allow for the orderly wind up of the Scheme and the continued alignment of the interests of Participating Directors with the interests of shareholders, the Remuneration Committee has determined that if the JSOP interests have not been realised before the payment of the FY2016 final dividend or the FY2017 interim dividend (payable in December 2016), the Participating Directors, should they remain in employment with the Group, will be entitled to a “dividend equivalent” calculated by reference to the dividend payable on a number of the Company’s shares with a value equal to the value of the Directors’ JSOP interests. Dividend equivalents will only be payable to the Participating Directors if their JSOP interests have not been realised and will not apply beyond December 2016. This will not result in an increase in the overall cost to the Company because the dividend equivalents will be in lieu of real dividends which would have been received if the JSOP interests had been realised.
C&C GROUP PLC ANNUAL REPORT 2016 GOVERNANCE
75
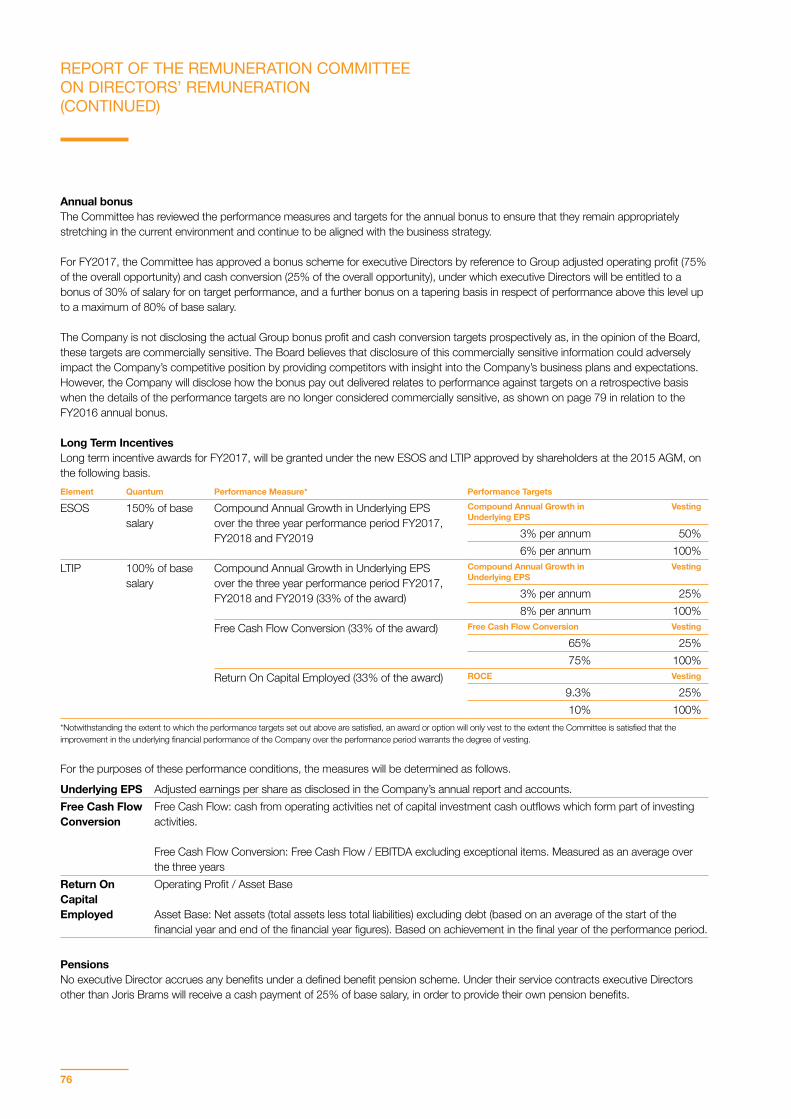
Annual bonusThe Committee has reviewed the performance measures and targets for the annual bonus to ensure that they remain appropriately stretching in the current environment and continue to be aligned with the business strategy.
For FY2017, the Committee has approved a bonus scheme for executive Directors by reference to Group adjusted operating profit (75% of the overall opportunity) and cash conversion (25% of the overall opportunity), under which executive Directors will be entitled to a bonus of 30% of salary for on target performance, and a further bonus on a tapering basis in respect of performance above this level up to a maximum of 80% of base salary.
The Company is not disclosing the actual Group bonus profit and cash conversion targets prospectively as, in the opinion of the Board, these targets are commercially sensitive. The Board believes that disclosure of this commercially sensitive information could adversely impact the Company’s competitive position by providing competitors with insight into the Company’s business plans and expectations. However, the Company will disclose how the bonus pay out delivered relates to performance against targets on a retrospective basis when the details of the performance targets are no longer considered commercially sensitive, as shown on page 79 in relation to the FY2016 annual bonus.
Long Term IncentivesLong term incentive awards for FY2017, will be granted under the new ESOS and LTIP approved by shareholders at the 2015 AGM, on the following basis. Element Quantum Performance Measure* Performance Targets
ESOS 150% of base salary
Compound Annual Growth in Underlying EPS over the three year performance period FY2017, FY2018 and FY2019
Compound Annual Growth in Underlying EPS
Vesting
3% per annum 50%6% per annum 100%
LTIP 100% of base salary
Compound Annual Growth in Underlying EPS over the three year performance period FY2017, FY2018 and FY2019 (33% of the award)
Compound Annual Growth in Underlying EPS
Vesting
3% per annum 25%8% per annum 100%
Free Cash Flow Conversion (33% of the award) Free Cash Flow Conversion Vesting
65% 25%75% 100%
Return On Capital Employed (33% of the award) ROCE Vesting
9.3% 25%10% 100%
*Notwithstanding the extent to which the performance targets set out above are satisfied, an award or option will only vest to the extent the Committee is satisfied that the improvement in the underlying financial performance of the Company over the performance period warrants the degree of vesting.
For the purposes of these performance conditions, the measures will be determined as follows.
Underlying EPS Adjusted earnings per share as disclosed in the Company’s annual report and accounts. Free Cash Flow Conversion
Free Cash Flow: cash from operating activities net of capital investment cash outflows which form part of investing activities.
Free Cash Flow Conversion: Free Cash Flow / EBITDA excluding exceptional items. Measured as an average over the three years
Return On Capital Employed
Operating Profit / Asset Base
Asset Base: Net assets (total assets less total liabilities) excluding debt (based on an average of the start of the financial year and end of the financial year figures). Based on achievement in the final year of the performance period.
PensionsNo executive Director accrues any benefits under a defined benefit pension scheme. Under their service contracts executive Directors other than Joris Brams will receive a cash payment of 25% of base salary, in order to provide their own pension benefits.
REPORT OF THE REMUNERATION COMMITTEE ON DIRECTORS’ REMUNERATION (CONTINUED)
76
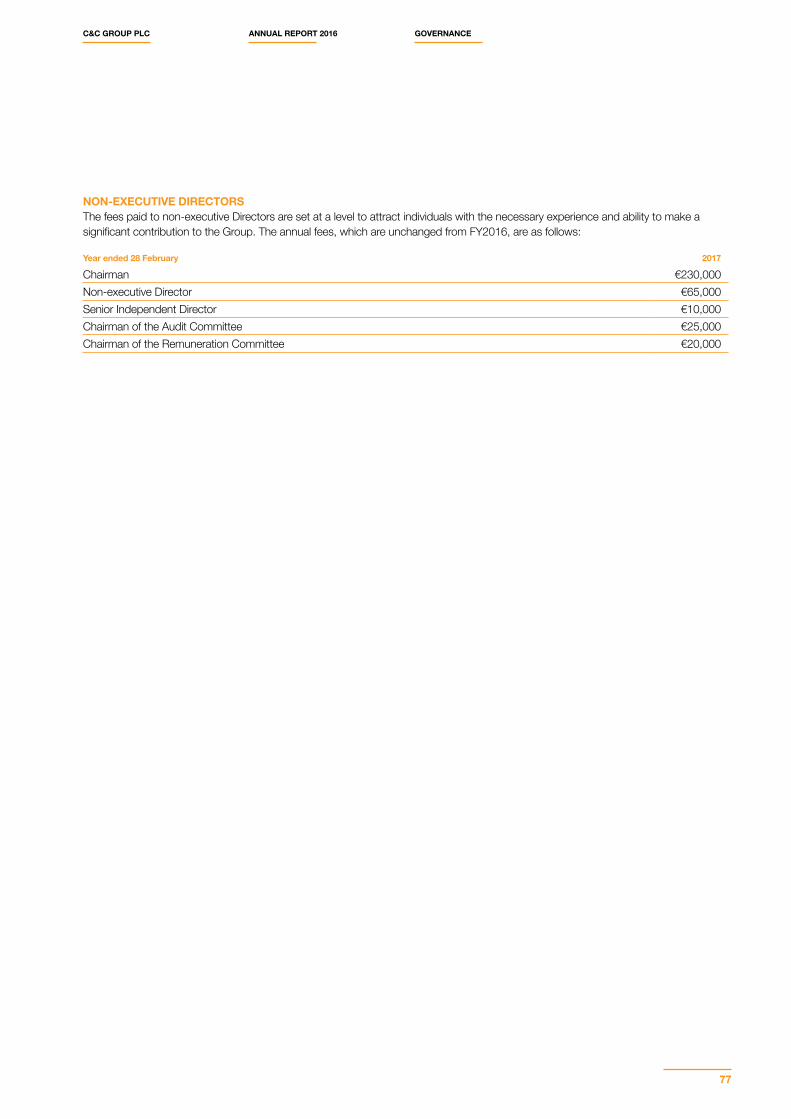
NON-EXECUTIVE DIRECTORSThe fees paid to non-executive Directors are set at a level to attract individuals with the necessary experience and ability to make a significant contribution to the Group. The annual fees, which are unchanged from FY2016, are as follows:
Year ended 28 February 2017
Chairman €230,000Non-executive Director €65,000Senior Independent Director €10,000Chairman of the Audit Committee €25,000Chairman of the Remuneration Committee €20,000
C&C GROUP PLC ANNUAL REPORT 2016 GOVERNANCE
77
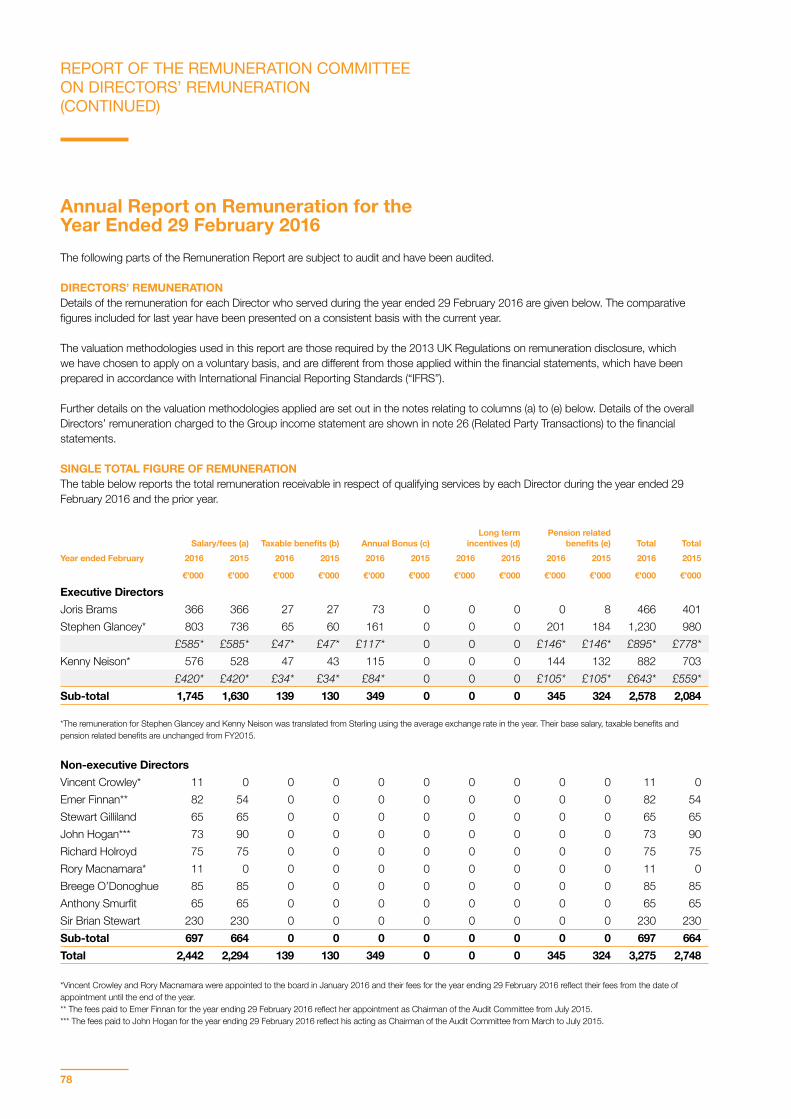
Annual Report on Remuneration for the Year Ended 29 February 2016The following parts of the Remuneration Report are subject to audit and have been audited.
DIRECTORS’ REMUNERATION Details of the remuneration for each Director who served during the year ended 29 February 2016 are given below. The comparative figures included for last year have been presented on a consistent basis with the current year.
The valuation methodologies used in this report are those required by the 2013 UK Regulations on remuneration disclosure, which we have chosen to apply on a voluntary basis, and are different from those applied within the financial statements, which have been prepared in accordance with International Financial Reporting Standards (“IFRS”).
Further details on the valuation methodologies applied are set out in the notes relating to columns (a) to (e) below. Details of the overall Directors’ remuneration charged to the Group income statement are shown in note 26 (Related Party Transactions) to the financial statements.
SINGLE TOTAL FIGURE OF REMUNERATION The table below reports the total remuneration receivable in respect of qualifying services by each Director during the year ended 29 February 2016 and the prior year.
Salary/fees (a) Taxable benefits (b) Annual Bonus (c)Long term
incentives (d)Pension related
benefits (e) Total TotalYear ended February 2016 2015 2016 2015 2016 2015 2016 2015 2016 2015 2016 2015
€’000 €’000 €’000 €’000 €’000 €’000 €’000 €’000 €’000 €’000 €’000 €’000
Executive DirectorsJoris Brams 366 366 27 27 73 0 0 0 0 8 466 401Stephen Glancey* 803 736 65 60 161 0 0 0 201 184 1,230 980
£585* £585* £47* £47* £117* 0 0 0 £146* £146* £895* £778*Kenny Neison* 576 528 47 43 115 0 0 0 144 132 882 703
£420* £420* £34* £34* £84* 0 0 0 £105* £105* £643* £559*Sub-total 1,745 1,630 139 130 349 0 0 0 345 324 2,578 2,084
*The remuneration for Stephen Glancey and Kenny Neison was translated from Sterling using the average exchange rate in the year. Their base salary, taxable benefits and pension related benefits are unchanged from FY2015.
Non-executive DirectorsVincent Crowley* 11 0 0 0 0 0 0 0 0 0 11 0Emer Finnan** 82 54 0 0 0 0 0 0 0 0 82 54Stewart Gilliland 65 65 0 0 0 0 0 0 0 0 65 65 John Hogan*** 73 90 0 0 0 0 0 0 0 0 73 90 Richard Holroyd 75 75 0 0 0 0 0 0 0 0 75 75 Rory Macnamara* 11 0 0 0 0 0 0 0 0 0 11 0Breege O’Donoghue 85 85 0 0 0 0 0 0 0 0 85 85 Anthony Smurfit 65 65 0 0 0 0 0 0 0 0 65 65 Sir Brian Stewart 230 230 0 0 0 0 0 0 0 0 230 230 Sub-total 697 664 0 0 0 0 0 0 0 0 697 664Total 2,442 2,294 139 130 349 0 0 0 345 324 3,275 2,748
*Vincent Crowley and Rory Macnamara were appointed to the board in January 2016 and their fees for the year ending 29 February 2016 reflect their fees from the date of appointment until the end of the year. ** The fees paid to Emer Finnan for the year ending 29 February 2016 reflect her appointment as Chairman of the Audit Committee from July 2015. *** The fees paid to John Hogan for the year ending 29 February 2016 reflect his acting as Chairman of the Audit Committee from March to July 2015.
REPORT OF THE REMUNERATION COMMITTEE ON DIRECTORS’ REMUNERATION (CONTINUED)
78

NOTES TO THE REMUNERATION TABLE Column (a) Salaries and fees(1) The amounts shown are the amounts earned in respect of the financial year.
(2) In addition to the amounts shown above, pursuant to a contract for services effective as of 1 April 2014 between C&C IP Sàrl (‘CCIP’) and Joris Brams BVBA (‘JBB’), (a company wholly owned by Joris Brams and family), CCIP paid fees in the FY2016 financial year of €91,550 to JBB in respect of brand development services provided by JBB to CCIP in relation to Belgian products.
Column (b) Benefits(1) The executive Directors received a cash allowance of 7.5% of base salary. The Group provided death-in-service cover of four times annual base salary and permanent health insurance (or reimbursement of premiums paid into a personal policy). Stephen Glancey and Kenny Neison also availed of medical insurance under a Group policy.
(2) When an award is granted to an executive under the JSOP, its value is assessed for tax purposes with the resulting value being deemed to fall due for payment on the date of grant. Under the terms of the Plan, the executive paid the Entry Price at the date of grant and, if the tax value of the award (i.e. the initial unrestricted market value) exceeds the Entry Price, the executive must pay a further amount, equating to the amount of such excess, before a sale of the awarded interests. The deferral of the payment of the further amount is considered to be an interest-free loan by the Company to the executive and a taxable benefit-in-kind arises, charged at UK HM Revenue and Customs stipulated rates (4.0% for the period up to and including 5 April 2014, 3.25% for the period from 6 April 2014 to 5 April 2015 and 3.0% for the period from 6 April 2015). The resulting loans by the Company to the executive Directors are required to be disclosed under the Companies Act 2014. The balances of the loans outstanding to the executive Directors as at 29 February 2016 and 28 February 2015 are as follows:
29 February 2016€’000
28 February 2015€’000
Stephen Glancey 111 111Kenny Neison 83 83Total 194 194
When the further amount is paid, the Company compensates the executive for the obligation to pay this further amount by paying him an equivalent amount, which is, however, subject to income tax and social security in the hands of the executive.
Further details of the JSOP are given in note 4 (Share-Based Payments) to the financial statements. No further awards can be made. All extant awards are fully vested.
Column (c) Annual Bonus(1) The amounts shown are the total bonus earned under the annual bonus scheme in respect of the financial year.
(2) For the year ended 29 February 2016, the annual bonus for executive Directors was based on performance against a Group adjusted operating profit target (75%) and a cash conversion target (25%). The maximum bonus opportunity was 80% of salary. Target bonus was 30% of salary (37.5% of the maximum opportunity). Further details of how the bonuses earned relate to performance are provided in the table below. As the adjusted operating profits targets are considered to be commercially sensitive, and recognising that no bonus was earned in respect of that element, the Company has not disclosed details of these targets. However, in future if a bonus is earned by reference to the adjusted operating profit measure, the Company will disclose details of the targets on a retrospective basis.
Performance Targets
Measure ‘Target’ ‘Maximum’ Actual Performance Bonuses earned (percentage of salary)
Adjusted Operating Profit Budget 110% of Budget Below Target The Operating Profit element of the bonus is not payable as the target has not been achieved
Cash Conversion 65% 75% 103% The maximum performance level for the Cash Conversion element of the bonus has been exceeded and a bonus of 20% of salary is therefore payable.
C&C GROUP PLC ANNUAL REPORT 2016 GOVERNANCE
79
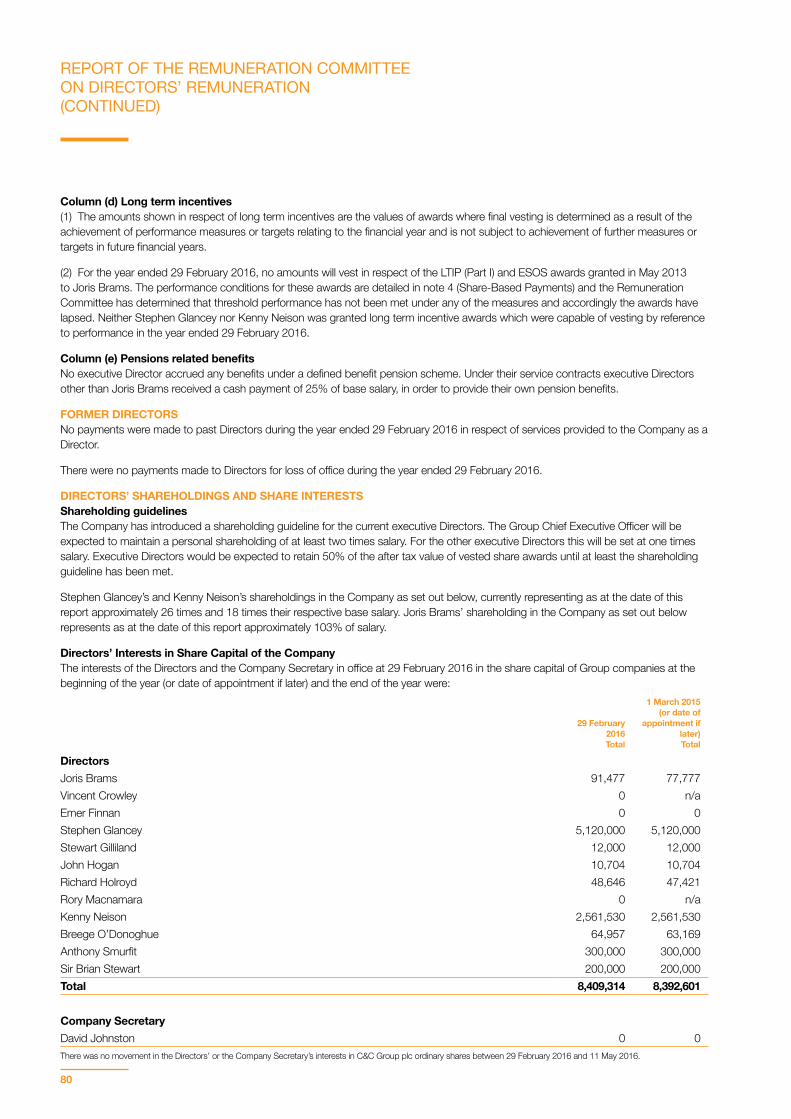
Column (d) Long term incentives(1) The amounts shown in respect of long term incentives are the values of awards where final vesting is determined as a result of the achievement of performance measures or targets relating to the financial year and is not subject to achievement of further measures or targets in future financial years.
(2) For the year ended 29 February 2016, no amounts will vest in respect of the LTIP (Part I) and ESOS awards granted in May 2013 to Joris Brams. The performance conditions for these awards are detailed in note 4 (Share-Based Payments) and the Remuneration Committee has determined that threshold performance has not been met under any of the measures and accordingly the awards have lapsed. Neither Stephen Glancey nor Kenny Neison was granted long term incentive awards which were capable of vesting by reference to performance in the year ended 29 February 2016.
Column (e) Pensions related benefitsNo executive Director accrued any benefits under a defined benefit pension scheme. Under their service contracts executive Directors other than Joris Brams received a cash payment of 25% of base salary, in order to provide their own pension benefits.
FORMER DIRECTORSNo payments were made to past Directors during the year ended 29 February 2016 in respect of services provided to the Company as a Director.
There were no payments made to Directors for loss of office during the year ended 29 February 2016.
DIRECTORS’ SHAREHOLDINGS AND SHARE INTERESTS Shareholding guidelinesThe Company has introduced a shareholding guideline for the current executive Directors. The Group Chief Executive Officer will be expected to maintain a personal shareholding of at least two times salary. For the other executive Directors this will be set at one times salary. Executive Directors would be expected to retain 50% of the after tax value of vested share awards until at least the shareholding guideline has been met.
Stephen Glancey’s and Kenny Neison’s shareholdings in the Company as set out below, currently representing as at the date of this report approximately 26 times and 18 times their respective base salary. Joris Brams’ shareholding in the Company as set out below represents as at the date of this report approximately 103% of salary.
Directors’ Interests in Share Capital of the CompanyThe interests of the Directors and the Company Secretary in office at 29 February 2016 in the share capital of Group companies at the beginning of the year (or date of appointment if later) and the end of the year were:
29 February 2016Total
1 March 2015 (or date of
appointment if later)Total
DirectorsJoris Brams 91,477 77,777Vincent Crowley 0 n/aEmer Finnan 0 0Stephen Glancey 5,120,000 5,120,000Stewart Gilliland 12,000 12,000John Hogan 10,704 10,704Richard Holroyd 48,646 47,421Rory Macnamara 0 n/aKenny Neison 2,561,530 2,561,530Breege O’Donoghue 64,957 63,169Anthony Smurfit 300,000 300,000Sir Brian Stewart 200,000 200,000Total 8,409,314 8,392,601
Company SecretaryDavid Johnston 0 0There was no movement in the Directors’ or the Company Secretary’s interests in C&C Group plc ordinary shares between 29 February 2016 and 11 May 2016.
REPORT OF THE REMUNERATION COMMITTEE ON DIRECTORS’ REMUNERATION (CONTINUED)
80
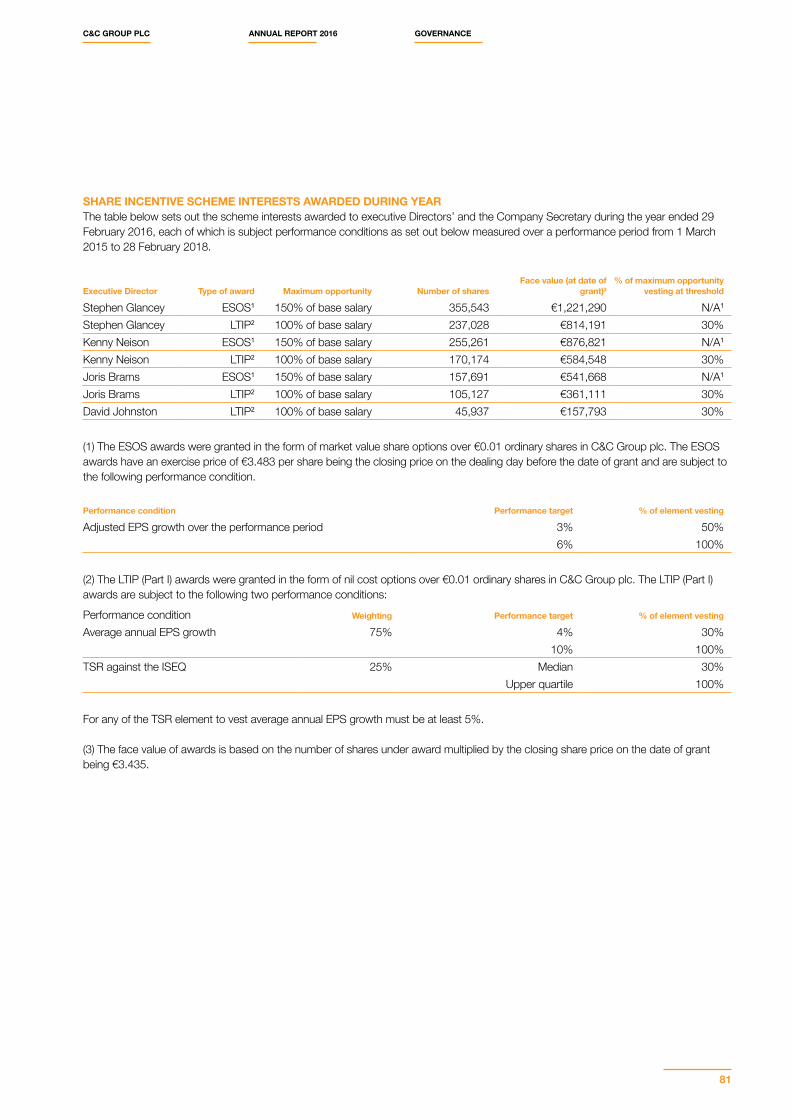
SHARE INCENTIVE SCHEME INTERESTS AWARDED DURING YEARThe table below sets out the scheme interests awarded to executive Directors’ and the Company Secretary during the year ended 29 February 2016, each of which is subject performance conditions as set out below measured over a performance period from 1 March 2015 to 28 February 2018.
Executive Director Type of award Maximum opportunity Number of sharesFace value (at date of
grant)3% of maximum opportunity
vesting at threshold
Stephen Glancey ESOS1 150% of base salary 355,543 €1,221,290 N/A1
Stephen Glancey LTIP2 100% of base salary 237,028 €814,191 30%Kenny Neison ESOS1 150% of base salary 255,261 €876,821 N/A1
Kenny Neison LTIP2 100% of base salary 170,174 €584,548 30%Joris Brams ESOS1 150% of base salary 157,691 €541,668 N/A1
Joris Brams LTIP2 100% of base salary 105,127 €361,111 30%David Johnston LTIP2 100% of base salary 45,937 €157,793 30%
(1) The ESOS awards were granted in the form of market value share options over €0.01 ordinary shares in C&C Group plc. The ESOS awards have an exercise price of €3.483 per share being the closing price on the dealing day before the date of grant and are subject to the following performance condition.
Performance condition Performance target % of element vesting
Adjusted EPS growth over the performance period 3% 50%6% 100%
(2) The LTIP (Part I) awards were granted in the form of nil cost options over €0.01 ordinary shares in C&C Group plc. The LTIP (Part I) awards are subject to the following two performance conditions:
Performance condition Weighting Performance target % of element vesting
Average annual EPS growth 75% 4% 30%10% 100%
TSR against the ISEQ 25% Median 30%Upper quartile 100%
For any of the TSR element to vest average annual EPS growth must be at least 5%.
(3) The face value of awards is based on the number of shares under award multiplied by the closing share price on the date of grant being €3.435.
C&C GROUP PLC ANNUAL REPORT 2016 GOVERNANCE
81
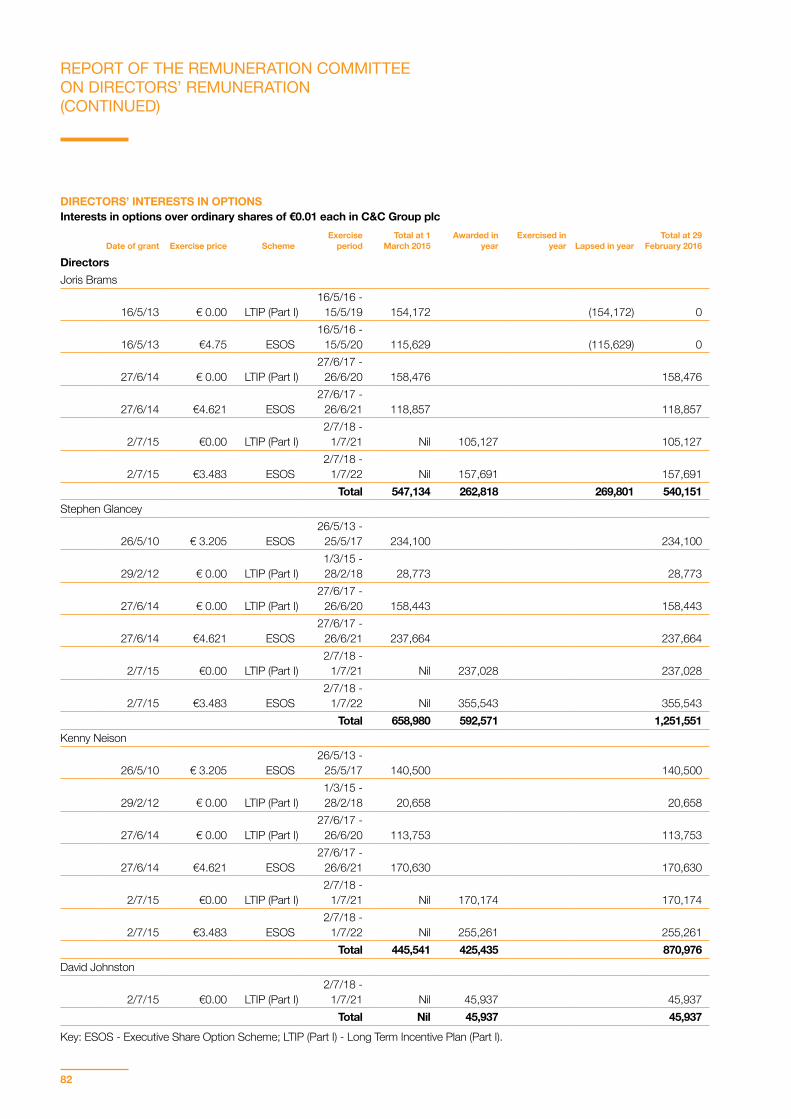
DIRECTORS’ INTERESTS IN OPTIONSInterests in options over ordinary shares of €0.01 each in C&C Group plc
Date of grant Exercise price SchemeExercise
periodTotal at 1
March 2015 Awarded in
yearExercised in
year Lapsed in yearTotal at 29
February 2016
DirectorsJoris Brams
16/5/13 € 0.00 LTIP (Part I)16/5/16 -
15/5/19 154,172 (154,172) 0
16/5/13 €4.75 ESOS16/5/16 -
15/5/20 115,629 (115,629) 0
27/6/14 € 0.00 LTIP (Part I)27/6/17 -
26/6/20 158,476 158,476
27/6/14 €4.621 ESOS27/6/17 -
26/6/21 118,857 118,857
2/7/15 €0.00 LTIP (Part I)2/7/18 -
1/7/21 Nil 105,127 105,127
2/7/15 €3.483 ESOS2/7/18 -
1/7/22 Nil 157,691 157,691Total 547,134 262,818 269,801 540,151
Stephen Glancey
26/5/10 € 3.205 ESOS26/5/13 -
25/5/17 234,100 234,100
29/2/12 € 0.00 LTIP (Part I)1/3/15 - 28/2/18 28,773 28,773
27/6/14 € 0.00 LTIP (Part I)27/6/17 -
26/6/20 158,443 158,443
27/6/14 €4.621 ESOS27/6/17 -
26/6/21 237,664 237,664
2/7/15 €0.00 LTIP (Part I)2/7/18 -
1/7/21 Nil 237,028 237,028
2/7/15 €3.483 ESOS2/7/18 -
1/7/22 Nil 355,543 355,543Total 658,980 592,571 1,251,551
Kenny Neison
26/5/10 € 3.205 ESOS26/5/13 -
25/5/17 140,500 140,500
29/2/12 € 0.00 LTIP (Part I)1/3/15 - 28/2/18 20,658 20,658
27/6/14 € 0.00 LTIP (Part I)27/6/17 -
26/6/20 113,753 113,753
27/6/14 €4.621 ESOS27/6/17 -
26/6/21 170,630 170,630
2/7/15 €0.00 LTIP (Part I)2/7/18 -
1/7/21 Nil 170,174 170,174
2/7/15 €3.483 ESOS2/7/18 -
1/7/22 Nil 255,261 255,261Total 445,541 425,435 870,976
David Johnston
2/7/15 €0.00 LTIP (Part I)2/7/18 -
1/7/21 Nil 45,937 45,937Total Nil 45,937 45,937
Key: ESOS - Executive Share Option Scheme; LTIP (Part I) - Long Term Incentive Plan (Part I).
REPORT OF THE REMUNERATION COMMITTEE ON DIRECTORS’ REMUNERATION (CONTINUED)
82
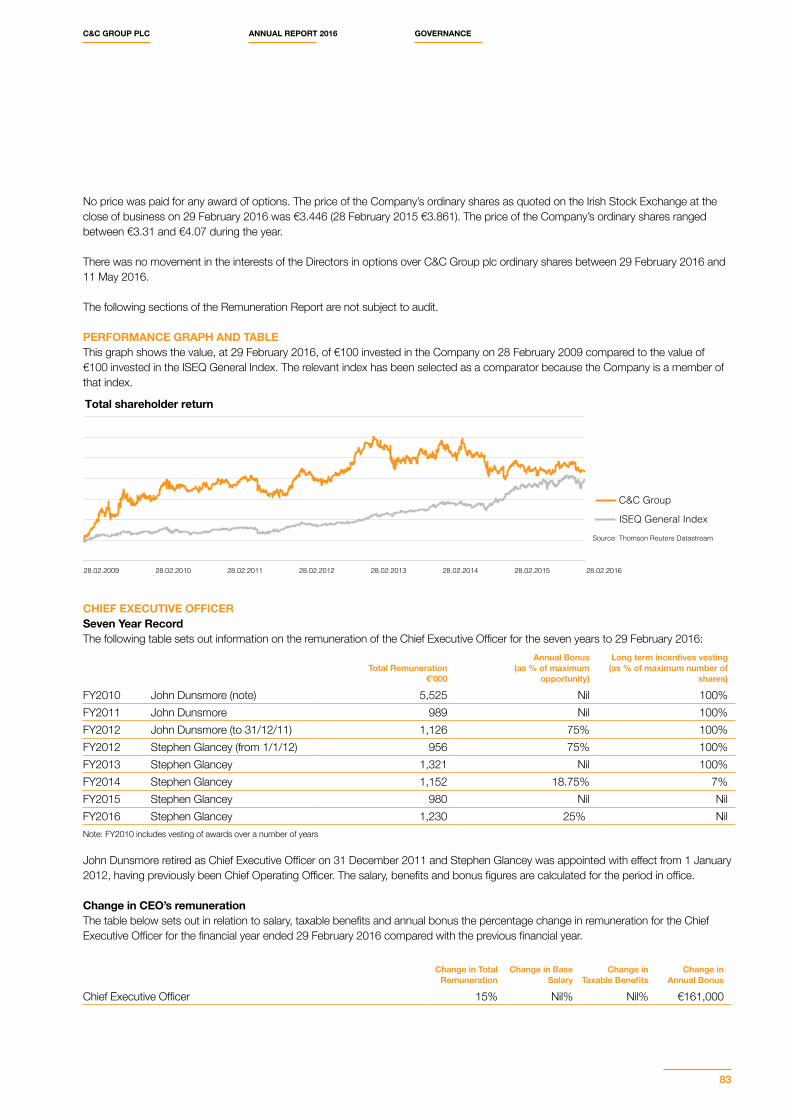
No price was paid for any award of options. The price of the Company’s ordinary shares as quoted on the Irish Stock Exchange at the close of business on 29 February 2016 was €3.446 (28 February 2015 €3.861). The price of the Company’s ordinary shares ranged between €3.31 and €4.07 during the year.
There was no movement in the interests of the Directors in options over C&C Group plc ordinary shares between 29 February 2016 and 11 May 2016.
The following sections of the Remuneration Report are not subject to audit.
PERFORMANCE GRAPH AND TABLEThis graph shows the value, at 29 February 2016, of €100 invested in the Company on 28 February 2009 compared to the value of €100 invested in the ISEQ General Index. The relevant index has been selected as a comparator because the Company is a member of that index.
CHIEF EXECUTIVE OFFICER Seven Year RecordThe following table sets out information on the remuneration of the Chief Executive Officer for the seven years to 29 February 2016:
Total Remuneration€’000
Annual Bonus (as % of maximum
opportunity)
Long term incentives vesting (as % of maximum number of
shares)
FY2010 John Dunsmore (note) 5,525 Nil 100%FY2011 John Dunsmore 989 Nil 100%FY2012 John Dunsmore (to 31/12/11) 1,126 75% 100%FY2012 Stephen Glancey (from 1/1/12) 956 75% 100%FY2013 Stephen Glancey 1,321 Nil 100%FY2014 Stephen Glancey 1,152 18.75% 7%FY2015 Stephen Glancey 980 Nil NilFY2016 Stephen Glancey 1,230 25% NilNote: FY2010 includes vesting of awards over a number of years
John Dunsmore retired as Chief Executive Officer on 31 December 2011 and Stephen Glancey was appointed with effect from 1 January 2012, having previously been Chief Operating Officer. The salary, benefits and bonus figures are calculated for the period in office.
Change in CEO’s remunerationThe table below sets out in relation to salary, taxable benefits and annual bonus the percentage change in remuneration for the Chief Executive Officer for the financial year ended 29 February 2016 compared with the previous financial year.
Change in TotalRemuneration
Change in Base Salary
Change in Taxable Benefits
Change in Annual Bonus
Chief Executive Officer 15% Nil% Nil% €161,000
C&C Group
ISEQ General Index
Total shareholder return
Source: Thomson Reuters Datastream
28.02.2009 28.02.2010 28.02.2011 28.02.2012 28.02.2013 28.02.2014 28.02.2015 28.02.2016
C&C GROUP PLC ANNUAL REPORT 2016 GOVERNANCE
83
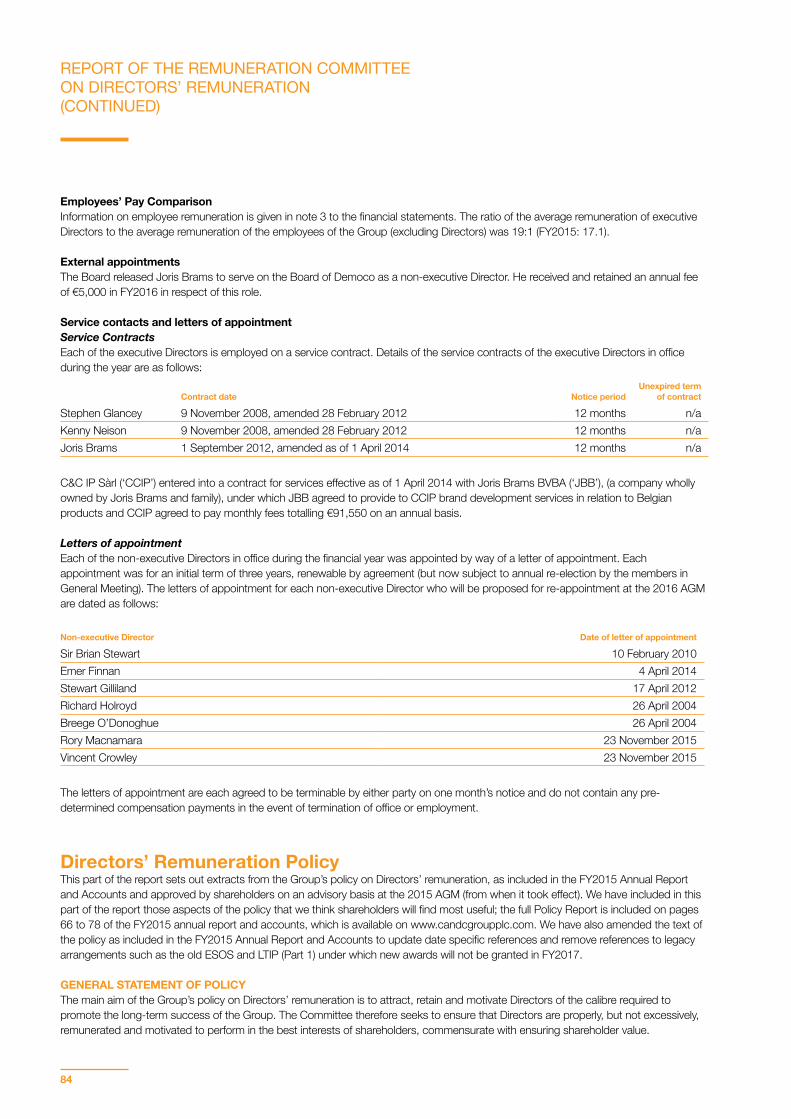
Employees’ Pay ComparisonInformation on employee remuneration is given in note 3 to the financial statements. The ratio of the average remuneration of executive Directors to the average remuneration of the employees of the Group (excluding Directors) was 19:1 (FY2015: 17.1).
External appointmentsThe Board released Joris Brams to serve on the Board of Democo as a non-executive Director. He received and retained an annual fee of €5,000 in FY2016 in respect of this role.
Service contacts and letters of appointmentService Contracts Each of the executive Directors is employed on a service contract. Details of the service contracts of the executive Directors in office during the year are as follows:
Contract date Notice periodUnexpired term
of contract
Stephen Glancey 9 November 2008, amended 28 February 2012 12 months n/aKenny Neison 9 November 2008, amended 28 February 2012 12 months n/aJoris Brams 1 September 2012, amended as of 1 April 2014 12 months n/a
C&C IP Sàrl (‘CCIP’) entered into a contract for services effective as of 1 April 2014 with Joris Brams BVBA (‘JBB’), (a company wholly owned by Joris Brams and family), under which JBB agreed to provide to CCIP brand development services in relation to Belgian products and CCIP agreed to pay monthly fees totalling €91,550 on an annual basis.
Letters of appointmentEach of the non-executive Directors in office during the financial year was appointed by way of a letter of appointment. Each appointment was for an initial term of three years, renewable by agreement (but now subject to annual re-election by the members in General Meeting). The letters of appointment for each non-executive Director who will be proposed for re-appointment at the 2016 AGM are dated as follows:
Non-executive Director Date of letter of appointment
Sir Brian Stewart 10 February 2010Emer Finnan 4 April 2014Stewart Gilliland 17 April 2012Richard Holroyd 26 April 2004Breege O’Donoghue 26 April 2004Rory Macnamara 23 November 2015Vincent Crowley 23 November 2015
The letters of appointment are each agreed to be terminable by either party on one month’s notice and do not contain any pre-determined compensation payments in the event of termination of office or employment.
Directors’ Remuneration PolicyThis part of the report sets out extracts from the Group’s policy on Directors’ remuneration, as included in the FY2015 Annual Report and Accounts and approved by shareholders on an advisory basis at the 2015 AGM (from when it took effect). We have included in this part of the report those aspects of the policy that we think shareholders will find most useful; the full Policy Report is included on pages 66 to 78 of the FY2015 annual report and accounts, which is available on www.candcgroupplc.com. We have also amended the text of the policy as included in the FY2015 Annual Report and Accounts to update date specific references and remove references to legacy arrangements such as the old ESOS and LTIP (Part 1) under which new awards will not be granted in FY2017.
GENERAL STATEMENT OF POLICY The main aim of the Group’s policy on Directors’ remuneration is to attract, retain and motivate Directors of the calibre required to promote the long-term success of the Group. The Committee therefore seeks to ensure that Directors are properly, but not excessively, remunerated and motivated to perform in the best interests of shareholders, commensurate with ensuring shareholder value.
REPORT OF THE REMUNERATION COMMITTEE ON DIRECTORS’ REMUNERATION (CONTINUED)
84

The Committee seeks to ensure that executive Directors’ remuneration is aligned with shareholders’ interests and the Group’s strategy. Share awards are therefore seen as the principal method of long-term incentivisation. Executive Directors are incentivised on a range of equity share structures, notably the significant share ownership held by Stephen Glancey and Kenny Neison through the JSOP. Similar principles are applied for senior management, several of whom have material equity holdings in the Company. Annual performance-related rewards aligned with the Group’s key financial, operational and strategic goals and based on stretching targets are a further component of the total executive remuneration package. For senior management, mechanisms are tailored to local requirements.
The Group seeks to bring transparency to executive Directors’ reward structures through the use of cash allowances in place of benefits in kind. In setting executive Directors’ remuneration the Committee has regard to pay levels and conditions applicable to other employees across the Group.
FUTURE POLICY TABLE Executive Directors’ remunerationElement SalaryPurpose and link to strategy Purpose is to attract, recruit and retain Directors of the necessary calibre.Operation Salary levels are determined by the Committee taking into account factors including:
• scope and responsibilities of the role; • experience and individual performance; • overall business performance;• prevailing market conditions;• pay in comparable companies, principally in the global beverage sector; and• overall risk of non-retention.
Opportunity Executive Directors are entitled to an annual review of their salary, but there is no entitlement to receive any increase.
The Committee may award salary increases to take account of individual circumstances such as:• increases or changes in scope and responsibility;• to reflect the executive Director’s development and performance in the role; or• alignment to market level.
In awarding increases, the Committee will have regard to the outcome of pay reviews for employees as a whole.
Performance metrics Not applicable.
Element Benefits/cash allowance in lieuPurpose and link to strategy Purpose is to attract, recruit, and retain Directors of the necessary calibre.Operation The Group seeks to bring transparency to Directors’ reward structures through the use of cash allowances
in place of benefits in kind. The cash allowance can be applied to benefits such as a company car and health benefits. Group benefits such as death in service insurance are also made available. Other benefits may be provided based on individual circumstances including housing or relocation allowances, travel allowance or other expatriate benefits. Benefits and allowances are reviewed alongside salary.
Opportunity The Committee has not set an absolute maximum on the levels of benefits that may be awarded since this will depend upon the circumstances applicable to the relevant Director as well as the cost of any third party suppliers. The value of the cash allowance/benefit is set at a level which the Committee considers appropriate against the market and provides sufficient level of benefit based on individual circumstances.
Performance metrics Not applicable.
C&C GROUP PLC ANNUAL REPORT 2016 GOVERNANCE
85
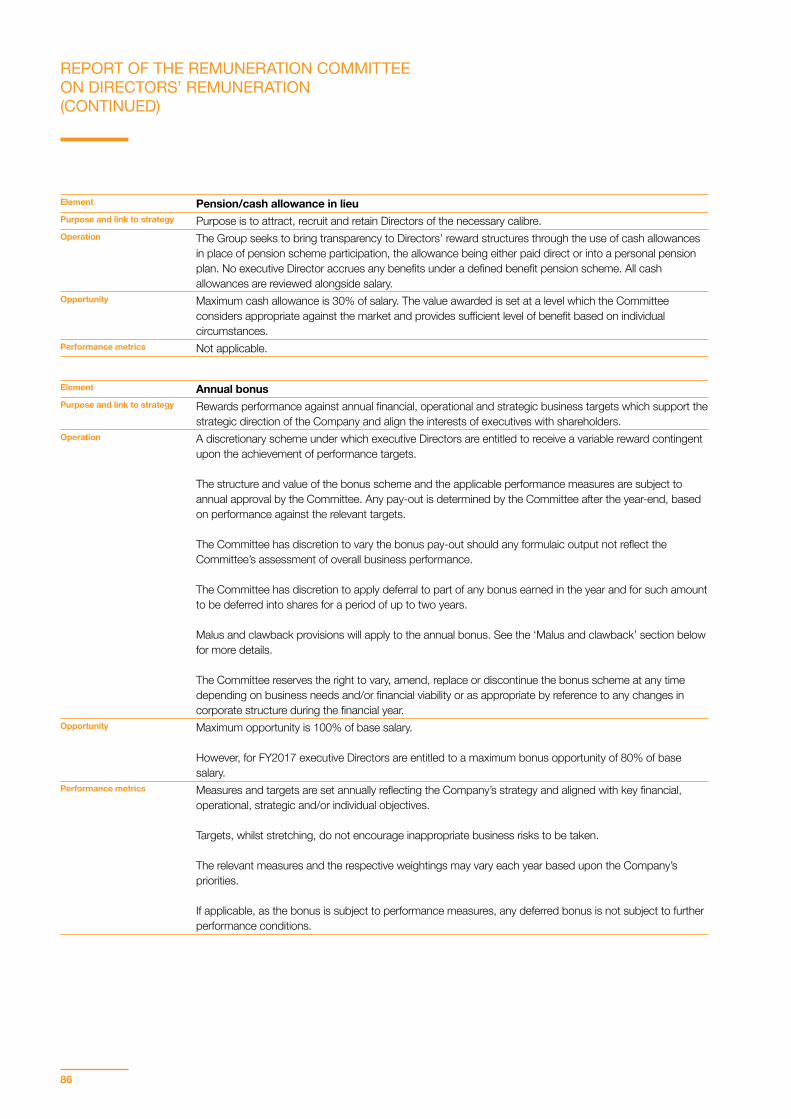
Element Pension/cash allowance in lieuPurpose and link to strategy Purpose is to attract, recruit and retain Directors of the necessary calibre.Operation The Group seeks to bring transparency to Directors’ reward structures through the use of cash allowances
in place of pension scheme participation, the allowance being either paid direct or into a personal pension plan. No executive Director accrues any benefits under a defined benefit pension scheme. All cash allowances are reviewed alongside salary.
Opportunity Maximum cash allowance is 30% of salary. The value awarded is set at a level which the Committee considers appropriate against the market and provides sufficient level of benefit based on individual circumstances.
Performance metrics Not applicable.
Element Annual bonusPurpose and link to strategy Rewards performance against annual financial, operational and strategic business targets which support the
strategic direction of the Company and align the interests of executives with shareholders.Operation A discretionary scheme under which executive Directors are entitled to receive a variable reward contingent
upon the achievement of performance targets.
The structure and value of the bonus scheme and the applicable performance measures are subject to annual approval by the Committee. Any pay-out is determined by the Committee after the year-end, based on performance against the relevant targets.
The Committee has discretion to vary the bonus pay-out should any formulaic output not reflect the Committee’s assessment of overall business performance.
The Committee has discretion to apply deferral to part of any bonus earned in the year and for such amount to be deferred into shares for a period of up to two years.
Malus and clawback provisions will apply to the annual bonus. See the ‘Malus and clawback’ section below for more details.
The Committee reserves the right to vary, amend, replace or discontinue the bonus scheme at any time depending on business needs and/or financial viability or as appropriate by reference to any changes in corporate structure during the financial year.
Opportunity Maximum opportunity is 100% of base salary.
However, for FY2017 executive Directors are entitled to a maximum bonus opportunity of 80% of base salary.
Performance metrics Measures and targets are set annually reflecting the Company’s strategy and aligned with key financial, operational, strategic and/or individual objectives.
Targets, whilst stretching, do not encourage inappropriate business risks to be taken.
The relevant measures and the respective weightings may vary each year based upon the Company’s priorities.
If applicable, as the bonus is subject to performance measures, any deferred bonus is not subject to further performance conditions.
REPORT OF THE REMUNERATION COMMITTEE ON DIRECTORS’ REMUNERATION (CONTINUED)
86
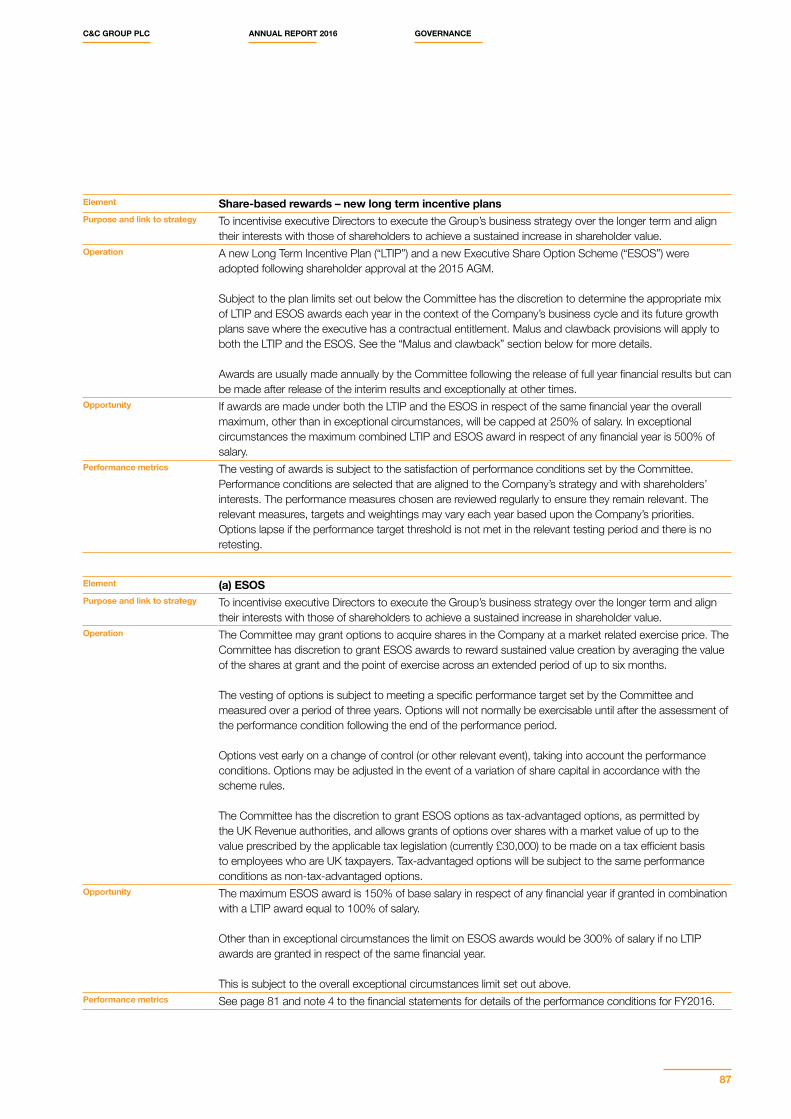
Element Share-based rewards – new long term incentive plansPurpose and link to strategy To incentivise executive Directors to execute the Group’s business strategy over the longer term and align
their interests with those of shareholders to achieve a sustained increase in shareholder value.Operation A new Long Term Incentive Plan (“LTIP”) and a new Executive Share Option Scheme (“ESOS”) were
adopted following shareholder approval at the 2015 AGM.
Subject to the plan limits set out below the Committee has the discretion to determine the appropriate mix of LTIP and ESOS awards each year in the context of the Company’s business cycle and its future growth plans save where the executive has a contractual entitlement. Malus and clawback provisions will apply to both the LTIP and the ESOS. See the “Malus and clawback” section below for more details.
Awards are usually made annually by the Committee following the release of full year financial results but can be made after release of the interim results and exceptionally at other times.
Opportunity If awards are made under both the LTIP and the ESOS in respect of the same financial year the overall maximum, other than in exceptional circumstances, will be capped at 250% of salary. In exceptional circumstances the maximum combined LTIP and ESOS award in respect of any financial year is 500% of salary.
Performance metrics The vesting of awards is subject to the satisfaction of performance conditions set by the Committee. Performance conditions are selected that are aligned to the Company’s strategy and with shareholders’ interests. The performance measures chosen are reviewed regularly to ensure they remain relevant. The relevant measures, targets and weightings may vary each year based upon the Company’s priorities. Options lapse if the performance target threshold is not met in the relevant testing period and there is no retesting.
Element (a) ESOSPurpose and link to strategy To incentivise executive Directors to execute the Group’s business strategy over the longer term and align
their interests with those of shareholders to achieve a sustained increase in shareholder value.Operation The Committee may grant options to acquire shares in the Company at a market related exercise price. The
Committee has discretion to grant ESOS awards to reward sustained value creation by averaging the value of the shares at grant and the point of exercise across an extended period of up to six months.
The vesting of options is subject to meeting a specific performance target set by the Committee and measured over a period of three years. Options will not normally be exercisable until after the assessment of the performance condition following the end of the performance period.
Options vest early on a change of control (or other relevant event), taking into account the performance conditions. Options may be adjusted in the event of a variation of share capital in accordance with the scheme rules.
The Committee has the discretion to grant ESOS options as tax-advantaged options, as permitted by the UK Revenue authorities, and allows grants of options over shares with a market value of up to the value prescribed by the applicable tax legislation (currently £30,000) to be made on a tax efficient basis to employees who are UK taxpayers. Tax-advantaged options will be subject to the same performance conditions as non-tax-advantaged options.
Opportunity The maximum ESOS award is 150% of base salary in respect of any financial year if granted in combination with a LTIP award equal to 100% of salary.
Other than in exceptional circumstances the limit on ESOS awards would be 300% of salary if no LTIP awards are granted in respect of the same financial year.
This is subject to the overall exceptional circumstances limit set out above.Performance metrics See page 81 and note 4 to the financial statements for details of the performance conditions for FY2016.
C&C GROUP PLC ANNUAL REPORT 2016 GOVERNANCE
87
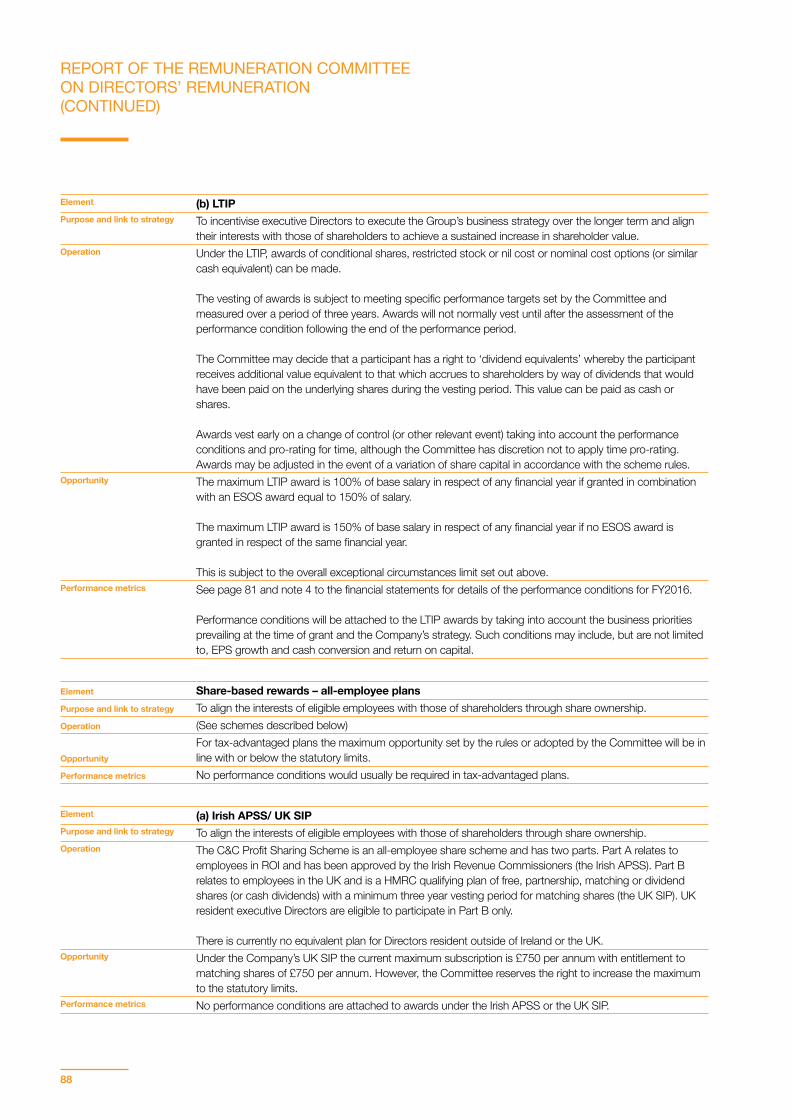
Element (b) LTIPPurpose and link to strategy To incentivise executive Directors to execute the Group’s business strategy over the longer term and align
their interests with those of shareholders to achieve a sustained increase in shareholder value.Operation Under the LTIP, awards of conditional shares, restricted stock or nil cost or nominal cost options (or similar
cash equivalent) can be made.
The vesting of awards is subject to meeting specific performance targets set by the Committee and measured over a period of three years. Awards will not normally vest until after the assessment of the performance condition following the end of the performance period.
The Committee may decide that a participant has a right to ‘dividend equivalents’ whereby the participant receives additional value equivalent to that which accrues to shareholders by way of dividends that would have been paid on the underlying shares during the vesting period. This value can be paid as cash or shares.
Awards vest early on a change of control (or other relevant event) taking into account the performance conditions and pro-rating for time, although the Committee has discretion not to apply time pro-rating. Awards may be adjusted in the event of a variation of share capital in accordance with the scheme rules.
Opportunity The maximum LTIP award is 100% of base salary in respect of any financial year if granted in combination with an ESOS award equal to 150% of salary.
The maximum LTIP award is 150% of base salary in respect of any financial year if no ESOS award is granted in respect of the same financial year.
This is subject to the overall exceptional circumstances limit set out above.Performance metrics See page 81 and note 4 to the financial statements for details of the performance conditions for FY2016.
Performance conditions will be attached to the LTIP awards by taking into account the business priorities prevailing at the time of grant and the Company’s strategy. Such conditions may include, but are not limited to, EPS growth and cash conversion and return on capital.
Element Share-based rewards – all-employee plansPurpose and link to strategy To align the interests of eligible employees with those of shareholders through share ownership.Operation (See schemes described below)
OpportunityFor tax-advantaged plans the maximum opportunity set by the rules or adopted by the Committee will be in line with or below the statutory limits.
Performance metrics No performance conditions would usually be required in tax-advantaged plans.
Element (a) Irish APSS/ UK SIPPurpose and link to strategy To align the interests of eligible employees with those of shareholders through share ownership.Operation The C&C Profit Sharing Scheme is an all-employee share scheme and has two parts. Part A relates to
employees in ROI and has been approved by the Irish Revenue Commissioners (the Irish APSS). Part B relates to employees in the UK and is a HMRC qualifying plan of free, partnership, matching or dividend shares (or cash dividends) with a minimum three year vesting period for matching shares (the UK SIP). UK resident executive Directors are eligible to participate in Part B only.
There is currently no equivalent plan for Directors resident outside of Ireland or the UK.Opportunity Under the Company’s UK SIP the current maximum subscription is £750 per annum with entitlement to
matching shares of £750 per annum. However, the Committee reserves the right to increase the maximum to the statutory limits.
Performance metrics No performance conditions are attached to awards under the Irish APSS or the UK SIP.
REPORT OF THE REMUNERATION COMMITTEE ON DIRECTORS’ REMUNERATION (CONTINUED)
88
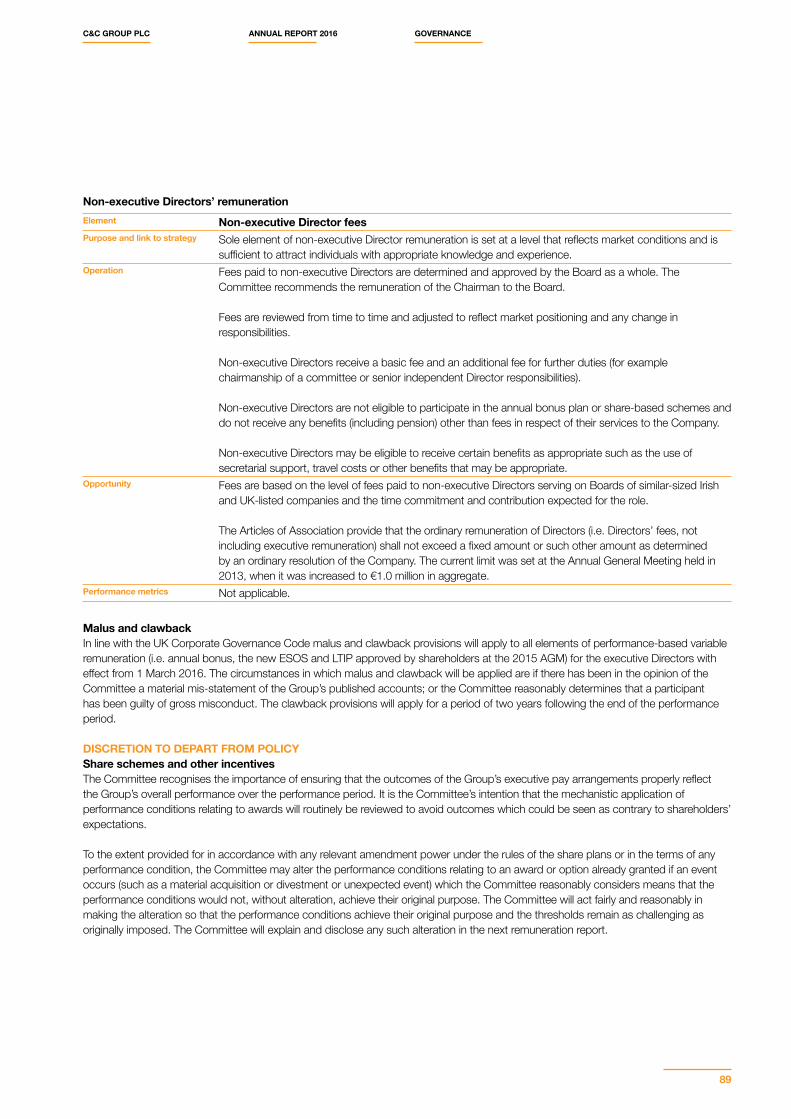
Non-executive Directors’ remuneration Element Non-executive Director feesPurpose and link to strategy Sole element of non-executive Director remuneration is set at a level that reflects market conditions and is
sufficient to attract individuals with appropriate knowledge and experience.Operation Fees paid to non-executive Directors are determined and approved by the Board as a whole. The
Committee recommends the remuneration of the Chairman to the Board.
Fees are reviewed from time to time and adjusted to reflect market positioning and any change in responsibilities.
Non-executive Directors receive a basic fee and an additional fee for further duties (for example chairmanship of a committee or senior independent Director responsibilities).
Non-executive Directors are not eligible to participate in the annual bonus plan or share-based schemes and do not receive any benefits (including pension) other than fees in respect of their services to the Company.
Non-executive Directors may be eligible to receive certain benefits as appropriate such as the use of secretarial support, travel costs or other benefits that may be appropriate.
Opportunity Fees are based on the level of fees paid to non-executive Directors serving on Boards of similar-sized Irish and UK-listed companies and the time commitment and contribution expected for the role.
The Articles of Association provide that the ordinary remuneration of Directors (i.e. Directors’ fees, not including executive remuneration) shall not exceed a fixed amount or such other amount as determined by an ordinary resolution of the Company. The current limit was set at the Annual General Meeting held in 2013, when it was increased to €1.0 million in aggregate.
Performance metrics Not applicable.
Malus and clawbackIn line with the UK Corporate Governance Code malus and clawback provisions will apply to all elements of performance-based variable remuneration (i.e. annual bonus, the new ESOS and LTIP approved by shareholders at the 2015 AGM) for the executive Directors with effect from 1 March 2016. The circumstances in which malus and clawback will be applied are if there has been in the opinion of the Committee a material mis-statement of the Group’s published accounts; or the Committee reasonably determines that a participant has been guilty of gross misconduct. The clawback provisions will apply for a period of two years following the end of the performance period.
DISCRETION TO DEPART FROM POLICYShare schemes and other incentivesThe Committee recognises the importance of ensuring that the outcomes of the Group’s executive pay arrangements properly reflect the Group’s overall performance over the performance period. It is the Committee’s intention that the mechanistic application of performance conditions relating to awards will routinely be reviewed to avoid outcomes which could be seen as contrary to shareholders’ expectations.
To the extent provided for in accordance with any relevant amendment power under the rules of the share plans or in the terms of any performance condition, the Committee may alter the performance conditions relating to an award or option already granted if an event occurs (such as a material acquisition or divestment or unexpected event) which the Committee reasonably considers means that the performance conditions would not, without alteration, achieve their original purpose. The Committee will act fairly and reasonably in making the alteration so that the performance conditions achieve their original purpose and the thresholds remain as challenging as originally imposed. The Committee will explain and disclose any such alteration in the next remuneration report.
C&C GROUP PLC ANNUAL REPORT 2016 GOVERNANCE
89
Legacy paymentsThe Committee reserves the right to make any remuneration payment or any payment for loss of office without the need to consult with shareholders or seek their approval, notwithstanding that it is not in line with the policy set out above, where the terms of the payment were agreed either:• before the policy came into effect; or • at a time when the relevant individual was not a Director of the Company and, in the opinion of the Committee, the payment was not in
consideration for the individual becoming a Director of the Company.
For these purposes: the term ‘payment’ includes any award of variable remuneration; in relation to an award over shares, the terms of the payment are ‘agreed’ at the time the award is granted.
Minor changesThe Committee may, without the need to consult with shareholders or seek their approval, make minor changes to this policy to aid in its operation or implementation taking into account the interests of shareholders.
This report was approved by the Board and signed on its behalf by
Breege O’Donoghue Chairman of the Remuneration Committee11 May 2016
REPORT OF THE REMUNERATION COMMITTEE ON DIRECTORS’ REMUNERATION (CONTINUED)
90
The Directors are responsible for preparing the Annual Report and the Group and Company financial statements, in accordance with applicable law and regulations.
Company law requires the Directors to prepare Group and Company financial statements for each financial year. Under that law, the Directors are required to prepare the Group financial statements in accordance with International Financial Reporting Standards (‘IFRSs’) as adopted by the EU, and have elected to prepare the Company financial statements in accordance with the requirements of the Companies Act 2014 and Financial Reporting Standard 101 ‘Reduced Disclosure Framework’ (‘FRS 101’) , issued by the Financial Reporting Council in the UK and promulgated by the Institute of Chartered Accountants in Ireland.
The Group financial statements are required by law and IFRSs as adopted by the EU to present fairly the financial position and performance of the Group. The Company financial statements are required by law to give a true and fair view of the state of affairs of the Company.
In preparing each of the Group and Company financial statements the Directors are required to:• select suitable accounting policies and apply them consistently;• make judgements and estimates that are reasonable and prudent;• state that the Group financial statements comply with IFRS as adopted by the EU and as regards the Company, comply with FRS 101
together with the requirements of the Companies Act 2014; and• prepare the financial statements on the going concern basis, unless it is inappropriate to presume that the Group and Company will
continue in business.
The Directors are also required by the Transparency (Directive 2004/109/EC0 Regulations 2007) and the interim Transparency Rules of the Irish Financial Services Regulatory Authority to include a management report containing a fair review of the business and a description of the principal risks and uncertainties facing the Group.
The Directors are responsible for adequate accounting records which disclose with reasonable accuracy at any time the assets, liabilities, financial position and profit or loss of the Company, and which will enable them to ensure that the financial statements of the Group are prepared in accordance with applicable IFRS as adopted by the European Union and comply with the provisions of the Companies Act 2014, and, as regards to the Group financial statements, Article 4 of the European Communities (International Financial Reporting Standards and Miscellaneous Amendments) Regulations 2005 (the ‘IAS Regulation’). They are also responsible for safeguarding the assets of the Company and the Group, and hence for taking reasonable steps for the prevention and detection of fraud and other irregularities.
The Directors are responsible for the maintenance and integrity of the corporate and financial information included on the Company’s website (‘www.candcgroupplc.com’). Legislation in Ireland concerning the preparation and dissemination of financial statements may differ from legislation in other jurisdictions.
STATEMENT OF DIRECTORS’ RESPONSIBILITIES
C&C GROUP PLC ANNUAL REPORT 2016 GOVERNANCE
91
RESPONSIBILITY STATEMENT AS REQUIRED BY THE TRANSPARENCY DIRECTIVE AND UK CORPORATE GOVERNANCE CODEEach of the Directors, whose names and functions are listed on pages 54 and 55 of this Annual Report, confirm that, to the best of each person’s knowledge and belief:• The Group Financial Statements, prepared in accordance with IFRS as adopted by the European Union and the Company financial
statements prepared in accordance with FRS 101, as applied in accordance with the Companies Act 2014, give a true and fair view of the assets, liabilities, financial position of the Group and Company at 29 February 2016 and of the profit or loss of the Group for the year then ended;
• The Directors’ report contained in the Annual Report includes a fair review of the development and performance of the business and the position of the Group and Company, together with a description of the principal risks and uncertainties that they face; and
• The annual report and financial statements, taken as a whole, provides the information necessary to assess the Group’s performance, business model and strategy and is fair, balanced and understandable and provides the information necessary for shareholders to assess the company’s position and performance, business model and strategy.
On behalf of the Board
Sir Brian Stewart Stephen Glancey Chairman Group Chief Executive Officer
STATEMENT OF DIRECTORS’ RESPONSIBILITIES (CONTINUED)
92
93
Financial Statements
IN THIS SECTION
Independent Auditor’s Report
Group Income Statement
Group Statement of Comprehensive Income
Group Balance Sheet
Group Cash Flow Statement
Group Statement of Changes in Equity
Company Balance Sheet
Company Statement of Changes In Equity
Statement of Accounting Policies
Notes Forming Part of the Financial Statements
Financial Definitions
94
98
99
100
101
102
103
104
105
118
185
93
94
OPINIONS AND CONCLUSIONS ARISING FROM OUR AUDIT
1 OUR OPINION ON THE FINANCIAL STATEMENTS IS UNMODIFIEDWe have audited the financial statements of C&C Group plc for the year ended 29 February 2016 set out on pages 98 to 184 which comprise the Group Income Statement, the Group Statement of Comprehensive Income, the Group and Company Balance Sheets, the Group Cash Flow Statement, the Group and Company Statement of Changes in Equity, and the related notes. The financial reporting framework that has been applied in their preparation is Irish law and International Financial Reporting Standards (IFRS) as adopted by the European Union, and, as regards the Company financial statements, as applied in accordance with FRS 101 Reduced Disclosure Framework (“FRS 101”) and the provisions of the Companies Act 2014. Our audit was conducted in accordance with International Standards on Auditing (ISAs) (UK & Ireland).
In our opinion:• the Group financial statements give a true and fair view of the assets, liabilities and financial position of the Group as at 29 February
2016 and of its profit for the year then ended; • the Company statement of financial position gives a true and fair view of the assets, liabilities and financial position of the Company as
at 29 February 2016;• the Group financial statements have been properly prepared in accordance with IFRS as adopted by the European Union;• the Company financial statements have been properly prepared in accordance with FRS 101 as applied in accordance with the
provisions of the Companies Act 2014; and• the Group financial statements and Company financial statements have been properly prepared in accordance with the requirements
of the Companies Act 2014 and, as regards the Group financial statements, Article 4 of the IAS Regulation.
2 OUR ASSESSMENT OF RISKS OF MATERIAL MISSTATEMENTThe risks of material misstatement detailed in this section of this report are those risks that we have deemed, in our professional judgement, to have had the greatest effect on: the overall audit strategy; the allocation of resources in our audit; and directing the efforts of the engagement team. Our audit procedures relating to these risks were designed in the context of our audit of the financial statements as a whole. Our opinion on the financial statements is not modified with respect to any of these risks, and we do not express an opinion on these individual risks.
In arriving at our audit opinion above on the Group financial statements, the risks of material misstatement that had the greatest effect on our Group audit were as follows:
Impairment assessment of intangibles and goodwill contained in the North America operating segment – Year end balance of €147.1 million (2015: Year end balance of €143.5 million after impairment charge of €150 million recorded in the prior year)
Refer to pages 65 and 66 (Audit Committee Report), page 110 (accounting policy) and note 12 to the financial statements.
The riskAs detailed in the accounting policy note on page 110, an impairment review of intangible assets and goodwill is performed annually by the Group. During the prior year an impairment charge of €150 million was recorded against the carrying value of these assets. There is a risk that the carrying value of the intangible assets and goodwill in the North America operating segment may not be recovered from future cashflows. There is inherent uncertainty involved in preparing forecasts and discounted future cash flow projections for this purpose and significant judgement is involved in relation to the assumptions used in the Group’s goodwill impairment model for the purposes of assessing the carrying value of the assets.
Our responseIn this area, our audit procedures included, amongst others, reviewing the appropriateness of management’s identification of cash generating units (“CGUs”) within the North America operating segment and the allocation of intangible assets, which are largely brands arising from acquisitions, to these CGUs, evaluating the assumptions and methodologies used by the Group, in particular those relating to revenue growth, operating profit and the discount rate and terminal growth rate applied to the forecasted cash flows in the model. We compared the Group’s assumptions with externally derived data as well as our own assessment in relation to key inputs into the model. We challenged the sensitivity analysis performed by management and performed our own sensitivity analysis in relation to the key assumptions. We also assessed whether the disclosures in note 12 presented the Group’s assumptions in relation to goodwill impairment and whether sensitivities of the outcome of the impairment assessment appropriately reflected the risks inherent in the valuation of goodwill.
INDEPENDENT AUDITOR’S REPORT TO THE MEMBERS OF C&C GROUP PLC
C&C GROUP PLC ANNUAL REPORT 2016 FINANCIAL STATEMENTS
95
We also performed similar procedures, to those outlined above, to management’s assessment of the carrying value of intangible assets and goodwill allocated to the Group’s other operating segments and the related disclosures.
We considered the difference between the market capitalisation of the Group and the book value of the Group’s net assets which indicated that the market capitalisation exceeded the book value by €426 million at 29 February 2016 (2015: €573 million).
Carrying value of Property, Plant and Equipment (‘PP&E’) – €190.3 million (2015: €218.9 million)Refer to pages 65 and 66 (Audit Committee Report), pages 111 to 112 (accounting policy) and note 11 to the financial statements.
The riskThe Group carries its land and buildings and plant and machinery at fair value. The freehold land and buildings in Ireland, Portugal and North America and certain assets in the UK are valued using a market approach. The Group’s remaining land and buildings assets in the UK, and its plant and machinery in Ireland, the UK and the US are valued using the Depreciated Replacement Cost (DRC) method.
During the prior year the fair value of the majority of the Group’s PP&E assets were determined by independent external property and plant valuation experts whilst certain assets were subject to internal valuations.
Such valuations were determined internally in the current year and significant judgement is exercised in determining the appropriate assumptions underlying the valuation, including amongst others, market based assumptions, plant replacement costs and plant utilisation levels.
During the year the Group announced the closure and proposed disposal of certain of its facilities in Ireland and England. The Group has engaged independent property experts to value these assets.
There is inherent uncertainty involved in preparing valuations when there is a lack of liquidity in the market and benchmark data for similar assets in similar locations given the specialised nature of the Group’s assets.
Our responseIn relation to land and buildings and plant and machinery internally valued by management, our audit procedures included assessing and challenging the key assumptions underpinning the valuations. We considered whether the assumptions were consistent with external market information, where available.
In relation to the Group’s land and buildings and plant and machinery which was valued externally, we inspected the valuation reports performed by the external valuation experts, in order to assess the integrity of the data and key assumptions underpinning the valuations. We challenged the assumptions underlying the valuations prepared by the valuers and considered whether the assumptions were consistent with external market information, where available. We also assessed the independence and qualifications of the valuers.
3 OUR APPLICATION OF MATERIALITY AND AN OVERVIEW OF THE SCOPE OF OUR AUDITThe materiality for the Group financial statements as a whole was set at €4.75 million (2015: €5.5 million). This has been calculated using a benchmark of 5% of Group profit before taxation as normalised for non-recurring items, which we have determined, in our professional judgement, to be one of the principal benchmarks within the financial statements relevant to members of the Company in assessing financial performance. We believe that materiality for the financial statements as a whole is more appropriately determined based on profit before tax excluding exceptional items which, based on the Group’s exceptional items accounting policy set out on page 108, reflects a measure of profit before tax excluding items of income and expenditure which, by virtue of their scale and nature, are separately highlighted by the Group in its financial reporting.
We report to the Audit Committee all corrected and uncorrected misstatements we identified through our audit in excess of €250,000 (2015: €275,000), in addition to other audit misstatements below that threshold that we believe warranted reporting on qualitative grounds.
The structure of the Group’s finance function is such that certain transactions and balances are accounted for by the Group finance team, with the remainder accounted for in the operating units. We performed audit procedures, including those in relation to the significant risks set out above, on those transactions and balances accounted for at operating unit and Group level. In relation to the operating units, audits for Group reporting purposes were performed at each of the key operating units of the Group. These audits covered 99.9% of Group revenue, 99.8% of Group profit before tax and 99.8% of Group total assets.
96
The audits undertaken for Group reporting purposes at the key operating units of the Group were all performed to component materiality levels set by the Group audit team. These component materiality levels were set individually and ranged from €0.6 million to €3.6 million.
Detailed audit instructions were sent to all the auditors in all of the identified locations. These instructions covered the significant audit areas that should be covered by these audits (which included the relevant risks of material misstatement detailed above) and set out the information required to be reported to the Group audit team. Members of the Group audit engagement team including the Group Engagement Partner attended the closing meetings for each of the significant operating components in person or by telephone at which the results of the business unit audit were discussed with local and Group management. Members of the Group audit engagement team and the Group Engagement Partner attended the closing meeting at which the results of all operating units were discussed with the Group’s Chief Financial Officer and senior members of the Group finance team.
One subsidiary was not in scope for Group reporting purposes. For this subsidiary, we performed other procedures to confirm there were no significant risks of material misstatements to the Group financial statements.
4 WE HAVE NOTHING TO REPORT ON THE DISCLOSURES OF PRINCIPAL RISKSBased on the knowledge we acquired during our audit, we have nothing material to add or draw attention to in relation to:• the Directors’ statement of principal risks and uncertainties on pages 24, 25 and 26, concerning the principal risks, their management,
and based on that statement, the directors’ assessment and expectations of the Group’s continuing operations over 3 years to 2019;• the disclosures in the significant accounting policies to the financial statements concerning the use of the going concern basis of
accounting.
5 WE HAVE NOTHING TO REPORT IN RESPECT OF MATTERS ON WHICH WE ARE REQUIRED TO REPORT BY EXCEPTIONISAs (UK and Ireland) require that we report to you if, based on the knowledge we acquired during our audit, we have identified information in the annual report that contains a material inconsistency with either that knowledge or the financial statements, a material misstatement of fact, or that is otherwise misleading.In particular, we are required to report to you if:• we have identified any inconsistencies between the knowledge we acquired during our audit and the directors’ statement that they
consider the annual report is fair, balanced and understandable and provides the information necessary for shareholders to assess the entity’s performance, business model and strategy; or
• the Report of the Audit Committee does not appropriately disclose those matters that we communicated to the Audit Committee.
The Listing Rules of the Irish Stock Exchange require us to review:• the directors’ statement, set out on page 71, in relation to going concern;• the part of the Directors’ Statement on Corporate Governance on pages 60 to 64 relating to the Company’s compliance with the
provisions of the UK Corporate Governance Code and the provisions of the Irish Corporate Governance Annex specified for our review; and
• certain elements of disclosures to shareholders by the Board in the Report on Directors’ Remuneration.
In addition, the Companies Act requires us to report to you if, in our opinion, the disclosures of directors’ remuneration and transactions specified by law are not made.
6 OUR CONCLUSIONS ON OTHER MATTERS ON WHICH WE ARE REQUIRED TO REPORT BY THE COMPANIES 2014 ARE SET OUT BELOWWe have obtained all the information and explanations which we consider necessary for the purposes of our audit.In our opinion the accounting records of the Company were sufficient to permit the financial statements to be readily and properly audited and the financial statements are in agreement with the accounting records.
In our opinion the information given in the Directors’ Report is consistent with the financial statements and the description in the Directors’ Statement of Corporate Governance of the main features of the internal control and risk management systems in relation to the process for preparing the Group financial statements is consistent with the Group financial statements.
INDEPENDENT AUDITOR’S REPORT TO THE MEMBERS OF C&C GROUP PLC(CONTINUED)
C&C GROUP PLC ANNUAL REPORT 2016 FINANCIAL STATEMENTS
97
In addition, we report in relation to information given in the Corporate Governance statement on pages 60 to 71 that:• based on knowledge and understanding of the Company and its environment obtained in the course of the audit, no material
misstatements in the information identified above have come to our attention.• based on our work undertaken in the course of our audit, in our opinion:
- the description of the main features of the internal control and risk management systems in relation to the voting rights and other matters required by the European Communities (Takeover Bids (Directive 2004/25/EC)) Regulations 2006, and specified by the Companies Act 2014 for our consideration, are consistent with the financial statements and have been prepared in accordance with the Companies Act 2014.
- The Corporate Governance statement contains the information required by the Companies Act 2014.
Basis of our report, responsibilities and restrictions on useAs explained more fully in the Statement of Directors’ Responsibilities set out on pages 91 and 92, the directors are responsible for the preparation of the financial statements and for being satisfied that they give a true and fair view. Our responsibility is to audit and express an opinion on the Group and Company financial statements in accordance with applicable law and International Standards on Auditing (ISAs) (UK and Ireland). Those standards require us to comply with the Financial Reporting Council’s Ethical Standards for Auditors.
An audit undertaken in accordance with ISAs (UK and Ireland) involves obtaining evidence about the amounts and disclosures in the financial statements sufficient to give reasonable assurance that the financial statements are free from material misstatement, whether caused by fraud or error. This includes an assessment of: whether the accounting policies are appropriate to the Group’s circumstances and have been consistently applied and adequately disclosed; the reasonableness of significant accounting estimates made by the directors; and the overall presentation of the financial statements.
In addition, we read all the financial and non-financial information in the Annual Report to identify material inconsistencies with the audited financial statements and to identify any information that is apparently materially incorrect based on, or materially inconsistent with, the knowledge acquired by us in the course of performing our audit. If we become aware of any apparent material misstatements or inconsistencies we consider the implications for our report.
Whilst an audit conducted in accordance with ISAs (UK and Ireland) is designed to provide reasonable assurance of identifying material misstatements or omissions it is not guaranteed to do so. Rather the auditor plans the audit to determine the extent of testing needed to reduce to an appropriately low level the probability that the aggregate of uncorrected and undetected misstatements does not exceed materiality for the financial statements as a whole. This testing requires us to conduct significant audit work on a broad range of assets, liabilities, income and expenses as well as devoting significant time of the most experienced members of the audit team, in particular the engagement partner responsible for the audit, to subjective areas of accounting and reporting.
Our report is made solely to the Company’s members, as a body, in accordance with Section 391 of the Companies Act 2014. Our audit work has been undertaken so that we might state to the Company’s members those matters we are required to state to them in an auditor’s report and for no other purpose. To the fullest extent permitted by law, we do not accept or assume responsibility to anyone other than the Company and the Company’s members as a body, for our audit work, for this report, or for the opinions we have formed.
11 May 2016Cliona Mullen for and on behalf of
Chartered Accountants, Statutory Audit Firm1 Stokes PlaceSt. Stephen’s GreenDublin 2Ireland
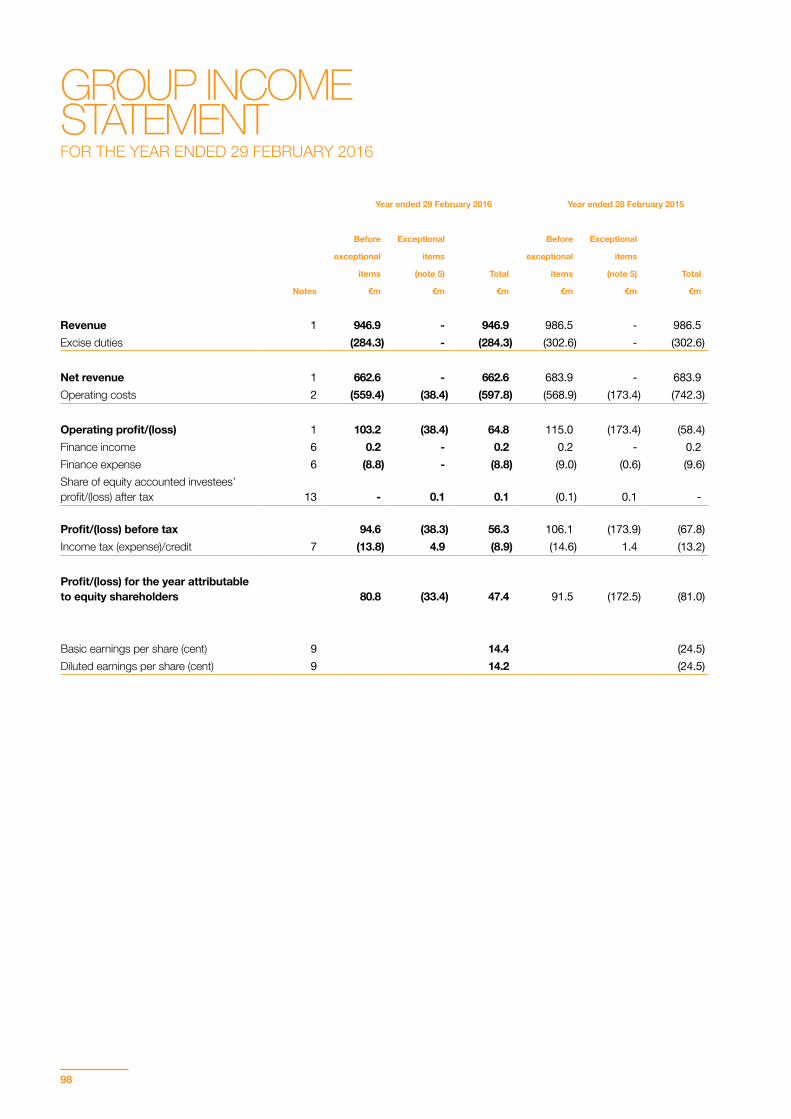
98
Year ended 29 February 2016 Year ended 28 February 2015
Before Exceptional Before Exceptional
exceptional items exceptional items
items (note 5) Total items (note 5) Total
Notes €m €m €m €m €m €m
Revenue 1 946.9 - 946.9 986.5 - 986.5Excise duties (284.3) - (284.3) (302.6) - (302.6)
Net revenue 1 662.6 - 662.6 683.9 - 683.9Operating costs 2 (559.4) (38.4) (597.8) (568.9) (173.4) (742.3)
Operating profit/(loss) 1 103.2 (38.4) 64.8 115.0 (173.4) (58.4)Finance income 6 0.2 - 0.2 0.2 - 0.2Finance expense 6 (8.8) - (8.8) (9.0) (0.6) (9.6)Share of equity accounted investees’ profit/(loss) after tax 13 - 0.1 0.1 (0.1) 0.1 -
Profit/(loss) before tax 94.6 (38.3) 56.3 106.1 (173.9) (67.8)Income tax (expense)/credit 7 (13.8) 4.9 (8.9) (14.6) 1.4 (13.2)
Profit/(loss) for the year attributable to equity shareholders 80.8 (33.4) 47.4 91.5 (172.5) (81.0)
Basic earnings per share (cent) 9 14.4 (24.5)Diluted earnings per share (cent) 9 14.2 (24.5)
GROUP INCOME STATEMENT FOR THE YEAR ENDED 29 FEBRUARY 2016
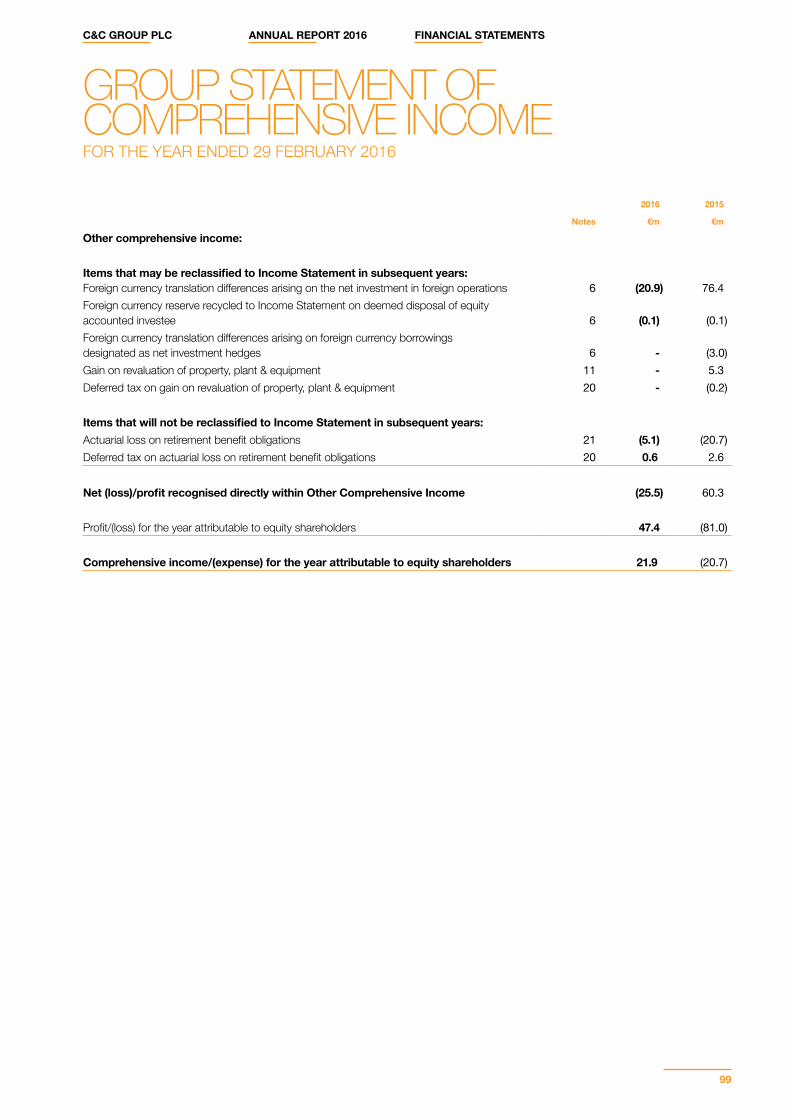
C&C GROUP PLC ANNUAL REPORT 2016 FINANCIAL STATEMENTS
99
2016 2015
Notes €m €m
Other comprehensive income:
Items that may be reclassified to Income Statement in subsequent years:Foreign currency translation differences arising on the net investment in foreign operations 6 (20.9) 76.4Foreign currency reserve recycled to Income Statement on deemed disposal of equity accounted investee 6 (0.1) (0.1)Foreign currency translation differences arising on foreign currency borrowings designated as net investment hedges 6 - (3.0)Gain on revaluation of property, plant & equipment 11 - 5.3Deferred tax on gain on revaluation of property, plant & equipment 20 - (0.2)
Items that will not be reclassified to Income Statement in subsequent years:Actuarial loss on retirement benefit obligations 21 (5.1) (20.7)Deferred tax on actuarial loss on retirement benefit obligations 20 0.6 2.6
Net (loss)/profit recognised directly within Other Comprehensive Income (25.5) 60.3
Profit/(loss) for the year attributable to equity shareholders 47.4 (81.0)
Comprehensive income/(expense) for the year attributable to equity shareholders 21.9 (20.7)
GROUP STATEMENT OF COMPREHENSIVE INCOME FOR THE YEAR ENDED 29 FEBRUARY 2016
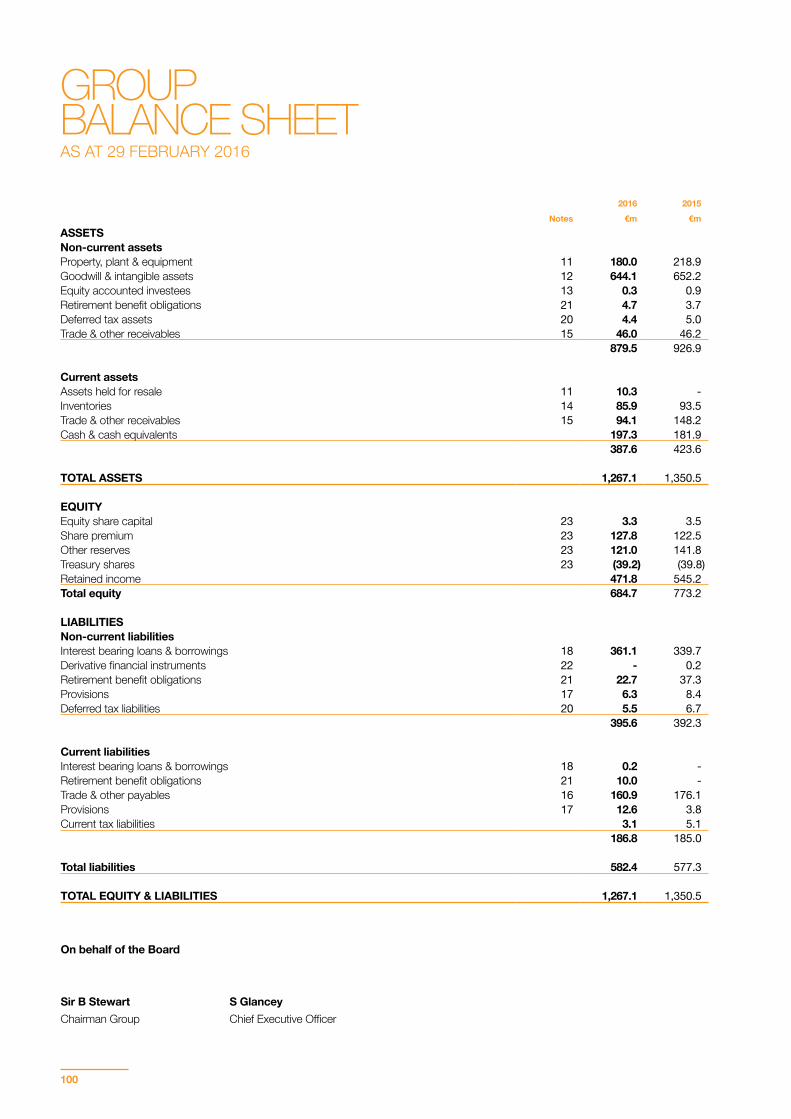
100
2016 2015Notes €m €m
ASSETSNon-current assetsProperty, plant & equipment 11 180.0 218.9Goodwill & intangible assets 12 644.1 652.2Equity accounted investees 13 0.3 0.9Retirement benefit obligations 21 4.7 3.7Deferred tax assets 20 4.4 5.0Trade & other receivables 15 46.0 46.2
879.5 926.9
Current assetsAssets held for resale 11 10.3 -Inventories 14 85.9 93.5Trade & other receivables 15 94.1 148.2Cash & cash equivalents 197.3 181.9
387.6 423.6
TOTAL ASSETS 1,267.1 1,350.5
EQUITYEquity share capital 23 3.3 3.5Share premium 23 127.8 122.5Other reserves 23 121.0 141.8Treasury shares 23 (39.2) (39.8)Retained income 471.8 545.2Total equity 684.7 773.2
LIABILITIESNon-current liabilitiesInterest bearing loans & borrowings 18 361.1 339.7Derivative financial instruments 22 - 0.2Retirement benefit obligations 21 22.7 37.3Provisions 17 6.3 8.4Deferred tax liabilities 20 5.5 6.7
395.6 392.3
Current liabilitiesInterest bearing loans & borrowings 18 0.2 -Retirement benefit obligations 21 10.0 -Trade & other payables 16 160.9 176.1Provisions 17 12.6 3.8 Current tax liabilities 3.1 5.1
186.8 185.0
Total liabilities 582.4 577.3
TOTAL EQUITY & LIABILITIES 1,267.1 1,350.5
On behalf of the Board
Sir B Stewart S Glancey Chairman Group Chief Executive Officer
GROUP BALANCE SHEET AS AT 29 FEBRUARY 2016

C&C GROUP PLC ANNUAL REPORT 2016 FINANCIAL STATEMENTS
101
2016 2015Notes €m €m
CASH FLOWS FROM OPERATING ACTIVITIESProfit/(loss) for the year attributable to equity shareholders 47.4 (81.0)Finance income (0.2) (0.2)Finance expense 8.8 9.6Income tax expense 8.9 13.2Impairment of intangible assets - 150.0Profit on share of equity accounted investee (0.1) -Revaluation/impairment of property, plant & equipment 16.0 13.8Impairment of investment in equity accounted investee - 2.0Depreciation of property, plant & equipment 19.1 24.6Amortisation of intangible assets 0.3 0.3Net profit on disposal of property, plant & equipment (0.2) (4.4)Charge for equity settled share-based payments 0.5 0.2Pension contributions paid less amount charged to income statement (11.0) (8.3)
89.5 119.8
Decrease/(increase) in inventories 4.3 (6.3)Decrease in trade & other receivables 45.9 11.9Decrease in trade & other payables (8.2) (15.6)Increase/(decrease) in provisions 7.0 (1.5)
138.5 108.3
Interest received 0.2 0.2Interest and similar costs paid (5.9) (9.3)Income taxes paid (10.2) (12.8)Net cash inflow from operating activities 122.6 86.4
CASH FLOWS FROM INVESTING ACTIVITIESPurchase of property, plant & equipment (9.7) (21.9)Net proceeds on disposal of property, plant & equipment 0.5 17.8Acquisition of business 10 (3.3) (13.6)Acquisition of equity accounted investee(s) 10, 13 - (0.5)
Net cash outflow from investing activities (12.5) (18.2)
CASH FLOWS FROM FINANCING ACTIVITIESProceeds from exercise of share options 0.5 1.0Drawdown of debt 25.0 335.8Repayment of debt (0.1) (337.6)Payment of issue costs - (2.0)Shares purchased under share buyback programme (76.6) (30.0)Dividends paid (34.8) (29.5)
Net cash outflow from financing activities (86.0) (62.3)
Net increase in cash & cash equivalents 24.1 5.9Cash & cash equivalents at beginning of year 181.9 162.8Translation adjustment (8.7) 13.2
Cash & cash equivalents at end of year 197.3 181.9
A reconciliation of cash & cash equivalents to net debt is presented in note 19 to the financial statements.
On behalf of the Board
Sir B Stewart S Glancey Chairman Group Chief Executive Officer
GROUP CASH FLOW STATEMENTFOR THE YEAR ENDED 29 FEBRUARY 2016
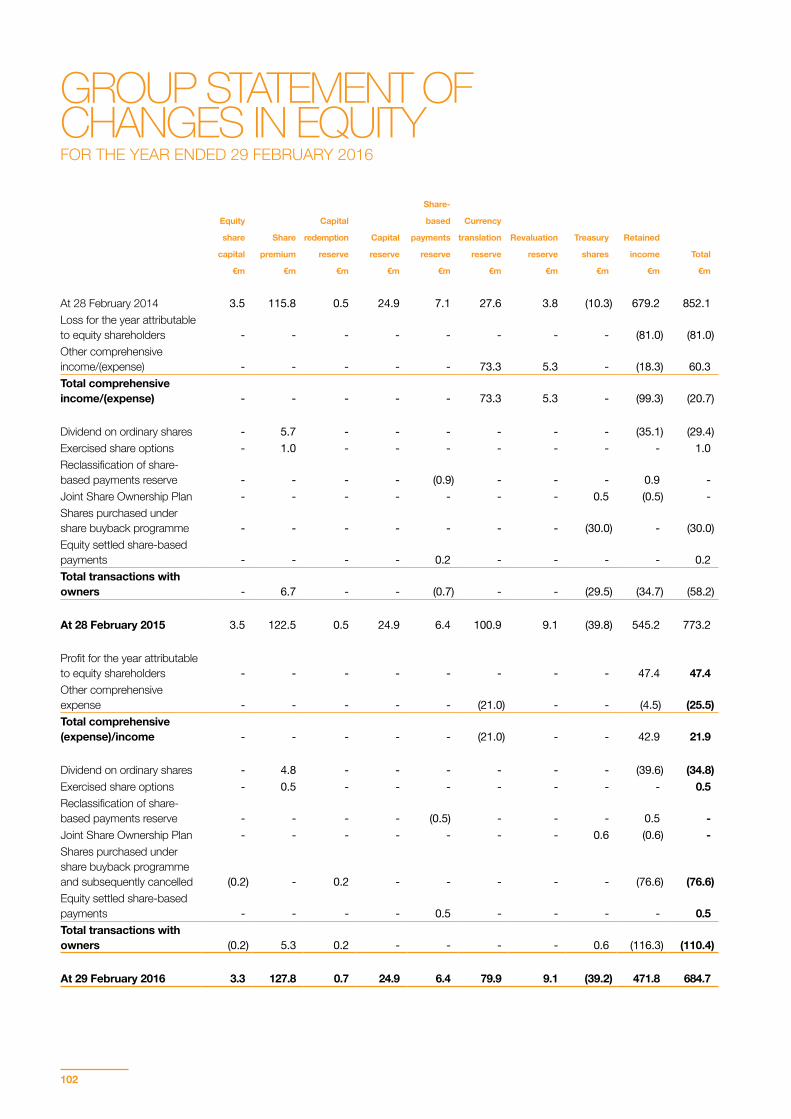
102
Share-
Equity Capital based Currency
share Share redemption Capital payments translation Revaluation Treasury Retained
capital premium reserve reserve reserve reserve reserve shares income Total
€m €m €m €m €m €m €m €m €m €m
At 28 February 2014 3.5 115.8 0.5 24.9 7.1 27.6 3.8 (10.3) 679.2 852.1Loss for the year attributable to equity shareholders - - - - - - - - (81.0) (81.0)Other comprehensive income/(expense) - - - - - 73.3 5.3 - (18.3) 60.3Total comprehensive income/(expense) - - - - - 73.3 5.3 - (99.3) (20.7)
Dividend on ordinary shares - 5.7 - - - - - - (35.1) (29.4)Exercised share options - 1.0 - - - - - - - 1.0Reclassification of share-based payments reserve - - - - (0.9) - - - 0.9 -Joint Share Ownership Plan - - - - - - - 0.5 (0.5) -Shares purchased under share buyback programme - - - - - - - (30.0) - (30.0)Equity settled share-based payments - - - - 0.2 - - - - 0.2Total transactions with owners - 6.7 - - (0.7) - - (29.5) (34.7) (58.2)
At 28 February 2015 3.5 122.5 0.5 24.9 6.4 100.9 9.1 (39.8) 545.2 773.2
Profit for the year attributable to equity shareholders - - - - - - - - 47.4 47.4Other comprehensive expense - - - - - (21.0) - - (4.5) (25.5)Total comprehensive (expense)/income - - - - - (21.0) - - 42.9 21.9
Dividend on ordinary shares - 4.8 - - - - - - (39.6) (34.8)Exercised share options - 0.5 - - - - - - - 0.5Reclassification of share-based payments reserve - - - - (0.5) - - - 0.5 -Joint Share Ownership Plan - - - - - - - 0.6 (0.6) -Shares purchased under share buyback programme and subsequently cancelled (0.2) - 0.2 - - - - - (76.6) (76.6)Equity settled share-based payments - - - - 0.5 - - - - 0.5Total transactions with owners (0.2) 5.3 0.2 - - - - 0.6 (116.3) (110.4)
At 29 February 2016 3.3 127.8 0.7 24.9 6.4 79.9 9.1 (39.2) 471.8 684.7
GROUP STATEMENT OF CHANGES IN EQUITY FOR THE YEAR ENDED 29 FEBRUARY 2016
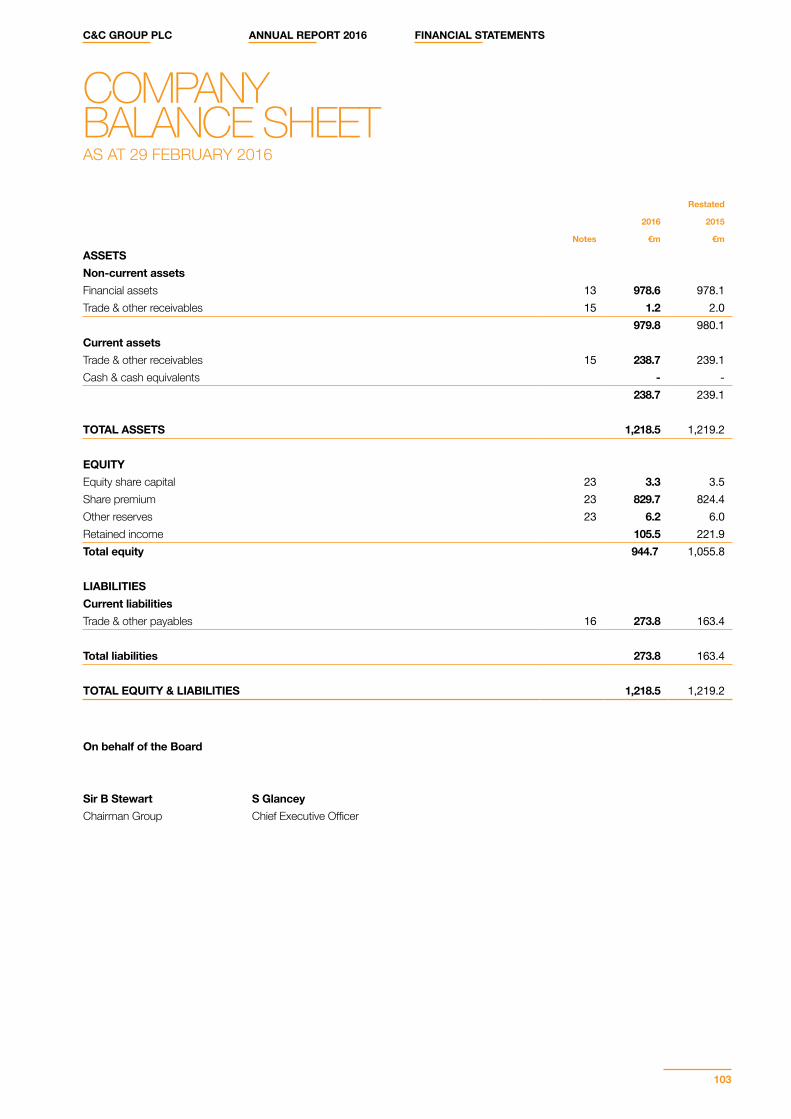
C&C GROUP PLC ANNUAL REPORT 2016 FINANCIAL STATEMENTS
103
Restated
2016 2015
Notes €m €m
ASSETSNon-current assetsFinancial assets 13 978.6 978.1Trade & other receivables 15 1.2 2.0
979.8 980.1Current assetsTrade & other receivables 15 238.7 239.1Cash & cash equivalents - -
238.7 239.1
TOTAL ASSETS 1,218.5 1,219.2
EQUITYEquity share capital 23 3.3 3.5Share premium 23 829.7 824.4Other reserves 23 6.2 6.0Retained income 105.5 221.9Total equity 944.7 1,055.8
LIABILITIESCurrent liabilitiesTrade & other payables 16 273.8 163.4
Total liabilities 273.8 163.4
TOTAL EQUITY & LIABILITIES 1,218.5 1,219.2
On behalf of the Board
Sir B Stewart S Glancey Chairman Group Chief Executive Officer
COMPANY BALANCE SHEETAS AT 29 FEBRUARY 2016
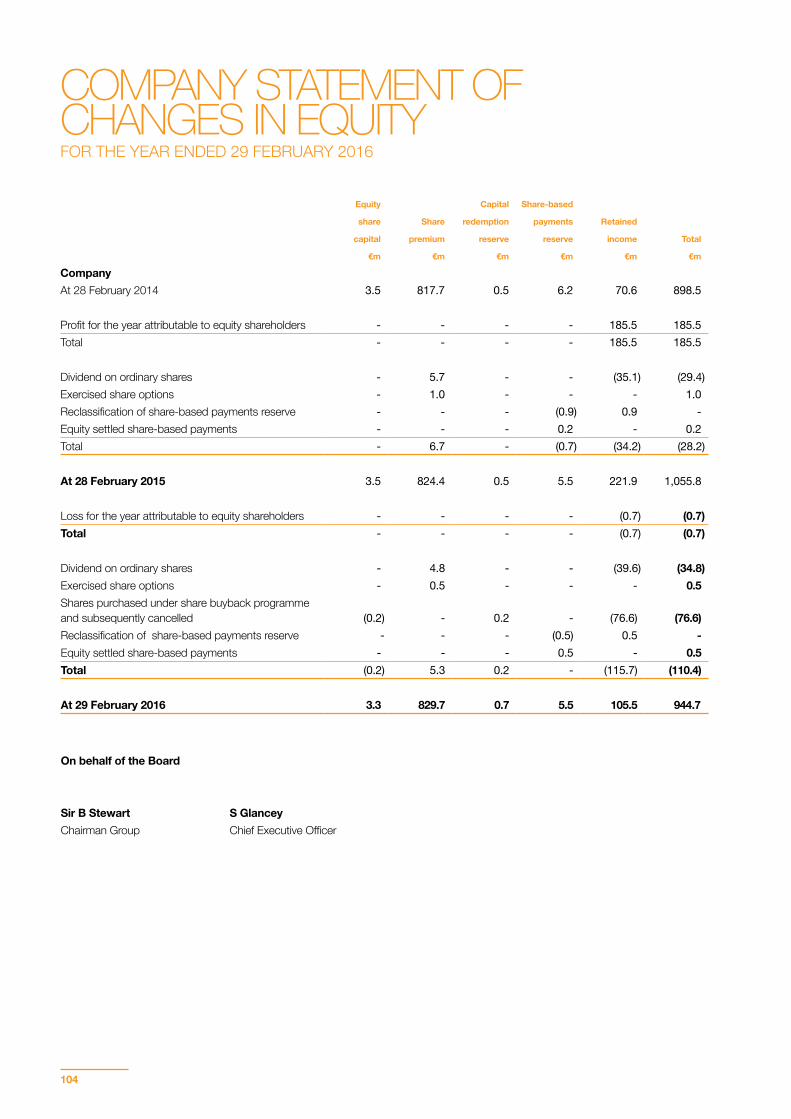
104
Equity Capital Share-based
share Share redemption payments Retained
capital premium reserve reserve income Total
€m €m €m €m €m €m
CompanyAt 28 February 2014 3.5 817.7 0.5 6.2 70.6 898.5
Profit for the year attributable to equity shareholders - - - - 185.5 185.5Total - - - - 185.5 185.5
Dividend on ordinary shares - 5.7 - - (35.1) (29.4)Exercised share options - 1.0 - - - 1.0Reclassification of share-based payments reserve - - - (0.9) 0.9 -Equity settled share-based payments - - - 0.2 - 0.2Total - 6.7 - (0.7) (34.2) (28.2)
At 28 February 2015 3.5 824.4 0.5 5.5 221.9 1,055.8
Loss for the year attributable to equity shareholders - - - - (0.7) (0.7)Total - - - - (0.7) (0.7)
Dividend on ordinary shares - 4.8 - - (39.6) (34.8)Exercised share options - 0.5 - - - 0.5Shares purchased under share buyback programme and subsequently cancelled (0.2) - 0.2 - (76.6) (76.6)Reclassification of share-based payments reserve - - - (0.5) 0.5 -Equity settled share-based payments - - - 0.5 - 0.5Total (0.2) 5.3 0.2 - (115.7) (110.4)
At 29 February 2016 3.3 829.7 0.7 5.5 105.5 944.7
On behalf of the Board
Sir B Stewart S Glancey Chairman Group Chief Executive Officer
COMPANY STATEMENT OF CHANGES IN EQUITYFOR THE YEAR ENDED 29 FEBRUARY 2016
C&C GROUP PLC ANNUAL REPORT 2016 FINANCIAL STATEMENTS
105
SIGNIFICANT ACCOUNTING POLICIESC&C Group plc (the ‘Company’) is a company incorporated and tax resident in Ireland. The Group’s financial statements for the year ended 29 February 2016 consolidate the individual financial statements of the Company and all subsidiary undertakings (together referred to as “the Group”) together with the Group’s share of the results and net assets of equity accounted investees for the period ended 29 February 2016.
The Company and Group financial statements, together the “financial statements”, were authorised for issue by the Directors on 11 May 2016.
The accounting policies applied in the preparation of the financial statements for the year ended 29 February 2016 are set out below. These have been applied consistently for all periods presented in these financial statements and by all Group entities.
STATEMENT OF COMPLIANCEThe Group financial statements have been prepared in accordance with International Financial Reporting Standards (IFRSs), which comprise standards and interpretations approved by the International Accounting Standards Board (IASB), as adopted by the EU and as applied in accordance with Companies Acts 2014. The individual financial statements of the Company have been prepared in accordance with FRS 101 Reduced Disclosure Framework (“FRS 101”) which permits a company that publishes its company and Group financial statements together to take advantage of the exemption in Section 304 of the Companies Act 2014 from presenting its individual profit and loss account and cash flow statement to the Annual General Meeting and from filing it with the Register of Companies. Following the publication of FRS 100, ‘Application of financial reporting requirements’, by the Financial Reporting Council, the Company elected to adopt FRS 101 in the preparation of the Company and subsidiary financial statements. This is the first year that the Company has presented financial statements complying with FRS 101. Comparative financial statements presented comply with FRS 101.
The Company’s date of transition to FRS 101 is 1 March 2014. There were no adjustments to the total equity of the Company as at 1 March 2014 or 28 February 2015 and profit for the financial year ending 28 February 2015 between IFRS as previously reported and FRS 101.
In these financial statements, the Company has applied the exemptions available under FRS 101 in respect of the following disclosures:• A cash flow statement and related notes;• Comparative period reconciliations for share capital, tangible fixed assets and intangible assets;• Disclosures in respect of transactions with wholly owned subsidiaries;• Disclosures in respect of capital management;• The effects of new but not yet effective IFRSs;• An additional Balance Sheet for the beginning of the earliest comparative period following the transition to FRS101; and• Disclosures in respect of Key Management Personnel.
As the consolidated financial statements of the Company include the equivalent disclosures, the Company has also taken exemptions under FRS 101 available in respect of the following disclosures:• IFRS 2 ‘Share-Based Payments’ in respect of group settled share-based payments;• Certain disclosures required by IAS 36 ‘Impairment of Assets’ in respect of the impairment of goodwill and indefinite life intangible
assets;• Certain disclosures required by IFRS 3 ‘Business Combinations’ in respect of business combinations undertaken by the Company.
Changes in accounting policies and disclosuresIFRSs as adopted by the EU applied by the Company and Group in the preparation of these financial statements are those that were effective for accounting periods ending on or before 29 February 2016. The IASB have issued the following standards, policies, interpretations and amendments which were effective for the Group for the first time in the year ended 29 February 2016:• Annual improvements to IFRSs 2010-2012 Cycle – various standards• Annual improvements to IFRSs 2011-2013 Cycle – various standards• Defined Benefit Plans: Employee Contributions (Amendments to IAS 19)
The adoption of the above annual improvements did not have a significant impact on the Group’s consolidated financial statements.
STATEMENT OF ACCOUNTING POLICIESFOR THE YEAR ENDED 29 FEBRUARY 2016
106
New standards and interpretations not yet adoptedA number of new standards, amendments to standards and interpretations are not yet effective for the year ended 29 February 2016, and have not been applied in preparing these consolidated financial statements.
These following new standards, amendments and interpretations are either not expected to have a material impact on the consolidated financial statements once applied or are still under assessment by the Group.
Accounting standard/interpretation (Effective date^)(a) Not expected to have a material impact on the consolidated financial statements:• IFRS 14, ‘Regulatory Deferral Accounts’ (1 January 2016)• Amendments to IFRS 10, IFRS 12 and IAS 28: Investment Entities – Applying the Consolidation (1 January 2016)• Amendments to IAS 12: Recognition of Deferred Tax Assets for Unrealised Losses (1 January 2017)• Amendments to IAS 7: Disclosure Initiative (1 January 2017)
(b) Subject to ongoing assessment by the Group• IFRS 15 – Revenue from contracts with customers* (1 January 2018 or earlier). IFRS 15 establishes a comprehensive framework for
determining whether, how much and when revenue is recognised. It replaces existing revenue recognition guidance, including IAS 18 Revenue, IAS 11 Construction Contracts and IFRIC 13 Customer Loyalty Programmes. IFRS 15 provides a new five step model to be applied to revenue arising from contracts with customers. The principles in IFRS 15 provide a more structured approach to measuring and recognising revenue, and will also result in additional disclosures in future years.
• IFRS 9 – Financial Instruments* (1 January 2018 or earlier). IFRS 9, published in July 2014, replaces the existing guidance in IAS 39 Financial Instruments: Recognition and Measurement. IFRS 9 includes revised guidance on the classification and measurement of financial instruments, including a new expected credit loss model for calculating impairment on financial assets, and the new general hedge accounting requirements. It also carries forward the guidance on recognition and derecognition of financial instruments from IAS 39.
• IFRS 16 – Leases* (1 January 2019 or earlier). IFRS 16, published in July 2016, eliminates the classification of leases as either operating leases or finance leases for a lessee. Leases will be capitalised by recognising the present value of the lease assets, similar to a finance lease under the existing standard.
(c) Amendments to existing standards effective for the year ending 28 February 2017The following are amendments to existing standards and interpretations that are effective for the Group’s financial year from 1 March 2016:• Amendments to IAS 27: Equity Method in Separate Financial Statements*• Amendments to IAS 1: Disclosure Initiative*• Annual Improvements to IFRSs 2012–2014 Cycle*• Amendments to IAS 16 and IAS 38: Clarification of Acceptable Methods of Depreciation and Amortisation*• Amendments to IFRS 11: Accounting for Acquisitions of Interests in Joint Operations*• Amendments to IAS 16 and IAS 41: Bearer Plants*• Amendments to IAS 19: Defined Benefit Plans: Employee Contributions*• Annual Improvements to IFRSs 2010–2012 Cycle*
* Not EU endorsed at the time of approval of financial statements^ the effective dates relate to financial period beginning on and after those dates and are those applying to EU endorsed IFRS if later than the IASB effective dates.
The Directors do not believe that the above amendments will have a significant impact on Group reporting.
IFRSs as adopted by the EU applied by the Company and Group in the preparation of these financial statements are those that were effective for accounting periods ending on or before 29 February 2016. The accounting policies adopted are consistent with those of the previous year except for the following new and amended IFRS and IFRIC interpretations adopted by the Group and Company in these financial statements:
STATEMENT OF ACCOUNTING POLICIESFOR THE YEAR ENDED 29 FEBRUARY 2016(CONTINUED)
C&C GROUP PLC ANNUAL REPORT 2016 FINANCIAL STATEMENTS
107
BASIS OF PREPARATIONThe Group and the individual financial statements of the Company are prepared on the going concern and historical cost basis except for the measurement at fair value of intangible assets acquired on the acquisition of a company or business, retirement benefit obligations, the revaluation of certain items of property, plant & equipment, share options at date of grant and derivative financial instruments. The accounting policies have been applied consistently by Group entities and for all periods presented.
The financial statements are presented in Euro millions to one decimal place.
The preparation of financial statements in conformity with IFRSs as adopted by the EU requires the use of certain critical accounting estimates. In addition, it requires management to exercise judgement in the process of applying the Group and Company’s accounting policies. The areas involving a high degree of judgement or complexity, or areas where assumptions and estimates are significant to the financial statements relate primarily to:• the determination of the fair value and the useful economic life of assets & liabilities, and intangible assets acquired on the acquisition of
a company or business (note 10),• the determination of carrying value of land (note 11),• the determination of carrying value or depreciated replacement cost, useful economic life and residual values in respect of the Group’s
buildings, plant & machinery (note 11),• the assessment of goodwill and intangible assets for impairment (note 12), and• accounting for retirement benefit obligations (note 21).
These are discussed in more detail in the accounting policies and/or notes to the financial statements as referenced above. The estimates and associated assumptions are based on historical experience and various other factors that are believed to be reasonable under the circumstances, the results of which form the basis of making the judgements about carrying values of assets and liabilities that are not readily apparent from other sources. Revisions to accounting estimates are recognised in the period in which the estimate is revised if the revision affects only that period or in the period of the revision and future periods if the revision affects both current and future periods.
BASIS OF CONSOLIDATION The Group’s financial statements consolidate the financial statements of the Company and all subsidiary undertakings together with the Group’s share of the results and net assets of equity accounted investees for the period ended 29 February 2016.
(i) SubsidiariesSubsidiaries are entities controlled by the Group. The Group controls an entity when it is exposed to, or has rights to, variable returns from its involvement with the entity and has the ability to affect those returns through its power over the entity. The financial statements of subsidiaries are included in the consolidated financial statements from the date on which control commences until the date on which control ceases.
On 30 April 2004, the Group, previously headed by C&C Group International Holdings Limited, underwent a re-organisation by virtue of which C&C Group International Holdings Limited’s shareholders in their entirety exchanged their shares for shares in C&C Group plc, a newly formed company, which then became the ultimate parent company of the Group. Notwithstanding the change in the legal parent of the Group, this transaction has been accounted for as a reverse acquisition and the consolidated financial statements are prepared on the basis of the new legal parent having been acquired by the existing Group except that the capital structure shown is that of the legal parent.
(ii) Investments in associates and jointly controlled entities (equity accounted investees)The Group’s interests in equity accounted investees comprise interests in associates and a joint venture.
Associates are those entities in which the Group has significant influence, but not control or joint control, over the financial and operating policies. A joint venture is an arrangement in which the Group has joint control, whereby the Group has rights to the net assets of the arrangement, rather than rights to its assets and obligations for its liabilities.
Interests in associates and joint ventures are accounted for using the equity method. They are initially recognised at cost, which includes transaction costs. Subsequent to initial recognition, the consolidated financial statements include the Group’s share of the profit or loss and Other Comprehensive Income of equity accounted investees, until the date on which significant influence or joint control ceases.
108
(iii) Transactions eliminated on consolidationAll inter-company balances and transactions, including unrealised gains arising from inter-group transactions, have been eliminated in full. Unrealised losses are eliminated in the same manner as unrealised gains except to the extent that they provide evidence of impairment. (iv) Company Financial StatementsInvestments in subsidiaries are carried at cost less provision for impairment. Dividend income is recognised when the right to receive payment is established.
REVENUE RECOGNITIONRevenue comprises the fair value of goods supplied to external customers exclusive of inter-company sales and value added tax, after allowing for discounts, rebates, allowances for customer loyalty and other pricing related allowances and incentives. Provision is made for returns where appropriate. Revenue is recognised to the extent that it is probable that the economic benefits will flow to the Group, that it can be reliably measured, and that the significant risks and rewards of ownership of the goods have passed to the buyer. This is normally deemed to occur on delivery except in the case of international customers where it is normally deemed to occur on despatch.
EXCISE DUTYExcise duty is levied at the point of production in the case of the Group’s manufactured products and at the point of importation in the case of imported products in the relevant jurisdictions in which the Group operates. As the Group’s manufacturing and warehousing facilities are Revenue approved and registered excise facilities, the excise duty liability generally crystallises on transfer of product from duty in suspense to duty paid status which normally coincides with the point of sale.
NET REVENUENet revenue is defined by the Group as Revenue less Excise duty. Excise duties, which represent a significant proportion of Revenue, are set by external regulators over which the Group has no control and are generally passed on to the consumer, consequently the Directors consider that the disclosure of Net Revenue enhances the transparency and provides a more meaningful analysis of underlying sales performance.
EXCEPTIONAL ITEMSThe Group has adopted an accounting policy and Income Statement format that seeks to highlight significant items of income and expense within the Group results for the year. The Directors believe that this presentation provides a more helpful analysis. Such items may include significant restructuring and integration costs, significant past service and curtailment gains/costs realised under the Group’s defined benefit pension schemes, profits or losses on disposal or termination of operations, litigation costs and settlements, profit or loss on disposal of investments, significant impairment of assets, acquisition related costs and unforeseen gains/losses arising on derivative financial instruments. The Directors use judgement in assessing the particular items which by virtue of their scale and nature are disclosed in the Income Statement and related notes as exceptional items.
FINANCE INCOME AND EXPENSESFinance income comprises interest income on funds invested and gains on hedging instruments that are recognised in the Income Statement. Interest income is recognised as it accrues in the Income Statement, using the effective interest method.
Finance expenses comprise interest expense on borrowings, interest expense on sale of trade receivables, bank guarantee fees, amortisation of borrowing issue costs, changes in the fair value of financial assets or liabilities which are accounted for at fair value through the Income Statement, losses on hedging instruments that are recognised in the Income Statement, gains or losses relating to the effective portion of interest rate swaps hedging variable rate borrowings, ineffective portion of changes in the fair value of cash flow hedges, impairment losses recognised on financial assets and unwinding the discount on provisions. All borrowing costs are recognised in the Income Statement using the effective interest method.
STATEMENT OF ACCOUNTING POLICIESFOR THE YEAR ENDED 29 FEBRUARY 2016(CONTINUED)
C&C GROUP PLC ANNUAL REPORT 2016 FINANCIAL STATEMENTS
109
RESEARCH AND DEVELOPMENTExpenditure on research that is not related to specific product development is recognised in the Income Statement as incurred.
Expenditure on the development of new or substantially improved products or processes is capitalised if the product or process is technically feasible and commercially viable.
GOVERNMENT GRANTSGrants are recognised at their fair value when there is a reasonable assurance that the grant will be received and all attaching conditions have been complied with.
Capital grants received and receivable by the Group are credited to government grants and are amortised to the Income Statement on a straight-line basis over the expected useful lives of the assets to which they relate.
Revenue grants are recognised as income over the periods necessary to match the grant on a systematic basis to the costs that it is intended to compensate. DISCONTINUED OPERATIONSA discontinued operation is a component of the Group’s business that represents a separate major line of business, geographical area of operations or is material to Revenue, Net revenue or Operating profit and has been disposed of or is held for sale. When an operation is classified as a discontinued operation, the comparative Income Statement is restated as if the operation had been discontinued from the start of the earliest period presented.
SEGMENTAL REPORTINGOperating segments are reported in a manner consistent with the internal organisational and management structure of the Group and the internal financial information provided to the Chief Operating Decision-Maker (the executive directors comprising Stephen Glancey, Kenny Neison and Joris Brams) who is responsible for the allocation of resources and the monitoring and assessment of performance of each of the operating segments. The Group has determined that it has five reportable operating segments.
The analysis by segment includes both items directly attributable to a segment and those, including central overheads that are allocated on a reasonable basis to those segments in internal financial reporting packages.
FOREIGN CURRENCY TRANSLATION Items included in the financial statements of each of the Group’s entities are measured using the currency of the primary economic environment in which the entity operates (“the functional currency”). The consolidated financial statements are presented in Euro, which is the presentation currency of the Group and both the presentation and functional currency of the Company.
Transactions in foreign currencies are translated into the functional currency of each entity at the foreign exchange rate ruling at the date of the transaction. Non-monetary assets carried at historic cost are not subsequently retranslated. Monetary assets and liabilities denominated in foreign currencies at the reporting date are translated into functional currencies at the foreign exchange rate ruling at that date. Foreign exchange movements arising on translation are recognised in the Income Statement with the exception of all monetary items designated as a hedge of a net investment in a foreign operation, which are recognised in the consolidated financial statements in Other Comprehensive Income until the disposal of the net investment, at which time they are recognised in the Income Statement for the year.
The assets and liabilities of foreign operations, including goodwill and fair value adjustments arising on consolidation, are translated to Euro at the foreign exchange rates ruling at the reporting date. The revenues and expenses of foreign operations are translated to Euro at the average exchange rate for the financial period where that represents a reasonable approximation of actual rates. Foreign exchange movements arising on translation of the net investment in a foreign operation, including those arising on long-term intra group loans for which settlement is neither planned nor likely to happen in the foreseeable future and as a consequence are deemed
110
quasi equity in nature, are recognised directly in Other Comprehensive Income in the consolidated financial statements in the foreign currency translation reserve. The portion of exchange gains or losses on foreign currency borrowings or derivatives used to provide a hedge against a net investment in a foreign operation that is designated as a hedge of those investments, is recognised directly in Other Comprehensive Income to the extent that they are determined to be effective. The ineffective portion is recognised immediately in the Income Statement for the year.
Any movements that have arisen since 1 March 2004, the date of transition to IFRS, are recognised in the currency translation reserve and are recycled through the Income Statement on disposal of the related business. Translation differences that arose before the date of transition to IFRS as adopted by the EU in respect of all non-Euro denominated operations are not presented separately.
BUSINESS COMBINATIONSThe purchase method of accounting is employed in accounting for the acquisition of subsidiaries by the Group. The fair value of consideration for a business combination is measured as the aggregate of the fair value at the date of exchange of assets acquired and liabilities incurred or assumed in exchange for control, together with the fair value of existing equity interests in the acquired business and the recognised amount of any non-controlling interests. Costs directly attributable to the acquisition of a business as defined by IFRS 3 (2008) Business Combinations are expensed in the period in which the costs are incurred and the services are received. Where a business combination agreement provides for an adjustment to the consideration contingent on future events, the amount of the estimate adjustment is included in the consideration at the acquisition date to the extent that it can be reliably measured. To the extent that settlement of all or any part of the consideration for a business combination is deferred, the fair value of the deferred component is determined through discounting the amounts payable to their present value at the date of exchange. The discount component is unwound as an interest charge in the Income Statement over the life of the obligation.
Acquisitions prior to 1 March 2011For acquisitions prior to 1 March 2011, transaction costs, other than those associated with the issue of debt or equity securities, that the Group incurred in connection with business combinations were capitalised as part of the cost of the acquisition in line with IFRS 3 (2004) Business Combinations. GOODWILL Goodwill is the excess of the fair value of the consideration paid over the fair value of the identifiable assets, liabilities and contingent liabilities in a business combination and relates to the future economic benefits arising from assets that are not capable of being individually identified and separately recognised.
As at the date of acquisition any goodwill acquired is allocated to each operating segment (which may comprise more than one cash generating unit) expected to benefit from the combination’s synergies. Impairment is determined by assessing the recoverable amount of the operating segment to which the goodwill relates. These operating segments represent the lowest level within the Group at which goodwill is monitored for internal management purposes.
Where goodwill forms part of an operating segment and part of the operation within that unit is disposed of, the goodwill associated with the operation disposed of is included in the carrying amount of the operation when determining the gain or loss on disposal of the operation. Goodwill disposed of in this circumstance is measured on the basis of the relative values of the operation disposed of and the proportion of the business segment retained.
INTANGIBLE ASSETS (OTHER THAN GOODWILL) ARISING ON BUSINESS COMBINATIONSAn intangible asset, which is a non-monetary asset without a physical substance, is capitalised separately from goodwill as part of a business combination at cost (fair value at date of acquisition) to the extent that it is probable that the expected future economic benefits attributable to the asset will flow to the Group and that its fair value can be reliably measured. Acquired brands and other intangible assets are deemed to be identifiable and recognised when they are controlled through contractual or other legal rights, or are separable from the rest of the business, regardless of whether those rights are transferable or separable from the Group or from other rights and obligations.
Subsequent to initial recognition, intangible assets are carried at cost less any accumulated amortisation and any accumulated impairment losses. The carrying values of intangible assets considered to have an indefinite useful economic life are reviewed for indicators of impairment regularly and are subject to impairment testing on an annual basis unless events or changes in circumstances indicate that the carrying values may not be recoverable and impairment testing is required earlier.
The amortisation charge on intangible assets considered to have finite lives is calculated to write-off the book value of the asset over its useful life on a straight-line basis on the assumption of zero residual value.
STATEMENT OF ACCOUNTING POLICIESFOR THE YEAR ENDED 29 FEBRUARY 2016(CONTINUED)
C&C GROUP PLC ANNUAL REPORT 2016 FINANCIAL STATEMENTS
111
PROPERTY, PLANT & EQUIPMENT Property (comprising land and buildings) is recognised at estimated fair value with the changes in the value of the property reflected in Other Comprehensive Income, to the extent it does not reverse previously recognised losses, or as an impairment loss in the Income Statement to the extent it does not reverse previously recognised revaluation gains. The fair value is based on estimated market value at the valuation date, being the estimated amount for which a property could be exchanged in an arm’s length transaction, to the extent that an active market exists. Such valuations are determined based on benchmarking against comparable transactions for similar properties in similar locations as those of the Group or on the use of valuation techniques including the use of market yields on comparable properties. If no active market exists or there are no other observable comparative transactions, the fair value may be determined using a valuation technique known as a Depreciated Replacement Cost approach.
Plant & machinery is carried at its revalued amount. In view of the specialised nature of the Group’s plant & machinery and the lack of comparable market-based evidence of similar plant sold, upon which to base a market approach of fair value, the Group uses a Depreciated Replacement Cost approach to determine a fair value for such assets.
Depreciated Replacement Cost is assessed, firstly, by the identification of the gross replacement cost for each class of plant & machinery. A depreciation factor derived from both the physical and functional obsolescence of each class of asset, taking into account estimated residual values at the end of the life of each class of asset, is then applied to the gross replacement cost to determine the net replacement cost. An economic obsolescence factor, which is derived based on current and anticipated capacity or utilisation of each class of plant & machinery as a function of total available production capacity, is applied to determine the Depreciated Replacement Cost.
Motor vehicles & other equipment are stated at cost less accumulated depreciation and impairment losses.
Cost includes expenditure that is directly attributable to the acquisition of the asset. When parts of an item of property, plant & equipment have different useful lives, they are accounted for as separate items (major components) of property, plant & equipment. Subsequent costs are included in an asset’s carrying amount or recognised as a separate asset, as appropriate, only when it is probable that future economic benefits associated with the item will flow to the Group. Property, plant & equipment, other than freehold land and assets under construction, which are not depreciated, were depreciated using the following rates which are calculated to write-off the value of the asset, less the estimated residual value, over its expected useful life:
Land and BuildingsLand n/aBuildings - ROI, US, Portugal, Wallaces Express 2% straight-lineBuildings – UK (excluding Wallaces Express) 2% reducing balance
Plant and MachineryStorage tanks 10% reducing balanceOther plant & machinery 15-30% reducing balance
Motor vehicles and other equipmentMotor vehicles 15% straight-lineOther equipment incl returnable bottles, cases and kegs 5-25% straight-line
The residual value and useful lives of property, plant & equipment are reviewed and adjusted if appropriate at each reporting date to take account of any changes that could affect prospective depreciation charges and asset carrying values. When determining useful economic lives, the principal factors the Group takes into account are the intensity at which the assets are expected to be used, expected requirements for the equipment and technological developments.
112
On disposal of property, plant & equipment the cost or valuation and related accumulated depreciation and impairments are removed from the Balance Sheet and the net amount, less any proceeds, is taken to the Income Statement and any amounts included within the revaluation reserve transferred to the retained income reserve.
The carrying amounts of the Group’s property, plant & equipment are reviewed at each balance sheet date to determine whether there is any indication of impairment. An impairment loss is recognised when the carrying amount of an asset or its cash generation unit exceeds its recoverable amount (being the greater of fair value less costs to sell and value in use). Impairment losses are debited directly to equity under the heading of revaluation reserve to the extent of any credit balance existing in the revaluation reserve account in respect of that asset with the remaining balance recognised in the Income Statement.
A revaluation surplus is credited directly to Other Comprehensive Income and accumulated in equity under the heading of revaluation reserve, unless it reverses a revaluation decrease on the same asset previously recognised as an expense, where it is first credited to the Income Statement to the extent of the previous write down.
INVENTORIES Inventories are stated at the lower of cost and net realisable value. Cost includes all expenditure incurred in acquiring the inventories and bringing them to their present location and condition and is based on the first-in first-out principle.
In the case of finished goods and work in progress, cost includes direct production costs and the appropriate share of production overheads plus excise duties, where appropriate. Net realisable value is the estimated selling price in the ordinary course of business, less estimated costs of completion and estimated costs necessary to complete the sale.
Provision is made for slow-moving or obsolete stock where appropriate.
PROVISIONS A provision is recognised in the Balance Sheet when the Group has a present legal or constructive obligation as a result of a past event, and it is probable that an outflow of economic benefits will be required to settle the obligation. Provisions are measured at the Directors’ best estimate of the expenditure required to settle the obligation at the balance sheet date and are discounted to present value at an appropriate rate if the effect of the time value of money is deemed material. The carrying amount of the provision increases in each period to reflect the passage of time and the unwinding of the discount. The increase in the provision due to the passage of time is recognised in the Income Statement within finance expense.
A contingent liability is not recognised but is disclosed where the existence of the obligation will only be confirmed by future events or where it is not probable that an outflow of resources will be required to settle the obligation or where the amount of the obligation cannot be measured with reasonable reliability. Contingent assets are not recognised but are disclosed where an inflow of economic benefits is probable. Provisions are not recognised for future operating losses, however, provisions are recognised for onerous contracts where the unavoidable cost exceeds the expected benefit. Due to the inherent uncertainty with respect to such matters, the value of each provision is based on the best information available at the time, including advice obtained from third party experts, and is reviewed by the Directors on a periodic basis with the potential financial exposure reassessed. Revisions to the valuation of a provision are recognised in the period in which such a determination is made and such revisions could have a material impact on the financial performance of the Group.
STATEMENT OF ACCOUNTING POLICIESFOR THE YEAR ENDED 29 FEBRUARY 2016(CONTINUED)
C&C GROUP PLC ANNUAL REPORT 2016 FINANCIAL STATEMENTS
113
LEASES Where the Group has entered into lease arrangements on land & buildings the lease payments are allocated between land & buildings and each component is assessed separately to determine whether it is a finance or operating lease. Finance leases, which transfer to the Group substantially all the risks and rewards of ownership of the leased asset, are recognised in property, plant & equipment at the inception of the lease at the fair value of the leased asset or, if lower, the present value of the minimum lease payments. The corresponding liability to the lessor is included in the Balance Sheet as a finance lease obligation. Lease payments are apportioned between finance charges and a reduction of the lease obligation so as to achieve a constant rate of interest on the remaining balance of the liability. Finance charges are charged to the Income Statement as part of finance expense.
Leases where the lessor retains substantially all the risks and benefits of ownership of the assets are classified as operating leases. Operating lease payments are recognised as an expense in the Income Statement on a straight-line basis over the lease term.
RETIREMENT BENEFIT OBLIGATIONSThe Group operates a number of defined contribution and defined benefit pension schemes.
Obligations to the defined contribution pension schemes are recognised as an expense in the Income Statement as the related employee service is received. Under these schemes, the Group has no obligation, either legal or constructive, to pay further contributions in the event that the fund does not hold sufficient assets to meet its benefit commitments.
The liabilities and costs associated with the Group’s defined benefit pension schemes, all of which are funded and administered under trusts which are separate from the Group, are assessed on the basis of the projected unit credit method by professionally qualified actuaries and are arrived at using actuarial assumptions based on market expectations at the reporting date. The discount rates employed in determining the present value of the schemes’ liabilities are determined by reference to market yields, at the reporting date, on high-quality corporate bonds of a currency and term consistent with the currency and term of the associated post-employment benefit obligations. The fair value of scheme assets is based on market price information, measured at bid value for publicly quoted securities.
The resultant defined benefit pension net surplus or deficit is shown within either current liabilities, non-current assets or non-current liabilities on the face of the Group Balance Sheet and comprises the total for each plan of the present value of the defined benefit obligation less the fair value of plan assets out of which the obligations are to be settled directly. The assumptions (disclosed in note 21) underlying these valuations are updated at each reporting period date based on current economic conditions and expectations (discount rates, salary inflation and mortality rates) and reflect any changes to the terms and conditions of the post retirement pension plans. The deferred tax liabilities and assets arising on pension scheme surpluses and deficits are disclosed separately within deferred tax assets or liabilities, as appropriate.
When the benefits of a defined benefit scheme are improved, the portion of the increased benefit relating to the past service of employees is recognised as an expense immediately in the Income Statement.
The expected increase in the present value of scheme liabilities arising from employee service in the current period is recognised in arriving at operating profit or loss together with the net interest expense/(income) on the net defined benefit liability/(asset). Differences between the actual return on plan assets and the interest income, experience gains and losses on scheme liabilities, together with the effect of changes in the current or prior assumptions underlying the liabilities are recognised in Other Comprehensive Income. The amounts recognised in the Income Statement and Statement of Other Comprehensive Income and the valuation of the defined benefit pension net surplus or deficit are sensitive to the assumptions used. While management believe that the assumptions used are appropriate, differences in actual experience or changes in assumptions may affect the valuation of retirement benefit obligations and expenses recognised in future accounting periods.
CompanyThe Company has no direct employees and is not the sponsoring employer for any of the Group’s defined benefit pension schemes. There is no stated policy within the Group in relation to the obligations of Group companies to contribute to scheme deficits. Group companies make contributions to the schemes as requested by the sponsoring employers.
114
SHARE-BASED PAYMENTSThe Group operates a number of Share Option Schemes, Performance Share Plans and cash settled award schemes, listed below:-• Executive Share Option Scheme (the ‘ESOS’), • Long-Term Incentive Plan (Part I) (the ‘LTIP (Part I)’),• Joint Share Ownership Plan (the ‘JSOP’), • Restricted Share Award Scheme,• Recruitment and Retention Plan, • Long-term Incentive Plan (Part II) (the ‘LTIP (Part II)’), and• Partnership and Matching Share Schemes.
Equity settled share-based payment transactionsGroup share schemes allow certain employees to acquire shares in the Company. The fair value of share entitlements granted is recognised as an employee expense in the Income Statement with a corresponding increase in equity, while the cost of acquiring shares on the open market to satisfy the Group’s obligations under the Partnership and Matching Share Schemes is recognised in the Income Statement as incurred.
To date, share options granted by the Company under the ESOS and share entitlements (represented by nominal cost options) granted under the LTIP (Part II) are subject to non-market vesting conditions only.
An element of the share entitlements (represented by nominal-cost options) granted by the Company under the LTIP (Part I), the Recruitment and Retention Plan and the Restricted Share Award Scheme and some of the Interests granted under the Joint Share Ownership Plan are subject to market vesting conditions with or without non-market vesting conditions whilst the remainder are subject to non-market vesting conditions only, the details of which are set out in note 4. Market conditions are incorporated into the calculation of fair value of share/Interest entitlements as at the grant date. Non-market vesting conditions are not taken into account when estimating such fair value.
The expense for the share entitlements shown in the Income Statement is based on the fair value of the total number of entitlements expected to vest and is allocated to accounting periods on a straight-line basis over the vesting period. The cumulative charge to the Income Statement at each reporting date reflects the extent to which the vesting period has expired and the Group’s best estimate of the number of equity instruments that will ultimately vest. It is reversed only where entitlements do not vest because all non-market performance conditions have not been met or where an employee in receipt of share entitlements leaves the Group before the end of the vesting period and forfeits those options in consequence. Awards with market based performance conditions are treated as vesting irrespective of whether or not the market condition is satisfied, provided that all other performance and/or service conditions are satisfied. No reversal is recorded for failure to vest as a result of market conditions not being met.
The proceeds received by the Company net of any directly attributable transaction costs on the vesting of share entitlements met by the issue of new shares are credited to share capital and share premium when the share entitlements are exercised. Amounts included in the share-based payments reserve are transferred to retained income when vested options are exercised, forfeited post vesting or lapse.
The dilutive effect of outstanding options, to the extent that they are to be settled by the issue of new shares and to the extent that the vesting conditions would have been satisfied if the end of the reporting period was the end of the contingency period, is reflected as additional share dilution in the determination of diluted earnings per share.
Cash settled share-based payment transactionsThe fair value of the amount payable to employees in respect of share appreciation rights that are settled in cash is recognised as an expense in the Income Statement with a corresponding increase in liabilities, over the period that the employees become unconditionally entitled to the payment. The liability is re-measured at each reporting date and at settlement date based on the fair value of the share appreciation rights. Any changes are recognised as an employee benefit expense in the Income Statement.
STATEMENT OF ACCOUNTING POLICIESFOR THE YEAR ENDED 29 FEBRUARY 2016(CONTINUED)
C&C GROUP PLC ANNUAL REPORT 2016 FINANCIAL STATEMENTS
115
INCOME TAXCurrent tax expense represents the expected tax amount to be paid in respect of taxable income for the current year and is based on reported profit and the expected statutory tax rates, reliefs and allowances applicable in the jurisdictions in which the Group operates. Current tax for the current and prior years, to the extent that it is unpaid, is recognised as a liability in the Balance Sheet.
Deferred tax is provided on the basis of the Balance Sheet liability method on all temporary differences at the reporting date. Temporary differences are defined as the difference between the tax bases of assets and liabilities and their carrying amounts in the financial statements. Deferred tax assets and liabilities are not subject to discounting and are measured at the tax rates that are expected to apply in the period in which the asset is recovered or the liability is settled based on tax rates and tax laws that have been enacted or substantively enacted at the balance sheet date.
Deferred tax assets and liabilities are recognised for all temporary differences except where they arise from:-• the initial recognition of goodwill or the initial recognition of an asset or a liability in a transaction that is not a business combination and
affects neither the accounting profit or loss nor the taxable profit or loss at the time of the transaction, or,• temporary differences associated with investments in subsidiaries where the timing of the reversal of the temporary difference is subject
to the Group’s control and it is probable that a reversal will not be recognised in the foreseeable future.
Deferred tax assets in respect of deductible temporary differences are recognised only to the extent that it is probable that taxable profits or taxable temporary differences will be available against which to offset these items. The recognition or non-recognition of deferred tax assets as appropriate also requires judgement as it involves an assessment of the future recoverability of those assets. The recognition of deferred tax assets is based on management’s judgement and estimate of the most probable amount of future taxable profits and taking into consideration applicable tax legislation in the relevant jurisdiction. The carrying amounts of deferred tax assets are subject to review at each reporting date and are reduced to the extent that future taxable profits are considered to be insufficient to allow all or part of the deferred tax asset to be utilised.
Deferred tax and current tax are recognised as a component of the tax expense in the Income Statement except to the extent that they relate to items recognised directly in Other Comprehensive Income or equity (for example, certain derivative financial instruments and actuarial gains and losses on defined benefit pension schemes), in which case the related tax is also recognised in Other Comprehensive Income or equity.
The Group is subject to income tax in a number of jurisdictions, and judgement is required in determining the worldwide provision for taxes. There are many transactions and calculations during the ordinary course of business, for which the ultimate tax determination is uncertain and the complexity of the tax treatment may be such that the final tax charge may not be determined until a formal resolution has been reached with the relevant tax authority which may take extended time periods to conclude. The ultimate tax charge may, therefore be different from that which initially is reflected in the Group’s consolidated tax charge and provision and any such differences could have a material impact on the Group’s income tax charge and consequently financial performance. The determination of the provision for income tax is based on management’s understanding of the relevant tax law and judgement as to the appropriate tax charge, and management believe that all assumptions and estimates used are reasonable and reflective of the tax legislation in jurisdictions in which the Group operates. Where the final tax charge is different from the amounts that were initially recorded, such differences are recognised in the income tax provision in the period in which such determination is made. FINANCIAL INSTRUMENTS Trade & other receivables Trade receivables are initially recognised at fair value (which usually equals the original invoice value) and are subsequently measured at amortised cost. A provision for impairment of trade receivables is established when there is objective evidence that the Group will not be able to collect all amounts due according to the original terms of the receivables. The amount of the provision is the difference between the asset’s carrying amount and the present value of estimated future cash flows. Movements in provisions are recognised in the Income Statement. Bad debts are written-off against the provision when no further prospect of collection exists.
116
Cash & cash equivalents Cash & cash equivalents in the Balance Sheet comprise cash at bank and in hand and short term deposits with an original maturity of three months or less. Bank overdrafts that are repayable on demand and form part of the Group’s cash management are included as a component of cash & cash equivalents for the purpose of the statement of cash flows.
Advances to customersAdvances to customers, which can be categorised as either an advance of discount or a repayment/annuity loan conditional on the achievement of contractual sales targets, are initially recognised at fair value, amortised to the Income Statement (and classified within sales discounts as a reduction in revenue) over the relevant period to which the customer commitment is made, and subsequently carried at amortised cost less an impairment allowance. Where there is a volume target the amortisation of the advance is included in sales discounts as a reduction to revenue. A provision for impairment is established when there is objective evidence that the Group will not be able to collect all amounts due according to the original terms of the agreement with the customer. The amount of the provision is determined by the difference between the asset’s carrying amount and the present value of the estimated future cash flows or recognition of the estimated amortisation of advances.
Trade & other payablesTrade & other payables are recognised initially at fair value and subsequently measured at amortised cost using the effective interest rate method, unless the maturity date is less than six months.
Interest-bearing loans & borrowings Interest-bearing loans & borrowings are recognised initially at fair value less attributable transaction costs and are subsequently measured at amortised cost with any difference between the amount originally recognised and redemption value being recognised in the Income Statement over the period of the borrowings on an effective interest rate basis. Where the early refinancing of a loan results in a significant change in the present value of the expected cash flows, the original loan is de-recognised and the replacement loan is recognised at fair value.
Derivative financial instrumentsThe Group uses derivative financial instruments (principally interest rate swaps and forward foreign exchange contracts) to hedge its exposure to interest rate and foreign exchange risks arising from operational and financing activities. The Group does not enter into speculative transactions. Derivative financial instruments are measured at fair value at each reporting date. The fair value of interest rate swaps is the estimated amount that the Group would receive or pay to terminate the swap at the reporting date, taking into account current market interest and currency exchange rates where relevant and the current creditworthiness of the swap counterparties. The fair value of forward exchange contracts is calculated by reference to current forward exchange rates for contracts with similar maturity and credit profiles and equates to the market price at the balance sheet date.
Gains or losses on re-measurement to fair value are recognised immediately in the Income Statement except where derivatives are designated and qualify for cashflow hedge accounting in which case recognition of any resultant gain or loss is recognised through Other Comprehensive Income.
Derivative financial instruments entered into by the Group are for the purposes of hedge accounting classified as cash flow hedges which hedge exposure to fluctuations in future cash flows derived from a particular risk associated with a recognised asset, liability, a firm commitment or a highly probable forecast transaction.
The Group documents at the inception of the transaction the relationship between hedging instruments and hedged items, as well as its risk management objectives and strategy for undertaking various hedging transactions. The Group also documents its assessment, both at hedge inception and on an ongoing basis, of whether the derivatives that are used in hedging transactions are highly effective in offsetting changes in fair values or cash flows of hedged items.
STATEMENT OF ACCOUNTING POLICIESFOR THE YEAR ENDED 29 FEBRUARY 2016(CONTINUED)
C&C GROUP PLC ANNUAL REPORT 2016 FINANCIAL STATEMENTS
117
Where a derivative financial instrument is designated as a hedge of the variability in cash flows of a recognised liability, a firm commitment or a highly probable forecasted transaction, the effective part of any gain or loss on the derivative financial instrument is recognised as a separate component of Other Comprehensive Income with the ineffective portion being reported in the Income Statement. The associated gains or losses that had previously been recognised in Other Comprehensive Income are transferred to the Income Statement contemporaneously with the materialisation of the hedged transaction, except when a firm commitment or forecast transaction results in the recognition of a non-financial asset or a non-financial liability, in which case the cumulative gain or loss is removed from Other Comprehensive Income and included in the initial measurement of the asset or liability.
Hedge accounting is discontinued when the hedging instrument expires or is sold, is terminated or exercised, or no longer qualifies for hedge accounting. For situations where the hedging instrument no longer qualifies for hedge accounting, the cumulative gain or loss on the hedging instrument that remains recognised directly in equity from the period when the hedge was effective shall remain separately recognised in equity until the expected forecast transaction occurs. If a hedged transaction is no longer expected to occur, the net cumulative gain or loss recognised in Other Comprehensive Income is transferred to the Income Statement in the period.
Net investment hedgingAny gain or loss on the effective portion of a hedge of a net investment in a foreign operation using a foreign currency denominated monetary liability is recognised in Other Comprehensive Income while the gain or loss on the ineffective portion is recognised immediately in the Income Statement. Cumulative gains and losses remain in Other Comprehensive Income until disposal of the net investment in the foreign operation at which point the related differences are transferred to the Income Statement as part of the overall gain or loss on disposal.
SHARE CAPITAL/PREMIUMOrdinary shares are classified as equity instruments. Incremental costs directly attributable to the issuance of new shares are shown in equity as a deduction from the gross proceeds.
Treasury sharesEquity share capital issued under its Joint Share Ownership Plan, which is held in trust by an Employee Trust is classified as treasury shares on consolidation until such time as the Interests vest and the participants acquire the shares from the Trust or the Interests lapse and the shares are cancelled or disposed of by the Trust.
Own shares acquired under share buyback programmeThe cost of ordinary shares purchased by a subsidiary of the Group on the open market is recorded as a deduction from equity on the face of the Group Balance Sheet. When these shares are cancelled, an amount equal to the nominal value of any shares cancelled is included within the capital redemption reserve fund and the cost is deducted from retained earnings.
Dividends Final dividends on ordinary shares are recognised as a liability in the financial statements only after they have been approved at an annual general meeting of the Company. Interim dividends on ordinary shares are recognised when they are paid.
COMPANY FINANCIAL ASSETSThe change in legal parent of the Group on 30 April 2004, as disclosed in detail in that year’s annual report, was accounted for as a reverse acquisition. This transaction gave rise to a financial asset in the Company’s accounts, which relates to the fair value at that date of its investment in subsidiaries. Financial assets are reviewed for impairment if there are any indications that the carrying value may not be recoverable.
Share options granted to employees of subsidiary companies are accounted for as an increase in the carrying value of the investment in subsidiaries and the share-based payment reserve.
118
1. SEGMENTAL REPORTINGThe Group’s business activity is the manufacturing, marketing and distribution of alcoholic and soft drinks. Five operating segments have been identified in the current period; Ireland, Scotland, C&C Brands, North America and Export.
The Group continually reviews and updates the manner in which it monitors and controls its financial operations resulting in changes in the manner in which information is classified and reported to the Chief Operating Decision Maker (“CODM”). The CODM, identified as the executive Directors comprising Stephen Glancey, Kenny Neison and Joris Brams, assesses and monitors the operating results of segments separately via internal management reports in order to effectively manage the business and allocate resources.
The identified business segments are as follows:-
(i) Ireland This segment includes the financial results from sale of own branded products in the Island of Ireland, principally Bulmers, Tennent’s, Magners, Clonmel 1650, Heverlee, Caledonia Smooth, Roundstone Irish Ale, Finches and Tipperary Water. It also includes the financial results from beer and wines and spirits distribution and wholesaling following the acquisition of Gleeson, and the results from sale of third party brands as permitted under the terms of a distribution agreement with AB InBev.
(ii) ScotlandThis segment includes the results from sale of the Group’s own branded products in Scotland, with Tennent’s, Heverlee, Caledonia Best and Magners the principal brands. It also includes the financial results from third party brand distribution and wholesaling in Scotland following the acquisition of the Wallaces Express wholesale business.
(iii) C&C BrandsThis segment includes the results from sale of the Group’s own branded products in England & Wales, principally Magners, Tennent’s, Chaplin & Cork’s and K Cider. It also includes the distribution of the Italian lager Menabrea and the production and distribution of private label cider products in England & Wales.
(iv) North AmericaThis segment includes the results from sale of the Group’s cider and beer products, principally Woodchuck, Magners, Blackthorn, Hornsby’s and Tennent’s in the United States and Canada.
(v) ExportThis segment includes the sale and distribution of the Group’s own branded products, principally Magners, Gaymers, Blackthorn, Hornsby’s and Tennent’s outside of Ireland, Scotland, England & Wales and North America. It also includes the sale of some third party brands.
The analysis by segment includes both items directly attributable to a segment and those, including central overheads, which are allocated on a reasonable basis in presenting information to the CODM.
Inter-segmental revenue is not material and thus not subject to separate disclosure.
NOTESFORMING PART OF THE FINANCIAL STATEMENTS
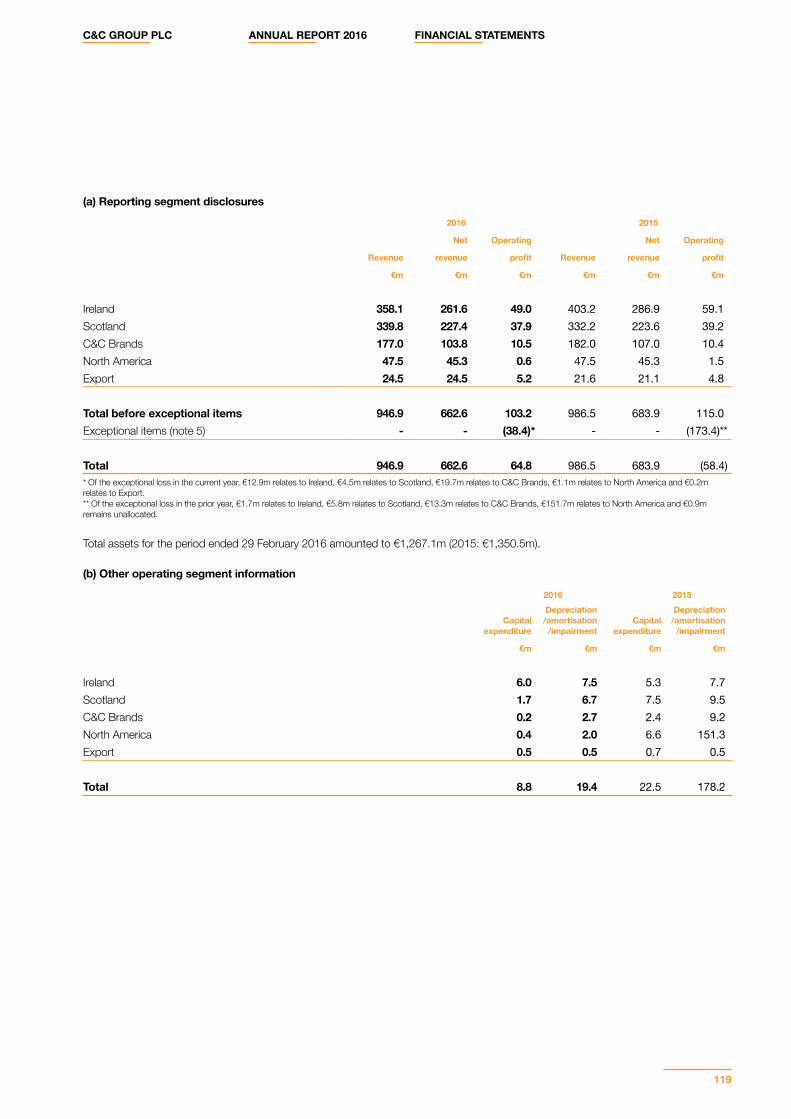
C&C GROUP PLC ANNUAL REPORT 2016 FINANCIAL STATEMENTS
119
(a) Reporting segment disclosures
2016 2015
Net Operating Net Operating
Revenue revenue profit Revenue revenue profit
€m €m €m €m €m €m
Ireland 358.1 261.6 49.0 403.2 286.9 59.1Scotland 339.8 227.4 37.9 332.2 223.6 39.2C&C Brands 177.0 103.8 10.5 182.0 107.0 10.4North America 47.5 45.3 0.6 47.5 45.3 1.5Export 24.5 24.5 5.2 21.6 21.1 4.8
Total before exceptional items 946.9 662.6 103.2 986.5 683.9 115.0Exceptional items (note 5) - - (38.4)* - - (173.4)**
Total 946.9 662.6 64.8 986.5 683.9 (58.4)* Of the exceptional loss in the current year, €12.9m relates to Ireland, €4.5m relates to Scotland, €19.7m relates to C&C Brands, €1.1m relates to North America and €0.2m relates to Export. ** Of the exceptional loss in the prior year, €1.7m relates to Ireland, €5.8m relates to Scotland, €13.3m relates to C&C Brands, €151.7m relates to North America and €0.9m remains unallocated.
Total assets for the period ended 29 February 2016 amounted to €1,267.1m (2015: €1,350.5m).
(b) Other operating segment information
2016 2015
Capital expenditure
Depreciation /amortisation
/impairmentCapital
expenditure
Depreciation /amortisation
/impairment
€m €m €m €m
Ireland 6.0 7.5 5.3 7.7Scotland 1.7 6.7 7.5 9.5C&C Brands 0.2 2.7 2.4 9.2North America 0.4 2.0 6.6 151.3Export 0.5 0.5 0.7 0.5
Total 8.8 19.4 22.5 178.2

120
(c) Geographical analysis of revenue and net revenue
Revenue Net revenue
2016 2015 2016 2015
€m €m €m €m
Ireland 358.1 403.2 261.6 286.9Scotland 339.8 332.2 227.4 223.6England and Wales* 177.0 182.0 103.8 107.0US and Canada** 47.5 47.5 45.3 45.3Other*** 24.5 21.6 24.5 21.1
Total 946.9 986.5 662.6 683.9* England and Wales reflects the C&C Brands segment. ** US and Canada reflects the North America segment. ***Other reflects the Export segment, being all other geographical locations excluding Ireland, Scotland, England, Wales, the US and Canada.
The geographical analysis of revenue and net revenue is based on the location of the third party customers.
(d) Geographical analysis of non-current assets
Ireland ScotlandEngland and
Wales*US and
Canada** Other*** Total
€m €m €m €m €m €m
29 February 2016Property, plant & equipment 60.3 67.1 16.1 30.8 5.7 180.0Goodwill & intangible assets 156.2 135.6 189.2 147.1 16.0 644.1Equity accounted investees - 0.3 - - - 0.3Retirement benefit obligations 4.7 - - - - 4.7Deferred tax assets 4.4 - - - - 4.4Trade & other receivables 15.0 29.7 1.3 - - 46.0
Total 240.6 232.7 206.6 177.9 21.7 879.5
Ireland ScotlandEngland and
Wales*US and
Canada** Other*** Total
€m €m €m €m €m €m
28 February 2015Property, plant & equipment 64.8 77.4 39.3 31.6 5.8 218.9Goodwill & intangible assets 156.3 145.1 191.3 143.5 16.0 652.2Equity accounted investees - 0.9 - - - 0.9Retirement benefit obligations 3.7 - - - - 3.7Deferred tax assets 5.0 - - - - 5.0Trade & other receivables 14.9 29.9 1.4 - - 46.2
Total 244.7 253.3 232.0 175.1 21.8 926.9 * England and Wales reflects the C&C Brands segment. ** US and Canada reflects the North America segment. ***Other reflects the Export segment, being all other geographical locations excluding Ireland, Scotland, England, Wales, the US and Canada.
The geographical analysis of non-current assets, with the exception of Goodwill & intangible assets, is based on the geographical location of the assets. The geographical analysis of Goodwill & intangible assets is allocated based on the country of destination of sales at date of application of IFRS 8 Operating Segments or date of acquisition, if later.
NOTES FORMING PART OF THE FINANCIAL STATEMENTS(CONTINUED)
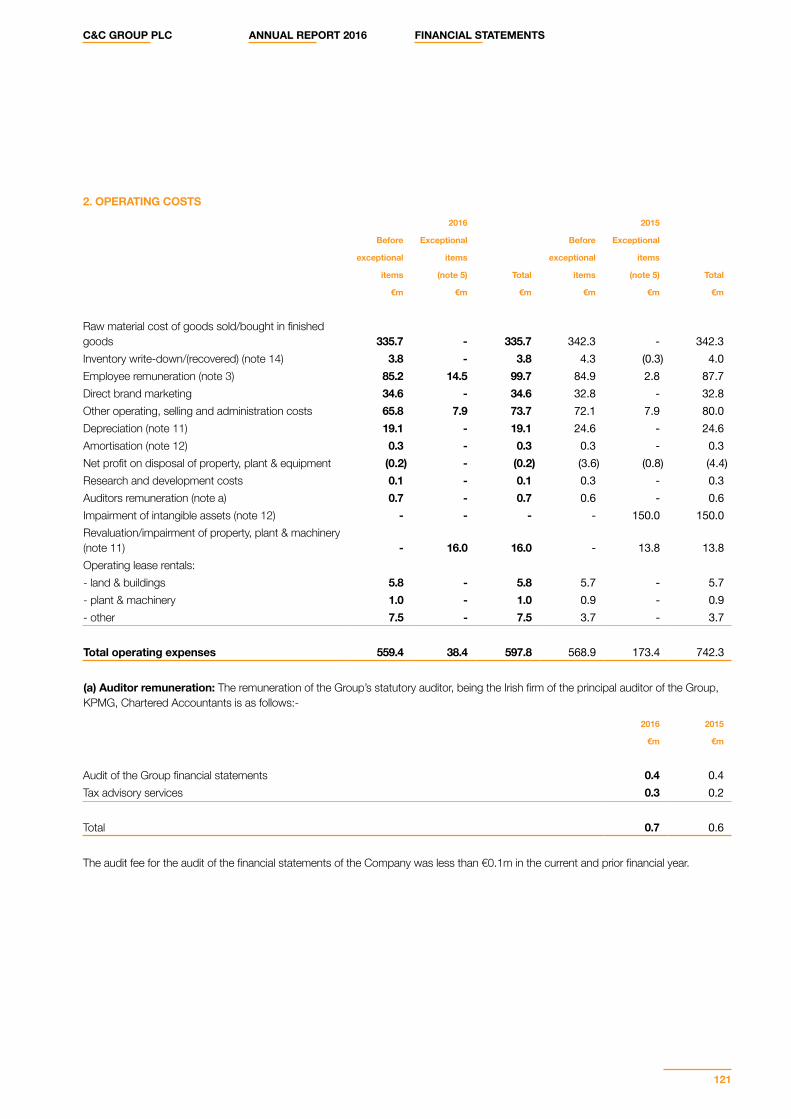
C&C GROUP PLC ANNUAL REPORT 2016 FINANCIAL STATEMENTS
121
2. OPERATING COSTS
2016 2015
Before Exceptional Before Exceptional
exceptional items exceptional items
items (note 5) Total items (note 5) Total
€m €m €m €m €m €m
Raw material cost of goods sold/bought in finished goods 335.7 - 335.7 342.3 - 342.3Inventory write-down/(recovered) (note 14) 3.8 - 3.8 4.3 (0.3) 4.0Employee remuneration (note 3) 85.2 14.5 99.7 84.9 2.8 87.7Direct brand marketing 34.6 - 34.6 32.8 - 32.8Other operating, selling and administration costs 65.8 7.9 73.7 72.1 7.9 80.0Depreciation (note 11) 19.1 - 19.1 24.6 - 24.6Amortisation (note 12) 0.3 - 0.3 0.3 - 0.3Net profit on disposal of property, plant & equipment (0.2) - (0.2) (3.6) (0.8) (4.4)Research and development costs 0.1 - 0.1 0.3 - 0.3Auditors remuneration (note a) 0.7 - 0.7 0.6 - 0.6Impairment of intangible assets (note 12) - - - - 150.0 150.0Revaluation/impairment of property, plant & machinery (note 11) - 16.0 16.0 - 13.8 13.8Operating lease rentals:- land & buildings 5.8 - 5.8 5.7 - 5.7- plant & machinery 1.0 - 1.0 0.9 - 0.9- other 7.5 - 7.5 3.7 - 3.7
Total operating expenses 559.4 38.4 597.8 568.9 173.4 742.3
(a) Auditor remuneration: The remuneration of the Group’s statutory auditor, being the Irish firm of the principal auditor of the Group, KPMG, Chartered Accountants is as follows:-
2016 2015
€m €m
Audit of the Group financial statements 0.4 0.4Tax advisory services 0.3 0.2
Total 0.7 0.6
The audit fee for the audit of the financial statements of the Company was less than €0.1m in the current and prior financial year.
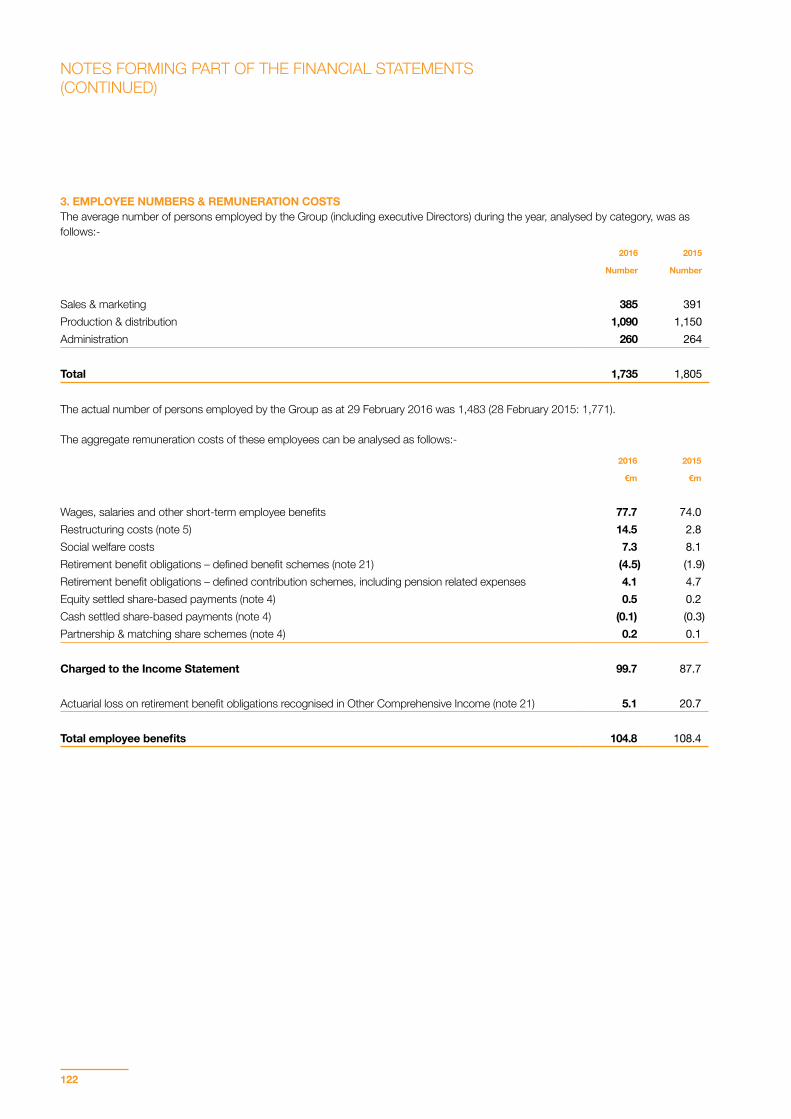
122
3. EMPLOYEE NUMBERS & REMUNERATION COSTSThe average number of persons employed by the Group (including executive Directors) during the year, analysed by category, was as follows:-
2016 2015
Number Number
Sales & marketing 385 391Production & distribution 1,090 1,150Administration 260 264
Total 1,735 1,805
The actual number of persons employed by the Group as at 29 February 2016 was 1,483 (28 February 2015: 1,771).
The aggregate remuneration costs of these employees can be analysed as follows:-
2016 2015
€m €m
Wages, salaries and other short-term employee benefits 77.7 74.0Restructuring costs (note 5) 14.5 2.8Social welfare costs 7.3 8.1Retirement benefit obligations – defined benefit schemes (note 21) (4.5) (1.9)Retirement benefit obligations – defined contribution schemes, including pension related expenses 4.1 4.7Equity settled share-based payments (note 4) 0.5 0.2Cash settled share-based payments (note 4) (0.1) (0.3)Partnership & matching share schemes (note 4) 0.2 0.1
Charged to the Income Statement 99.7 87.7
Actuarial loss on retirement benefit obligations recognised in Other Comprehensive Income (note 21) 5.1 20.7
Total employee benefits 104.8 108.4
NOTES FORMING PART OF THE FINANCIAL STATEMENTS(CONTINUED)
C&C GROUP PLC ANNUAL REPORT 2016 FINANCIAL STATEMENTS
123
4. SHARE-BASED PAYMENTSEquity settled awardsIn April 2004, the Group established an equity settled Executive Share Option Scheme (ESOS) under which options to purchase shares in C&C Group plc are granted to certain executive Directors and members of management. Under the terms of the scheme, the options are exercisable at the market price prevailing at the date of the grant of the option. The maximum grant that can normally be made to any individual in any one year is an award of 150% of base salary in that year. Options have been granted under this scheme in each year since 2004. Under this scheme, options will not normally be exercisable until three years after the date of grant. In addition to continued employment, the options are subject to meeting a specific performance target relating to growth in earnings per share (EPS). EPS is calculated using earnings per share before exceptional items, as disclosed in the financial statements of the Group, subject to any further adjustments approved by the Remuneration Committee. For all awards pre the current financial year the performance target requires that the Group’s aggregate EPS in the three financial years to be not less than the aggregate that would have been achieved had base-year EPS grown by 5% per annum in excess of the change in the Irish Consumer Price Index (Irish CPI) during the period, in order for options to vest. If after the relevant three year period (i.e. 3 years from date of grant) the performance target is not met, the options lapse. For awards in the current financial year the performance target requires that if adjusted EPS growth is 3% per annum over the performance period, 50% of the awards vest and if adjusted EPS growth is 6% per annum or more over the performance period (i.e. 3 years from date of grant), the award vests in full. There will be straight-line vesting between both points and no reward for below threshold performance. If after the relevant three year period (i.e. 3 years from date of grant) the performance target is not met, the options lapse. In the current financial year the performance target options awarded in June 2014 were deemed to be not capable of achieving their performance targets and consequently they were deemed to have lapsed in accordance with IFRS 2 Share-Based Payment.
In April 2004, the Group established a Long-Term Incentive Plan (Part I) (LTIP (Part I)) under the terms of which options to purchase shares in C&C Group plc are granted at nominal cost to certain executive Directors and members of management. Under this plan, awards of up to 100% of base salary may normally be granted and up to 200% of base salary in exceptional circumstances. The options will not normally be exercisable until three years after the date of grant.
Options under this scheme were granted in January 2006, in June of each year from 2006 through to 2008 and in each year since 2011. In the current financial year the options granted in June 2014 were deemed to be not capable of achieving their performance targets and consequently they were deemed to have lapsed in accordance with IFRS 2 Share-Based Payment.
In addition to the time and continued employment vesting conditions, the Remuneration Committee has adopted performance conditions for the options awarded: (i) during each year from 2011 to 2013; and (ii) during 2014 and 2015; as follows:-
2011- 2013• With regard to 50% of the award, a performance condition relating to total shareholder return (“TSR”) applies and achievement of
a financial underpin as mentioned below. 30% of this part of the award vests if the Group’s TSR over a three year period equals the median TSR of a comparator group; 100% of this part of the award vests if the Group’s TSR over a three year period equals or exceeds the TSR of the upper quartile of the comparator group; for performance between the median and the upper quartile there is straight-line pro-rating between 30% and 100%. None of this part of the award vests if the Group’s TSR over a three year period is less than the median TSR of a comparator group. In respect of the TSR condition, a financial underpin applies; the growth in the Group’s earnings per share (EPS) over the three year period must be 5% or more per annum in real terms (compared with Irish CPI) over the same period; alternatively the Remuneration Committee must be satisfied that the Group’s underlying financial performance warrants that level of vesting; otherwise the award lapses. EPS is calculated using earnings per share before exceptional items, as disclosed in the financial statements of the Group, subject to any further adjustments approved by the Remuneration Committee.
• With regard to the remaining 50% of the award, a performance condition relating to growth in EPS applies. 30% of this part of the award vests if the Group’s aggregate EPS in a three year period achieves 4% per annum compound growth in real terms (compared with Irish CPI). 100% of this part of the award vests if the Group’s aggregate EPS in a three year period achieves 10% per annum compound growth in real terms. There is straight-line pro-rating between 30% and 100% vesting for performance between 4% and 10% per annum compound real growth. None of this part of the award vests if the real growth in the Group’s aggregate EPS in a three year period is less than 4% per annum.
124
2014-2015• With regard to 25% of the award, a performance condition relating to total shareholder return (“TSR”) applies and achievement of
a financial underpin as mentioned below. 30% of this part of the award vests if the Group’s TSR over a three year period equals the median TSR of a comparator group; 100% of this part of the award vests if the Group’s TSR over a three year period equals or exceeds the TSR of the upper quartile of the comparator group; for performance between the median and the upper quartile there is straight-line pro-rating between 30% and 100%. None of this part of the award vests if the Group’s TSR over a three year period is less than the median TSR of a comparator group. In respect of the TSR condition, a financial underpin applies; the growth in the Group’s earnings per share (EPS) over the three year period must be 4% or more per annum over the same period; alternatively the Remuneration Committee must be satisfied that the Group’s underlying financial performance warrants that level of vesting; otherwise the award lapses. EPS is calculated using earnings per share before exceptional items, as disclosed in the financial statements of the Group, subject to any further adjustments approved by the Remuneration Committee.
• With regard to the remaining 75% of the award, a performance condition relating to growth in EPS applies. 30% of this part of the award vests if the Group’s aggregate EPS in a three year period achieves 4% per annum compound growth. 100% of this part of the award vests if the Group’s aggregate EPS in a three year period achieves 10% per annum compound growth. There is straight-line pro-rating between 30% and 100% vesting for performance between 4% and 10% per annum compound growth. None of this part of the award vests if the growth in the Group’s aggregate EPS in a three year period is less than 4% per annum.
In December 2008, the Group established a Joint Share Ownership Plan (JSOP) whereby certain executive Directors and members of management were eligible to participate in the Plan at the discretion of the Remuneration Committee. Under this plan, Interests in the form of a restricted Interest in ordinary shares in the Company were awarded to executive Directors and key members of senior management on payment upfront to the Company of an amount equal to 10% of the initial issue price of the shares on the acquisition of the Interest. The participants are also required to pay a further amount if the tax value of their Interest exceeds the price paid. When the further amount is paid, the Company compensates the participant for the obligation to pay this further amount by paying him an equivalent amount, which is, however, subject to income tax in the hands of the participant. The vesting of Interests granted were subject to the following conditions. All of the Interests were subject to a time and service vesting condition with one-third of the Interest in the shares vesting on each of the first, second and third anniversary of acquisition, subject to continued employment only. In addition, half of the Interests in the shares were subject to a pre-vesting share price target. In order to benefit from those Interests the Company’s share price must have been greater than €2.50 for 13,800,000 of the Interests initially awarded, and €4.00 for an additional 2,200,000 of the Interests initially awarded, for at least 20 days out of 40 consecutive dealing days during the five-year period commencing on the date of acquisition of the Interest. All the Interests have now vested or lapsed. When an Interest vests, the trustees may, at the request of the participant and on payment of the further amount, if relevant, transfer shares to the participant of equal value to the participant’s Interest or the shares may be sold by the trustees, who will account to the participant for the difference between the sale proceeds (less expenses) and the Hurdle Value (balancing 90% of the acquisition price on the acquisition of the Interest). In February 2010, the Group established a Restricted Share Award Scheme under the terms of which options to purchase shares in C&C Group plc at nominal cost were granted to certain members of management, excluding executive Directors. The vesting conditions for these awards were similar to those for the JSOP award. All shares awarded under this scheme have now vested or lapsed.
In June 2010, the Group established a Recruitment and Retention Plan under the terms of which options to purchase shares in C&C Group plc at nominal cost are granted to certain members of management, excluding executive Directors.
NOTES FORMING PART OF THE FINANCIAL STATEMENTS(CONTINUED)
C&C GROUP PLC ANNUAL REPORT 2016 FINANCIAL STATEMENTS
125
The performance conditions and/or other terms and conditions for awards granted under this plan are specifically approved by the Board of Directors at the time of each individual award, following a recommendation by the Remuneration Committee.
In May 2012 and May 2013, awards of 1,036,255 and 252,672 respectively, were granted under the Recruitment and Retention Plan subject to continuous employment and the performance condition that the Company’s TSR must grow by not less than 25% between 17 May 2012 and 16 May 2014 for the May 2012 awards and between 16 May 2013 and 15 May 2015 for the May 2013 awards. Awards vest in full if the growth in TSR is at least 50% over that period and the Remuneration Committee is satisfied that the extent to which the award vests is appropriate given the general financial performance of the Group over the performance period. Where TSR growth is between 25% and 50% the percentage of the award that vests is calculated on a straight-line basis between 25% and 100%. Options awarded in May 2012 were deemed to have only partially achieved their performance conditions and consequently 65% of the outstanding awards lapsed. Options granted in May 2013 were deemed to be not capable of achieving their performance conditions and consequently the outstanding awards were deemed to have lapsed in the prior financial year under IFRS 2 Share-Based Payment.
In May 2014 and January 2015, awards of 823,233 and 283,092 respectively, were granted under the Recruitment and Retention Plan subject to continuous employment. Of the May 2014 awards, 547,382 are subject to continued employment and the achievement of annual performance targets related to the business unit to which each recipient is aligned to. Options will vest in May 2017 on achievement of these conditions. Also in May 2014, an award of 92,111 was made subject to continued employment only, to vest in May 2016 and an award of 183,740 was also made subject to continued employment only to vest in May 2017. An award of 283,092 in January 2015 was subject to continued employment and the achievement of performance targets linked to the business unit of the recipient. These awards lapsed in the current financial year on cessation of employment by the recipient.
In the current financial year, 74,956 awards were granted in July 2015 and 490,387 awards were granted in October 2015 under the Recruitment and Retention plan. Of the July 2015 awards, all are subject to continued employment and the achievement of annual performance targets related to the business unit to which each recipient is aligned to. On achievement of both conditions the awards granted will vest in June 2017. Of the October 2015 awards, all are subject to continued employment and the achievement of specific performance targets related to the business unit to which each recipient is aligned to and also specific performance targets related to the specific role of each recipient. Each award has its own vesting period ranging from May 2016 to October 2018.
Obligations arising under the Restricted Share Award Scheme and the Recruitment and Retention Plan will be satisfied by the purchase of existing shares on the open market. On settlement, any difference between the amount included in the Share-based payment reserve account and the cash paid to purchase the shares is recognised in retained income via the Statement of Changes in Equity.
In May 2011, the Group established a deferred equity settled share bonus scheme, Long-Term Incentive Plan (Part II) (LTIP (Part II)), under which shares are awarded to certain employees (excluding executive Directors and senior management) at nominal cost, at the end of the financial year in which the award is granted, if the performance conditions set by the Remuneration Committee are achieved and subject to a two year time vesting period post the end of the relevant financial year. During the financial year ended 29 February 2012, the Remuneration Committee agreed two levels of award linked to operating profit targets. Based on the actual results to 29 February 2012, a right to receive shares at nominal cost equating to 23% of salary was granted to certain employees and a right to receive shares at nominal cost equating to 5% of salary was granted to other employees. The maximum number of shares over which awards were granted under the LTIP (Part II) in the financial year ended 29 February 2012 was set by reference to a share price of €3.55, being the closing share price on 18 May 2011, the date the results for the financial year ended 28 February 2011 were announced. Awards vested in May 2014 and obligations were satisfied by the purchase of existing shares on the open market.
In November 2011, the Group set up Partnership and Matching Share Schemes for all ROI and UK based employees of the Group under the approved profit sharing schemes referred to below. Under these schemes, employees can invest in shares in C&C Group plc (partnership shares) that will be matched on a 1:1 basis by the Company (“matching shares”) subject to Revenue approved limits. Both the partnership and matching shares are held on behalf of the employee by the Scheme trustee, Capita Corporate Trustees Limited. The shares are purchased on the open market on a monthly basis at the market price prevailing at the date of purchase with any remaining cash amounts carried forward and used in the next share purchase. The shares are held in trust for the participating employee, who has full voting rights and dividend entitlements on both partnership and matching shares. Matching shares may be forfeited and/or tax penalties may apply if the employee leaves the Group or removes their partnership shares within the Revenue-stipulated vesting period. The Revenue stipulated vesting period for matching shares awarded under the ROI scheme is three years and under the UK scheme is five years. The Group held 298,202 matching shares (596,404 partnership and matching) in trust at 29 February 2016 (2015: 218,455 matching shares and 436,910 partnership and matching shares held).
126
Cash-settled awardsIn May 2012, the Group granted 114,522 cash-settled awards on terms equivalent to the LTIP (Part I). These awards did not achieve their performance targets and consequently lapsed in accordance with IFRS 2 Share-Based Payment in the prior financial year.
In December 2012, the Group granted 150,786 cash-settled awards on terms equivalent to the rules of the Recruitment and Retention Plan. The awards were subject to continued employment and performance conditions linked to the achievement of annual performance targets with respect to the business unit to which the participant is aligned to. The operating profit targets were deemed not to have been achieved however and consequently the awards have now lapsed in accordance with IFRS 2 Share-Based Payment.
In July 2013, the Group granted 28,279 cash-settled awards on terms equivalent to the rules of the Recruitment and Retention Plan but subject to a time and service vesting condition only. The award will vest in July 2016 subject to the achievement of this condition.
In the prior financial year, the Group granted 16,723 cash-settled awards on terms equivalent to the rules of the Recruitment and Retention Plan. The awards are subject to continued employment and performance conditions linked to the achievement of performance targets with respect to the business unit to which the participant is aligned to. These awards will vest in May 2017 on the achievement of these conditions.
Award valuationThe fair values assigned to the ESOS options granted were computed in accordance with a Black Scholes valuation methodology; the fair value of options awarded under the LTIP (Part I) and Recruitment and Retention Plan were computed in accordance with the stochastic model for the TSR element and the Black Scholes model for the EPS element; the fair value of options awarded under the LTIP (Part II) were computed in accordance with a Black Scholes model; and the fair value of the Interests awarded under the JSOP and the Restricted Share Award Plan were computed using a Monte Carlo simulation model.
As per IFRS 2 Share-based Payment, market based vesting conditions, such as the LTIP (Part I) and Recruitment and Retention Plan TSR condition and the share price target conditions in the JSOP and the Restricted Share Award Plan, have been taken into account in establishing the fair value of equity instruments granted. Non-market or performance related conditions were not taken into account in establishing the fair value of equity instruments granted, instead these non-market vesting conditions are taken into account by adjusting the number of equity instruments included in the measurement of the transaction amount so that, ultimately the amount recognised for time and services received as consideration for the equity instruments granted is based on the number of equity instruments that eventually vest, unless the failure to vest is due to failure to meet a market condition.
NOTES FORMING PART OF THE FINANCIAL STATEMENTS(CONTINUED)
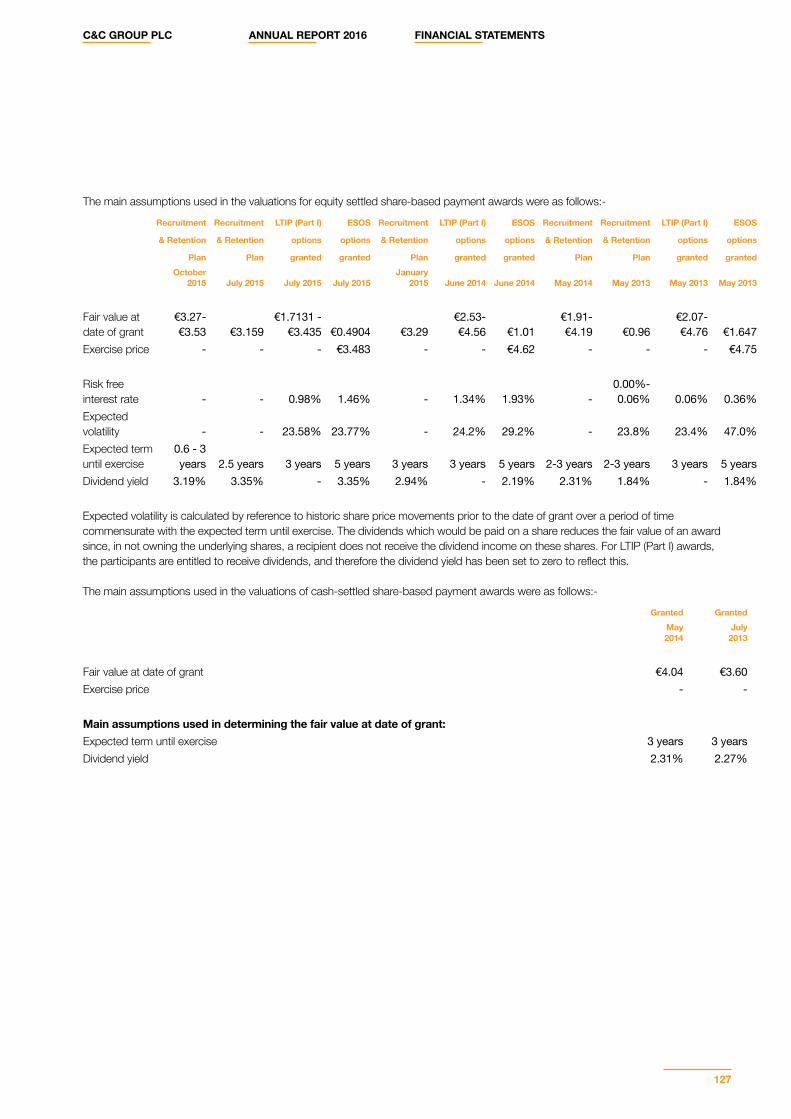
C&C GROUP PLC ANNUAL REPORT 2016 FINANCIAL STATEMENTS
127
The main assumptions used in the valuations for equity settled share-based payment awards were as follows:-
Recruitment Recruitment LTIP (Part I) ESOS Recruitment LTIP (Part I) ESOS Recruitment Recruitment LTIP (Part I) ESOS
& Retention & Retention options options & Retention options options & Retention & Retention options options
Plan Plan granted granted Plan granted granted Plan Plan granted grantedOctober
2015 July 2015 July 2015 July 2015January
2015 June 2014 June 2014 May 2014 May 2013 May 2013 May 2013
Fair value at date of grant
€3.27-€3.53 €3.159
€1.7131 - €3.435
€0.4904 €3.29
€2.53- €4.56 €1.01
€1.91-€4.19 €0.96
€2.07-€4.76 €1.647
Exercise price - - - €3.483 - - €4.62 - - - €4.75
Risk free interest rate - - 0.98% 1.46% - 1.34% 1.93% -
0.00%- 0.06% 0.06% 0.36%
Expected volatility - - 23.58% 23.77% - 24.2% 29.2% - 23.8% 23.4% 47.0%Expected term until exercise
0.6 - 3 years 2.5 years 3 years 5 years 3 years 3 years 5 years 2-3 years 2-3 years 3 years 5 years
Dividend yield 3.19% 3.35% - 3.35% 2.94% - 2.19% 2.31% 1.84% - 1.84%
Expected volatility is calculated by reference to historic share price movements prior to the date of grant over a period of time commensurate with the expected term until exercise. The dividends which would be paid on a share reduces the fair value of an award since, in not owning the underlying shares, a recipient does not receive the dividend income on these shares. For LTIP (Part I) awards, the participants are entitled to receive dividends, and therefore the dividend yield has been set to zero to reflect this.
The main assumptions used in the valuations of cash-settled share-based payment awards were as follows:-
Granted GrantedMay 2014
July 2013
Fair value at date of grant €4.04 €3.60Exercise price - -
Main assumptions used in determining the fair value at date of grant:Expected term until exercise 3 years 3 yearsDividend yield 2.31% 2.27%
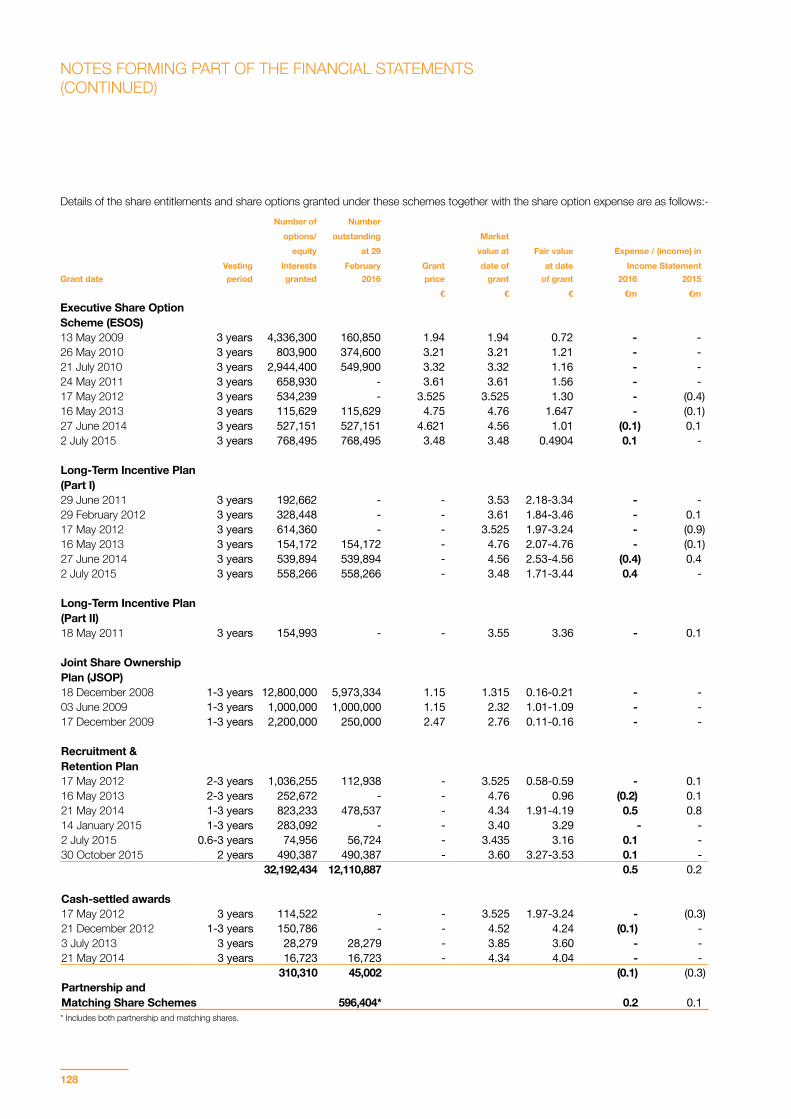
128
Details of the share entitlements and share options granted under these schemes together with the share option expense are as follows:-Number of Number
options/ outstanding Marketequity at 29 value at Fair value Expense / (income) in
Vesting Interests February Grant date of at date Income StatementGrant date period granted 2016 price grant of grant 2016 2015
€ € € €m €mExecutive Share Option Scheme (ESOS)13 May 2009 3 years 4,336,300 160,850 1.94 1.94 0.72 - -26 May 2010 3 years 803,900 374,600 3.21 3.21 1.21 - -21 July 2010 3 years 2,944,400 549,900 3.32 3.32 1.16 - -24 May 2011 3 years 658,930 - 3.61 3.61 1.56 - -17 May 2012 3 years 534,239 - 3.525 3.525 1.30 - (0.4)16 May 2013 3 years 115,629 115,629 4.75 4.76 1.647 - (0.1)27 June 2014 3 years 527,151 527,151 4.621 4.56 1.01 (0.1) 0.12 July 2015 3 years 768,495 768,495 3.48 3.48 0.4904 0.1 -
Long-Term Incentive Plan (Part I)29 June 2011 3 years 192,662 - - 3.53 2.18-3.34 - -29 February 2012 3 years 328,448 - - 3.61 1.84-3.46 - 0.117 May 2012 3 years 614,360 - - 3.525 1.97-3.24 - (0.9)16 May 2013 3 years 154,172 154,172 - 4.76 2.07-4.76 - (0.1)27 June 2014 3 years 539,894 539,894 - 4.56 2.53-4.56 (0.4) 0.42 July 2015 3 years 558,266 558,266 - 3.48 1.71-3.44 0.4 -
Long-Term Incentive Plan (Part II)18 May 2011 3 years 154,993 - - 3.55 3.36 - 0.1
Joint Share Ownership Plan (JSOP)18 December 2008 1-3 years 12,800,000 5,973,334 1.15 1.315 0.16-0.21 - -03 June 2009 1-3 years 1,000,000 1,000,000 1.15 2.32 1.01-1.09 - -17 December 2009 1-3 years 2,200,000 250,000 2.47 2.76 0.11-0.16 - -
Recruitment & Retention Plan17 May 2012 2-3 years 1,036,255 112,938 - 3.525 0.58-0.59 - 0.116 May 2013 2-3 years 252,672 - - 4.76 0.96 (0.2) 0.121 May 2014 1-3 years 823,233 478,537 - 4.34 1.91-4.19 0.5 0.814 January 2015 1-3 years 283,092 - - 3.40 3.29 - -2 July 2015 0.6-3 years 74,956 56,724 - 3.435 3.16 0.1 -30 October 2015 2 years 490,387 490,387 - 3.60 3.27-3.53 0.1 -
32,192,434 12,110,887 0.5 0.2
Cash-settled awards17 May 2012 3 years 114,522 - - 3.525 1.97-3.24 - (0.3)21 December 2012 1-3 years 150,786 - - 4.52 4.24 (0.1) -3 July 2013 3 years 28,279 28,279 - 3.85 3.60 - -21 May 2014 3 years 16,723 16,723 - 4.34 4.04 - -
310,310 45,002 (0.1) (0.3)Partnership and Matching Share Schemes 596,404* 0.2 0.1* Includes both partnership and matching shares.
NOTES FORMING PART OF THE FINANCIAL STATEMENTS(CONTINUED)
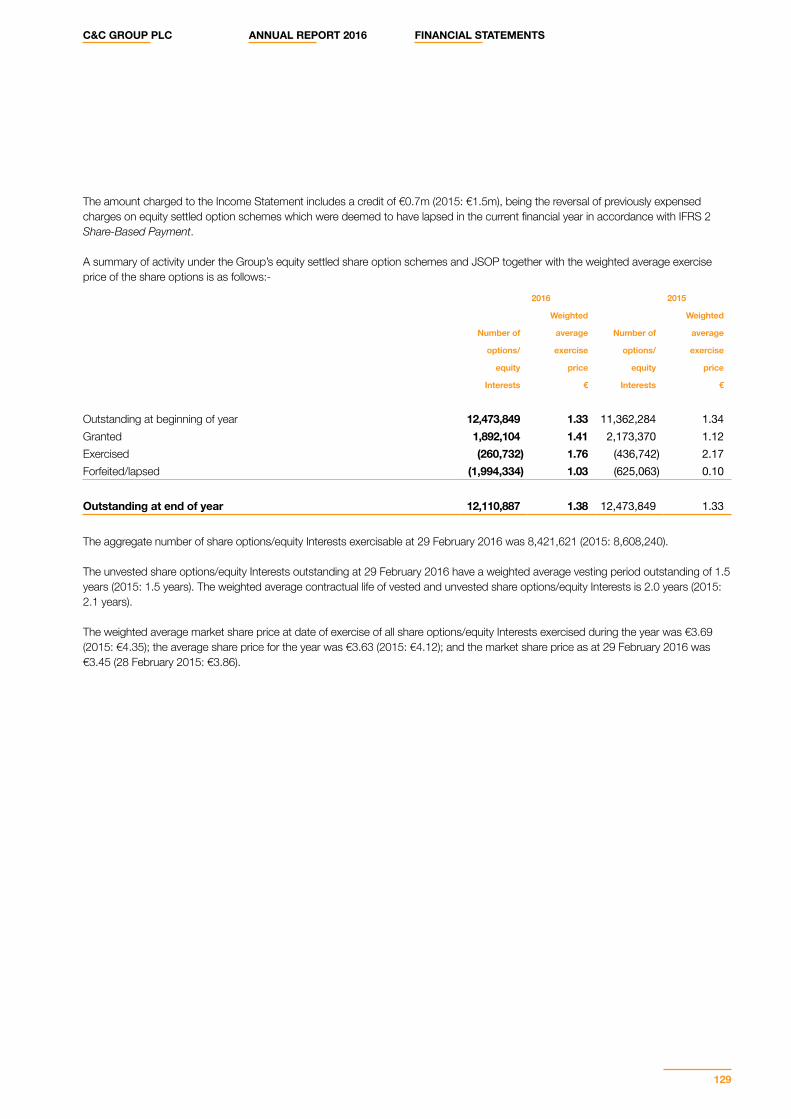
C&C GROUP PLC ANNUAL REPORT 2016 FINANCIAL STATEMENTS
129
The amount charged to the Income Statement includes a credit of €0.7m (2015: €1.5m), being the reversal of previously expensed charges on equity settled option schemes which were deemed to have lapsed in the current financial year in accordance with IFRS 2 Share-Based Payment. A summary of activity under the Group’s equity settled share option schemes and JSOP together with the weighted average exercise price of the share options is as follows:-
2016 2015
Weighted Weighted
Number of average Number of average
options/ exercise options/ exercise
equity price equity price
Interests € Interests €
Outstanding at beginning of year 12,473,849 1.33 11,362,284 1.34Granted 1,892,104 1.41 2,173,370 1.12Exercised (260,732) 1.76 (436,742) 2.17Forfeited/lapsed (1,994,334) 1.03 (625,063) 0.10
Outstanding at end of year 12,110,887 1.38 12,473,849 1.33
The aggregate number of share options/equity Interests exercisable at 29 February 2016 was 8,421,621 (2015: 8,608,240). The unvested share options/equity Interests outstanding at 29 February 2016 have a weighted average vesting period outstanding of 1.5 years (2015: 1.5 years). The weighted average contractual life of vested and unvested share options/equity Interests is 2.0 years (2015: 2.1 years). The weighted average market share price at date of exercise of all share options/equity Interests exercised during the year was €3.69 (2015: €4.35); the average share price for the year was €3.63 (2015: €4.12); and the market share price as at 29 February 2016 was €3.45 (28 February 2015: €3.86).
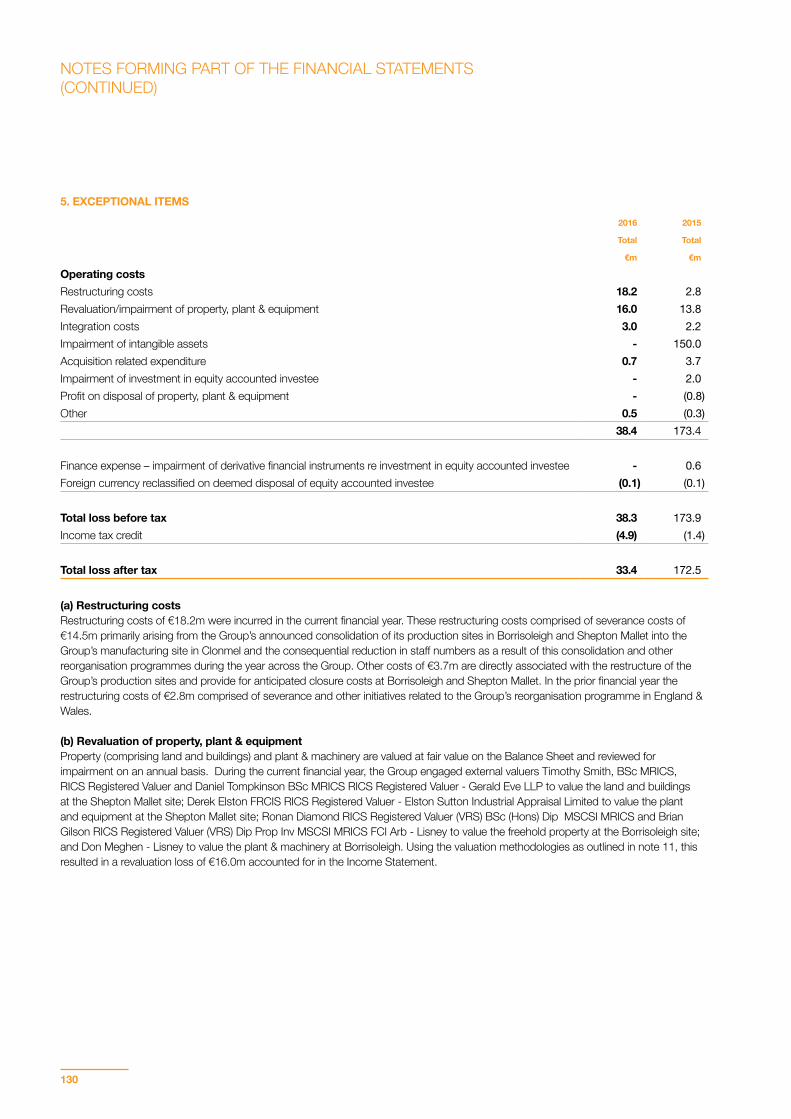
130
5. EXCEPTIONAL ITEMS
2016 2015
Total Total
€m €m
Operating costsRestructuring costs 18.2 2.8Revaluation/impairment of property, plant & equipment 16.0 13.8Integration costs 3.0 2.2Impairment of intangible assets - 150.0Acquisition related expenditure 0.7 3.7Impairment of investment in equity accounted investee - 2.0Profit on disposal of property, plant & equipment - (0.8)Other 0.5 (0.3)
38.4 173.4
Finance expense – impairment of derivative financial instruments re investment in equity accounted investee - 0.6Foreign currency reclassified on deemed disposal of equity accounted investee (0.1) (0.1)
Total loss before tax 38.3 173.9Income tax credit (4.9) (1.4)
Total loss after tax 33.4 172.5
(a) Restructuring costsRestructuring costs of €18.2m were incurred in the current financial year. These restructuring costs comprised of severance costs of €14.5m primarily arising from the Group’s announced consolidation of its production sites in Borrisoleigh and Shepton Mallet into the Group’s manufacturing site in Clonmel and the consequential reduction in staff numbers as a result of this consolidation and other reorganisation programmes during the year across the Group. Other costs of €3.7m are directly associated with the restructure of the Group’s production sites and provide for anticipated closure costs at Borrisoleigh and Shepton Mallet. In the prior financial year the restructuring costs of €2.8m comprised of severance and other initiatives related to the Group’s reorganisation programme in England & Wales.
(b) Revaluation of property, plant & equipmentProperty (comprising land and buildings) and plant & machinery are valued at fair value on the Balance Sheet and reviewed for impairment on an annual basis. During the current financial year, the Group engaged external valuers Timothy Smith, BSc MRICS, RICS Registered Valuer and Daniel Tompkinson BSc MRICS RICS Registered Valuer - Gerald Eve LLP to value the land and buildings at the Shepton Mallet site; Derek Elston FRCIS RICS Registered Valuer - Elston Sutton Industrial Appraisal Limited to value the plant and equipment at the Shepton Mallet site; Ronan Diamond RICS Registered Valuer (VRS) BSc (Hons) Dip MSCSI MRICS and Brian Gilson RICS Registered Valuer (VRS) Dip Prop Inv MSCSI MRICS FCI Arb - Lisney to value the freehold property at the Borrisoleigh site; and Don Meghen - Lisney to value the plant & machinery at Borrisoleigh. Using the valuation methodologies as outlined in note 11, this resulted in a revaluation loss of €16.0m accounted for in the Income Statement.
NOTES FORMING PART OF THE FINANCIAL STATEMENTS(CONTINUED)
C&C GROUP PLC ANNUAL REPORT 2016 FINANCIAL STATEMENTS
131
In the prior financial year, the Group engaged external valuers Shane O’Beirne RICS Registered Valuer (VRS) BSc (Surv) Dip AVEA MSCSI MRICS and Brian Gilson RICS Registered Valuer (VRS) BSc MSCSI MRICS FCI Arb - Lisney to value the freehold property at the Clonmel site; David Fawcett, FRICS RICS Registered Valuer - Sanderson Weatherall to value the plant and machinery at the Clonmel site; Timothy Smith BSc MRICS RICS Registered Valuer and Joseph Funtek BSc MRICS RICS Registered Valuer – Gerald Eve LLP to value the freehold property at the Shepton Mallet and Wellpark Brewery sites; Derek Elston FRCIS RICS Registered Valuer - Elston Sutton Industrial Appraisal Limited to value the plant and equipment at the Shepton Mallet and Wellpark Brewery site and John Coto, Certified Machine & Equipment appraiser, Alliance Machinery & Equipment Appraisals to value the plant & machinery at the Group’s Vermont site. Using the valuation methodologies as outlined in note 11, this resulted in a net revaluation loss of €10.5m accounted for in the Income Statement and a gain of €5.3m accounted for within Other Comprehensive Income. Also during the prior financial year, in light of a material reduction in the utilisation levels of a bottling line located at the Group’s cider manufacturing plant at Shepton Mallet, used to bottle both own branded and third party branded product, a decision was taken to impair the bottling line by €3.3m.
(c) Integration costs During the current financial year the Group incurred costs of €3.0m primarily in relation to the continued integration of the previously acquired Wallaces Express with the Group’s existing Scottish business. During the prior financial year, the Group incurred external consultancy fees and other costs of €2.2m directly attributable to the integration of Wallaces Express and Gleeson with the Group’s existing businesses.
(d) Impairment of intangible assetsTo ensure that goodwill and brands considered to have an indefinite useful economic life are not carried at above their recoverable amount, impairment reviews are performed annually or more frequently if there is an indication that their carrying amount(s) may not be recoverable, comparing the carrying value of the assets with their recoverable amount using value-in-use computations. In the prior financial year, as a result of such a review, the Group impaired the value of its intangible assets with respect to the Group’s North American business segment by €150.0m as outlined in more detail in note 12.
(e) Acquisition related expenditureIn the current financial year the Group incurred professional fees of €0.7m associated with the assessment and consideration of strategic opportunities by the Group during the year. In the prior financial year the Group completed the acquisition of Green Light Brands Ltd., Monuriki Drinks Ltd., and Monuriki Sales and Marketing Ltd., (collectively referred to as “Green Light Brands”), on 19 January 2015, for €3.2m. Also during the prior financial year, the Group incurred €0.5m of costs directly attributable to the preliminary approach of the Spirit Pub Group.
(f) Impairment of investment in equity accounted investeeDuring the prior financial year, the Group impaired its investment in the Maclay Group plc as a result of the Maclay Group plc entering administration proceedings during the prior financial year. This resulted in the impairment in the Group’s investment of €2.0m and the impairment of derivative financial instruments of €0.6m which were accounted for within finance expense.
(g) Profit on disposal of property, plant & equipmentIn the prior financial year the Group disposed of land & buildings which were surplus to requirements realising a profit of €0.8m.
(h) OtherDuring the current financial year the Group incurred costs of €0.5m in relation to a one-off shortage in a key process gas. The business was forced to limit production for a period and incur additional costs in sourcing gas due to a plant failure at its key supplier.
During the financial year ended 28 February 2009, the Group’s stock holding of apple juice at circa 36 months of forecasted future sales was deemed excessive in light of anticipated future needs, forward purchase commitments and useful life of the stock on hand. Accordingly the Group recorded an impairment charge in relation to excess apple juice stocks. During the prior financial year, some of the previously impaired juice stocks were recovered and used by the Group. As a result this stock was written back to operating profit at its recoverable value resulting in a gain of €0.3m.
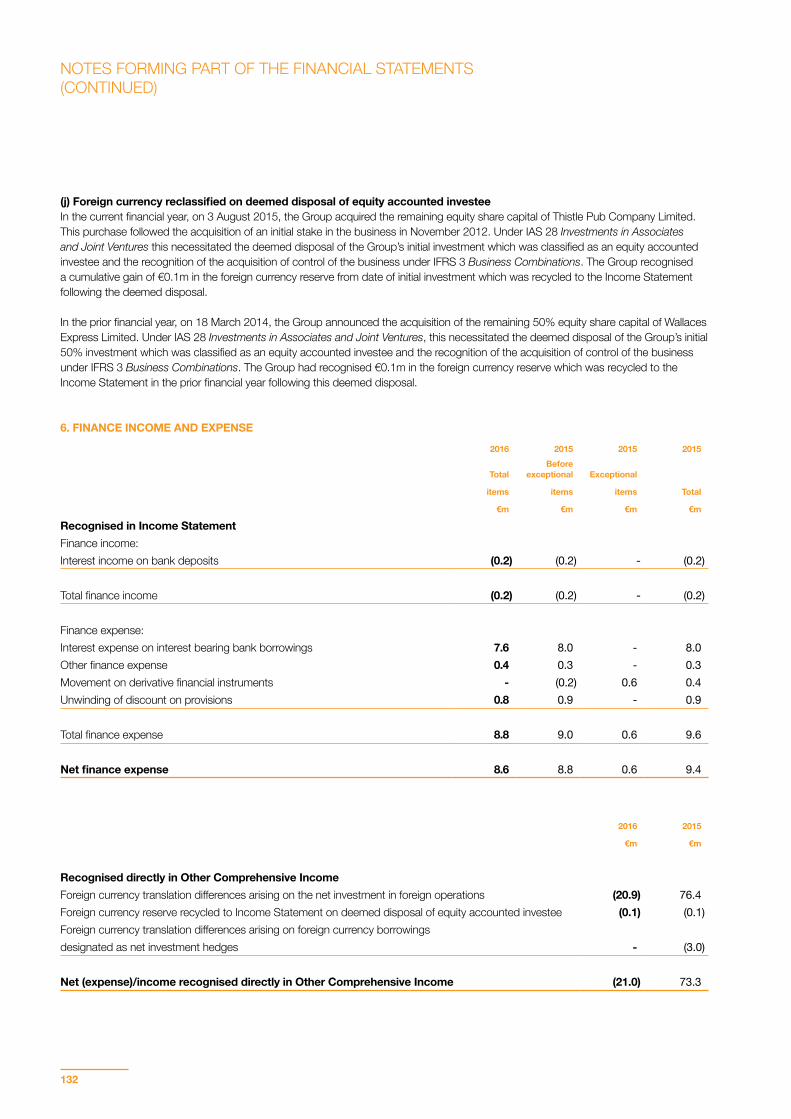
132
(j) Foreign currency reclassified on deemed disposal of equity accounted investeeIn the current financial year, on 3 August 2015, the Group acquired the remaining equity share capital of Thistle Pub Company Limited. This purchase followed the acquisition of an initial stake in the business in November 2012. Under IAS 28 Investments in Associates and Joint Ventures this necessitated the deemed disposal of the Group’s initial investment which was classified as an equity accounted investee and the recognition of the acquisition of control of the business under IFRS 3 Business Combinations. The Group recognised a cumulative gain of €0.1m in the foreign currency reserve from date of initial investment which was recycled to the Income Statement following the deemed disposal.
In the prior financial year, on 18 March 2014, the Group announced the acquisition of the remaining 50% equity share capital of Wallaces Express Limited. Under IAS 28 Investments in Associates and Joint Ventures, this necessitated the deemed disposal of the Group’s initial 50% investment which was classified as an equity accounted investee and the recognition of the acquisition of control of the business under IFRS 3 Business Combinations. The Group had recognised €0.1m in the foreign currency reserve which was recycled to the Income Statement in the prior financial year following this deemed disposal.
6. FINANCE INCOME AND EXPENSE
2016 2015 2015 2015
TotalBefore
exceptional Exceptional
items items items Total
€m €m €m €m
Recognised in Income StatementFinance income:Interest income on bank deposits (0.2) (0.2) - (0.2)
Total finance income (0.2) (0.2) - (0.2)
Finance expense:Interest expense on interest bearing bank borrowings 7.6 8.0 - 8.0Other finance expense 0.4 0.3 - 0.3Movement on derivative financial instruments - (0.2) 0.6 0.4Unwinding of discount on provisions 0.8 0.9 - 0.9
Total finance expense 8.8 9.0 0.6 9.6
Net finance expense 8.6 8.8 0.6 9.4
2016 2015
€m €m
Recognised directly in Other Comprehensive IncomeForeign currency translation differences arising on the net investment in foreign operations (20.9) 76.4Foreign currency reserve recycled to Income Statement on deemed disposal of equity accounted investee (0.1) (0.1)Foreign currency translation differences arising on foreign currency borrowings designated as net investment hedges - (3.0)
Net (expense)/income recognised directly in Other Comprehensive Income (21.0) 73.3
NOTES FORMING PART OF THE FINANCIAL STATEMENTS(CONTINUED)
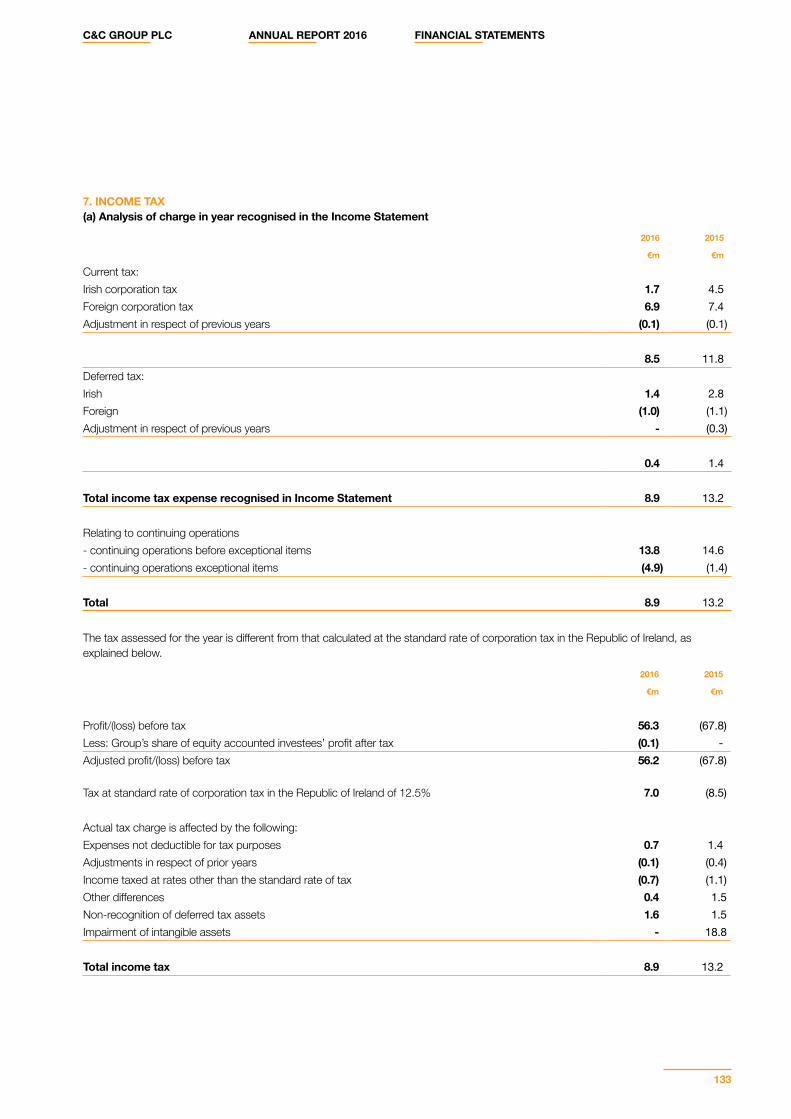
C&C GROUP PLC ANNUAL REPORT 2016 FINANCIAL STATEMENTS
133
7. INCOME TAX (a) Analysis of charge in year recognised in the Income Statement
2016 2015
€m €m
Current tax: Irish corporation tax 1.7 4.5Foreign corporation tax 6.9 7.4Adjustment in respect of previous years (0.1) (0.1)
8.5 11.8Deferred tax: Irish 1.4 2.8Foreign (1.0) (1.1)Adjustment in respect of previous years - (0.3)
0.4 1.4
Total income tax expense recognised in Income Statement 8.9 13.2
Relating to continuing operations- continuing operations before exceptional items 13.8 14.6- continuing operations exceptional items (4.9) (1.4)
Total 8.9 13.2
The tax assessed for the year is different from that calculated at the standard rate of corporation tax in the Republic of Ireland, as explained below.
2016 2015
€m €m
Profit/(loss) before tax 56.3 (67.8)Less: Group’s share of equity accounted investees’ profit after tax (0.1) -Adjusted profit/(loss) before tax 56.2 (67.8)
Tax at standard rate of corporation tax in the Republic of Ireland of 12.5% 7.0 (8.5)
Actual tax charge is affected by the following:Expenses not deductible for tax purposes 0.7 1.4Adjustments in respect of prior years (0.1) (0.4)Income taxed at rates other than the standard rate of tax (0.7) (1.1)Other differences 0.4 1.5Non-recognition of deferred tax assets 1.6 1.5Impairment of intangible assets - 18.8
Total income tax 8.9 13.2
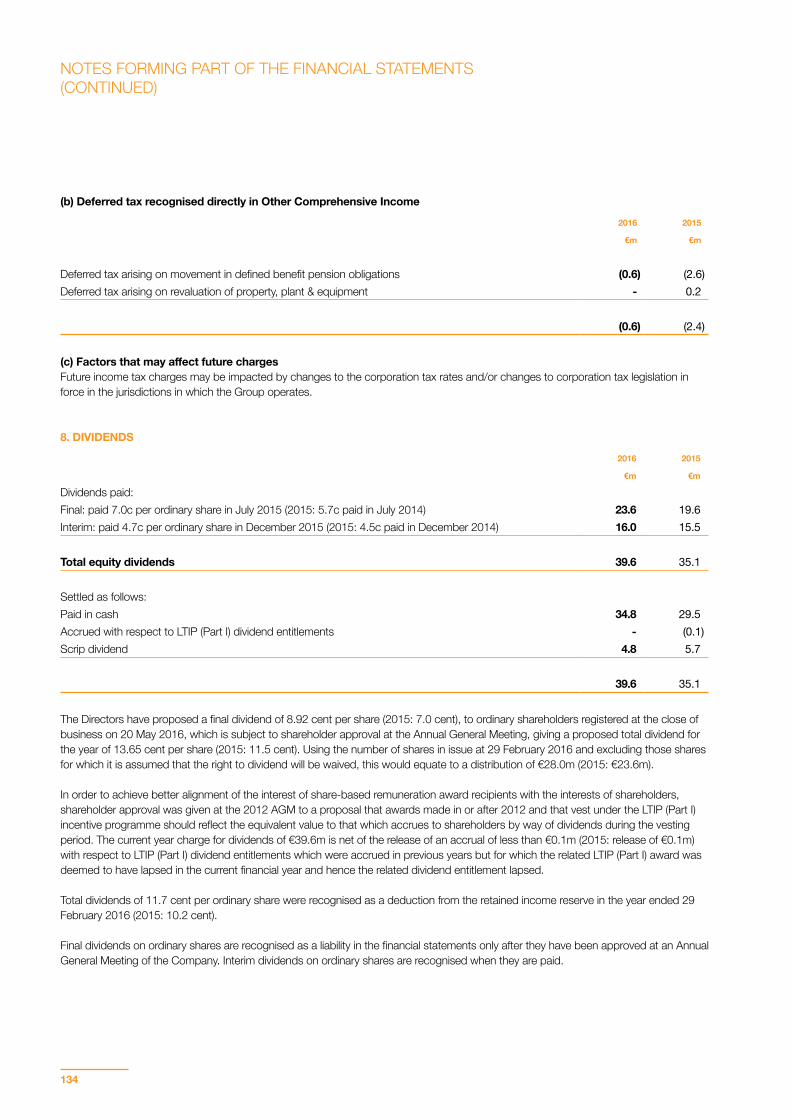
134
(b) Deferred tax recognised directly in Other Comprehensive Income
2016 2015
€m €m
Deferred tax arising on movement in defined benefit pension obligations (0.6) (2.6)Deferred tax arising on revaluation of property, plant & equipment - 0.2
(0.6) (2.4)
(c) Factors that may affect future chargesFuture income tax charges may be impacted by changes to the corporation tax rates and/or changes to corporation tax legislation in force in the jurisdictions in which the Group operates.
8. DIVIDENDS
2016 2015
€m €m
Dividends paid:Final: paid 7.0c per ordinary share in July 2015 (2015: 5.7c paid in July 2014) 23.6 19.6Interim: paid 4.7c per ordinary share in December 2015 (2015: 4.5c paid in December 2014) 16.0 15.5
Total equity dividends 39.6 35.1
Settled as follows:Paid in cash 34.8 29.5Accrued with respect to LTIP (Part I) dividend entitlements - (0.1)Scrip dividend 4.8 5.7
39.6 35.1
The Directors have proposed a final dividend of 8.92 cent per share (2015: 7.0 cent), to ordinary shareholders registered at the close of business on 20 May 2016, which is subject to shareholder approval at the Annual General Meeting, giving a proposed total dividend for the year of 13.65 cent per share (2015: 11.5 cent). Using the number of shares in issue at 29 February 2016 and excluding those shares for which it is assumed that the right to dividend will be waived, this would equate to a distribution of €28.0m (2015: €23.6m). In order to achieve better alignment of the interest of share-based remuneration award recipients with the interests of shareholders, shareholder approval was given at the 2012 AGM to a proposal that awards made in or after 2012 and that vest under the LTIP (Part I) incentive programme should reflect the equivalent value to that which accrues to shareholders by way of dividends during the vesting period. The current year charge for dividends of €39.6m is net of the release of an accrual of less than €0.1m (2015: release of €0.1m) with respect to LTIP (Part I) dividend entitlements which were accrued in previous years but for which the related LTIP (Part I) award was deemed to have lapsed in the current financial year and hence the related dividend entitlement lapsed.
Total dividends of 11.7 cent per ordinary share were recognised as a deduction from the retained income reserve in the year ended 29 February 2016 (2015: 10.2 cent).
Final dividends on ordinary shares are recognised as a liability in the financial statements only after they have been approved at an Annual General Meeting of the Company. Interim dividends on ordinary shares are recognised when they are paid.
NOTES FORMING PART OF THE FINANCIAL STATEMENTS(CONTINUED)
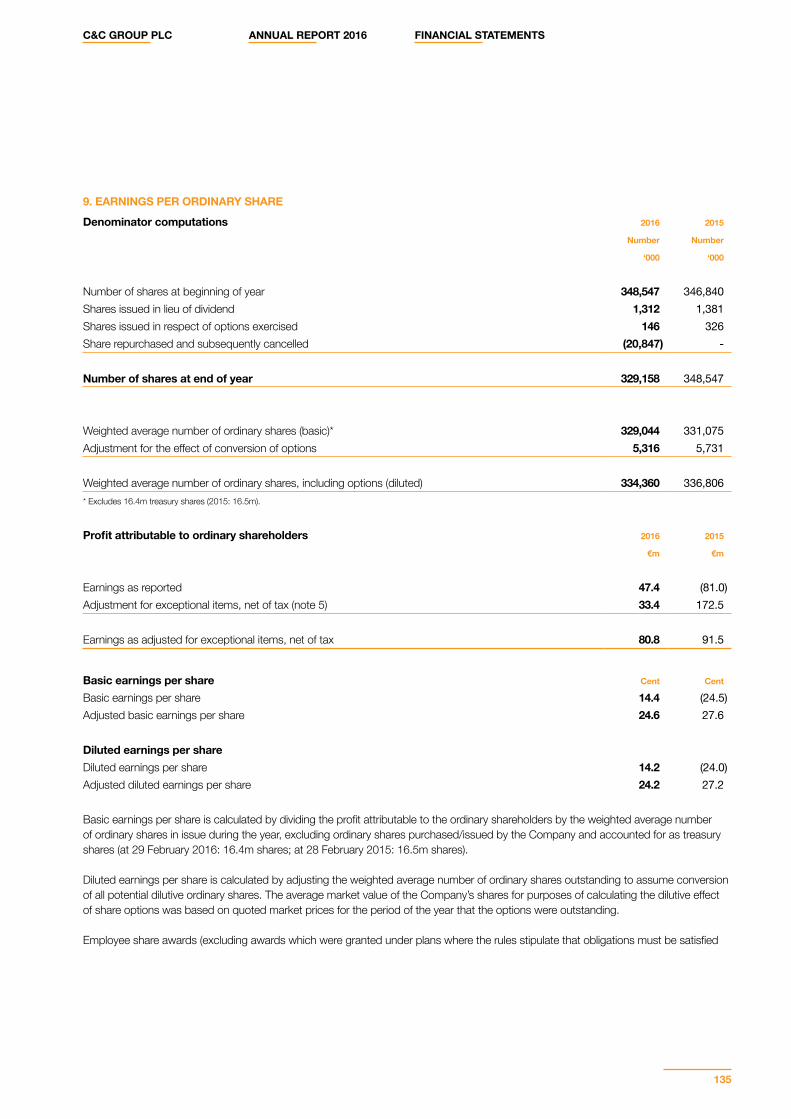
C&C GROUP PLC ANNUAL REPORT 2016 FINANCIAL STATEMENTS
135
9. EARNINGS PER ORDINARY SHARE
Denominator computations 2016 2015
Number Number
‘000 ‘000
Number of shares at beginning of year 348,547 346,840Shares issued in lieu of dividend 1,312 1,381Shares issued in respect of options exercised 146 326Share repurchased and subsequently cancelled (20,847) -
Number of shares at end of year 329,158 348,547
Weighted average number of ordinary shares (basic)* 329,044 331,075Adjustment for the effect of conversion of options 5,316 5,731
Weighted average number of ordinary shares, including options (diluted) 334,360 336,806* Excludes 16.4m treasury shares (2015: 16.5m).
Profit attributable to ordinary shareholders 2016 2015
€m €m
Earnings as reported 47.4 (81.0)Adjustment for exceptional items, net of tax (note 5) 33.4 172.5
Earnings as adjusted for exceptional items, net of tax 80.8 91.5
Basic earnings per share Cent Cent
Basic earnings per share 14.4 (24.5)Adjusted basic earnings per share 24.6 27.6
Diluted earnings per shareDiluted earnings per share 14.2 (24.0)Adjusted diluted earnings per share 24.2 27.2
Basic earnings per share is calculated by dividing the profit attributable to the ordinary shareholders by the weighted average number of ordinary shares in issue during the year, excluding ordinary shares purchased/issued by the Company and accounted for as treasury shares (at 29 February 2016: 16.4m shares; at 28 February 2015: 16.5m shares). Diluted earnings per share is calculated by adjusting the weighted average number of ordinary shares outstanding to assume conversion of all potential dilutive ordinary shares. The average market value of the Company’s shares for purposes of calculating the dilutive effect of share options was based on quoted market prices for the period of the year that the options were outstanding. Employee share awards (excluding awards which were granted under plans where the rules stipulate that obligations must be satisfied
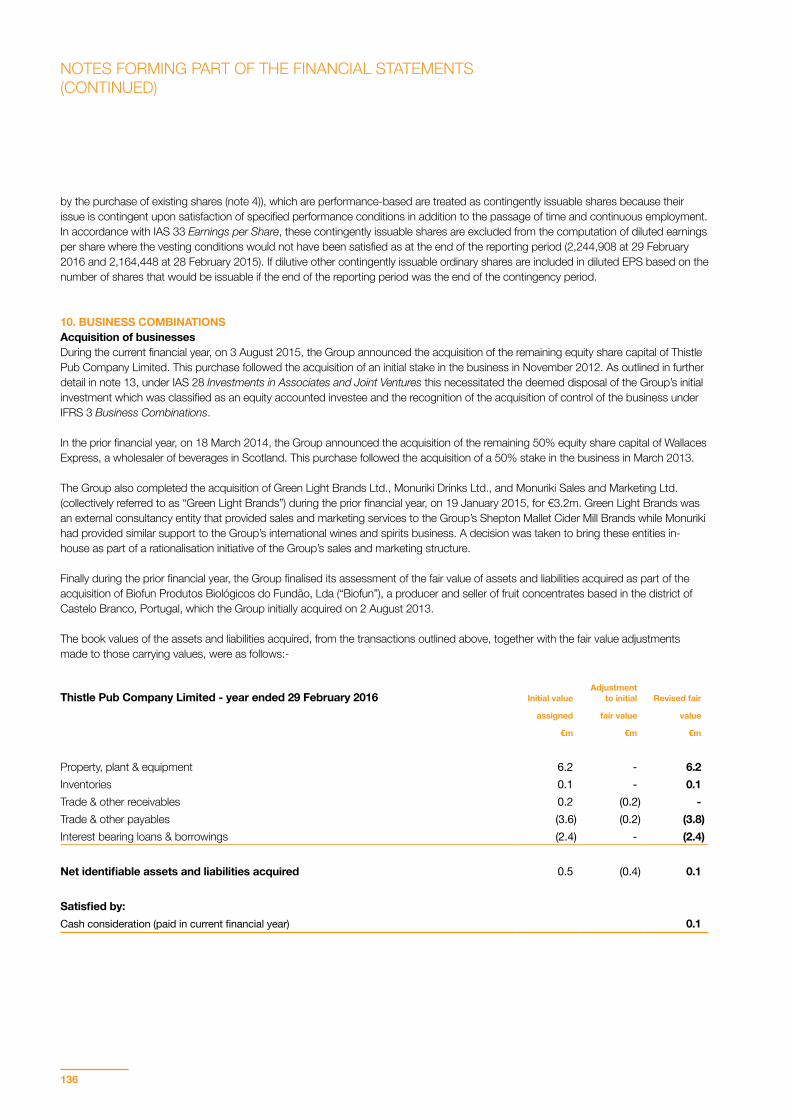
136
by the purchase of existing shares (note 4)), which are performance-based are treated as contingently issuable shares because their issue is contingent upon satisfaction of specified performance conditions in addition to the passage of time and continuous employment. In accordance with IAS 33 Earnings per Share, these contingently issuable shares are excluded from the computation of diluted earnings per share where the vesting conditions would not have been satisfied as at the end of the reporting period (2,244,908 at 29 February 2016 and 2,164,448 at 28 February 2015). If dilutive other contingently issuable ordinary shares are included in diluted EPS based on the number of shares that would be issuable if the end of the reporting period was the end of the contingency period.
10. BUSINESS COMBINATIONSAcquisition of businessesDuring the current financial year, on 3 August 2015, the Group announced the acquisition of the remaining equity share capital of Thistle Pub Company Limited. This purchase followed the acquisition of an initial stake in the business in November 2012. As outlined in further detail in note 13, under IAS 28 Investments in Associates and Joint Ventures this necessitated the deemed disposal of the Group’s initial investment which was classified as an equity accounted investee and the recognition of the acquisition of control of the business under IFRS 3 Business Combinations.
In the prior financial year, on 18 March 2014, the Group announced the acquisition of the remaining 50% equity share capital of Wallaces Express, a wholesaler of beverages in Scotland. This purchase followed the acquisition of a 50% stake in the business in March 2013.
The Group also completed the acquisition of Green Light Brands Ltd., Monuriki Drinks Ltd., and Monuriki Sales and Marketing Ltd. (collectively referred to as “Green Light Brands”) during the prior financial year, on 19 January 2015, for €3.2m. Green Light Brands was an external consultancy entity that provided sales and marketing services to the Group’s Shepton Mallet Cider Mill Brands while Monuriki had provided similar support to the Group’s international wines and spirits business. A decision was taken to bring these entities in-house as part of a rationalisation initiative of the Group’s sales and marketing structure.
Finally during the prior financial year, the Group finalised its assessment of the fair value of assets and liabilities acquired as part of the acquisition of Biofun Produtos Biológicos do Fundão, Lda (“Biofun”), a producer and seller of fruit concentrates based in the district of Castelo Branco, Portugal, which the Group initially acquired on 2 August 2013.
The book values of the assets and liabilities acquired, from the transactions outlined above, together with the fair value adjustments made to those carrying values, were as follows:-
Thistle Pub Company Limited - year ended 29 February 2016 Initial valueAdjustment
to initial Revised fair
assigned fair value value
€m €m €m
Property, plant & equipment 6.2 - 6.2Inventories 0.1 - 0.1Trade & other receivables 0.2 (0.2) -Trade & other payables (3.6) (0.2) (3.8)Interest bearing loans & borrowings (2.4) - (2.4)
Net identifiable assets and liabilities acquired 0.5 (0.4) 0.1
Satisfied by:Cash consideration (paid in current financial year) 0.1
NOTES FORMING PART OF THE FINANCIAL STATEMENTS(CONTINUED)
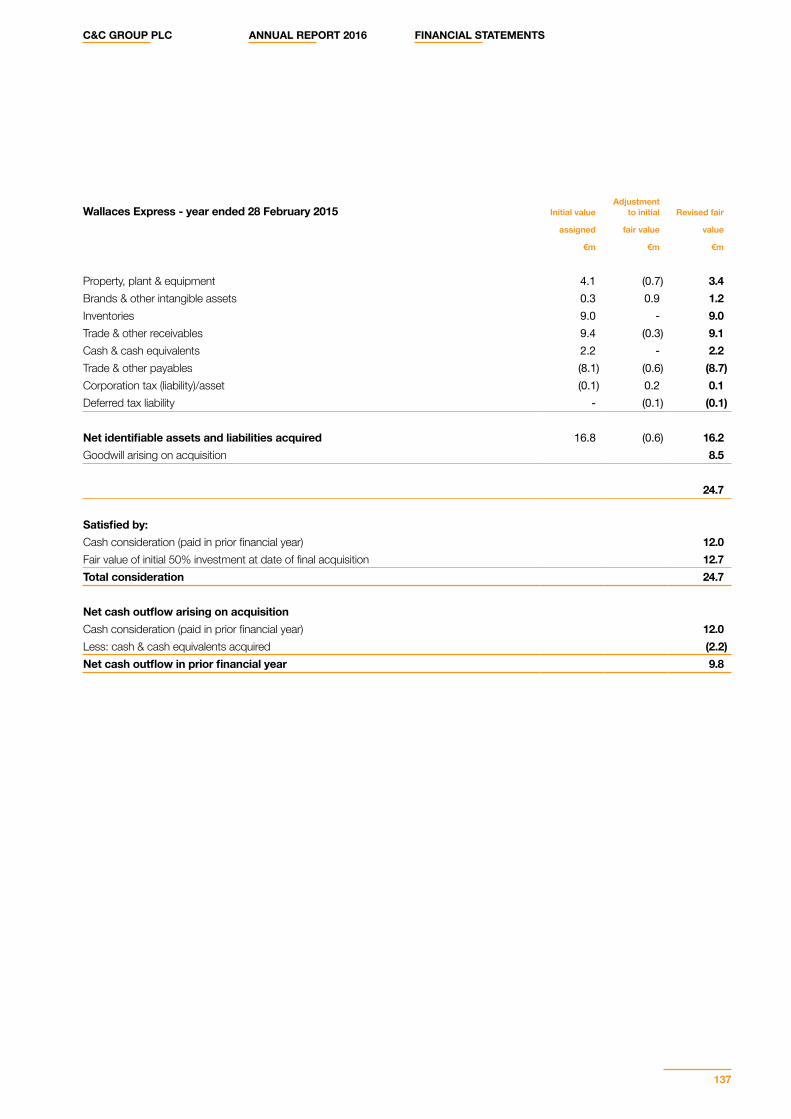
C&C GROUP PLC ANNUAL REPORT 2016 FINANCIAL STATEMENTS
137
Wallaces Express - year ended 28 February 2015 Initial valueAdjustment
to initial Revised fair
assigned fair value value
€m €m €m
Property, plant & equipment 4.1 (0.7) 3.4Brands & other intangible assets 0.3 0.9 1.2Inventories 9.0 - 9.0Trade & other receivables 9.4 (0.3) 9.1Cash & cash equivalents 2.2 - 2.2Trade & other payables (8.1) (0.6) (8.7)Corporation tax (liability)/asset (0.1) 0.2 0.1Deferred tax liability - (0.1) (0.1)
Net identifiable assets and liabilities acquired 16.8 (0.6) 16.2Goodwill arising on acquisition 8.5
24.7
Satisfied by:Cash consideration (paid in prior financial year) 12.0Fair value of initial 50% investment at date of final acquisition 12.7Total consideration 24.7
Net cash outflow arising on acquisitionCash consideration (paid in prior financial year) 12.0Less: cash & cash equivalents acquired (2.2)Net cash outflow in prior financial year 9.8
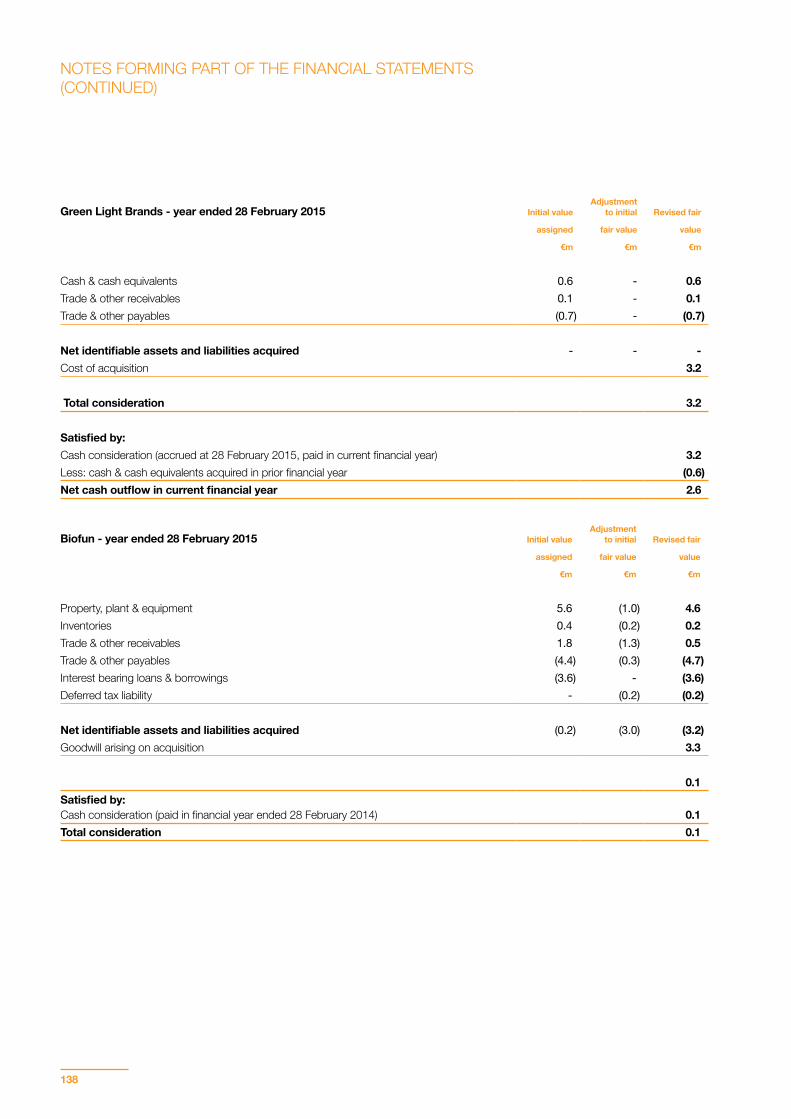
138
Green Light Brands - year ended 28 February 2015 Initial valueAdjustment
to initial Revised fair
assigned fair value value
€m €m €m
Cash & cash equivalents 0.6 - 0.6Trade & other receivables 0.1 - 0.1Trade & other payables (0.7) - (0.7)
Net identifiable assets and liabilities acquired - - -Cost of acquisition 3.2
Total consideration 3.2
Satisfied by:Cash consideration (accrued at 28 February 2015, paid in current financial year) 3.2Less: cash & cash equivalents acquired in prior financial year (0.6)Net cash outflow in current financial year 2.6
Biofun - year ended 28 February 2015 Initial valueAdjustment
to initial Revised fair
assigned fair value value
€m €m €m
Property, plant & equipment 5.6 (1.0) 4.6Inventories 0.4 (0.2) 0.2Trade & other receivables 1.8 (1.3) 0.5Trade & other payables (4.4) (0.3) (4.7)Interest bearing loans & borrowings (3.6) - (3.6)Deferred tax liability - (0.2) (0.2)
Net identifiable assets and liabilities acquired (0.2) (3.0) (3.2)Goodwill arising on acquisition 3.3
0.1Satisfied by:Cash consideration (paid in financial year ended 28 February 2014) 0.1Total consideration 0.1
NOTES FORMING PART OF THE FINANCIAL STATEMENTS(CONTINUED)
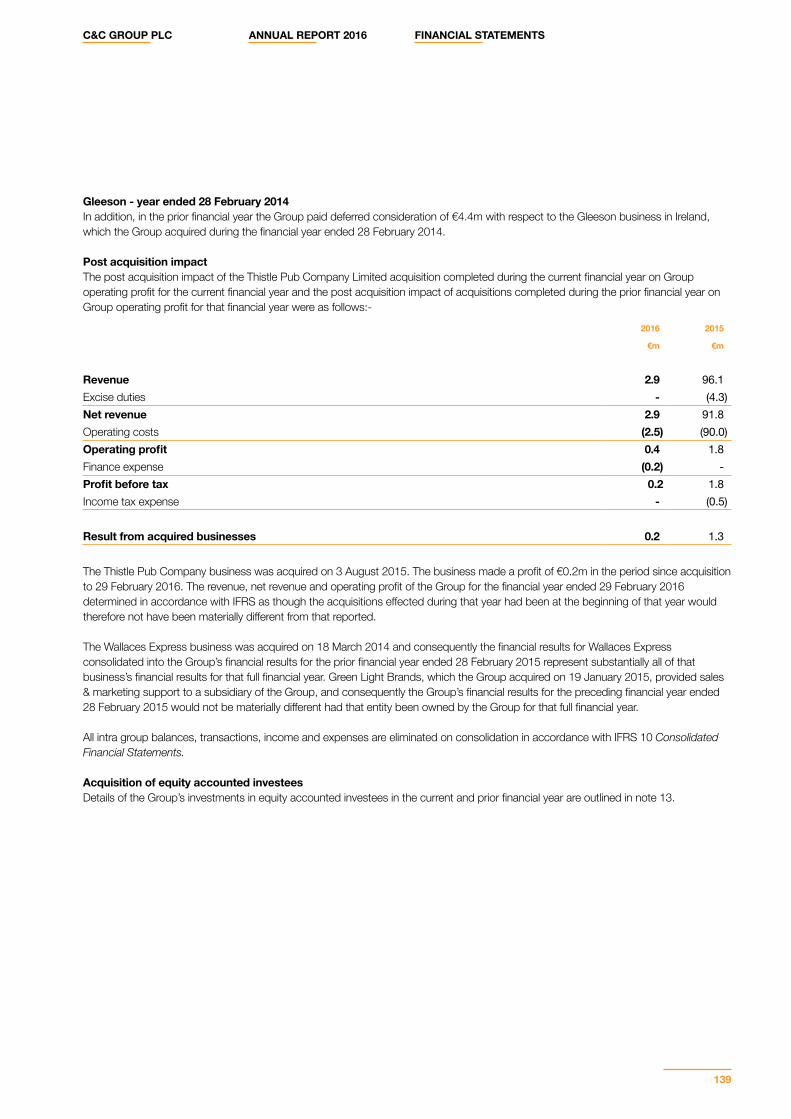
C&C GROUP PLC ANNUAL REPORT 2016 FINANCIAL STATEMENTS
139
Gleeson - year ended 28 February 2014In addition, in the prior financial year the Group paid deferred consideration of €4.4m with respect to the Gleeson business in Ireland, which the Group acquired during the financial year ended 28 February 2014.
Post acquisition impactThe post acquisition impact of the Thistle Pub Company Limited acquisition completed during the current financial year on Group operating profit for the current financial year and the post acquisition impact of acquisitions completed during the prior financial year on Group operating profit for that financial year were as follows:-
2016 2015
€m €m
Revenue 2.9 96.1Excise duties - (4.3)Net revenue 2.9 91.8Operating costs (2.5) (90.0)Operating profit 0.4 1.8Finance expense (0.2) -Profit before tax 0.2 1.8Income tax expense - (0.5)
Result from acquired businesses 0.2 1.3
The Thistle Pub Company business was acquired on 3 August 2015. The business made a profit of €0.2m in the period since acquisition to 29 February 2016. The revenue, net revenue and operating profit of the Group for the financial year ended 29 February 2016 determined in accordance with IFRS as though the acquisitions effected during that year had been at the beginning of that year would therefore not have been materially different from that reported.
The Wallaces Express business was acquired on 18 March 2014 and consequently the financial results for Wallaces Express consolidated into the Group’s financial results for the prior financial year ended 28 February 2015 represent substantially all of that business’s financial results for that full financial year. Green Light Brands, which the Group acquired on 19 January 2015, provided sales & marketing support to a subsidiary of the Group, and consequently the Group’s financial results for the preceding financial year ended 28 February 2015 would not be materially different had that entity been owned by the Group for that full financial year.
All intra group balances, transactions, income and expenses are eliminated on consolidation in accordance with IFRS 10 Consolidated Financial Statements.
Acquisition of equity accounted investeesDetails of the Group’s investments in equity accounted investees in the current and prior financial year are outlined in note 13.
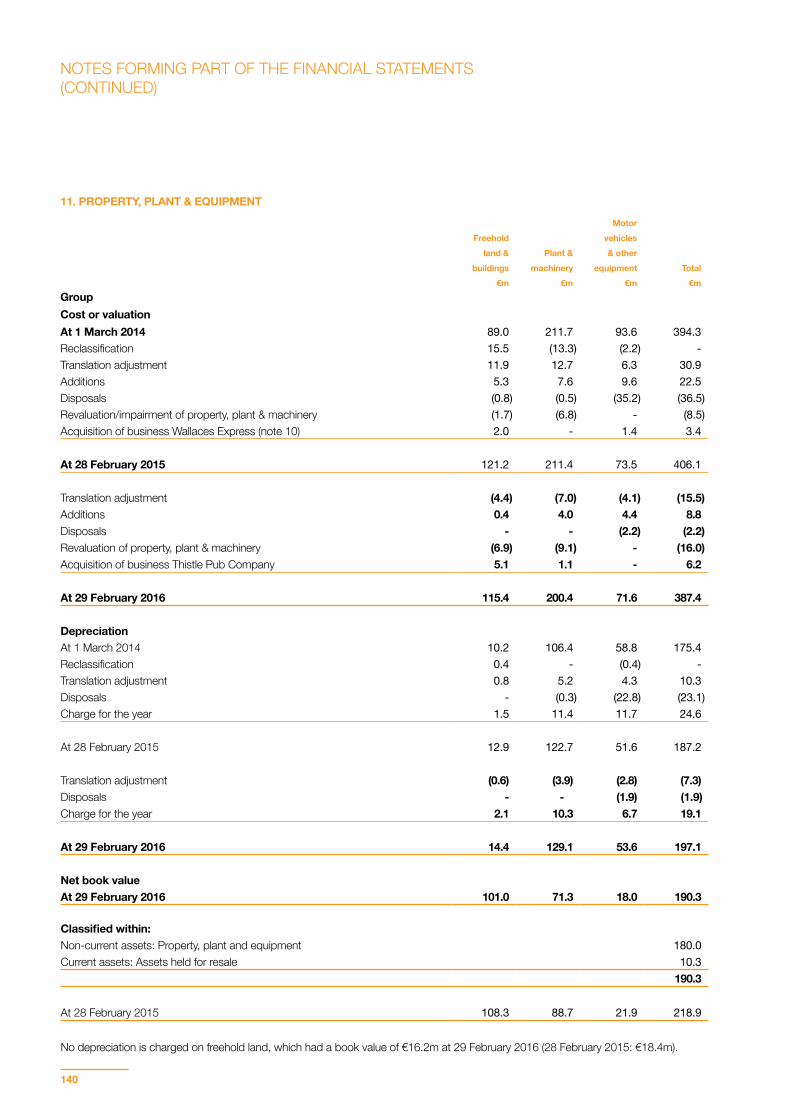
140
11. PROPERTY, PLANT & EQUIPMENT
MotorFreehold vehicles
land & Plant & & otherbuildings machinery equipment Total
€m €m €m €mGroupCost or valuationAt 1 March 2014 89.0 211.7 93.6 394.3Reclassification 15.5 (13.3) (2.2) -Translation adjustment 11.9 12.7 6.3 30.9Additions 5.3 7.6 9.6 22.5Disposals (0.8) (0.5) (35.2) (36.5)Revaluation/impairment of property, plant & machinery (1.7) (6.8) - (8.5)Acquisition of business Wallaces Express (note 10) 2.0 - 1.4 3.4
At 28 February 2015 121.2 211.4 73.5 406.1
Translation adjustment (4.4) (7.0) (4.1) (15.5)Additions 0.4 4.0 4.4 8.8Disposals - - (2.2) (2.2)Revaluation of property, plant & machinery (6.9) (9.1) - (16.0)Acquisition of business Thistle Pub Company 5.1 1.1 - 6.2
At 29 February 2016 115.4 200.4 71.6 387.4
DepreciationAt 1 March 2014 10.2 106.4 58.8 175.4Reclassification 0.4 - (0.4) -Translation adjustment 0.8 5.2 4.3 10.3Disposals - (0.3) (22.8) (23.1)Charge for the year 1.5 11.4 11.7 24.6
At 28 February 2015 12.9 122.7 51.6 187.2
Translation adjustment (0.6) (3.9) (2.8) (7.3)Disposals - - (1.9) (1.9)Charge for the year 2.1 10.3 6.7 19.1
At 29 February 2016 14.4 129.1 53.6 197.1
Net book valueAt 29 February 2016 101.0 71.3 18.0 190.3
Classified within:Non-current assets: Property, plant and equipment 180.0Current assets: Assets held for resale 10.3
190.3
At 28 February 2015 108.3 88.7 21.9 218.9 No depreciation is charged on freehold land, which had a book value of €16.2m at 29 February 2016 (28 February 2015: €18.4m).
NOTES FORMING PART OF THE FINANCIAL STATEMENTS(CONTINUED)
C&C GROUP PLC ANNUAL REPORT 2016 FINANCIAL STATEMENTS
141
Valuation of freehold land, buildings and plant & machinery - 29 February 2016 In the current financial year, the Group engaged the following external valuers to value the land & buildings and plant & machinery at the Group’s facilities in Shepton Mallet, UK and Borrisoleigh, Ireland; • Timothy Smith, BSc MRICS, RICS Registered Valuer and Daniel Tompkinson BSc MRICS RICS Registered Valuer - Gerald Eve LLP to
value the land and buildings at the Shepton Mallet site; • Derek Elston FRCIS RICS Registered Valuer - Elston Sutton Industrial Appraisal Limited to value the plant and equipment at the
Shepton Mallet site;• Ronan Diamond RICS Registered Valuer (VRS) BSc (Hons) Dip MSCSI MRICS and Brian Gilson RICS Registered Valuer (VRS) Dip
Prop Inv MSCSI MRICS FCI Arb - Lisney to value the freehold property at the Borrisoleigh site; and• Don Meghen - Lisney to value the plant & machinery at Borrisoleigh.
The valuations were in accordance with the requirements of the RICS Valuation - Professional Standards, January 2014 edition and the International Valuation Standards.
The Fair Value of operational land & buildings and plant & machinery in Shepton Mallet was based on the Depreciated Replacement Cost approach in light of the lack of comparative market transactions and on the market approach for the non-operational land & buildings and plant & machinery. The valuation of the land & buildings and plant & machinery in Borrisoleigh was on the basis of market value. Market value is defined as ‘the price that would be received to sell an asset or paid to transfer a liability in an orderly transaction between market participants at the measurement date’. The market approach was considered to be the most appropriate valuation approach for the non-operational assets in Shepton Mallet, and the assets held in Borrisoleigh, as the Group has announced consolidation of its production sites in Borrisoleigh and Shepton Mallet into the Group’s manufacturing site in Clonmel.
In view of the specialised nature of Shepton Mallet operational land & buildings and plant & machinery, a Depreciated Replacement Cost approach was used to assess as Fair Value. IAS 16 Property, Plant and Equipment prescribes that where there is no market based evidence of Fair Value because of the specialist nature of the item of property, plant and equipment and the item is rarely sold, except as part of a continuing business, an entity may need to estimate Fair Value using an income or a Depreciated Replacement Cost approach to valuation.
The result of these external valuations, as at 29 February 2016, was a decrease in the value of land and buildings of €6.9m which was expensed to the Income Statement as there was no previously recognised gain in the revaluation reserve against which to offset. The value of plant and machinery decreased by €9.1m as a result of this valuation which was expensed to the Income Statement as there was no previously recognised gain in the revaluation reserve against which to offset.
On the acquisition of Thistle Pub Company the valuation of the land and buildings was on the basis of market value. In April 2016, land and buildings were disposed of for a value consistent with their carrying value as at 29 February 2016. For all other freehold land & buildings and plant & machinery assets held by the Group an internal valuation was completed by the Directors as at 29 February 2016. As part of their valuation assessment, the Directors considered the following factors and their impact in determining year end valuation of the Group’s property, plant & equipment:-• market fluctuations of land and industrial property prices since the date of the last external valuation. The last external valuation date
for each Group site is as follows: year ended 28 February 2015: Clonmel - freehold property, Clonmel - plant and machinery, Wellpark - freehold property, Wellpark - plant and machinery, Vermont - plant and machinery, Wallaces Express - freehold property; year ended 28 February 2014: Portugal - freehold property, Portugal - plant and machinery, Gleeson - freehold property, Gleeson - plant and machinery,
• fluctuations driven by market commodity prices, of the gross replacement cost of property, plant & machinery,• projected asset utilisation rates based on FY2017 budgeted/forecasted production volumes, • changes to functional and physical obsolescence of plant & machinery beyond that which would normally be expected, and continued
appropriateness of the assumed useful lives of property, plant & machinery.
Having considered the above variables, the Directors estimate that the changes arising from market fluctuations and anticipated utilisation rates would not result in a material change to the valuation of the carrying value of these items of property, plant & equipment and hence no adjustment to their carrying value was deemed necessary.
142
Valuation of freehold land, buildings and plant & machinery - 28 February 2015 In the prior financial year, the Group engaged the following external valuers to value the land & buildings and plant & machinery at the Group’s facilities in Clonmel, Wellpark, Shepton Mallet, Wallaces Express and Vermont; • Shane O’Beirne RICS Registered Valuer (VRS) BSc (Surv) Dip AVEA MSCSI MRICS and Brian Gilson RICS Registered Valuer (VRS)
BSc MSCSI MRICS FCI Arb - Lisney to value the freehold property at the Clonmel site;• David Fawcett, FRICS RICS Registered Valuer - Sanderson Weatherall to value the plant and machinery at the Clonmel site;• Timothy Smith BSc MRICS RICS Registered Valuer and Joseph Funtek BSc MRICS RICS Registered Valuer – Gerald Eve LLP to value
the freehold property at the Shepton Mallet and Wellpark Brewery sites;• Derek Elston FRCIS RICS Registered Valuer - Elston Sutton Industrial Appraisal Limited to value the plant and equipment at the
Shepton Mallet and Wellpark Brewery sites;• John Coto, Certified Machine & Equipment appraiser, Alliance Machinery & Equipment Appraisals to value the plant & machinery at the
Group’s Vermont site; and• Martin Clarkson, BSc MRICS, RICS Registered Valuer - Gerald Eve LLP to value the land and buildings acquired on acquisition of
Wallaces Express.
The valuations were in accordance with the requirements of the RICS Valuation - Professional Standards, January 2014 edition and the International Valuation Standards.
The valuation of the land & buildings in Clonmel was on the basis of market value, defined as ‘the price that would be received to sell an asset or paid to transfer a liability in an orderly transaction between market participants at the measurement date’ and was subject to the assumption that the property be sold as part of a continuing business. The valuers opinion of Fair Value of the Clonmel properties was primarily derived using comparable recent market transactions on an arm’s-length basis. The Fair Value of land & buildings in Shepton Mallet and Wellpark Brewery were derived primarily based on the Depreciated Replacement Cost approach to valuation in light of the lack of comparative recent market transactions.
In view of the specialised nature of the Group’s plant & machinery and the lack of comparable market evidence of similar plant being sold as a ‘going concern’, a Depreciated Replacement Cost approach was used to assess a Fair Value of the Group’s plant & machinery. IAS 16 Property, Plant and Equipment prescribes that where there is no market based evidence of Fair Value because of the specialist nature of the item of property, plant and equipment and the item is rarely sold, except as part of a continuing business, an entity may need to estimate Fair Value using an income or a Depreciated Replacement Cost approach to valuation.
The result of these external valuations, as at 28 February 2015, was a net increase in the value of land of €2.5m of which €2.7m was credited to the revaluation reserve with respect to an increase in the valuation of that element of the Group’s land where there was no revaluation decrease previously recognised on the same asset and €0.2m was expensed to the Income Statement as there was no previously recognised gain in the revaluation reserve against which to offset. The value of buildings decreased by a net €4.2m as a result of this valuation with €2.6m being credited to the revaluation reserve with respect to an increase in the value of an element of the Group’s buildings and for which there was no revaluation decrease previously recognised on the same assets. This was offset by a reduction of €6.8m in the value of another element of the Group’s buildings which was expensed to the Income Statement as there was no previously recognised gain in the revaluation reserve against which to offset. The value of plant & machinery was written down by a cumulative €3.5m which was expensed to the Income Statement as there was no previously recognised gain in the revaluation reserve against which to offset.
Also during the year ended 28 February 2015, in light of a material reduction in the utilisation levels of a bottling line located at its cider manufacturing plant at Shepton Mallet used to bottle both own branded and third party branded product, a decision was taken to impair the bottling line by €3.3m.
On the acquisition of Wallaces Express the valuation of the land and buildings was on the basis of market value, defined as ‘the price that would be received to sell an asset or paid to transfer a liability in an orderly transaction between market participants at the measurement date’ and was subject to the assumption that the property be sold as part of a continuing business. The valuers opinion of Fair Value of the Wallaces Express properties was primarily derived using comparable recent market transactions on an arm’s-length basis. This revaluation gave rise to a reduction in the carrying value of the land and buildings of €0.7m on acquisition in FY2015 as outlined in note 10.
NOTES FORMING PART OF THE FINANCIAL STATEMENTS(CONTINUED)
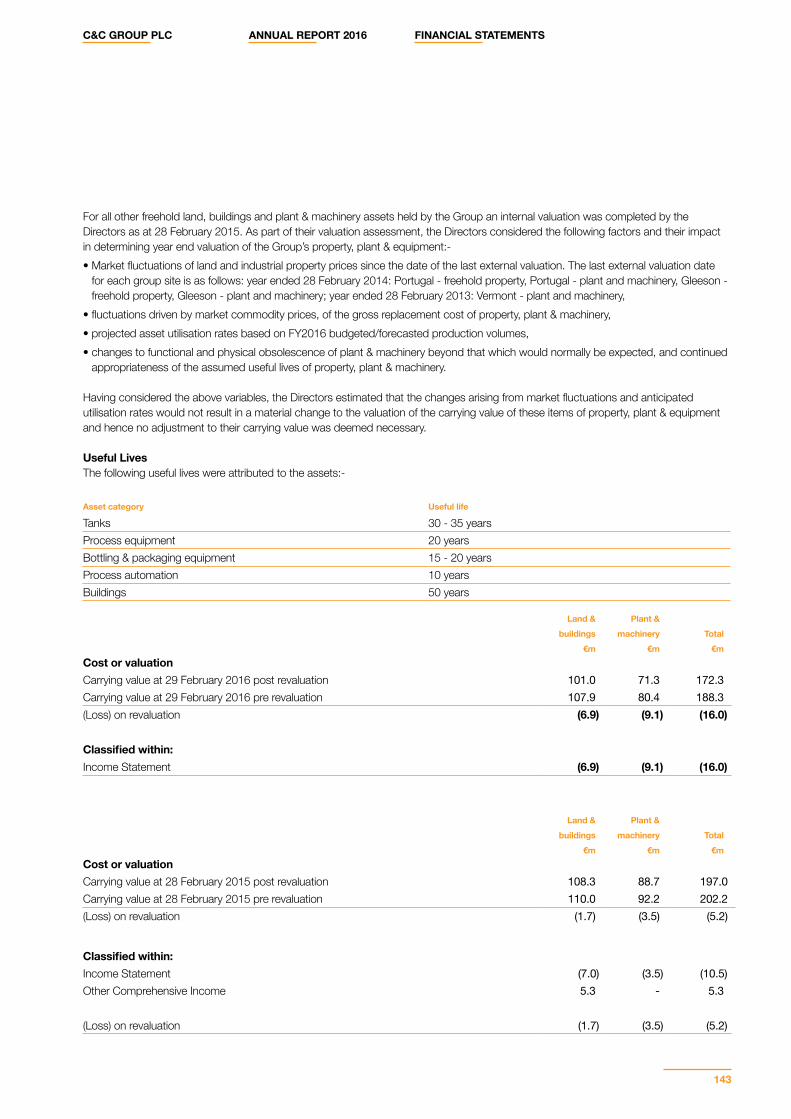
C&C GROUP PLC ANNUAL REPORT 2016 FINANCIAL STATEMENTS
143
For all other freehold land, buildings and plant & machinery assets held by the Group an internal valuation was completed by the Directors as at 28 February 2015. As part of their valuation assessment, the Directors considered the following factors and their impact in determining year end valuation of the Group’s property, plant & equipment:-• Market fluctuations of land and industrial property prices since the date of the last external valuation. The last external valuation date
for each group site is as follows: year ended 28 February 2014: Portugal - freehold property, Portugal - plant and machinery, Gleeson - freehold property, Gleeson - plant and machinery; year ended 28 February 2013: Vermont - plant and machinery,
• fluctuations driven by market commodity prices, of the gross replacement cost of property, plant & machinery,• projected asset utilisation rates based on FY2016 budgeted/forecasted production volumes, • changes to functional and physical obsolescence of plant & machinery beyond that which would normally be expected, and continued
appropriateness of the assumed useful lives of property, plant & machinery.
Having considered the above variables, the Directors estimated that the changes arising from market fluctuations and anticipated utilisation rates would not result in a material change to the valuation of the carrying value of these items of property, plant & equipment and hence no adjustment to their carrying value was deemed necessary.
Useful LivesThe following useful lives were attributed to the assets:-
Asset category Useful life
Tanks 30 - 35 yearsProcess equipment 20 yearsBottling & packaging equipment 15 - 20 yearsProcess automation 10 yearsBuildings 50 years
Land & Plant &buildings machinery Total
€m €m €mCost or valuationCarrying value at 29 February 2016 post revaluation 101.0 71.3 172.3Carrying value at 29 February 2016 pre revaluation 107.9 80.4 188.3(Loss) on revaluation (6.9) (9.1) (16.0)
Classified within:Income Statement (6.9) (9.1) (16.0)
Land & Plant &buildings machinery Total
€m €m €mCost or valuationCarrying value at 28 February 2015 post revaluation 108.3 88.7 197.0Carrying value at 28 February 2015 pre revaluation 110.0 92.2 202.2(Loss) on revaluation (1.7) (3.5) (5.2)
Classified within:Income Statement (7.0) (3.5) (10.5)Other Comprehensive Income 5.3 - 5.3
(Loss) on revaluation (1.7) (3.5) (5.2)
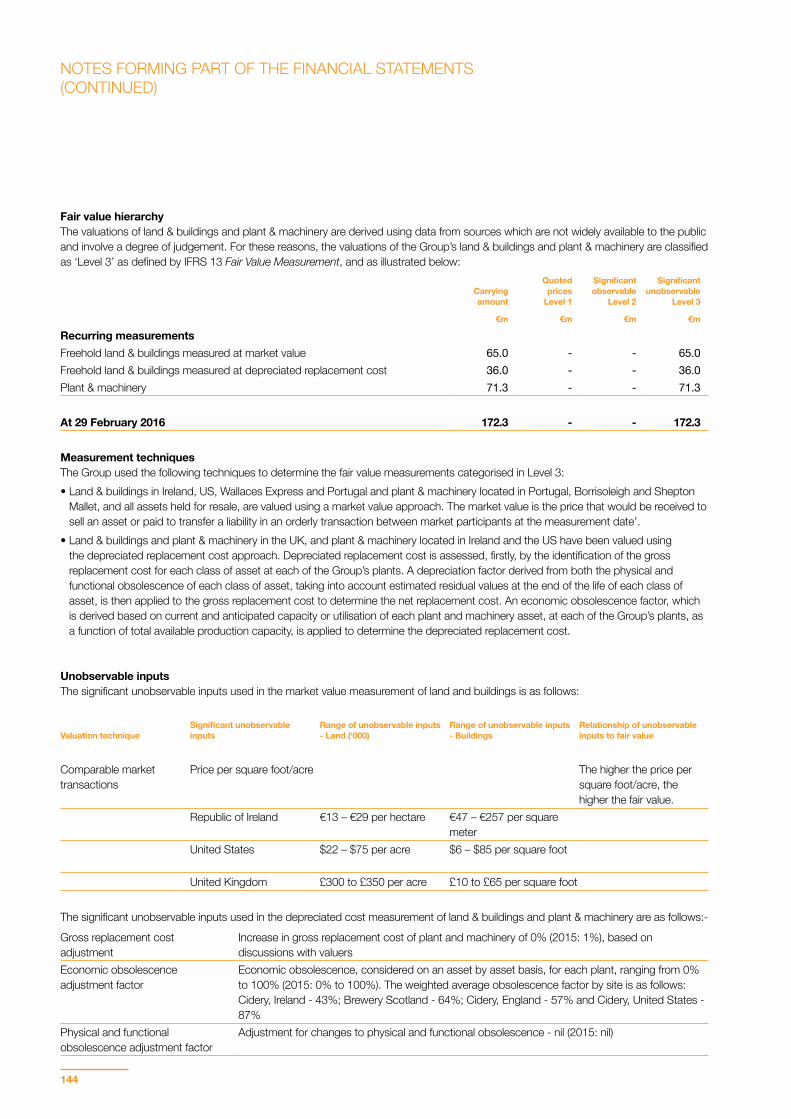
144
Fair value hierarchyThe valuations of land & buildings and plant & machinery are derived using data from sources which are not widely available to the public and involve a degree of judgement. For these reasons, the valuations of the Group’s land & buildings and plant & machinery are classified as ‘Level 3’ as defined by IFRS 13 Fair Value Measurement, and as illustrated below:
Carrying amount
Quoted prices
Level 1
Significant observable
Level 2
Significant unobservable
Level 3
€m €m €m €m
Recurring measurementsFreehold land & buildings measured at market value 65.0 - - 65.0Freehold land & buildings measured at depreciated replacement cost 36.0 - - 36.0Plant & machinery 71.3 - - 71.3
At 29 February 2016 172.3 - - 172.3
Measurement techniquesThe Group used the following techniques to determine the fair value measurements categorised in Level 3:• Land & buildings in Ireland, US, Wallaces Express and Portugal and plant & machinery located in Portugal, Borrisoleigh and Shepton
Mallet, and all assets held for resale, are valued using a market value approach. The market value is the price that would be received to sell an asset or paid to transfer a liability in an orderly transaction between market participants at the measurement date’.
• Land & buildings and plant & machinery in the UK, and plant & machinery located in Ireland and the US have been valued using the depreciated replacement cost approach. Depreciated replacement cost is assessed, firstly, by the identification of the gross replacement cost for each class of asset at each of the Group’s plants. A depreciation factor derived from both the physical and functional obsolescence of each class of asset, taking into account estimated residual values at the end of the life of each class of asset, is then applied to the gross replacement cost to determine the net replacement cost. An economic obsolescence factor, which is derived based on current and anticipated capacity or utilisation of each plant and machinery asset, at each of the Group’s plants, as a function of total available production capacity, is applied to determine the depreciated replacement cost.
Unobservable inputsThe significant unobservable inputs used in the market value measurement of land and buildings is as follows:
Valuation techniqueSignificant unobservable inputs
Range of unobservable inputs - Land (‘000)
Range of unobservable inputs - Buildings
Relationship of unobservable inputs to fair value
Comparable market transactions
Price per square foot/acre The higher the price per square foot/acre, the higher the fair value.
Republic of Ireland €13 – €29 per hectare €47 – €257 per square meter
United States $22 – $75 per acre $6 – $85 per square foot
United Kingdom £300 to £350 per acre £10 to £65 per square foot
The significant unobservable inputs used in the depreciated cost measurement of land & buildings and plant & machinery are as follows:-
Gross replacement cost adjustment
Increase in gross replacement cost of plant and machinery of 0% (2015: 1%), based on discussions with valuers
Economic obsolescence adjustment factor
Economic obsolescence, considered on an asset by asset basis, for each plant, ranging from 0% to 100% (2015: 0% to 100%). The weighted average obsolescence factor by site is as follows: Cidery, Ireland - 43%; Brewery Scotland - 64%; Cidery, England - 57% and Cidery, United States - 87%
Physical and functional obsolescence adjustment factor
Adjustment for changes to physical and functional obsolescence - nil (2015: nil)
NOTES FORMING PART OF THE FINANCIAL STATEMENTS(CONTINUED)

C&C GROUP PLC ANNUAL REPORT 2016 FINANCIAL STATEMENTS
145
The carrying value of plant & machinery in the Group which is valued on the depreciated replacement cost basis, would increase/(decrease) by €3.5m if the economic obsolescence adjustment factor was increased/(decreased) by 5%. If the gross replacement cost was increased/(decreased) by 2% the carrying value of the Group’s plant & machinery would increase/(decrease) by €1.4m.
The carrying value of freehold land & buildings which is valued on the depreciated replacement cost basis, would increase/(decrease) by €1.6m if the economic obsolescence adjustment factor was increased/(decreased) by 5%. The estimated carrying value of the same land & buildings would increase/(decrease) by €0.7m if the gross replacement cost was increased/(decreased) by 2%.
The carrying value of freehold land & buildings located in Ireland, the US, Wallaces Express and Portugal would increase/(decrease) by €3.2m if the comparable open market value increased/(decreased) by 5%.
Assets held for resaleAs at 29 February 2016, the Group holds property, plant and equipment of €10.3m (FY2015: €nil) as assets held for resale which is comprised of land & buildings of €7.3m and plant & machinery of €3.0m.
CompanyThe Company has no property, plant & equipment.
12. GOODWILL & INTANGIBLE ASSETS
Other
intangible
Goodwill Brands assets Total
€m €m €m €m
CostAt 28 February 2014 457.3 261.6 3.5 722.4Translation adjustment 19.2 49.3 0.3 68.8Acquisition of Wallaces Express (note 10) 8.5 - 1.2 9.7Acquisition of Biofun 2.1 - - 2.1At 28 February 2015 487.1 310.9 5.0 803.0
Translation adjustment (3.4) (4.2) (0.2) (7.8)
At 29 February 2016 483.7 306.7 4.8 795.2
Amortisation and impairmentAt 28 February 2014 - - 0.5 0.5Amortisation charge for the year - - 0.3 0.3Impairment charge for the year 76.2 73.8 - 150.0At 28 February 2015 76.2 73.8 0.8 150.8
Amortisation charge for the year - - 0.3 0.3
At 29 February 2016 76.2 73.8 1.1 151.1
Net book value At 29 February 2016 407.5 232.9 3.7 644.1
At 28 February 2015 410.9 237.1 4.2 652.2
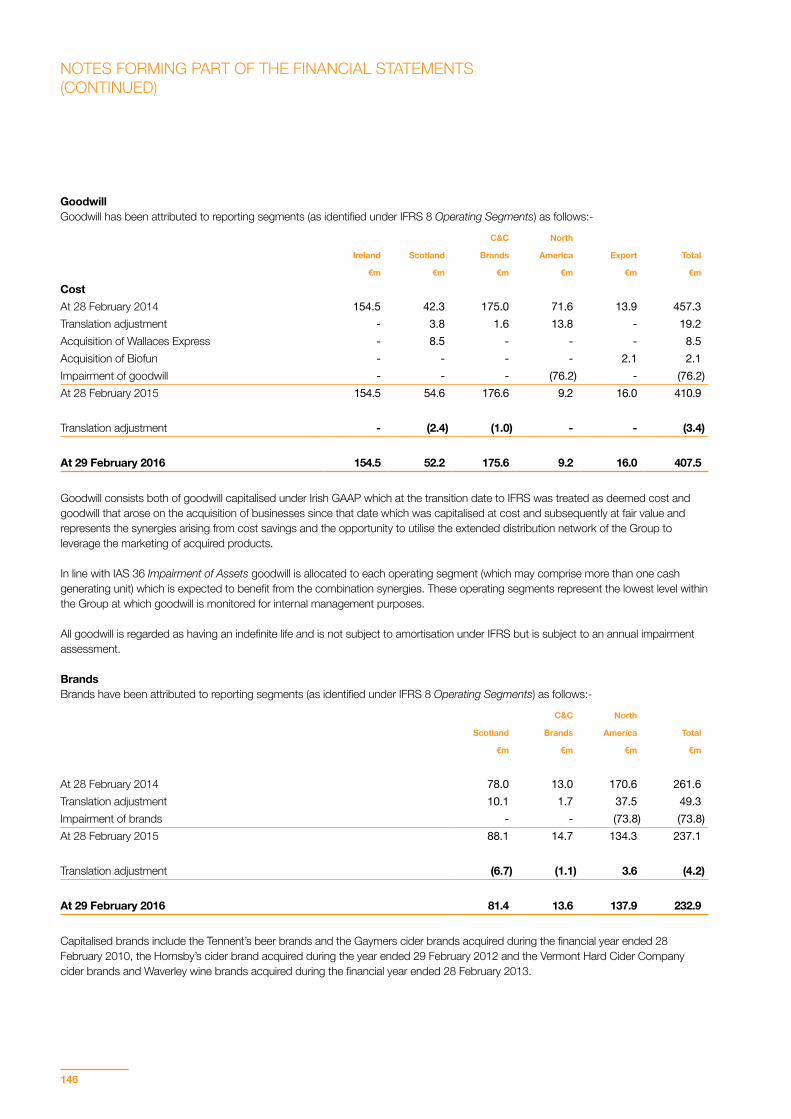
146
GoodwillGoodwill has been attributed to reporting segments (as identified under IFRS 8 Operating Segments) as follows:-
C&C North
Ireland Scotland Brands America Export Total
€m €m €m €m €m €m
CostAt 28 February 2014 154.5 42.3 175.0 71.6 13.9 457.3Translation adjustment - 3.8 1.6 13.8 - 19.2Acquisition of Wallaces Express - 8.5 - - - 8.5Acquisition of Biofun - - - - 2.1 2.1Impairment of goodwill - - - (76.2) - (76.2)At 28 February 2015 154.5 54.6 176.6 9.2 16.0 410.9
Translation adjustment - (2.4) (1.0) - - (3.4)
At 29 February 2016 154.5 52.2 175.6 9.2 16.0 407.5
Goodwill consists both of goodwill capitalised under Irish GAAP which at the transition date to IFRS was treated as deemed cost and goodwill that arose on the acquisition of businesses since that date which was capitalised at cost and subsequently at fair value and represents the synergies arising from cost savings and the opportunity to utilise the extended distribution network of the Group to leverage the marketing of acquired products. In line with IAS 36 Impairment of Assets goodwill is allocated to each operating segment (which may comprise more than one cash generating unit) which is expected to benefit from the combination synergies. These operating segments represent the lowest level within the Group at which goodwill is monitored for internal management purposes. All goodwill is regarded as having an indefinite life and is not subject to amortisation under IFRS but is subject to an annual impairment assessment.
BrandsBrands have been attributed to reporting segments (as identified under IFRS 8 Operating Segments) as follows:-
C&C North
Scotland Brands America Total
€m €m €m €m
At 28 February 2014 78.0 13.0 170.6 261.6Translation adjustment 10.1 1.7 37.5 49.3Impairment of brands - - (73.8) (73.8)At 28 February 2015 88.1 14.7 134.3 237.1
Translation adjustment (6.7) (1.1) 3.6 (4.2)
At 29 February 2016 81.4 13.6 137.9 232.9
Capitalised brands include the Tennent’s beer brands and the Gaymers cider brands acquired during the financial year ended 28 February 2010, the Hornsby’s cider brand acquired during the year ended 29 February 2012 and the Vermont Hard Cider Company cider brands and Waverley wine brands acquired during the financial year ended 28 February 2013.
NOTES FORMING PART OF THE FINANCIAL STATEMENTS(CONTINUED)
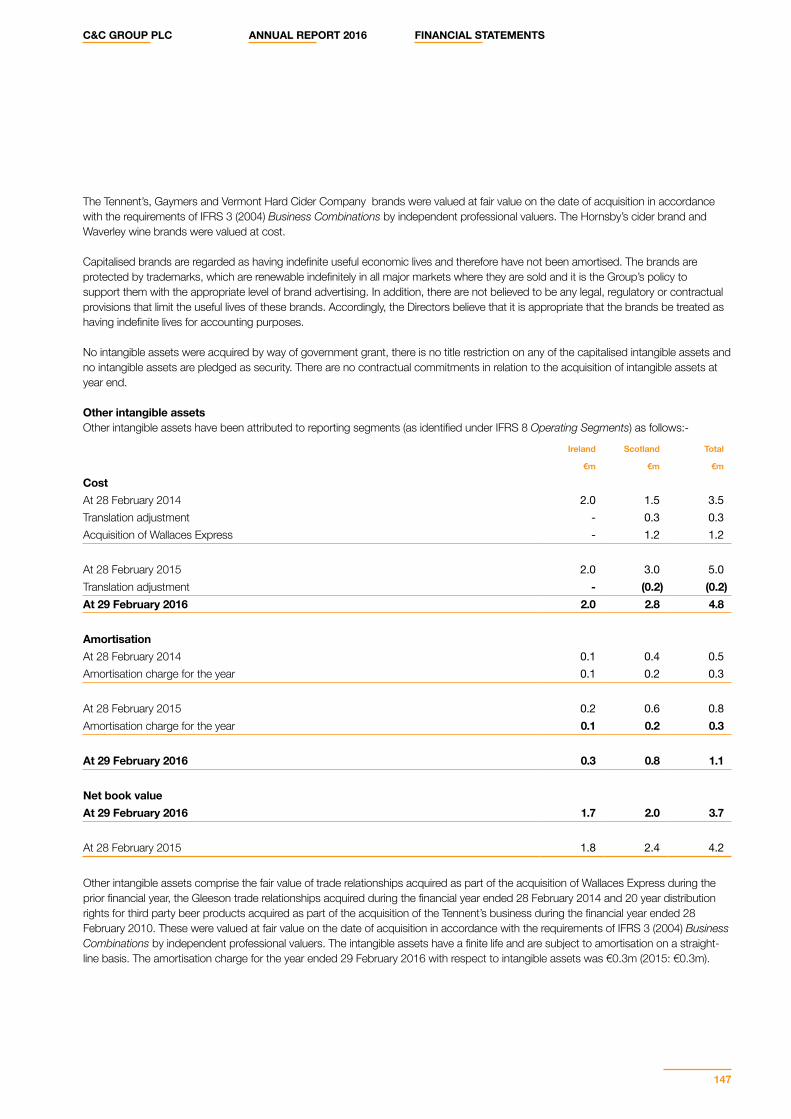
C&C GROUP PLC ANNUAL REPORT 2016 FINANCIAL STATEMENTS
147
The Tennent’s, Gaymers and Vermont Hard Cider Company brands were valued at fair value on the date of acquisition in accordance with the requirements of IFRS 3 (2004) Business Combinations by independent professional valuers. The Hornsby’s cider brand and Waverley wine brands were valued at cost. Capitalised brands are regarded as having indefinite useful economic lives and therefore have not been amortised. The brands are protected by trademarks, which are renewable indefinitely in all major markets where they are sold and it is the Group’s policy to support them with the appropriate level of brand advertising. In addition, there are not believed to be any legal, regulatory or contractual provisions that limit the useful lives of these brands. Accordingly, the Directors believe that it is appropriate that the brands be treated as having indefinite lives for accounting purposes.
No intangible assets were acquired by way of government grant, there is no title restriction on any of the capitalised intangible assets and no intangible assets are pledged as security. There are no contractual commitments in relation to the acquisition of intangible assets at year end.
Other intangible assetsOther intangible assets have been attributed to reporting segments (as identified under IFRS 8 Operating Segments) as follows:-
Ireland Scotland Total
€m €m €m
CostAt 28 February 2014 2.0 1.5 3.5Translation adjustment - 0.3 0.3Acquisition of Wallaces Express - 1.2 1.2
At 28 February 2015 2.0 3.0 5.0Translation adjustment - (0.2) (0.2)At 29 February 2016 2.0 2.8 4.8
AmortisationAt 28 February 2014 0.1 0.4 0.5Amortisation charge for the year 0.1 0.2 0.3
At 28 February 2015 0.2 0.6 0.8Amortisation charge for the year 0.1 0.2 0.3
At 29 February 2016 0.3 0.8 1.1
Net book value At 29 February 2016 1.7 2.0 3.7
At 28 February 2015 1.8 2.4 4.2
Other intangible assets comprise the fair value of trade relationships acquired as part of the acquisition of Wallaces Express during the prior financial year, the Gleeson trade relationships acquired during the financial year ended 28 February 2014 and 20 year distribution rights for third party beer products acquired as part of the acquisition of the Tennent’s business during the financial year ended 28 February 2010. These were valued at fair value on the date of acquisition in accordance with the requirements of IFRS 3 (2004) Business Combinations by independent professional valuers. The intangible assets have a finite life and are subject to amortisation on a straight-line basis. The amortisation charge for the year ended 29 February 2016 with respect to intangible assets was €0.3m (2015: €0.3m).
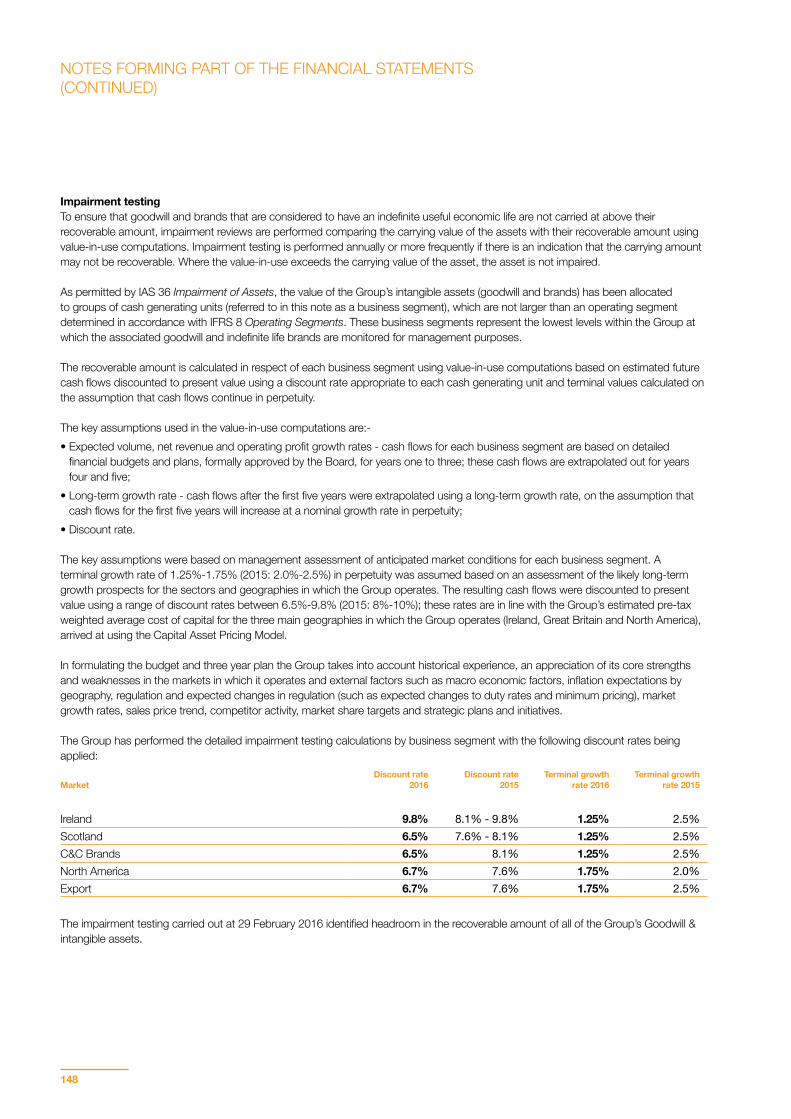
148
Impairment testingTo ensure that goodwill and brands that are considered to have an indefinite useful economic life are not carried at above their recoverable amount, impairment reviews are performed comparing the carrying value of the assets with their recoverable amount using value-in-use computations. Impairment testing is performed annually or more frequently if there is an indication that the carrying amount may not be recoverable. Where the value-in-use exceeds the carrying value of the asset, the asset is not impaired.
As permitted by IAS 36 Impairment of Assets, the value of the Group’s intangible assets (goodwill and brands) has been allocated to groups of cash generating units (referred to in this note as a business segment), which are not larger than an operating segment determined in accordance with IFRS 8 Operating Segments. These business segments represent the lowest levels within the Group at which the associated goodwill and indefinite life brands are monitored for management purposes. The recoverable amount is calculated in respect of each business segment using value-in-use computations based on estimated future cash flows discounted to present value using a discount rate appropriate to each cash generating unit and terminal values calculated on the assumption that cash flows continue in perpetuity.
The key assumptions used in the value-in-use computations are:-• Expected volume, net revenue and operating profit growth rates - cash flows for each business segment are based on detailed
financial budgets and plans, formally approved by the Board, for years one to three; these cash flows are extrapolated out for years four and five;
• Long-term growth rate - cash flows after the first five years were extrapolated using a long-term growth rate, on the assumption that cash flows for the first five years will increase at a nominal growth rate in perpetuity;
• Discount rate. The key assumptions were based on management assessment of anticipated market conditions for each business segment. A terminal growth rate of 1.25%-1.75% (2015: 2.0%-2.5%) in perpetuity was assumed based on an assessment of the likely long-term growth prospects for the sectors and geographies in which the Group operates. The resulting cash flows were discounted to present value using a range of discount rates between 6.5%-9.8% (2015: 8%-10%); these rates are in line with the Group’s estimated pre-tax weighted average cost of capital for the three main geographies in which the Group operates (Ireland, Great Britain and North America), arrived at using the Capital Asset Pricing Model.
In formulating the budget and three year plan the Group takes into account historical experience, an appreciation of its core strengths and weaknesses in the markets in which it operates and external factors such as macro economic factors, inflation expectations by geography, regulation and expected changes in regulation (such as expected changes to duty rates and minimum pricing), market growth rates, sales price trend, competitor activity, market share targets and strategic plans and initiatives.
The Group has performed the detailed impairment testing calculations by business segment with the following discount rates being applied:
MarketDiscount rate
2016Discount rate
2015Terminal growth
rate 2016Terminal growth
rate 2015
Ireland 9.8% 8.1% - 9.8% 1.25% 2.5%Scotland 6.5% 7.6% - 8.1% 1.25% 2.5%C&C Brands 6.5% 8.1% 1.25% 2.5%North America 6.7% 7.6% 1.75% 2.0%Export 6.7% 7.6% 1.75% 2.5%
The impairment testing carried out at 29 February 2016 identified headroom in the recoverable amount of all of the Group’s Goodwill & intangible assets.
NOTES FORMING PART OF THE FINANCIAL STATEMENTS(CONTINUED)
C&C GROUP PLC ANNUAL REPORT 2016 FINANCIAL STATEMENTS
149
In the prior financial year, the impairment testing carried out by the Group led to an impairment charge of €150.0m with respect to the Group’s North American business segment. This impairment charge in the prior financial year resulted in the write-down of the carrying value of the brands of €73.8m and goodwill of €76.2m. Competitive intensity increased markedly in the US market during the prior financial year, with new entrants from global and domestic brewers and a growing craft cider movement. As a consequence the Group’s share of the category came under pressure and this led to the rebasing of the Group’s profit expectations, and terminal growth rate for the US business which resulted in the impairment charge in the prior financial year. All other segments had sufficient headroom in the prior financial year.
In the current financial year the Group announced a long-term partnership agreement in the US with Pabst Brewing Company (“Pabst”) for the sale and distribution of the Group’s cider brands within the US. The agreement will take effect from 1 March 2016. The partnership will substantially strengthen the Group’s route to market in the US by leveraging Pabst’s extensive distribution and sales platform. Under the terms of the partnership, Pabst has an option to acquire C&C Group’s US Cider Brands and related assets, subject to any shareholder and regulatory approval. The option is exercisable from 2017. Consideration, which is not to be below US$150.0m, will be determined at the time of the exercise of the option.
Sensitivity analysis The impairment testing carried out at 29 February 2016 identified headroom in the recoverable amount of the brands and goodwill compared to their carrying values in all business segments. In the prior financial year the impairment testing carried out as at 28 February 2015 identified headroom in the recoverable amount of the brands and goodwill compared to their carrying values in all business segments excluding North America. The testing identified an impairment charge in North America of €150.0m.
The key sensitivities for the impairment testing are net revenue and operating profit assumptions, discount rates applied to the resulting cash flows and the expected long-term growth rates.
The value-in-use calculations indicate significant headroom in respect of the Ireland and Scotland operating segments. In the case of C&C Brands, the level of headroom, while significantly less than the headroom in the Ireland and Scotland operating segments, is in excess of €102.7m. The level of headroom in the North America segment, primarily arising as a consequence of revised expectations of the performance of the segment going forward in light of the Pabst arrangement as outlined above, is in excess of €48.0m.
For C&C Brands, an increase and a decrease in the operating profit assumption applied by 2.5% would impact the headroom by €6.0m. For North America, an increase and a decrease in the operating profit assumption by 2.5% would impact the headroom by €5.5m.
For C&C Brands, an increase in the discount rate assumption by 0.25% would decrease the headroom by €17.0m and a decrease by 0.25% would increase the headroom by €18.7m. For North America, an increase in the discount rate assumption by 0.25% would decrease the headroom by €8.9m and a decrease by 0.25% would increase the headroom by €9.8m.
For C&C Brands, an increase in the terminal growth rate assumption by 0.25% would increase the headroom by €13.9m and a decrease by 0.25% would decrease the headroom by €12.6m. For North America, an increase in the terminal growth rate by 0.25% would increase the headroom by €10.1m and a decrease by 0.25% would decrease the headroom by €9.2m.
Therefore the Group concludes that no reasonable movement in any of the underlying assumptions would result in an impairment in any of the Group’s business segments.
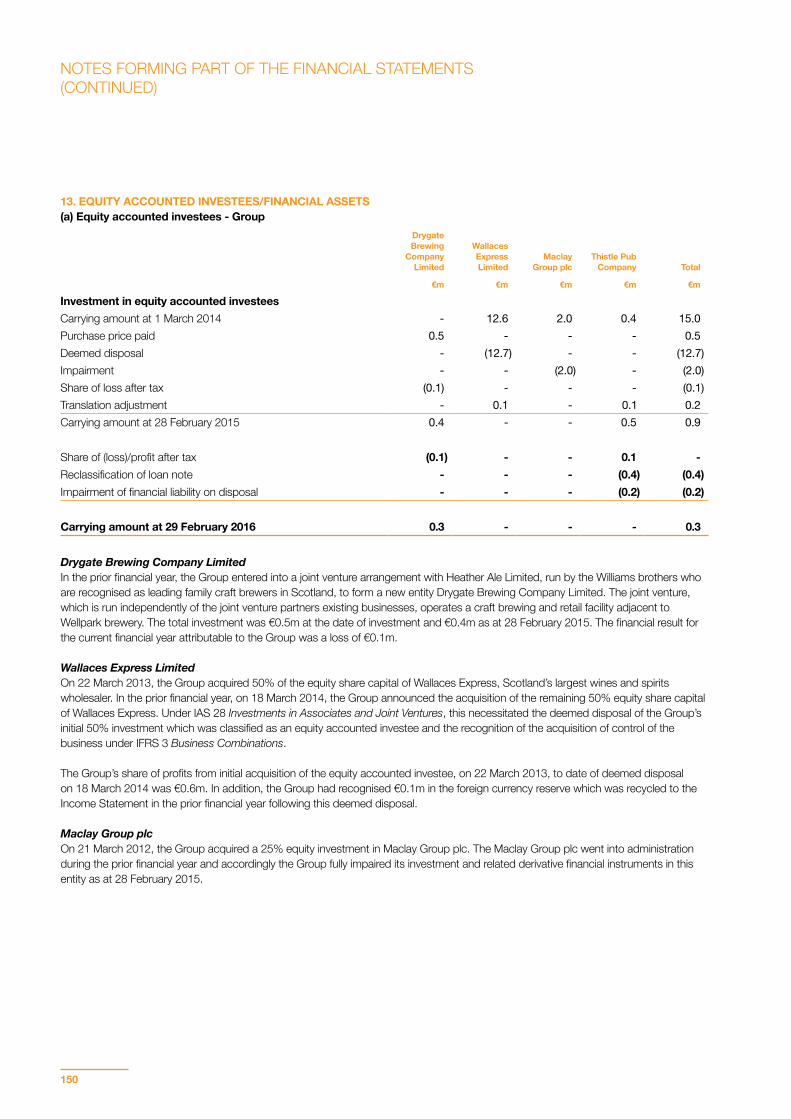
150
13. EQUITY ACCOUNTED INVESTEES/FINANCIAL ASSETS(a) Equity accounted investees - Group
Drygate Brewing
Company Limited
Wallaces Express Limited
Maclay Group plc
Thistle Pub Company Total
€m €m €m €m €m
Investment in equity accounted investeesCarrying amount at 1 March 2014 - 12.6 2.0 0.4 15.0Purchase price paid 0.5 - - - 0.5Deemed disposal - (12.7) - - (12.7)Impairment - - (2.0) - (2.0)Share of loss after tax (0.1) - - - (0.1)Translation adjustment - 0.1 - 0.1 0.2Carrying amount at 28 February 2015 0.4 - - 0.5 0.9
Share of (loss)/profit after tax (0.1) - - 0.1 -Reclassification of loan note - - - (0.4) (0.4)Impairment of financial liability on disposal - - - (0.2) (0.2)
Carrying amount at 29 February 2016 0.3 - - - 0.3
Drygate Brewing Company LimitedIn the prior financial year, the Group entered into a joint venture arrangement with Heather Ale Limited, run by the Williams brothers who are recognised as leading family craft brewers in Scotland, to form a new entity Drygate Brewing Company Limited. The joint venture, which is run independently of the joint venture partners existing businesses, operates a craft brewing and retail facility adjacent to Wellpark brewery. The total investment was €0.5m at the date of investment and €0.4m as at 28 February 2015. The financial result for the current financial year attributable to the Group was a loss of €0.1m.
Wallaces Express LimitedOn 22 March 2013, the Group acquired 50% of the equity share capital of Wallaces Express, Scotland’s largest wines and spirits wholesaler. In the prior financial year, on 18 March 2014, the Group announced the acquisition of the remaining 50% equity share capital of Wallaces Express. Under IAS 28 Investments in Associates and Joint Ventures, this necessitated the deemed disposal of the Group’s initial 50% investment which was classified as an equity accounted investee and the recognition of the acquisition of control of the business under IFRS 3 Business Combinations.
The Group’s share of profits from initial acquisition of the equity accounted investee, on 22 March 2013, to date of deemed disposal on 18 March 2014 was €0.6m. In addition, the Group had recognised €0.1m in the foreign currency reserve which was recycled to the Income Statement in the prior financial year following this deemed disposal.
Maclay Group plcOn 21 March 2012, the Group acquired a 25% equity investment in Maclay Group plc. The Maclay Group plc went into administration during the prior financial year and accordingly the Group fully impaired its investment and related derivative financial instruments in this entity as at 28 February 2015.
NOTES FORMING PART OF THE FINANCIAL STATEMENTS(CONTINUED)
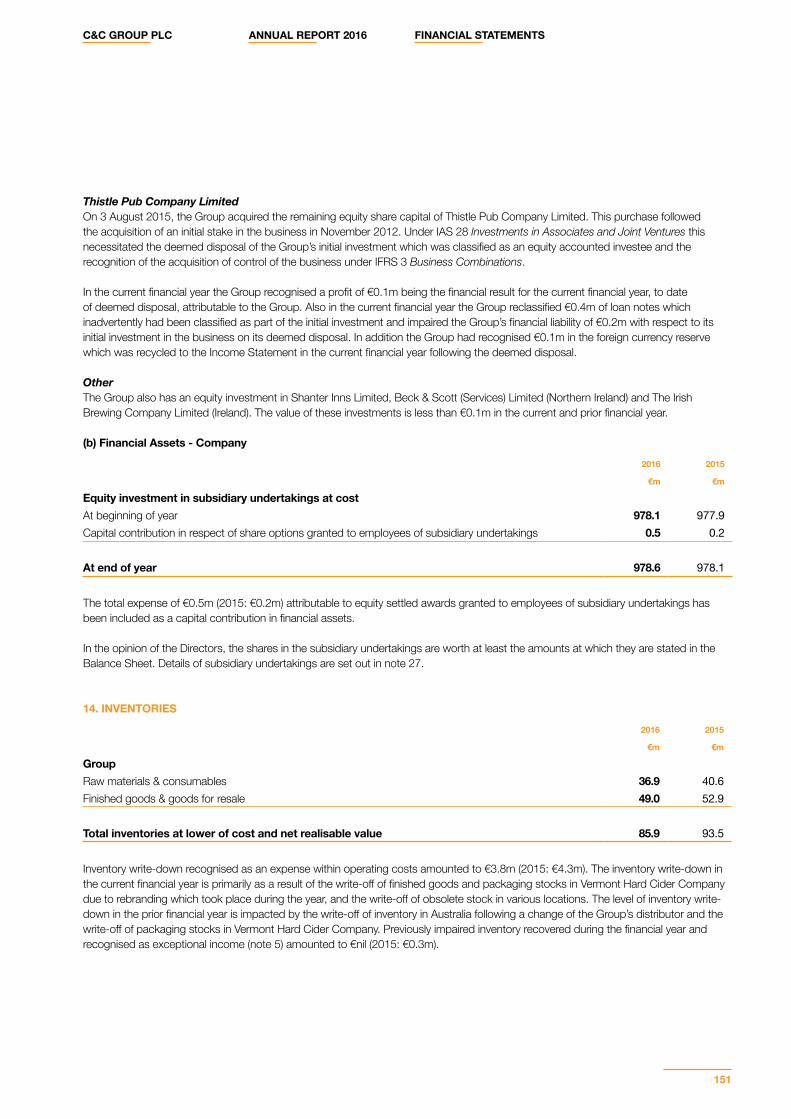
C&C GROUP PLC ANNUAL REPORT 2016 FINANCIAL STATEMENTS
151
Thistle Pub Company LimitedOn 3 August 2015, the Group acquired the remaining equity share capital of Thistle Pub Company Limited. This purchase followed the acquisition of an initial stake in the business in November 2012. Under IAS 28 Investments in Associates and Joint Ventures this necessitated the deemed disposal of the Group’s initial investment which was classified as an equity accounted investee and the recognition of the acquisition of control of the business under IFRS 3 Business Combinations.
In the current financial year the Group recognised a profit of €0.1m being the financial result for the current financial year, to date of deemed disposal, attributable to the Group. Also in the current financial year the Group reclassified €0.4m of loan notes which inadvertently had been classified as part of the initial investment and impaired the Group’s financial liability of €0.2m with respect to its initial investment in the business on its deemed disposal. In addition the Group had recognised €0.1m in the foreign currency reserve which was recycled to the Income Statement in the current financial year following the deemed disposal.
OtherThe Group also has an equity investment in Shanter Inns Limited, Beck & Scott (Services) Limited (Northern Ireland) and The Irish Brewing Company Limited (Ireland). The value of these investments is less than €0.1m in the current and prior financial year.
(b) Financial Assets - Company
2016 2015
€m €m
Equity investment in subsidiary undertakings at costAt beginning of year 978.1 977.9Capital contribution in respect of share options granted to employees of subsidiary undertakings 0.5 0.2
At end of year 978.6 978.1
The total expense of €0.5m (2015: €0.2m) attributable to equity settled awards granted to employees of subsidiary undertakings has been included as a capital contribution in financial assets. In the opinion of the Directors, the shares in the subsidiary undertakings are worth at least the amounts at which they are stated in the Balance Sheet. Details of subsidiary undertakings are set out in note 27.
14. INVENTORIES
2016 2015
€m €m
GroupRaw materials & consumables 36.9 40.6Finished goods & goods for resale 49.0 52.9
Total inventories at lower of cost and net realisable value 85.9 93.5
Inventory write-down recognised as an expense within operating costs amounted to €3.8m (2015: €4.3m). The inventory write-down in the current financial year is primarily as a result of the write-off of finished goods and packaging stocks in Vermont Hard Cider Company due to rebranding which took place during the year, and the write-off of obsolete stock in various locations. The level of inventory write-down in the prior financial year is impacted by the write-off of inventory in Australia following a change of the Group’s distributor and the write-off of packaging stocks in Vermont Hard Cider Company. Previously impaired inventory recovered during the financial year and recognised as exceptional income (note 5) amounted to €nil (2015: €0.3m).
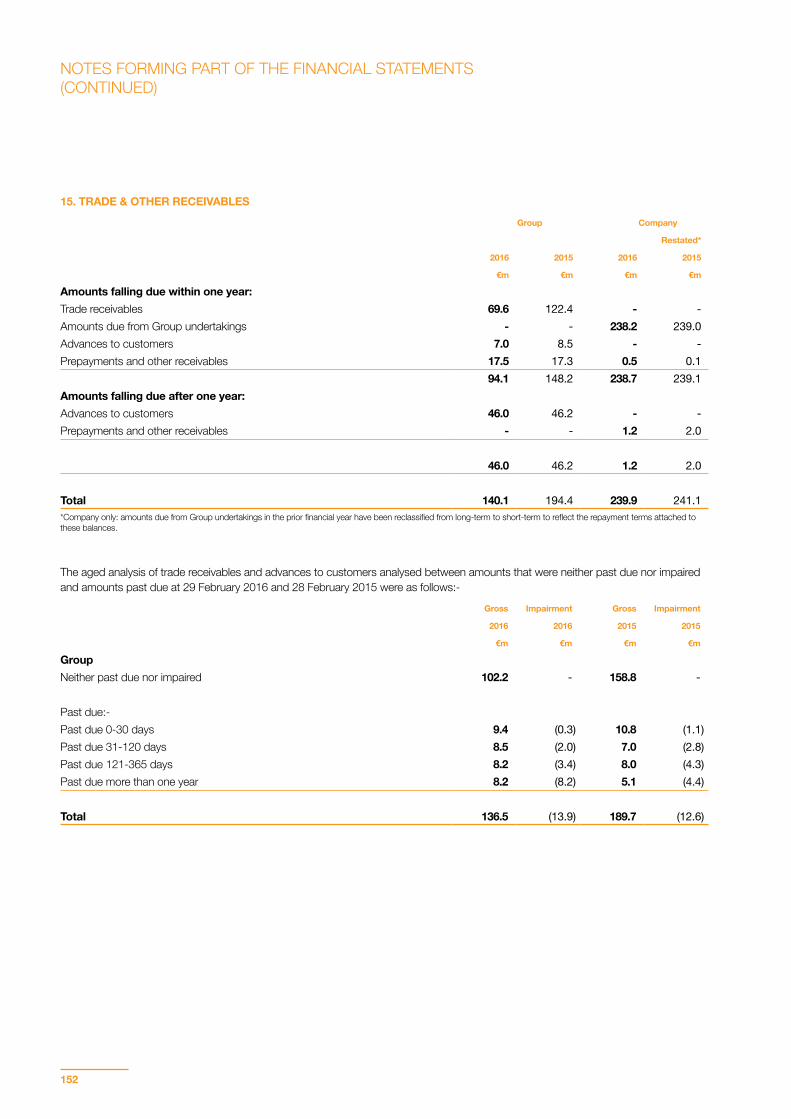
152
15. TRADE & OTHER RECEIVABLES
Group Company
Restated*
2016 2015 2016 2015
€m €m €m €m
Amounts falling due within one year:Trade receivables 69.6 122.4 - -Amounts due from Group undertakings - - 238.2 239.0Advances to customers 7.0 8.5 - -Prepayments and other receivables 17.5 17.3 0.5 0.1
94.1 148.2 238.7 239.1Amounts falling due after one year:Advances to customers 46.0 46.2 - -Prepayments and other receivables - - 1.2 2.0
46.0 46.2 1.2 2.0
Total 140.1 194.4 239.9 241.1*Company only: amounts due from Group undertakings in the prior financial year have been reclassified from long-term to short-term to reflect the repayment terms attached to these balances.
The aged analysis of trade receivables and advances to customers analysed between amounts that were neither past due nor impaired and amounts past due at 29 February 2016 and 28 February 2015 were as follows:-
Gross Impairment Gross Impairment
2016 2016 2015 2015
€m €m €m €m
GroupNeither past due nor impaired 102.2 - 158.8 -
Past due:-Past due 0-30 days 9.4 (0.3) 10.8 (1.1)Past due 31-120 days 8.5 (2.0) 7.0 (2.8)Past due 121-365 days 8.2 (3.4) 8.0 (4.3)Past due more than one year 8.2 (8.2) 5.1 (4.4)
Total 136.5 (13.9) 189.7 (12.6)
NOTES FORMING PART OF THE FINANCIAL STATEMENTS(CONTINUED)
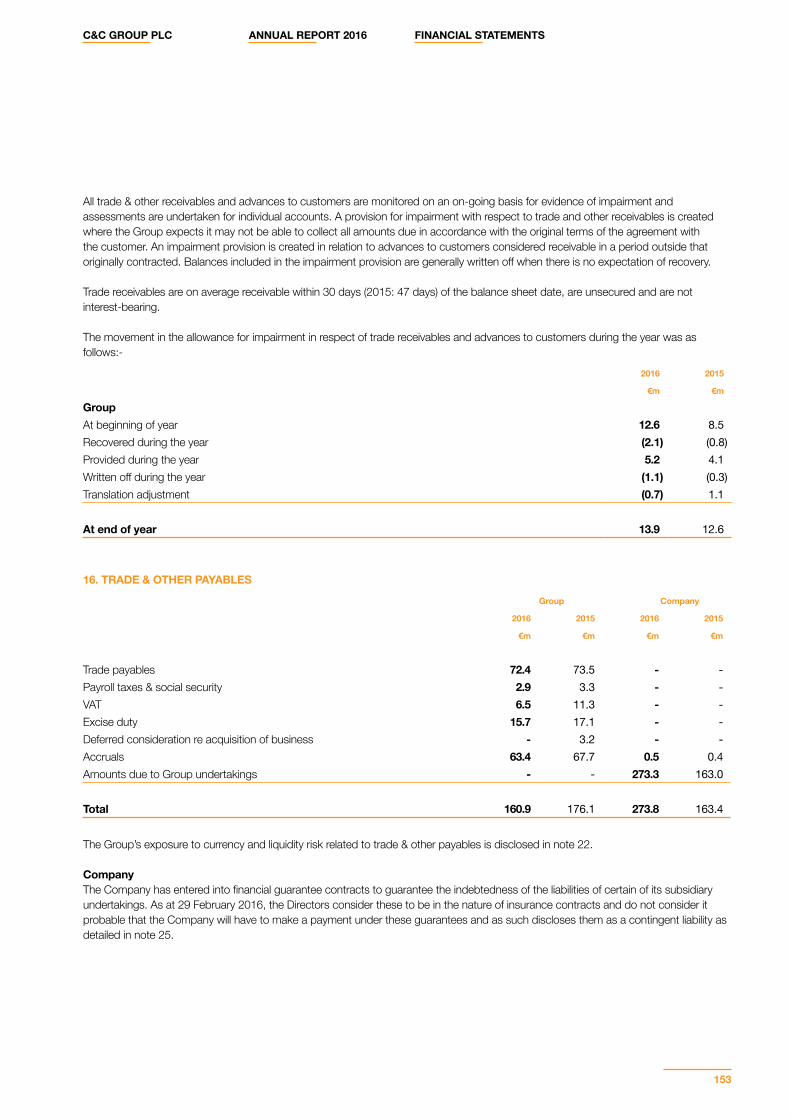
C&C GROUP PLC ANNUAL REPORT 2016 FINANCIAL STATEMENTS
153
All trade & other receivables and advances to customers are monitored on an on-going basis for evidence of impairment and assessments are undertaken for individual accounts. A provision for impairment with respect to trade and other receivables is created where the Group expects it may not be able to collect all amounts due in accordance with the original terms of the agreement with the customer. An impairment provision is created in relation to advances to customers considered receivable in a period outside that originally contracted. Balances included in the impairment provision are generally written off when there is no expectation of recovery.
Trade receivables are on average receivable within 30 days (2015: 47 days) of the balance sheet date, are unsecured and are not interest-bearing.
The movement in the allowance for impairment in respect of trade receivables and advances to customers during the year was as follows:-
2016 2015
€m €m
GroupAt beginning of year 12.6 8.5Recovered during the year (2.1) (0.8)Provided during the year 5.2 4.1Written off during the year (1.1) (0.3)Translation adjustment (0.7) 1.1
At end of year 13.9 12.6
16. TRADE & OTHER PAYABLES
Group Company
2016 2015 2016 2015
€m €m €m €m
Trade payables 72.4 73.5 - -Payroll taxes & social security 2.9 3.3 - -VAT 6.5 11.3 - -Excise duty 15.7 17.1 - -Deferred consideration re acquisition of business - 3.2 - -Accruals 63.4 67.7 0.5 0.4Amounts due to Group undertakings - - 273.3 163.0
Total 160.9 176.1 273.8 163.4
The Group’s exposure to currency and liquidity risk related to trade & other payables is disclosed in note 22.
CompanyThe Company has entered into financial guarantee contracts to guarantee the indebtedness of the liabilities of certain of its subsidiary undertakings. As at 29 February 2016, the Directors consider these to be in the nature of insurance contracts and do not consider it probable that the Company will have to make a payment under these guarantees and as such discloses them as a contingent liability as detailed in note 25.
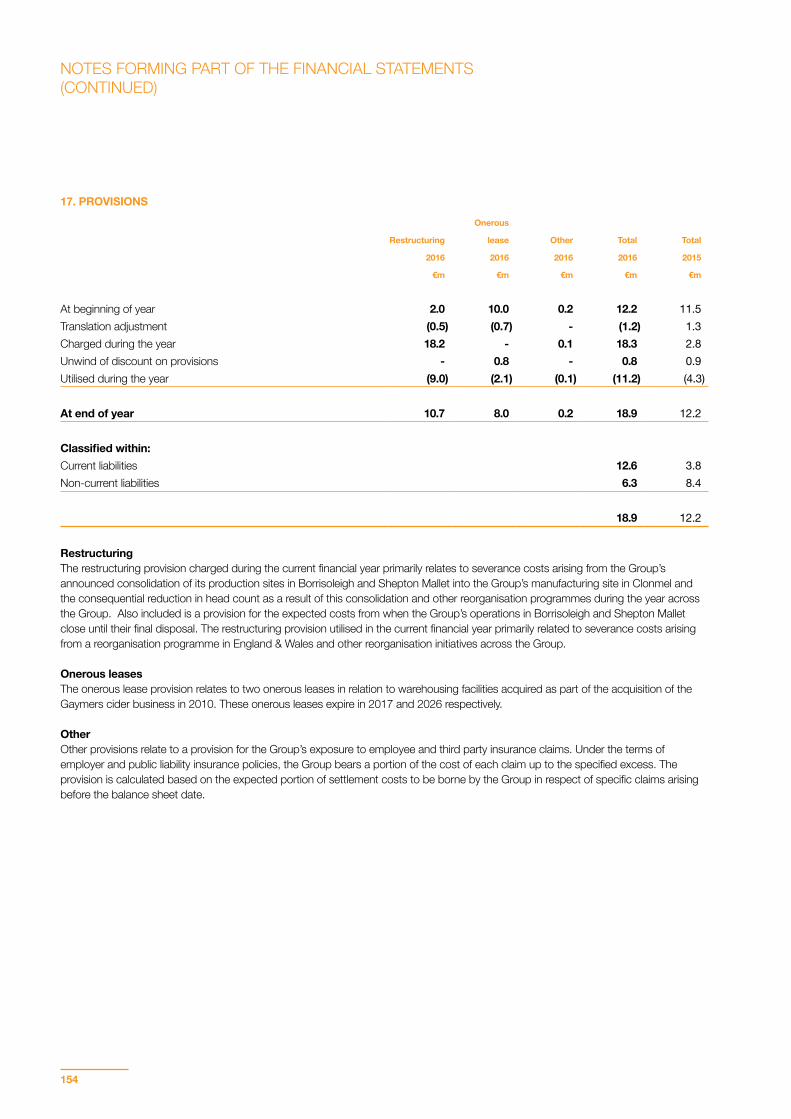
154
17. PROVISIONS
Onerous
Restructuring lease Other Total Total
2016 2016 2016 2016 2015
€m €m €m €m €m
At beginning of year 2.0 10.0 0.2 12.2 11.5Translation adjustment (0.5) (0.7) - (1.2) 1.3Charged during the year 18.2 - 0.1 18.3 2.8Unwind of discount on provisions - 0.8 - 0.8 0.9Utilised during the year (9.0) (2.1) (0.1) (11.2) (4.3)
At end of year 10.7 8.0 0.2 18.9 12.2
Classified within:Current liabilities 12.6 3.8Non-current liabilities 6.3 8.4
18.9 12.2
Restructuring The restructuring provision charged during the current financial year primarily relates to severance costs arising from the Group’s announced consolidation of its production sites in Borrisoleigh and Shepton Mallet into the Group’s manufacturing site in Clonmel and the consequential reduction in head count as a result of this consolidation and other reorganisation programmes during the year across the Group. Also included is a provision for the expected costs from when the Group’s operations in Borrisoleigh and Shepton Mallet close until their final disposal. The restructuring provision utilised in the current financial year primarily related to severance costs arising from a reorganisation programme in England & Wales and other reorganisation initiatives across the Group.
Onerous leases The onerous lease provision relates to two onerous leases in relation to warehousing facilities acquired as part of the acquisition of the Gaymers cider business in 2010. These onerous leases expire in 2017 and 2026 respectively.
Other Other provisions relate to a provision for the Group’s exposure to employee and third party insurance claims. Under the terms of employer and public liability insurance policies, the Group bears a portion of the cost of each claim up to the specified excess. The provision is calculated based on the expected portion of settlement costs to be borne by the Group in respect of specific claims arising before the balance sheet date.
NOTES FORMING PART OF THE FINANCIAL STATEMENTS(CONTINUED)
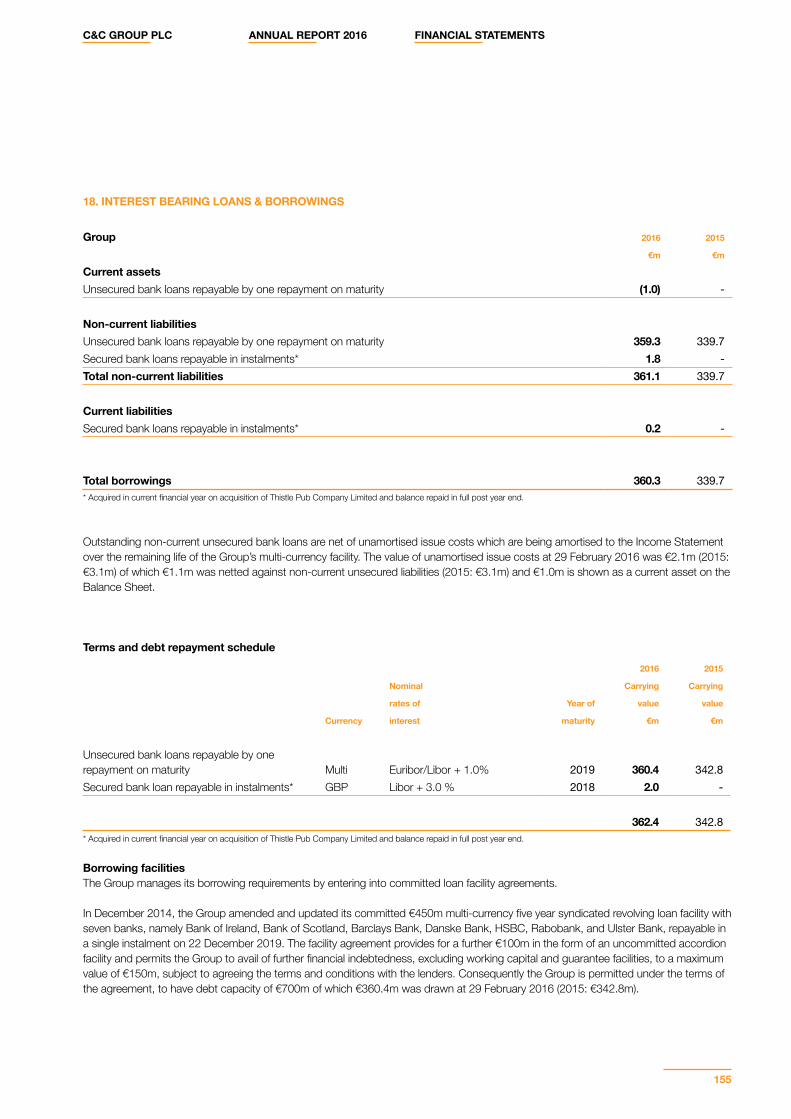
C&C GROUP PLC ANNUAL REPORT 2016 FINANCIAL STATEMENTS
155
18. INTEREST BEARING LOANS & BORROWINGS
Group 2016 2015
€m €m
Current assetsUnsecured bank loans repayable by one repayment on maturity (1.0) -
Non-current liabilitiesUnsecured bank loans repayable by one repayment on maturity 359.3 339.7Secured bank loans repayable in instalments* 1.8 -Total non-current liabilities 361.1 339.7
Current liabilitiesSecured bank loans repayable in instalments* 0.2 -
Total borrowings 360.3 339.7* Acquired in current financial year on acquisition of Thistle Pub Company Limited and balance repaid in full post year end.
Outstanding non-current unsecured bank loans are net of unamortised issue costs which are being amortised to the Income Statement over the remaining life of the Group’s multi-currency facility. The value of unamortised issue costs at 29 February 2016 was €2.1m (2015: €3.1m) of which €1.1m was netted against non-current unsecured liabilities (2015: €3.1m) and €1.0m is shown as a current asset on the Balance Sheet.
Terms and debt repayment schedule
2016 2015
Nominal Carrying Carrying
rates of Year of value value
Currency interest maturity €m €m
Unsecured bank loans repayable by one repayment on maturity Multi Euribor/Libor + 1.0% 2019 360.4 342.8Secured bank loan repayable in instalments* GBP Libor + 3.0 % 2018 2.0 -
362.4 342.8* Acquired in current financial year on acquisition of Thistle Pub Company Limited and balance repaid in full post year end.
Borrowing facilitiesThe Group manages its borrowing requirements by entering into committed loan facility agreements. In December 2014, the Group amended and updated its committed €450m multi-currency five year syndicated revolving loan facility with seven banks, namely Bank of Ireland, Bank of Scotland, Barclays Bank, Danske Bank, HSBC, Rabobank, and Ulster Bank, repayable in a single instalment on 22 December 2019. The facility agreement provides for a further €100m in the form of an uncommitted accordion facility and permits the Group to avail of further financial indebtedness, excluding working capital and guarantee facilities, to a maximum value of €150m, subject to agreeing the terms and conditions with the lenders. Consequently the Group is permitted under the terms of the agreement, to have debt capacity of €700m of which €360.4m was drawn at 29 February 2016 (2015: €342.8m).
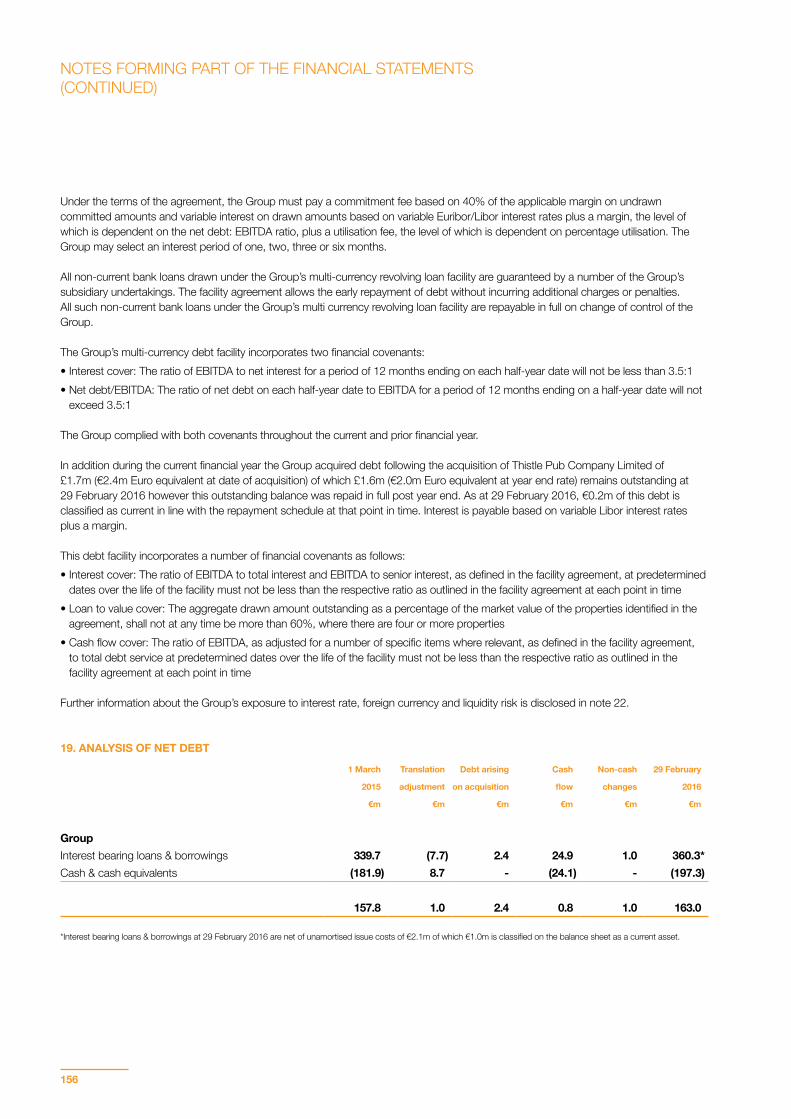
156
Under the terms of the agreement, the Group must pay a commitment fee based on 40% of the applicable margin on undrawn committed amounts and variable interest on drawn amounts based on variable Euribor/Libor interest rates plus a margin, the level of which is dependent on the net debt: EBITDA ratio, plus a utilisation fee, the level of which is dependent on percentage utilisation. The Group may select an interest period of one, two, three or six months. All non-current bank loans drawn under the Group’s multi-currency revolving loan facility are guaranteed by a number of the Group’s subsidiary undertakings. The facility agreement allows the early repayment of debt without incurring additional charges or penalties. All such non-current bank loans under the Group’s multi currency revolving loan facility are repayable in full on change of control of the Group.
The Group’s multi-currency debt facility incorporates two financial covenants:• Interest cover: The ratio of EBITDA to net interest for a period of 12 months ending on each half-year date will not be less than 3.5:1• Net debt/EBITDA: The ratio of net debt on each half-year date to EBITDA for a period of 12 months ending on a half-year date will not
exceed 3.5:1
The Group complied with both covenants throughout the current and prior financial year.
In addition during the current financial year the Group acquired debt following the acquisition of Thistle Pub Company Limited of £1.7m (€2.4m Euro equivalent at date of acquisition) of which £1.6m (€2.0m Euro equivalent at year end rate) remains outstanding at 29 February 2016 however this outstanding balance was repaid in full post year end. As at 29 February 2016, €0.2m of this debt is classified as current in line with the repayment schedule at that point in time. Interest is payable based on variable Libor interest rates plus a margin.
This debt facility incorporates a number of financial covenants as follows:• Interest cover: The ratio of EBITDA to total interest and EBITDA to senior interest, as defined in the facility agreement, at predetermined
dates over the life of the facility must not be less than the respective ratio as outlined in the facility agreement at each point in time• Loan to value cover: The aggregate drawn amount outstanding as a percentage of the market value of the properties identified in the
agreement, shall not at any time be more than 60%, where there are four or more properties• Cash flow cover: The ratio of EBITDA, as adjusted for a number of specific items where relevant, as defined in the facility agreement,
to total debt service at predetermined dates over the life of the facility must not be less than the respective ratio as outlined in the facility agreement at each point in time
Further information about the Group’s exposure to interest rate, foreign currency and liquidity risk is disclosed in note 22.
19. ANALYSIS OF NET DEBT
1 March Translation Debt arising Cash Non-cash 29 February
2015 adjustment on acquisition flow changes 2016
€m €m €m €m €m €m
GroupInterest bearing loans & borrowings 339.7 (7.7) 2.4 24.9 1.0 360.3*Cash & cash equivalents (181.9) 8.7 - (24.1) - (197.3)
157.8 1.0 2.4 0.8 1.0 163.0
*Interest bearing loans & borrowings at 29 February 2016 are net of unamortised issue costs of €2.1m of which €1.0m is classified on the balance sheet as a current asset.
NOTES FORMING PART OF THE FINANCIAL STATEMENTS(CONTINUED)
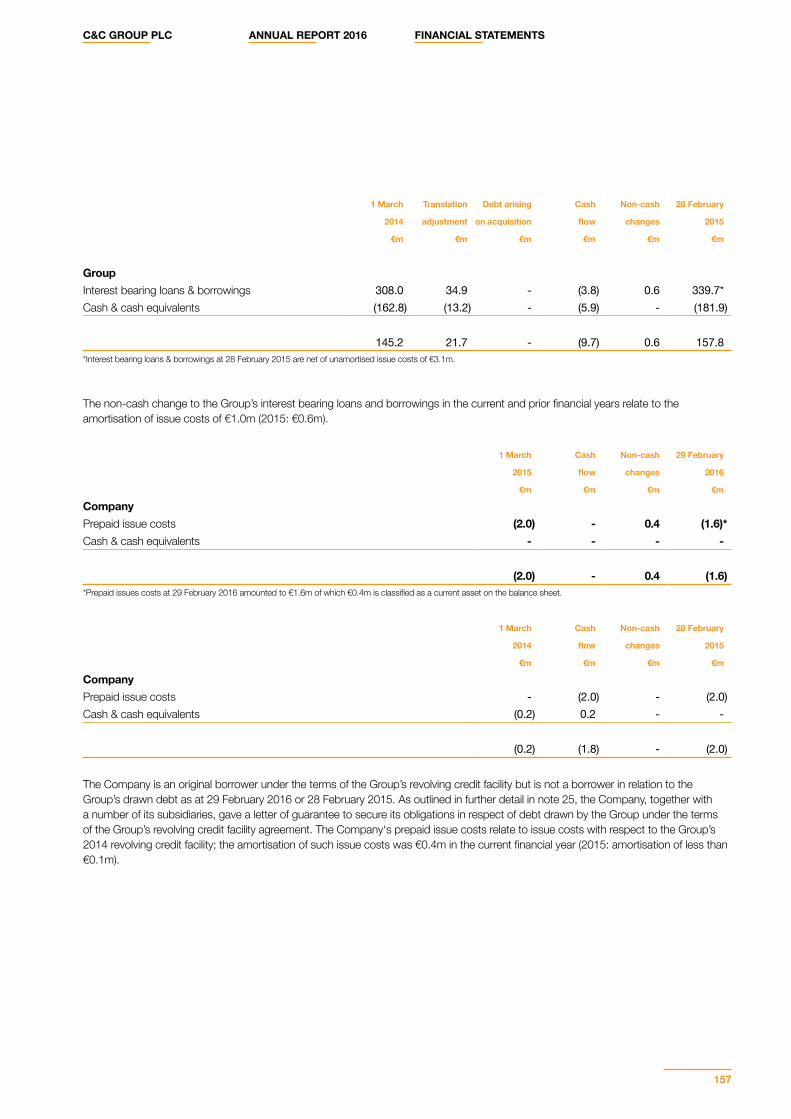
C&C GROUP PLC ANNUAL REPORT 2016 FINANCIAL STATEMENTS
157
1 March Translation Debt arising Cash Non-cash 28 February
2014 adjustment on acquisition flow changes 2015
€m €m €m €m €m €m
GroupInterest bearing loans & borrowings 308.0 34.9 - (3.8) 0.6 339.7*Cash & cash equivalents (162.8) (13.2) - (5.9) - (181.9)
145.2 21.7 - (9.7) 0.6 157.8*Interest bearing loans & borrowings at 28 February 2015 are net of unamortised issue costs of €3.1m.
The non-cash change to the Group’s interest bearing loans and borrowings in the current and prior financial years relate to the amortisation of issue costs of €1.0m (2015: €0.6m).
1 March Cash Non-cash 29 February
2015 flow changes 2016
€m €m €m €m
CompanyPrepaid issue costs (2.0) - 0.4 (1.6)*Cash & cash equivalents - - - -
(2.0) - 0.4 (1.6)*Prepaid issues costs at 29 February 2016 amounted to €1.6m of which €0.4m is classified as a current asset on the balance sheet.
1 March Cash Non-cash 28 February
2014 flow changes 2015
€m €m €m €m
CompanyPrepaid issue costs - (2.0) - (2.0)Cash & cash equivalents (0.2) 0.2 - -
(0.2) (1.8) - (2.0)
The Company is an original borrower under the terms of the Group’s revolving credit facility but is not a borrower in relation to the Group’s drawn debt as at 29 February 2016 or 28 February 2015. As outlined in further detail in note 25, the Company, together with a number of its subsidiaries, gave a letter of guarantee to secure its obligations in respect of debt drawn by the Group under the terms of the Group’s revolving credit facility agreement. The Company‘s prepaid issue costs relate to issue costs with respect to the Group’s 2014 revolving credit facility; the amortisation of such issue costs was €0.4m in the current financial year (2015: amortisation of less than €0.1m).
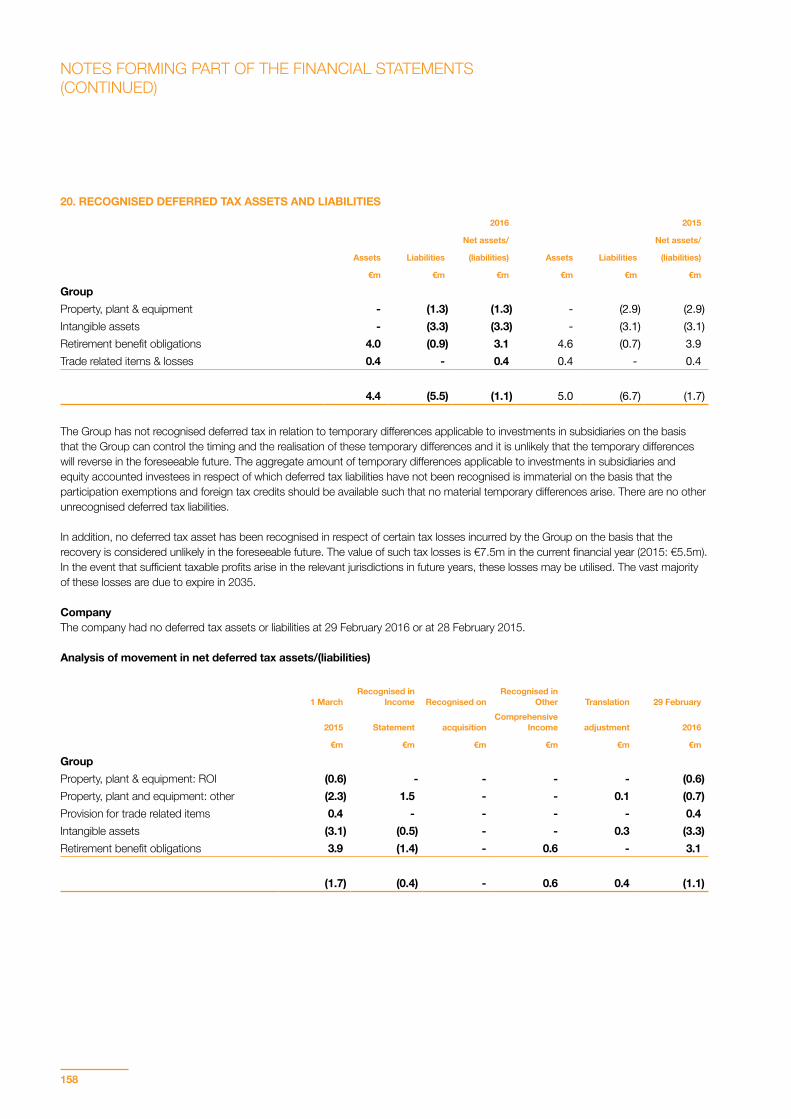
158
20. RECOGNISED DEFERRED TAX ASSETS AND LIABILITIES
2016 2015
Net assets/ Net assets/
Assets Liabilities (liabilities) Assets Liabilities (liabilities)
€m €m €m €m €m €m
GroupProperty, plant & equipment - (1.3) (1.3) - (2.9) (2.9)Intangible assets - (3.3) (3.3) - (3.1) (3.1)Retirement benefit obligations 4.0 (0.9) 3.1 4.6 (0.7) 3.9Trade related items & losses 0.4 - 0.4 0.4 - 0.4
4.4 (5.5) (1.1) 5.0 (6.7) (1.7)
The Group has not recognised deferred tax in relation to temporary differences applicable to investments in subsidiaries on the basis that the Group can control the timing and the realisation of these temporary differences and it is unlikely that the temporary differences will reverse in the foreseeable future. The aggregate amount of temporary differences applicable to investments in subsidiaries and equity accounted investees in respect of which deferred tax liabilities have not been recognised is immaterial on the basis that the participation exemptions and foreign tax credits should be available such that no material temporary differences arise. There are no other unrecognised deferred tax liabilities.
In addition, no deferred tax asset has been recognised in respect of certain tax losses incurred by the Group on the basis that the recovery is considered unlikely in the foreseeable future. The value of such tax losses is €7.5m in the current financial year (2015: €5.5m). In the event that sufficient taxable profits arise in the relevant jurisdictions in future years, these losses may be utilised. The vast majority of these losses are due to expire in 2035.
CompanyThe company had no deferred tax assets or liabilities at 29 February 2016 or at 28 February 2015.
Analysis of movement in net deferred tax assets/(liabilities)
1 MarchRecognised in
Income Recognised on Recognised in
Other Translation 29 February
2015 Statement acquisitionComprehensive
Income adjustment 2016
€m €m €m €m €m €m
Group Property, plant & equipment: ROI (0.6) - - - - (0.6)Property, plant and equipment: other (2.3) 1.5 - - 0.1 (0.7)Provision for trade related items 0.4 - - - - 0.4Intangible assets (3.1) (0.5) - - 0.3 (3.3)Retirement benefit obligations 3.9 (1.4) - 0.6 - 3.1
(1.7) (0.4) - 0.6 0.4 (1.1)
NOTES FORMING PART OF THE FINANCIAL STATEMENTS(CONTINUED)
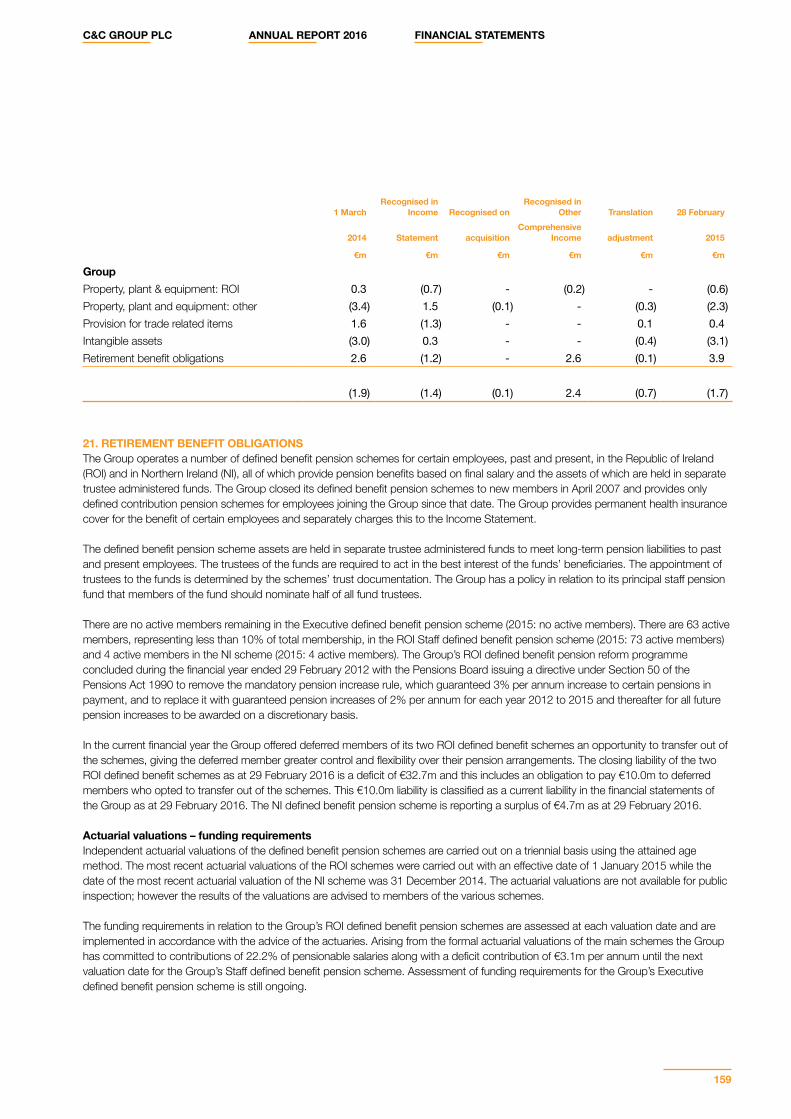
C&C GROUP PLC ANNUAL REPORT 2016 FINANCIAL STATEMENTS
159
1 MarchRecognised in
Income Recognised on Recognised in
Other Translation 28 February
2014 Statement acquisitionComprehensive
Income adjustment 2015
€m €m €m €m €m €m
GroupProperty, plant & equipment: ROI 0.3 (0.7) - (0.2) - (0.6)Property, plant and equipment: other (3.4) 1.5 (0.1) - (0.3) (2.3)Provision for trade related items 1.6 (1.3) - - 0.1 0.4Intangible assets (3.0) 0.3 - - (0.4) (3.1)Retirement benefit obligations 2.6 (1.2) - 2.6 (0.1) 3.9
(1.9) (1.4) (0.1) 2.4 (0.7) (1.7)
21. RETIREMENT BENEFIT OBLIGATIONSThe Group operates a number of defined benefit pension schemes for certain employees, past and present, in the Republic of Ireland (ROI) and in Northern Ireland (NI), all of which provide pension benefits based on final salary and the assets of which are held in separate trustee administered funds. The Group closed its defined benefit pension schemes to new members in April 2007 and provides only defined contribution pension schemes for employees joining the Group since that date. The Group provides permanent health insurance cover for the benefit of certain employees and separately charges this to the Income Statement.
The defined benefit pension scheme assets are held in separate trustee administered funds to meet long-term pension liabilities to past and present employees. The trustees of the funds are required to act in the best interest of the funds’ beneficiaries. The appointment of trustees to the funds is determined by the schemes’ trust documentation. The Group has a policy in relation to its principal staff pension fund that members of the fund should nominate half of all fund trustees.
There are no active members remaining in the Executive defined benefit pension scheme (2015: no active members). There are 63 active members, representing less than 10% of total membership, in the ROI Staff defined benefit pension scheme (2015: 73 active members) and 4 active members in the NI scheme (2015: 4 active members). The Group’s ROI defined benefit pension reform programme concluded during the financial year ended 29 February 2012 with the Pensions Board issuing a directive under Section 50 of the Pensions Act 1990 to remove the mandatory pension increase rule, which guaranteed 3% per annum increase to certain pensions in payment, and to replace it with guaranteed pension increases of 2% per annum for each year 2012 to 2015 and thereafter for all future pension increases to be awarded on a discretionary basis.
In the current financial year the Group offered deferred members of its two ROI defined benefit schemes an opportunity to transfer out of the schemes, giving the deferred member greater control and flexibility over their pension arrangements. The closing liability of the two ROI defined benefit schemes as at 29 February 2016 is a deficit of €32.7m and this includes an obligation to pay €10.0m to deferred members who opted to transfer out of the schemes. This €10.0m liability is classified as a current liability in the financial statements of the Group as at 29 February 2016. The NI defined benefit pension scheme is reporting a surplus of €4.7m as at 29 February 2016.
Actuarial valuations – funding requirements Independent actuarial valuations of the defined benefit pension schemes are carried out on a triennial basis using the attained age method. The most recent actuarial valuations of the ROI schemes were carried out with an effective date of 1 January 2015 while the date of the most recent actuarial valuation of the NI scheme was 31 December 2014. The actuarial valuations are not available for public inspection; however the results of the valuations are advised to members of the various schemes.
The funding requirements in relation to the Group’s ROI defined benefit pension schemes are assessed at each valuation date and are implemented in accordance with the advice of the actuaries. Arising from the formal actuarial valuations of the main schemes the Group has committed to contributions of 22.2% of pensionable salaries along with a deficit contribution of €3.1m per annum until the next valuation date for the Group’s Staff defined benefit pension scheme. Assessment of funding requirements for the Group’s Executive defined benefit pension scheme is still ongoing.
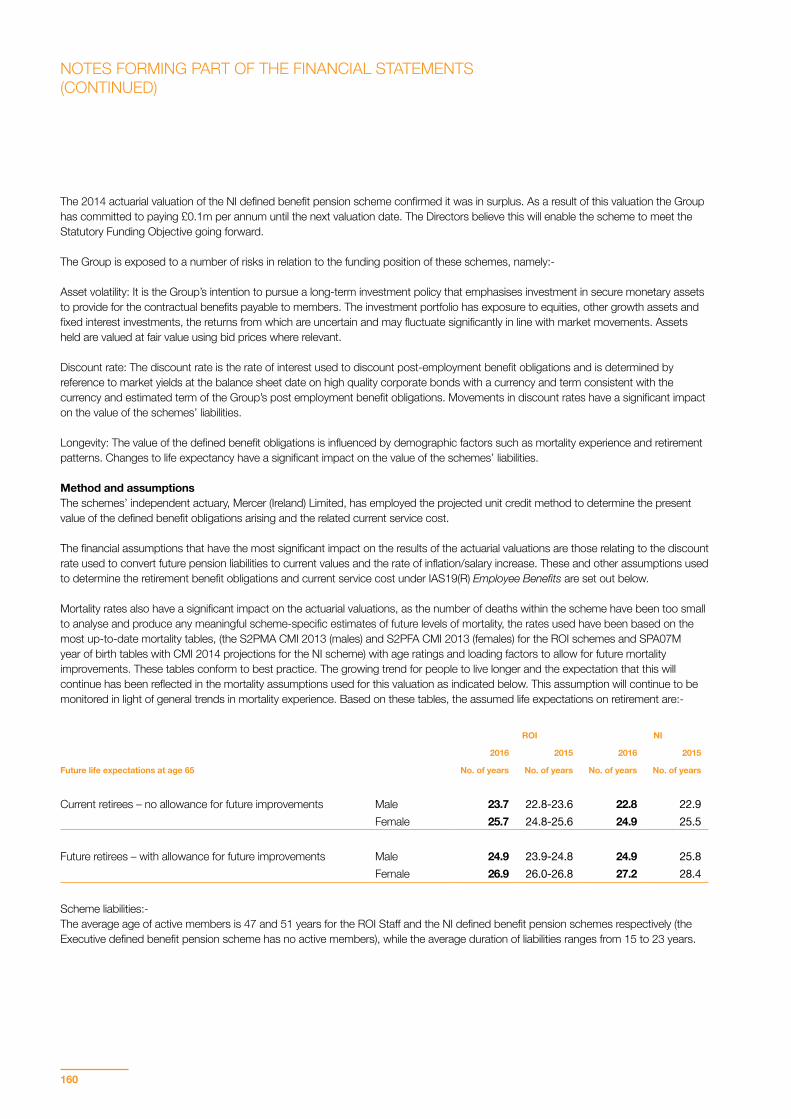
160
The 2014 actuarial valuation of the NI defined benefit pension scheme confirmed it was in surplus. As a result of this valuation the Group has committed to paying £0.1m per annum until the next valuation date. The Directors believe this will enable the scheme to meet the Statutory Funding Objective going forward.
The Group is exposed to a number of risks in relation to the funding position of these schemes, namely:-
Asset volatility: It is the Group’s intention to pursue a long-term investment policy that emphasises investment in secure monetary assets to provide for the contractual benefits payable to members. The investment portfolio has exposure to equities, other growth assets and fixed interest investments, the returns from which are uncertain and may fluctuate significantly in line with market movements. Assets held are valued at fair value using bid prices where relevant.
Discount rate: The discount rate is the rate of interest used to discount post-employment benefit obligations and is determined by reference to market yields at the balance sheet date on high quality corporate bonds with a currency and term consistent with the currency and estimated term of the Group’s post employment benefit obligations. Movements in discount rates have a significant impact on the value of the schemes’ liabilities.
Longevity: The value of the defined benefit obligations is influenced by demographic factors such as mortality experience and retirement patterns. Changes to life expectancy have a significant impact on the value of the schemes’ liabilities.
Method and assumptions The schemes’ independent actuary, Mercer (Ireland) Limited, has employed the projected unit credit method to determine the present value of the defined benefit obligations arising and the related current service cost. The financial assumptions that have the most significant impact on the results of the actuarial valuations are those relating to the discount rate used to convert future pension liabilities to current values and the rate of inflation/salary increase. These and other assumptions used to determine the retirement benefit obligations and current service cost under IAS19(R) Employee Benefits are set out below. Mortality rates also have a significant impact on the actuarial valuations, as the number of deaths within the scheme have been too small to analyse and produce any meaningful scheme-specific estimates of future levels of mortality, the rates used have been based on the most up-to-date mortality tables, (the S2PMA CMI 2013 (males) and S2PFA CMI 2013 (females) for the ROI schemes and SPA07M year of birth tables with CMI 2014 projections for the NI scheme) with age ratings and loading factors to allow for future mortality improvements. These tables conform to best practice. The growing trend for people to live longer and the expectation that this will continue has been reflected in the mortality assumptions used for this valuation as indicated below. This assumption will continue to be monitored in light of general trends in mortality experience. Based on these tables, the assumed life expectations on retirement are:-
ROI NI
2016 2015 2016 2015
Future life expectations at age 65 No. of years No. of years No. of years No. of years
Current retirees – no allowance for future improvements Male 23.7 22.8-23.6 22.8 22.9 Female 25.7 24.8-25.6 24.9 25.5
Future retirees – with allowance for future improvements Male 24.9 23.9-24.8 24.9 25.8 Female 26.9 26.0-26.8 27.2 28.4
Scheme liabilities:- The average age of active members is 47 and 51 years for the ROI Staff and the NI defined benefit pension schemes respectively (the Executive defined benefit pension scheme has no active members), while the average duration of liabilities ranges from 15 to 23 years.
NOTES FORMING PART OF THE FINANCIAL STATEMENTS(CONTINUED)

C&C GROUP PLC ANNUAL REPORT 2016 FINANCIAL STATEMENTS
161
The principal long-term financial assumptions used by the Group’s actuaries in the computation of the defined benefit liabilities arising on pension schemes as at 29 February 2016 and 28 February 2015 are as follows:-
2016 2015
ROI NI ROI NI
Salary increases 0.0%-2.5% 3.4% 0.0%-2.5% 3.5%Increases to pensions in payment 1.5% 1.7% 1.5% 1.7%
Discount rate1.95%-2.15% 3.9% 1.7-1.9% 3.6%
Inflation rate 1.5% 3.0% 1.5% 3.1% A reduction in discount rate used to value the schemes’ liabilities by ¼% would increase the valuation of liabilities by €11.3m while an increase in inflation/salary increase expectations of ¼% would increase the valuation of liabilities by €9.7m. The sensitivity is calculated by changing the individual assumption while holding all other assumptions constant.
The pension assets and liabilities on the following pages have been prepared in accordance with IAS19(R) Employee Benefits.
a. Impact on Group Income Statement
2016 2015
ROI NI Total ROI NI Total
€m €m €m €m €m €m
Analysis of defined benefit pension expense:Current service cost 1.0 0.1 1.1 0.6 - 0.6Past service gain (0.8) - (0.8) (1.8) (1.3) (3.1)Gain on settlement (5.4) - (5.4) - - -Interest cost on scheme liabilities 4.2 0.3 4.5 6.5 0.3 6.8Interest income on scheme assets (3.5) (0.4) (3.9) (5.8) (0.4) (6.2)
Total income recognised in Income Statement (4.5) - (4.5) (0.5) (1.4) (1.9)
Analysis of amount recognised in Other Comprehensive Income:
2016 2015
ROI NI Total ROI NI Total
€m €m €m €m €m €m
Actual return on scheme assets (4.4) (0.1) (4.5) 29.8 1.5 31.3Expected interest income on scheme assets (3.5) (0.4) (3.9) (5.8) (0.4) (6.2)Experience gains and losses on scheme liabilities (7.5) 0.5 (7.0) 0.9 - 0.9Effect of changes in assumptions on scheme liabilities 9.7 0.6 10.3 (45.6) (1.1) (46.7)
Total (expense)/income (5.7) 0.6 (5.1) (20.7) - (20.7)
Scheme assets 184.8 10.3 195.1 192.6 10.7 203.3Scheme liabilities (217.5) (5.6) (223.1) (229.9) (7.0) (236.9)Deficit in scheme (32.7) - (32.7) (37.3) - (37.3)Surplus in scheme - 4.7 4.7 - 3.7 3.7
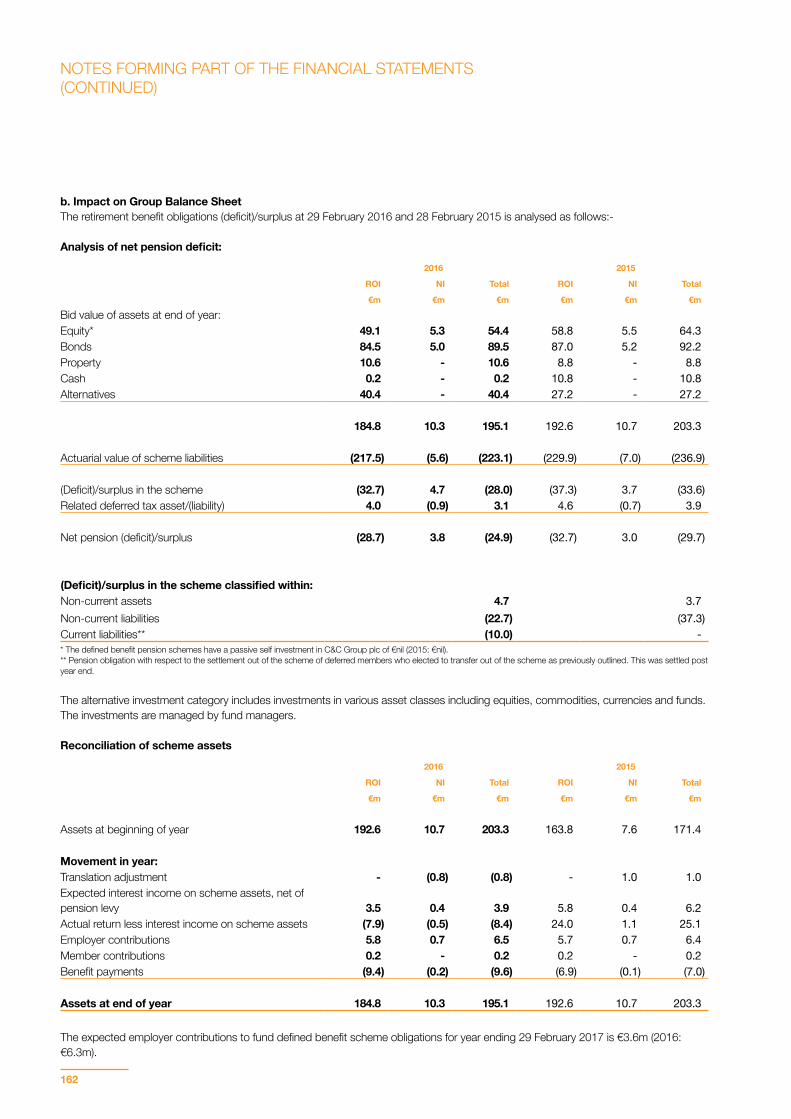
162
b. Impact on Group Balance SheetThe retirement benefit obligations (deficit)/surplus at 29 February 2016 and 28 February 2015 is analysed as follows:-
Analysis of net pension deficit:
2016 2015
ROI NI Total ROI NI Total
€m €m €m €m €m €m
Bid value of assets at end of year:Equity* 49.1 5.3 54.4 58.8 5.5 64.3Bonds 84.5 5.0 89.5 87.0 5.2 92.2Property 10.6 - 10.6 8.8 - 8.8Cash 0.2 - 0.2 10.8 - 10.8Alternatives 40.4 - 40.4 27.2 - 27.2
184.8 10.3 195.1 192.6 10.7 203.3
Actuarial value of scheme liabilities (217.5) (5.6) (223.1) (229.9) (7.0) (236.9)
(Deficit)/surplus in the scheme (32.7) 4.7 (28.0) (37.3) 3.7 (33.6)Related deferred tax asset/(liability) 4.0 (0.9) 3.1 4.6 (0.7) 3.9
Net pension (deficit)/surplus (28.7) 3.8 (24.9) (32.7) 3.0 (29.7)
(Deficit)/surplus in the scheme classified within:Non-current assets 4.7 3.7Non-current liabilities (22.7) (37.3)Current liabilities** (10.0) -* The defined benefit pension schemes have a passive self investment in C&C Group plc of €nil (2015: €nil).** Pension obligation with respect to the settlement out of the scheme of deferred members who elected to transfer out of the scheme as previously outlined. This was settled post year end.
The alternative investment category includes investments in various asset classes including equities, commodities, currencies and funds. The investments are managed by fund managers.
Reconciliation of scheme assets
2016 2015
ROI NI Total ROI NI Total
€m €m €m €m €m €m
Assets at beginning of year 192.6 10.7 203.3 163.8 7.6 171.4
Movement in year:Translation adjustment - (0.8) (0.8) - 1.0 1.0Expected interest income on scheme assets, net of pension levy 3.5 0.4 3.9 5.8 0.4 6.2Actual return less interest income on scheme assets (7.9) (0.5) (8.4) 24.0 1.1 25.1Employer contributions 5.8 0.7 6.5 5.7 0.7 6.4Member contributions 0.2 - 0.2 0.2 - 0.2Benefit payments (9.4) (0.2) (9.6) (6.9) (0.1) (7.0)
Assets at end of year 184.8 10.3 195.1 192.6 10.7 203.3
The expected employer contributions to fund defined benefit scheme obligations for year ending 29 February 2017 is €3.6m (2016: €6.3m).
NOTES FORMING PART OF THE FINANCIAL STATEMENTS(CONTINUED)
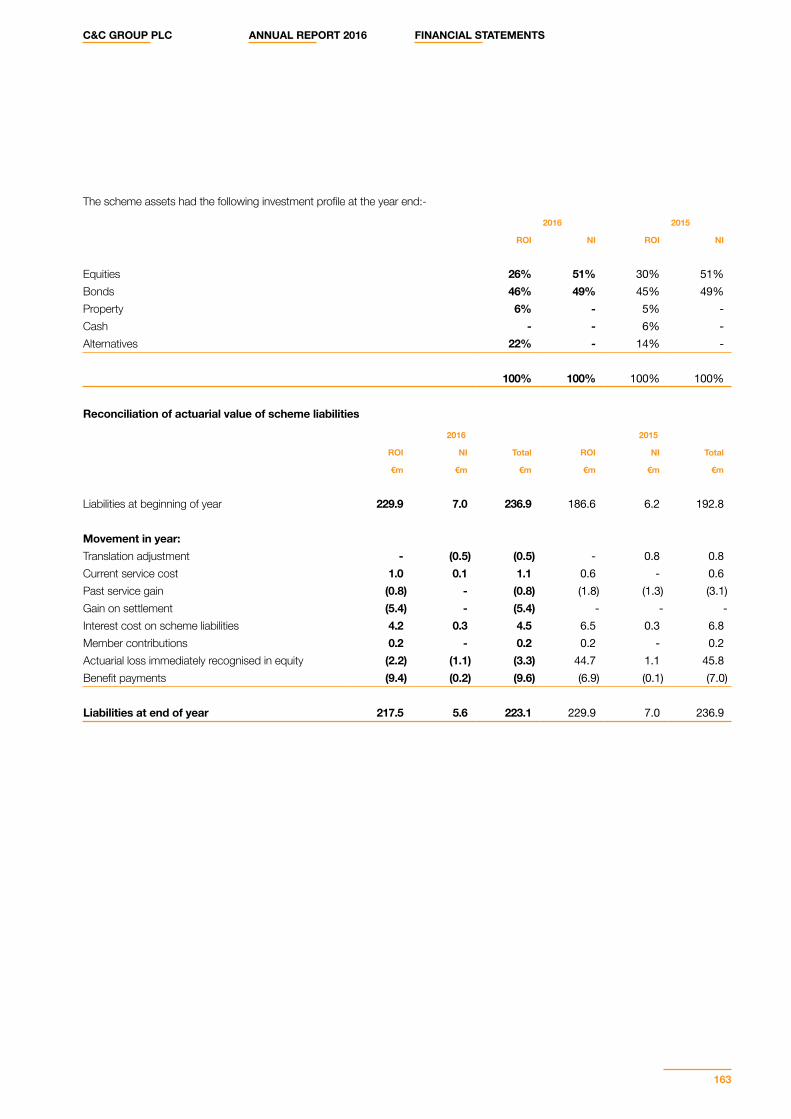
C&C GROUP PLC ANNUAL REPORT 2016 FINANCIAL STATEMENTS
163
The scheme assets had the following investment profile at the year end:-
2016 2015
ROI NI ROI NI
Equities 26% 51% 30% 51%Bonds 46% 49% 45% 49%Property 6% - 5% -Cash - - 6% -Alternatives 22% - 14% -
100% 100% 100% 100%
Reconciliation of actuarial value of scheme liabilities
2016 2015
ROI NI Total ROI NI Total
€m €m €m €m €m €m
Liabilities at beginning of year 229.9 7.0 236.9 186.6 6.2 192.8
Movement in year:Translation adjustment - (0.5) (0.5) - 0.8 0.8Current service cost 1.0 0.1 1.1 0.6 - 0.6Past service gain (0.8) - (0.8) (1.8) (1.3) (3.1)Gain on settlement (5.4) - (5.4) - - -Interest cost on scheme liabilities 4.2 0.3 4.5 6.5 0.3 6.8Member contributions 0.2 - 0.2 0.2 - 0.2Actuarial loss immediately recognised in equity (2.2) (1.1) (3.3) 44.7 1.1 45.8Benefit payments (9.4) (0.2) (9.6) (6.9) (0.1) (7.0)
Liabilities at end of year 217.5 5.6 223.1 229.9 7.0 236.9
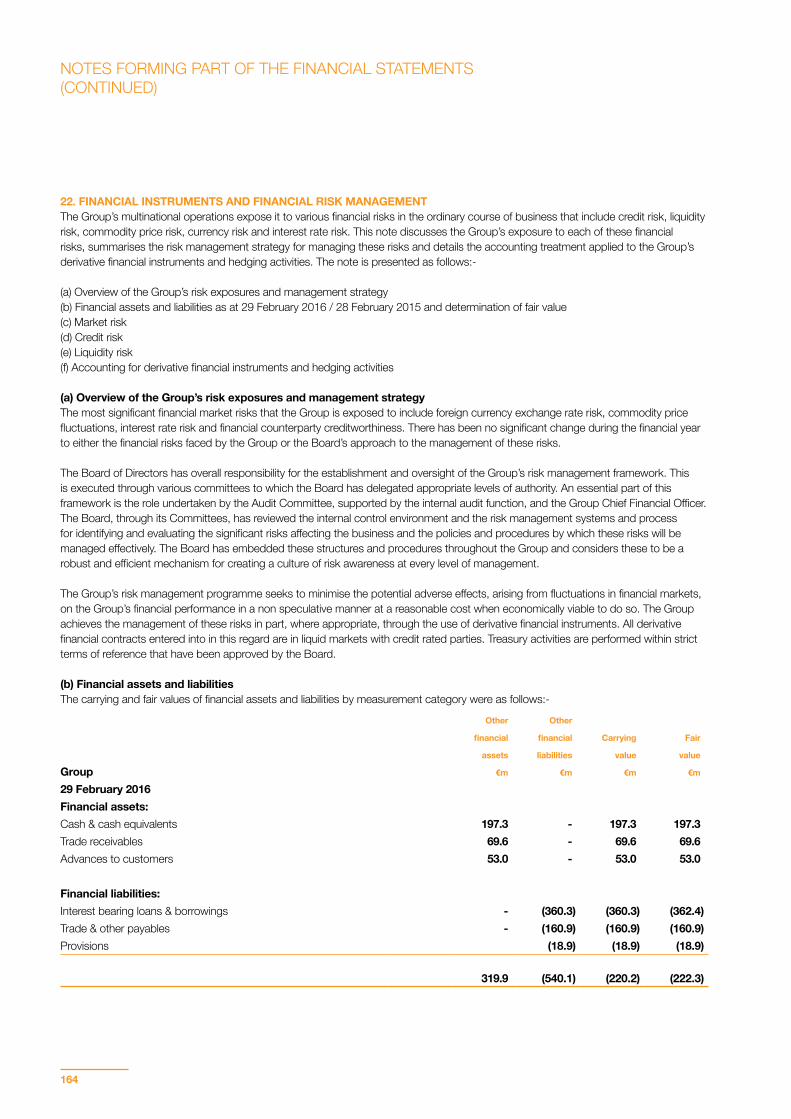
164
22. FINANCIAL INSTRUMENTS AND FINANCIAL RISK MANAGEMENTThe Group’s multinational operations expose it to various financial risks in the ordinary course of business that include credit risk, liquidity risk, commodity price risk, currency risk and interest rate risk. This note discusses the Group’s exposure to each of these financial risks, summarises the risk management strategy for managing these risks and details the accounting treatment applied to the Group’s derivative financial instruments and hedging activities. The note is presented as follows:-
(a) Overview of the Group’s risk exposures and management strategy(b) Financial assets and liabilities as at 29 February 2016 / 28 February 2015 and determination of fair value(c) Market risk (d) Credit risk(e) Liquidity risk(f) Accounting for derivative financial instruments and hedging activities
(a) Overview of the Group’s risk exposures and management strategyThe most significant financial market risks that the Group is exposed to include foreign currency exchange rate risk, commodity price fluctuations, interest rate risk and financial counterparty creditworthiness. There has been no significant change during the financial year to either the financial risks faced by the Group or the Board’s approach to the management of these risks.
The Board of Directors has overall responsibility for the establishment and oversight of the Group’s risk management framework. This is executed through various committees to which the Board has delegated appropriate levels of authority. An essential part of this framework is the role undertaken by the Audit Committee, supported by the internal audit function, and the Group Chief Financial Officer. The Board, through its Committees, has reviewed the internal control environment and the risk management systems and process for identifying and evaluating the significant risks affecting the business and the policies and procedures by which these risks will be managed effectively. The Board has embedded these structures and procedures throughout the Group and considers these to be a robust and efficient mechanism for creating a culture of risk awareness at every level of management. The Group’s risk management programme seeks to minimise the potential adverse effects, arising from fluctuations in financial markets, on the Group’s financial performance in a non speculative manner at a reasonable cost when economically viable to do so. The Group achieves the management of these risks in part, where appropriate, through the use of derivative financial instruments. All derivative financial contracts entered into in this regard are in liquid markets with credit rated parties. Treasury activities are performed within strict terms of reference that have been approved by the Board.
(b) Financial assets and liabilitiesThe carrying and fair values of financial assets and liabilities by measurement category were as follows:-
Other Other
financial financial Carrying Fair
assets liabilities value value
Group €m €m €m €m
29 February 2016Financial assets:Cash & cash equivalents 197.3 - 197.3 197.3Trade receivables 69.6 - 69.6 69.6Advances to customers 53.0 - 53.0 53.0
Financial liabilities:Interest bearing loans & borrowings - (360.3) (360.3) (362.4)Trade & other payables - (160.9) (160.9) (160.9)Provisions (18.9) (18.9) (18.9)
319.9 (540.1) (220.2) (222.3)
NOTES FORMING PART OF THE FINANCIAL STATEMENTS(CONTINUED)
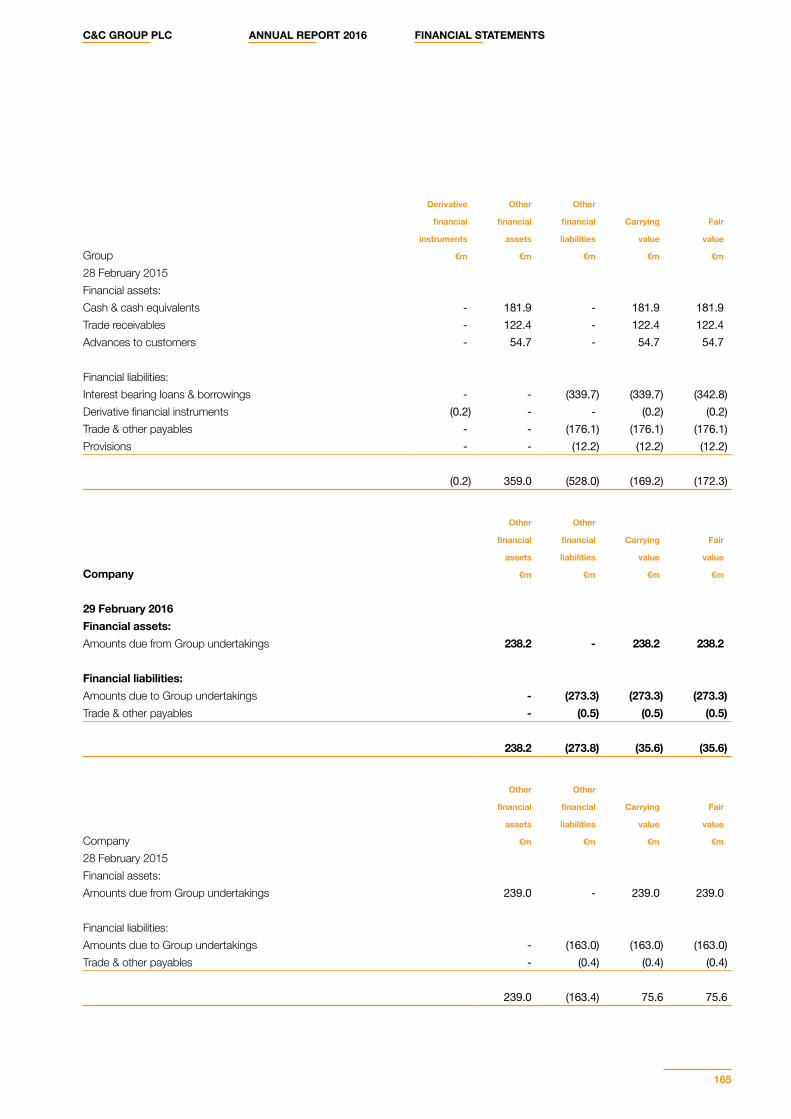
C&C GROUP PLC ANNUAL REPORT 2016 FINANCIAL STATEMENTS
165
Derivative Other Other
financial financial financial Carrying Fair
instruments assets liabilities value value
Group €m €m €m €m €m
28 February 2015Financial assets:Cash & cash equivalents - 181.9 - 181.9 181.9Trade receivables - 122.4 - 122.4 122.4Advances to customers - 54.7 - 54.7 54.7
Financial liabilities:Interest bearing loans & borrowings - - (339.7) (339.7) (342.8)Derivative financial instruments (0.2) - - (0.2) (0.2)Trade & other payables - - (176.1) (176.1) (176.1)Provisions - - (12.2) (12.2) (12.2)
(0.2) 359.0 (528.0) (169.2) (172.3)
Other Other
financial financial Carrying Fair
assets liabilities value value
Company €m €m €m €m
29 February 2016Financial assets:Amounts due from Group undertakings 238.2 - 238.2 238.2
Financial liabilities:Amounts due to Group undertakings - (273.3) (273.3) (273.3)Trade & other payables - (0.5) (0.5) (0.5)
238.2 (273.8) (35.6) (35.6)
Other Other
financial financial Carrying Fair
assets liabilities value value
Company €m €m €m €m
28 February 2015Financial assets:Amounts due from Group undertakings 239.0 - 239.0 239.0
Financial liabilities:Amounts due to Group undertakings - (163.0) (163.0) (163.0)Trade & other payables - (0.4) (0.4) (0.4)
239.0 (163.4) 75.6 75.6
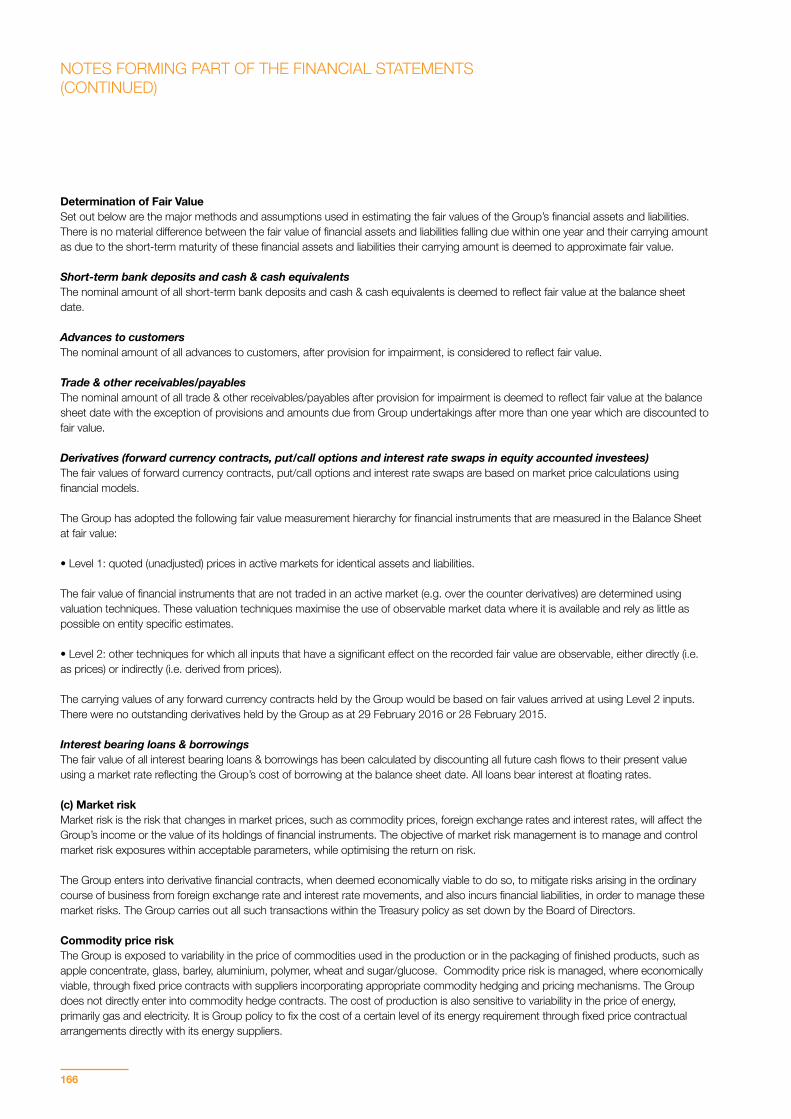
166
Determination of Fair ValueSet out below are the major methods and assumptions used in estimating the fair values of the Group’s financial assets and liabilities. There is no material difference between the fair value of financial assets and liabilities falling due within one year and their carrying amount as due to the short-term maturity of these financial assets and liabilities their carrying amount is deemed to approximate fair value.
Short-term bank deposits and cash & cash equivalentsThe nominal amount of all short-term bank deposits and cash & cash equivalents is deemed to reflect fair value at the balance sheet date.
Advances to customersThe nominal amount of all advances to customers, after provision for impairment, is considered to reflect fair value.
Trade & other receivables/payablesThe nominal amount of all trade & other receivables/payables after provision for impairment is deemed to reflect fair value at the balance sheet date with the exception of provisions and amounts due from Group undertakings after more than one year which are discounted to fair value. Derivatives (forward currency contracts, put/call options and interest rate swaps in equity accounted investees)The fair values of forward currency contracts, put/call options and interest rate swaps are based on market price calculations using financial models.
The Group has adopted the following fair value measurement hierarchy for financial instruments that are measured in the Balance Sheet at fair value:
• Level 1: quoted (unadjusted) prices in active markets for identical assets and liabilities.
The fair value of financial instruments that are not traded in an active market (e.g. over the counter derivatives) are determined using valuation techniques. These valuation techniques maximise the use of observable market data where it is available and rely as little as possible on entity specific estimates.
• Level 2: other techniques for which all inputs that have a significant effect on the recorded fair value are observable, either directly (i.e. as prices) or indirectly (i.e. derived from prices).
The carrying values of any forward currency contracts held by the Group would be based on fair values arrived at using Level 2 inputs. There were no outstanding derivatives held by the Group as at 29 February 2016 or 28 February 2015. Interest bearing loans & borrowingsThe fair value of all interest bearing loans & borrowings has been calculated by discounting all future cash flows to their present value using a market rate reflecting the Group’s cost of borrowing at the balance sheet date. All loans bear interest at floating rates.
(c) Market riskMarket risk is the risk that changes in market prices, such as commodity prices, foreign exchange rates and interest rates, will affect the Group’s income or the value of its holdings of financial instruments. The objective of market risk management is to manage and control market risk exposures within acceptable parameters, while optimising the return on risk. The Group enters into derivative financial contracts, when deemed economically viable to do so, to mitigate risks arising in the ordinary course of business from foreign exchange rate and interest rate movements, and also incurs financial liabilities, in order to manage these market risks. The Group carries out all such transactions within the Treasury policy as set down by the Board of Directors.
Commodity price riskThe Group is exposed to variability in the price of commodities used in the production or in the packaging of finished products, such as apple concentrate, glass, barley, aluminium, polymer, wheat and sugar/glucose. Commodity price risk is managed, where economically viable, through fixed price contracts with suppliers incorporating appropriate commodity hedging and pricing mechanisms. The Group does not directly enter into commodity hedge contracts. The cost of production is also sensitive to variability in the price of energy, primarily gas and electricity. It is Group policy to fix the cost of a certain level of its energy requirement through fixed price contractual arrangements directly with its energy suppliers.
NOTES FORMING PART OF THE FINANCIAL STATEMENTS(CONTINUED)
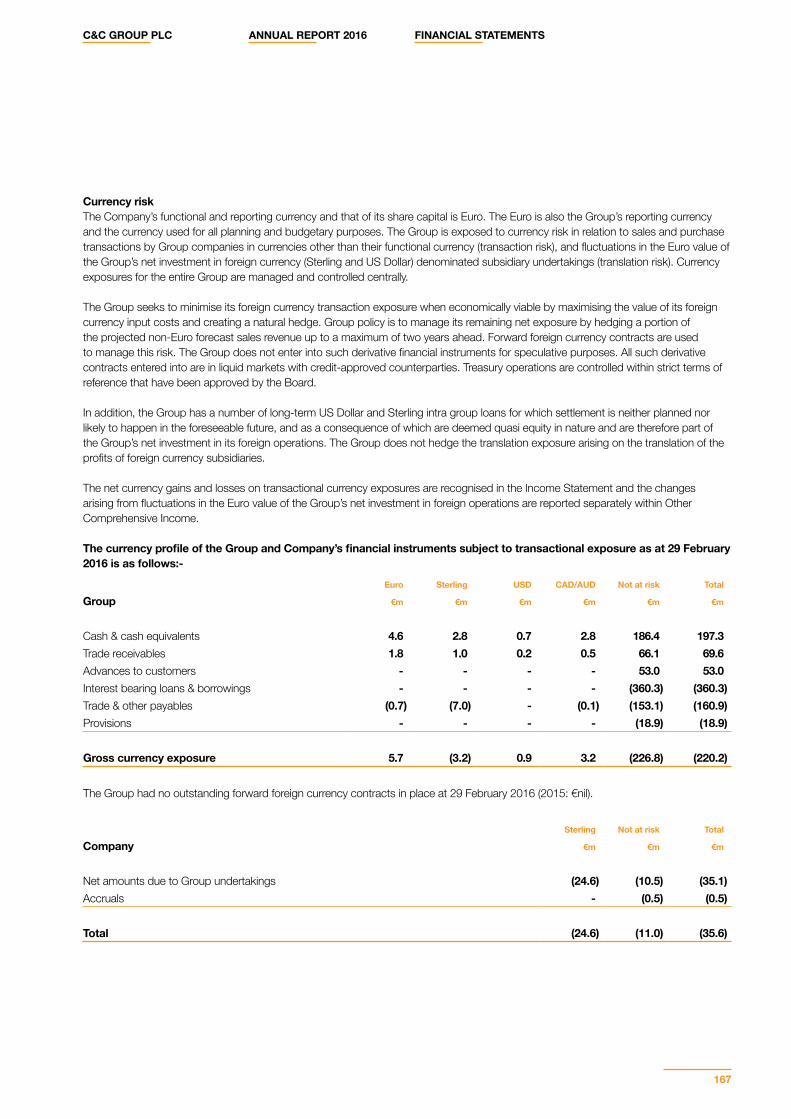
C&C GROUP PLC ANNUAL REPORT 2016 FINANCIAL STATEMENTS
167
Currency riskThe Company’s functional and reporting currency and that of its share capital is Euro. The Euro is also the Group’s reporting currency and the currency used for all planning and budgetary purposes. The Group is exposed to currency risk in relation to sales and purchase transactions by Group companies in currencies other than their functional currency (transaction risk), and fluctuations in the Euro value of the Group’s net investment in foreign currency (Sterling and US Dollar) denominated subsidiary undertakings (translation risk). Currency exposures for the entire Group are managed and controlled centrally.
The Group seeks to minimise its foreign currency transaction exposure when economically viable by maximising the value of its foreign currency input costs and creating a natural hedge. Group policy is to manage its remaining net exposure by hedging a portion of the projected non-Euro forecast sales revenue up to a maximum of two years ahead. Forward foreign currency contracts are used to manage this risk. The Group does not enter into such derivative financial instruments for speculative purposes. All such derivative contracts entered into are in liquid markets with credit-approved counterparties. Treasury operations are controlled within strict terms of reference that have been approved by the Board.
In addition, the Group has a number of long-term US Dollar and Sterling intra group loans for which settlement is neither planned nor likely to happen in the foreseeable future, and as a consequence of which are deemed quasi equity in nature and are therefore part of the Group’s net investment in its foreign operations. The Group does not hedge the translation exposure arising on the translation of the profits of foreign currency subsidiaries. The net currency gains and losses on transactional currency exposures are recognised in the Income Statement and the changes arising from fluctuations in the Euro value of the Group’s net investment in foreign operations are reported separately within Other Comprehensive Income. The currency profile of the Group and Company’s financial instruments subject to transactional exposure as at 29 February 2016 is as follows:-
Euro Sterling USD CAD/AUD Not at risk Total
Group €m €m €m €m €m €m
Cash & cash equivalents 4.6 2.8 0.7 2.8 186.4 197.3Trade receivables 1.8 1.0 0.2 0.5 66.1 69.6Advances to customers - - - - 53.0 53.0Interest bearing loans & borrowings - - - - (360.3) (360.3)Trade & other payables (0.7) (7.0) - (0.1) (153.1) (160.9)Provisions - - - - (18.9) (18.9)
Gross currency exposure 5.7 (3.2) 0.9 3.2 (226.8) (220.2)
The Group had no outstanding forward foreign currency contracts in place at 29 February 2016 (2015: €nil).
Sterling Not at risk Total
Company €m €m €m
Net amounts due to Group undertakings (24.6) (10.5) (35.1)Accruals - (0.5) (0.5)
Total (24.6) (11.0) (35.6)
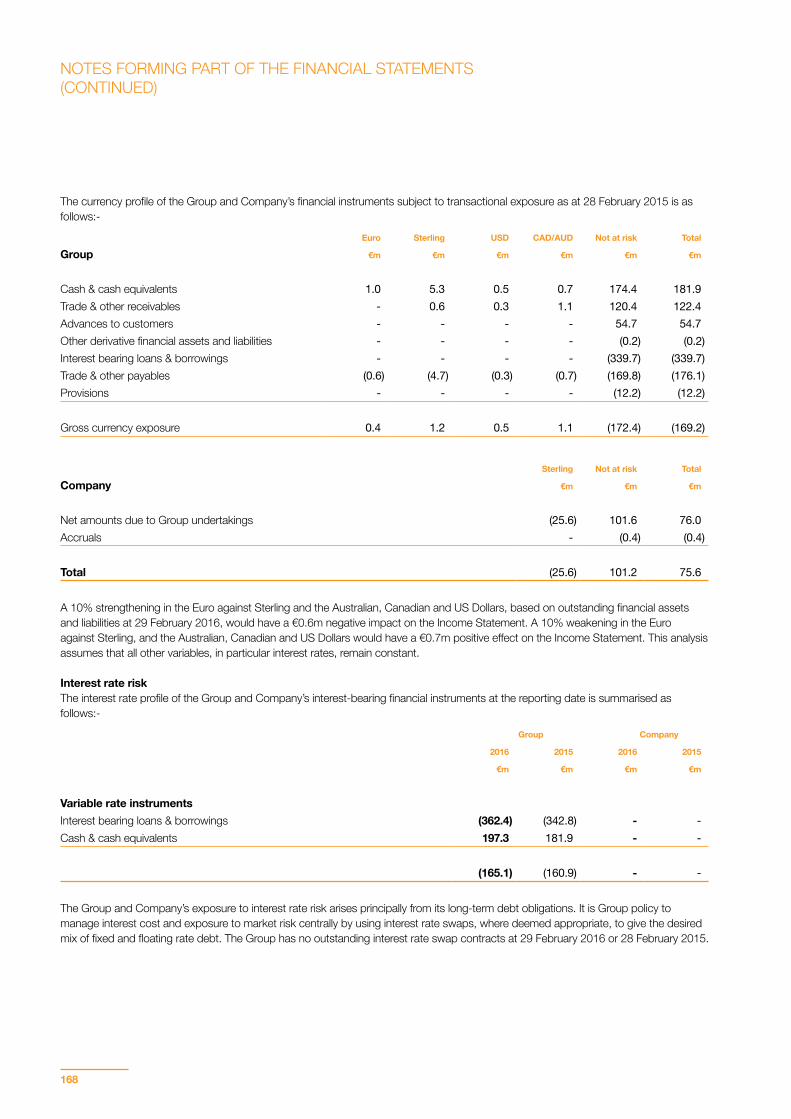
168
The currency profile of the Group and Company’s financial instruments subject to transactional exposure as at 28 February 2015 is as follows:-
Euro Sterling USD CAD/AUD Not at risk Total
Group €m €m €m €m €m €m
Cash & cash equivalents 1.0 5.3 0.5 0.7 174.4 181.9Trade & other receivables - 0.6 0.3 1.1 120.4 122.4Advances to customers - - - - 54.7 54.7Other derivative financial assets and liabilities - - - - (0.2) (0.2)Interest bearing loans & borrowings - - - - (339.7) (339.7)Trade & other payables (0.6) (4.7) (0.3) (0.7) (169.8) (176.1)Provisions - - - - (12.2) (12.2)
Gross currency exposure 0.4 1.2 0.5 1.1 (172.4) (169.2)
Sterling Not at risk Total
Company €m €m €m
Net amounts due to Group undertakings (25.6) 101.6 76.0Accruals - (0.4) (0.4)
Total (25.6) 101.2 75.6
A 10% strengthening in the Euro against Sterling and the Australian, Canadian and US Dollars, based on outstanding financial assets and liabilities at 29 February 2016, would have a €0.6m negative impact on the Income Statement. A 10% weakening in the Euro against Sterling, and the Australian, Canadian and US Dollars would have a €0.7m positive effect on the Income Statement. This analysis assumes that all other variables, in particular interest rates, remain constant.
Interest rate risk The interest rate profile of the Group and Company’s interest-bearing financial instruments at the reporting date is summarised as follows:-
Group Company
2016 2015 2016 2015
€m €m €m €m
Variable rate instrumentsInterest bearing loans & borrowings (362.4) (342.8) - -Cash & cash equivalents 197.3 181.9 - -
(165.1) (160.9) - -
The Group and Company’s exposure to interest rate risk arises principally from its long-term debt obligations. It is Group policy to manage interest cost and exposure to market risk centrally by using interest rate swaps, where deemed appropriate, to give the desired mix of fixed and floating rate debt. The Group has no outstanding interest rate swap contracts at 29 February 2016 or 28 February 2015.
NOTES FORMING PART OF THE FINANCIAL STATEMENTS(CONTINUED)
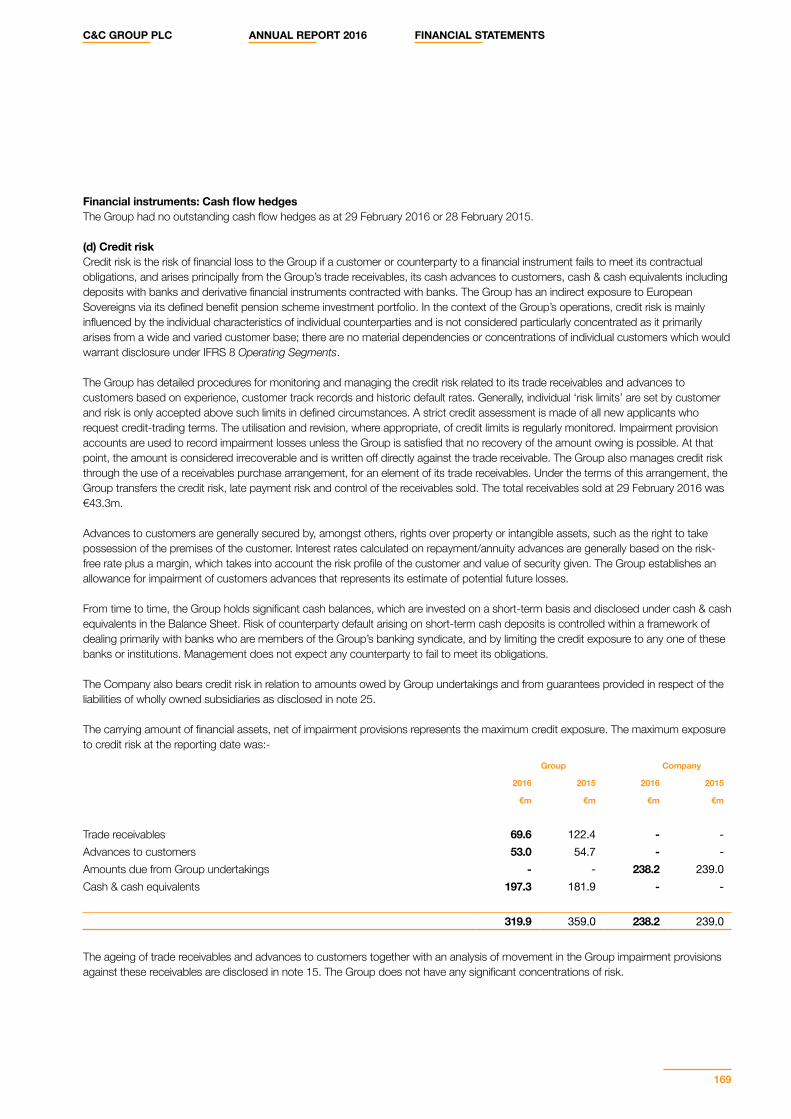
C&C GROUP PLC ANNUAL REPORT 2016 FINANCIAL STATEMENTS
169
Financial instruments: Cash flow hedges The Group had no outstanding cash flow hedges as at 29 February 2016 or 28 February 2015.
(d) Credit riskCredit risk is the risk of financial loss to the Group if a customer or counterparty to a financial instrument fails to meet its contractual obligations, and arises principally from the Group’s trade receivables, its cash advances to customers, cash & cash equivalents including deposits with banks and derivative financial instruments contracted with banks. The Group has an indirect exposure to European Sovereigns via its defined benefit pension scheme investment portfolio. In the context of the Group’s operations, credit risk is mainly influenced by the individual characteristics of individual counterparties and is not considered particularly concentrated as it primarily arises from a wide and varied customer base; there are no material dependencies or concentrations of individual customers which would warrant disclosure under IFRS 8 Operating Segments. The Group has detailed procedures for monitoring and managing the credit risk related to its trade receivables and advances to customers based on experience, customer track records and historic default rates. Generally, individual ‘risk limits’ are set by customer and risk is only accepted above such limits in defined circumstances. A strict credit assessment is made of all new applicants who request credit-trading terms. The utilisation and revision, where appropriate, of credit limits is regularly monitored. Impairment provision accounts are used to record impairment losses unless the Group is satisfied that no recovery of the amount owing is possible. At that point, the amount is considered irrecoverable and is written off directly against the trade receivable. The Group also manages credit risk through the use of a receivables purchase arrangement, for an element of its trade receivables. Under the terms of this arrangement, the Group transfers the credit risk, late payment risk and control of the receivables sold. The total receivables sold at 29 February 2016 was €43.3m.
Advances to customers are generally secured by, amongst others, rights over property or intangible assets, such as the right to take possession of the premises of the customer. Interest rates calculated on repayment/annuity advances are generally based on the risk-free rate plus a margin, which takes into account the risk profile of the customer and value of security given. The Group establishes an allowance for impairment of customers advances that represents its estimate of potential future losses. From time to time, the Group holds significant cash balances, which are invested on a short-term basis and disclosed under cash & cash equivalents in the Balance Sheet. Risk of counterparty default arising on short-term cash deposits is controlled within a framework of dealing primarily with banks who are members of the Group’s banking syndicate, and by limiting the credit exposure to any one of these banks or institutions. Management does not expect any counterparty to fail to meet its obligations. The Company also bears credit risk in relation to amounts owed by Group undertakings and from guarantees provided in respect of the liabilities of wholly owned subsidiaries as disclosed in note 25. The carrying amount of financial assets, net of impairment provisions represents the maximum credit exposure. The maximum exposure to credit risk at the reporting date was:-
Group Company
2016 2015 2016 2015
€m €m €m €m
Trade receivables 69.6 122.4 - -Advances to customers 53.0 54.7 - -Amounts due from Group undertakings - - 238.2 239.0Cash & cash equivalents 197.3 181.9 - -
319.9 359.0 238.2 239.0
The ageing of trade receivables and advances to customers together with an analysis of movement in the Group impairment provisions against these receivables are disclosed in note 15. The Group does not have any significant concentrations of risk.
170
(e) Liquidity riskLiquidity risk is the risk that the Group or Company will not be able to meet its financial obligations as they fall due. Liquid resources are defined as the total of cash & cash equivalents. The Group finances its operations through cash generated by the business and medium term bank credit facilities; the Group does not use off-balance sheet special purpose entities as a source of liquidity or financing. The Group’s policy is to ensure that sufficient resources are available either from cash balances, cash flows or committed bank facilities to meet all debt obligations as they fall due. To achieve this, the Group (a) maintains adequate cash or cash equivalent balances; (b) prepares detailed 3 year cash projections; and (c) keeps refinancing options under review. In addition, the Group maintains an overdraft facility that is unsecured. In December 2014, the Group updated and amended its committed €450m multi-currency five year syndicated revolving loan facility with seven banks, namely Bank of Ireland, Bank of Scotland, Barclays Bank, Danske Bank, HSBC, Rabobank, and Ulster Bank, repayable in a single instalment on 22 December 2019. The facility agreement provides for a further €100m in the form of an uncommitted accordion facility and permits the Group to avail of further financial indebtedness, excluding working capital and guarantee facilities, to a maximum value of €150m, subject to agreeing the terms and conditions with the lenders. Consequently the Group is permitted under the terms of the agreement, to have debt capacity of €700m of which €360.4m was drawn at 29 February 2016 (2015: €342.8m). The current five year multi-currency facility negotiated in February 2012 replaces the Group’s previous multi-currency facility which was due to mature in February 2017.
The Group’s debt facility incorporates two financial covenants:• Interest cover: The ratio of EBITDA to net interest for a period of 12 months ending on each half-year date will not be less than 3.5:1• Net debt/EBITDA: The ratio of net debt on each half-year date to EBITDA for a period of 12 months ending on a half-year date will not
exceed 3.5:1
Compliance with these debt covenants is monitored continuously.
During the current year, the group acquired debt following the acquisition of Thistle Pub Company Limited of £1.7m (€2.4m Euro equivalent at date of acquisition) of which £1.6m (€2.0m Euro equivalent at year end rate) remains outstanding at 29 February 2016 however this outstanding balance was repaid in full post year end. The Group’s main liquidity risk relates to maturing debt, however this risk is considered low at year end given the current facility extends to December 2019 as outlined above.
At the year end, the Group had net debt, net of unamortised issue costs, of €163.0m (28 February 2015: €157.8m), with a Net debt/EBITDA ratio of 1.3:1.
NOTES FORMING PART OF THE FINANCIAL STATEMENTS(CONTINUED)
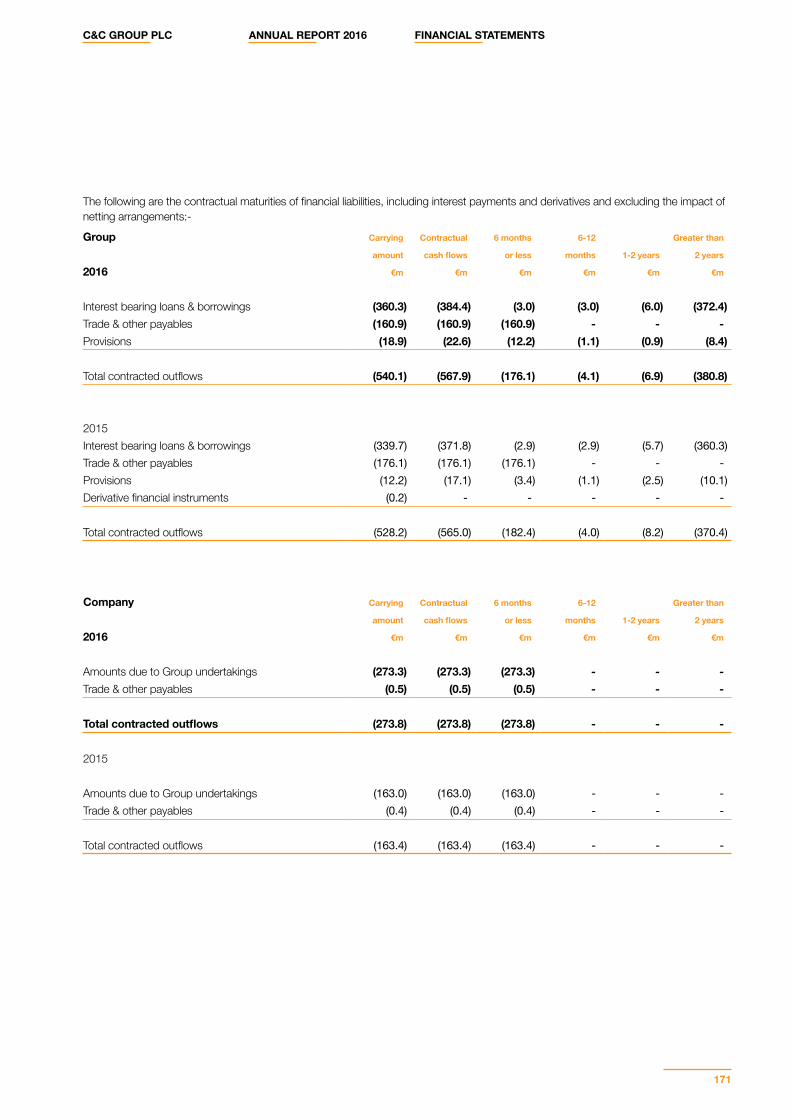
C&C GROUP PLC ANNUAL REPORT 2016 FINANCIAL STATEMENTS
171
The following are the contractual maturities of financial liabilities, including interest payments and derivatives and excluding the impact of netting arrangements:-
Group Carrying Contractual 6 months 6-12 Greater than
amount cash flows or less months 1-2 years 2 years
2016 €m €m €m €m €m €m
Interest bearing loans & borrowings (360.3) (384.4) (3.0) (3.0) (6.0) (372.4)Trade & other payables (160.9) (160.9) (160.9) - - -Provisions (18.9) (22.6) (12.2) (1.1) (0.9) (8.4)
Total contracted outflows (540.1) (567.9) (176.1) (4.1) (6.9) (380.8)
2015Interest bearing loans & borrowings (339.7) (371.8) (2.9) (2.9) (5.7) (360.3)Trade & other payables (176.1) (176.1) (176.1) - - -Provisions (12.2) (17.1) (3.4) (1.1) (2.5) (10.1)Derivative financial instruments (0.2) - - - - -
Total contracted outflows (528.2) (565.0) (182.4) (4.0) (8.2) (370.4)
Company Carrying Contractual 6 months 6-12 Greater than
amount cash flows or less months 1-2 years 2 years
2016 €m €m €m €m €m €m
Amounts due to Group undertakings (273.3) (273.3) (273.3) - - -Trade & other payables (0.5) (0.5) (0.5) - - -
Total contracted outflows (273.8) (273.8) (273.8) - - -
2015
Amounts due to Group undertakings (163.0) (163.0) (163.0) - - -Trade & other payables (0.4) (0.4) (0.4) - - -
Total contracted outflows (163.4) (163.4) (163.4) - - -
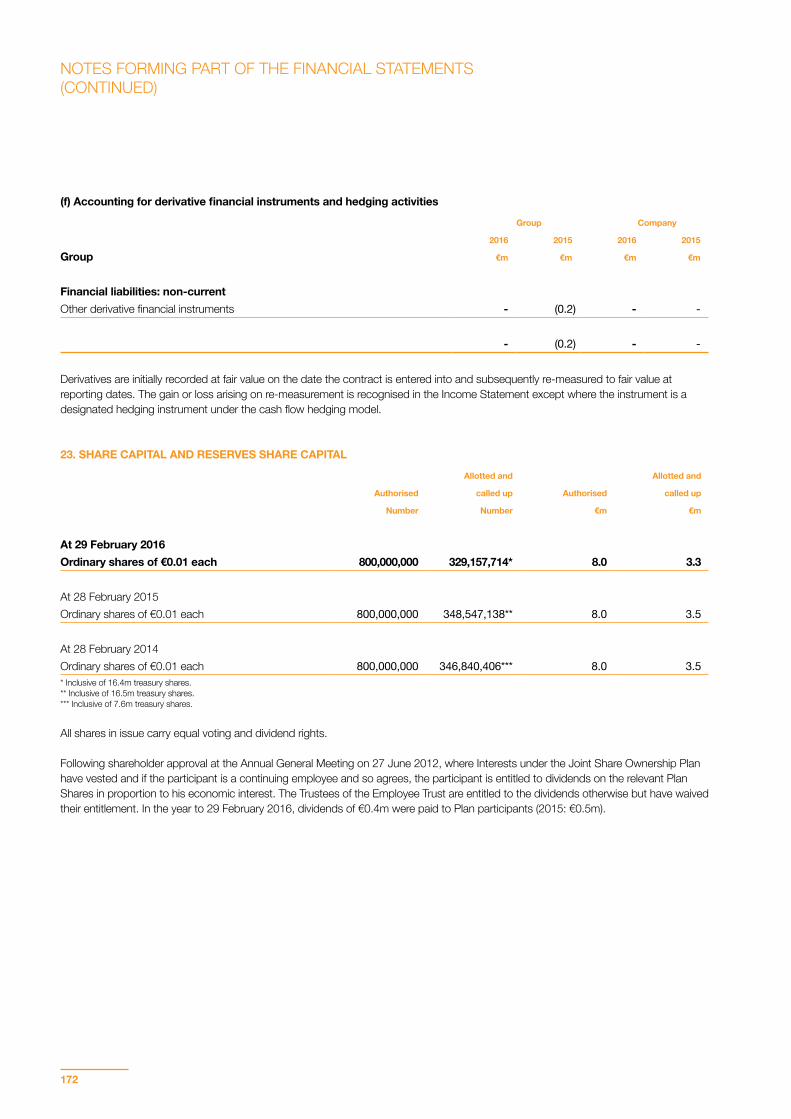
172
(f) Accounting for derivative financial instruments and hedging activities
Group Company
2016 2015 2016 2015
Group €m €m €m €m
Financial liabilities: non-currentOther derivative financial instruments - (0.2) - -
- (0.2) - -
Derivatives are initially recorded at fair value on the date the contract is entered into and subsequently re-measured to fair value at reporting dates. The gain or loss arising on re-measurement is recognised in the Income Statement except where the instrument is a designated hedging instrument under the cash flow hedging model.
23. SHARE CAPITAL AND RESERVES SHARE CAPITAL
Allotted and Allotted and
Authorised called up Authorised called up
Number Number €m €m
At 29 February 2016Ordinary shares of €0.01 each 800,000,000 329,157,714* 8.0 3.3
At 28 February 2015Ordinary shares of €0.01 each 800,000,000 348,547,138** 8.0 3.5
At 28 February 2014Ordinary shares of €0.01 each 800,000,000 346,840,406*** 8.0 3.5* Inclusive of 16.4m treasury shares.** Inclusive of 16.5m treasury shares. *** Inclusive of 7.6m treasury shares.
All shares in issue carry equal voting and dividend rights. Following shareholder approval at the Annual General Meeting on 27 June 2012, where Interests under the Joint Share Ownership Plan have vested and if the participant is a continuing employee and so agrees, the participant is entitled to dividends on the relevant Plan Shares in proportion to his economic interest. The Trustees of the Employee Trust are entitled to the dividends otherwise but have waived their entitlement. In the year to 29 February 2016, dividends of €0.4m were paid to Plan participants (2015: €0.5m).
NOTES FORMING PART OF THE FINANCIAL STATEMENTS(CONTINUED)
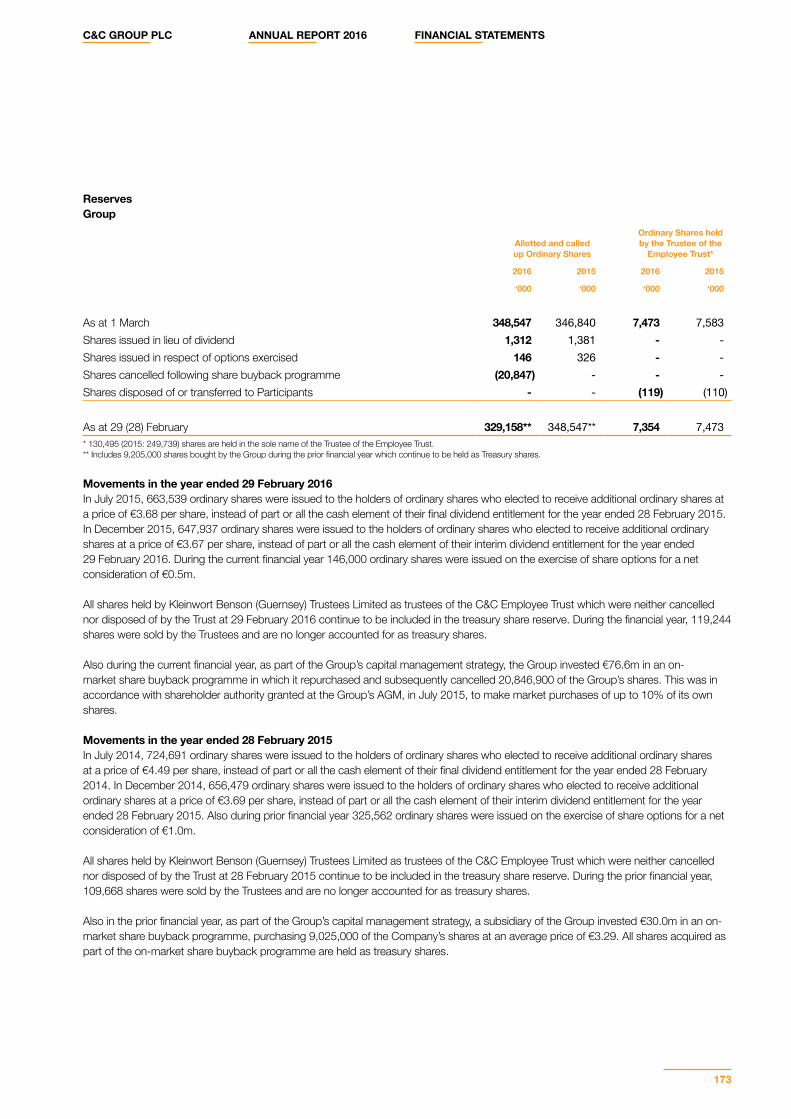
C&C GROUP PLC ANNUAL REPORT 2016 FINANCIAL STATEMENTS
173
ReservesGroup
Allotted and called up Ordinary Shares
Ordinary Shares held by the Trustee of the
Employee Trust*
2016 2015 2016 2015
‘000 ‘000 ‘000 ‘000
As at 1 March 348,547 346,840 7,473 7,583Shares issued in lieu of dividend 1,312 1,381 - -Shares issued in respect of options exercised 146 326 - -Shares cancelled following share buyback programme (20,847) - - -Shares disposed of or transferred to Participants - - (119) (110)
As at 29 (28) February 329,158** 348,547** 7,354 7,473* 130,495 (2015: 249,739) shares are held in the sole name of the Trustee of the Employee Trust. ** Includes 9,205,000 shares bought by the Group during the prior financial year which continue to be held as Treasury shares.
Movements in the year ended 29 February 2016 In July 2015, 663,539 ordinary shares were issued to the holders of ordinary shares who elected to receive additional ordinary shares at a price of €3.68 per share, instead of part or all the cash element of their final dividend entitlement for the year ended 28 February 2015. In December 2015, 647,937 ordinary shares were issued to the holders of ordinary shares who elected to receive additional ordinary shares at a price of €3.67 per share, instead of part or all the cash element of their interim dividend entitlement for the year ended 29 February 2016. During the current financial year 146,000 ordinary shares were issued on the exercise of share options for a net consideration of €0.5m. All shares held by Kleinwort Benson (Guernsey) Trustees Limited as trustees of the C&C Employee Trust which were neither cancelled nor disposed of by the Trust at 29 February 2016 continue to be included in the treasury share reserve. During the financial year, 119,244 shares were sold by the Trustees and are no longer accounted for as treasury shares.
Also during the current financial year, as part of the Group’s capital management strategy, the Group invested €76.6m in an on-market share buyback programme in which it repurchased and subsequently cancelled 20,846,900 of the Group’s shares. This was in accordance with shareholder authority granted at the Group’s AGM, in July 2015, to make market purchases of up to 10% of its own shares.
Movements in the year ended 28 February 2015 In July 2014, 724,691 ordinary shares were issued to the holders of ordinary shares who elected to receive additional ordinary shares at a price of €4.49 per share, instead of part or all the cash element of their final dividend entitlement for the year ended 28 February 2014. In December 2014, 656,479 ordinary shares were issued to the holders of ordinary shares who elected to receive additional ordinary shares at a price of €3.69 per share, instead of part or all the cash element of their interim dividend entitlement for the year ended 28 February 2015. Also during prior financial year 325,562 ordinary shares were issued on the exercise of share options for a net consideration of €1.0m. All shares held by Kleinwort Benson (Guernsey) Trustees Limited as trustees of the C&C Employee Trust which were neither cancelled nor disposed of by the Trust at 28 February 2015 continue to be included in the treasury share reserve. During the prior financial year, 109,668 shares were sold by the Trustees and are no longer accounted for as treasury shares.
Also in the prior financial year, as part of the Group’s capital management strategy, a subsidiary of the Group invested €30.0m in an on-market share buyback programme, purchasing 9,025,000 of the Company’s shares at an average price of €3.29. All shares acquired as part of the on-market share buyback programme are held as treasury shares.
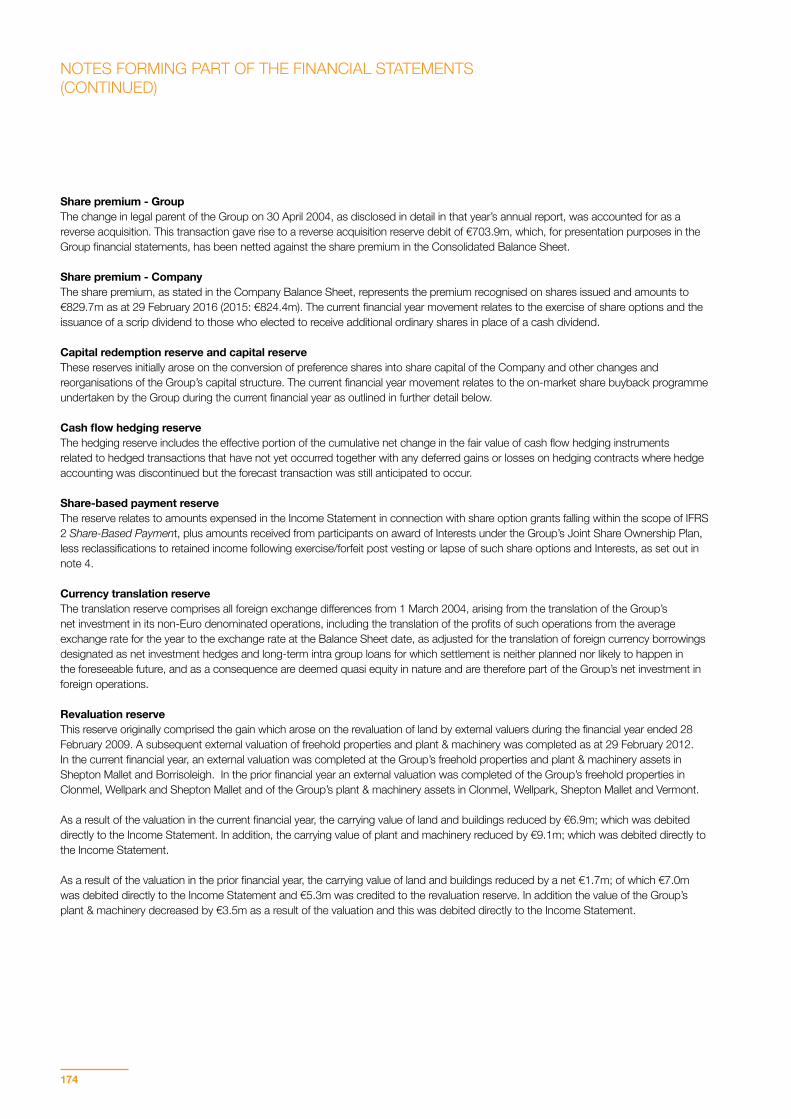
174
Share premium - GroupThe change in legal parent of the Group on 30 April 2004, as disclosed in detail in that year’s annual report, was accounted for as a reverse acquisition. This transaction gave rise to a reverse acquisition reserve debit of €703.9m, which, for presentation purposes in the Group financial statements, has been netted against the share premium in the Consolidated Balance Sheet.
Share premium - CompanyThe share premium, as stated in the Company Balance Sheet, represents the premium recognised on shares issued and amounts to €829.7m as at 29 February 2016 (2015: €824.4m). The current financial year movement relates to the exercise of share options and the issuance of a scrip dividend to those who elected to receive additional ordinary shares in place of a cash dividend.
Capital redemption reserve and capital reserveThese reserves initially arose on the conversion of preference shares into share capital of the Company and other changes and reorganisations of the Group’s capital structure. The current financial year movement relates to the on-market share buyback programme undertaken by the Group during the current financial year as outlined in further detail below.
Cash flow hedging reserveThe hedging reserve includes the effective portion of the cumulative net change in the fair value of cash flow hedging instruments related to hedged transactions that have not yet occurred together with any deferred gains or losses on hedging contracts where hedge accounting was discontinued but the forecast transaction was still anticipated to occur.
Share-based payment reserveThe reserve relates to amounts expensed in the Income Statement in connection with share option grants falling within the scope of IFRS 2 Share-Based Payment, plus amounts received from participants on award of Interests under the Group’s Joint Share Ownership Plan, less reclassifications to retained income following exercise/forfeit post vesting or lapse of such share options and Interests, as set out in note 4.
Currency translation reserve The translation reserve comprises all foreign exchange differences from 1 March 2004, arising from the translation of the Group’s net investment in its non-Euro denominated operations, including the translation of the profits of such operations from the average exchange rate for the year to the exchange rate at the Balance Sheet date, as adjusted for the translation of foreign currency borrowings designated as net investment hedges and long-term intra group loans for which settlement is neither planned nor likely to happen in the foreseeable future, and as a consequence are deemed quasi equity in nature and are therefore part of the Group’s net investment in foreign operations.
Revaluation reserveThis reserve originally comprised the gain which arose on the revaluation of land by external valuers during the financial year ended 28 February 2009. A subsequent external valuation of freehold properties and plant & machinery was completed as at 29 February 2012. In the current financial year, an external valuation was completed at the Group’s freehold properties and plant & machinery assets in Shepton Mallet and Borrisoleigh. In the prior financial year an external valuation was completed of the Group’s freehold properties in Clonmel, Wellpark and Shepton Mallet and of the Group’s plant & machinery assets in Clonmel, Wellpark, Shepton Mallet and Vermont.
As a result of the valuation in the current financial year, the carrying value of land and buildings reduced by €6.9m; which was debited directly to the Income Statement. In addition, the carrying value of plant and machinery reduced by €9.1m; which was debited directly to the Income Statement.
As a result of the valuation in the prior financial year, the carrying value of land and buildings reduced by a net €1.7m; of which €7.0m was debited directly to the Income Statement and €5.3m was credited to the revaluation reserve. In addition the value of the Group’s plant & machinery decreased by €3.5m as a result of the valuation and this was debited directly to the Income Statement.
NOTES FORMING PART OF THE FINANCIAL STATEMENTS(CONTINUED)
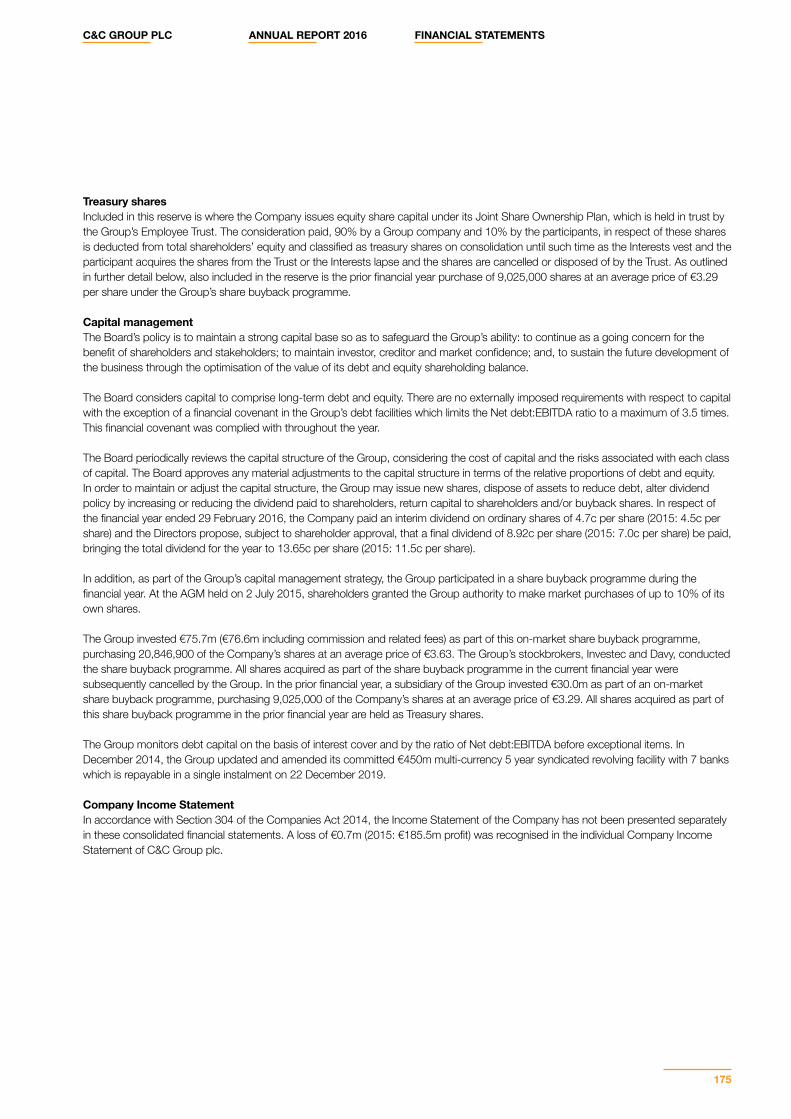
C&C GROUP PLC ANNUAL REPORT 2016 FINANCIAL STATEMENTS
175
Treasury sharesIncluded in this reserve is where the Company issues equity share capital under its Joint Share Ownership Plan, which is held in trust by the Group’s Employee Trust. The consideration paid, 90% by a Group company and 10% by the participants, in respect of these shares is deducted from total shareholders’ equity and classified as treasury shares on consolidation until such time as the Interests vest and the participant acquires the shares from the Trust or the Interests lapse and the shares are cancelled or disposed of by the Trust. As outlined in further detail below, also included in the reserve is the prior financial year purchase of 9,025,000 shares at an average price of €3.29 per share under the Group’s share buyback programme.
Capital managementThe Board’s policy is to maintain a strong capital base so as to safeguard the Group’s ability: to continue as a going concern for the benefit of shareholders and stakeholders; to maintain investor, creditor and market confidence; and, to sustain the future development of the business through the optimisation of the value of its debt and equity shareholding balance. The Board considers capital to comprise long-term debt and equity. There are no externally imposed requirements with respect to capital with the exception of a financial covenant in the Group’s debt facilities which limits the Net debt:EBITDA ratio to a maximum of 3.5 times. This financial covenant was complied with throughout the year. The Board periodically reviews the capital structure of the Group, considering the cost of capital and the risks associated with each class of capital. The Board approves any material adjustments to the capital structure in terms of the relative proportions of debt and equity. In order to maintain or adjust the capital structure, the Group may issue new shares, dispose of assets to reduce debt, alter dividend policy by increasing or reducing the dividend paid to shareholders, return capital to shareholders and/or buyback shares. In respect of the financial year ended 29 February 2016, the Company paid an interim dividend on ordinary shares of 4.7c per share (2015: 4.5c per share) and the Directors propose, subject to shareholder approval, that a final dividend of 8.92c per share (2015: 7.0c per share) be paid, bringing the total dividend for the year to 13.65c per share (2015: 11.5c per share).
In addition, as part of the Group’s capital management strategy, the Group participated in a share buyback programme during the financial year. At the AGM held on 2 July 2015, shareholders granted the Group authority to make market purchases of up to 10% of its own shares.
The Group invested €75.7m (€76.6m including commission and related fees) as part of this on-market share buyback programme, purchasing 20,846,900 of the Company’s shares at an average price of €3.63. The Group’s stockbrokers, Investec and Davy, conducted the share buyback programme. All shares acquired as part of the share buyback programme in the current financial year were subsequently cancelled by the Group. In the prior financial year, a subsidiary of the Group invested €30.0m as part of an on-market share buyback programme, purchasing 9,025,000 of the Company’s shares at an average price of €3.29. All shares acquired as part of this share buyback programme in the prior financial year are held as Treasury shares. The Group monitors debt capital on the basis of interest cover and by the ratio of Net debt:EBITDA before exceptional items. In December 2014, the Group updated and amended its committed €450m multi-currency 5 year syndicated revolving facility with 7 banks which is repayable in a single instalment on 22 December 2019.
Company Income StatementIn accordance with Section 304 of the Companies Act 2014, the Income Statement of the Company has not been presented separately in these consolidated financial statements. A loss of €0.7m (2015: €185.5m profit) was recognised in the individual Company Income Statement of C&C Group plc.
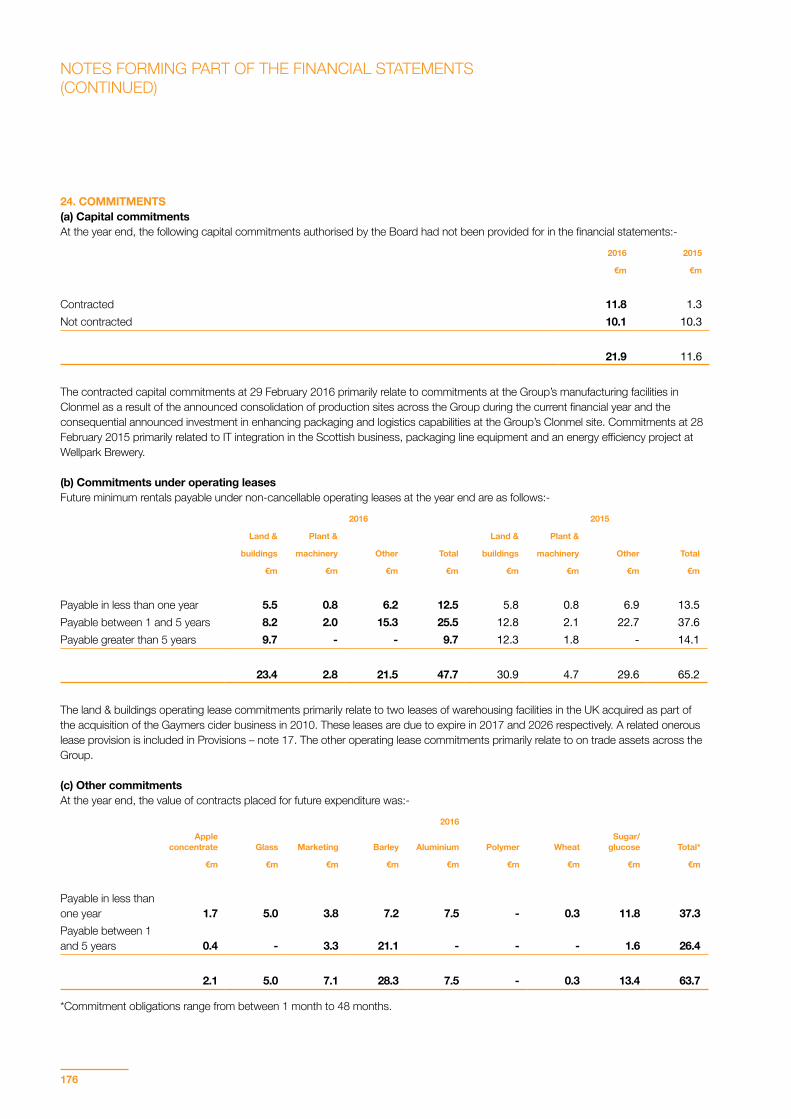
176
24. COMMITMENTS(a) Capital commitmentsAt the year end, the following capital commitments authorised by the Board had not been provided for in the financial statements:-
2016 2015
€m €m
Contracted 11.8 1.3Not contracted 10.1 10.3
21.9 11.6
The contracted capital commitments at 29 February 2016 primarily relate to commitments at the Group’s manufacturing facilities in Clonmel as a result of the announced consolidation of production sites across the Group during the current financial year and the consequential announced investment in enhancing packaging and logistics capabilities at the Group’s Clonmel site. Commitments at 28 February 2015 primarily related to IT integration in the Scottish business, packaging line equipment and an energy efficiency project at Wellpark Brewery.
(b) Commitments under operating leasesFuture minimum rentals payable under non-cancellable operating leases at the year end are as follows:-
2016 2015
Land & Plant & Land & Plant &
buildings machinery Other Total buildings machinery Other Total
€m €m €m €m €m €m €m €m
Payable in less than one year 5.5 0.8 6.2 12.5 5.8 0.8 6.9 13.5Payable between 1 and 5 years 8.2 2.0 15.3 25.5 12.8 2.1 22.7 37.6Payable greater than 5 years 9.7 - - 9.7 12.3 1.8 - 14.1
23.4 2.8 21.5 47.7 30.9 4.7 29.6 65.2
The land & buildings operating lease commitments primarily relate to two leases of warehousing facilities in the UK acquired as part of the acquisition of the Gaymers cider business in 2010. These leases are due to expire in 2017 and 2026 respectively. A related onerous lease provision is included in Provisions – note 17. The other operating lease commitments primarily relate to on trade assets across the Group.
(c) Other commitmentsAt the year end, the value of contracts placed for future expenditure was:-
2016Apple
concentrate Glass Marketing Barley Aluminium Polymer WheatSugar/
glucose Total*
€m €m €m €m €m €m €m €m €m
Payable in less than one year 1.7 5.0 3.8 7.2 7.5 - 0.3 11.8 37.3Payable between 1 and 5 years 0.4 - 3.3 21.1 - - - 1.6 26.4
2.1 5.0 7.1 28.3 7.5 - 0.3 13.4 63.7
*Commitment obligations range from between 1 month to 48 months.
NOTES FORMING PART OF THE FINANCIAL STATEMENTS(CONTINUED)
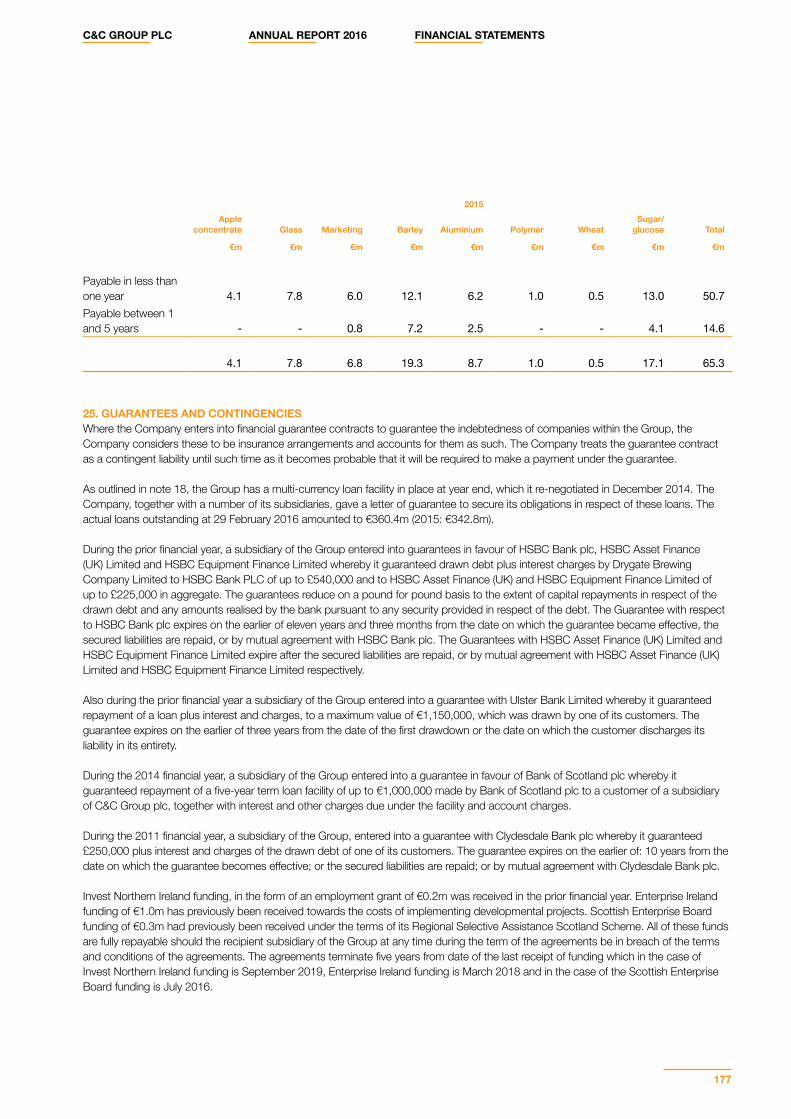
C&C GROUP PLC ANNUAL REPORT 2016 FINANCIAL STATEMENTS
177
2015Apple
concentrate Glass Marketing Barley Aluminium Polymer WheatSugar/
glucose Total
€m €m €m €m €m €m €m €m €m
Payable in less than one year 4.1 7.8 6.0 12.1 6.2 1.0 0.5 13.0 50.7Payable between 1 and 5 years - - 0.8 7.2 2.5 - - 4.1 14.6
4.1 7.8 6.8 19.3 8.7 1.0 0.5 17.1 65.3
25. GUARANTEES AND CONTINGENCIESWhere the Company enters into financial guarantee contracts to guarantee the indebtedness of companies within the Group, the Company considers these to be insurance arrangements and accounts for them as such. The Company treats the guarantee contract as a contingent liability until such time as it becomes probable that it will be required to make a payment under the guarantee.
As outlined in note 18, the Group has a multi-currency loan facility in place at year end, which it re-negotiated in December 2014. The Company, together with a number of its subsidiaries, gave a letter of guarantee to secure its obligations in respect of these loans. The actual loans outstanding at 29 February 2016 amounted to €360.4m (2015: €342.8m).
During the prior financial year, a subsidiary of the Group entered into guarantees in favour of HSBC Bank plc, HSBC Asset Finance (UK) Limited and HSBC Equipment Finance Limited whereby it guaranteed drawn debt plus interest charges by Drygate Brewing Company Limited to HSBC Bank PLC of up to £540,000 and to HSBC Asset Finance (UK) and HSBC Equipment Finance Limited of up to £225,000 in aggregate. The guarantees reduce on a pound for pound basis to the extent of capital repayments in respect of the drawn debt and any amounts realised by the bank pursuant to any security provided in respect of the debt. The Guarantee with respect to HSBC Bank plc expires on the earlier of eleven years and three months from the date on which the guarantee became effective, the secured liabilities are repaid, or by mutual agreement with HSBC Bank plc. The Guarantees with HSBC Asset Finance (UK) Limited and HSBC Equipment Finance Limited expire after the secured liabilities are repaid, or by mutual agreement with HSBC Asset Finance (UK) Limited and HSBC Equipment Finance Limited respectively.
Also during the prior financial year a subsidiary of the Group entered into a guarantee with Ulster Bank Limited whereby it guaranteed repayment of a loan plus interest and charges, to a maximum value of €1,150,000, which was drawn by one of its customers. The guarantee expires on the earlier of three years from the date of the first drawdown or the date on which the customer discharges its liability in its entirety.
During the 2014 financial year, a subsidiary of the Group entered into a guarantee in favour of Bank of Scotland plc whereby it guaranteed repayment of a five-year term loan facility of up to €1,000,000 made by Bank of Scotland plc to a customer of a subsidiary of C&C Group plc, together with interest and other charges due under the facility and account charges.
During the 2011 financial year, a subsidiary of the Group, entered into a guarantee with Clydesdale Bank plc whereby it guaranteed £250,000 plus interest and charges of the drawn debt of one of its customers. The guarantee expires on the earlier of: 10 years from the date on which the guarantee becomes effective; or the secured liabilities are repaid; or by mutual agreement with Clydesdale Bank plc.
Invest Northern Ireland funding, in the form of an employment grant of €0.2m was received in the prior financial year. Enterprise Ireland funding of €1.0m has previously been received towards the costs of implementing developmental projects. Scottish Enterprise Board funding of €0.3m had previously been received under the terms of its Regional Selective Assistance Scotland Scheme. All of these funds are fully repayable should the recipient subsidiary of the Group at any time during the term of the agreements be in breach of the terms and conditions of the agreements. The agreements terminate five years from date of the last receipt of funding which in the case of Invest Northern Ireland funding is September 2019, Enterprise Ireland funding is March 2018 and in the case of the Scottish Enterprise Board funding is July 2016.
178
Under the terms of the Sale and Purchase Agreements with respect to the disposal of the wines and spirits distribution businesses in the year ended to 28 February 2009, the Group had a maximum exposure of €9.6m with respect to the Republic of Ireland business and £1.9m with respect to the Northern Ireland business in relation to warranties undertaken. The time limit for all claims with respect to these warranties expired on 13 June 2010 and 26 August 2010 respectively, except for any claim relating to tax in Northern Ireland where the time limit is seven years from the transaction date and therefore this expired in February 2016. Under the terms of the Sale and Purchase Agreement with respect to disposal of the Group’s Northern Ireland wholesaling business in the year ended 29 February 2012, the Group has a maximum aggregate exposure of £4.3m in relation to warranties. The time limit for notification of all claims with respect to these warranties expired on 3 February 2013, with the exception of any claim relating to tax where the time limit is seven years from the transaction date and is due to expire on 3 August 2018. Pursuant to the provisions of Section 357 of the Companies Act 2014, the Company has guaranteed the liabilities of certain of its subsidiary undertakings incorporated in the Republic of Ireland for the financial year to 29 February 2016 and as a result such subsidiaries are exempt from certain filing provisions.
26. RELATED PARTY TRANSACTIONS The principal related party relationships requiring disclosure in the consolidated financial statements of the Group under IAS 24 Related Party Disclosures pertain to the existence of subsidiary undertakings and equity accounted investees, transactions entered into by the Group with these subsidiary undertakings and equity accounted investees and the identification and compensation of and transactions with key management personnel.
(a) GroupTransactions Transactions between the Group and its related parties are made on terms equivalent to those that prevail in arm’s length transactions.
Subsidiary undertakingsThe consolidated financial statements include the financial statements of the Company and its subsidiaries. A listing of all subsidiaries is provided in note 27. Sales to and purchases from subsidiary undertakings, together with outstanding payables and receivables, are eliminated in the preparation of the consolidated financial statements in accordance with IFRS 10 Consolidated Financial Statements.
Equity accounted investeesOn 28 November 2012, the Group acquired an equity investment in Thistle Pub Company Limited, a joint venture with Maclay Group plc. The Group subsequently acquired the remaining equity share capital of the Thistle Pub Company Limited business in the current financial year on 3 August 2015. The Group therefore accounts for Thistle Pub Company Limited as a related party from date of the initial equity investment, on 28 November 2012, to date of deemed disposal of this initial investment and subsequent acquisition of 100% Thistle Pub Company Limited on 3 August 2015.
On 22 March 2013, the Group acquired 50% of the equity share capital of Wallaces Express Limited, a wholesaler of beverages in Scotland. The Group subsequently acquired the remaining 50% equity share capital of Wallaces Express Limited on 18 March 2014. The Group accounted for Wallaces Express Limited as a related party in the prior financial year from date of the initial 50% investment, on 22 March 2013, to date of deemed disposal of this investment and subsequent acquisition of Wallaces Express Limited on 18 March 2014.
A subsidiary of the Group holds a 33% investment in Shanter Inns Limited with which the Group trades. Transactions between the Group and Shanter Inns are disclosed below.
On 21 March 2012, the Group acquired a 25% equity investment in Maclay Group plc. The Maclay Group plc went into administration during the prior financial year and the Group consequently impaired its investment in this entity, however the Group continues to trade with Maclay Inns Limited (in administration), a 100% owned subsidiary of the Maclay Group plc (in administration) and continues to account for it as a related party.
During the prior financial year, the Group entered into a joint venture arrangement with Heather Ale Limited, run by the Williams brothers who are recognised as leading family craft brewers in Scotland, to form a new entity Drygate Brewing Company Limited. The joint venture, which is run independently of the joint venture partners existing businesses, operates a craft brewing and retail facility adjacent to Wellpark brewery.
NOTES FORMING PART OF THE FINANCIAL STATEMENTS(CONTINUED)
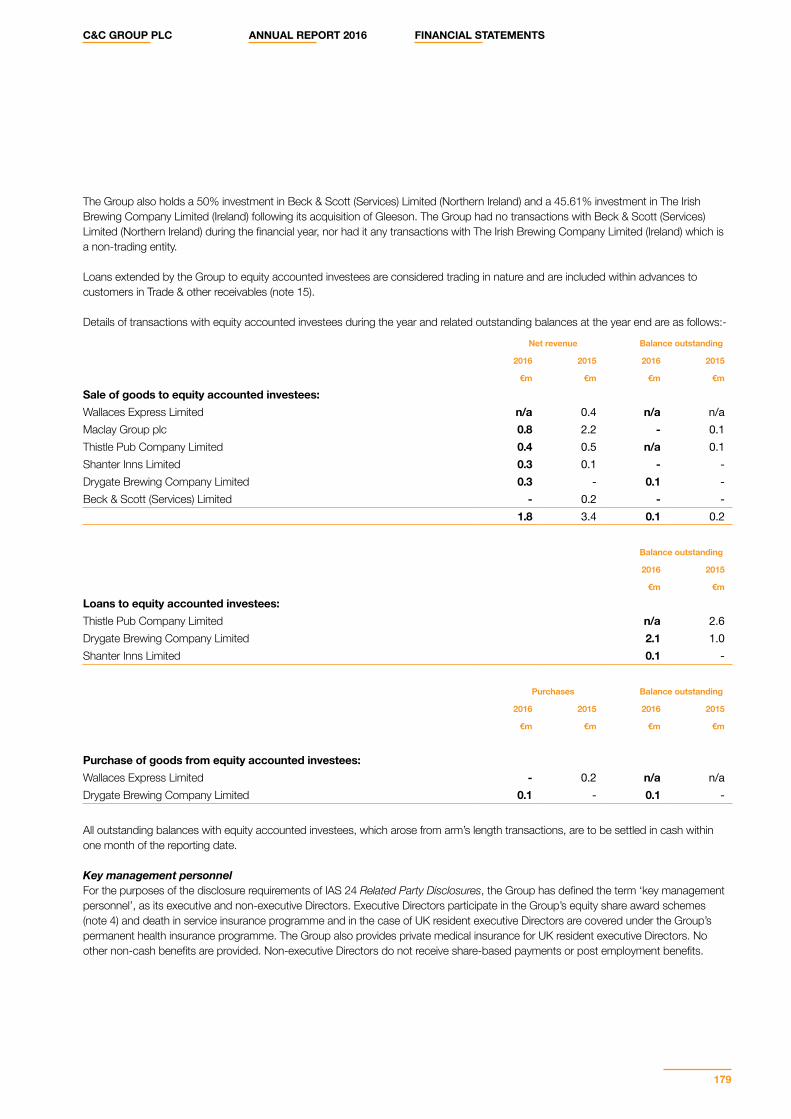
C&C GROUP PLC ANNUAL REPORT 2016 FINANCIAL STATEMENTS
179
The Group also holds a 50% investment in Beck & Scott (Services) Limited (Northern Ireland) and a 45.61% investment in The Irish Brewing Company Limited (Ireland) following its acquisition of Gleeson. The Group had no transactions with Beck & Scott (Services) Limited (Northern Ireland) during the financial year, nor had it any transactions with The Irish Brewing Company Limited (Ireland) which is a non-trading entity.
Loans extended by the Group to equity accounted investees are considered trading in nature and are included within advances to customers in Trade & other receivables (note 15).
Details of transactions with equity accounted investees during the year and related outstanding balances at the year end are as follows:-
Net revenue Balance outstanding
2016 2015 2016 2015
€m €m €m €m
Sale of goods to equity accounted investees:Wallaces Express Limited n/a 0.4 n/a n/aMaclay Group plc 0.8 2.2 - 0.1Thistle Pub Company Limited 0.4 0.5 n/a 0.1Shanter Inns Limited 0.3 0.1 - -Drygate Brewing Company Limited 0.3 - 0.1 -Beck & Scott (Services) Limited - 0.2 - - 1.8 3.4 0.1 0.2
Balance outstanding
2016 2015
€m €m
Loans to equity accounted investees:Thistle Pub Company Limited n/a 2.6Drygate Brewing Company Limited 2.1 1.0Shanter Inns Limited 0.1 -
Purchases Balance outstanding
2016 2015 2016 2015
€m €m €m €m
Purchase of goods from equity accounted investees:Wallaces Express Limited - 0.2 n/a n/aDrygate Brewing Company Limited 0.1 - 0.1 - All outstanding balances with equity accounted investees, which arose from arm’s length transactions, are to be settled in cash within one month of the reporting date.
Key management personnel For the purposes of the disclosure requirements of IAS 24 Related Party Disclosures, the Group has defined the term ‘key management personnel’, as its executive and non-executive Directors. Executive Directors participate in the Group’s equity share award schemes (note 4) and death in service insurance programme and in the case of UK resident executive Directors are covered under the Group’s permanent health insurance programme. The Group also provides private medical insurance for UK resident executive Directors. No other non-cash benefits are provided. Non-executive Directors do not receive share-based payments or post employment benefits.
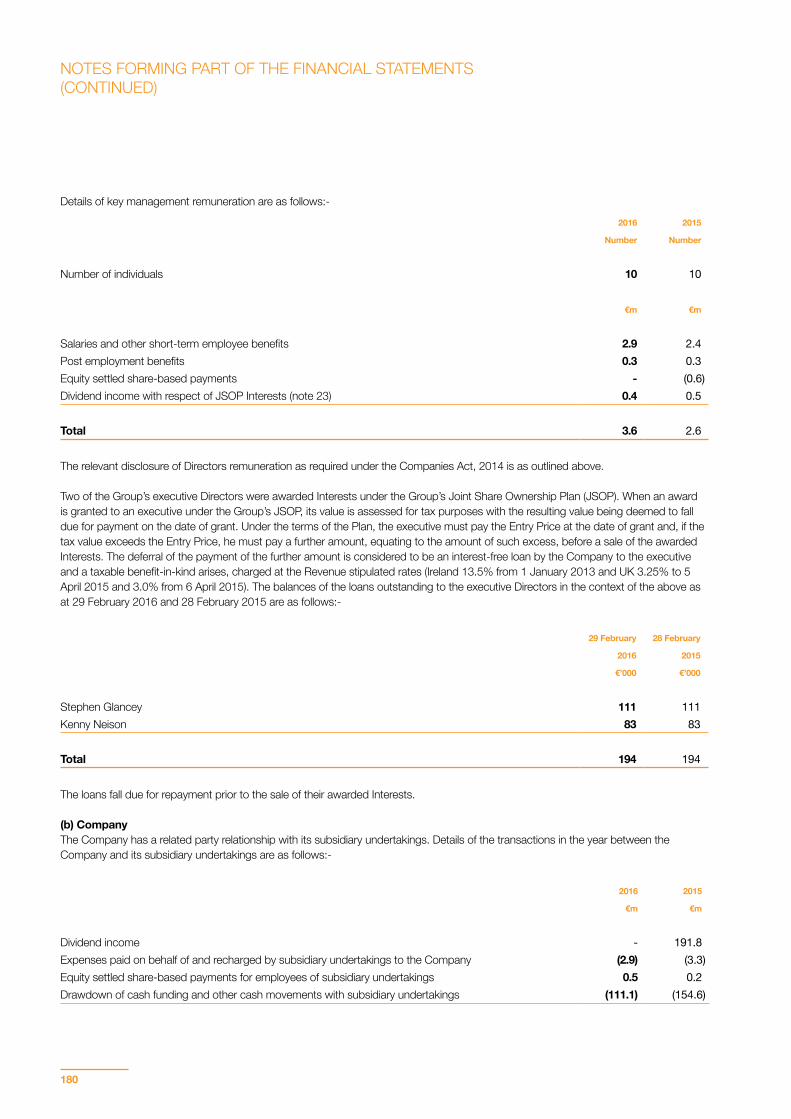
180
Details of key management remuneration are as follows:-
2016 2015
Number Number
Number of individuals 10 10
€m €m
Salaries and other short-term employee benefits 2.9 2.4Post employment benefits 0.3 0.3Equity settled share-based payments - (0.6)Dividend income with respect of JSOP Interests (note 23) 0.4 0.5
Total 3.6 2.6
The relevant disclosure of Directors remuneration as required under the Companies Act, 2014 is as outlined above. Two of the Group’s executive Directors were awarded Interests under the Group’s Joint Share Ownership Plan (JSOP). When an award is granted to an executive under the Group’s JSOP, its value is assessed for tax purposes with the resulting value being deemed to fall due for payment on the date of grant. Under the terms of the Plan, the executive must pay the Entry Price at the date of grant and, if the tax value exceeds the Entry Price, he must pay a further amount, equating to the amount of such excess, before a sale of the awarded Interests. The deferral of the payment of the further amount is considered to be an interest-free loan by the Company to the executive and a taxable benefit-in-kind arises, charged at the Revenue stipulated rates (Ireland 13.5% from 1 January 2013 and UK 3.25% to 5 April 2015 and 3.0% from 6 April 2015). The balances of the loans outstanding to the executive Directors in the context of the above as at 29 February 2016 and 28 February 2015 are as follows:-
29 February 28 February
2016 2015
€’000 €’000
Stephen Glancey 111 111Kenny Neison 83 83
Total 194 194
The loans fall due for repayment prior to the sale of their awarded Interests.
(b) CompanyThe Company has a related party relationship with its subsidiary undertakings. Details of the transactions in the year between the Company and its subsidiary undertakings are as follows:-
2016 2015
€m €m
Dividend income - 191.8Expenses paid on behalf of and recharged by subsidiary undertakings to the Company (2.9) (3.3)Equity settled share-based payments for employees of subsidiary undertakings 0.5 0.2Drawdown of cash funding and other cash movements with subsidiary undertakings (111.1) (154.6)
NOTES FORMING PART OF THE FINANCIAL STATEMENTS(CONTINUED)
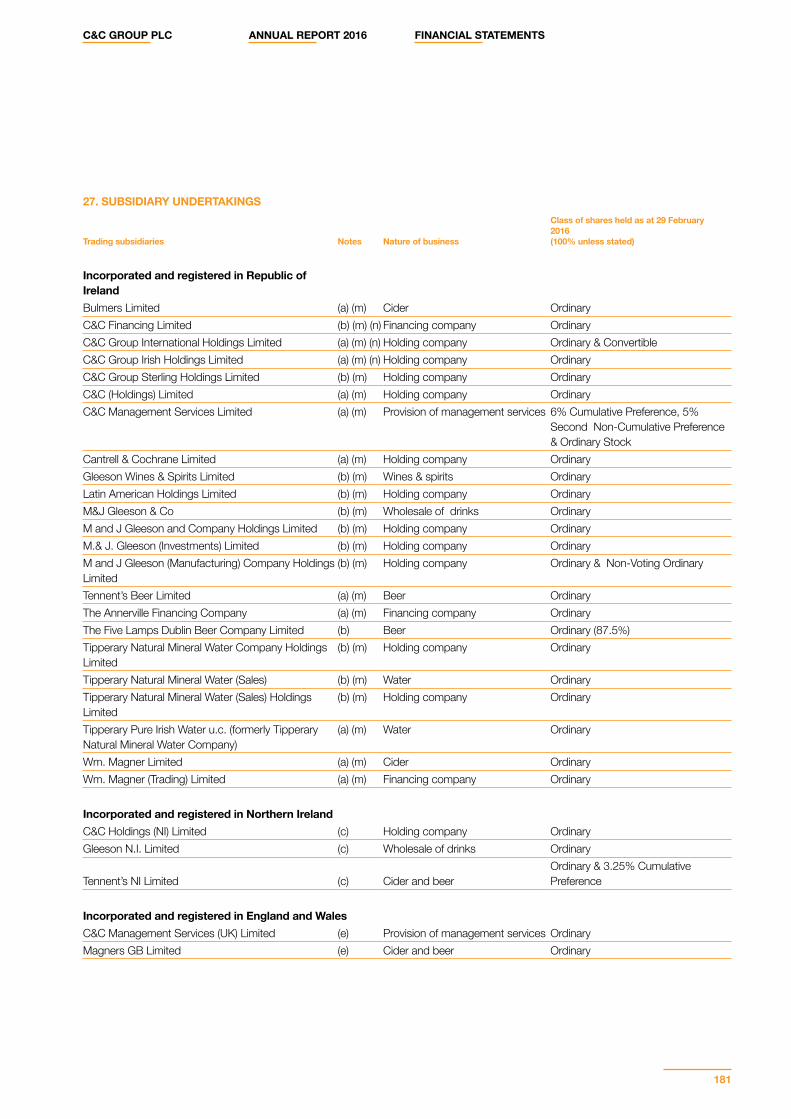
C&C GROUP PLC ANNUAL REPORT 2016 FINANCIAL STATEMENTS
181
27. SUBSIDIARY UNDERTAKINGS
Trading subsidiaries Notes Nature of business
Class of shares held as at 29 February 2016(100% unless stated)
Incorporated and registered in Republic of IrelandBulmers Limited (a) (m) Cider OrdinaryC&C Financing Limited (b) (m) (n) Financing company OrdinaryC&C Group International Holdings Limited (a) (m) (n) Holding company Ordinary & Convertible C&C Group Irish Holdings Limited (a) (m) (n) Holding company OrdinaryC&C Group Sterling Holdings Limited (b) (m) Holding company OrdinaryC&C (Holdings) Limited (a) (m) Holding company OrdinaryC&C Management Services Limited (a) (m) Provision of management services 6% Cumulative Preference, 5%
Second Non-Cumulative Preference & Ordinary Stock
Cantrell & Cochrane Limited (a) (m) Holding company OrdinaryGleeson Wines & Spirits Limited (b) (m) Wines & spirits OrdinaryLatin American Holdings Limited (b) (m) Holding company OrdinaryM&J Gleeson & Co (b) (m) Wholesale of drinks OrdinaryM and J Gleeson and Company Holdings Limited (b) (m) Holding company OrdinaryM.& J. Gleeson (Investments) Limited (b) (m) Holding company OrdinaryM and J Gleeson (Manufacturing) Company Holdings Limited
(b) (m) Holding company Ordinary & Non-Voting Ordinary
Tennent’s Beer Limited (a) (m) Beer OrdinaryThe Annerville Financing Company (a) (m) Financing company OrdinaryThe Five Lamps Dublin Beer Company Limited (b) Beer Ordinary (87.5%)Tipperary Natural Mineral Water Company Holdings Limited
(b) (m) Holding company Ordinary
Tipperary Natural Mineral Water (Sales) (b) (m) Water OrdinaryTipperary Natural Mineral Water (Sales) Holdings Limited
(b) (m) Holding company Ordinary
Tipperary Pure Irish Water u.c. (formerly Tipperary Natural Mineral Water Company)
(a) (m) Water Ordinary
Wm. Magner Limited (a) (m) Cider OrdinaryWm. Magner (Trading) Limited (a) (m) Financing company Ordinary
Incorporated and registered in Northern IrelandC&C Holdings (NI) Limited (c) Holding company OrdinaryGleeson N.I. Limited (c) Wholesale of drinks Ordinary
Tennent’s NI Limited (c) Cider and beer Ordinary & 3.25% Cumulative Preference
Incorporated and registered in England and WalesC&C Management Services (UK) Limited (e) Provision of management services OrdinaryMagners GB Limited (e) Cider and beer Ordinary
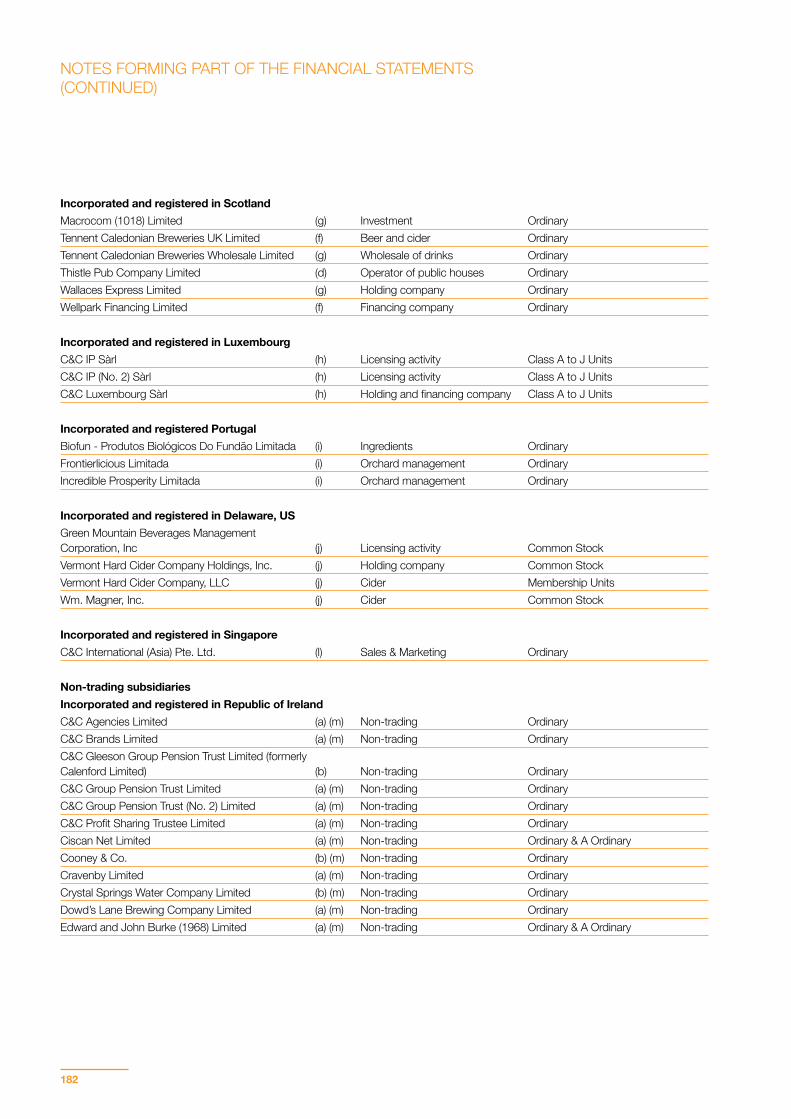
182
Incorporated and registered in ScotlandMacrocom (1018) Limited (g) Investment Ordinary Tennent Caledonian Breweries UK Limited (f) Beer and cider OrdinaryTennent Caledonian Breweries Wholesale Limited (g) Wholesale of drinks OrdinaryThistle Pub Company Limited (d) Operator of public houses Ordinary Wallaces Express Limited (g) Holding company OrdinaryWellpark Financing Limited (f) Financing company Ordinary
Incorporated and registered in LuxembourgC&C IP Sàrl (h) Licensing activity Class A to J UnitsC&C IP (No. 2) Sàrl (h) Licensing activity Class A to J UnitsC&C Luxembourg Sàrl (h) Holding and financing company Class A to J Units
Incorporated and registered PortugalBiofun - Produtos Biológicos Do Fundão Limitada (i) Ingredients OrdinaryFrontierlicious Limitada (i) Orchard management OrdinaryIncredible Prosperity Limitada (i) Orchard management Ordinary
Incorporated and registered in Delaware, US Green Mountain Beverages Management Corporation, Inc (j) Licensing activity Common StockVermont Hard Cider Company Holdings, Inc. (j) Holding company Common StockVermont Hard Cider Company, LLC (j) Cider Membership UnitsWm. Magner, Inc. (j) Cider Common Stock
Incorporated and registered in SingaporeC&C International (Asia) Pte. Ltd. (l) Sales & Marketing Ordinary
Non-trading subsidiariesIncorporated and registered in Republic of IrelandC&C Agencies Limited (a) (m) Non-trading OrdinaryC&C Brands Limited (a) (m) Non-trading OrdinaryC&C Gleeson Group Pension Trust Limited (formerly Calenford Limited) (b) Non-trading OrdinaryC&C Group Pension Trust Limited (a) (m) Non-trading OrdinaryC&C Group Pension Trust (No. 2) Limited (a) (m) Non-trading OrdinaryC&C Profit Sharing Trustee Limited (a) (m) Non-trading OrdinaryCiscan Net Limited (a) (m) Non-trading Ordinary & A OrdinaryCooney & Co. (b) (m) Non-trading OrdinaryCravenby Limited (a) (m) Non-trading OrdinaryCrystal Springs Water Company Limited (b) (m) Non-trading OrdinaryDowd’s Lane Brewing Company Limited (a) (m) Non-trading OrdinaryEdward and John Burke (1968) Limited (a) (m) Non-trading Ordinary & A Ordinary
NOTES FORMING PART OF THE FINANCIAL STATEMENTS(CONTINUED)
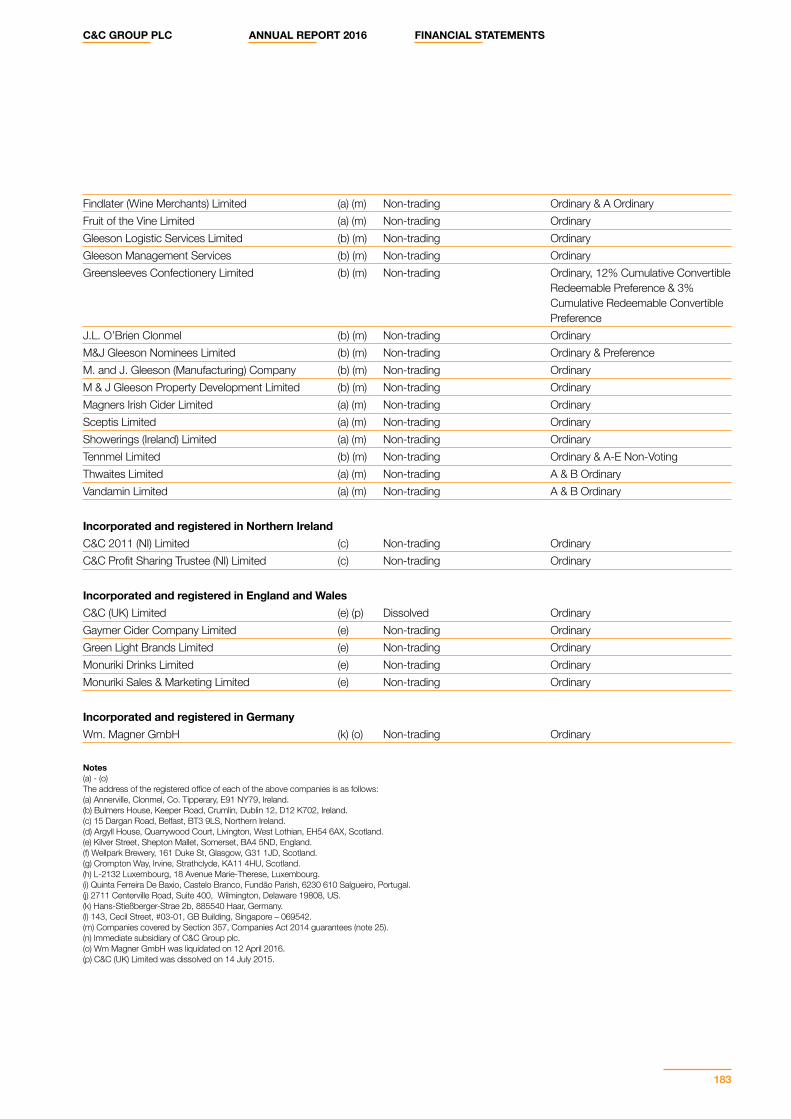
C&C GROUP PLC ANNUAL REPORT 2016 FINANCIAL STATEMENTS
183
Findlater (Wine Merchants) Limited (a) (m) Non-trading Ordinary & A OrdinaryFruit of the Vine Limited (a) (m) Non-trading OrdinaryGleeson Logistic Services Limited (b) (m) Non-trading OrdinaryGleeson Management Services (b) (m) Non-trading OrdinaryGreensleeves Confectionery Limited (b) (m) Non-trading Ordinary, 12% Cumulative Convertible
Redeemable Preference & 3% Cumulative Redeemable Convertible Preference
J.L. O’Brien Clonmel (b) (m) Non-trading OrdinaryM&J Gleeson Nominees Limited (b) (m) Non-trading Ordinary & PreferenceM. and J. Gleeson (Manufacturing) Company (b) (m) Non-trading Ordinary M & J Gleeson Property Development Limited (b) (m) Non-trading OrdinaryMagners Irish Cider Limited (a) (m) Non-trading OrdinarySceptis Limited (a) (m) Non-trading OrdinaryShowerings (Ireland) Limited (a) (m) Non-trading OrdinaryTennmel Limited (b) (m) Non-trading Ordinary & A-E Non-VotingThwaites Limited (a) (m) Non-trading A & B OrdinaryVandamin Limited (a) (m) Non-trading A & B Ordinary
Incorporated and registered in Northern IrelandC&C 2011 (NI) Limited (c) Non-trading OrdinaryC&C Profit Sharing Trustee (NI) Limited (c) Non-trading Ordinary
Incorporated and registered in England and WalesC&C (UK) Limited (e) (p) Dissolved OrdinaryGaymer Cider Company Limited (e) Non-trading OrdinaryGreen Light Brands Limited (e) Non-trading Ordinary Monuriki Drinks Limited (e) Non-trading OrdinaryMonuriki Sales & Marketing Limited (e) Non-trading Ordinary
Incorporated and registered in GermanyWm. Magner GmbH (k) (o) Non-trading Ordinary
Notes(a) - (o) The address of the registered office of each of the above companies is as follows:(a) Annerville, Clonmel, Co. Tipperary, E91 NY79, Ireland.(b) Bulmers House, Keeper Road, Crumlin, Dublin 12, D12 K702, Ireland.(c) 15 Dargan Road, Belfast, BT3 9LS, Northern Ireland. (d) Argyll House, Quarrywood Court, Livington, West Lothian, EH54 6AX, Scotland.(e) Kilver Street, Shepton Mallet, Somerset, BA4 5ND, England.(f) Wellpark Brewery, 161 Duke St, Glasgow, G31 1JD, Scotland.(g) Crompton Way, Irvine, Strathclyde, KA11 4HU, Scotland. (h) L-2132 Luxembourg, 18 Avenue Marie-Therese, Luxembourg.(i) Quinta Ferreira De Baxio, Castelo Branco, Fundão Parish, 6230 610 Salgueiro, Portugal.(j) 2711 Centerville Road, Suite 400, Wilmington, Delaware 19808, US.(k) Hans-Stießberger-Strae 2b, 885540 Haar, Germany.(l) 143, Cecil Street, #03-01, GB Building, Singapore – 069542. (m) Companies covered by Section 357, Companies Act 2014 guarantees (note 25). (n) Immediate subsidiary of C&C Group plc.(o) Wm Magner GmbH was liquidated on 12 April 2016.(p) C&C (UK) Limited was dissolved on 14 July 2015.

184
Equity accounted investees
Company Name Nature of business Class of shares and % held
Beck & Scott (Services) Limited (Northern Ireland) (a) Wholesale of drinks Ordinary, 50%Drygate Brewing Company Limited (Scotland) (b) Brewing B Ordinary, 49%Maclay Group plc (Scotland) (c) Operator of managed public houses B Ordinary & B Preference, 25%The Irish Brewing Company Limited (Ireland) (d) Non-trading Ordinary, 45.61%Shanter Inns Limited (e) Public houses Ordinary, 33%(a) - (e) The address of the registered office of each of the above equity accounted investees is as follows:(a) Unit 1, Ravenhill Business Park, Ravenhill Road, Belfast, BT6 8AW, Northern Ireland. (b) 85 Drygate, Glasgow, G4 0UT, Scotland.(c) G1 Building, 5 George Square, Glasgow, G2 1DY, Scotland.(d) Bulmers House, Keeper Road, Crumlin, Dublin 12, D12 K702, Ireland.(e) 230 High Street, Ayr, KA7 1RQ, Scotland.
28. POST BALANCE SHEET EVENTSNo significant events affecting the Group have occurred since the year end which would require disclosed in or amendment of the financial statements.
29. APPROVAL OF FINANCIAL STATEMENTSThese financial statements were approved by the Directors on 11 May 2016.
NOTES FORMING PART OF THE FINANCIAL STATEMENTS(CONTINUED)
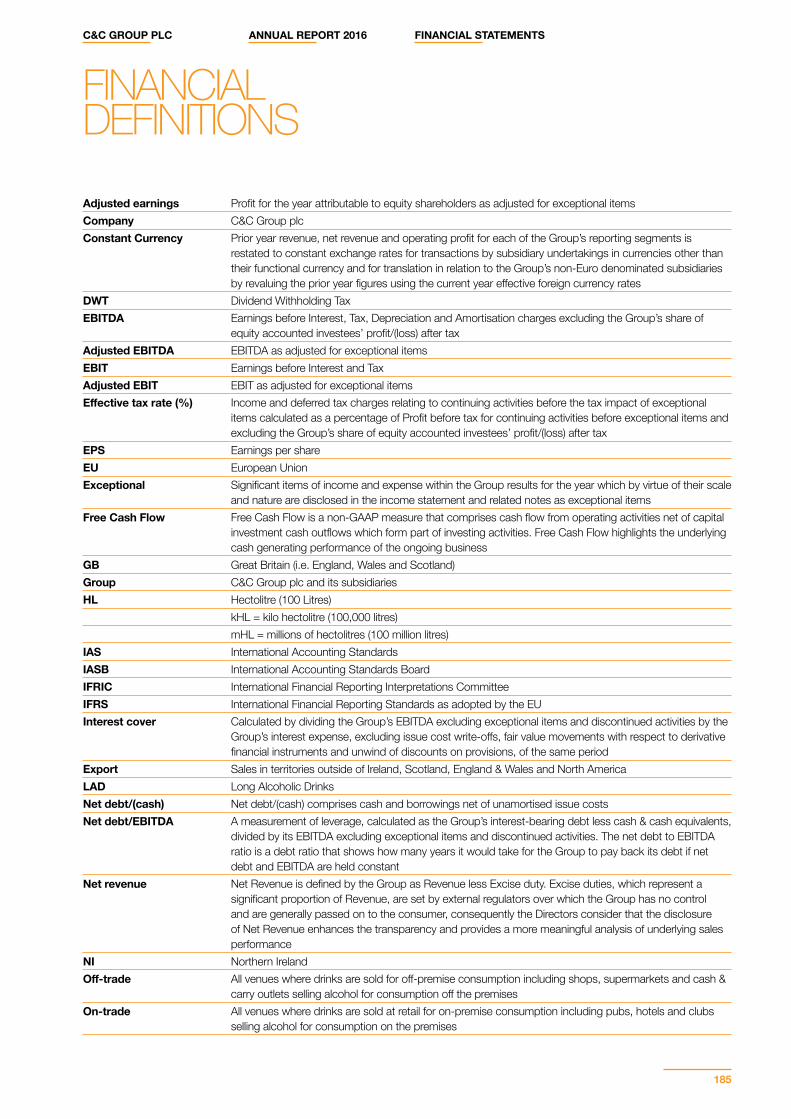
C&C GROUP PLC ANNUAL REPORT 2016 FINANCIAL STATEMENTS
185
Adjusted earnings Profit for the year attributable to equity shareholders as adjusted for exceptional itemsCompany C&C Group plcConstant Currency Prior year revenue, net revenue and operating profit for each of the Group’s reporting segments is
restated to constant exchange rates for transactions by subsidiary undertakings in currencies other than their functional currency and for translation in relation to the Group’s non-Euro denominated subsidiaries by revaluing the prior year figures using the current year effective foreign currency rates
DWT Dividend Withholding TaxEBITDA Earnings before Interest, Tax, Depreciation and Amortisation charges excluding the Group’s share of
equity accounted investees’ profit/(loss) after taxAdjusted EBITDA EBITDA as adjusted for exceptional itemsEBIT Earnings before Interest and TaxAdjusted EBIT EBIT as adjusted for exceptional itemsEffective tax rate (%) Income and deferred tax charges relating to continuing activities before the tax impact of exceptional
items calculated as a percentage of Profit before tax for continuing activities before exceptional items and excluding the Group’s share of equity accounted investees’ profit/(loss) after tax
EPS Earnings per shareEU European UnionExceptional Significant items of income and expense within the Group results for the year which by virtue of their scale
and nature are disclosed in the income statement and related notes as exceptional itemsFree Cash Flow Free Cash Flow is a non-GAAP measure that comprises cash flow from operating activities net of capital
investment cash outflows which form part of investing activities. Free Cash Flow highlights the underlying cash generating performance of the ongoing business
GB Great Britain (i.e. England, Wales and Scotland)Group C&C Group plc and its subsidiariesHL Hectolitre (100 Litres)
kHL = kilo hectolitre (100,000 litres) mHL = millions of hectolitres (100 million litres)
IAS International Accounting StandardsIASB International Accounting Standards BoardIFRIC International Financial Reporting Interpretations CommitteeIFRS International Financial Reporting Standards as adopted by the EUInterest cover Calculated by dividing the Group’s EBITDA excluding exceptional items and discontinued activities by the
Group’s interest expense, excluding issue cost write-offs, fair value movements with respect to derivative financial instruments and unwind of discounts on provisions, of the same period
Export Sales in territories outside of Ireland, Scotland, England & Wales and North AmericaLAD Long Alcoholic Drinks Net debt/(cash) Net debt/(cash) comprises cash and borrowings net of unamortised issue costsNet debt/EBITDA A measurement of leverage, calculated as the Group’s interest-bearing debt less cash & cash equivalents,
divided by its EBITDA excluding exceptional items and discontinued activities. The net debt to EBITDA ratio is a debt ratio that shows how many years it would take for the Group to pay back its debt if net debt and EBITDA are held constant
Net revenue Net Revenue is defined by the Group as Revenue less Excise duty. Excise duties, which represent a significant proportion of Revenue, are set by external regulators over which the Group has no control and are generally passed on to the consumer, consequently the Directors consider that the disclosure of Net Revenue enhances the transparency and provides a more meaningful analysis of underlying sales performance
NI Northern IrelandOff-trade All venues where drinks are sold for off-premise consumption including shops, supermarkets and cash &
carry outlets selling alcohol for consumption off the premisesOn-trade All venues where drinks are sold at retail for on-premise consumption including pubs, hotels and clubs
selling alcohol for consumption on the premises
FINANCIAL DEFINITIONS
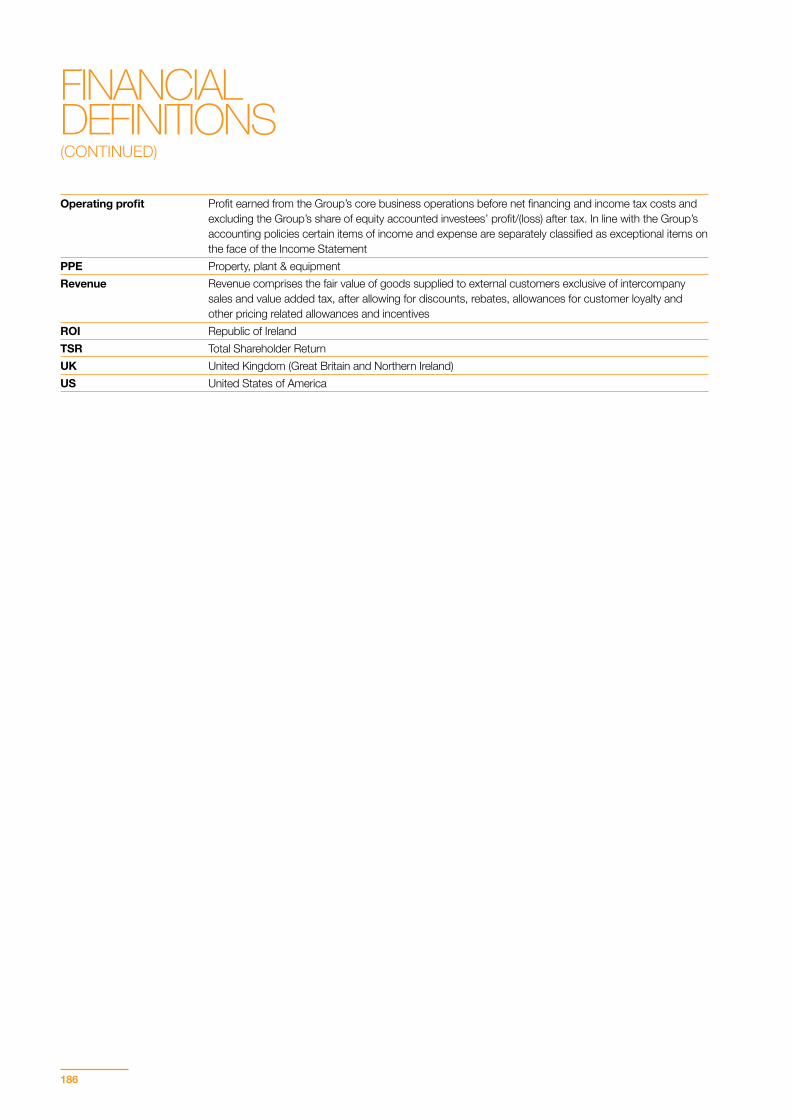
186
Operating profit Profit earned from the Group’s core business operations before net financing and income tax costs and excluding the Group’s share of equity accounted investees’ profit/(loss) after tax. In line with the Group’s accounting policies certain items of income and expense are separately classified as exceptional items on the face of the Income Statement
PPE Property, plant & equipmentRevenue Revenue comprises the fair value of goods supplied to external customers exclusive of intercompany
sales and value added tax, after allowing for discounts, rebates, allowances for customer loyalty and other pricing related allowances and incentives
ROI Republic of IrelandTSR Total Shareholder ReturnUK United Kingdom (Great Britain and Northern Ireland)US United States of America
FINANCIAL DEFINITIONS(CONTINUED)
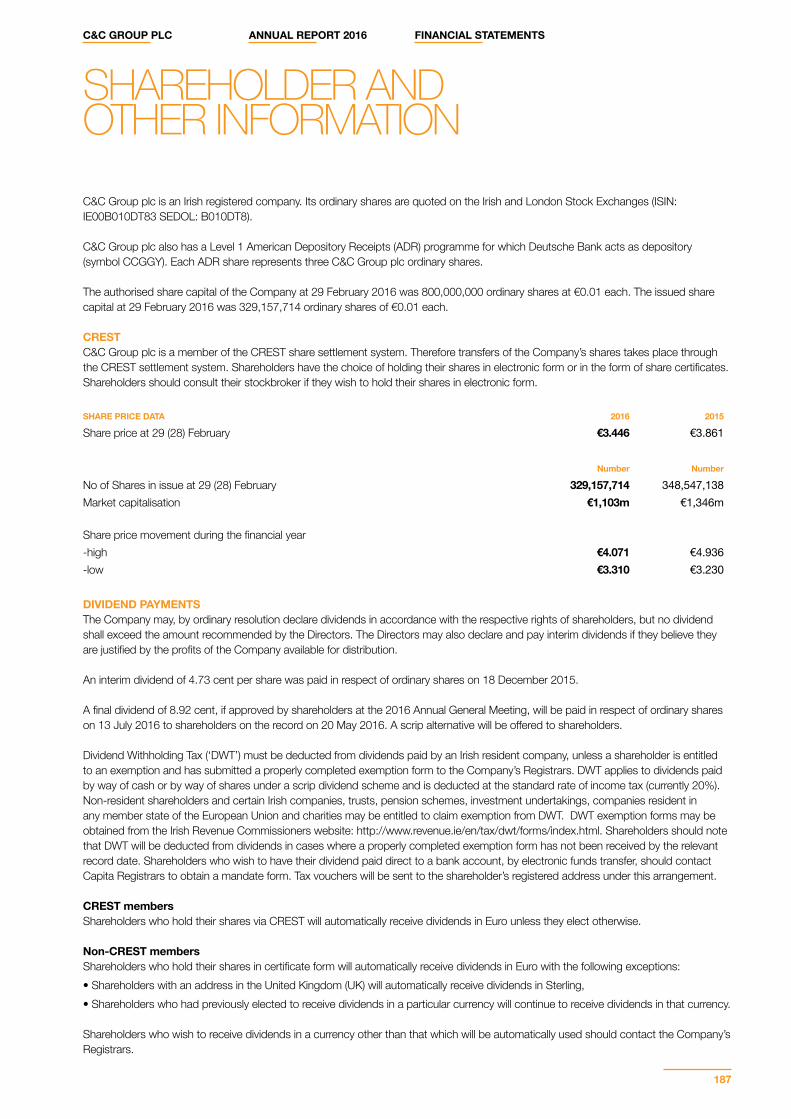
C&C GROUP PLC ANNUAL REPORT 2016 FINANCIAL STATEMENTS
187
C&C Group plc is an Irish registered company. Its ordinary shares are quoted on the Irish and London Stock Exchanges (ISIN: IE00B010DT83 SEDOL: B010DT8).
C&C Group plc also has a Level 1 American Depository Receipts (ADR) programme for which Deutsche Bank acts as depository (symbol CCGGY). Each ADR share represents three C&C Group plc ordinary shares.
The authorised share capital of the Company at 29 February 2016 was 800,000,000 ordinary shares at €0.01 each. The issued share capital at 29 February 2016 was 329,157,714 ordinary shares of €0.01 each.
CRESTC&C Group plc is a member of the CREST share settlement system. Therefore transfers of the Company’s shares takes place through the CREST settlement system. Shareholders have the choice of holding their shares in electronic form or in the form of share certificates. Shareholders should consult their stockbroker if they wish to hold their shares in electronic form.
SHARE PRICE DATA 2016 2015
Share price at 29 (28) February €3.446 €3.861
Number Number
No of Shares in issue at 29 (28) February 329,157,714 348,547,138Market capitalisation €1,103m €1,346m
Share price movement during the financial year-high €4.071 €4.936-low €3.310 €3.230
DIVIDEND PAYMENTSThe Company may, by ordinary resolution declare dividends in accordance with the respective rights of shareholders, but no dividend shall exceed the amount recommended by the Directors. The Directors may also declare and pay interim dividends if they believe they are justified by the profits of the Company available for distribution.
An interim dividend of 4.73 cent per share was paid in respect of ordinary shares on 18 December 2015.
A final dividend of 8.92 cent, if approved by shareholders at the 2016 Annual General Meeting, will be paid in respect of ordinary shares on 13 July 2016 to shareholders on the record on 20 May 2016. A scrip alternative will be offered to shareholders.
Dividend Withholding Tax (‘DWT’) must be deducted from dividends paid by an Irish resident company, unless a shareholder is entitled to an exemption and has submitted a properly completed exemption form to the Company’s Registrars. DWT applies to dividends paid by way of cash or by way of shares under a scrip dividend scheme and is deducted at the standard rate of income tax (currently 20%). Non-resident shareholders and certain Irish companies, trusts, pension schemes, investment undertakings, companies resident in any member state of the European Union and charities may be entitled to claim exemption from DWT. DWT exemption forms may be obtained from the Irish Revenue Commissioners website: http://www.revenue.ie/en/tax/dwt/forms/index.html. Shareholders should note that DWT will be deducted from dividends in cases where a properly completed exemption form has not been received by the relevant record date. Shareholders who wish to have their dividend paid direct to a bank account, by electronic funds transfer, should contact Capita Registrars to obtain a mandate form. Tax vouchers will be sent to the shareholder’s registered address under this arrangement.
CREST membersShareholders who hold their shares via CREST will automatically receive dividends in Euro unless they elect otherwise.
Non-CREST membersShareholders who hold their shares in certificate form will automatically receive dividends in Euro with the following exceptions:• Shareholders with an address in the United Kingdom (UK) will automatically receive dividends in Sterling,• Shareholders who had previously elected to receive dividends in a particular currency will continue to receive dividends in that currency. Shareholders who wish to receive dividends in a currency other than that which will be automatically used should contact the Company’s Registrars.
SHAREHOLDER AND OTHER INFORMATION
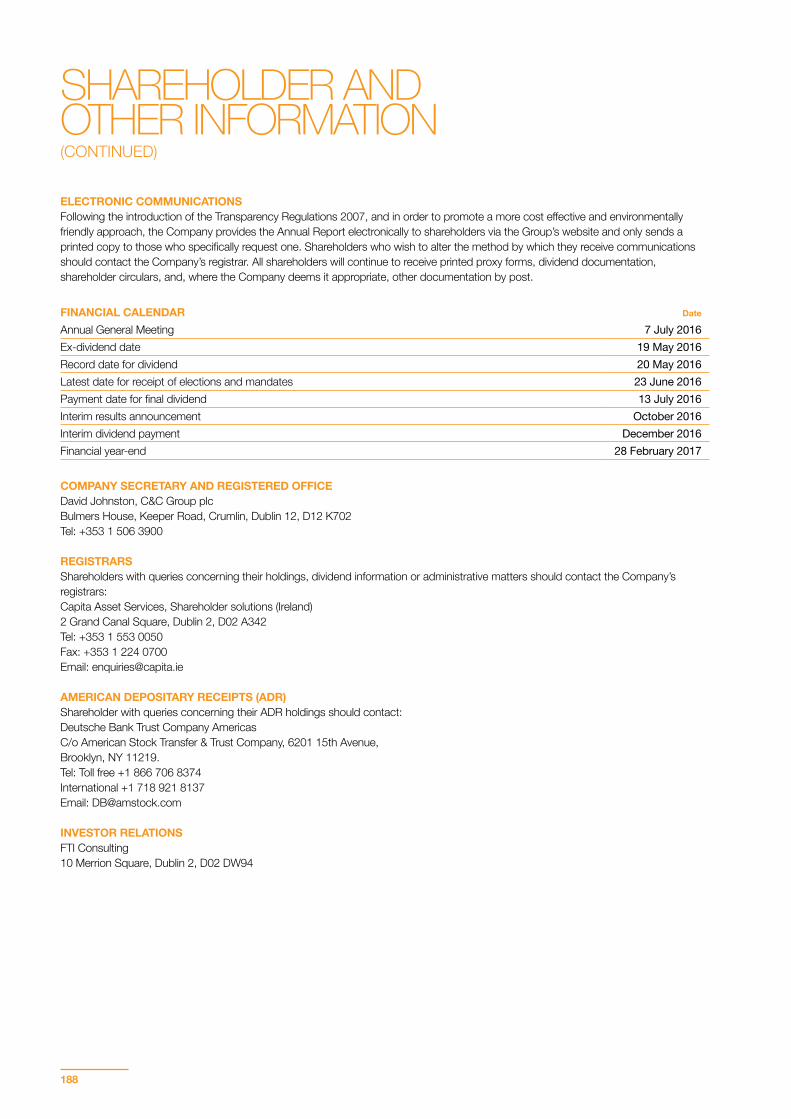
188
ELECTRONIC COMMUNICATIONSFollowing the introduction of the Transparency Regulations 2007, and in order to promote a more cost effective and environmentally friendly approach, the Company provides the Annual Report electronically to shareholders via the Group’s website and only sends a printed copy to those who specifically request one. Shareholders who wish to alter the method by which they receive communications should contact the Company’s registrar. All shareholders will continue to receive printed proxy forms, dividend documentation, shareholder circulars, and, where the Company deems it appropriate, other documentation by post.
FINANCIAL CALENDAR Date
Annual General Meeting 7 July 2016 Ex-dividend date 19 May 2016 Record date for dividend 20 May 2016 Latest date for receipt of elections and mandates 23 June 2016 Payment date for final dividend 13 July 2016 Interim results announcement October 2016Interim dividend payment December 2016Financial year-end 28 February 2017
COMPANY SECRETARY AND REGISTERED OFFICEDavid Johnston, C&C Group plcBulmers House, Keeper Road, Crumlin, Dublin 12, D12 K702 Tel: +353 1 506 3900
REGISTRARSShareholders with queries concerning their holdings, dividend information or administrative matters should contact the Company’s registrars:Capita Asset Services, Shareholder solutions (Ireland) 2 Grand Canal Square, Dublin 2, D02 A342 Tel: +353 1 553 0050 Fax: +353 1 224 0700 Email: [email protected]
AMERICAN DEPOSITARY RECEIPTS (ADR)Shareholder with queries concerning their ADR holdings should contact: Deutsche Bank Trust Company Americas C/o American Stock Transfer & Trust Company, 6201 15th Avenue,Brooklyn, NY 11219.Tel: Toll free +1 866 706 8374 International +1 718 921 8137 Email: [email protected]
INVESTOR RELATIONSFTI Consulting10 Merrion Square, Dublin 2, D02 DW94
SHAREHOLDER AND OTHER INFORMATION(CONTINUED)
C&C GROUP PLC ANNUAL REPORT 2016 FINANCIAL STATEMENTS
189
PRINCIPAL BANKERSBank of IrelandBank of ScotlandBarclays BankDanske BankHSBCRabobankUlster Bank
SOLICITORS McCann FitzGeraldRiverside One, Sir John Rogerson’s Quay, Dublin 2, D02 X576
STOCKBROKERSDavy 49 Dawson Street, Dublin 2, D02 PY05
Investec Bank plc2 Gresham Street, London, EC2V 7QP
AUDITORKPMGChartered Accountants1 Stokes Place, St. Stephen’s Green, Dublin 2, D02 DE03
WEBSITEFurther information on C&C Group plc is available at www.candcgroupplc.com
190
Bulmers House, Keeper Road, Crumlin, Dublin 12, D12 K702. www.candcgroupplc.com


![Bebop 2 - 레이븐퓨리 · PDF file,+/]0&m%&&-b:z&!"#$%&'&dma&rs1)*+ '+!"#$%&'a&*q&781)*+!"#8795:";+",f&'"g*9"h*9"ij:nkn>q"lz'"c](https://img.pdfslide.tips/doc/110x75/5ababe407f8b9ab1118c3267/bebop-2-0m-bzdmars1-aq7818795fg9h9ijnknqlzc.jpg)