Embed Size (px)
Citation preview
CYRIC
ANNUAL REPORT
2005
(January 2005・December2005)
CYCLOTRON AND RADIOISOTOPE CENTER TOHOKU UNIVERSITY http://www.cyric.tohoku.ac.jp/
’( ... ~
.一一・ . ・.
.
‘
守
.
’一.e
.
.
.. 白、
a句.,‘
| -T .
↑・
.
,.
L
Jζ ,・.
-
-
e
., .. '
1 ミ
-
I
L-
-
白--・0
.
、.
CYRICAnnuαl Report 2005
PREFACE
In this twenty-sixth issue of the CYRIC Annual Report, we summarize the
activities in research and development, and in training of radioisotope safe-treatment at the
Cyclotron and Radioisotope Center (CYRIC) during the calendar year 2005.
Research at CYRIC was carried out in the fields of nuclear physics, nuclear
chemis町y,material sciences, nuclear medicine using PET (oncology, brain study,
pharmacology), radiopharmaceutical chemis佐y,health physics, nuclear instrumentation,
nuclear medical engineering (diagnosis and therapy technology), nuclear engineering and
elemental analysis using PDffi.
Developments and improvements on nuclear instruments and techniques have
progressed; one of the 2005 highlights is the construction of high e首iciencyGermanium
gamma-ray detectors array (Hyper-ball 2) which consists of 6 clover type Ge detectors and
13 single crystal type Ge detectors; other highlights紅ethe construction of high-intensity
neutron-beam course and the success of extraction of the negatively ch紅gedhydrogen beam,
which are combined to extend the research with neutron beams. The beam attenuator
device and the acceleration of C-0-Ne cocktail beam were also in甘oducedfor testing
semiconductor devices. Since the 14 GHz ECR ion source has been improved for the
plasma region, the acceleration of heavy ion beams was extended to the mass region of
Krypton. The high-intensity neutron-beam course installed in 2004 has been used
effectively for studies of neutron-induced reactions like fragment production and activation,
and also for semiconductor irradiation experiments. A total of 2513 hours of beam-time of
the K= 11 OMe V cyclotron were delivered for scheduled operation in research work.
[ 18F]FDG, [ 18F]FRP-170, [ 11C]methionine, [ 11C]doxepin, [ 11C]raclopride,
[ 11C]donepezil and [ 150]water were routinely prepared and supplied to clinical PET studies.
In May 2005, [11C]BF-227, a new ~-amyloid imaging agent, was successfully prep紅 edand
supplied to the first clinical PET study in collaboration with TUBERO, Tohoku University.
Molecular imaging of dementia such as Alzheimer’s disease and mild cognitive
impairment (MCI) has been activated at CYRIC since the starting of clinical application of
[11C]BF-227, the first domestically-supplied ~-amyloid imaging probe. [11C]Donepezil is
also important for evaluation of neurotransmission of the cholinergic nervous system and
the clinical study has been conducted. [18F]FDG study is still very active, and CYRIC has
participated in a nationwide multi-center study, Study on Diagnosis of Early Alzheimer’s
Disease (SEAD)ーJapan. Histamine Hl receptor imaging and dopamine D2 receptor
imaging have seen steadily progressing this year. Clinical evaluation of several new
antihistamines is a good example of clinically-oriented application of receptor studies. In
addition to PET study of sports science, scientific evaluation of various techniques used in
alternative medicine, such as 紅 oma-therapyand acupuncture, is becoming another
important research field.
As for clinical diagnosis, [ 11C]methionine has been very useful for diagnosis of
brain tumors. This tracer has given an important medical information reg紅 dingdecision
making of neurosurgeons at T0hoku University Hospital, as well as clinical research on
whole-body oncology studies , of malignant and non-malignant diseases that are not
reimbursed by health insurance yet.
The research progra111 on PIXE analysis has been carried out by using an
electrostatic accelerator ( 4.5 MV Dynamitron) at the Fast Neutron Laboratory (FNL),
Graduate School of Engineering, Tohoku University, under the scientific tie up between
CYRIC and FNL. A total of 528 hours of beam-time was served to this program. The
micro-beam formation system of which the beam spot size is about 1 μm was completed.
Micro-PIXE analysis, STIM analysis, and beam processing紅 enow available.
The training for radioisotope safe-treatment was carried out as usual. In 2005, a
total of 1097 staffs and students of Tohoku University took three courses: 1) Radioisotopes
and radiation generators (525 trainees), 2) X-ray machines and electron microscope (478),
and 3) Synchrotron Radiation (94). The number of trainees (1122) decreased slightly from
2005 (2.3% ), while that for x-rays and SOR increased markedly. The English classes for
each course were practiced for 88 foreign students and scientists.
This year, two big projects st紅白d:1) Development of ultra high resolution
semiconductor PET under the support of a Grant-In-Aid for Specially Promoted Research
of the Ministry of Education, Sports, Culture, Science and Technology, 2) CYRIC and
National Institute of Radiological Sciences (NIRS) joint educational program of molecular
imaging using PET.
We are most grateful to Tohoku University and to the Ministry of Education,
Sports, Culture, Science and Technology for continuous support.
January 2006 Keizo ISHII Director Cyclotron and Radioisotope Center, Tohoku University

EDITORS: Keizo Masatoshi Mamoru Ren Tsutomu
CYRICAnnual Report 2005
ISHII ITOH BABA I~四TA
SHINOZUKA
WORD PROCESSED BY
Yu・koYAMASHITA
..・.ー’.'・.・.. '・て.,. .. r' ・t . ; ¥ '.・ ・・ー ・町 、
戸,; r’・ I',・.一ー・.ートー マザ一 、← .. f 、 ー・..・ f' . 、 ,.
I. ’~- • I l ,. -. - T ~. - • •
e f
- -l
,
l
-
L
-p‘.
・..、・I'.. .
..、ー.. '・’,‘‘・.'.' .ー・ー司、L ’二、
• \• I' . 1・' • 二了句.
! 、. ・.
. 、
,0
・El
,‘
.
L
4
4
【・
2
-
一
.
・・.,‘工
i 、.‘’.·-~·- ・:-・ ..・ 1・-'', I I・
CYRIC Annual Report 2005
CONTENTS
I. NUCLEAR PHYSICS
I. 1. Search for Chiral Doublet Structures in 79Kr with Hyperball2 ....・H ・-……....・H ・-…・・ 1
Suzuki T., Koike T., Ahn T., Endo T., Fujita M., Fu Y. Y., Fukuchi T., Joshi P., Kinoshita S., Ma Y., Miura Y., Miyashita Y., Ohguma M., Rainovski G., Sato N., Shinozuka T., Shirotori K., Tamura H., Tateo初 M.,Timar J., Ukai M., Wakui T., and Yamazaki A.
I. 2. Study of High-Spin Structure in 151Er ....・H ・--…......・H ・......・H ・-…....・H ・...・H ・......・H ・H ・H ・...・H ・....6
Fukuchi T., Gono Y., Odahara A., Shinozu初 T.,Suzuki T., Ukai M., Koike T., Shirotori K., and Ma Y.
I. 3. ”Basic Research in Physics" at CYRIC……・……...・H ・....・H ・.............・H ・-…...・H ・...・H ・...・H ・...8
Kanda H., Hirose K., Maeda K., Matsuzawa M., Miyase H., Ohtsuki T., Shinozuka T., and Yuki H.
II. NUCLEAR INSTRUMENTATION
II. 1. Design and construction of RFIGISOL2 at CYRIC……….........・H ・...・H ・-……...・H ・...JJ
Miyashita Y.,Fujita M., Ohguma M., Suzuki T., Sato N., Tateoka M., Ukai M., Wada M., Wakui T.,
Yamazaki A., and Shinozuka T.
II. 2. E貸ectsof RF Voltage and Cooling of RFIGISOL2・・H ・H ・....・H ・………….........……・…・ 13
Sato N., Miyashita Y., Fujita M., Ohguma M., Suzuki T., Tateoka M., U.初iM., Wada M., Wakui T., Yamazaki A., and Shinozuka T.
II. 3. Construction of Hyperball2 at CYRJc .............・H ・....・H ・-…・・H ・H ・-……・….....・H ・-………......J6
Ukai M., Fujita M., Kinoshita S., Koike T., Ma Y., Miura Y., Miyashita Y., Ohguma M., Sato N.,
Shinozuka T., Shirotori K., Suzuki T., Tamura H., Tateoka M., Wakui T., and Yamazaki A.
II. 4. High Resolution Beam Line at CYRIC ....・H ・-…....・H ・....・H ・...・H ・.....・H ・...・H ・.....・H ・-…...・H ・-… 18
ltoh M., Okaumra H., and Ozeki K.
II. 5. Study for Nal(Tl) and Scintillation Fiber with 80 MeV Proton Beam Toward ESPRI Experiment at NIRS-HIMAC, RIKEN-RIBF ・・・H ・...・H ・....・H ・...・H ・.....・H ・.....・H ・・20
Zenihiro J., Matsuda Y., Sakaguchi H吋 TakedaH., lwao Y., Matsumoto H., and ltoh M.
II. 6. Development of a Novel Fast-response Neutron Beam Monitor ...・H ・.....・H ・...・H ・-…27
Nakhostin M., Baba M., Oishi T., ltogaT., Kamata S., Unno Y., and Otsuki T.
III. NUCLEAR ENGINEERING
III. 1. Tail Correction in Quasi-monoenergetic Neutron Source・………・....・...・H ・...・H ・-…・…31
Kamata S., /toga T., Unno Y., and Baba M.
III. 2. Study of Low Energy Fragment Measurement Using Energy Time of Flight Method ....・H ・.....・H ・...・H ・-….....・H ・...・H ・......・H ・.....・H ・-……….....・H ・-…...・H ・-…....・H ・.....・H ・-…...・H ・.....・H ・...34
Oishi T., Sanami T., Hagiwara M., Okuji T., /toga T., and Baba M.

III. 3. Experimental Study qn Fission Cross-sections of Actinides using Digital Signal Processing・・・・・・・・・・・・・・・・・・・・・・・・・・・・・・・・・・・・・・・・・・・・・・・・・・・・・・・・・・・・・・・・・・・・・・・・・・・・・・・・・・・・・・・・・・・・・・・・・・・・・・・・・・・・・・・・・・・・・・・・・・・・・・・・・・・・ 37 Takahashi W., Oishi T., Nakhostin M., Yamauchi T., Baba M., Yuki H., and Ohtsuki T.
IV. NUCLEAR MEDICAL ENGINEERING
IV. 1. Beam Irradiation System for Proton Therapy at CYRIC ・…....・H ・....・H ・…….....・H ・・・・41Terakawa A., lshizaki A吋 TotsukaY., Honda T., Miy,αshita T., Arikav. M. , and Orihara H.
IV. 2. Benchmark Experiments on Neutron Moderator Assembly for Cyclotron-Based Boron Neutron Capture Therapy・・・ ................................................ 44 Unno Y., Yonai S., Baba M.'. /toga T., Kamada S., Tahara Y., and Yokobori H.
IV. 3. Measurement and M~nte Carlo Calculation of the Response Function of a Schottky CdTe Detector with a Guard Ring Electrode for Medical X-ray Field ・H ・H ・-…...・ H ・.....・H ・....・H ・....・H ・....・H ・...・H ・.....・...・H ・........・H ・...・H ・.....・H ・...・H ・.....・H ・-…...・H ・...47 Mohammadi A., Baba M., Olmchi H., Yamaguchi Y.
IV. 4. An Optical Common-mode Rejection for Improving the Sensitivity Limit of a Radiochromic Imaging Film ................................................................................................ 50 Ohuchi H., and Abe K.
IV. 5. Preliminary Report of Position Sensitive CdTe Detector for a Semiconductor PET Camera・・・・・・・・・H ・.....・H ・-…....・H ・-…....・H ・....・H ・….....・H ・-…....・H ・-…・・..................・H ・.....・H ・--…H ・H ・・55Kikuchi Y., Ishii K., Yamazaki H., Matsuyama S., and Kudo T.
IV. 6. Development of a Pulse Height Estimation Method for a High Resolution PET Camera with Position Sensitive Semiconductor Detectors ..........・H ・-…...・H ・--…...・H ・・58Sakai T., Ishii K., Yamazaki H., Matsuyama S., and Kikuchi Y.
IV. 7. Accuracy of Registration Algorithm Based on Mutual Information .. ・・・・・・・・・・・・・・・・・ 62 Kumagai K., Sasaki T., Yamaguchi K., Margaretha S., Miyake M., Watanuki S., Tashiro M., and ltoh M.
V. PIXE AND ENVIRON;MENTAL ANALYSIS
V.1. Micro-beam Analysis System at Tohoku University・・・・・H ・...・H ・....・H ・-…H ・H ・...・H ・.....・H ・・65Matsuyama S., Ishii K., Yamazaki H., Barbotteau Y., Amartaivan Ts., Izukawa D., Hotta K., Mizumaκ,Abe丘, Ohishif., Rodriguez M., Suzuki A., Sakamoto R., Fujisa\!問 M.,KamかaT.,Oikawa M., Arakawa K., lntaseki H., and Matsumoto N.
V. 2. Micro-beam Analysis at Tohoku University for Biological Studies・…....・H ・....・H ・.72
Matsuyama S., Ishii K., Abe S., Ohtsu H., Yamazaki H., Kikuchi Y., Amartaivan Ts., lnomata K., Watanabe Y., Ishizaki A., Barbotteau Y., Suzuki A., Yamaguchi T., Momose G., and Imaseki H.
V. 3. Chemical State Analisis of Cr Compounds Using Heavy ion PIXE ・・・・・H ・....・H ・-… 78Ishii K., Amartaivan Ts., Yamazaki H., Matsuyama S., Kawamura Y., Oyama R., /shizaki A吋 andMomoseG.
11
之 σPs V. 4. Absorption of Arsenate and Arsenite by Arsenic Hyperaccumlating・・・・・…H ・H ・・82
Tashiro K., Suto K., Inoue C., Matsuyama S., Yamazaki H., and Ishii K.
V. 5. Development of Monitoring System of Aqueous Environment ・....・...・H ・...・H ・...・H ・..87
Yamazaki H., Ishii K., Matsuyama S., Kikuchi Y., Amartaivan Ts., Yamaguchi T., Momose G., Inomata K., Watanabe Y., lshizaki A., Oyama R., and Kawamura Y.
V. 6. Transfer Factors of Technetium・99for Various Plants in Forests ...・H ・-………..93
Tagami, K., Uchida, S. and Sekine, T.
VI. RADIOCHEMISRTY AND NUCLEAR CHEMISTRY
VI. 1. Investigation of Excitation Function for 238U(12C,4・6n)244-246Cf..…H ・H ・-…H ・H ・--… 99
Takamiya K., Kasamatsu Y., Ohtsuki T., Yuki H., Takabe T., Nakashima K., Hasegawa H., Shinohara A., Shibata S., Mitsugashira T., Sato N., Suzuki T., Miyashita Y., Shinozuka T., Kikunaga H., and Nakanishi T.
VI. 2. Measurement of the Cross Section of the 40 Ar(α,2p)42Ar Reaction H ・H ・....・H ・--… 103
Yuki H., Satoh N., Ohtsuki T., Shinozuka T., Baba M., /do T., and Morinaga H.
VII. RADIOPHAR島IACEUTICALCHE島1ISTRYAND BIOLOGY
VII. 1. Development of a Miniature Module for On-column Preparation of [11C]Methionine from [11C]Metyl Triflate ....・H ・....・H ・....・H ・..........・H ・.....・H ・...・H ・--…...・H ・..107
Watanabe T., Ishikm仰 Y.,Ishiwata K., Sato T., and IwαtaR.
VIII. NUCLEAR島'IEDICINE
VIII.1. Functional Neuroimaging of Actual Car-driving ....・H ・-…...・H ・--……………...・H ・--… 111
Jeong M., Tashiro M., Singh LN., Yamaguchi K., Miyake M., Watanuki S., Fukuda F., Ta初haslziT., and Itoh M.
VIII. 2. Functional Neuroimaging of Autonomic Nervous Responses During Aroma-therapy Using [18F]FDG PET ........・H ・....・H ・...・H ・...・H ・...・H ・.....・H ・....・H ・....・H ・....・H ・00l15
Duan X., Tashiro M., Wu D., Yambe T., Wang Q., Sasaki T.,κ!1111agai K., Luo Y., Nina S., and ltoh M.
VIII. 3. Brain Histamine H1 Receptor Occupancy of Antihistamines, Bepotastine and Diphenhydramine, Measured by [11C]Doxepin PET .........・H ・....・H ・....・H ・-…....・H ・...・H ・00120
Duan X., Tashiro M., Kato M., Miyake M., Watanuki S., Ishikawa S., Funaki Y., Iwata R., ltoh M., and Yanai. K.
VIII. 4. Whole Body Metabolic Imaging for Sport Science・・・・・・・・・・・・・・・・・・・・・・・・・・・・・・・・・・・・・・・・・・・・・・・・・・・ 124 Masud M., Fujimoto T., Tashiro M., Watanuki S., Miyake M., Iwata R., and Itoh M.
VIII. 5. Differential Activation of the Midbrain Periaqueductal Grey .....・H ・...・H ・...・H ・---… 130
Hamaguchi T., Kano M., Kanazawa M., Rikimaru H., Watanabe S., Itoh M., Yanai K., and Fukudo S.
VIII. 6. Relationship between Brain Activity and Natural Killer Cell Activity in Patients with Cancer ............................................................................................................. 136 Tashiro M., Kubota K., Miyake M., Watanuki S., Kumano K., and ltoh M.
111
之(!) t) rf
VIII. 7. Reactivation of Medi~l Temporal Lobe and Occipital Lobe During the Retrieval of Color Information: a Positron Emission Tomography Study・・・・・ 140
Ueno A., Abe N., Suzuki MらHirayamaK., Mori E., Tashiro M., ltoh M., and Fujii T.
IX. RADIATION PROTECTION AND TRA町INGOF SAFETY HANDL町G
IX. 1. Beginners Training for Safe Handling of Radiation and Radioisotopes in Tohoku University ・・・・H ・.....・H ・-…....・H ・...・H ・...・H ・-…....・H ・...・H ・....・H ・.........・H ・....・H ・......・H ・-…H ・H ・...145
Bα!baM叶 MiyataT.吋 andlwatiαR.
IX. 2. Radiation Protection !and Management・・・・・H ・-…...・H ・..........・H ・....・H ・...・H ・....・H ・.....・H ・…..148
Miyata T., Baba M. and Nakae H.
X. PUBLICATIONS .. ・・・H ・H ・H ・.....・H ・--“H ・H ・-…H ・H ・...・H ・...・H ・......・H ・-----…・・H ・H ・....・H ・---…...・H ・...・H ・...・H ・...・H ・.......・H ・.....・H ・・・・・・151
XI. l¥1El¥1BERS OF CO島町fiTTEK.....・H ・...・H ・-…....・H ・---“..............................
XII.STAFF…H ・H ・...・H ・.......・H ・......・H ・...・H ・...・H ・H ・.....・H ・H ・H ・.....・H ・.....・H ・...・H ・....・H ・H ・H ・H ・H ・.......・H ・.....・H ・H ・.....・H ・----・“・H ・H ・---“・H ・H ・・00・159
iv

I. NUCLEAR PHYSICS
CYRIC Annual Report 2005
I. 1. Search for ChiI叫 DoubletStructures in 79Kr with Hyperball2
Suzuki T. 1・2, Koike T. 2, Ahn T. 3, Endo T. 1, Fujita M. 1, Fu Y. Y. 4, Fukuchi T. 5 , Joshi RペKinoshitaS. 2, Ma Y. 2, Miura Y. 2, Miyashita KペOhgumaM. 1・2
Rαinovski G. 3.7, Sato N. 1' Shinozuka工1,Shirotori K. 2, Tamura H.2, Tateoka M. 1.2, Timar J.8, Ukai M. 1, Wakui T. 1, and Yamazaki A. 1
8Institute of Nuclear Research (ATOMKJ)
Nearly degenerate pairs of & = 1 rotational bands, which are interpreted as chiral
twin bands candidate1'2), are observed in several odd-odd and few odd-A nuclei in the
A~1303・?) and the A~105 s-t3) regions. In these triaxial nuclei, left-and right-handed chiral
geometries in the body-fixed frame can be formed from the mutually perpendicular angular
momentum of the valence proton, valence neutron and the core rotation. In odd-A nuclei,
one of the components of angular momentum is a broken pair of quasi-particles at higher
spin states. Chirality can be identified via (1) nearly degenerate pair of Lll=l rotational
bands with the same parity and (2) B(E2; I→I -2t.0111 and B(Ml;I→I -2);n,州
having same or similar values between the pair bands.
Recently, life time for chiral candidate members in 134Pr in the A~130 region was
measured; however B(E2) values are largely different between the two bands 14). This
result suggests a difference in deformation between the two, challenging the origin of these
doublets from formation of chirality 15). While verification of nuclear chirality is being
ca凶edout in the mentioned mass region, observations of chiral candidates are expected in
a new mass region, namely the mass A~80 region.
In this region, the best single particle configuration for chiral geometry is
F窓9/2⑧昭912-i for odd-odd nucleus. Angular momentum of valence proton is aligned
along the short axis, and that of valence neutron is aligned along the long axis where three
axes are defined by triaxial mass distribution. This mechanism is opposite to that of
F君9/2-I⑧vh1112 in the A~105 region, and similar to幼11/2③vh,112 _, in the A~130 region.
In this study, we tried to search. for chiral twin bands in 79Kr in the mass 80 regions.
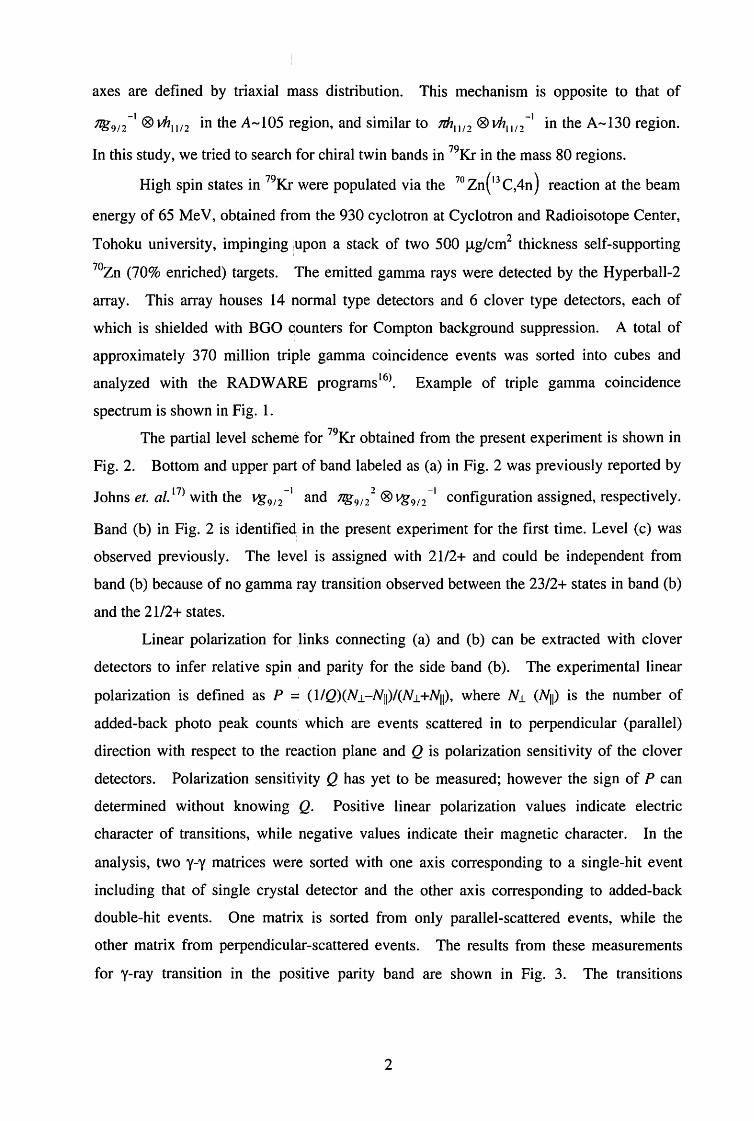
High spin sta防 in79Kr we叫 opulatedvia the 河 zn(13C刈) reaction川 ebeam
energy of 65 Me V, obtained from the 930 cyclotron at Cyclotron and Radioisotope Center,
Tohoku university, impinging 'upon a stack of two 500 μg/cm2 thickness self-supporting
70Zn (70% enriched) targets. The emitted gamma rays were detected by the Hyperball-2
a汀ay. This a町ayhouses 14 normal type detectors and 6 clover type detectors, each of
which is shielded with BOO counters for Compton background suppression. A total of
approximately 370 million triple gamma coincidence events was sorted into cubes and
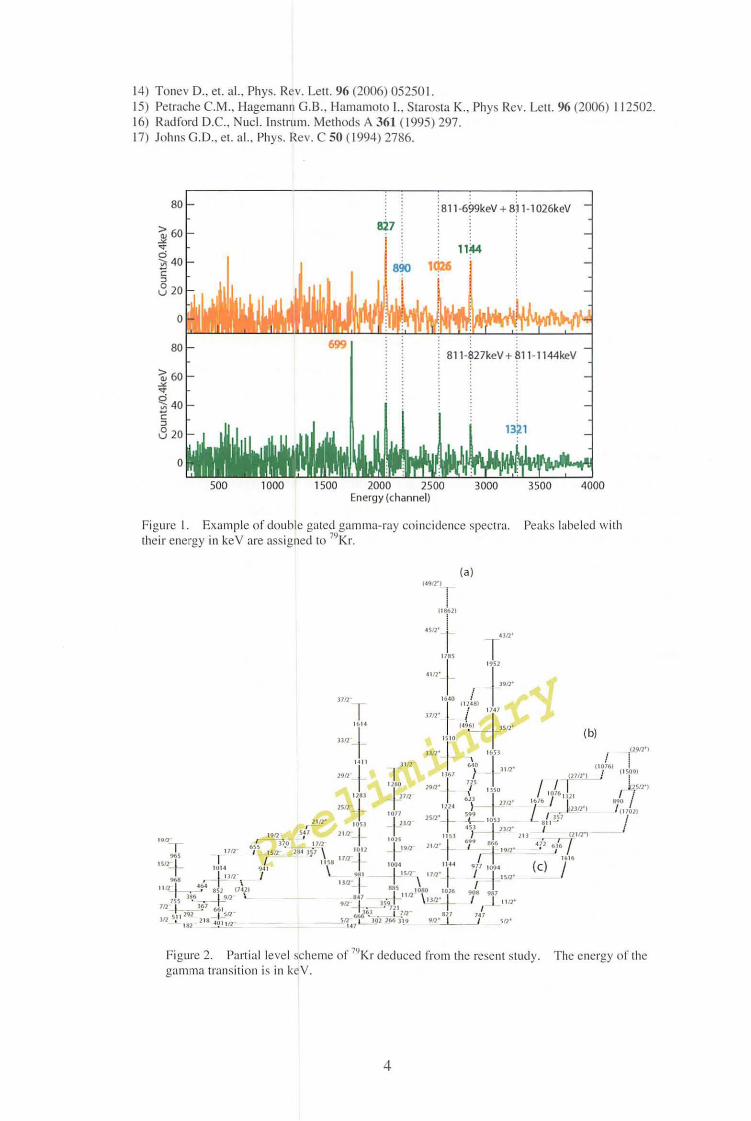
analyzed with the RADWARE programs16). Example of triple gamma coincidence
spectrum is shown in Fig. 1.
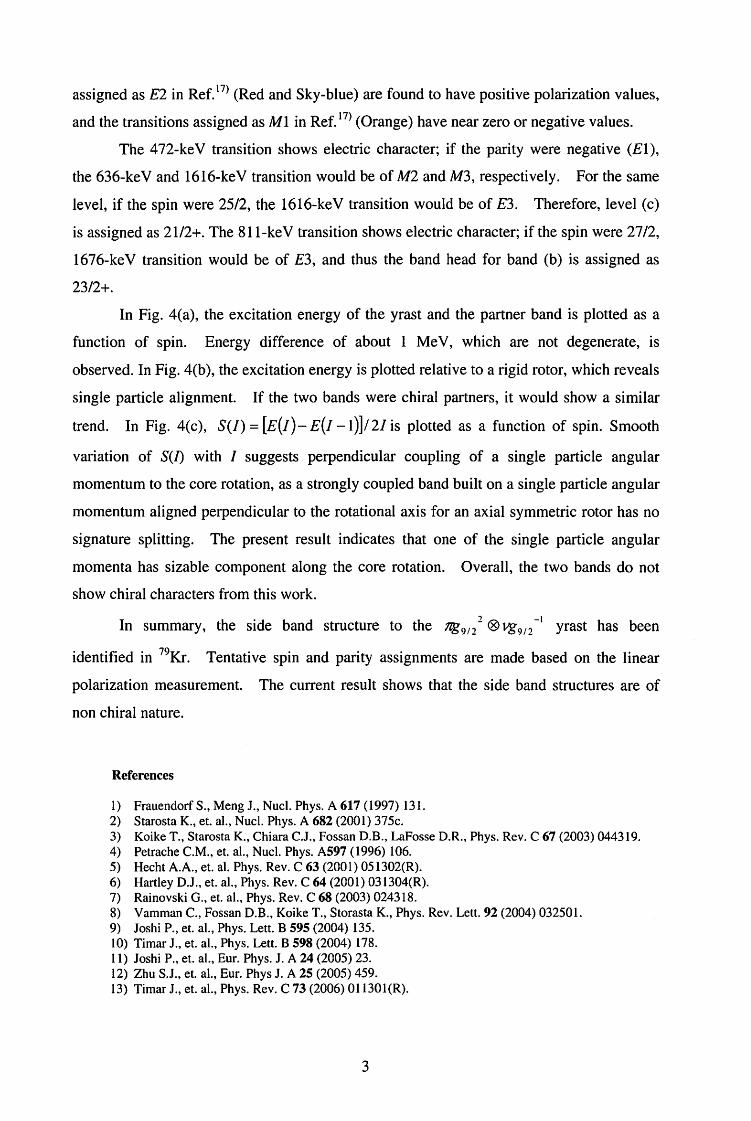
The partial level scheme for 79Kr obtained from the present experiment is shown in
Fig. 2. Bottom and upper part of band labeled as (a) in Fig. 2 was previously reported by
Johns et. al. 17) with the vg912 _, and宅9//③l-g912_, configuration assigned, respectively.
Band (b) in Fig. 2 is identified in the present experiment for the first time. Level ( c) was
observed previously. The level is assigned with 21/2+ and could be independent from
band (b) because of no gamma ray transition observed between the 23/2+ states in band (b)
and the 2112+ states.
Linear polarization for links connecting (a) and (b) can be extracted with clover
detectors to infer relative spin and parity for the side band (b). The experimental linear
polarization is defined as P = ( l/Q)(N J. -Nu)l(N J. +Nu), where Nょ(Nn)is the number of
added-back photo peak counts which are events scattered in to pe中endicular(parallel)
direction with respect to the reaction plane and Q is polarization sensitivity of the clover
detectors. Polarization sensitivity Q has yet to be measured; however the sign of P can
dete口ninedwithout knowing Q. Positive linear polarization values indicate electric
character of transitions, while negative values indicate their magnetic character. In the
analysis, two y-y matrices were sorted with one axis corresponding to a single-hit event
including that of single crystal detector and the other axis corresponding to added-back
double-hit events. One matrix is sorted from only parallel-scattered events, while the
other matrix from perpendicular-scattered events. The results from these measurements
for y-ray transition in the positive parity band are shown in Fig. 3. The transitions
2
assigned as E2 in Ref.17> (Red and Sky-blue) are found to have positive polarization values,
and the transitions assigned as Ml in Ref.17> (Orange) have near zero or negative values.
The 472・keVtransition shows electric character; if the parity were negative (El),
the 636-keV and 1616・keVtransition would be of M2 and M3, respectively. For the same
level, if the spin were 25/2, the 1616-keV transition would be of E3. Therefore, level (c)
is assigned as 21/2+. The 811-keV transition shows electric character; if the spin were 27/2,
1676-keV transition would be of E3, and thus the band head for band (b) is assigned as
2312+.
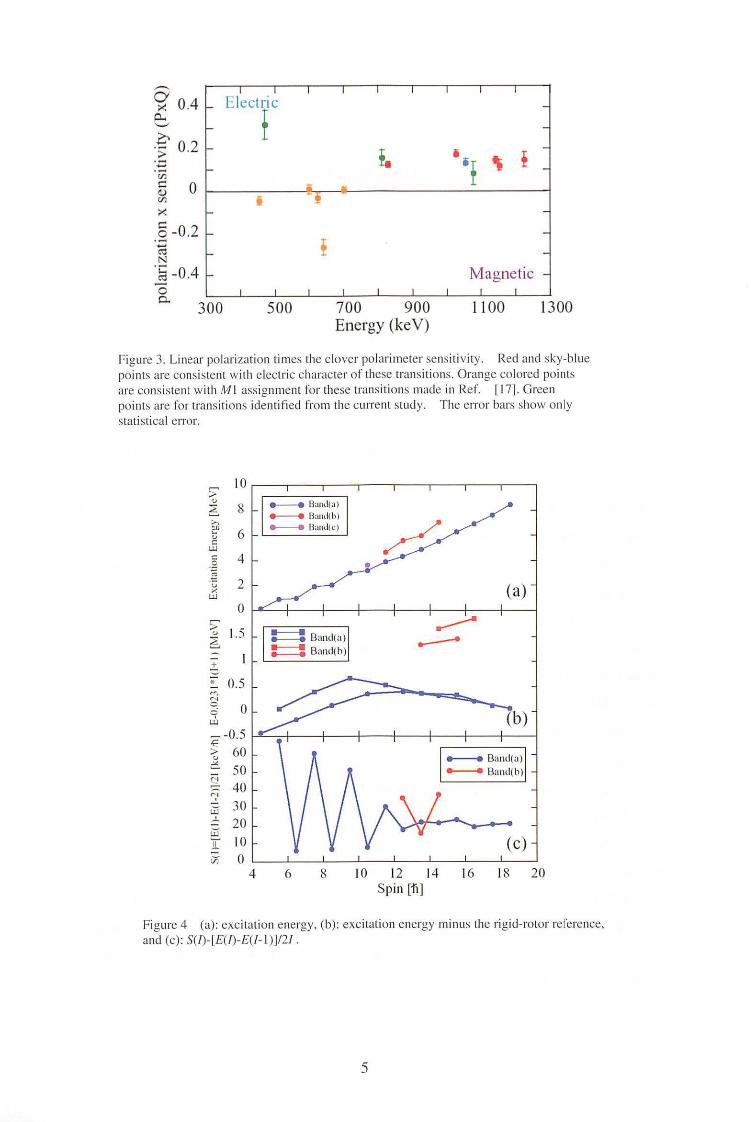
In Fig. 4(a), the excitation energy of the yrast and the pa抗nerband is plotted as a
function of spin. Energy difference of about 1 Me V, which are not degenerate, is
observed. In Fig. 4(b ), the excitation energy is plotted relative to a rigid rotor, which reveals
single particle alignment. If the two bands were chiral partners, it would show a similar
trend. In Fig. 4(c), S(/) = [E(!)-E(Iー1)]/21is plotted as a function of spin. Smooth
variation of S(乃 withI suggests perpendicular coupling of a single particle angular
momentum to the core rotation, as a strongly coupled band built on a single particle angular
momentum aligned perpendicular to the rotational axis for an axial symmetric rotor has no
signature splitting. The present result indicates that one of the single p訂tideangular
momenta has sizable component along the core rotation. Overall, the two bands do not
show chir叫 charactersfrom this work.
In summaη,the side band structure to the F哲9//③v.g-912-i yrast has been
identified in 79Kr. Tentative spin and parity assignments are made based on the linear
polarization measurement. The current result shows that the side band structures are of
non chiral nature.
References
1) Frauendorf S., Meng J., Nucl. Phys. A 617 (1997) 131. 2) Starosta K., et. al., Nucl. Phys. A 682 (2001) 375c. 3) Koike T., Starosta K., Chiara C.J., Fossan D.B., LaFosse D.R., Phys. Rev. C 67 (2003) 044319. 4) Petrache C.M., et. al., Nucl. Phys. A597 (1996) 106. 5) Hecht A.A., et. al. Phys. Rev. C 63 (2001) 051302(R). 6) Hartley D.J., et. al., Phys. Rev. C 64 (2001) 031304(R). 7) Rainovski G., et. al., Phys. Rev. C 68 (2003) 024318. 8) Vamman C., Fossan D.B., Koike T., Storasta K., Phys. Rev. Lett. 92 (2004) 032501. 9) Joshi P., et. al., Phys. Lett. B 595 (2004) 135. 10) Timar J., et. al., Phys. Lett. B 598 (2004) 178. 11) Joshi P., et. al., Eur. Phys. J. A 24 (2005) 23. 12) Zhu S.J., et. al., Eur. Phys J. A 25 (2005) 459. 13) Timar J., et. al., Phys. Rev. C 73 (2006) Ol 130l(R).
3
14) Tonev D .. et. al.. Phys. Rev. Lett. 96 (2006) 052501.
15) p巴tracheC.M., Hagemann G.B .. Hamarηoto I.. Starosta K .. Phys Rev. Lett. 96 (2006) I 12502.
16) Radford D.C., Nucl. lnstrum. Methods A 361(1995)297.
17) Johns G.D.雫 et.al.. Phys. Iミ巴v.c 50 (1994) 2786.
11~
1町 j
~ s11-?27kev + ~11・1144keV
止!....11..J..1;.2000 2500
Energy (channel)
80
壱60.五守
~ 40 c コδ20
。
i 60
~ 40 c
8 20
。80
4000
Peaks labeled with
3500 3000
Figure I Example of double gated gamma-ray coincidence spectra.
their en巴rgyin keV are assigned to 79Kr・-
1500 1000 500
n
n
pi蜘
ib--mf
H
’’吻Hd
制,e
I
JH岬OJ2
2
」U
n
n
n
U
リ
H
N
F
6
t
’tl引BLF
t
』,I削’v
L,J
F6
1
i
’
‘,
,,,引
ne
dd’
4
.. ,・1H
o,JJ3
6
4
・-W冒aF
fJ
JI・日
1
1
J7
I
f
d間
同
ll
a
’t
‘,‘,
3
町
町
府
川
町
町
明
日
目
r
Jim
-
γm卜11T叩ト半tJJS
/蛸fp
ふJFH1”ト?”rf叩ll醐
I
IM
J
hw
川J
J
44
4
J
16
5
4
64
一
幻
S
柑
同
司
7
N
一
日
川
-
6
一
一
1212刷
z・・illim---JIl--日Ill1山ll|日llIH--
TlMj寸立
r
t
r
r
r
r
r
r
n
咽
同
r
S
1
y
S
9
S
川
1
1
9
.・
4
3
3
2
2
J
tl
側、い
n
M
q
@
n
n
M
n
!h
,
1
れ
L
9
S
E
nt-
3
3
2
P
2
S
B
』
’
1p
’’・M
lwlim--附|
跡1l制
Jml胤・回
|
川l||川|
|湘||附lim--
T11r
n
z
n
n
n
宮
崎
n
nH
M
S
N
3
3
9
g
s、I
mM
m11H
,w,一捌
o m
2「
4
5
A
F
,,
-N
m
m
t
n
n
n
,A
,-P9
-’g一H
ZJ刈.J“Eq
M
叩・.M・U
AW
可
H
-mm
l制
ll糊
llmlM・
阿
m
M
M
M
Th巴巴nergyof the Figure 2. Partial l巴velsch巴meof791くrdedueed from the resent study.
gamma transition is in keV.
4
Electnc
宅Tt
ム・τム事.,.
t.
孔1agnetic
1300
‘
1100 ハU
、B/
nUしV
QJιe
LkA
,,l
、VJ
ob
--a
nue
on
7E
500 300
,,-...,
~ 0.4 a司
ぎ0.2‘d
C/l i::: ω 的
κ
5-0.2 Cl3 N
· ~ -0.4 0 0..
。
Figure 3. Linear polarization times the clover polarimeter sensitivity. R巴dand sky-blue
points are consist巴ntwith巴lectriccharacter of these transitions. 01 angc color巴dpoints
are consistent with M 1 assignment for these transitions made in Ref. 1171. Gr巴en
points are for transitions identified from the current study. The巴rrorbars show only
statistical error.
(a)
r’_..:.』---
・一一- llaml(a)
・一一一一・lhnd(b)
・一一一一・Band(c)
20
、BEノ
pu
rtk
18 16 12 14 Spin [も]
10 8 6
10
2
。
A守
P
コ
ベd
戸、Jnu
nunununυ
ハリ
ヘJ
-
n仏
0
6543
21
1
[〉U
2](一+一)
r一門何CCE凶[
ぞ
〉
U
ぷごq[(竹一)凶ム
一}凶]ム一)的
6
4
8
{〉UT4}
h叫』UE凶=DZE
--uk凶
。
Figure 4 (a): excitation巴nergy,(b): excitation energy minus th巴rigid-rotorref,巴rence,
and (c): S(乃・IE(乃-£(/-1)]/2/.
5
CYRJC Annual Report 2005
I. 2. Stu~y of High-Spin Structure in 151Er
Fukuchi T. 1, Gono Y. 2, Odahara A. 1, Shinozuka T. 3, Suzuki T. 3, Ukai M. 3, Koike T. 4, Shirotoriκ4, and Ma Y.4
1 Department of P宵ysics,Osaka Universiη "RIKEN
3Cyclotron and Radioisotope CellteにTohokuUniversity 噌De1?artmentof Physics, Tohoku University
High-spin isomers were reported in N = 83 isotones systematically1>, namely 143Nd, 144Pm, 145Sm, 146Eu, 147Gd, 148Tb, 149Dy, 150Ho and 151Er. Their lifetimes range from 10 ns
to a few μ sec. The exc1tat1on energies of those isomers are close each other ranging
between 8.5 and 9.0MeV except for 151Er. Configuration of the high-spin isomers訂e
deduced experimentally and theoretically2> to be [ v(f712h9ai1312) 1Z'(hn122)]4912+ for odd nuclei
and [ v if712h912i 1112)π(ds12・1h11122) h1+ for odd-odd nuclei. In a high-spin region of these
nuclei, the angular momenta of individual valence particles align to the symmetry axis so
that the overlaps of nucleon wave functions become to be maximum. Then the shape
changes from near spherical to oblate. According to the Deformed Independent Particle
Model (DIPM) calculations2>, the shapes suddenly change at high-spin isomeric states.
This sudden shape change causes the high-spin isomer. Therefore, these isomers could be
described as high-spin shape isomers. As to 151Er nucleus, J'r = 6T isomer at 10.6MeV was
reported by C. Foin et al. 3.4>_ It is important to investigate the high-spin isomer in 151Er,
since the spin-parity and the excitation energy of the high-spin isomer in this nuclei are
largely different to those of other isotones.
An experiment for 151 Er was performed at Cyclotron and Radioisotope Center
(CYRIC), Tohoku University. Excitation states in 151Er were populated using the reaction
tt6Sn(4oA1・,5n)151Er. The 116Sn target of 1.4 mg/cm2 was enriched to 90% and a target foil
was backed by llmg/cm2 lead to stop the reaction products. This target was bombarded
by 40Ar beam of 197MeV with intensity of around 2pnA provided by the cyclotron. A
germanium ball, Hyperball-2, which consist of 12 single and 4 clover type detectors was
6
total detection The measurements. y-y-y coincidence used for prompt and delayed
A total of 4.5xl08 efficiency was about 3.2% for 1.3-MeV y-ray in the singles mode.
above 3・foldcoincidence events were recorded in event by event mode.
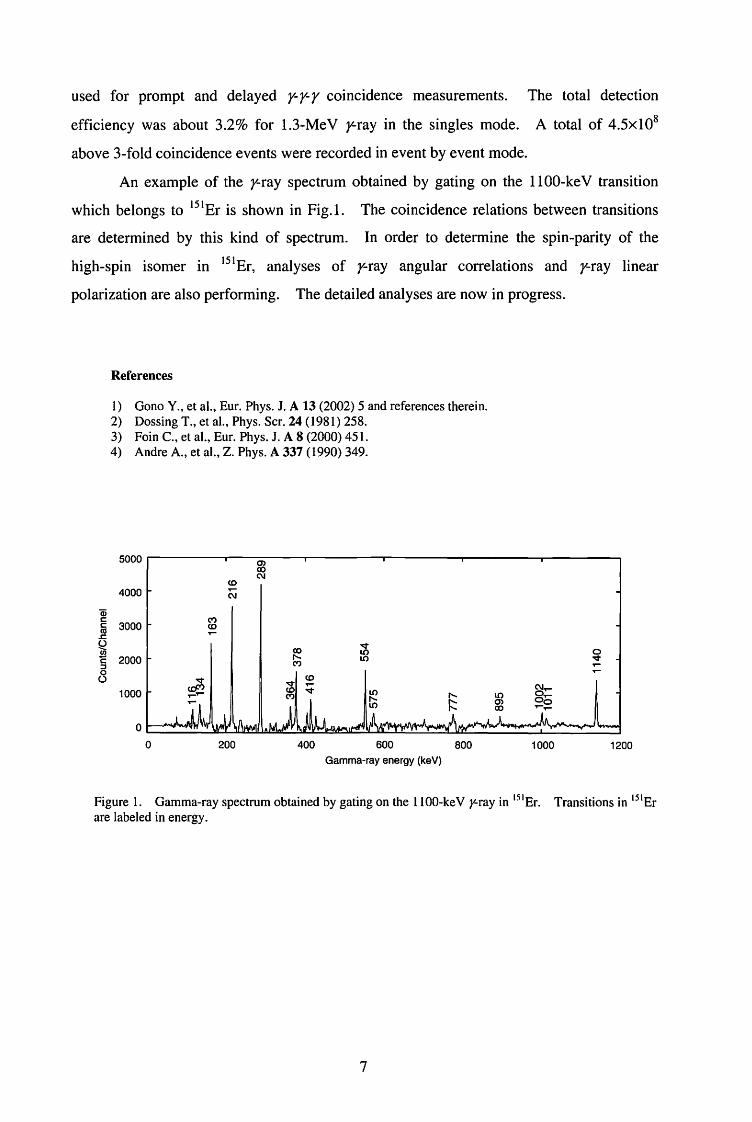
An example of the y-ray spectrum obtained by gating on the 1100-ke V transition
which belongs to 151 Er is shown in Fig. I. The coincidence relations between transitions
In order to determine the spin圃 p訂ityof the are determined by this kind of spectrum.
linear y-ray and
The detailed analyses are now in progress.
correlations angular y-ray of analyses
polarization are also perforr凶ng.
1s1Er, m isomer high-spin
References
Gono Y., et al., Eur. Phys. J. A 13 (2002) 5 and references therein. Dossing T., et al., Phys. Ser. 24 (1981) 258. Foin C., et al., Eur. Phys. J. A 8 (2000) 451. Andre A., et al., Z. Phys. A 337 (1990) 349.
、.EEF
、‘,r、‘,F
、‘.,,
1234
5000 ∞∞ω
也
FN
4000
1200
の匂F
1000 800
寸的的
600
Gamma-ray energy (keV) 400 200
3000
2000
1000
百CCMWZO、ω-cコ00
Transitions in 151 Er Figure 1. Gamma-ray spectrum obtained by gating on the 1100-keV r-ray in 151Er. are labeled in energy.
7
CYRIC Annual Report 2005
I. 3. ”Basic Research in Physics" at CYRIC
Kanda H. 1, Hiroseκ1, Maedaκ1, M_atsuzawa M.1, Miyase H.1, Ohtsuki Tλ Shinozuka T.J, and Yuki H:~·
2 1Graduate School of Science, Tohoku University _ La.boratory of Nuclear Science, Tohoku University "Cyclotron ,and Radioisotope Center, Tohoku Universiザ
From fiscal year 2004~ we have carried out the radioactive isotope (RI) production
experiment at CYRIC for one of the themes in the “Basic Research in Physics ( Butsurigaku
kiso kenかuu)". The main objective of the theme is to learn radiation detection techniques.
As the practice of the radiation detection and measurement, the sealed checking sources紅e
usually used. But the hand-made RI sources more stimulate the students' interests. RI
production is the demonstration of a modern alchemy that means the conversion of atom
which cannot be achieved by conventional chemical methods. An iron plate becomes
radioactive after the i町adiati9nof proton beams of 20 MeV. Students identify the
radioactive nuclide by the energy spectrum of emitted gamma-rays and reconfirm it by its
half life measured by the attenuation of gamma-ray intensity with the course of time0.
After 3 terms of the experiment, we found some problems as the following list.
1. Produced RI: 56Co is identified by the energy spectrum and the half life, and
then we have concluded that 56Fe (p, n) 56Co reaction changes the iron nucleus.
However it is still qualitative and with less physical meaning.
2. Because the systematic e町orsin measurements of counting rates are large
compared to the half life of 56Co (77.3 days), the measured half life of 56Co is
deviated by the slight changes of the experimental conditions.
This year, we used thin iron plates stacked along the proton beam for the
measurement of the RI production cross sections which vary with the energy of incident
proton. By introducing the idea of the reaction cross section, students can qualitatively
access the scale of the nucleus. And the energy loss: the principle of the radiation
detection is qualitatively treated by calculating mean energy of proton in each thin iron
plate. Vanadium plates were also prepared to produce 51Cr via (p, n) reaction. Its half
8
life is 27.7 days2>, that means more than 50% decrease of the gamma-ray intensity can be
measured in 4 weeks.
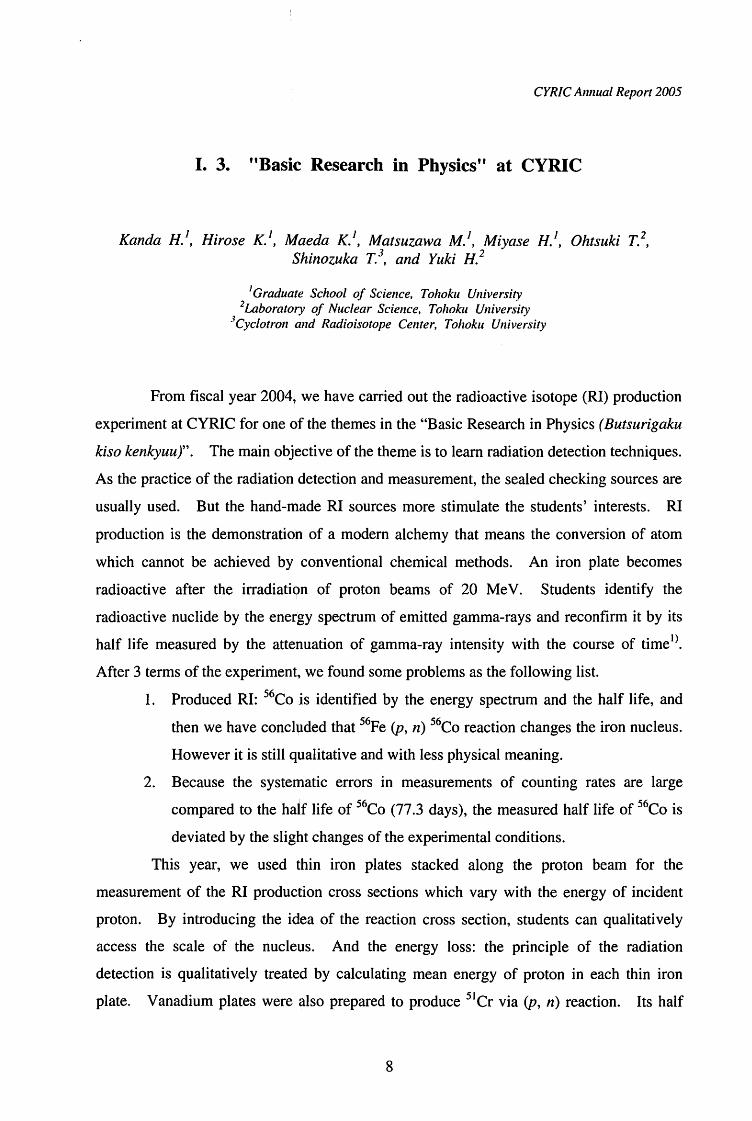
The measured cross sections of 56Fe(p, n )56Co reaction with respect to the incident
proton energies are compared with the reference values in Fig. 1. The students' results
and the reference values show a good agreement. By assuming the maximum cross
section of 56Fe(p, n)56Co reaction is the cross section of spherical 56Fe nucleus, its radius
was measured as 3.8 fm. 百ieradius of 56Fe estimated by using l.25A 113 rule is 4.8 fm.
Thus they are in the same order. From this result, it is shown that the assumption was not
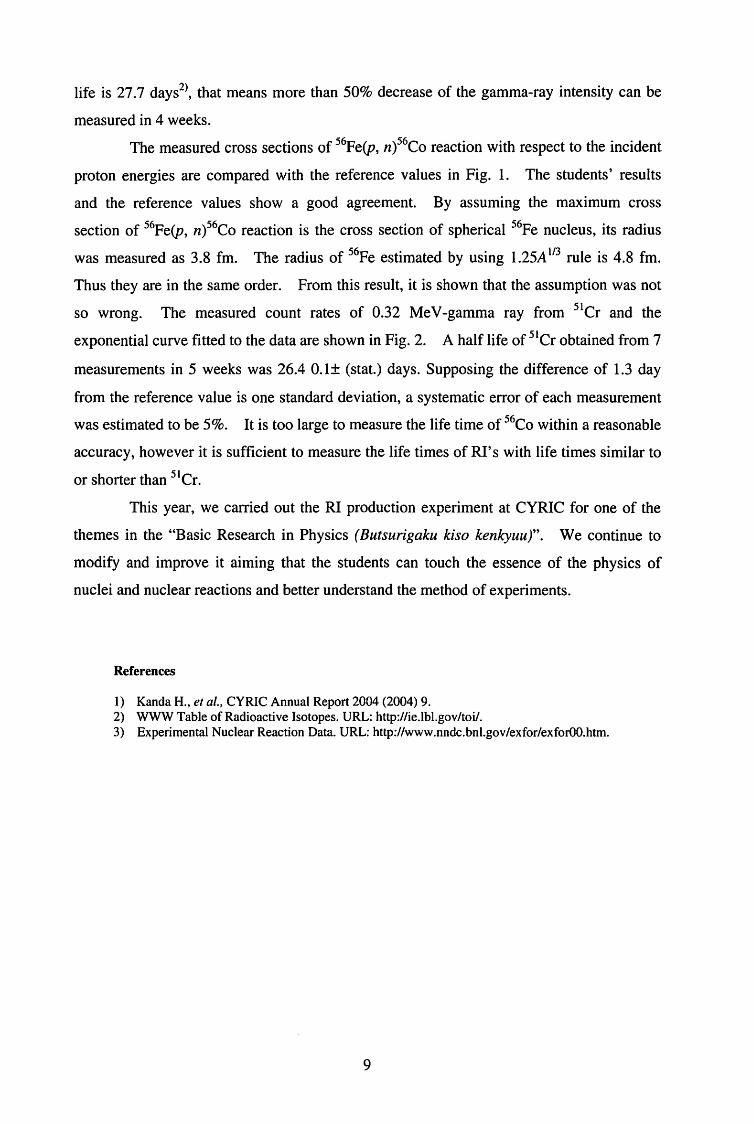
so wrong. The measured count rates of 0.32 MeV-gamma ray from 51Cr and the
exponential curve fitted to the data are shown in Fig. 2. A half life of 51Cr obtained from 7
measurements in 5 weeks was 26.4 0.1± (stat.) days. Supposing the difference of 1.3 day
from the reference value is one standard deviation, a systematic e町orof each measurement
was estimated to be 5%. It is too large to measure the life time of 56Co within a reasonable
accuracy, however it is sufficient to measure the life times of RI' s with life times similar to
or shorter than 51Cr.
This year, we carried out the RI production experiment at CYRIC for one of the
themes in the “Basic Research in Physics ( Butsurigaku kiso kenかuu)”. We continue to
modify and improve it aiming that the students can touch the essence of the physics of
nuclei and nuclear reactions and better understand the method of experiments.
References
1) Kanda H., et al., CYRIC Annual Report 2004 (2004) 9. 2) WWW Table of Radioactive Isotopes. URL: http://ie.lbl.gov/toi/. 3) Experimental Nuclear Reaction Data. URL: http://www.nndc.bnl.gov/exfor/exforOO.htm.
9
] 0.5
き0.4
~ 0.3
、、句句、J司 0.2
0.1
。。
O想注 Oσ(ssFe(
CわνV屯E肘 1 一一.Y i&.・ σ(”Fe(p,n)四Co)Students measurement Q°" I U I’ fj {(fh - I
oi 吟
On 0¢ • σ が
5 10 15 20 25 30 35
Figure I. The cross sections of 56Fe(p, n)56Co reaction with respect to the incident energy
of proton. Open circles are the reference data from Experimental Nuclear Reaction Data Library3> and red closed circles町ethe data from students' measurement.
hwhsS室、hw民主
SSU
. ・・..
-
E噌
.
』司
.
-- ‘
.
.
司
‘ .
.
司
.
旬
.
.
』聞』司
.
‘ .
.
.
旬‘ .
τ1氾= 26.4± 0.1 day
・・・-0. • "Oo-••
···~・・・・
。 5 10 15 20 25 30 35 40 45 50
Time from irradiation (day)
Figure 2. Count rates of 0.32 MeV gamma-ray from 51Cr with respect to the time after proton irradiation. An exponential curve is fitted to the data points and the half life of 26.4 days was
obtained.
10

II. NUCLEAR INSTRU恥IENTATION
CYRIC Annual Report 2005
II. 1. Design and construction of RFIGISOL2 at CYRIC
MかashitaY.1, Fi巧itaM. 2, Ohgun Ukαi M.2, WadaM.3, Wakui工2,yαmazaki A. 2, and Shinozuka T. 2
I Department of Physics, Tohoku University 2Cyclotron and Radioisotope center, Tohoku Universiか
3Atomic Physics Laboratoη,RIKEN
The study of neutron rich unstable nuclei far from the valley of beta-stability is an
important step toward the understanding of nuclear structure. The Radio Frequency Ion
Guide Isotope Separator On-Line (RFIGISOL) system provides us neutron rich unstable
nuclei produced by proton induced fission reactions with Uranium target. The RFIGISOLl
using large volume thermalization gascell equipped with DC and RF electric field was
installed and developed in 20011>. The mass separated fission yield was increased in
comparison with the yield from a classical type IGISOL system2>. However, the mass
separated fission yields from RFIGISOLl was insufficient for the purpose of nuclear
physics experiment such as perturbed angular co町elationmeasurement at the region of
more neutron rich unstable nuclei3>.
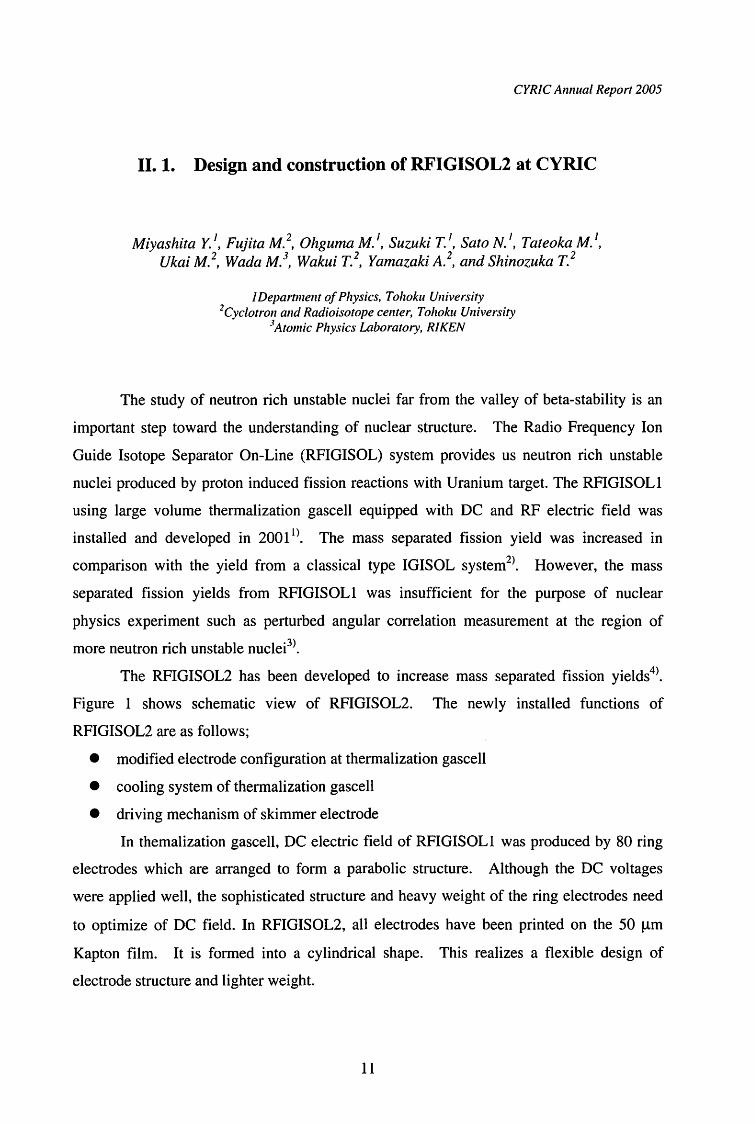
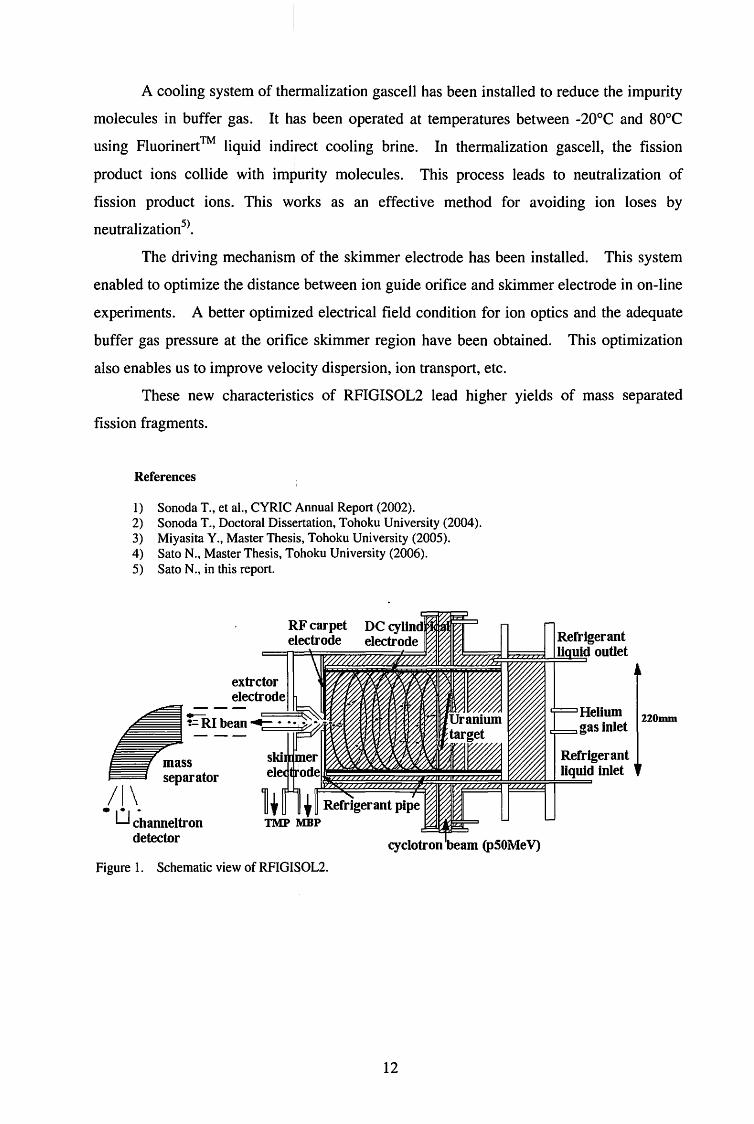
The RFIGISOL2 has been developed to increase mass separated fission yields4>.
Figure 1 shows schematic view of RFIGISOL2. The newly installed functions of
RFIGISOL2 are as follows;
• modified electrode configuration at thermalization gascell
・coolingsystem of thermalization gascell
• driving mechanism of skimmer electrode
In themalization gascell, DC electric field of RFIGISOLl was produced by 80 ring
electrodes which are a町angedto form a parabolic structure. Although the DC voltages
were applied well, the sophisticated structure and heavy weight of the ring electrodes need
to optimize of DC field. In RFIGISOL2, all electrodes have been printed on the 50 μm
Kapton film. It is formed into a cylindrical shape. This realizes a flexible design of
electrode structure and lighter weight.
11
A cooling system of thermalization gascell has been installed to reduce the impurity
molecules in buffer gas. It has been operated at temperatures between ・20°cand 80°C
using Fluorinert™ liquid indirect cooling brine. In thermalization gascell, the fission
product ions collide with impurity molecules. This process leads to neutralization of
fission product ions. This works as an effective method for avoiding ion loses by
neutralization5>.
The driving mechanisrq of the skimmer electrode has been installed. This system
enabled to optimize the distance between ion guide orifice and skimmer electrode in on-line
experiments. A better optimized electrical field condition for ion optics and the adequate
buffer gas pressure at the orifice skimmer region have been obtained. This optimization
also enables us to improve velocity dispersion, ion transport, etc.
These new characteris~ics of RFIGISOL2 lead higher yields of mass separated
fission fragments.
References
1) Sonoda T., et al., CYRIC Annual Report (2002). 2) Sonoda T., Doctoral Dissertation, Tohoku University (2004). 3) Miyasita Y., Master Thesis, Tohoku University (2005). 4) Sato N., Master Thesis, Tohoku University (2006). 5) Sato N., in this report.
Figure 1. Schematic view of RFIGISOL2.
12
Helium gas inlet
Re仕igerantliquid inlet
220mm
CYRIC Annual Report 2005
II. 2. Effects of RF Voltage and Cooling of RFIGISOL2
Sato N. 1, Miyashita Y. 1, Fujita M. 2, Ohguma M. 1, Suzuki T. 1, Tateoka M. 1,
Ukai M. 2, Wada M. 3, Wakui T. 2, Yamazaki A. 2, and Shinozuka T. 2
1 Department of Physics, Tohoku Universiη
2Cyclotron and Radioisotope Center, Tohoku Universiか
3 Atomic Physics Laboratory, Rf KEN
Radio Frequency Ion Guide Isotope Separator On-Line (RFIGISOL) has been
designed and developed to study the nuclear structure of neutron-rich nuclei at the
medium-mass region far from the beta stability line. The upgraded RFIGISOL2 has been
recently designed and developed to obtain higher yield of mass-separated unstable nuclei at
CYRIC1・2>.
We report the effects of RF voltage and the performance of cooling of upgraded
RFIGISOL2. The details of design and specifications of RFIGISOL2 are presented in this
volume2>.
In order to study the effect of RF-voltage in RFIGSIOL2, we chose stable xenon,
which are mixed in helium buffer gas and are ionized by the 50 Me V proton beam of the
930 cyclotron. Stable xenon ions are an adequate probe instead of fission products.
Xenon ions are transported by the DC and RF electric fields in the RFIGISOL chamber.
Then, they are extracted from an exit hole, mass separated by the magnetic field and
detected with a channeltron.
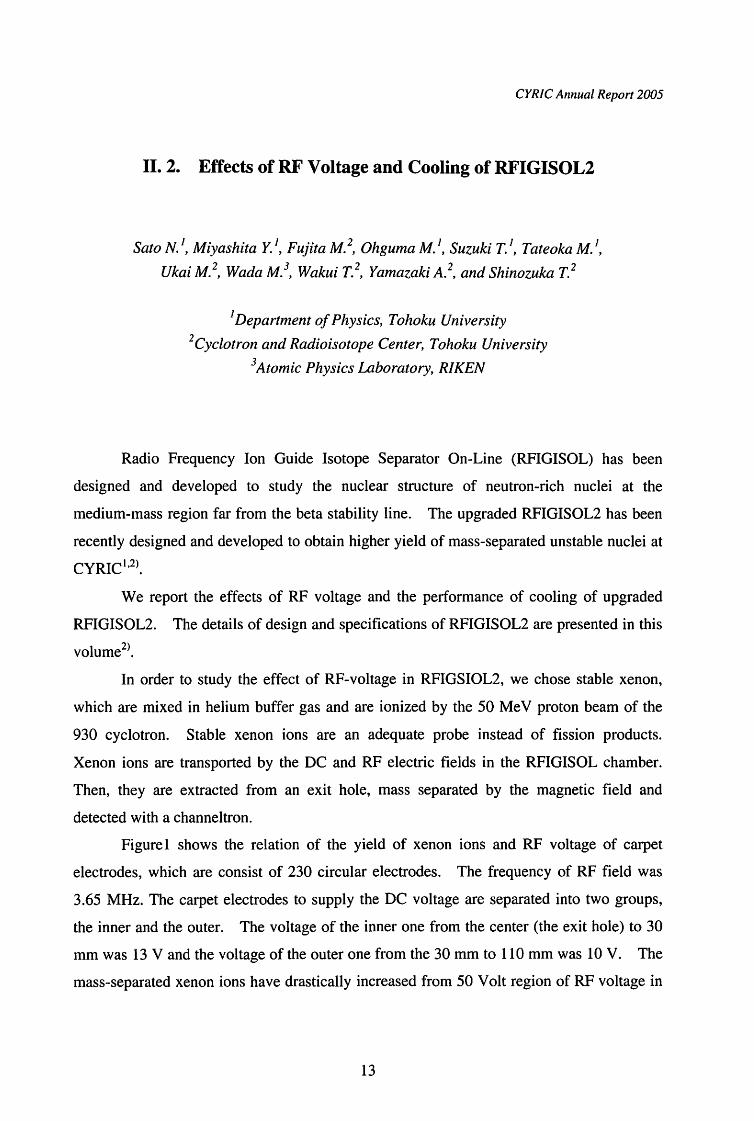
Figure 1 shows the relation of the yield of xenon ions and RF voltage of carpet
electrodes, which are consist of 230 circular electrodes. The frequency of RF field was
3.65 MHz. The carpet electrodes to supply the DC voltage are separated into two groups,
the inner and the outer. The voltage of the inner one from the center (the exit hole) to 30
mm was 13 V and the voltage of the outer one from the 30 mm to 110 mm was 10 V. The
mass-separated xenon ions have drastically increased from 50 Volt region of RF voltage in
13
The extr~ction yield of xenon ions at Vpp = 90 Vis about 1000 times peak to peak (V pp).
higher than the yield without RF voltage.
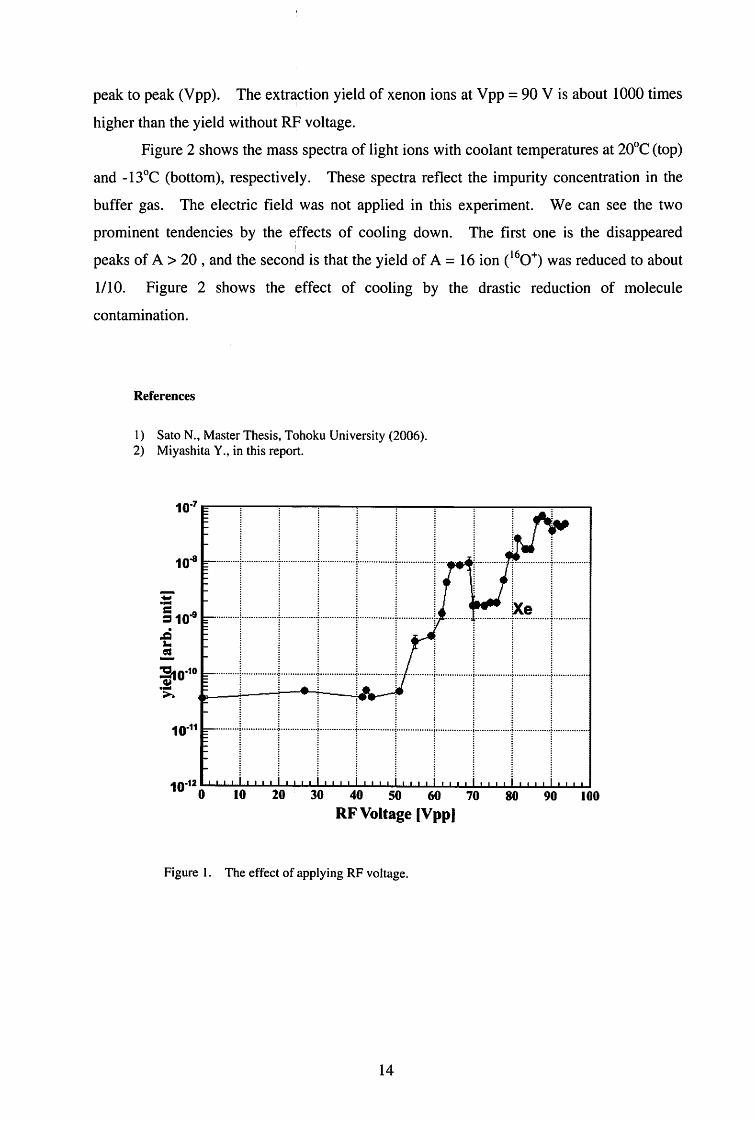
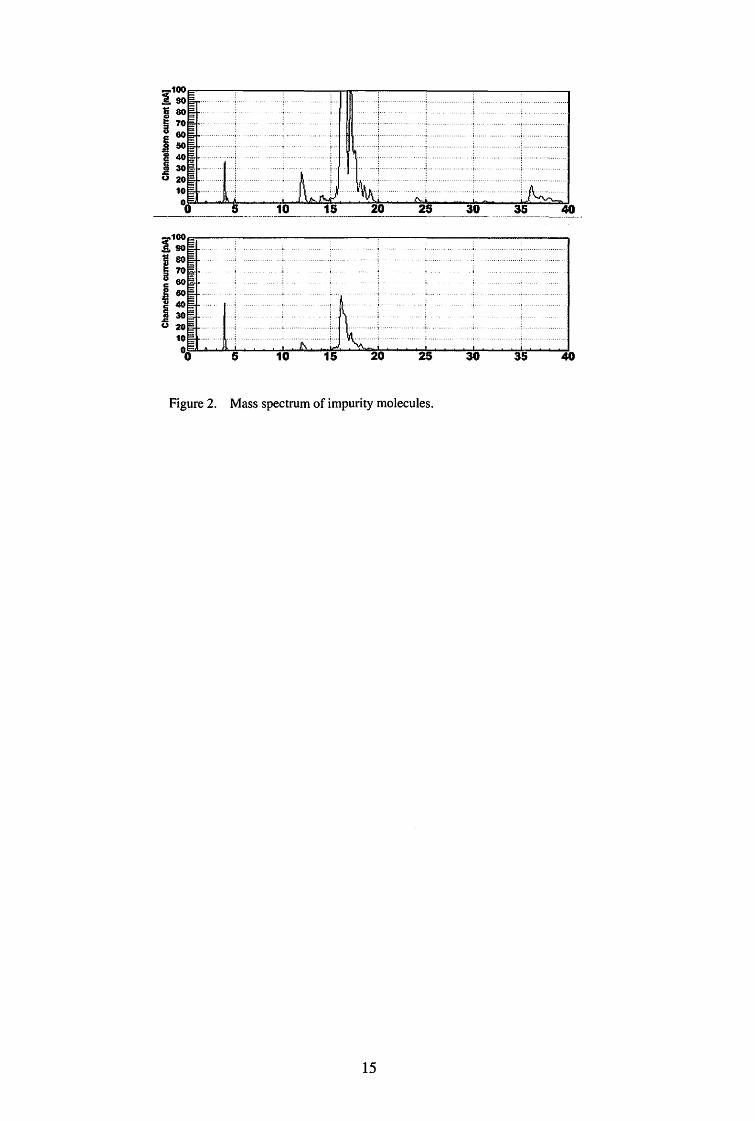
Figure 2 shows the mass spectra of light ions with coolant temperatures at 20°C (top)
These spectra reflect the impurity concentration in the and -13°C (bottom), respectively.
We can see the two
prominent tendencies by the effects of cooling down.
peaks of A > 20 , and the second is that the yield of A = 16 ion ( 160+) was reduced to about
The electric field was not applied in this experiment.
The first one is the disappeared
buffer gas.
of molecule reduction drastic effect of cooling by the the shows 2 Figure
contammat1on.
1/10.
References
Sato N., Master Thesis, Tohoku University (2006). Miyashita Y., in this report. 2)
.
.
.
.
.
.
.
.
.
.
.
.
.
.
.
.
.
.
.
.
.
.
.
.
.
.
.
.
.
.
.
.
.
.
.
.
.
.
.
.
.
.
.
.
.
.
.
.
.
.
.
.
.
.
.
.
.
.
.
.
.
iji--j
i--j
i---
. . . . . . .
-
M…
e…
…
…
. . . .
,
・
ji--jji--i::・
. . . . . . . . . . . . . . .
-
E
::jil--iji--・:
一
-
一
-
一
-
一
-
一
-
一
-
一
-一
・
一
-
一
-
一
-
u・司
4
---z’E,ll
』F
”
日
・
一
-
. .
-
E
・・・・・・・・・・・・3
・・・・・・・・・・・・・・・・・・・
一
-
一
-
一
-
一
-
一
-
一
-
一
-
一
-
一
-
一
-
一
-
一
-
一
-
一
. .
,
---------------------------・・・・・・・・・・・・・・・・・・・・剛・・・・・・・・・・・・・・・・・・・・・・・a
-------z一---------------仇・・・・・・・・・・・・・・・・・・・・
. . . . . . . . . . . . . . . .
・・・・・・・・・・・・・・・・・・・・・・・・・・・・・・・・・・・・・・・・・・・・・・・E
・・・・・・・・・・・・・・・・・・・・・・・4
・・・・・・・・・・・・・・・・・・・・・・・仇・・・・・・・・・・・・・・・・・・・・
. . . . . . . . . . . . . . .
................. ------
m
・・・・・
.......... --------
m
・・・・・・・
............ ----A
・・:・・・巴:・:・---------A
・・・・・・・・・・・・・・・・・・・・
. . . . . . . . . . . . . . .
・::::
......... ・:・・7
・:・・・・・:・・・・:・・・---TZ
・・・::::::::-A
・:・---hr
・-::・・・・・・・・‘:・・・・・・・・・・・・・・:・・
. . . . . . . . . . . . . . . .
2
z
i
g
----gi---jit--
.
.
.
.
.
.
.
.
.
.
.
.
.
.
.
.
.
.
.
.
.
.
.
.
.
.
.
.
.
.
.
.
.
.
.
.
.
唱o-1
10-s
‘・’・個圃冨-=1o"'lS .,Q 』
伺
帽 司 ・10芯10-・圃
》冶
10・11
40 so 60
RF Voltage (Vppl
The effect of applying RF voltage.
14
Figure 1.
市 100
sso E制5 70
=ω 蚕駒
皇 制}・
歪 30u 20
官。。占
言喧Z
Figure 2. Mass spectrum of impurity molecules.
15
CYRIC Annual Report 2005
II. 3. Coqstruction of Hyperball2 at CYRIC
Ukai M.1, Fujita M.1, Kinoshita S.2, Koike T.2, Ma Y.2, Miura Y.2, Miyashita Y.1・2, Ohguma M.1.2, Sato N. I.2, Shi~<!_zuka T. 1, S~irotoバ κ2, Suzuk~ T. 1ベTamuraH.2,
Tateoka M.’勺 WakuiT. ', and Yamazαki A.'
1 Cyclotron and Radioisotope Center. Tohoku Universityn 2 Department of Physics, Tohoku Universiη
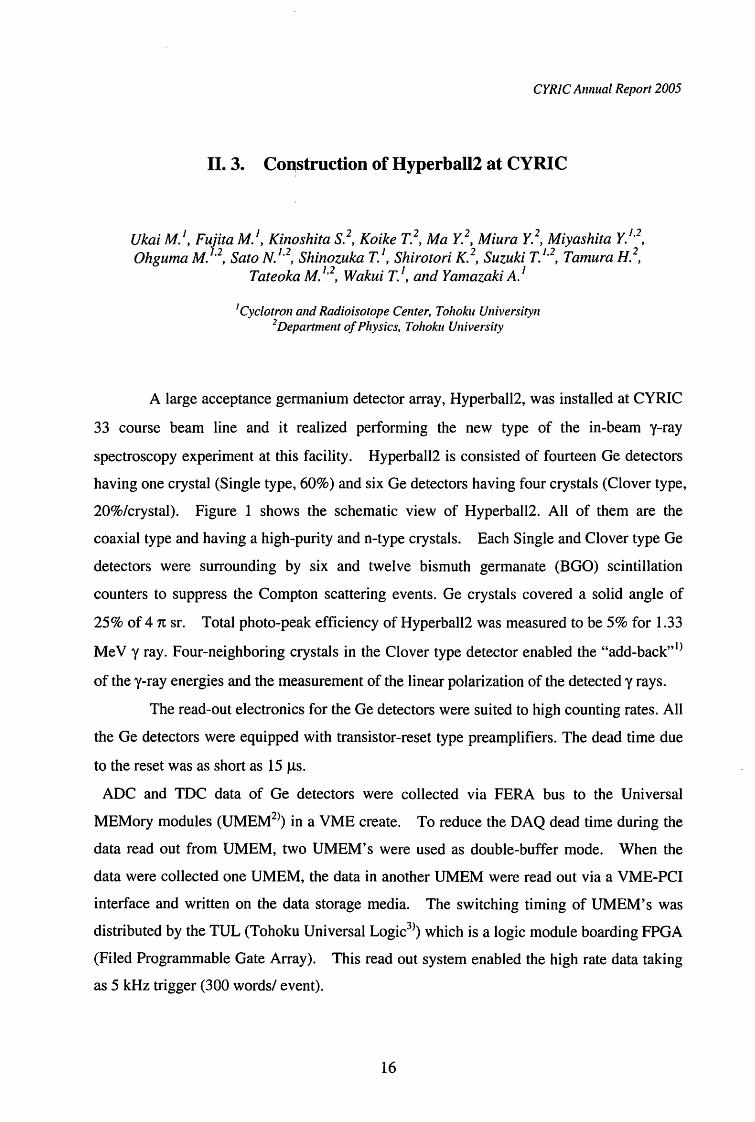
A large acceptance gel!manium detector紅 ray,Hyperball2, was installed at CYRIC
33 course beam line and it realized performing the new type of the in-beam y-ray
spectroscopy experiment at this facility. Hyperball2 is consisted of fourteen Ge detectors
having one crystal (Single type, 60%) and six Ge detectors having four crystals (Clover type,
20%/crystal). Figure 1 shows the schematic view of Hyperball2. All of them are the
coaxial type and having a high-purity and n-type crystals. Each Single and Clover type Ge
detectors were surroundmg by six and twelve bismuth germanate (BGO) scintillation
counters to suppress the Compton scattering events. Ge crystals covered a solid angle of
25%of 4πsr. Total photo-peak efficiency of Hyperball2 was measured to be 5% for 1.33
MeV .y ray. Four-neighboring crystals in the Clover type detector enabled the “add-back”I)
of the y-ray energies and the measurement of the linear polarization of the detected y rays.
The read-out electronics for the Ge detectors were suited to high counting rates. All
the Ge detectors were equipped with transistor-reset type preamplifiers. The dead time due
to the reset was as short as 15 μs.
ADC and TDC data of Ge detectors were collected via FERA bus to the Universal
MEMory modules (UMEM2>) in a VME create. To reduce the DAQ dead time during the
data read out from UMEM, two UMEM’s were used as double-buffer mode. When the
data were collected one UMEM, the data in another UMEM were read out via a VME・PCI
interface and written on the data storage media. The switching timing of UMEM’s was
distributed by the TUL (Tohoku Universal Logic3>) which is a logic module boarding FPGA
(Filed Programmable Gate Array). This read out system enabled the high rate data taking
as 5 kHz trigger (300 words/ event).
16
The liquid nitrogen used to cool the Ge crystals was contained in a 3 litter dewar
and re-filled every 12 hours in the beam time. Therefore, oxygen hazard monitors were
also installed at the target room.
In 2005,出efirst inゐeamy-ray spectroscopy using Hyperball2 at CYRIC, the
chiral doublet structure search in the A~ 80 region, was started4). Hyperbalロwasonce
moved to the KEK-PS K6 beam line and used for they-ray spectroscopy experiment of the
p-shell hypernucleus5・6) (the predecessor of Hyperba112, Hyperball, was dedicated to the
hypernuclear y-ray spectroscopy). Afterwards, it came back to CYRIC and was used for
further chiral doublet search experiment and another experiment, high spin isomer search
experiment of Er isotopes 7l.
References
I) http://www.canberra.com/proclucts/ I I 12.asp 2) Ajimura S., http://km.phys.sci.osaka-u.ac.jp/~aj i mura/mem/ 3) Nomura H., Master Thesis, Tohoku Univ巴rsity(2006). 4) Suzuki T., et al., in this report. 5) Kinoshita S., Master Thesis, Tohoku Unive1・sity(2006). 6) Yue M., Master Thesis, Tohoku University (2006). 7) Fukuchi T., et al., in this report.
Figure I. Schematic view of Hyperball2 installed at 33 course.
17
CYRIC Annual Report 2005
II. 4. High Resolution Beam Line at CYRIC
ltoh M., Okaumra H., and Ozeki K.
Cyclotron and Radioisotope Center, Tohoku University
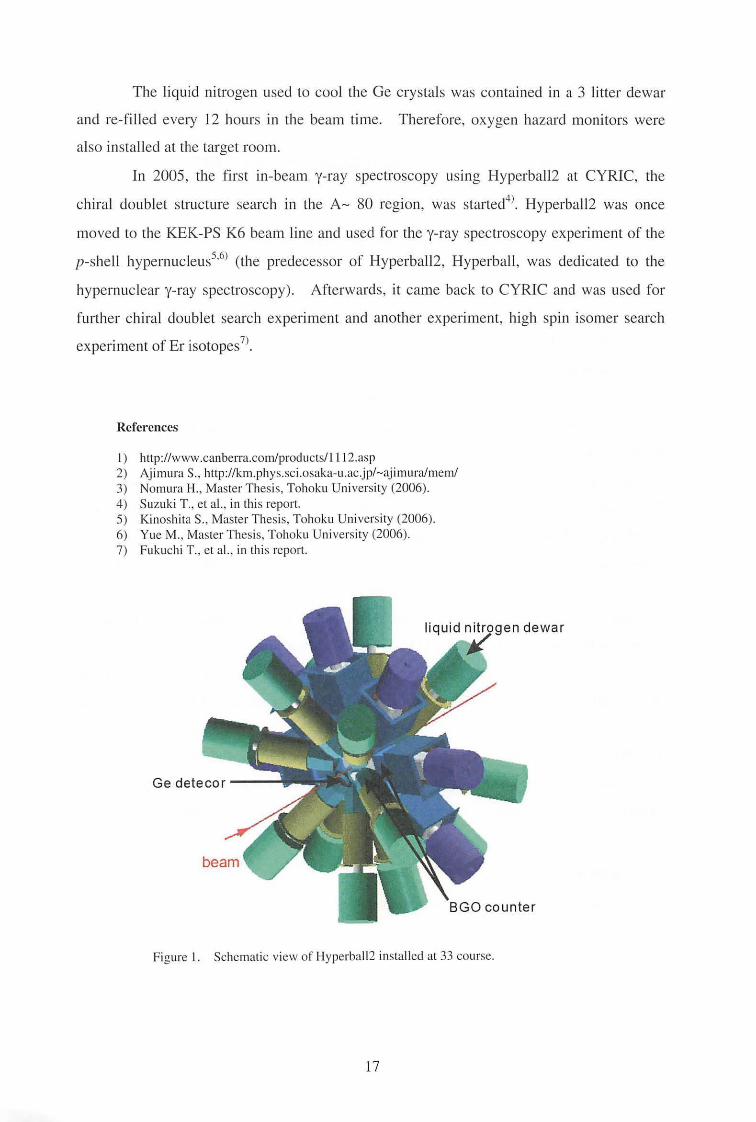
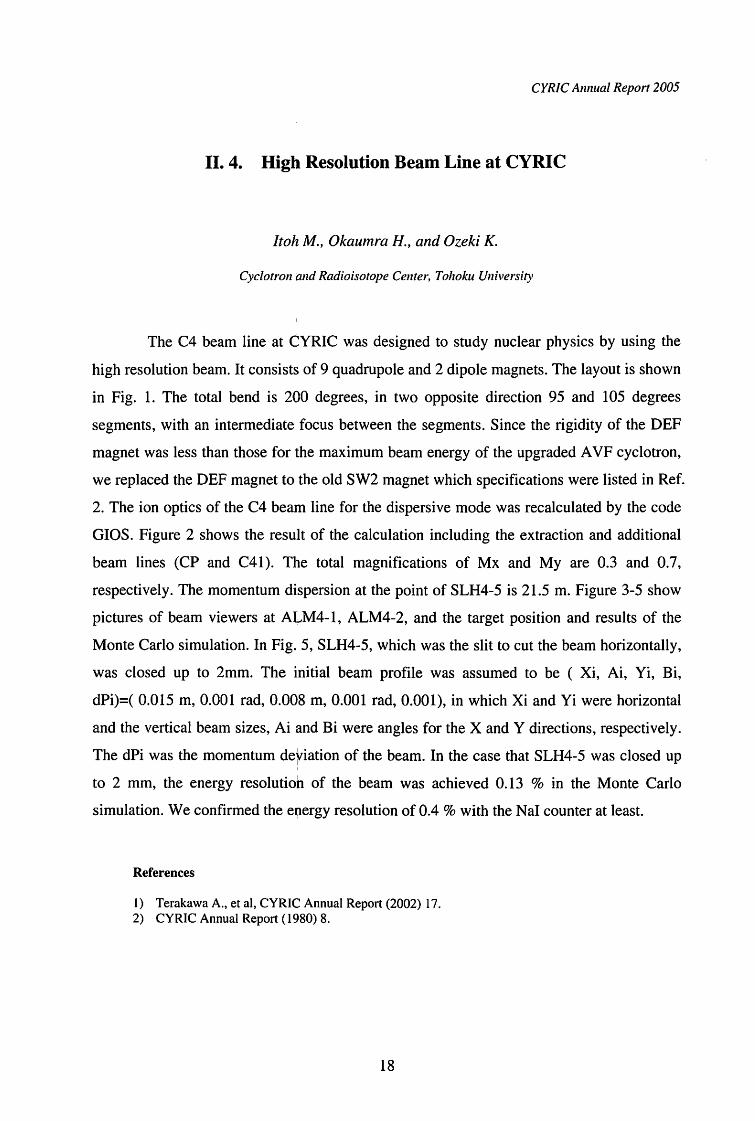
The C4 beam line at CYRIC was designed to study nuclear physics by using the
high resolution beam. It consists of 9 quadrupole and 2 dipole magnets. The layout is shown
in Fig. 1. The total bend is 200 degrees, in two opposite direction 95 and 105 degrees
segments, with an intermediate focus between the segments. Since the rigidity of the DEF
magnet was less than those for the maximum beam energy of the upgraded A VF cyclotron,
we replaced the DEF magnet to the old SW2 magnet which specifications were listed in Ref.
2. The ion optics of the C4 beam line for the dispersive mode was recalculated by the code
GIOS. Figure 2 shows the result of the calculation including the extraction and additional
beam lines (CP and C41). The total magnifications of Mx and My are 0.3 and 0.7,
respectively. The momentum dispersion at the point of SLH4・5is 21.5 m. Figure 3・5show
pictures of beam viewers at ALM4-1, ALM4-2, and the target position and results of the
Monte Carlo simulation. In Fig. 5, SLH4・5,which was the slit to cut the beam horizontally,
was closed up to 2mm. The initial beam profile was assumed to be ( Xi, Ai, Yi, Bi,
dPi)=( 0.015 m, 0.001 rad, 0.008 m, 0.001 rad, 0.001), in which Xi and Yi were horizontal
and the vertical beam sizes, Ai and Bi were angles for the X and Y directions, respectively.
The dPi was the momentum deyiation of the beam. In the case that SLH4-5 was closed up
to 2 mm, the energy resolution of the beam was achieved 0.13 % in the Monte Carlo
simulation. We confirmed the energy resolution of 0.4 % with the Nal counter at least.
References
I) Terakawa A., et al, CYRIC Annual Report (2002) 17. 2) CYRIC Annual Report ( 1980) 8.
18
, / ,
〆,
,,
,,
〆,,
’
,
,
,
’
Figur巴 I. Layout of the C4 beam line.
(a)
f ,
f r
r ’
’ ,,
J ’
/ ,
(b):日:-:- :て.
L ~
Target
民F
釦仲5仙川4-2)
立Z 柚 1
乱Hφ司4
制- AN.II
-
S胃1此且ーJPSW
Bl
Figure 2. The profile of the
dispersive beam transport.
(a)
(a)
”・し~斗-ムーームー~l......._..1. ~」.ム l‘-・"-】ム】一・・ ・・ 岨岨岨・・‘四回・・四XI・0
(b)帽円二一 「ー十一
日一;議: ;
..」必~--」-··“・1~~1-····~· 1 ••• 1 ..町・・ 悼四幅岨・ ・・・‘・・・・帽XI・0
19
Figure 3.
(a) The beam profile at
ALM4-l. (b) The result of the
Monte Carlo simulation at
ALM4-l.
Figure 4. (a) Th巴 beam profile at ALM4-2. (b) The result of the
Monte Carlo simulation at
ALM4-2.
Figur巴5.(a) Th巴 b巴amprofile at the
target position. (b) Th巴 resultof the Monte Carlo simulation
at the target position.
CYRIC Annual Report 2005
II. 5. Study for Nal(Tl) and Scintillation Fiber with 80勘leVProton Beam Toward ESPRI Experiment at NIRS-HIMAC,
RIKEN-RIBF
Zenihiro J.1, Matsuda Y. 2, Sakaguchi Hλ Tak~da H.4, lwao Y.1, 'Matsumoto H. ',and Itoh M . .J
1 Department of Physics, Kyoto Universi.砂2Department of Physics, Tohoku Universiη
3Department of Applied Physics, Miyazaki Universiザ4RIKEN
5Cyclotron and Radioisotope Center, Tohoku Universi砂
In recent years various new phenomena in unstable nuclei such as neutron skin or
halo, have been a focus of international attention. RI beam facilities of the next generation,
RIKEN-RIBF, GSI-SISl00/300, RIA at USA, and so on,紅ebeing built and various
experiments are planned to confirm these phenomena.
We have already succeeded in ex住actingthe neutron density distributions in stable
nuclei by using intermediate energy polarized proton elastic scattering measurements at
RCNP in Osaka University.
Now we are proposing experiments of Elastic Scattering of Protons with RI beam
(ESPRI) at NIRS-HIMAC and RIKEN-RIBF, and developing a new detector system
composed of momentum tagging and tracking counters of the RI beam (Scintillation Fibers,
two MWDCs), a Solid Hydrogen Target (SHT) and a Recoil Particle Spectrometer (RPS),
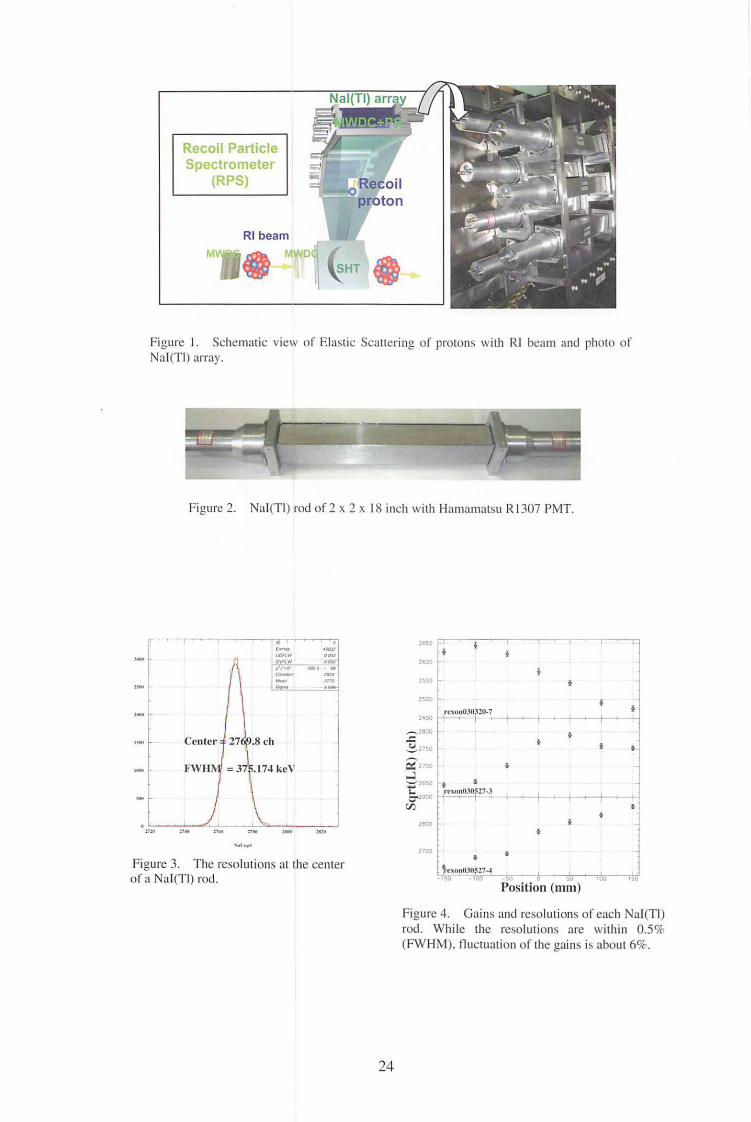
to measure recoil protons in出eSHT scattered by RI beam. The RPS shown in Fig. I,
consists of MWDCs, plastic scintillators and finally fourteen-Nal(Tl)訂rays. Nal(Tl)
determines the total energy of recoil protons precisely. The Scintillation Fibers installed in
the secondary beam line are used to tag the momentum of the RI beam at the focal plane of
the beam line. Both of them are indispensable to the measurement of inverse kinematical
proton elastic scattering with the RI beam.
In order to evaluate the performances of Nal(Tl) and Scintillation Fiber we have
calibrated these detectors with 77.6 MeV proton beam at CYRIC in Nov. and Dec. of 2005.
20
Nal(TI)
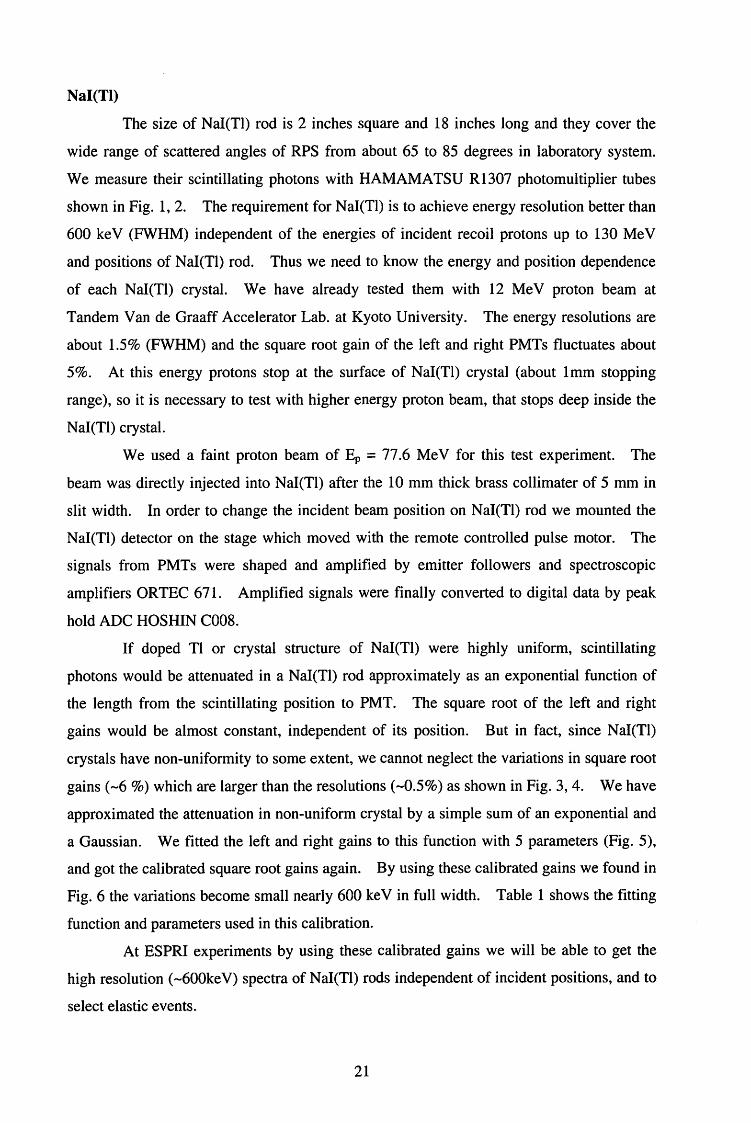
The size of Nal(Tl) rod is 2 inches square and 18 inches long and they cover the
wide range of scattered angles of RPS from about 65 to 85 degrees in laboratory system.
We measure their scintillating photons with HAMAMATSU R1307 photomultiplier tubes
shown in Fig. 1, 2. The requirement for N al(Tl) is to achieve energy resolution better than
600 ke V (FWHM) independent of the energies of incident recoil protons up to 130 Me V
and positions of Nal(Tl) rod. Thus we need to know the energy and position dependence
of each NaI(Tl) crystal. We have already tested them with 12 MeV proton beam at
Tandem Van de Graaff Accelerator Lab. at Kyoto University. The energy resolutions are
about 1.5% (FWHM) and the squ紅eroot gain of the left and right PMTs fluctuates about
5%. At this energy protons stop at the surface of Nal(Tl) crystal (about Imm stopping
range), so it is necessary to test with higher energy proton beam, that stops deep inside the
Nal(Tl) crystal.
We used a faint proton beam of Ep = 77 .6 Me V for this test experiment. The
beam was directly i吋ectedinto Nal(Tl) after the 10 mm thick brass collimater of 5 mm in
slit width. In order to change the incident beam position on Nal(Tl) rod we mounted the
Nal(Tl) detector on the stage which moved with the remote controlled pulse motor. The
signals from PMTs were shaped and amplified by emitter followers and spectroscopic
amplifiers ORTEC 671. Amplified signals were finally converted to digital data by peak
hold ADC HOSHIN COOS.
If doped Tl or crystal structure of Nal(Tl) were highly uniform, scintillating
photons would be attenuated in a Nal(Tl) rod approximately as an exponential function of
the length from the scintillating position to PMT. The square root of the left and right
gains would be almost constant, independent of its position. But in fact, since Nal(Tl)
crystals have non-uniformity to some extent, we cannot neglect the variations in square root
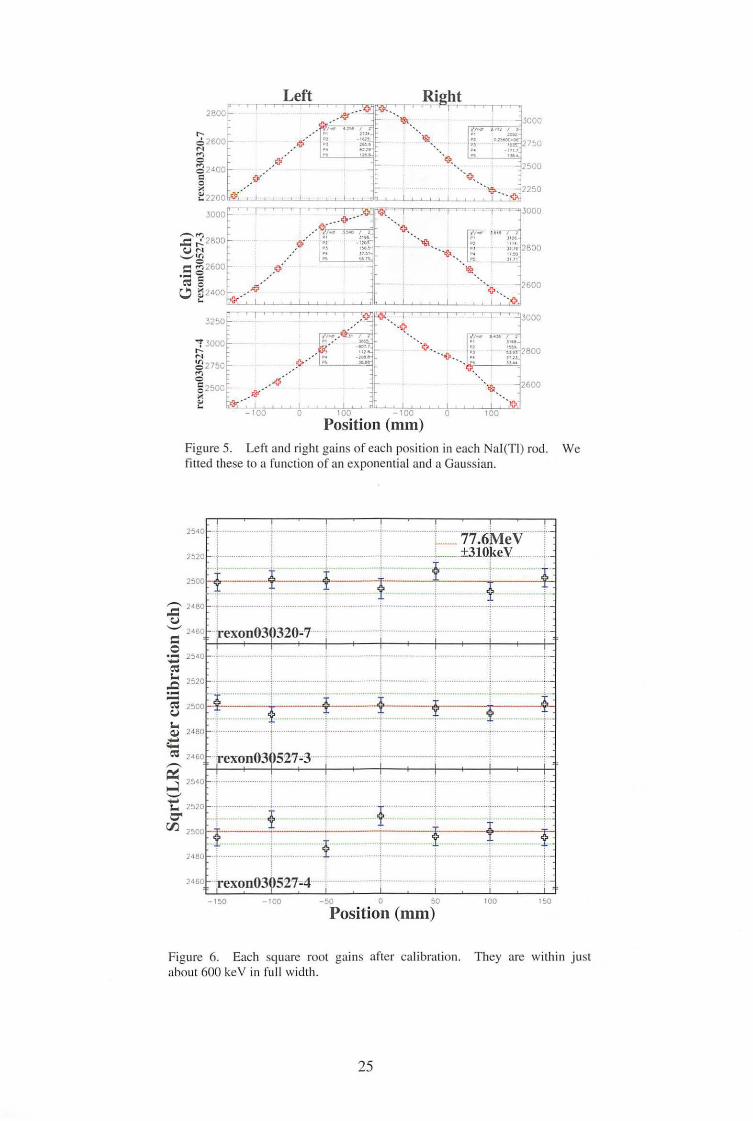
gains (~6 %) which紅 elarger than the resolutions (~0.5%) as shown in Fig. 3, 4. We have
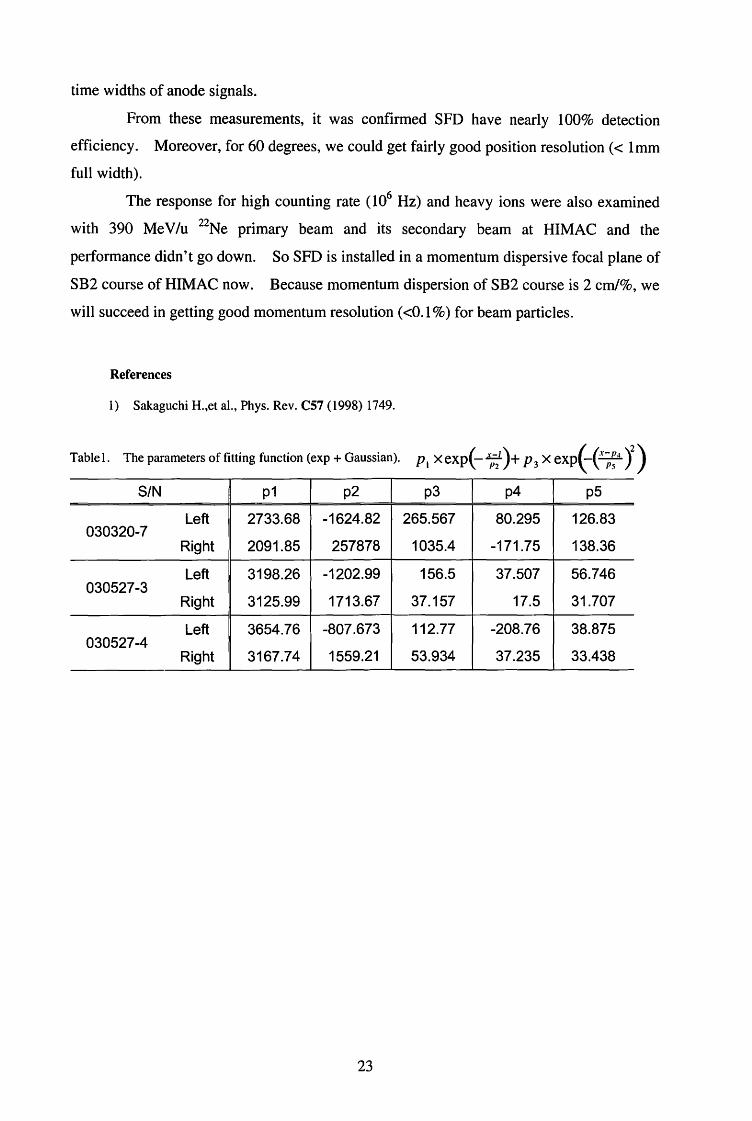
approximated the attenuation in non-uniform crystal by a simple sum of an exponential and
a Gaussian. We fitted the left and right gains to this function with 5 parameters (Fig. 5),
and got the calibrated square root gains again. By using these calibrated gains we found in
Fig. 6 the variations become small nearly 600 ke V in full width. Table 1 shows the fitting
function and p紅 ametersused in this calibration.
At ESPRI experiments by using these calibrated gains we will be able to get the
high resolution (~600keV) spectra of Nal(Tl) rods independent of incident positions, and to
select elastic events.
21
Scintillation Fiber
Gas counters such as Low pressure MWPC and PPAC are often used as a position
detector at a focal plane of a RI beam line. However, beam intensity, energy and so on are
very influential in these performances. Moreover, usage of the counter gas can’t release
from danger. To avoid such problems, we have developed a simple one-dimensional
Scintillation Fiber Detector (SFD).
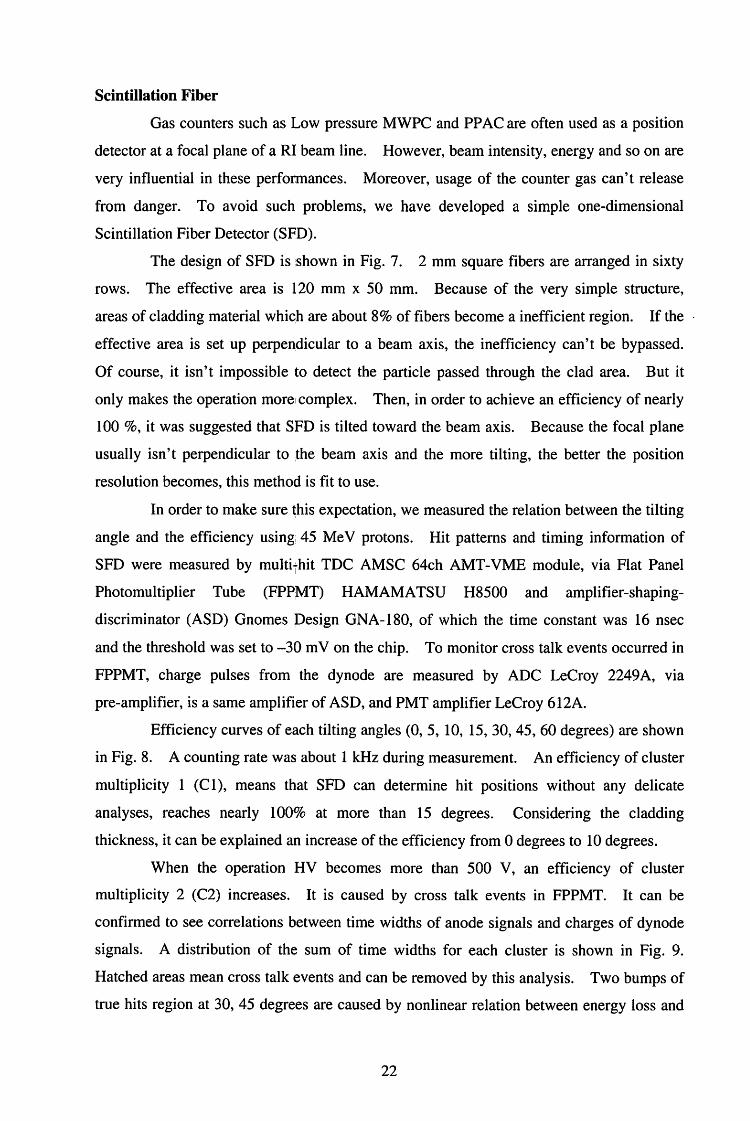
The design of SFD is shown in Fig. 7. 2 mm square fibers are arranged in sixty
rows. The effective area is 120 mm x 50 mm. Because of the very simple structure,
areas of cladding material which are about 8% of fibers become a ine伍cientregion. If the ・
effective area is set up perpendicular to a beam axis, the inefficiency can’t be bypassed.
Of course, it isn’t impossible to detect the particle passed through the clad area. But it
only makes the operation more1 complex. Then, in order to achieve an efficiency of nearly
100 %, it was suggested that SFD is tilted toward the beam axis. Because the focal plane
usually isn’t perpendicular to .the beam axis and the more tilting, the better the position
resolution becomes, this method is fit to use.
In order to make sure this expectation, we measured the relation between the tilting
angle and the efficiency using; 45 Me V protons. Hit patterns and timing information of
SFD were measured by multithit TDC AMSC 64ch AMT-VME module, via Flat Panel
Photomultiplier Tube (FPPMT) HAMAMATSU H8500 and amplifier-shaping-
discriminator (ASD) Gnomes Design GNA-180, of which the time constant was 16 nsec
and the threshold was set to -30 m V on the chip. To monitor cross talk events occurred in
FPPMT, charge pulses from the dynode are measured by ADC LeCroy 2249 A, via
pre-amplifier, is a same amplifier of ASD, and PMT amplifier LeCroy 612A.
Efficiency curves of each tilting angles (0, 5, 10, 15, 30, 45, 60 degrees) are shown
in Fig. 8. A counting rate was about I kHz during measurement. An efficiency of cluster
multiplicity 1 (CI), means that SFD can determine hit positions without any delicate
analyses, reaches nearly 100% at more than 15 degrees. Considering the cladding
thickness, it can be explained加 increaseof the efficiency from 0 degrees to I 0 degrees.
When the operation HV becomes more than 500 V, an efficiency of cluster
multiplicity 2 (C2) increases. It is caused by cross talk events in FPPMT. It can be
confirmed to see correlations between time widths of anode signals and charges of dynode
signals. A distribution of the sum of time widths for each cluster is shown in Fig. 9.
Hatched areas mean cross talk events and can be removed by this analysis. Two bumps of
true hits region at 30, 45 degrees are caused by nonlinear relation between energy loss and
22
time widths of anode signals.
From these measurements, it was confirmed SFD have nearly 100% detection
efficiency. Moreover, for 60 degrees, we could get fairly good position resolution ( < Imm
full width).
The response for high counting rate ( 106 Hz) and heavy ions were also examined
with 390 Me V /u 22Ne primary beam and its secondary beam at HIMAC and the
performance didn’t go down. So SFD is installed in a momentum dispersive focal plane of
SB2 course of HIMAC now. Because momentum dispersion of SB2 course is 2 cm/%, we
will succeed in getting good momentum resolution (く0.1% ) for beam particles.
References
1) Sakaguchi H.,et al., Phys. Rev. C57 (1998) 1749.
Table 1. The p…ters of
S/N p1 p2 p3 p4 p5
Left 2733.68 -1624.82 265.567 80.295 126.83 030320-7
Right 2091.85 257878 1035.4 -171.75 138.36
Left 3198.26 ・1202.99 156.5 37.507 56.746 030527・3
Right 3125.99 1713.67 37.157 17.5 31.707
Left 3654.76 ー807.673 112.77 -208.76 38.875 030527・4
Right 3167.74 1559.21 53.934 37.235 33.438
23
Recoil Partic e Spectrometer
(RPS)
RI beam
M 命+〉
Figure I. Schematic view of日asticScattering of protons with RI beam and photo of Nal(TI) array.
Figure 2. Nal(Tl) rod of 2 x 2 x I 8 inch with Hamamatsu R 1307 PMT.
明「
-
mo 玄,.. ""・
、川崎”
Figure 3. The resolutions at the center of a Nal(TI) rod.
24
26>‘ rー『ー
261
ー2'~0
ー" I ,
ー,.,。
::c、、u: 、,2600 27'‘
J
ー るE,孟-、"" ...J ヱ』ゴ2品 川} ’
TOO『103-0$27-3
(l"叫十.
,.,附暑
2700 t . . 1".•on旧0527-1 .斗’. LJ
_,,., t。。"" 0 "" 100 ,,.
Position (mm)
Figure 4. Gains and resolutions of each Nal(TI)
rod. While the resolutions are within 0.5%
(FWHM), fluctuation of the gains is about 6%.
3000
2600
Left 2800
nu
《リV
ハu
nunuv
《
U
ε
U
P
句
内
d
Ra’
色
丹
4
内
4
ト・0N円号向。
zo岡山』
31100
:2::;'.2aoo UN 、.〆'!:'
c !!?2600 ・; g c.!l ~ 2400
W巴
十 Jt.__. L』 4ー」L
100 100 0
Position (mm)
Figure 5. Left and right gains of each position in each Nal(TI) rod. fitted these to a function of an巳xponentialand a Gaussian.
し..77~6MeV .. ±310,keV .似 4
@
i-
i
m
2 2480 ω 、_, 2<60
ロ。:;:: 2s•or 1 何十 :
主 2520~t
~ 250件一一包2480ト1.._. r .
匂・4
C喧 2460,-、
告別、_,場d
L・.2520 r:;;< r:JJ 2500
2540
2520
150 100
Position (mm) 100 -150
They are within just Figure 6. Each square root gains after calibration. about 600 keV in full width.
25
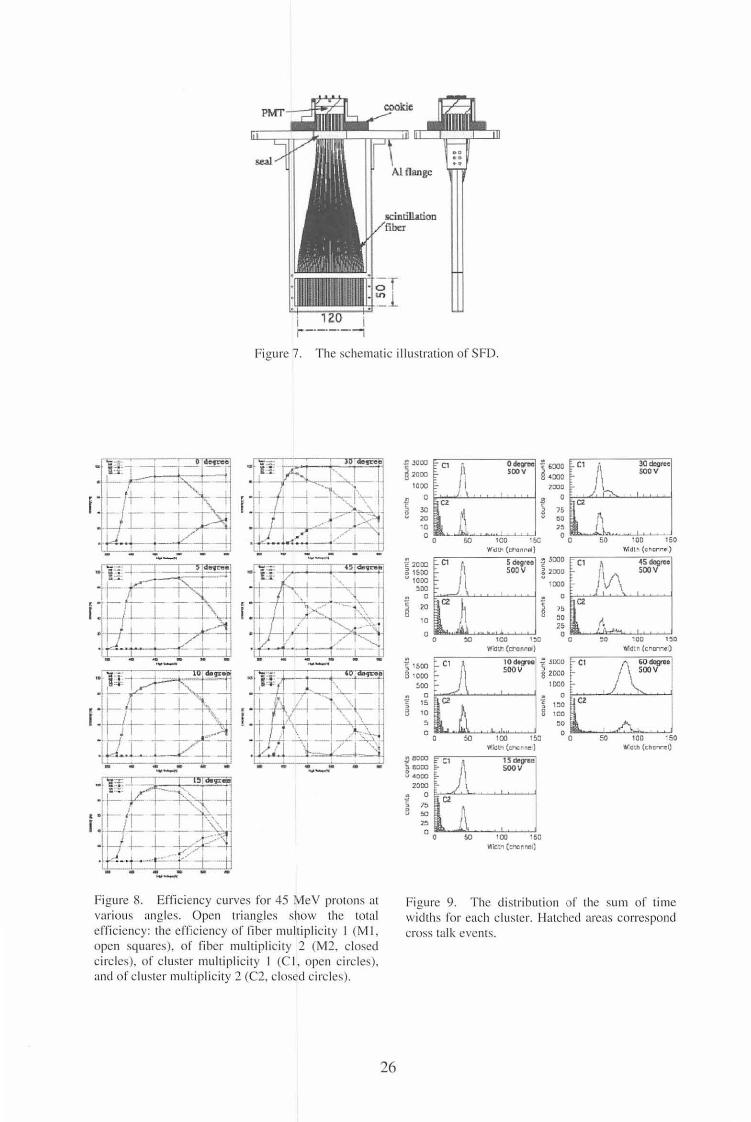
Figure 7. The schematic illustration or SFD.
Figure 8. Efficiency curves for 45 MeY protons at
various angles. Op巴n triangles show the total
cffici巴ncy:the efficiency of fiber multiplicity I (MI,
open squares). or fiber multiplicity 2 (M2. closed circles). or cluster multiplicity I (CI, open circles),
and or cluster multiplicity 2 (C2, closed circles).
26
!! JO田c
9 20田
1000
聖ロ
書 mu 20
”
・a 0
芭201Xli: 1500 u 1由民3
S間
”。c d初、。
口
0
。 ヨー
~副主 60005由 V lg叩 o
W"d:t>(ct"<lnrol)
Zllコ00 J!
c ~ 75
‘’ 00 ,. 0
一ーす石Qi司~ 3000 ---・・--・ c 500 v ~ 2国 0
100。
..,...,由{町、onr刷}
口
l :: ~jl ~1:: t :1~ ~ )~i :~j
。 臼 ) 100 ISD 0
i:: Eα u,・000E-
2000 c;.
E;民自 由
2!I
鈎
一一守宮石否iOi500ν
’00 15D W面白肌(er、町内四1)
よ50
100 150
Mdth (<hann・1)一寸E高E
5αlV
100 150 W'dth (<hcnr<I)
Figure 9. The distribution or the sum or time
widths for each cluster. Hatched areas correspond
cross talk events.
CYRIC Annual Report 2005
II. 6. Development of a Novel Fast・responseNeutron Beam Monitor
Nakhostin M.1, Baba M.1, Oishi T.1, /toga T.1, Kamata S.1, Unno Y.1, and Otsuki T.2
Introduction
Cyclotron and Radioisotope Center, Tohoku University Laboratory for Nuclera Study, Tohoku Univeris砂
During the last year we have been involved with the development of fast response
neutrons detectors. Such detectors訂erequired for couple of applications. A prominent
example of such applications is intense neutron beam monitoring in next generation of
accelerator-based neutron sources. Such accelerators紅 enow under construction in
several countries. For example, in Japan, Japan proton accelerator research complex
(J-PARC) is being built. In this project very intense thermal neutron beams will be
available and therefore appropriate neutron detectors紅 erequired to provide information on
the neutron beam such as intensity, spatial and time distribution. In such a harsh
environment, detector radiation durability is of crucial importance as well.
This report is devoted to the preliminary results of a novel fast neutron beam
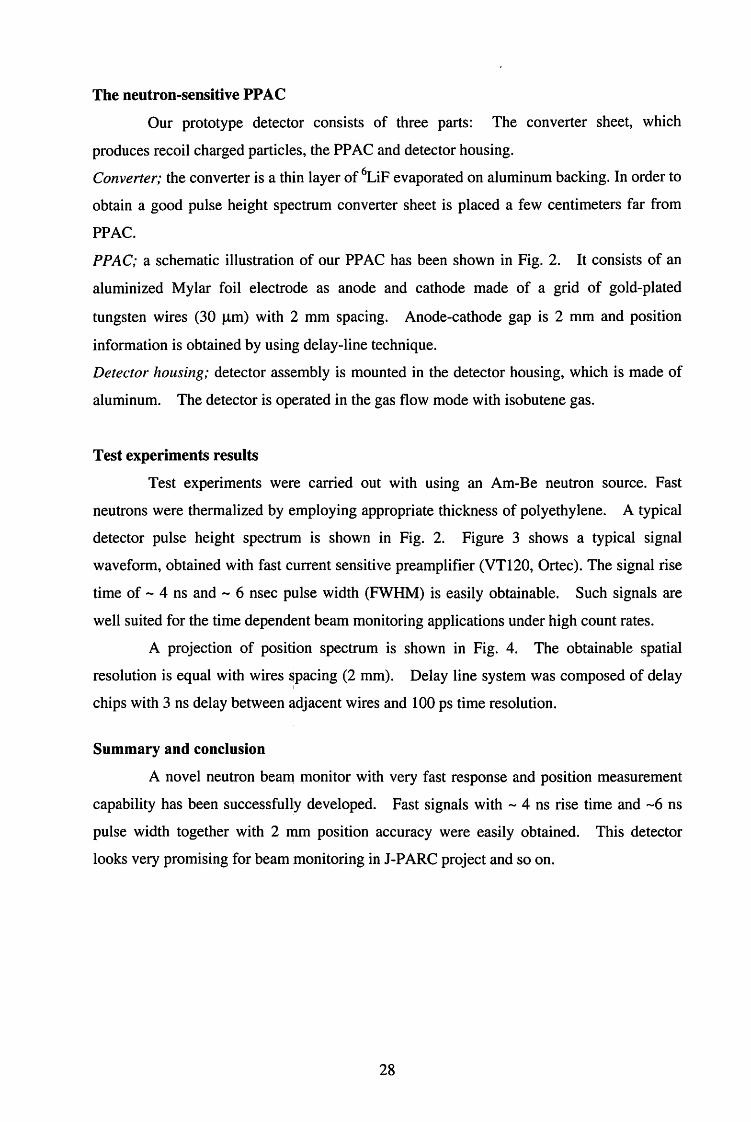
monitor, which is based on the parallel plate avalanche chamber (PPAC). Choice of PPAC
was made due to its fast response, radiation resistance, high-count rate and position
measurement capability.
Parallel plate avalanche counters
A PPAC consists simply of two thin metalized foils mounted in parallel, with a
small gap of a few mm in between (Fig. 1). PPAC is employed at a few to汀 ofa
hydrocarbon gas like isobutene, and under a strong electric field E in the gap. Due to the
high-reduced electric field, EIP, (Pis gas pressure) released electrons by ionizing radiations
initiate electron avalanche and form a very fast signal (~1 ns rise time) due to the high
drift velocity of electrons. Detector can be easily made position sensitive, if an electrode is
made of a grid of parallel thin wires or parallel strips. Then, position data can be obtained
by means of conventional methods like delay line or charge division method.
27
The neutron-sensitive PPAC
Our prototype detector consists of three p紅白: The converter sheet, which
produces recoil charged particles, the PP AC and detector housing.
Converter; the converter is a thin layer of 6LiF evaporated on aluminum backing. In order to
obtain a good pulse height spectrum converter sheet is placed a few centimeters far from
PPAC.
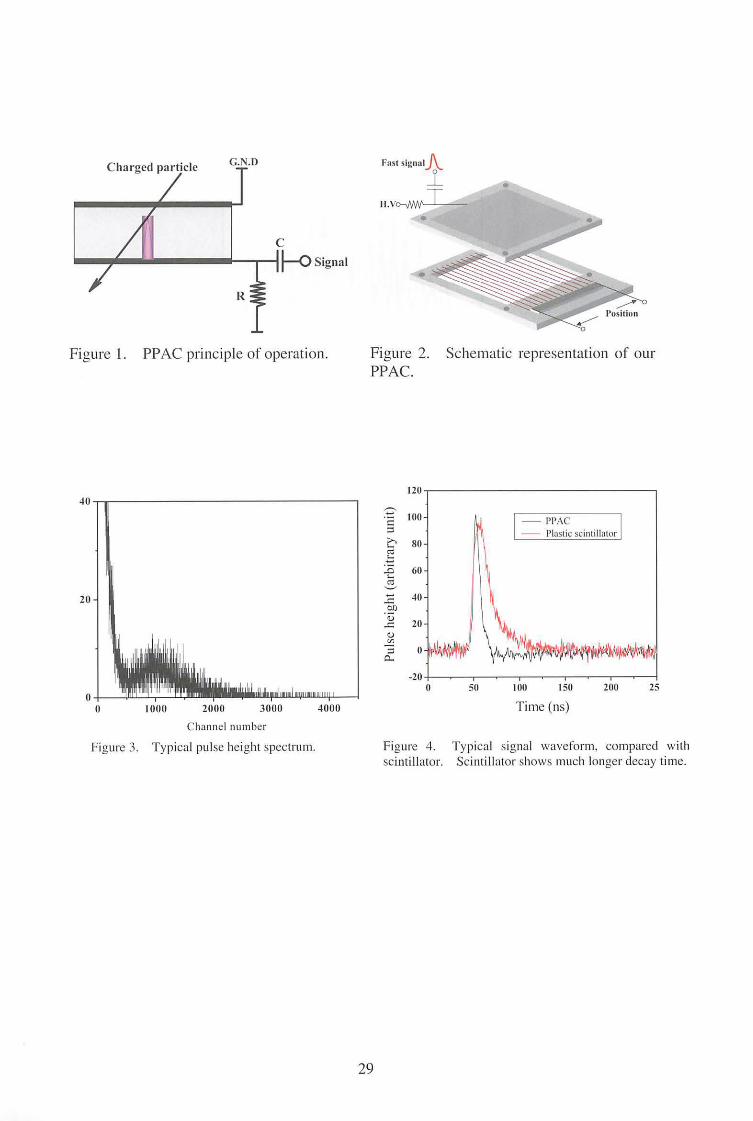
PPAC; a schematic illustration of our PPAC has been shown in Fig. 2. It consists of an
aluminized Mylar foil electrode as anode and cathode made of a grid of gold-plated
tungsten wires (30 μm) with 2 mm spacing. Anode-cathode gap is 2 mm and position
information is obtained by using delay-line technique.
Detector housing; detector assembly is mounted in the detector housing, which is made of
aluminum. The detector is operated in the gas flow mode with isobutene gas.
Test experiments results
Test experiments were carned out with using an Am-Be neutron source. Fast
neutrons were thermalized by employing appropriate thickness of polyethylene. A typical
detector pulse height spectrum is shown in Fig. 2. Figure 3 shows a typical signal
waveform, obtained with fast cu町entsensitive preamplifier (VT120, Ortec). The signal rise
time of~4 ns and ~6 nsec pulse width (FWHM) is easily obtainable. Such signals are
well suited for the time dependent beam monitoring applications under high count rates.
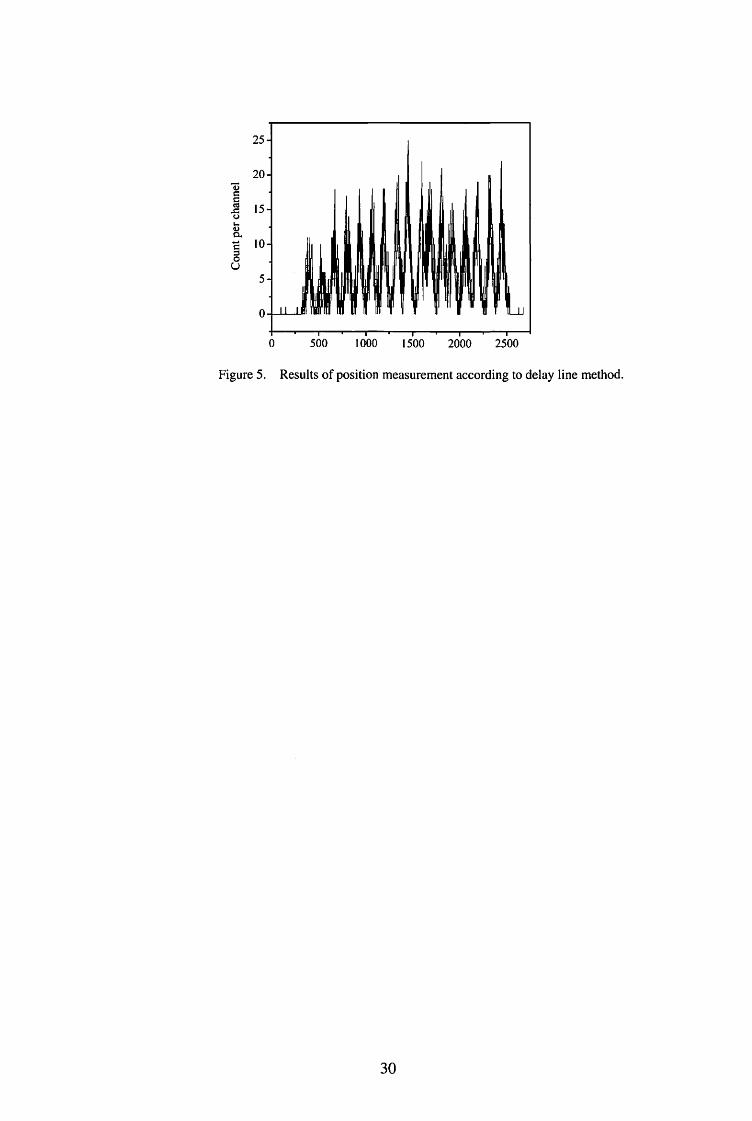
A projection of position spectrum is shown in Fig. 4. The obtainable spatial
resolution is equal with wires spacing (2 mm). Delay line system was composed of delay
chips with 3 ns delay between a司jacentwires and 100 ps time resolution.
Summary and conclusion
A novel neutron beam monitor with very fast response and position measurement
capability has been successfully developed. Fast signals with ~4 ns rise time and ~6 ns
pulse width together with 2 mm position accuracy were easily obtained. This detector
looks very promising for beam monitoring in J-PARC project and so on.
28
山畦H .Vo--,附工~
可吾
トー0Signa
G.N.D
R
Charged particle
Schematic representation of our Figure 2. PPAC.
PPAC principle of operation. Figure 1.
25 200
一一- PPAC - Plastic sc111tilla1or
150 100 50
120
60
20
-20 0
40
JOO
80
(--z-dh-E-z・5)三∞むこ
ω∞一コ円一
40
20
Time (ns) 。。
Typical signal waveform. compared with Scintillator shows much longer d巴caytime.
Figure 4. scintillator.
29
4000 3000
Typical pulse height spectrum.
2000
Channel number
nu ou
ou
l
Figure 3.
25
20
15
10
5
一ωロロ何回{υ』ω弘剖ロョ。
υ
。2500
Results of position measurement according to delay line method.
30
2000 1500 1000 500 。Figure 5.

III. NUCLEAR ENGINEERING
CYRIC Annual Report 2005
III. 1. Tail Correction in Quasi-monoenergetic Neutron Source
Kamala S., /toga T., Unno Y., and Baba M.
Cyclotron and Rα'dioisotope Center, Tohoku University
Mono-energetic neutron source plays an important role for cross-section
measurement, dosimetry development, testing of semi-conductors for single-event effects
and so on. In the energy region above 20 MeV, the 7Li{p,n) and 9Be(p,n) neutron source
have been employed as an intense “monoemnergetic”neutron source. Actually, however,
they are not purely mono-energetic but quasi-monoenergetic because continuos spectrum
neutrons (tail) are produced from breakup reactions and accompany with the main peak
neutrons.
In the measurement using such sources, large errors comes from the background
due to low energy tail as well as limited intensity of the peak neutrons. To improve the
situation, we have installed and characterized an intense quasi-monoenergetic neutron
source at CYRICl). Now we are promoting the study of the applicability of the “t泊l
correction”method which is the correction for backgrounds due to tail, reported by R.Nolte
et al. for 200 Me V proton beams2>. Their tail correction is based on the fact that the
high-energy peak neutron decreases rapidly with angle whereas the shape of the “tail”
neutrons does not change considerably. Therefore we can get corrected
quasi-monoenergetic neutron spectrum by subtracting the data in larger angle from that in
smaller angle (zero-degふ
In order to inspect the applicability of this “tail correction method" in our energy
range, we carried out experiment for 70 Me V protons and obtained neutron spectrum from a
Li target, and Be target at 5th target room at CYRIC. The experimental method was
almost the same with these in previous experiments3>. A thin target of lithium ( 4.69 mm
thickness), a thin target of beryllium (3.0 mm thickness) and a thick target of copper (10
mm thickness) in order to determine the timing of prompt gamma ray event were prepared.
The neutron spectra were measured with time-of-flight method using a beam
31
swinger system over a wide range (5-70 Me V) of secondary energies at seven laboratory
angles for lithium and nineteen angles for beryllium respectively, between 0-and 110-deg.
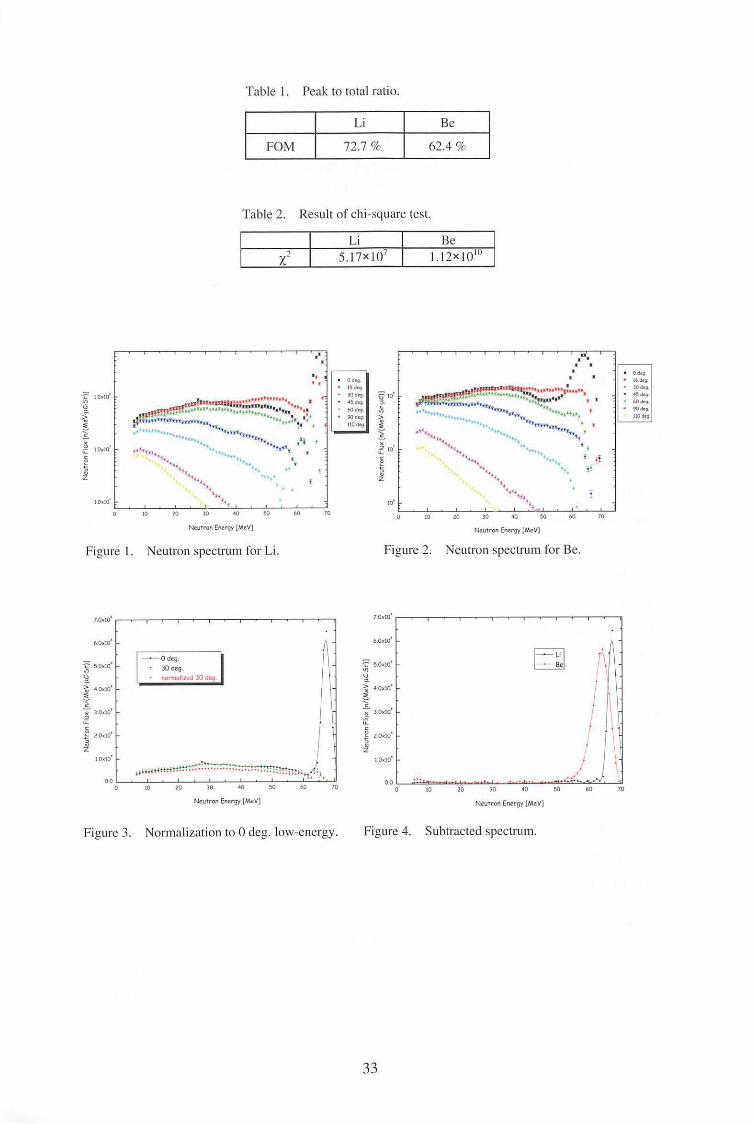
The results are shown in Fig. 1 and Fig. 2. These figures show that peak neutrons from
lithium and beryllium tend to decrease very rapidely with the neutron emission angle but the
low-energy tail show much milder angle-dependence.
Let two neutron spec町ameasured at 0 deg. and 0 (larger than 0 deg.) be 中oand φ0・
We normalize the spectra to the same flux in the low-energy tail region by multiplying the
spectrumφ0 by a factor k. The normalize factor is determined in order to avoid negative
value of subtracted spec佐um.The subtraction equation as follows:
φ=φ。-k・φ。where φis the corrected spectrum,
φo is spectral fluence at angle 0 deg.
cp0 is spectral fluence at angle 0.
k is a normalize factor.
Figure 3 indicates 0 deg. spectrum and 30 deg. spectrum normalized to 0 degree‘s
low-energy tail region.
With a view to select optimum angle for the “tail co町ectionぺweevaluated the
three quantities: 1) peak-to-total flux ratio, 2) chi-square test on each energy bin, 3) feature
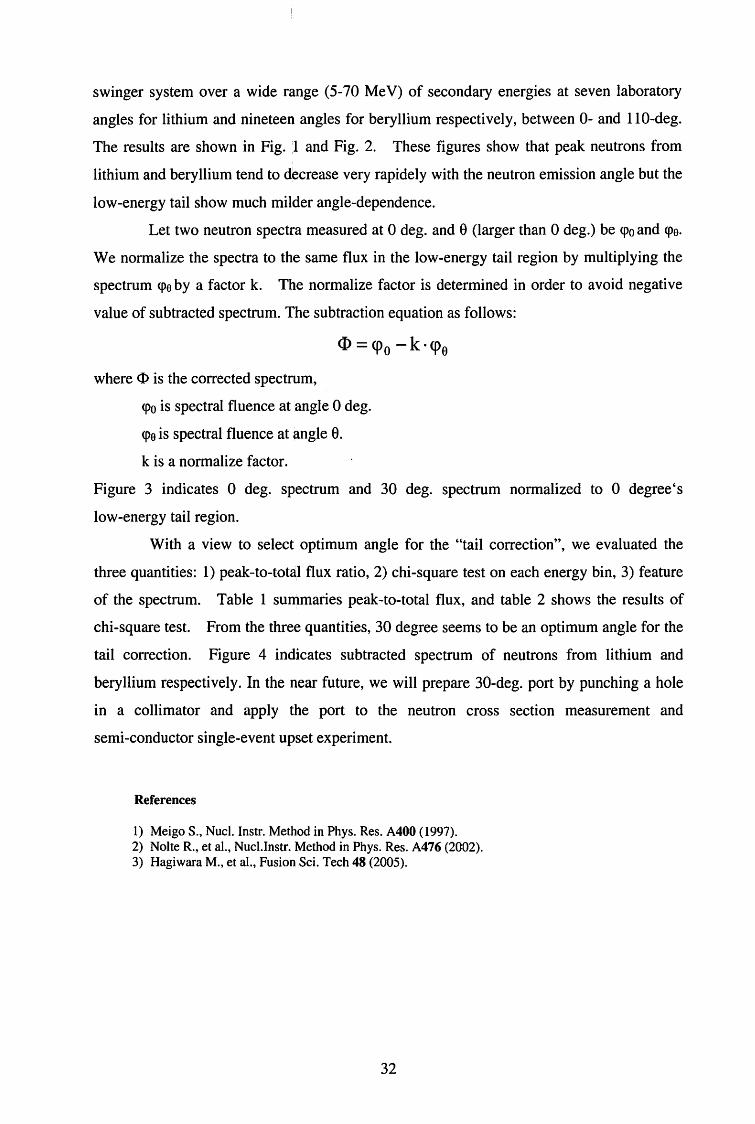
of the spectrum. Table 1 summaries peak-to・totalflux, and table 2 shows the results of
chi-squ紅etest. From the three quantities, 30 degree seems to be an optimum angle for the
tail correction. Figure 4 indicates subtracted spectrum of neutrons from lithium and
beryllium respectively. In the near future, we will prepare 30・deg.port by punching a hole
in a collimator and apply the port to the neu甘oncross section measurement and
semi-conductor smgle-event upset experiment.
References
1) Meigo S., Nucl. Instr. Method in Phys. Res. A400 (1997). 2) Nolte R., et al., Nucl.Instr. Method in Phys. Res. A476 (2002). 3) Hagiwara M., et al., Fusion Sci. Tech 48 (2005).
32
Peak to total ratio. Table I.
Be Li
62.4 % 72.7 % FOM
Result of chi-square test. Table 2.
Be lfl訂守万
Li
5百石07χ2
判\\
岡町
dHV電離
一“t‘・..一
司‘、-. .., .. .. .. ・<‘・,. " ’a . ..“ .
"" ... . 4一
副』ー『...L-ーーニ30 岨 回
出 ur河 内E噌叩y[MeV)
J0
.,nu
{(
U
-tり〉ωさ)、iX2LcE吉ωZ
---同時間四位出;;:::~:: ::~..川_.. ~~い川H・a・ ; ---··
酬川町.曲閉 ι ...
疋 里唖- .且 .
" ・・......・ .......... ,m:.,. .. ・. 「..’- ...... ' 、ι... . .......’l
....J...._
日t0
.
0
&
王
Ji 10.10・、,〉・ω:,;
"' ~ 1°'10’
f コ芝
10.10'
' 0 70 曲
Neutron spectrum for Be.
2。10
Figure 2.
70 60 20
Neutron sp巴ctrumfor Li.
10
Figure I.
70• 10'
国
ー『ー....... ーム"'-'30 40
Neutron E問 rgy[MeV)
』
旧
。O•IO'
。。。
o
o
x
x
H
H
H
0
0
0
0
0
5
4
3
2
1
【で叫
Uユ〉
ω淫てE]
X2比c。、吉ωZ
。。。H…川?同一一一ーで:?::n";o(:'.=.10 20 30 崎日 60 7。
ト品色川問nE隅吋y[MeV)
・-0 d句30 deg
問問、olozed30 d句
7 0 •10'
。0<10'で 50,10'同、B壱4。''"= E
1己主Jo.to・u..
~ . l 2 0 •10
10d0'
00 0 70 20
Subtracted spectrum. Figure 4.
33
Normalization to 0 deg. low-energy. Figure 3.
CYRIC Annual Report 2005
III. 2. Study, of low energy fragment measurement using: energy time of flight method
Oishi T.1, Sanami T.2, HagiwaraM.2, Okuji T.1, /toga T.1, and BαbaM.1
1 Cyclotron and Radioisotope Cellter, Tohoku University ~High energy accelerator research organization
In the evaluation of the single event effects (SEE) which cause semiconductor
memory errors, detailed knowledge are required on the charge, mass, and energy not only
for primary p訂ticlebut also secondary particles produced in semiconductor. In particular,
fragments produced by ten’s of Me V nucleons are important due to the large liner energy
transfer (LET) of fragment and high flux of incident particles in space. However, the
experimental data of the fragment production are very few due to the experimental
difficulty of a small amount of produced fragments, large energy loss, and high back ground
of light particles. Especially, the fragment production cross-section in low energy region
will be very important to evaluate the SEE because the fragments production cross-section
increases toward lower energy. However there is no experimental data. We have been
conducting measurement of fragment production using specially developed Bragg curve
counter and the energy time-of-flight method. In this report, the energy-TOP method is
discussed to measure the fragment production cross-sections in low energy region,
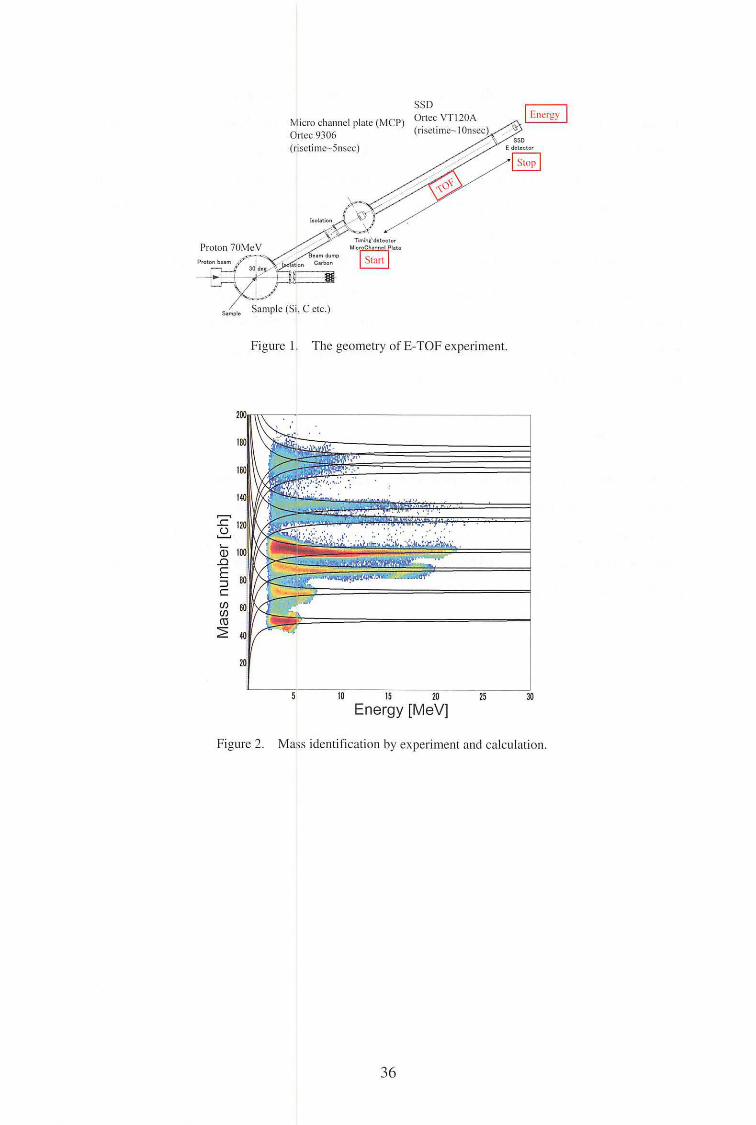
The Energy Time of flight (E-TOF) method can identify the mass of the particles
using the energy and TOF information as explained by the equation:
E = mv212 = m/2x(Llt)2・・・(1)'
where Eis the energy of the particle, mis mass of the particle, Lis the flight pass, tis TOF.
The advantage of this method is the wide energy range to be covered and there is no low
limit in principle. The experiment was carried out in the No. 2 target room of CYRIC.
The experimental geometry is shown in Fig. 1. The fragments which was produced by 70
MeV protons were detected by micro-channel plate (MCP) and SSD. Fast preamplifiers
were used to achieve good timing resolution over a wide energy region. In the first
experiment, analog circuits were used for a signal processing but there were distortions in
34
low energy region due to“walk”on the timing detection. To overcome this problem, the
digital signal processing (DSP) technique was introduced. The DSP is a data handling
method in which each signal waveform from a detector is acquired as digital data, and the
information on the radiation can be derived through the analysis of the signal waveform
using computers. By applying DSP, even small pulses were could be without the “walk”
by ideal constant fraction discrimination enabled by DSP.
The two dimensional plot of the energy-TOP distribution is shown in Fig. 2. The
horizontal axis is energy of the fragments and the vertical axis is tfE which is derived
from eq.1. Boundary energy to identify the particles was investigated. Dispersion of each
mass line is derived by the propagation of e町orsand expressed by eq.2, where O't and σE is
the resolution of TOP and energy, respectively.
日=阿+手σ1・ ・(2)
。; andaE were adjusted by the experimental value. The boundary energy was found by
changing the resolutions. As a result, the boundary energy became lower owing to improved
energy resolution while the boundary energy does not change from the old data with
infereior TOP resolution. Additionally it became clear that 2.5% energy resolution is
needed to identify above 2 Me V of the carbon p訂ticles.
35
SSD Ortcc VTl20A Micro channel plate (MCP) ~
Ortcc 9306 (risctimc~5nscc)
S•mpl・
Figureし Thegeom巴tryof E-TOF experiment.
10 15 20 25 30
Energy [MeV]
Figure 2. Mass id巴ntificationby experiment and calculation.
36
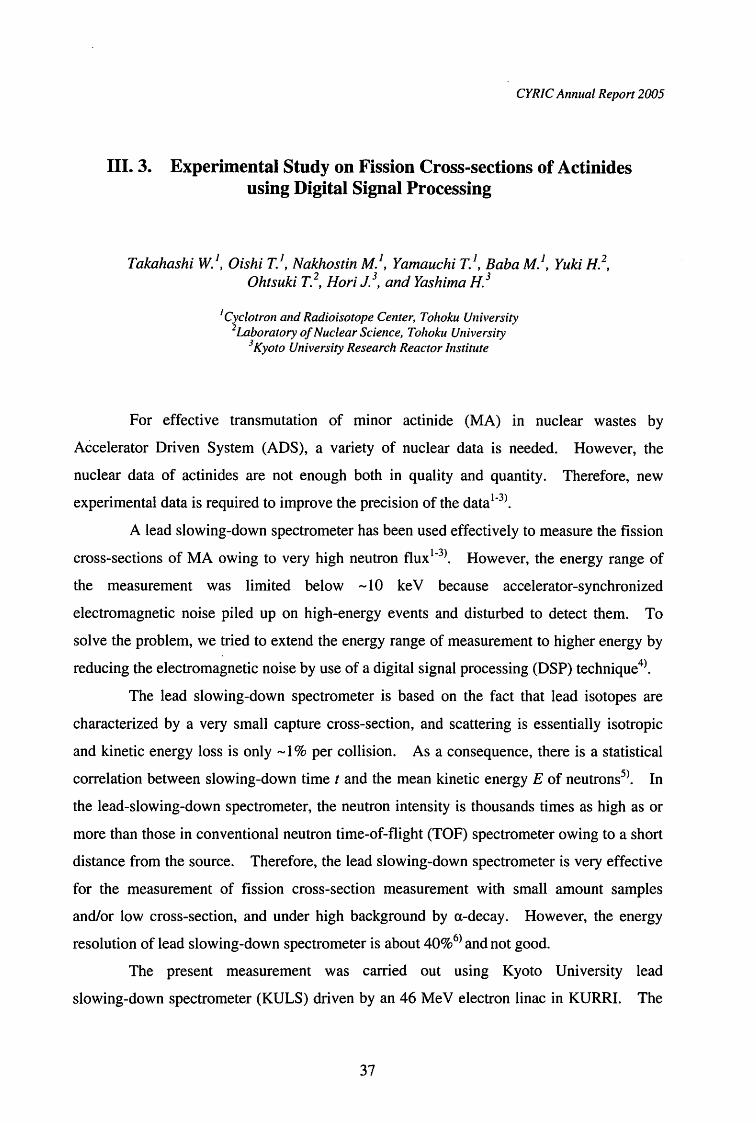
CYRIC Annual Report 2005
III. 3. Experimental Study on Fission Cross-sections of Actinides using Digital Signal Processing
Takahashi W. 1, Oishi T. 1, Nakhostin M. 1, Yamauchi T. 1, Baba M. 1, Yuki H.2, Ohtsuki T. 2, Hori J. 3, and 均'ShimaH.3
1 Cyclotron and Radioisotope Center, Tohoku University ~Laboratoη of Nuclear Science, Tohoku University
.l Kyoto University Research Reactor Institute
For effective transmutation of minor actinide (MA) in nuclear wastes by
Accelerator Driven System (ADS), a variety of nuclear data is needed. However, the
nuclear data of actinides are not enough both in quality and quantity. Therefore, new
experimental data is required to improve the precision of the data 1・3)_
A lead slowing-down spectrometer has been used effectively to measure the fission
cross-sections of MA owing to very high neu住onflux1・3>. However, the energy range of
the measurement was limited below ~10 keV because accelerator-synchronized
electromagnetic noise piled up on high-energy events and disturbed to detect them. To
solve the problem, we tried to extend the energy range of measurement to higher energy by
reducing the electromagnetic noise by use of a digital signal processing (DSP) technique 4).
The lead slowing-down spectrometer is based on the fact that lead isotopes are
characterized by a very small capture cross-section, and scattering is essentially isotropic
and kinetic energy loss is only ~1 % per collision. As a consequence, there is a statistical
correlation between slowing-down time t and the mean kinetic energy E of neutrons5). In
the lead-slowing-down spectrometer, the neutron intensity is thousands times as high as or
more than those in conventional neutron time-of-flight (TOF) spectrometer owing to a short
distance from the source. Therefore, the lead slowing-down spec町ometeris very effective
for the measurement of fission cross-section measurement with small amount samples
and/or low cross-section, and under high background by α-decay. However, the energy
resolution of lead slowing-down spectrometer is about 40%6) and not good.
The present measurement was carried out using Kyoto University lead
slowing-down spectrometer (KULS) driven by an 46 MeV electron linac in KURRI. The
37
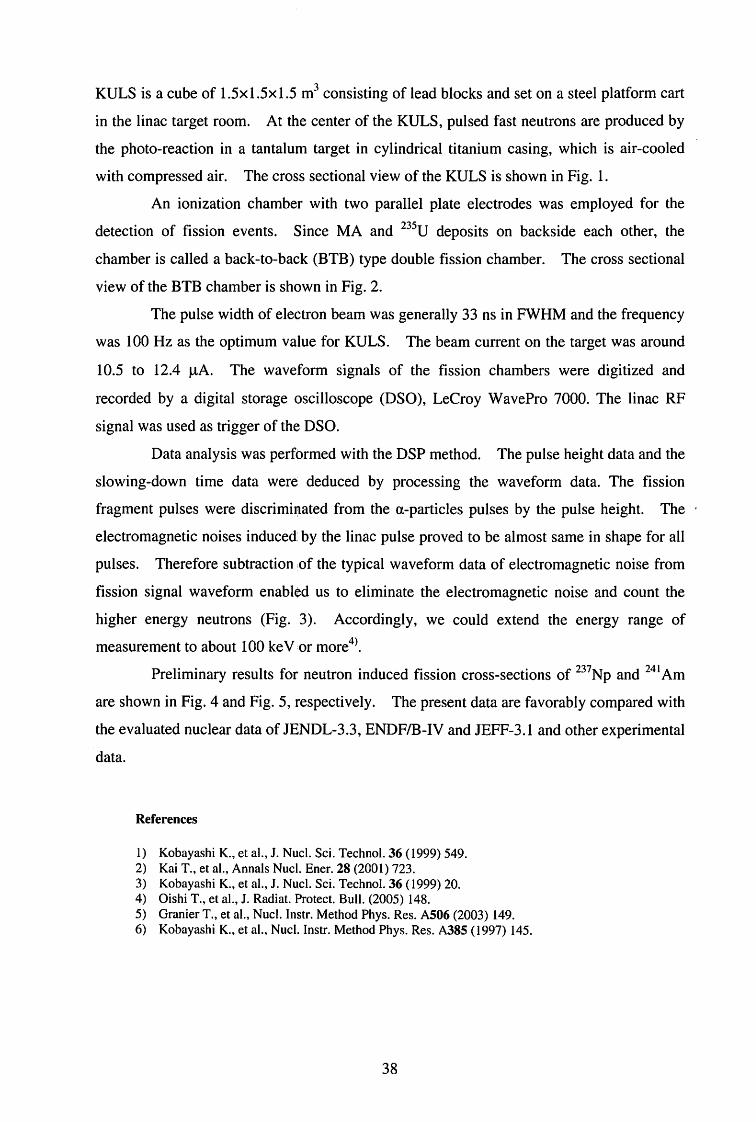
KULS is a cube of 1.5×1.5×1.5 m3 consisting of lead blocks and set on a steel platform cart
in the linac target room. At the center of the KULS, pulsed fast neutrons are produced by
the photo-reaction in a tantalum target in cylindrical titanium casing, which is air-cooled
with compressed air. The cross sectional view of the KULS is shown in Fig. 1.
An ionization chamber with two parallel plate electrodes was employed for the
detection of fission events. Since MA and 235U deposits on backside each other, the
chamber is called a back-to-back (BTB) type double fission chamber. The cross sectional
view of the BTB chamber is shown in Fig. 2.
The pulse width of electron beam was generally 33 ns in FWHM and the frequency
was 100 Hz as the optimum value for KULS. The beam cu町enton the target was around
10.5 to 12.4 μA. The waveform signals of the fission chambers were digitized and
recorded by a digital storage oscilloscope (DSO), LeCroy WavePro 7000. The linac RF
signal was used as trigger of the DSO.
Data analysis was perfbrmed with the DSP method. The pulse height data and the
slowing-down time data were deduced by processing the waveform data. The fission
仕agmentpulses were discriminated from the αーparticlespulses by the pulse height. The ・
electromagnetic noises induced by the linac pulse proved to be almost same in shape for all
pulses. Therefore subtraction ,of the typical waveform data of electromagnetic noise from
fission signal waveform enabled us to eliminate the electromagnetic noise and count the
higher energy neutrons (Fig. 3). Accordingly, we could extend the energy range of
measurement to about 100 ke V or more4>.
Preliminary results for neutron induced fission cross-sections of 237Np and 241 Am
are shown in Fig. 4 and Fig. 5, respectively. The present data are favorably compared with
the evaluated nuclear data of JENDL・3.3,ENDF/B-IV and JEFF-3.1 and other experimental
data.
References
1) Kobayashi K., et al., J. Nucl. Sci. Technol. 36 (1999) 549. 2) Kai T., et al., Annals Nucl. Ener. 28 (2001) 723. 3) Kobayashi K., et al., J. Nucl. Sci. Technol. 36 (1999) 20. 4) Oishi T., et al., J. Radiat. Protect. Bull. (2005) 148. 5) Granier T., et al., Nucl. Instr. Method Phys. Res. A506 (2003) 149. 6) Kobayashi K., et al., Nucl. Instr. Method Phys. Res. A385 (1997) 145.
38
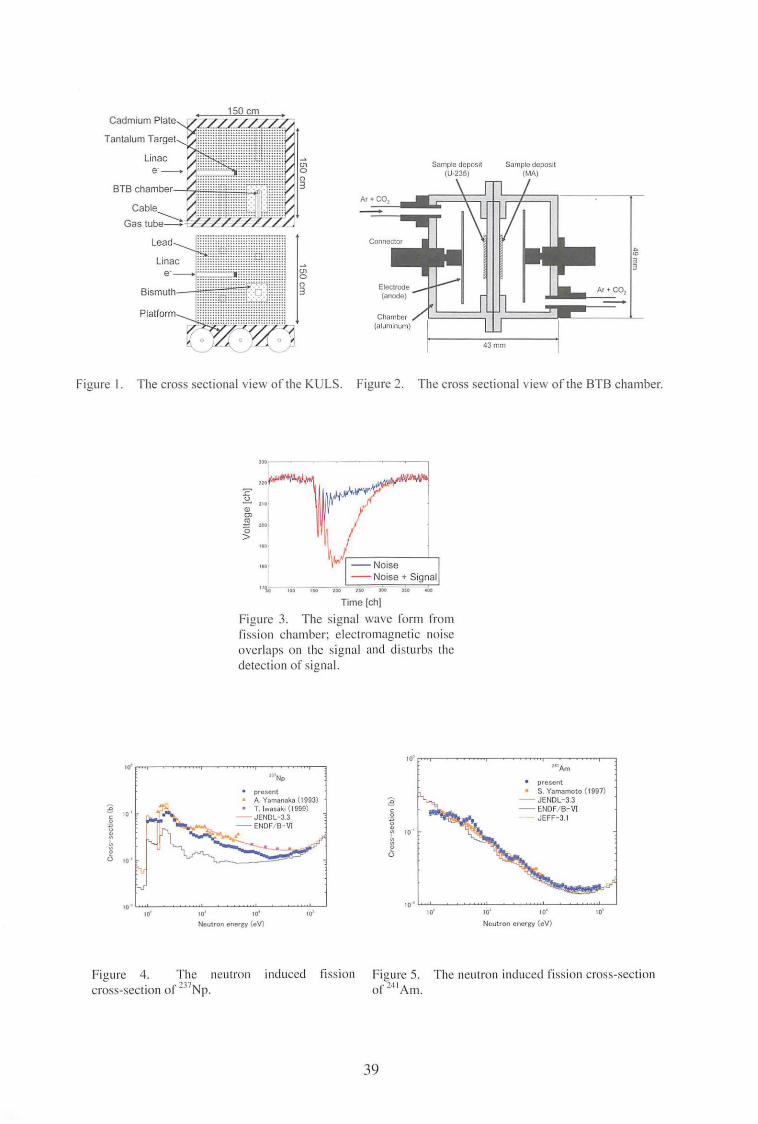
ゐ也ヨヨ
Sample dcpos11
(MA)
Samp'e depos同
(U・235)
品川山口ロヨBismuth
Platform
言:::阿国ロ3由。〉
’、
43mm
The cross sectional view of the BTB chamber. Figure 2. The cross sectional view o「theKULS. Figure I.
一一-Noise- Noise + Signal
“””。’”’”’””。 .”Time [ch]
Figure 3. The signal wave form from
fission chamber; electromagnetic noise
overlaps on the signal and disturbs the
d巴I巴ctionof signal.
州 Am
・present
S Yamamoto (1997) JENDL-3.3
一一ーENDF/B-VIJEFF-3.1
10•
nu
{
a)
coauω
”’凶例。‘口
"'Np
• present • A Yamonnka (1993)
・T lwo印刷 (1999)
一一一JENDL-3.3
一一-ENOF/B-Vl
、ぜ
0
0
(
a}
g
。30ω”’”2EU
10’ 10' ’o• Neutron e同 rgy(eV}
10' 10’
10' 10・,o'
Neu tr。nene<gy (eV}
10’ 10.
The neutron induced fission cross-section Figure 5. of 241 Am.
39
fission induced Fi!!.ure 4. The n巴utron237
cross-section of No.
•• 1-1
.,
、
.
可・
E
』
1
・
. . .・・ . . 、 . .
“二3
.
.、今...’・
.. . . . 、
・- .. .‘ .、
」
I:• ;
-. • '・. .
? .. ,
. ・'1, •
-
I •・
-m .‘
、l.
l
. •' . ・o
,、!「.
. -
・?.. ,
. .

IV. NUCLEAR恥1EDICALENGINEERING
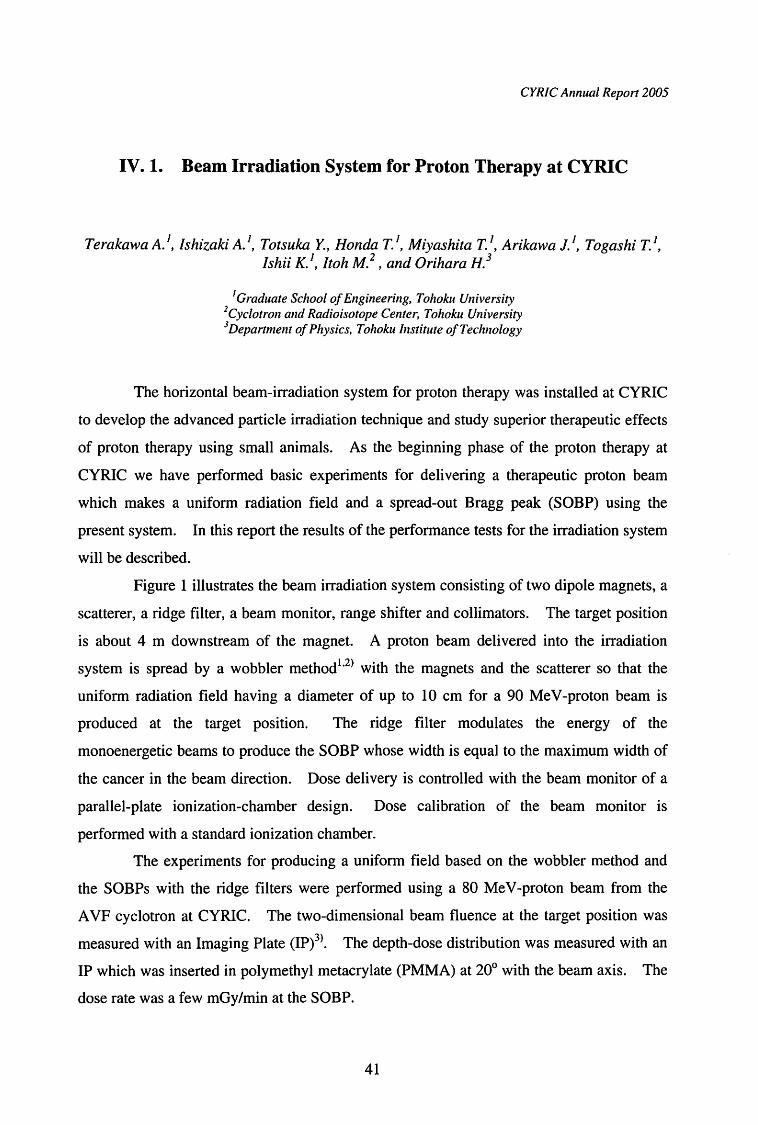
CYRIC Annual Report 2005
IV. 1. Beam Irradiation System for Proton Therapy at CYRIC
Terakawa A. 1, Ishizaki A. 1, Totsuka Y., Hondf!. T. 1, Miyashita T. 1, Arikawa J. 1, Togashi T. 1, Ishii K.’, Itoh M . .:. , and Orihara H・
2 1 Graduate School of Engineering, Tohoku UniversiザCyclotron and Radioisotope Center, Tohoku Universiη 3Department of Physics, Tohoku Institute of Technology
The horizontal beam-irradiation system for proton therapy was installed at CYRIC
to develop the advanced p訂 ticleirradiation technique and study superior therapeutic effects
of proton therapy using small animals. As the beginning phase of the proton therapy at
CYRIC we have performed basic experiments for delivering a therapeutic proton beam
which makes a uniform radiation field and a spread-out Bragg peak (SOBP) using the
present system. In this report the results of the performance tests for the irradiation system
will be described.
Figure 1 illustrates the beam irradiation system consisting of two dipole magnets, a
scatterer, a ridge filter, a beam monitor, range shifter and collimators. The target position
is about 4 m downstream of the magnet. A proton beam delivered into the irradiation
system is spread by a wobbler method1・2> with the magnets and the scatterer so that the
uniform radiation field having a diameter of up to 10 cm for a 90 Me V-proton beam is
produced at the target position. The ridge filter modulates the energy of the
monoenergetic beams to produce the SOBP whose width is equal to the maximum width of
the cancer in the beam direction. Dose delivery is controlled with the beam monitor of a
parallel-plate ionization-chamber design. Dose calibration of the beam monitor is
performed with a standard ionization chamber.
The experiments for producing a uniform field based on the wobbler method and
the SOBPs with the ridge filters were performed using a 80 Me V-proton beam from the
A VF cyclotron at CYRIC. The two-dimensional beam fluence at the target position was
measured with an Imaging Plate (IP)3>. The depth-dose distribution was measured with an
IP which was inserted in polymethyl metacrylate (PMMA) at 20° with the beam axis. The
dose rate was a few mGy/min at the SOBP.
41

Figure 2 shows typical results for a uniform field of about 80 mm in diameter and
The flatness of the field is less than 5% which has
sufficient quality for proton therapy, while the flatness of about 6% for the SOBP should be
the depth-dose distribution in PMMA.
improved.
In the following phase we are plann川gto perform not only the clinical experiments
using a rat but also the beam-delivery experiments based on a spot-beam scanning for
development of the advanced irradiation technique.
References
Akagi T司 clal.. Phys. Med. Biol. 48 (2003) N30 I. Tamura H.『 etal.. Japan. J. Med. Phys. 18 ( 1998) -l2. Fuji Photo日ImCO .. LTD .. hllp://www.fujifilm.eo.jp/bio/si_imgplate/imgplatc.html.
)))
’l司ノ-今、d
Collimetor and bolus
Ridge filter
Target
-I
Dose monitor
-n.
lLトι
-
-s- H
Wobbler/scanning magnets
;s
凪三DJ~j'
v
ャ14
Proton
」一一___.島小It • .1. ;1
百
Schematic layout of the beam irradiation system for proton therapy at CYRIC.
42
Figure I.
" - .. ...
-. ・、.一. . . . . .
.~ .
舎で
.. ・4・.・-
「,._. . -ー一一一ーー一一一-:a
1.0
0.8
0.6
0.4
0.2
0
刃包
ω己〈
ωσωωヨ-3gwコω芹V\
5
5
5
U
7
Z
-50 o 50 mm Distance from the beam axis (mm)
ニ~5こ口口75 ε口ZS
記 述法j
SOBP
Bragg peaヤ
1.0
刃
*-0.6 r+ 〈。
0.8
0.4 aoω
。三三ー
Width of the cancer
.-=:=:..
Expt.
Expt.
Cale.
0.2
40 10 20 30
Depth from the surface (mm)
0.0 0
Uniform field of about 80 mm in diameter (upper) and depth-dose distribution in PMMA
43
Figure 2.
(lower).
CYRIC Annual Report 2005
IV. 2. Benchmark Experiments on Neutron Moderator Assembly for Cyclotron-Based Boron Neutron Capture Therapy
Unno Y.1, Yonai S.2, Baba M.1, /toga T.1, Kamada S.1, :Tahara Y.3, and Yokobor H.4
1Cyclo_tron and Radioisotope Center, Tohoku Universiか~Na!ional Institute of Radiological Sciences
J Engineering Development Co., Ltd. 『'AdvancedReactor Technology Co., Ltd.
In ref.1・2>, we have proposed a neutron moderator system for a cyclotron-based
Boron Neutron Capture Therapy (BNCT). Nevertheless, a cyclotron with a beam power of
50 Me V and 300 μA is not realized yet. Therefore, to facilitate the realization of a
cyclotron-based BNCT neutron filed, we started the design of the BNCT assembly
employing a commercially available high-intensity cyclotron with a beam power of 30
MeVx750 μA. The design resulted in very promising feature and engineering design also
indicated feasibility of the ass~mbly. However, the validity of the design depends on the
adequacy of the simulations by the MCNPX code3> and LA150 data library4> which were
used in the design calculation and not validated yet.
In order to confirm the adequacy of neutron production and transport by MCNPX,
we carried out two experiments,; 1) measurement of neutron energy spectra from a tantalum
thick target for 30 MeV protons with the TOF method, 2) measurement of the neutron
energy spectrum for仕・eatmentusing multi-moderator spectrometer5> with the sand-II
unfolding code6>.
The results for angle-dependent neutron energy spec甘afor the Ta(p,xn) reaction at
30 Me V (experiment 1)訂eshown in Fig.1. The present study is to evaluate the adequacy
of the calculation of the neutron source. Then, Figure 2 shows the comparison between
the calculation and the measurement of the Ta(p,xn) neutron spectra at 90-deg. The data
for tungsten is shown for LA150 data because, in LA150 library, the neutron emission data
is available only for tungsten apd we confirmed the identity of tantalum data and tungsten
data experimentally. The sum of the measured spectrum from 1 Me V to 5 Me V which
44
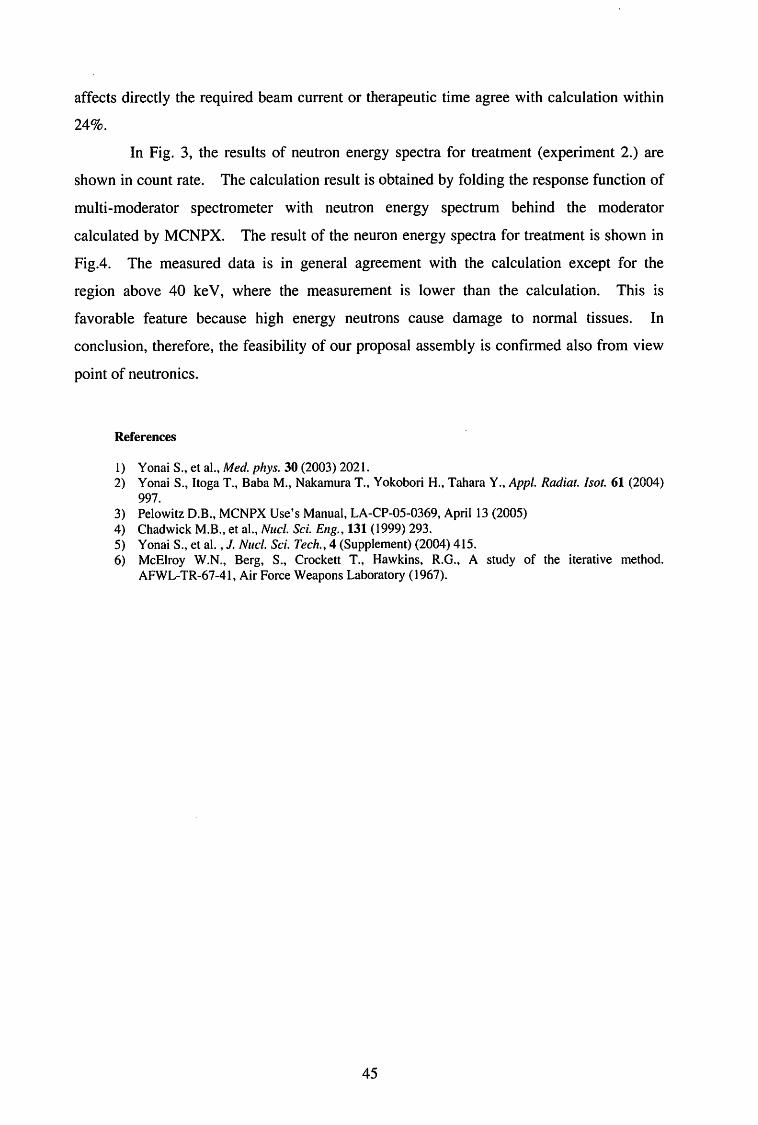
affects directly the required beam cu汀・entor therapeutic time agree with calculation within
24%.
In Fig. 3, the results of neutron energy spectra for treatment (experiment 2.)紅e
shown in count rate. The calculation result is obtained by folding the response function of
multi-moderator spectrometer with neutron energy spectrum behind the moderator
calculated by MCNPX. The result of the neuron energy spectra for treatment is shown in
Fig.4. The measured data is in general agreement with the calculation except for the
region above 40 ke V, where the measurement is lower than the calculation. This is
favorable feature because high energy neutrons cause damage to normal tissues. In
conclusion, therefore, the feasibility of our proposal assembly is confirmed also from view
point of neutronics.
References
1) Yonai S., et al., Med. phys. 30 (2003) 2021. 2) Yonai S., ltoga T., Baba M., Nakamura T., Yokobori H., Tahara Y., Appl. Radiat. /sot. 61 (2004)
997. 3) Pelowitz D.B., MCNPX Use’s Manual, LA-CP・05-0369,April 13 (2005) 4) Chadwick M.B., et al., Nucl. Sci. Eng., 131(1999)293. 5) Yonai S., et al., J. Nucl. Sci. Tech., 4 (Supplement) (2004) 415. 6) McElroy W.N., Berg, S., Crockett T., Hawkins, R.G., A study of the iterative method.
AFWL-TR・67・41,Air Force Weapons Laboratory (1967).
45
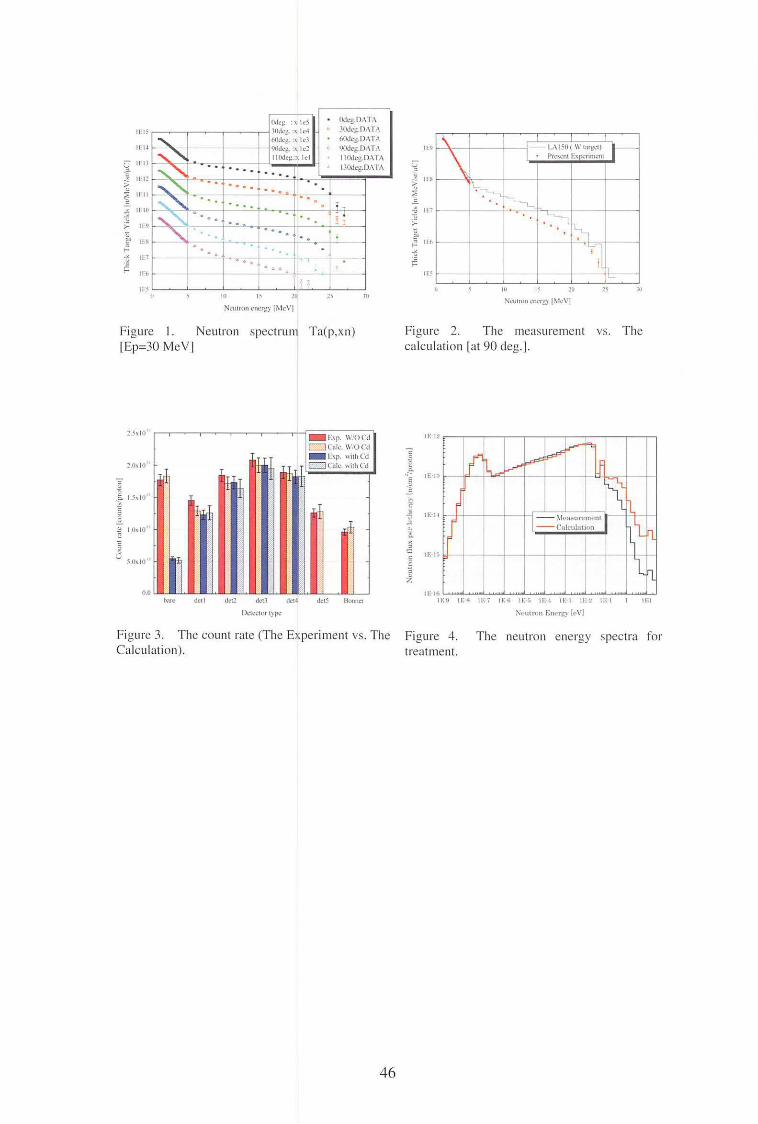
。
S
7
b
g
一)ユ』為、〉
υ-AZ一J『
d-ndfr
z凶回目-
duコFF
-
.
Illミ
Li II ll . -" -!c II I~ -〆ω ミ1111
- :ffe 1111>
" Eニ 119-" i:' II詩
= .... 舌 117
.=
.... llb
1』I'
"’
The VS.
νh uz
uhEE-
-
v
“仁
川
me
uれ
En
ιH
1
N
6
LE
Uh
dR
Uh
rh
れV
-1-
U
10 I‘"' Nピlllf0111.'lll'思) l~ IピVI
Figur巴 2. The measurem巴Ill
calculation lat 90 deg.J.
i>:・15
IE 12
= 乙ユ"::山 u= " コ
" 』
日
ぷ' n:-11 . 』
主x -c: ~
~
~ 7.
¥JI ?、‘ー
Ta(p.xn)
!” 1‘'" Ncnl即日山崎山) 1 ~1cv1
spectrum Figure I. N巴utron
1Ep=30 MeVI
10略10
" c 己 1.s,10,, 言。0
" 1.0,10 i::
コc u
5.0ミ10
。。
2台湾10
lf'.I
for The neutron energy spectra Figu1巴 4.
treat打1ent.
Donneτ
Figure 3. Th巴countrate (The Experiment vs. The
Calculation).
46
d<J5 dell dct3 ""'
Del出 IOri)pe
d<ll ""'
CYRIC Annual Report 2005
IV. 3. Measurement and Monte Carlo Calculation of the Response Function of a Schottky CdTe Detector with a Guard Ring Electrode
for Medical X-ray Field
Mohammadi A.1, Baba M.1, Ohuchi H.2, and Yamaguchi Y.1
2 1 Cyclotron and Radioisotope Center, Tohoku University Graduate School of Pharmaceutical sciences, Tohoku Universiη
The CdTe detectors have a great advantage for use at room temperature because
they are compact and have large photon absorption cross section in comparison with Si and
Ge. Therefore, they are convenient for X-ray spectroscopic systems. However, the CdTe
detectors have problems of poor charge transport properties because of the charge carrier
trappingl). This problem has been improved significantly in a Schottky CdTe diode that is
made of a high quality CdTe crystal, where a high Schottky barrier is formed by using
indium2・3> for the holes on a CdTe surface. The Schottky CdTe diode with guard ring can
be operated with higher bias voltage, which leads to high resolution X-ray spectra free from
tail structure, even at room temperature4>.
In this study, we use a Schottky CdTe detector with a guard ring electrode for
analysis of medical X-ray field. The effective area of the detector is 4x4 mm2 and 0.3 mm
thick. The response function of the detector has been investigated at various operating
condition for an 241Am source. The spectra of mentioned source is shown in Fig. 2 at
various bias voltage and shaping time. From this figure, the optimum applied bias voltage
and shaping time紅eobtained to be 200 V and 2 μsec respectively.
The response function of detectors can be calculated using the勘fCNP4Ccode5>.
Our detector response was calculated by the code for 241 Am, 133Ba and 152Eu sources and
then the results were compared with the measured responses at optimum operating
condition. Figure 2 shows the experimental results in comparison with calculation for
three sources. From these results, the energy resolution (FWHM) is estimated to be 1.53
keV, 1.6 keV and 2.07 keV for 59.54 keV, 81keV and 121.78 KeV, respectively.
The full-energy-peak efficiency of the detector has also been calculated and
compared with the measurement for 60 ke V and 81 ke V lines of 241 Am and 133Ba sources,
47
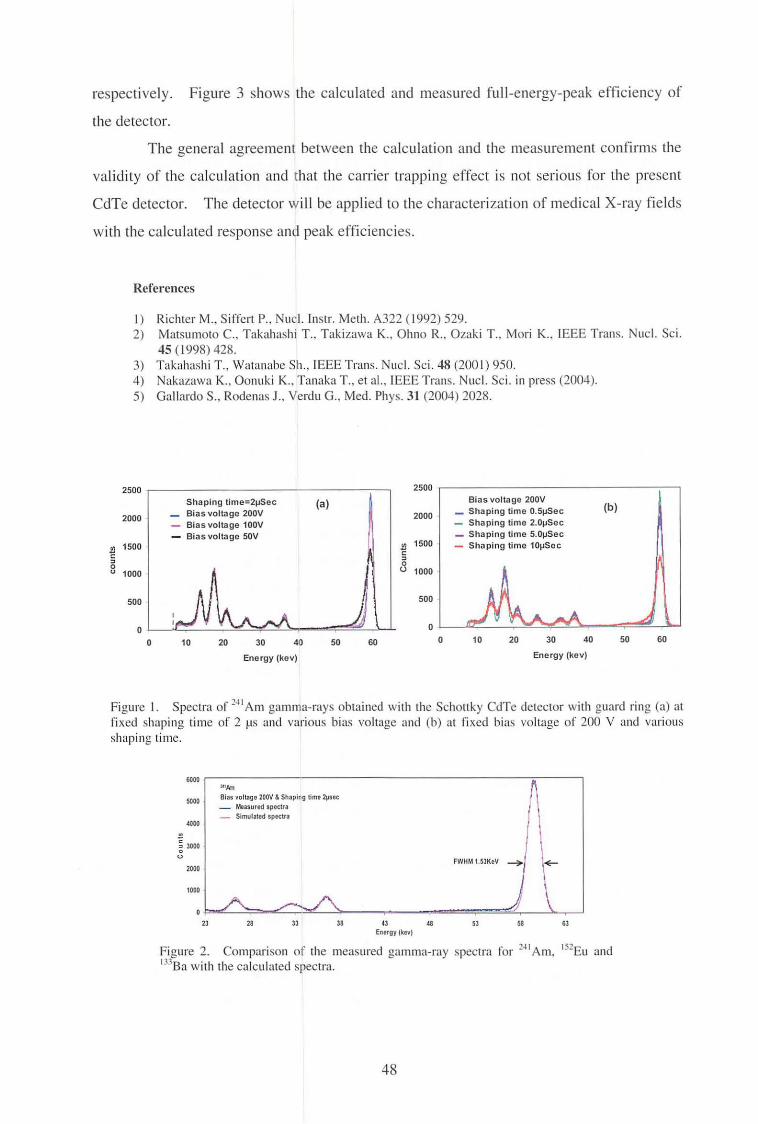
respectively. Figure 3 shows the calculated and measured full-energy-peak efficiency of
the detector.
The general agreement between the calculation and the measurement confirms the
validity of the calculation and that the carrier trapping effect is not serious for the present
CdTe detector. The detector will be applied to the characterization of medical X-ray fields
with the calculated response and peak efficiencies.
References
I) Richr巴IM., Siffert P.ーNucl.Instr. M巴th.A322 (1992) 529.
2) Matsumoto C., Takahashi T., Takizawa K .. Ohno R .. Ozaki T.. Mori K .. IEEE Trans. Nucl. Sci.
45 ( 1998) 428.
3) Takahashi T., Watanabe Sh., IEEE Trans. Nucl. Sci. 48 (2001) 950.
4) Nakazawa K.‘Oonuki K .. Tanaka T., et al., IEEE Trans. Nucl. Sci. in press (2004).
5) Gallardo S., Rodenas J., Yerdu G .. Med. Phys. 31 (2004) 2028.
2500 2500
2000
~ 1500
0 Uコ 1000
500
。。
2000
Bias voltage 200V
- Shaping time 0.5μSec
- Shaping lime 2.0μSec
- Shaping lime 5.0μSec
- Shaping time 10μSec
(b) Shaping time=2μSec
_ Bias voltage 200V
- Bias voltage 100V
- Bias voltage 50V
(a)
i!J 1500 c :I 。u 1000
500
。10 20 30 40 50 60
。 10 20 30 40 50 60
Energy (kev) Energy (kev)
Figure I. Sp巴ctraof 241 Am gamma-rays obtained with the Schottky CdTc detector with guard ring (a) at
fixed shaping time of 2ドsand various bias voltage and (b) at fix巴dbias voltage of 200 V and various
shaping time.
帥伺
印刷u’"'" Blas v。ltage200V & Sh叩Ingtime 2岡田
- Mea叫『凶叩e<traー- Simulated叩属国
柑同
回
。3
・-E
2
。u20曲
1000
23 28 33 38 ‘3 48 En・rgy(k刷}
53 持 63
Figure 2. Comparison of th巴 measuredgamma-ray spectra fo1・241Am, 152Eu and 133Ba with th巴calculatedsp巴ctra.
48
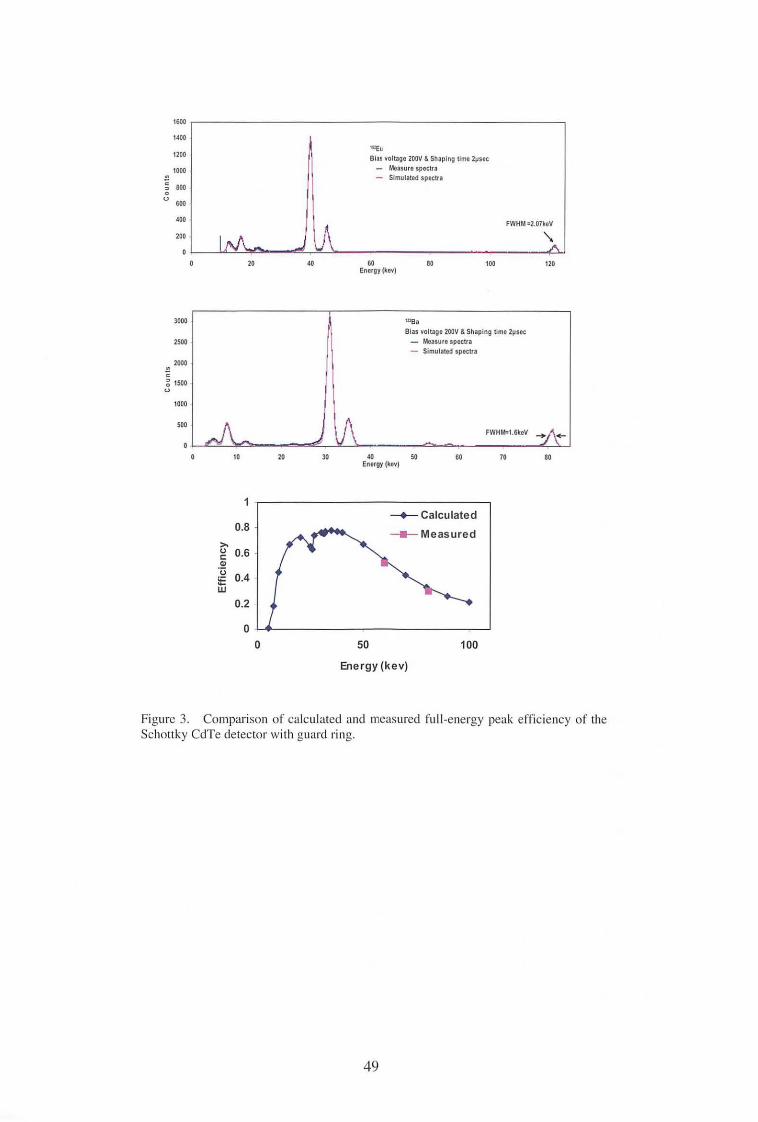
時価
H冊
12同
1000 ~
; 8師。u
--
c
6叫
400
200
。
3000
2”。2000
~ 1蜘&」,
1000
500
。 20 40
10 20
0.8 _,
>-g 0.6 由
選0.4_, w
0.2
。。
30
世Eu
BIH voltage 200V & Shaping time 2回目
ー胸a剖『@叩ectra
- Slmulated叩 目tra
FWHM =2 07keV
60 Energy (kev)
"'Ba
80 100
Bias voltage 2同v& Shaping time 2岡田
一 胸 asure叩回目
- Slmulat岡 町 民 国
柑 日En er師(kev)
同
~Calculated
-・」ーMeasured
50
Energy (kev)
100
FWH体 1.6keV
70
\
120
-+f\←
80
Figure 3. Comparison of calculated and measur巴dfull-energy peak efficiency of the
Schottky CdTe det巴ctorwith guard ring.
49
CYRIC Annual Report 2005
IV. 4. An Optica~ Common-mode Rejection for Improving the Sensitivity Limit of a Radiochromic Imaging Film
Ohuchi H. 1, and Abe K. 2
1 Graduate School of Pharmaceutical Sciences, Tohoku Universiη,
2Cyclotron and Radioisotope Center, Tohoku University
Radiochromic plastic dye films, such as the commercially available GAFCHROMIC
films (International Specialty Products, USAふ have been found to be excellent
two-dimensional dosimetry tools for tissue-equivalence, having good spatial response,
relatively flat energy response like LiF TLD’s (with a few exceptions, e.g. XR filmsl),
wide dynamic range of absorbed doses, dose-rate independence and long-term storage of
images, allowing multiple reevaluations, etc. Investigations up to 2002 are fully reviewed
in the literaturel). They have, however, some drawbacks, such as low-sensitivity,
non-uniformity of response, post-exposure optical density growth and film cost.
Low-sensitivity and non-uniformity of response are difficult to resolve owing, mainly, to
the low-Z composition of the films. The films were formerly imaging materials for
high-dose radiation dosimetry and high-resolution radiography2>. However, their use has
increasingly spread to medical and industrial applications, owing to their numerous
excellent qualities. Nevertheless, their low sensitivities have become a serious obstacle,
especially in medical applications. For example, doses from about 10 mGy to a few Gy
are valuable for monitoring patient skin dose in interventional procedures, whereas the
required doses (higher than those mentioned) for the present films preclude most
applications.
Various studies have reported efforts to improve sensitivity: (1) layering five sheets
of film together3>; (2) wrapping the film with UV phosphor screens4>, or (3)
GAFCHROMIC XR film including proprietary materials (Br, Cs, Ba)5>. It should be noted
that the latter two improvements have been achieved with the loss of tissue-equivalence,
owing to the high-Z material content. Further improvements in sensitivity seem to have
reached their limit.
50
We considered the second drawback: macroscopic and microscopic non-uniformities
of film layers, including the thickness variation of active radiochromic emulsions, discussed
in Ref. 1 and inferred that these non-uniformities may be the main causes of light
disturbance (noises) against the lights (signals) to be measured with a densitometer,
resulting in a lowering of actual film sensitivities, i.e. generating the first drawback. The
most important factor is not the intensity of signals but the optical SIN (signal-to-noise
ratio) in the light paths.
Among the many devices used for film dosimetry, RGB color scanners have been
extensively used by researchers1ム1>. Fortunately, the high absorption peaks upon
irradiation are at 675 nm (main peak) and 617 nm (secondary peak), both lying in the red
region of the light spectra (Fig. 2) and both responsible for the same R output from color
scanners. It is noted that both R and G components are a set of raw data of the lights
having passed together along the common optical path, hence, suffering a common fate
upon attenuation, reflection, etc., with the exception of wavelength-dependent events. The
R and G components are neighboring wavebands about I 00 nm apart, nevertheless, their
responses to radiation exposure are quite different. The R component is highly sensitive to
radiation exposure, while the G component is nearly insensitive to radiation exposure,
owing to the absence of a clear absorption peak in the green waveband. These facts
indicate that the common-mode rejection (CMR) scheme may be successful in distinctively
recording events not common to them, i.e. irradiated effects, if applied to paired optical
signals.
The optical properties of radiochromic films 1 were examined, using a
spectrophotometer (DU・640,Beckman Coulter, Inc., USA.), and computer-simulated
experiments carried out on the obtained absorption spectra to assess the applicability and
validity of an optical version of the CMR scheme to radiochromic film dosimetry. The
RGB components, needed for processing, were generated by multiplying the spectra by the
RGB filter functions stated below. One way to simulate the CMR is to create a ratio of the
two signals, where the factors common to both numerator and denominator will
automatically disappear.
We found that, in the case of GAFCHROMIC films, the detection limit is greatly
improved with the optical CMR stated above and the lowest detectable dose attained was
nearly 20 mGy for the HS・14(response range for product specification: 0.5 -40 Gy) and 50
mGy for the MD-55-2 (response range: 2・100Gy). Some studies, using a single color
component (red in most cases) output from RGB scanners, have been reported5'7>, but, so far,
51
no publication has reported usiqg the combination described above.
Experimental procedures were as follows: film specimens of 1 x 4 cm in size were
placed on the sample stage in the X-ray irradiation system (MBR-1520R, Hitachi Medico
Co., Japan.), exposed to X-ray beams of 100 kV with a 1.0-mm Al filter and monitored with
a thimble ionization chamber (PTW・TN31003)installed inside the unit. They were
analyzed, 24 or 25.5h after exposure, using the spec甘ophotometerover the range 450 -1100
nm in 1.0・nmsteps.
Figure 1 shows the RGB filter functions used for analysis, whose properties are
similar to those of color filters for CCD photosystems. Figure 2 shows an example of the
R and G components produced from an absorption spectrum for HS-14 film, multiplied by
the filter functions. The vertical is expressed as light transmission in percentage, T (% ).
The relationship between T and optical density (OD) used in film dosimetry can be
expressed as follows:
OD= -logio(T/100)= 2 -log10 T,
net OD= OD -ODo= log10To -log10 T= log10 (To汀)
where subscripts denote unirradiated background quantities and ’net’stands for the
quantities after removing the background.
In the case of the optical CMR scheme, T should be replaced by Rd/Gr, where Rd
and Gr are the amounts of ligqts for the red and green components, respectively. Thus,
reduced OD (ROD) in the optical CMR scheme, is:
ROD= 2 -log10 (Rd/Gr), net ROD= log10 ((Rdo/Gr0)/(Rd/Gr))
Figure 3 shows the dos~-response curve, i.e. net ROD vs. absorbed dose, from 8.1
mGy to 1.6 Gy, for the HS-14 film 24 h after exposure. Figure 4 shows an expanded
version of Fig. 3 over the range 0 -500 mGy. The standard e町orsshown in the figures are
less than 3.4% after repeated measurements.
Linear fits established for each of the two data sets have nearly the same slopes,
demonstrating that HS-14 film is a valuable tool for monitoring doses down to about 20
mGy. Some fluctuations were observed around the lowest doses, which were, however,
far lower than the normal working range of the X-ray system of 0.1・860Gy.
Figure 5 shows the dose-:-response, from 7 .2 to 720 mGy, for the MD・55-2film, 25.5
h after exposure. The lowest detectable dose was about 50 mGy. The cause of
fluctuations around the doses lower than 40 mGy are unclear. However, MD・55-2film
52
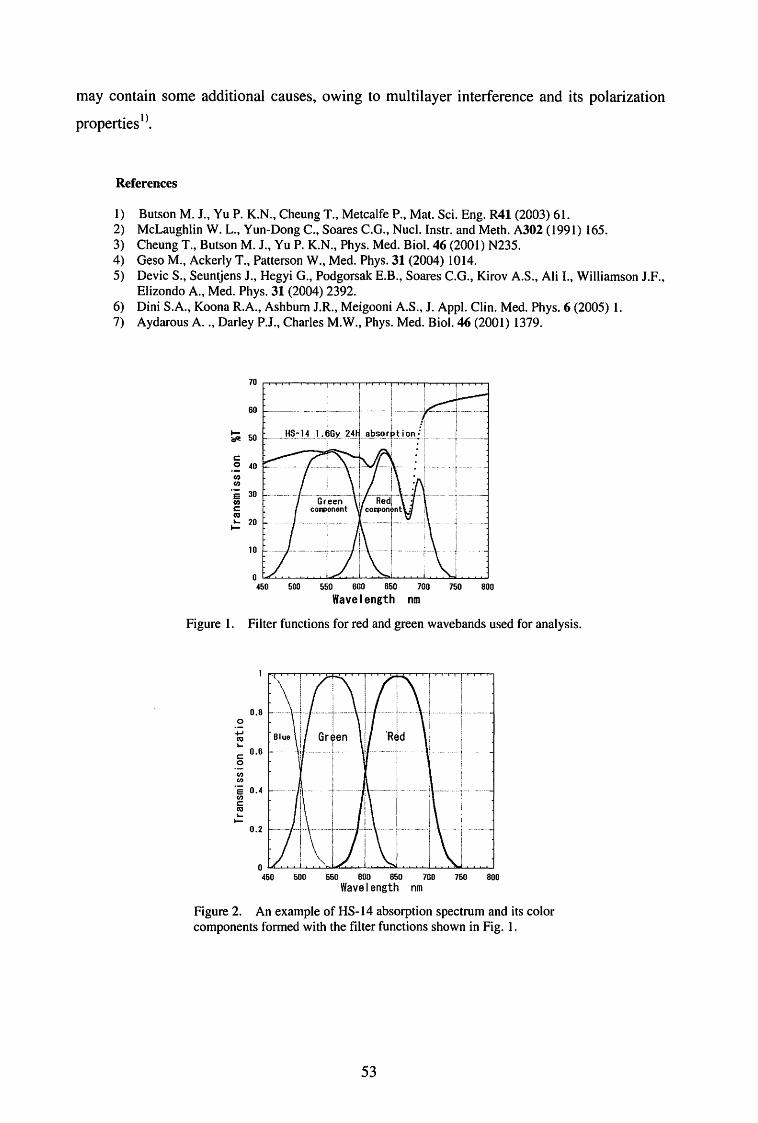
may contain some additional causes, owing to multilayer interference and its polarization
properties 0.
References
I) Butson M. J., Yu P. K.N., Cheung T., Metcalfe P., Mat. Sci. Eng. R41(2003)61. 2) McLaughlin W. L., Yun-Dong C., Soares C.G., Nucl. Instr. and Meth. A302 (1991) 165. 3) Cheung T., Butson M. J., Yu P. K.N., Phys. Med. Biol. 46 (2001) N235. 4) Geso M., Ackerly T., Patterson W., Med. Phys. 31 (2004) 1014. 5) Devic S., Seuntjens J., Hegyi G., Podgorsak E.B., Soares C.G., Kirov A.S., Ali I., Williamson J.F.,
Elizondo A., Med. Phys. 31(2004)2392. 6) Dini S.A., Koona R.A., Ashburn J.R., Meigooni A.S., J. Appl. Clin. Med. Phys. 6 (2005) I. 7) Aydarous A .. , Darley P.J., Charles M.W., Phys. Med. Biol. 46 (2001) 1379.
70
~ 50
白
u
n
u
白
u
aa司勾
a
内
t
co一四回
ω一gωcmw』」戸
10
500 550 600 650 700 750 800
Wavelength nm
Figure 1. Filter functions for red and green wavebands used for analysis.
0.8
。一μ・伺』
c: 0.6 0
(/) (/)
e 0.4 (/)
c: 悶
‘ー』.
0.2
500 550 600 650 700 750 800
Wavelength nm
Figure 2. An example of HS-14 absorption spectrum and its color components formed with the filter functions shown in Fig. 1.
53
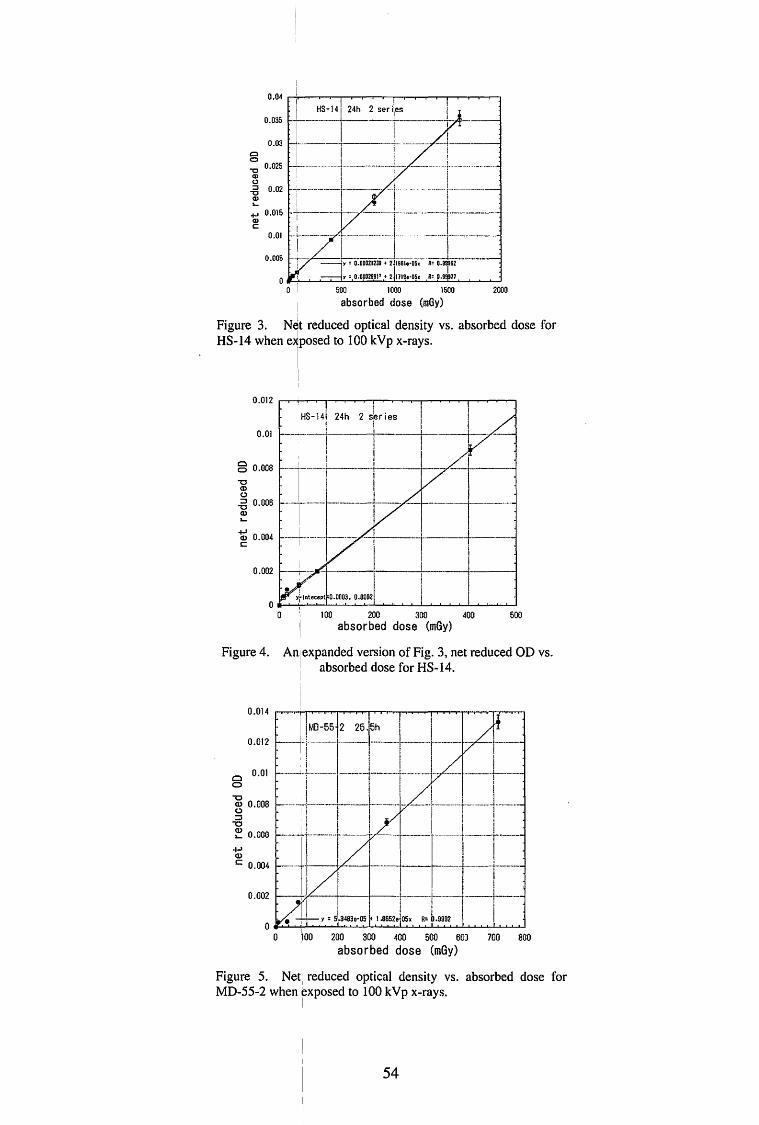
0.035
0.012
0.01
§ 0.008 て3(J)
0
召 O.OOB(J)
s....
~ 0.004 c:
0.002
Figure 4.
0.014
ロ 0.01Cコ
~ 0.008 0 コてコ~ 0.000 4」Q)
c: 0.004
0.002
2000
absorbed dose (mGy)
Figure 5. Net11 reduced optical density vs. absorbed dose for MD品 2when Fxposed to 1伽 Vpx-r
54
CYRIC Annual Report 2005
IV. 5. Preliminary Report of Position Sensitive CdTe Detector for a Semiconductor PET Camera
Kikuchi Y. 1, Ishii K.1ペYamazakiH.1, Matsuyama S.1, and Kudo T.1
1 Graduate School of Engineering, Tohoku Universiη 2Cyclotron and Radioisotope Center, Tohoku University
Application of small semiconductor detectors to PET camera is an effective way to
achieve high spatial resolution because it can make possible that data are obtained in fine
spatial sampling width. But, the use of small detector may cause decreasing of system
sensitivity. When detectors are aligned, vacancy between them is needed in order to divide
detectors electrically, and this causes that packing ratio becomes lower.
In order to avoid decreasing of packing ratio, we propose to embed a position
sensitive detector to a semiconductor PET camera. We report about development of a
position sensitive CdTe detector for a semiconductor PET camera. From our previous
research, it was determined that CdTe (cadmium telluride) semiconductor detector, whose
atomic number was high (Cd: 42, Te 52), was suitable for application of PET. In particular,
schottky CdTe detector which is made by evaporating In an Pt as electrode can be available
in high bias voltage, so that fast timing performance is expected.
A position sensitive semiconductor detector is made by formation of resistive area
electrode. Several output lines are connected to the surface and detection position is
determined by calculating fraction between output amplitude of signals. In order to form
the resistive electrode, thickness of evaporation metal on the crystal is controlled. This
may make it possible that resistive electrode is formed, preserving good timing performance.
With ion beam induced charge (IBIC) method, we confirmed formation of resistive
electrode by controlling electrode thickness. IBIC is a technology which is for research
about charge collection ability of radiation detector by irradiating ion beam to the detector.
A Cd Te detector whose electrode thickness was controlled was irradiated 3 Me V proton
with micro beam line in Fast Neutron Laboratory, Tohoku University and a correlation
between irradiation position on the electrode and signal outputs.
55
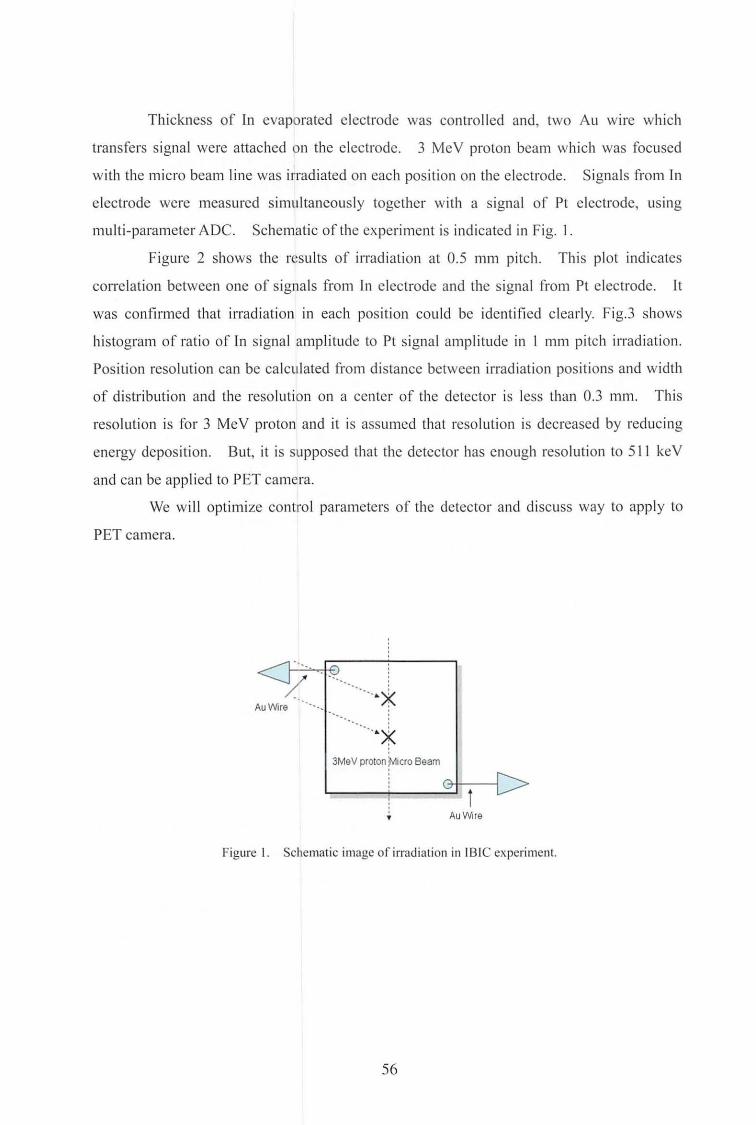
Thickness of In evaporated electrode was controlled and, two Au wire which
transfers signal were attached on the electrode. 3 MeV proton beam which was focused
with the micro beam line was in-adiated on each position on the electrode. Signalsれi・omIn
electrode were measured simultaneously together with a signal of Pt electrode, using
multi-parameter ADC. Schematic of the experiment is indicated in Fig.卜
Figure 2 shows the results of irradiation at 0.5 mm pitch. This plot indicates
correlation between one of signals from In electrode and the signal from Pt electrode. It
was confirmed that irradiation in each position could be identified clearly. Fig.3 shows
histogram of ratio of In signal amplitude to Pt signal amplitude in I 111111 pitch irradiation.
Position resolution can be calculated fro111 distance between irradiation positions and width
of distribution and the resolution on a center of the detector is less than 0.3 m111. This
resolution is for 3 MeV proton and it is assumed that resolution is decreased by reducing
energy deposition. But, it is supposed that the detector has enough resolution to 511 keV
and can be applied to PET ca111era.
We will opti111ize control parameters of the detector and discuss way to apply to
PET camera.
i1 l ... * 3MeV proto『1)'vt1croBeam
Figure I. Schematic image of irradiation in I BIC experiment.
56
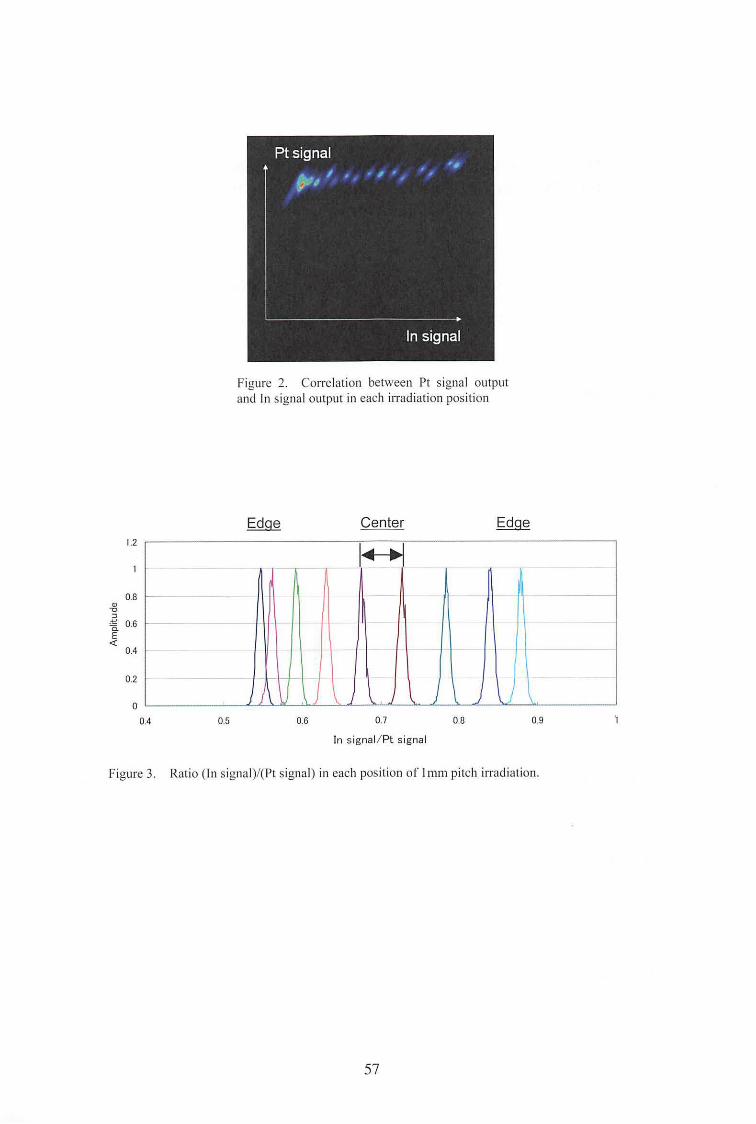
1.2
てωコ
歪コ 0.6
~ 0.4
。マ2
。
0.4 0.5
Figur巴 2. Correlation between Pt signal output and In signal output in each irradiation position
E血豆 Center E由主
~ ~ -「l ~ 除1
0.6 0.7 0.8
In signal/Pt signal
0.9
Figure 3. Ratio (In signal)/( Pt signal) in each position of I mm pitch irradiation.
57
CYRIC Annual Report 2005
IV. 6. Develop~ent of a Pulse Height Estimation Method for a High Resolu~ion PET Camera with Position Sensitive
Semiconductor Detectors
Sakai T., Ishii K.~ Yamazaki H., Matsuyama S.,αnd Kikuchi Y.
Grad,閥均S伽 olofBゆ zeering,Tohoku肋 仰rsiη
Introduction
In order to achieve high spatial resolution, application of semiconductor detectors
to animal PET cameras is an effective way. Semiconductor detectors can be small, and
these detectors enable fine spatial sampling. But, use of small semiconductor detectors
may cause decrease of system sensitivity, because of vacancy between detectors aligned
densely.
Against this problem, we propose use of position sensitive semiconductor detectors
(PSD), which are consisted of continues crystal. Generally, one of electrode of these
detectors is a resistive layer on which several wire are connected to obtain signal. Because
there is a correlation between an energy deposited position in the detector and outputs
fraction from detector, the position can be identified with calculation. But, devices which
can acquire pulse height information, like ADCs, are necess紅 yfor position analysis, so that
a measurement system become large, when considering of detectors number in a PET
camera. So, it is desirable that pulse height information is acquired with a simple way.
We report about pulse height estimation method based on pulse shape analysis without
ADCs.
Principle
Pulse height of an analog signal from a radiation measurement circuit which is
consisted of preamplifiers, amplifiers, and so on, is proportional to energy deposited to a
detector, and a pulse shape depends on time constant of the circuit. In order to estimate
pulse height, we propose amplitude to time conversion (A TC) method with a comparator.
When an analog signal is input to comp訂 ator,a width of a comparator signal is determined
58
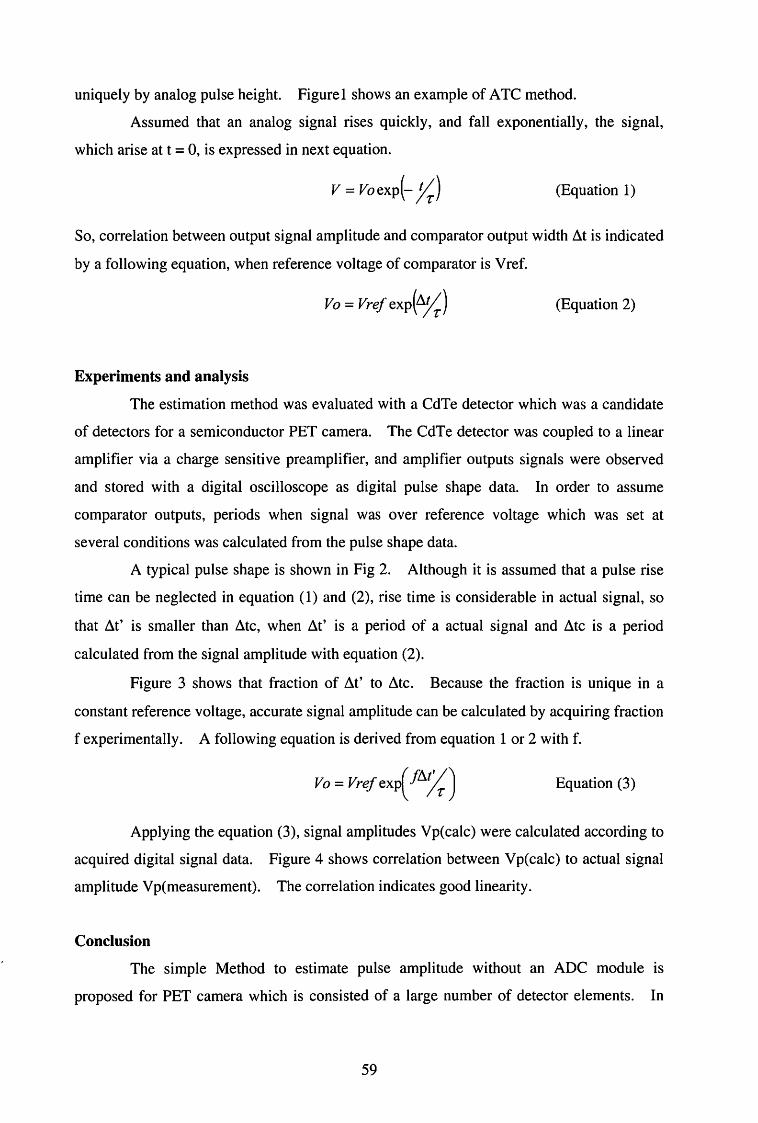
uniquely by analog pulse height. Figurel shows an example of ATC method.
Assumed that an analog signal rises quickly, and fall exponentially, the signal,
which arise at t = 0, is expressed in next equation.
V=Vo叫十万) (Equation 1)
So, correlation between output signal amplitude and comparator output width ~t is indicated
by a following equation, when reference voltage of comparator is Vref.
均=附叫切) (Equation 2)
Experiments and analysis
The estimation method was evaluated with a CdTe detector which was a candidate
of detectors for a semiconductor PET camera. The CdTe detector was coupled to a linear
amplifier via a charge sensitive preamplifier, and amplifier outputs signals were observed
and stored with a digital oscilloscope as digital pulse shape data. In order to assume
comparator outputs, periods when signal was over reference voltage which was set at
several conditions was calculated from the pulse shape data.
A typical pulse shape is shown in Fig 2. Although it is assumed that a pulse rise
time can be neglected in equation (1) and (2), rise time is considerable in actual signal, so
that dt' is smaller than Mc, when dt' is a period of a actual signal and dtc is a period
calculated from the signal amplitude with equation (2).
Figure 3 shows that fraction of dt' to dtc. Because the fraction is unique in a
constant reference voltage, accurate signal amplitude can be calculated by acquiring fraction
f experimentally. A following equation is derived from equation 1 or 2 with f.
Vo=Vrefexp(勺) Equation (3)
Applying the equation (3), signal amplitudes Vp(calc) were calculated according to
acquired digital signal data. Figure 4 shows correlation between Vp(calc) to actual signal
amplitude Vp(measurement). The correlation indicates good linearity.
Conclusion
The simple Method to estimate pulse amplitude without an ADC module is
proposed for PET camera which is consisted of a large number of detector elements. In
59
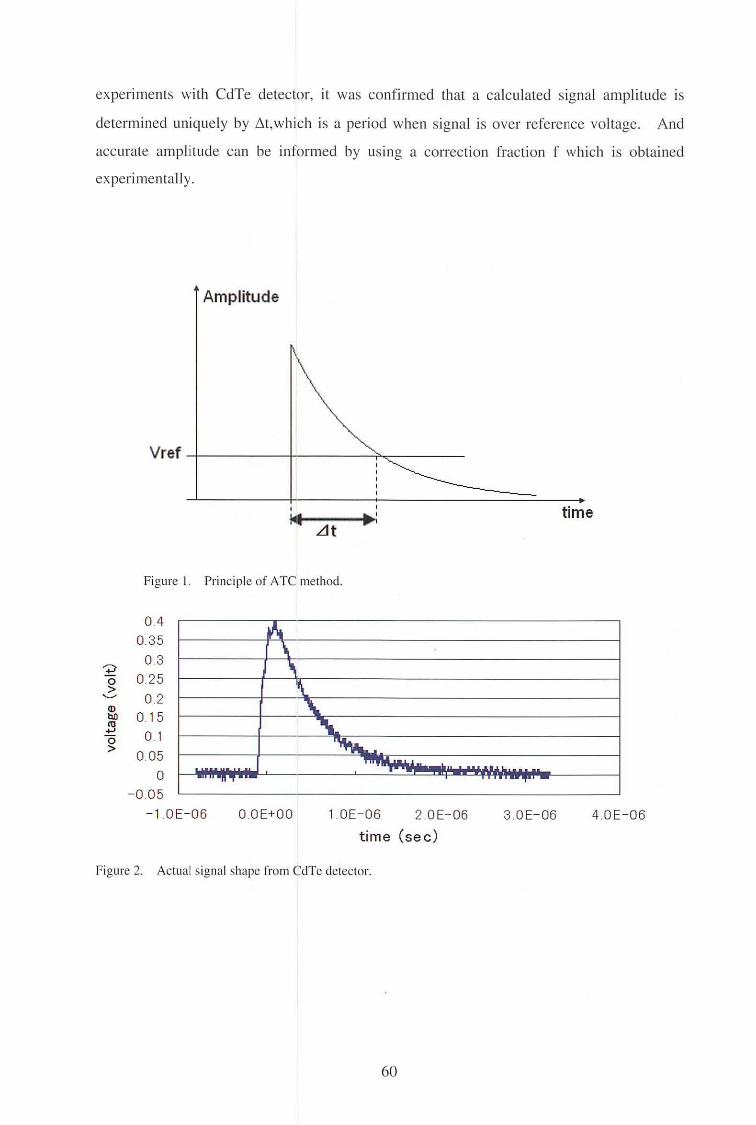
experiments with CdTe detector, it was confirmed that a calculated signal amplitude is
And determined uniquely by ~t,which is a period when signal is over reference voltage.
accurate amplitude can be informed by using a correction fraction f which is obtained
Amplitude
experimentally.
。。,ou島
Vref
t川、e初.Lit
Principle of ATC method. Figure l.
0.4
0.35
0.3
0.25
0.2
0.15
0.1
0.05
0
-0.05
2
一O〉)@凶
2
-O〉
4.0E-06 3.0E-06 2.0E-06 1.0E-06 O.OE+OO -1.0E-06
time (sec)
60
Actual signal shap巴fromCdTe detector. Figure 2.
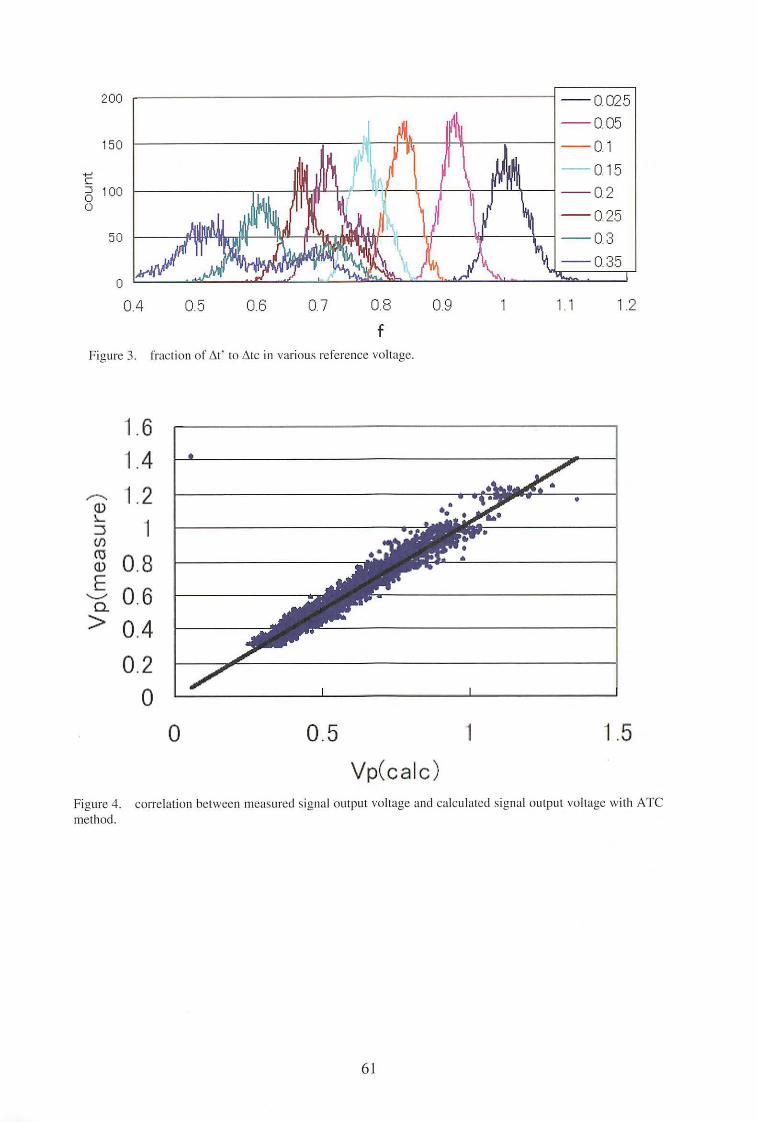
一一
一一一一
一一一0.1
200
150
50
...., c ~ 100 0
1.2 0.8
。1. 1 0.9
f
fraction of ~I ' to ~tc in various reference voltage.
0.7 0.6 0.5 0.4
Figure 3.
.
1. 6
1.4
0.4
0.2
1.2
0.8
0.6
(
ωLコω何ωE)a>
。1 .5 0.5 。
Vp(calc)
correlation betw巴enmeasured signal output voltage and calculated signal output voltage with ATC
61
Figure 4.
method.
CYRIC Annual Report 2005
IV. 7. Accuracy of Registration Algorithm Based on Mutual Information
Kumagai K., Sasaki T., Yamaguchi K., Margaretha S., Miyake M~ , Watanuki S., Tashiro M., and ltoh M.
Cyclotron and Radioisotope Center, Tohoku Universiη
In medical imaging studies, it is now commonly performed to scan the same subject
with different imaging devices in order to obtain the complementary information by fusing
these images into one. This technique, multimodality image fusion, is one of the cu町・ent
subjects in many fields of 30 medical image processing. The key issue of the image
fusion is assessment of registration accuracy. In this report we will summarize the results
of the investigation on performance of registration algorithm. The first step of the
registration process yields a rough estimates of rigid transformation parameters with images
of much decreased resolution, for which Nelder-Mead Simplex method was used to find a
global maximum of mutual information (Ml). With increased resolution, the third and the
following steps include optimization for 12 affine transformation parameters, where
Davidon-Fletcher-Powell method is used for maximizing the cost function. The one
dimensional maximization is solved using a line search procedure such as golden section
method that does not require any derivatives. Throughout the entire process, only used
matching criterion is Ml. Thus, the method does not directly depend on image intensity
itself and is generally applicable to inter-modality image registration with global
transformation. The validation study was performed with simulated PET-MR head images.
The present method has some operation parameters which include initial image resolution to
begin multiresolution process, interpolation method for image transformation, histograming
method to evaluate mutual information and convergence condition to stop iteration of
optimization process. The latter two would not greatly affect the performance. We applied
the present method with different initial image resolutions (low, medium and high) and two
types of interpolation (nearest neighbor and linear) to a series of randomly mismatched
simulation images and measured computation time and matching e汀orafter the registration.
62
In order to examine the performance of the present method, PET-MR head images were
simulated to mimic finite resolution images. The simulated images can be transformed
without need of interpolation which might cause serious side effects on the results of the
validation study. Considering that MI does not strongly depend on shape of a overlapping
image but on the intensity distribution of images, simulation images were carefully a司justed
to reproduce the real intensity distribution by optimization of parameterized distribution
functions of asymmetric ellipsoid shape each of which approximates both spatial and
intensity distribution of PET and MR image parts. PET image was randomly transformed
to be a series of test images, while MR image was held fixed as a reference image. The
three kinds of the test image series were used to examine the performance and accuracy as a
function of initial mismatch. The rigid body transformation were used to generate the test
images. The algorithm was implemented as a computer program and was written mainly
in fortran and partly in assembler source code to manually optimize execution speed,
especially for FPU operation. The calculation for the validation study was performed
using a PC (600 MHz-CPU, 250MB-RAM). Table 1 shows the measured CPU time and
mean matching e汀orof the registration with different operation parameters.
An average CPU time needed to register each images was 52 sec when the process
has been given the highest scheduling priority. This value increases to 780 sec if the
hierarchical optimization scheme was dismissed. Variance of the computation time was
due mainly to the differences of number of pixels in an image. Table I shows that the
computation time increases as initial resolution increases and that mean matching e汀or
decreases as initial resolution increases. As the validation study reveals, the performance
and accuracy of the present method strongly depends on operation parameter and initial
condition of mismatching images. Assuming that the resolution of PET images is larger
than 3 mm, and that of MRI and CT is negligible to PET, the accuracy of regis佐ationless
than 3 mm would be of no real significance. Thus, if the accuracy is sucient, that is, less
than 3 mm, then the best operational parameter would be the one that gives the smallest
computation time. Table 1 indicates that by using the optimum operational parameters, the
present method can match PET-MR head images with an overall e町orof less than 3 mm in
60 seconds. Considering that in most cases PET images have the worst resolution among
other 3D medical image modalities, and that the resolution is the most dominant source that
afects both performance and accuracy, the results of the validation study of the present
method might essentially be unchanged even if it were applied to other cases than PET-MR
head images. The more detailed description about the results of the validation study will
63
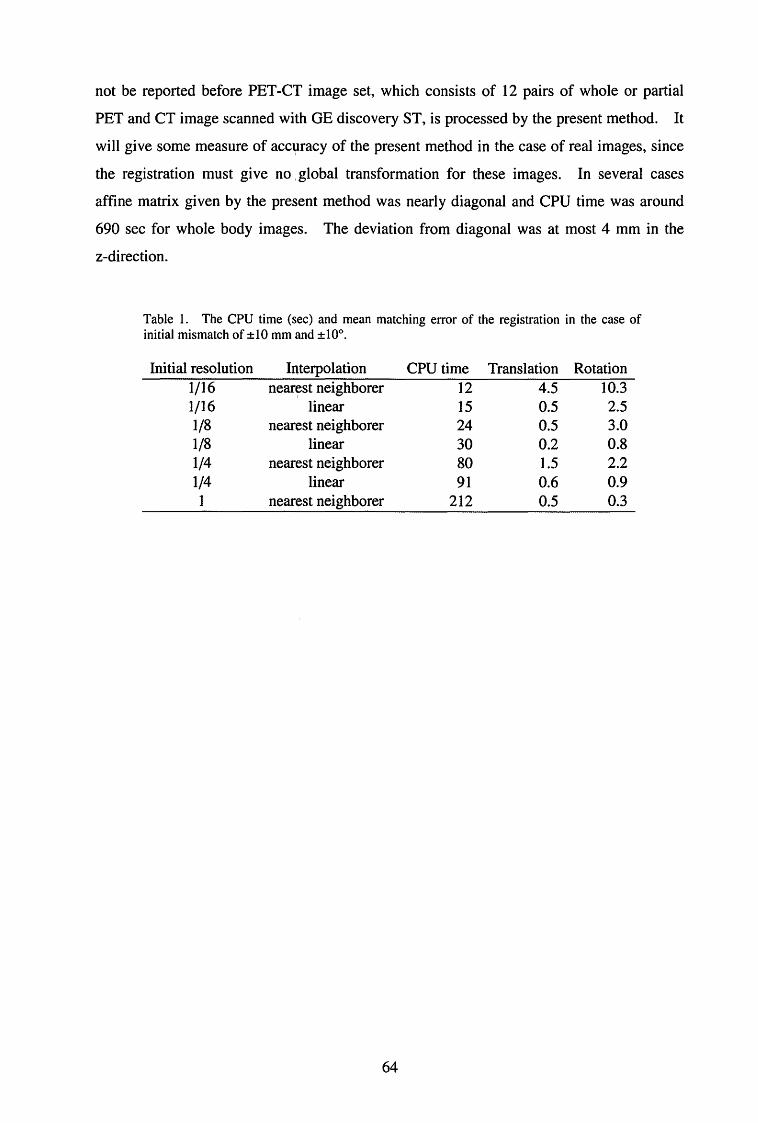
not be reported before PET-CT image set, which consists of 12 pairs of whole or partial
PET and CT image scanned with GE discovery ST, is processed by the present method. It
will give some measure of accuracy of the present method in the case of real images, since
the registration must give no , global transformation for these images. In several cases
affine matrix given by the present method was nearly diagonal and CPU time was around
690 sec for whole body images. The deviation from diagonal was at most 4 mm in the
z-direction.
Table 1. The CPU time (sec) and mean matching e汀orof the registration in the case of initial mismatch of ±10 mm and ±10°.
I凶tial陀 solution
1/16 1/16
1/8 1/8
1/4
1/4
Interpolation
nearest neighborer linear
nearest neighborer line訂
ne紅白tneighborer
linear
nearest neighborer
64
CPU time
12 15
24
30
80 91
212
Translation
4.5
0.5
0.5 0.2
1.5
0.6
0.5
Rotation
10.3 2.5
3.0 0.8 2.2
0.9 0.3

V. PIXE AND ENVIRONMENTAL ANALYSIS
CYRIC Annual Report 2005
V. 1. Micro-beam Analysis System at Tohoku University
Matsuyama S. 1, Ishii K. 1,均mazakiH. 1, Barbotteau Y.1, Amartaivan Ts. 1, Jzukawa D. 1, Hotta K. 1, Afizuma K. i', Abe S. 1, Ohishi Y.1, Rodriguez M 1, Suzuki A. 1, Sakamoto R. 1, Fujisawa M1,KamかaT.2, Oikawa M 2, Arakawa K. 2, lmaseki H. 3, and Matsumoto N. 4
1 Graduate School of Engineering, Tohoku University 2Takasaki Radiation Chemistry Resea1℃h Establishment, Japan Atomic Energy Research Institute
3National Institute of Radiological Science 4TOKIN Machinery Corporation
Introduction
The nuclear microbeam has proved to be a powerful analytical tool by combining
various analysis techniques such as PIXE, RBS, NRA, CT and STIM1・2>. A microbeam
system was constructed at the Tohoku University Dynamitron Laboratory for biological
applications. The microbeam line was installed in July 2002 and has since been optimized
to obtain a beam spot size smaller than 1 μm. In microbeam analysis of biological
specimens, simultaneous measurement of structural and elemental properties is very
important3'4) and can be obtained by combining PIXE, RBS and STIM analysis. This
paper describes performance of the microbeam system and presents typical results of
biological applications.
Microbeam Analysis System
The microbeam system is installed at the 4.5 MV Dynamitron accelerator at
Tohoku University. Technical details of this system have been given in a previous paper5>.
The system was designed for a spatial resolution less than 1×I μm2 using the second
order calculation code
object-to-lens distance of 6 m and working distance of 30 cm when the energy resolution of
the beam is l'.lE/E = 1. 3×10・4and beam divergence is limited to 0.2 mrad with object size
set to 30×8 μm2. The microbeam line consists of a doublet quadrupole lens and a system
of microslits, divergence-defining slits mounted on a heavy rigid support to isolate from
vibrations. Three turbo-molecular pumps evacuate the beam line and target chamber.
65
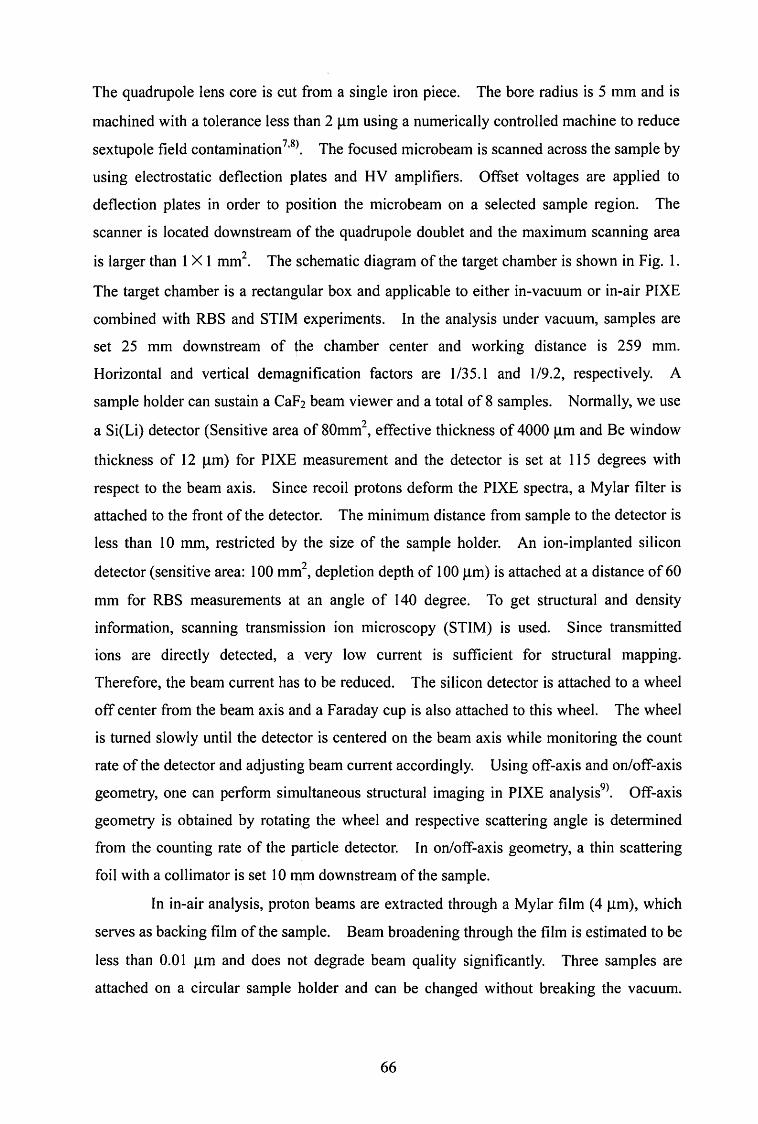
The quadrupole lens core is cut from a single iron piece. The bore radius is 5 mm and is
machined with a tolerance less than 2 μmusing a numerically controlled machine to reduce
sextupole field contamination 7'8>. The focused micro beam is scanned across the sample by
using electrostatic deflection plates and HV amplifiers. Offset voltages are applied to
deflection plates in order to position the microbeam on a selected sample region. The
scanner is located downstream of the quadrupole doublet and the maximum scanning area
is larger than l×1 mm2. The schematic diagram of the target chamber is shown in Fig. 1.
The target chamber is a rectangular box and applicable to either in-vacuum or in-air PIXE
combined with RBS and STIM experiments. In the analysis under vacuum, samples are
set 25 mm downstream of the chamber center and working distance is 259 mm.
Horizontal and vertical demagnification factors are 1135.1 and 1/9.2, respectively. A
sample holder can sustain a CaF2 beam viewer and a total of 8 samples. Normally, we use
a Si(Li) detector (Sensitive area of 80mmヘeffectivethickness of 4000 μm and Be window
thickness of 12 μm) for PIXE measurement and the detector is set at 115 degrees with
respect to the beam axis. Since recoil protons deform the PIXE spectra, a Mylar filter is
attached to the front of the detector. The minimum distance from sample to the detector is
less than 10 mm, restricted by the size of the sample holder. An ion-implanted silicon
detector (sensitive area: 100 mm乙depletiondepth of 100 μm) is attached at a distance of 60
mm for RBS measurements at an angle of 140 degree. To get structural and density
information, scanning transmission ion microscopy (STIM) is used. Since transmitted
ions are directly detected, a very low current is sufficient for structural mapping.
Therefore, the beam current has to be reduced. The silicon detector is attached to a wheel
off center from the beam axis and a Faraday cup is also attached to this wheel. The wheel
is turned slowly until the detector is centered on the beam axis while monitoring the count
rate of the detector and adjusting beam current accordingly. Using o任axisand on/o任:.axis
geometry, one can perform simultaneous structural imaging in PIXE analysis9>. 0妊:.axis
geometry is obtained by rotating the wheel and respective scattering angle is determined
from the counting rate of the pa此icledetector. In on/o住axisgeometry, a thin scattering
foil with a collimator is set 10 mm downstream of the sample.
In in-air analysis, proton beams are extracted through a Mylar film ( 4 μm), which
serves as backing film of the sample. Beam broadening through the film is estimated to be
less than 0.01 μm and does not degrade beam quality significantly. Three samples are
attached on a circular sample holder and can be changed without breaking the vacuum.
66
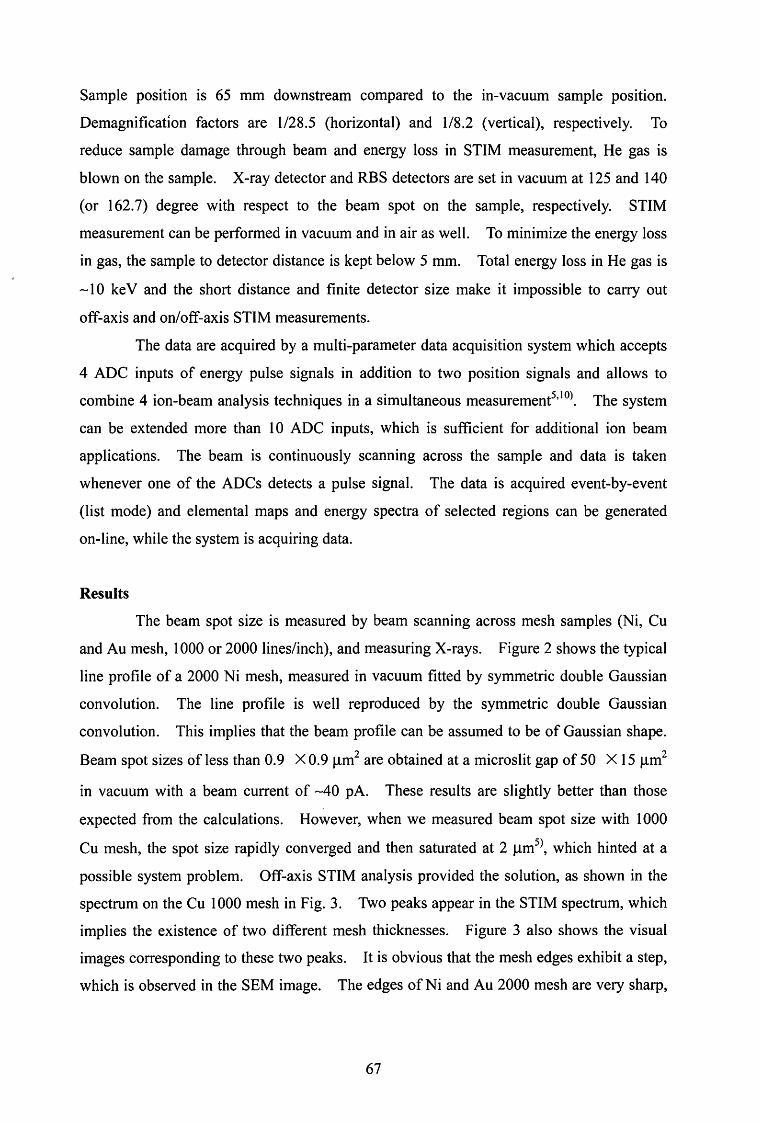
Sample position is 65 mm downstream compared to the in-vacuum sample position.
Demagnification factors are 1128.5 (horizontal) and 1/8.2 (vertical), respectively. To
reduce sample damage through beam and energy loss in STIM measurement, He gas is
blown on the sample. X-ray detector and RBS detectors are set in vacuum at 125 and 140
(or 162. 7) degree with respect to the beam spot on the sample, respectivel子 STIM
measurement can be performed in vacuum and in air as well. To minimize the energy loss
in gas, the sample to detector distance is kept below 5 mm. Total energy loss in He gas is
~I 0 ke V and the short distance and finite detector size make it impossible to ca町yout
。ιaxisand on/o住axisSTIM measurements.
The data are acquired by a multi-parameter data acquisition system which accepts
4 ADC inputs of energy pulse signals in addition to two position signals and allows to
combine 4 ion-beam analysis techniques in a simultaneous measurement5・10>. The system
can be extended more than 10 ADC inputs, which is sufficient for additional ion beam
applications. The beam is continuously scanning across the sample and data is taken
whenever one of the ADCs detects a pulse signal. The data is acquired event-by-event
(list mode) and elemental maps and energy spectra of selected regions can be generated
on-line, while the system is acquiring data.
Results
The beam spot size is measured by beam scanning across mesh samples (Ni, Cu
and Au mesh, 1000 or 2000 lines/inch), and measuring X-rays. Figure 2 shows the typical
line profile of a 2000 Ni mesh, measured in vacuum fitted by symmetric double Gaussian
convolution. The line profile is well reproduced by the symmetric double Gaussian
convolution. This implies that the beam profile can be assumed to be of Gaussian shape.
Beam spot sizes of less than 0.9×0.9 μm2 are obtained at a microslit gap of 50×15 μm2
in vacuum with a beam current of~40 pA. These results are slightly better than those
expected from the calculations. However, when we measured beam spot size with I 000
Cu mesh, the spot size rapidly converged and then saturated at 2 μm5), which hinted at a
possible system problem. Off-axis STIM analysis provided the solution, as shown in the
spectrum on the Cu 1000 mesh in Fig. 3. Two peaks appear in the STIM spectrum, which
implies the existence of two di妊erentmesh thicknesses. Figure 3 also shows the visual
images corresponding to these two peaks. It is obvious that the mesh edges exhibit a step,
which is observed in the SEM image. The edges of Ni and Au 2000 mesh are very sha中,
67
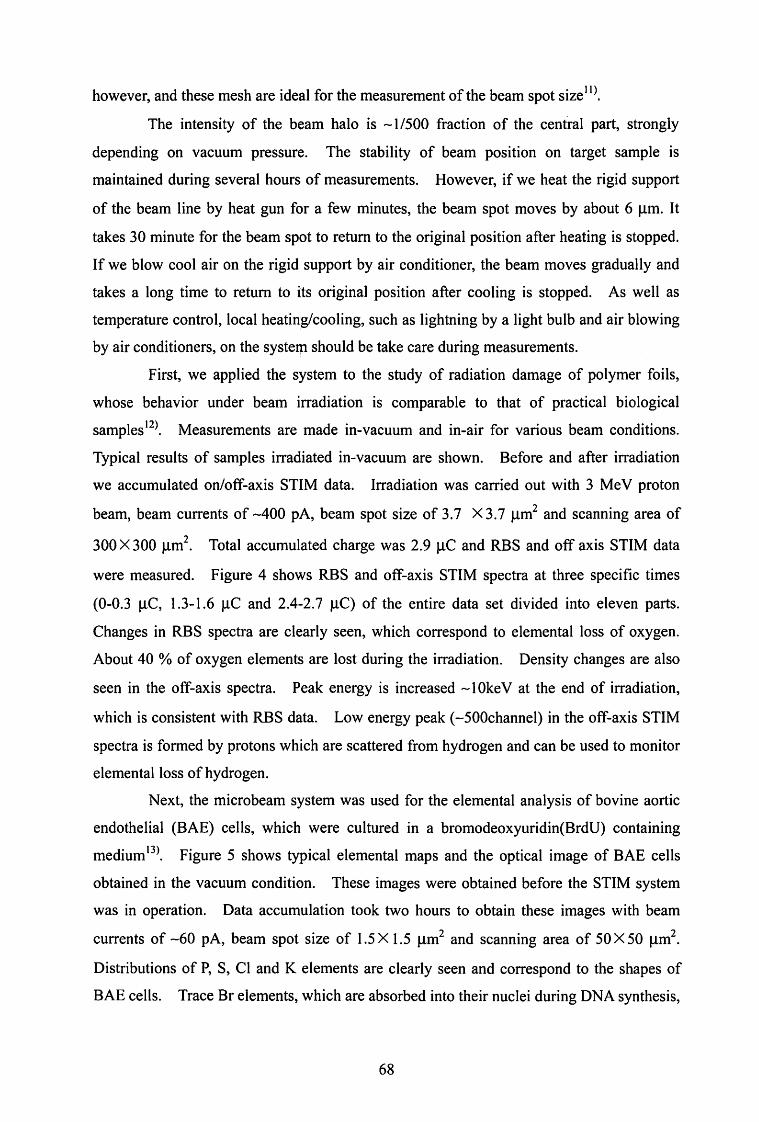
however, and these mesh are ideal for the measurement of the beam spot size11>.
The intensity of the beam halo is ~1/500 fraction of the cenfral part, s廿ongly
depending on vacuum pressure. The stability of beam position on target sample is
maintained during several hours of measurements. However, if we heat the rigid support
of the beam line by heat gun for a few minutes, the beam spot moves by about 6 μm. It
takes 30 minute for the beam spot to re知mto the original position after heating is stopped.
If we blow cool air on the rigid support by air conditioner, the beam moves gradually and
takes a long time to印刷m to its original position after cooling is stopped. As well as
temperature control, local heating/cooling, such as lightning by a light bulb and air blowing
by air conditioners, on the systerp should be take care during measurements.
First, we applied the system to the study of radiation damage of polymer foils,
whose behavior under beam irradiation is comparable to that of practical biological
samples12>. Measurements are made in-vacuum and in-air for various beam conditions.
Typical results of samples irradiated in-vacuum are shown. Before and after irradiation
we accumulated on/o任:.axisSTIM data. Irradiation was carried out with 3 Me V proton
beam, beam currents of~400 pA, beam spot size of 3. 7×3. 7 μm2 and scanning area of
300×300 μm2. Total accumulated charge was 2.9 μC and RBS and off axis STIM data
were measured. Figure 4 shows RBS and off-axis STIM spectra at three specific times
(0・0.3μC, 1.3・1.6μC and 2.4・2.7 μC) of the entire data set divided into eleven parts.
Changes in RBS spectra are clearly seen, which correspond to elemental loss of oxygen.
About 40 % of oxygen elements are lost during the irradiation. Density changes are also
seen in the o釘:.axisspectra. Peak energy is increased ~I Oke V at the end of irradiation,
which is consistent with RBS data. Low energy peak (-500channel) in the o住axisSTIM
spectra is formed by protons which are scattered from hydrogen and can be used to monitor
elemental loss of hydrogen.
Next, the microbeam system was used for the elemental analysis of bovine aortic
endothelial (BAE) cells, which were cultured in a bromodeoxyuridin(BrdU) containing
medium 13>. Figure 5 shows typical elemental maps and the optical image of BAE cells
obtained in the vacuum condition. These images were obtained before the STIM system
was in operation. Data accumulation took two hours to obtain these images with beam
currents of -60 pA, beam spot size of 1.5×1.5 μm2 and scanning area of 50×50 μm2.
Distributions of P, S, Cl and K elements are clearly seen and correspond to the shapes of
BAE cells. Trace Br elements, which are absorbed into their nuclei during DNA synthesis,
68
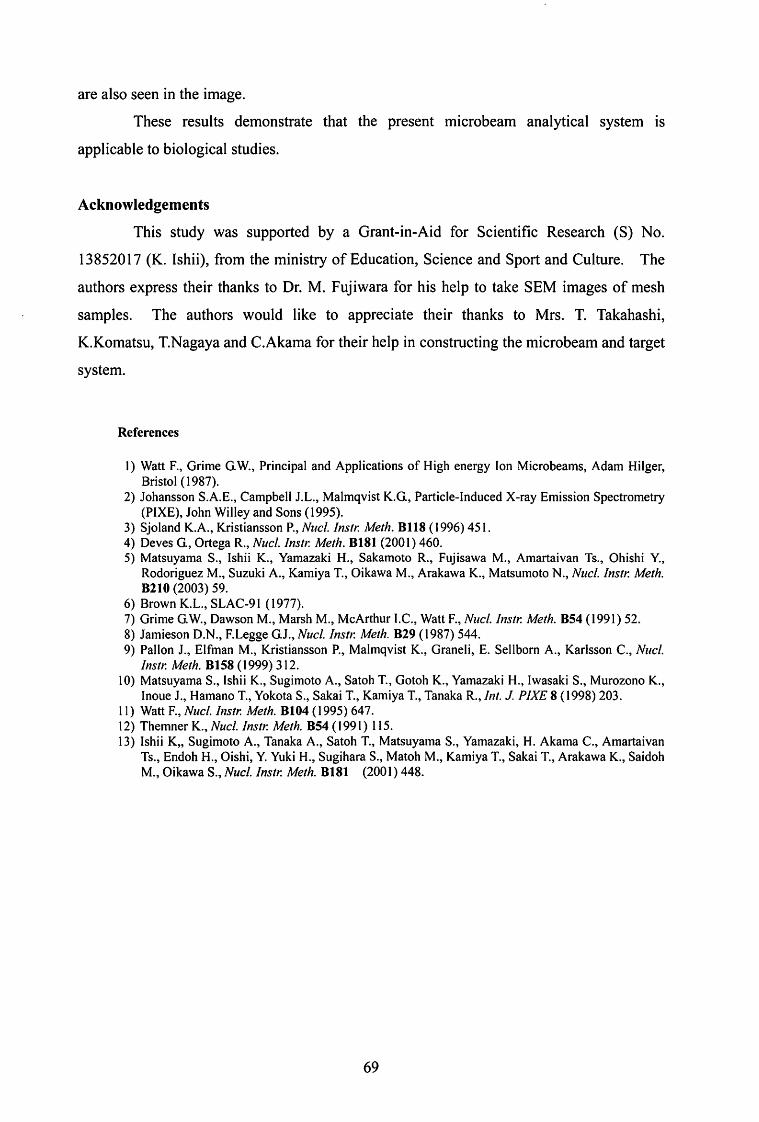
are also seen in the image.
These results demonstrate that the present microbeam analytical system is
applicable to biological studies.
Acknowledgements
This study was supported by a Grant-in-Aid for Scientific Research (S) No.
13852017 (K. Ishii), from the ministry of Education, Science and Sport and Culture. The
authors express their thanks to Dr. M. F吋iwarafor his help to take SEM images of mesh
samples. The authors would like to appreciate their thanks to Mrs. T. Takahashi,
K.Komatsu, T.Nagaya and C.Akama for their help in constructing the microbeam and target
system.
References
I) Watt F., Grime G.W., Principal and Applications of High energy Ion Microbeams, Adam Hilger, Bristol ( 1987).
2) Johansson S.A.E., Campbell J.L., Malmqvist K.G., Particle-Induced X-ray Emission Spectrometry (PIXE), John Willey and Sons (1995).
3) Sjoland K.A., Kristiansson P., Nucl. Instr. Meth. Bl18 ( 1996) 451. 4) Deves G., Ortega R., Nucl. Instr. Meth. B181 (200 I) 460. 5) Matsuyama S., Ishii K., Yamazaki H., Sakamoto R., F吋isawaM., Amartaivan Ts., Ohishi Y.,
Rodoriguez M., Suzuki A., Kamiya T., Oikawa M., Arakawa K., Matsumoto N., Nucl. Instr. Meth. B210 (2003) 59.
6) Brown K.L., SLAC-91 ( 1977). 7) Grime G.W., Dawson M., Marsh M., McArthur I.C., Watt F., Nucl. Instr. A命的.B54 (1991) 52. 8) Jamieson D.N., F.Legge G.J., Nucl. Jnst1~ Meth. B29 ( 1987) 544. 9) Pallon J., Elfman M., Kristiansson P., Malmqvist K., Graneli, E. Sellbom A., Karlsson C., Nucl.
Instr. Meth. B158 (1999) 312. 10) Matsuyama S., Ishii K., Sugimoto A., Satoh T., Gotoh K., Yamazaki H., Iwasaki S., Murozono K.,
Inoue J., Hamano T., Yokota S., Sakai T., Kamiya T., Tanaka R., Int. J. PIXE 8 (1998) 203. 11) Watt F., Nucl. Instr. Meth. B104 (1995) 647. 12) Themner K., Nucl. Instr. Meth. B54 (1991) 115. 13) Ishii k”Sugimoto A., Tanaka A., Satoh T., Matsuyama S., Yamazaki, H. Akama C., Amartaivan
Ts., Endoh H., Oishi, Y. Yuki H., Sugihara S., Matoh M., Kamiya T., Sakai T., Arakawa K., Saidoh M., Oikawa S., Nucl. Instr. Meth. B181 (2001) 448.
69
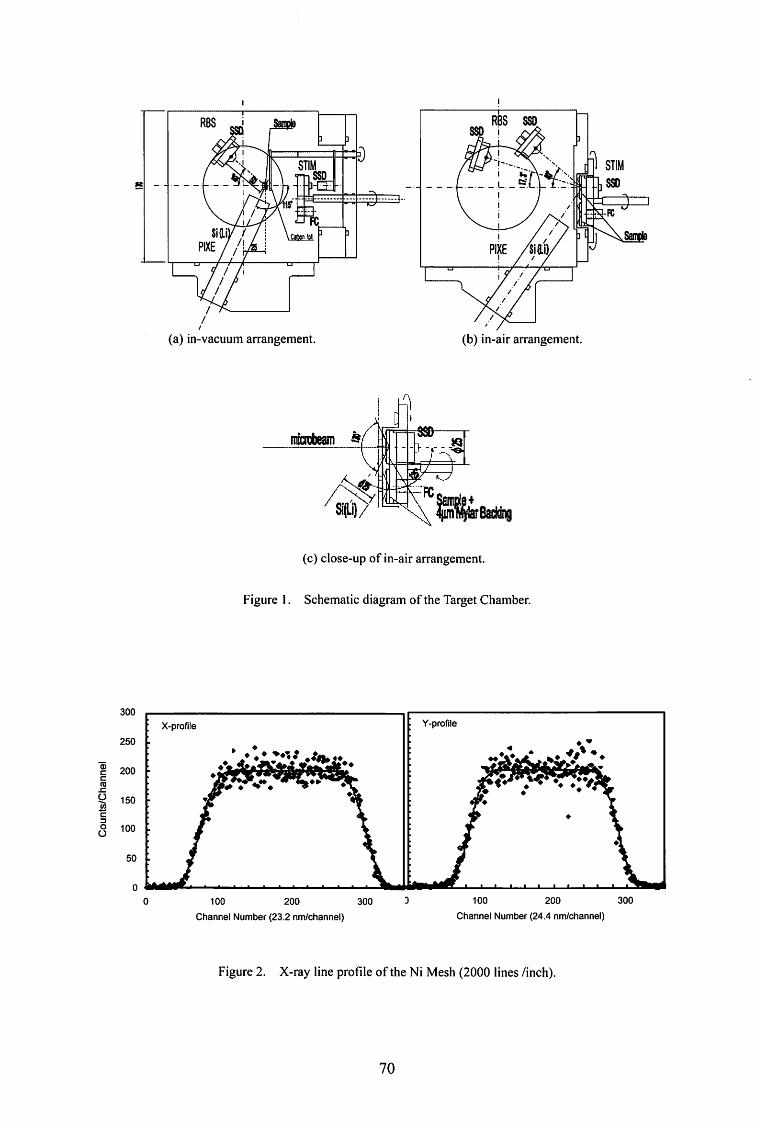
/
/
/ /
/
/
(b) in-air a汀angement.
/
(a) in-vacuum a町angement.
’E
ま!誌協酬( c) close-up of in-air arrangement.
Schematic diagram of the Target Chamber. Figure I.
300
Y-profile
100 200
Channel Number (24.4 nm/channel)
300
×-profile
100 200
Channel Number (23.2 nm/channel)
300
50
250
200
150
100
百ccmzo~gcコOU
X-ray line profile of the Ni Mesh (2000 lines /inch).
70
Figure 2.
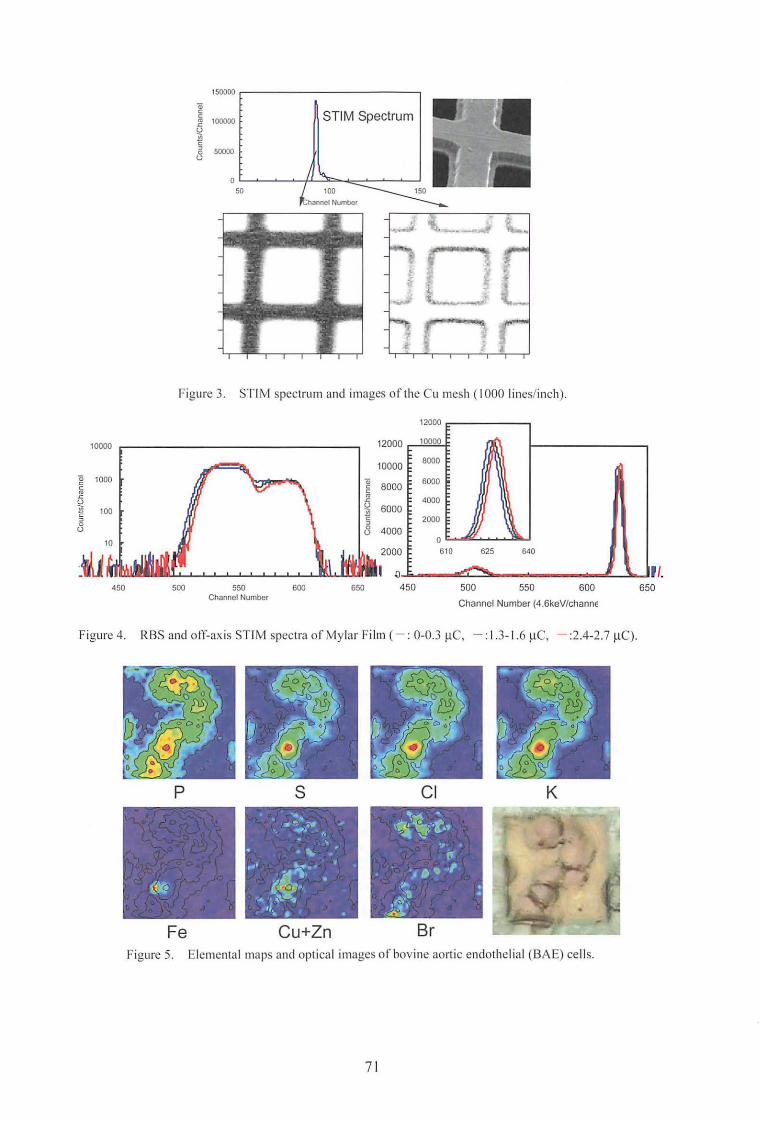
150000
~ c 2 100000
~ c
il u
0 50
50000
’I.
STIM spectrum and images of the Cu mesh (1000 lines/inch).
500 550 600
Channel Number (4.6keV/channe 650 600 550
Channel Number
Figure 3.
500
10000
1000
100
制
百ccozUB-C20U
- 1.3・I.6μC,一:2.4-2.7μC). RBS and off-axis STIM spectra of Mylar Film (一.0-0.3 μC, Figure 4.
K Cl s
,
ι”‘,
mh
,、
丸Fve
--’
p
:ダ悶
Cu+Zn Elemental maps and optical images ofbovinc aortic endothelial (BAE) cells.
71
Fe
Figure 5.
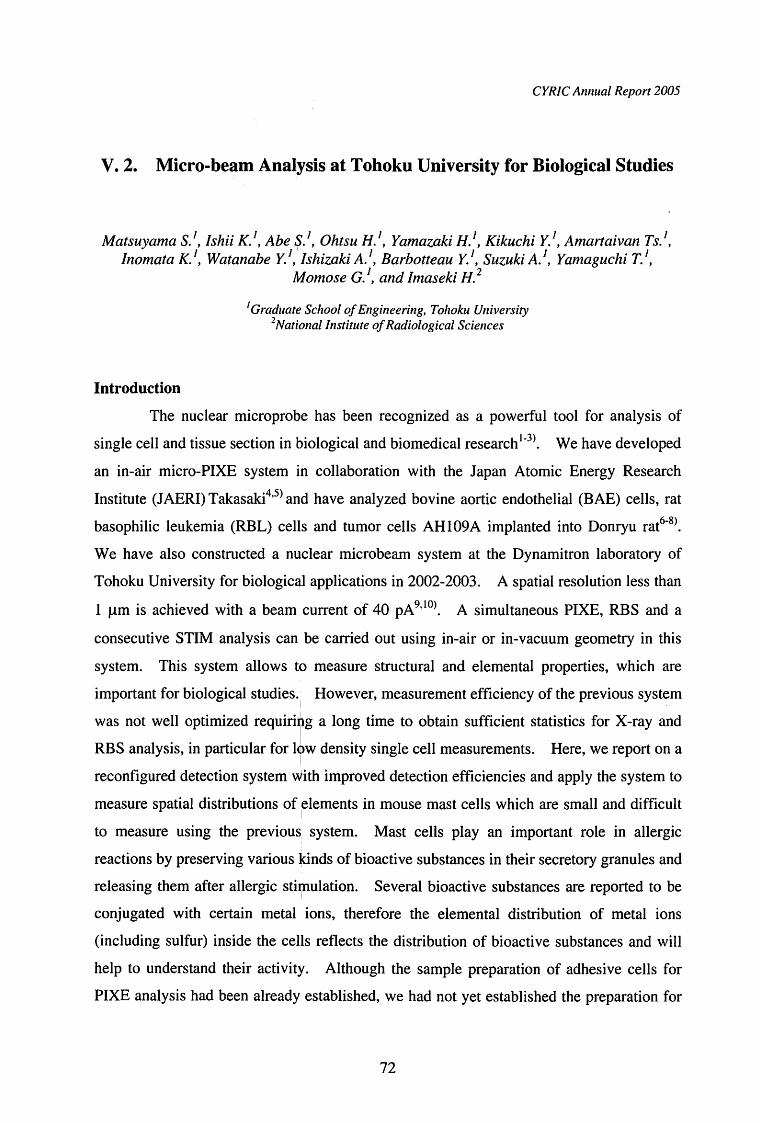
CYRIC Annual Report 2005
V. 2. Micro-beam Anal~sis at Tohoku University for Biological Studies
MatsuyamαS.1, Ishii K.1, Abe $.1, Ohtsu H.1, Yamazaki H.1, Kikuchi Y.1, Amartaivan Ts.1, lnomata K.1, Watanabe Y.1, lshizaki A.', Barbotteαu Y.1, Suzuki A.1, Yamaguchi T.1,
Momose G.1, and lmaseki H.2
Introduction
'Graduate School of Engineering, Tohoku Universiか"National Institute of Radiological Sciences
The nuclear microprobe has been recognized as a powerful tool for analysis of
single cell and tissue section in biological and biomedical research 1・3>. We have developed
an in-air micro-PIXE system in collaboration with the Japan Atomic Energy Research
Institute (JAERI) Takasaki4・5> and have analyzed bovine aortic endothelial (BAE) cells, rat
basophilic leukemia (RBL) cells and tumor cells AH109A implanted into Donryu rat6-8>.
We have also constructed a nuclear microbeam system at the Dynamitron laboratory of
Tohoku University for biological applications in 2002・2003. A spatial resolution less than
I μm is achieved with a beam cu汀・entof 40 pA9・10>. A simultaneous PIXE, RBS and a
consecutive STIM analysis can be carried out using in-air or in-vacuum geometry in this
system. This system allows to measure structural and elemental properties, which are
important for biological studies.1 However, measurement efficiency of the previous system
was not well optimized req山ga long time to obtain sufficient S附加伽 X-町 and
RBS a叫 sis,in partic伽 for1tw de叫 siゆ cellmeasureme凶 Here, we問削ona
reconfigured detection system with improved detection efficiencies and apply the system to
measure spatial distributions of 1elements in mouse mast cells which紅esmall and difficult
to measure using the previous: system. Mast cells play an important role in allergic
reactions by preserving various kinds of bioactive substances in their secretory granules and
releasing them after allergic sti~ulation. Several bioactive substances are reported to be
conjugated with certain metal ions, therefore the elemental distribution of metal ions
(including sulfur) inside the cells reflects the distribution of bioactive substances and will
help to understand their activity. Although the sample preparation of adhesive cells for
PIXE analysis had been already established, we had not yet established the preparation for
72
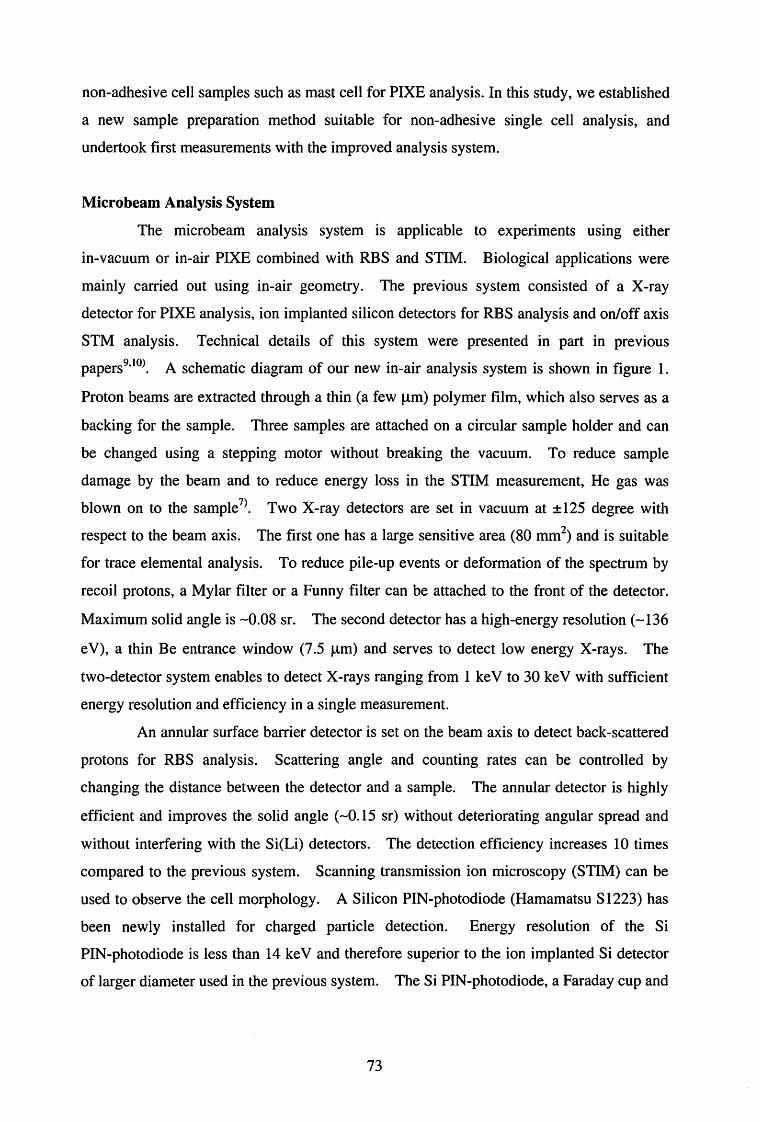
non-adhesive cell samples such as mast cell for PIXE analysis. In this study, we established
a new sample preparation method suitable for non-adhesive single cell analysis, and
undertook first measurements with the improved analysis system.
Microbeam Analysis System
The microbeam analysis system is applicable to experiments using either
in-vacuum or in-air PIXE combined with RBS and STIM. Biological applications were
mainly carried out using in-air geome甘y. The previous system consisted of a X-ray
detector for PIXE analysis, ion implanted silicon detectors for RBS analysis and on/off axis
STM analysis. Technical details of this system were presented in part in previous
papers9・10>. A schematic diagram of our new in-air analysis system is shown in figure 1.
Proton beams are extracted through a thin (a few μm) polymer film, which also serves as a
backing for the sample. Three samples are attached on a circular sample holder and can
be changed using a stepping motor without breaking the vacuum. To reduce sample
damage by the beam and to reduce energy loss in the STIM measurement, He gas was
blown on to the sample7>. Two X-ray detectors are set in vacuum at ±125 degree with
respect to the beam axis. The first one has a large sensitive訂ea(80 mm2) and is suitable
for trace elemental analysis. To reduce pile-up events or deformation of the spectrum by
recoil protons, a Mylar filter or a Funny filter can be attached to the front of the detector.
Maximum solid angle is ~0.08 sr. The second detector has a high-energy resolution (ー136
eV), a thin Be entrance window (7.5 μm) and serves to detect low energy X-rays. The
two-detector system enables to detect X-rays ranging from 1 keV to 30 keV with sufficient
energy resolution and efficiency in a single measurement.
An annular surface barner detector is set on the beam axis to detect back-scattered
protons for RBS analysis. Scattering angle and counting rates can be controlled by
changing the distance between the detector and a sample. The annular detector is highly
efficient and improves the solid angle (~0.15 sr) without deteriorating angular spread and
without interfering with the Si(Li) detectors. The detection efficiency increases 10 times
compared to the previous system. Scanning transmission ion microscopy (STIM) can be
used to observe the cell morphology. A Silicon PIN-photodiode (Hamamatsu S1223) has
been newly installed for charged particle detection. Energy resolution of the Si
PIN-photodiode is less than 14 keV and therefore superior to the ion implanted Si detector
of larger diameter used in the previous system. The Si PIN-photodiode, a Faraday cup and
73

a scintillator are attached to a detector wheel off center to the beam axis (see Fig. 1). The
detector wheel is turned slowly until the PIN-photodiode is centered on the beam axis,
while monitoring the count rate of the detector and reducing beam cu町entaccordingly.
Sample to detector distance is ~10 mm. Before and after simultaneous PIXE and RBS
analysis, STIM data are acquired. Data are acquired in list mode by a multi-parameter
data acquisition system. The list mode is very e仔ectiveto monitor elemental loss during
irradiation.
Sample Preparation
Mouse mast cell line P815, which has the characteristic features of non-adhesive
type mast cells, was cultured in RPMI 1640 medium supplemented with 10% FBS (Fetal
Bovine Serum). After washing three times with THAM (trishydroxymethylamino-
methane)-HN03 buffer, the cell pellet was resuspended with 15 ml (equivalent to 3 x10⁷
cells) of THAM-HN03 buffer and passed through Nuclepore filter of 0.22 μm pore size
(Millipore, Isopore Membrane filter). Although trapped cells are not uniformly distributed,
the region which is suitable for single cell analysis is found easily. Then, the Nuclepore
filter is attached to the 5 μm polycarbonate foil which serves as beam exit window so that
cells訂einserted between Nuclepore filter and polyc訂bonatefoil. The cells are cryofixed
in isopentane solution at liquid nitrogen temperature for 24 hours in vacuum6・8).
Results
The new analysis system was employed. STIM was used to find single cells and
proved to be fast and efficient especially when cells are not uniformly distributed. The
cell matrix composition (C, N 1and 0), density and thickness were determined by RBS.
PIXE provided the elemental information. Typical elemental maps of mast cell are shown
in figure 2. It took 90 minutes to obtain the elemental images with beam cu町・entsof~40
pA, a beam spot size of l×1 μm2 and scanning size of 20×20 μm2. Quantitative PIXE
analysis was performed using the GeoPIXEII software1l). Distributions of P, S and K
elements are clearly seen and co町espondto the C, 0 maps. Cells keep their original shape
and cryofixation seems to be successful. Phosphorus appears to be concentrated in the cell
nucleus but S and K are more uniformly distributed through the cell. Iron is strongly
localized in one cell only but has been also seen in bovine aortic endothelial (BEA) cells in
a previous study10>. The amount of P in a cell is less than 5 pg, which is one half of the
74
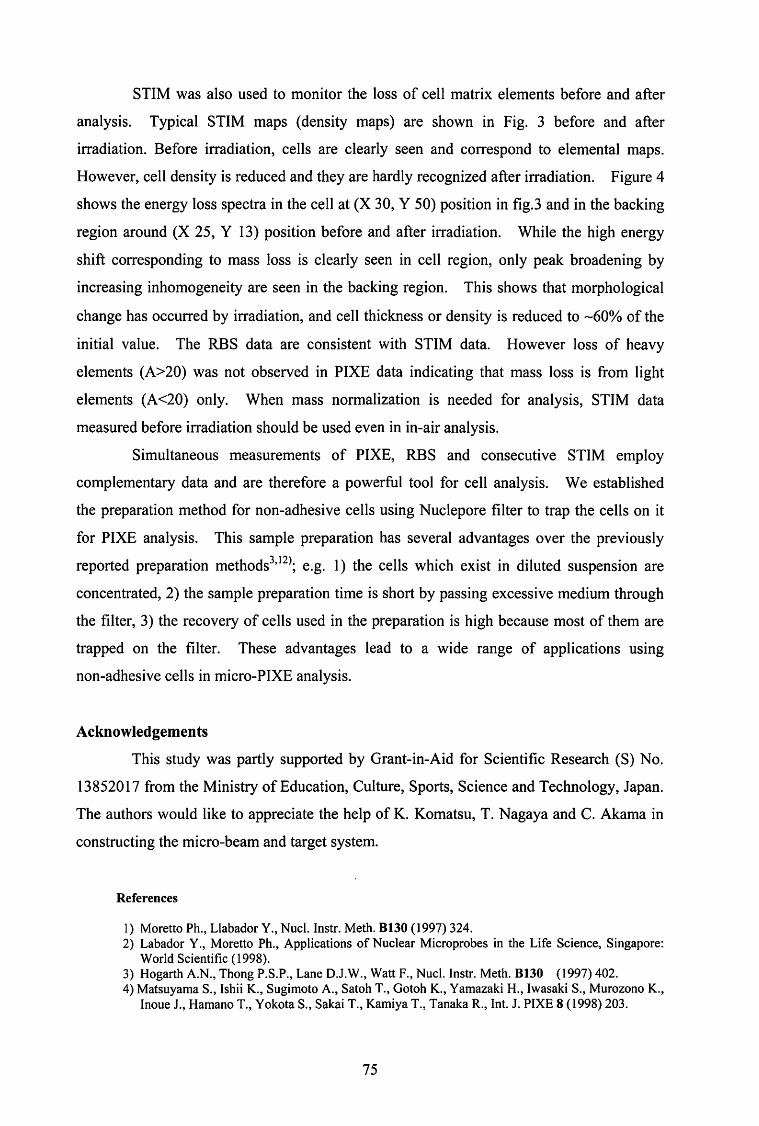
STIM was also used to monitor the loss of cell matrix elements before and after
analysis. Typical STIM maps (density maps) are shown in Fig. 3 before and a丘町
irradiation. Before irradiation, cells are clearly seen and correspond to elemental maps.
However, cell density is reduced and they are hardly recognized after irradiation. Figure 4
shows the energy loss spectra in the cell at (X 30, Y 50) position in fig.3 and in the backing
region around (X 25, Y 13) position before and after irradiation. While the high energy
shift corresponding to mass loss is clearly seen in cell region, only peak broadening by
increasing inhomogeneity are seen in the backing region. This shows that morphological
change has occurred by irradiation, and cell thickness or density is reduced to~60% of the
initial value. The RBS data are consistent with STIM data. However loss of heavy
elements (A>20) was not observed in PIXE data indicating that mass loss is from light
elements (Aく20)only. When mass normalization is needed for analysis, STIM data
measured before irradiation should be used even in in-air analysis.
Simultaneous measurements of PIXE, RBS and consecutive STIM employ
complementary data and are therefore a power白ltool for cell analysis. We established
the preparation method for non-adhesive cells using Nuclepore filter to trap the cells on it
for PIXE analysis. This sample preparation has several advantages over the previously
reported preparation methods3・12>; e.g. I) the cells which exist in diluted suspension are
concentrated, 2) the sample preparation time is short by passing excessive medium through
the filter, 3) the recovery of cells used in the preparation is high because most of them are
trapped on the filter. These advantages lead to a wide range of applications using
non-adhesive cells in micro-PIXE analysis.
Acknowledgements
This study was partly supported by Grant-in-Aid for Scientific Research (S) No.
13852017企omthe Ministry of Education, Culture, Sports, Science and Technology, Japan.
The authors would like to appreciate the help of K. Komatsu, T. Nagaya and C. Akama in
constructing the micro-beam and target system.
References
1) Moretto Ph., Llabador Y., Nucl. Instr. Meth. 8130 (1997) 324. 2) Labador Y ., Moretto Ph., Applications of Nuclear Microprobes in the Life Science, . Singapore:
World Scientific ( 1998). 3) Hogarth A.N., Thong P.S.P., Lane D.J.W., Watt F., Nucl. Instr. Meth. B130 (1997) 402. 4) Matsuyama S., Ishii K., Sugimoto A., Satoh T., Gotoh K., Yamazaki H., Iwasaki S., Murozono K.,
Inoue J., Hamano T., Yokota S., Sakai T., Kamiya T., Tanaka R., Int. J. PIXE 8 (1998) 203.
75
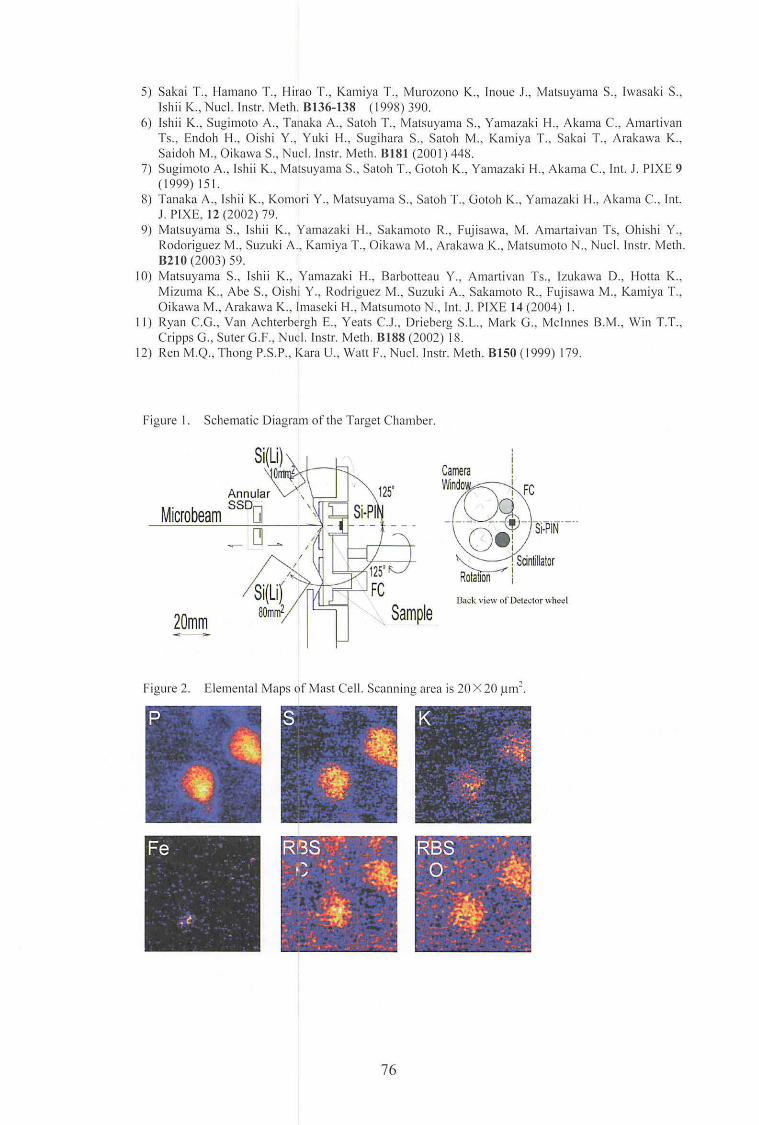
5) Sakai T., Hamano T., Hirao T., Kamiya T., Murozono K., Inoue J., Matsuyama S., Iwasaki S., Ishii K., Nucl. Instr. Meth. B136・138 ( 1998) 390.
6) Ishii K., Sugimoto A., Tanaka A., Satoh T., Matsuyama S., Yamazaki 1-1., Akama C., Amart1van Ts., Endoh 1-1., Oishi Y., Yuki H., Sugihara S., Satoh M., Kamiya T., Sakai T., Arakawa K., Saidoh M., Oikawa S., Nucl. Instr. M巴th.8181 (2001)448.
7) Sugimoto A., Ishii K., Matsuyama S., Satoh T., Gotoh K., Yamazaki H., Akama C., Int. J. PIXE 9 ( 1999) 151.
8) Tanaka A., Ishii K., IくomoriY., Matsuyama S., Satoh T., Gotoh K., Yamazaki H., Akama C., Int. J. PIXE, 12 (2002) 79.
9) Matsuyama S., Ishii K., Yamazaki H., Sakamoto R., Fujisawa, M. Amartaivan Ts, Ohishi Y., Iミodorigu巴ZM., Suzuki A., Kamiya T., Oikawa M., AralくawaK., Matsumoto N., Nucl. Instr. Meth. 8210 (2003) 59.
I 0) Matsuyama S円 IshiiK., Yamazaki H., Barbotteau Y., Amartivan Ts., lzukawa D., l-lotta K., M izuma K., Abe S., Oishi Y ., IミodriguezM., Suzuki A., Sakamoto R., Fujisawa M., Kamiya T., Oikawa M., Arakawa K., lmaseki 札、MatsumotoN., Int. J. PIXE 14 (2004) I.
11) Ryan C.G., Van Achterbergh E., Yeats C.J., Drieberg S.L., Mark G., Mcinnes B.M., Win T.T., Cripps G., Suter G.F., Nucl. Instr. Meth. Bl88 (2002) 18.
12) Ren M.Q., Thong P.S.P., Kara U., Watt F., Nucl. Instr. Meth. BISO (1999) 179.
Figur巴 I. Schematic Diagram of the Target Chamber.
畑
口凶丙口
町川
D
一
nqu
一
AS
一m川
一
MM一
20mm
Camera 1
Back view of Detector wheel
p
Figure 2. Elemental Maps of Mast Cell. Scanning area is 20×20ドm2.
RBS·~~
‘議正圃
76
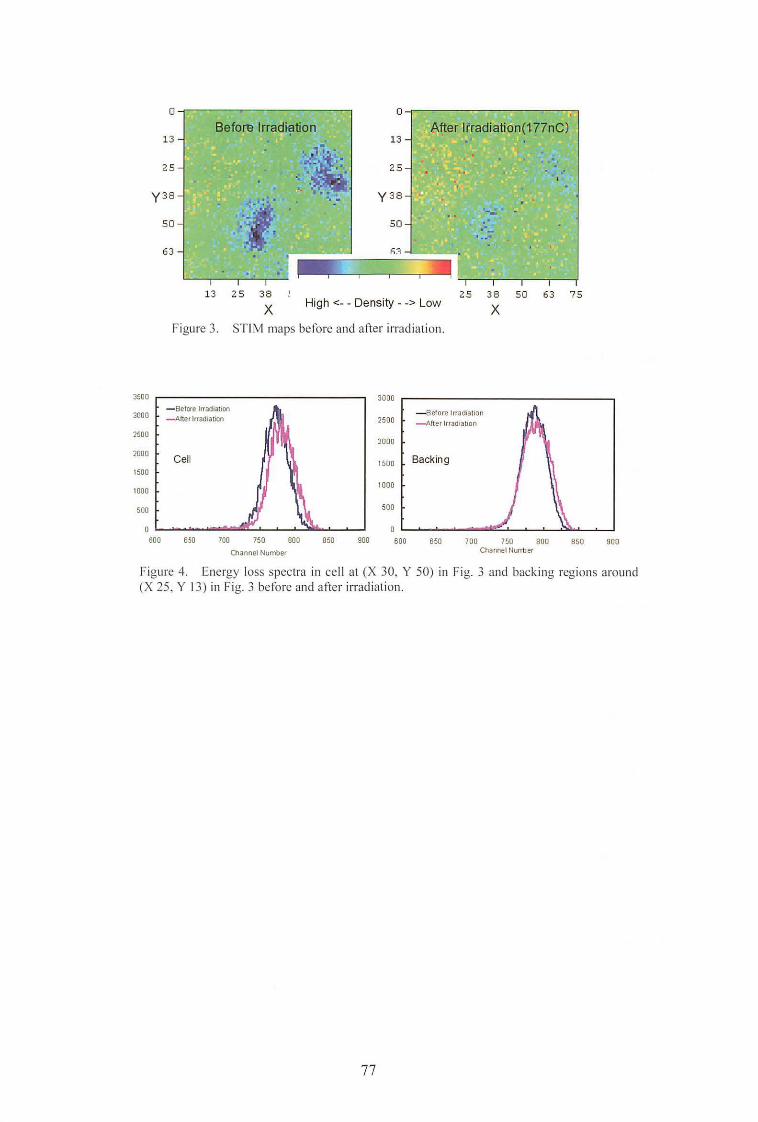
25 -l
y3sイ
50-l
63」
。Beforn lrrad陥泊on A代erlfradiation(177nC)
.
13 25 38 !
x
13
y3s
"' -
High<ー・Density-・〉しow
. _, .. ~ .. ・ l. ~ :c~ . ~ ~己戸 .:.・‘
’
.-、司町.. .
' . .
. - ー・..ー.
25 38 50 63 75
x Figure 3. STIM maps before and after irradiation.
3500 . 3日日日
300日
2500
2日日目
1500
1日目。
500
2500
20日O
ー-Beforelrrad1副ion
-Alter lrradiabon
150日 ιBacking
100日
50日
6日0 650 700 750 800 850 9日日 600 650 700 750 自日日 850 90日
αiannel Number Channel Nun1:Jer
Figure 4. Energy loss spectra in cell at (X 30, Y 50) in Fig. 3 and backing regions around (X 25, Y 13) in Fig. 3 before and after irradiation.
77
CYRIC Annual R問port2005
V. 3. Chemical State Analisis of Cr Compounds Using Heavy ion PIXE
Ishii K., Amartaivan Ts., Yamαzaki H., Matsuyαma S., Kawamura Y., OyαmaR., Jshizαki A,αndMomose G
Graduate School of Engineering, Tohoku University,
Introduction
The toxicity of heavier elements differs widely in their chemical state as well as
there concentrations. Therefore, trace heavy element analysis with their chemical state
and high sensitivity is of great importance for environmental monitoring. Particle induced
x-ray emission (PIXE) is a power白ltechnique for quantitative analysis. Usually proton
beams with an energy around 3 MeV are used in PIXE offering high sensitivity'>. Since
chemical shift is very small and difficult to measured with conventional Si(Li) detector,
high sensitive measurement with chemical state is impossible in this condition.
The sensitivity of PIXE strongly depends on the X-ray production cross-sections,
which are proportional to the square of the projectile charge2> it can be expected that the use
of heavy ion beams will improve the sensitivity of the analysis considerably. The lower
limit of detection (LLD) in the PIXE analysis using 70 Me V carbon ions is improved 2-4
times compared to that using proton bombardment for heavier elements3>.
Since chemical change due to chemical state of the elements will be expanded due
to multiple ionization, it may be measured with a conventional Si(Li) detector. In the last
report, the three parameters, the relative change of an intensity ratio of k~ and kcx (Intensity
Ratio), a ratio of k~ and kαline width (line width ratio) and an energy difference between kL
and kcx line (relative energy shift), were measured using 70 MeV carbon ions and 3 MeV
protons. Changes in those parameters were corresponds to their chemical state. It shows
that PIXE with heavy ions will lead to chemical state analysis with high-sensitivity. Here,
the Ar ion beams of 78 Me V are applied to chemical state analysis using PIXE.
Probability of multiple ionization for Ar ion beams of 78 Me V is higher than that for C ion
beams of 70 MeV, which will increase sensitivity in determining chemical state with high
sensitivity.
78
Experimental
Experiment for Ar ions was carried out at Cyclotron Radioisotope Center. Samples
are Cr2(S04)3, CrCbヲ Cr(N03)3,KzCr201, Cr metal, CrB2, Cr203, CrB and CrF3.3H20.
The targets were placed at an angle of 45° with respect to the beam direction. X-rays
emitted from the target were measured at an angle of 90° with respect to the beam direction,
by a Si(Li) detector. 1 mm Mylar film was placed in front of the Si(Li) detector to reduce
pile-up events. The energy calibration was obtained with characteristic x-rays from a 241 Am
source.
Results
The relative change of an intensity ratio of k~ and kα (Intensity Ratio), a ratio of kp
and kαline width (line width ratio) and an energy di妊erencebetween kp and kαline
(relative energy shift) for Ar ions is shown 3-dimentionally in Figure 1, in comparison with
the results for protons and carbon ions. The changes of these parameters are within
experimental e町orsexcept for intensity ratio in case of proton bombardment and difficult to
speci今 chemicalstate of the elements. In case of carbon and Ar ions, changes in
parameters seem to correspond to chemical states. However, tendency of these parameter
changes corresponds to chemical state is different for these ion bombardments. Figure 2
shows the 3-parameters results for mixed samples which contains elements of different
chemical states with different composition. As expected the previous results in Fig. 1,
values of mixed samples on these parameters are close to the values of the sample in single
chemical state. Since these measurements were carried out within a few minute, PIXE with
Ar ions will lead to chemical state analysis with high-sensitivity.
Acknowledgements
The authors thank the working group of the Cyclotron Radioisotope Center, Tohoku
University for the operation and maintenance of the accelerator.
References
I) Johansson S.A.E., Campbell J.L.,“PIXE A Novel Technique for Elemental Analysis”, John Wiley & Sons Ltd. (1988) 32.
2) Ishii K., Orihara., H., Iwat, Y., Bessho K., Int. J. PIXE 4 (1994) 1. 3) Amartaivan Ts., Ishii K., Yamazaki H .. , Matsuyama S., Suzuki A., Yamaguchi T., Abe S., Inomata
K., Watanabe Y., Proceedings of 101h international conference on PIXE and its applications, Portoroz, Slovenia, June 4・8,2004.
79
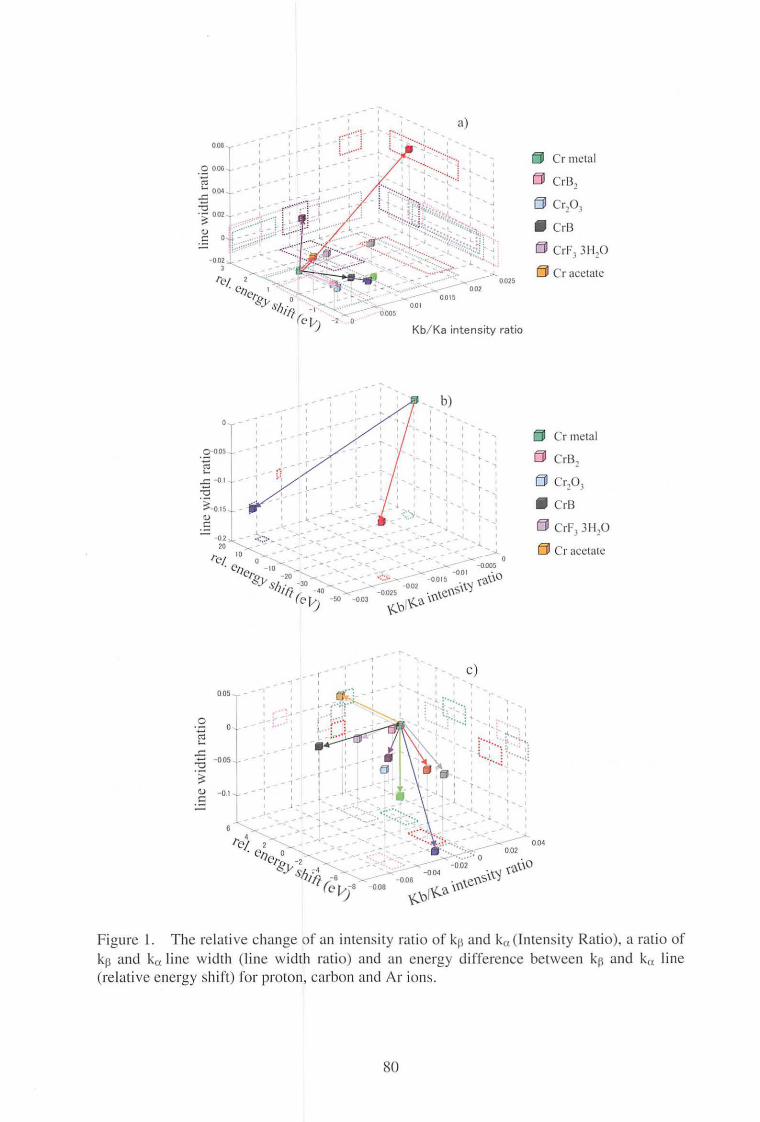
。問
、コ〉
ω ロ
~<~三 三:隆三三;:!とミ
r
,
,
,
, ’’ ,
、‘,J・hu
、、
' I I ‘、I‘、
、、。、”
ー}司」
、
nu
E
,ih5ρ
、
J
∞.1
r
l
久
4
dI
白
・
、
加
吋J
JM
O
--
三
4
β
l
l
f
v
f
、
A
目が
、
川
nu
・凶ν
;r
,ypA’4V
、
}
,
\
可
仇y
e
,、一
.
ωばい
/
J1
.一二聞ゆ
6
1
4
,、,
ρ・4
h
,,、
v’’、片
的
8
4
’IJ
1
1
4
,、J
‘
4
,、J
,t、’\r
,\
h3
1sょ,\,-
H
,、一』
寸
,’J
J
、.よ
・4hy
一
、
,
、
,
、
,しV
1
,J
’、,
A
\叩’e
/
J
三、初-の
一トJ1!
H
,’Lリ
/
R
m
s-
lor
A.一U
K0
.b
4
・・”.
,、
h
’’a可
、oht
Lt
1
e
一
白喝
hill-E4il--,J凶
1
5
2
0
/
4
引
4
2hLi
戸一日主主
οzニ
-_, ,ぺ、ー,
U可
’Ili-
-
.白、ι1・.人一.ー ・-.一:ー..、’・ ..ー.、 .・
005
,
,
,
寸
t, ,、
戸右主主
’
,
,
,
,
,
”・’。ニ偲』
. ,. o 、L ’;:••" I ・・.
1 ・' . ・・・1.I
I • •
I • , 1
き引十’_: ~ -’_・.:-・'・’下〉とッ ..-
叫"'~~ n~ ー二二f’~ ぜ・-λ!と 年 _......- 002 島 004問。-~- _;ヘH ・~--···:・~ー ’'<!?..v-L ~~ 岡 、 戸 町二nA 叩 〕\"'<\ (\0
、'Ott;.,..-6 ->< --006 vv守・ tf'.¥,s¥¥) .
・ω円j"-<JOB ¥(_DI¥(_'(¥¥¥'¥¥:-
I 、て. I I v 、、2
Lil Cr metal
Lil Ct・払
白 Cr203
• CrB 。CrF33Hp
白Cracetate
白 Crmetal
Lil CrB、
白 Crp3
• CrB
白 CrF331120
Lil Cr acetate
、
Figure 1. The relative change of an intensity ratio of kp and kα(Intensity Ratio), a ratio of
kp and kαline width (line width ratio) and an energy difference between kp and kαline (relative energy shift) for proton, carbon and Ar ions.
80
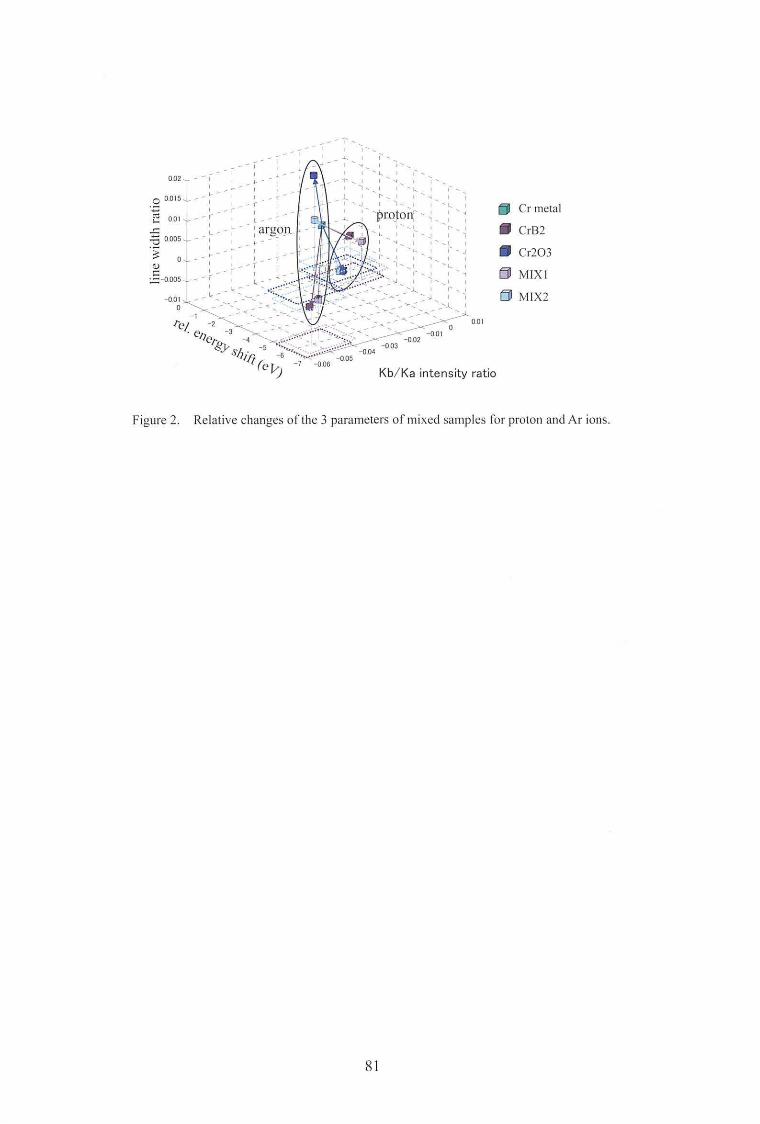
。Crmetal ・CrB2
• Cr203
白 MIXI
白 MIX2
Figure 2. Relative changes of the 3 parameters of mixed samples for proton and Ar ions.
81
CYRIC Annual Report 2005
V. 4. Absorption of Arsenate and Arsenite by Arsenic Hyperaccumlating Fern (Pteris vittata)
Tashiro K.1, Suto K.1, Inoue C. 1, Matsuyama S.2, Yamazaki H.2, and Ishii K.2
1 Graduate School of Environmental Studies, Tohoku University 2Graduate School of Engineering, Tohoku University
Phytoremediation using an arsenic hyperaccumulator, Pteris vittata L., has
generated increasing interest worldwide, for it’s both environmentally sound and cost
effective. However, the mechanisms of arsenic uptake and accumulation by this plant are
not clear at this time. This study shows the uptake of arsenate (As(V)) and arsenite
(As(Ill)) using a hydroponic culture of P. vittata. The fem takes up both As(V) and
As(III) from the culture which spiked with 50 mg of arsenic per litter, and can grow within
5 days of experimental period. Final amount of arsenic accumulated in the fem is 3.2 mg
(As(V)), and 3.8 mg (As(III)). The submilli-scale distribution of elements by PIXE
analysis clearly shows the accumulation of arsenic in fronds of P. vittata.
Introduction
Arsenic contamination of soils and groundwater from various sources such as mine
and urban wastes, wood preservatives and pesticides is of great environmental problem 1 ・2>.
A number of technologies for arsenic-contaminated soils have been proposed. However,
most of them are generally expensive and may produce secondary wastes.
Phytoremediation is an acceptable technology for relative lower level of arsenic
contaminated soil because it is recognized cost-effective and environmental friendly
process. Recently, Pteris vittata L., a kind of fem, has been found as an arsenic
hyperaccumulator plant3>. Thi~ species can accumulate up to 20 g/kg of arsenic in its
above ground biomass. Recently, several other fem species have been reported to have
ability to hyperaccumulate arsenic similar to P. vittata4>. In case of P. vittata grown on
arsenic-contaminated soil, most of the arsenic localized to the vacuoles in epidermal cell of
仕onds3・5>. It is undoubtedly that arsenic enters in the roots and translocate to the fronds.
Arsenic accumulated in the frond of P. vittata is mostly arsenite (As(Ill)) form, while
82
arsenic in the root occurs predominantly arsenate (As(V)) form6>. It is believed that
arsenate taken up by roots is converted to arsenite before or after it is translocated to the
frond 7>. The entry system of arsenic to P. vittata is not studied well. Recently, Poynton et
al. S) showed that arsenate influx into the roots of hyperaccumlating ferns is greater than in
nonhyperaccumulating ferns and speculated that the phosphate transporting protein has a
responsibility for the influx. However, in our knowledge, there are no report concerning
to arsenite influx into hyperaccumlating ferns. The aim of this work is to show the uptake
of arsenate and arsenite into the P. vittata using chemical and PIXE analysis.
Materials and Methods
Plant material
P. vittata L.3> was used throughout the experiment. Fern seedlings were used 3
months after spore germination. The roots were washed carefully in tap water to remove
soil particles. The seedlings were then transferred to hydroponic water containing nutrient
solution. To compare the effect of phosphate, phosphate-free nutrient solution was also
used for several hydroponic experiments. The nutrient solution was aerated continuously.
Seedlings were grown on the solution for 1 week in a growth camber with a 16 hours light
period, 25 degree/20 degree day/night temperature and 70% relative humidity.
Arsenate and arsenite uptake experiments
After 1 week cultivation in hydroponic solution, the roots were washed well in tap
water. Each seedling was placed in 100 ml conical beaker filled with 100 ml uptake
solution. Then arsenic in the form of either As(V) as sodium arsenate (Na2HAs04 7H20),
or As(III) as sodium arsenite (NaAs02) was added to the uptake solution to be final
concentration 50 mg-As per litter. The seedlings treated were incubated in the growth
camber at the same condition for a day. After 24 hours incubation, total weight of the
beaker was measured to determine the amount of transpiration by the fern. Then the roots
were washed and the seedling was placed new conical beaker filled with 100 ml of fresh
solution containing the same kind and amount of arsenic. This cycle was repeated for 5
days. Arsenic concentration of the uptake solution was determined by ICP-MS (Hewlett
Packard, HP-4500). Distribution image of elements in the plant sample was analyzed by
submilli-PIXE camera equipped in the Dynamitron laboratory of Tohoku University.
Details of the system and analytical methods are described previously9・10>.
83
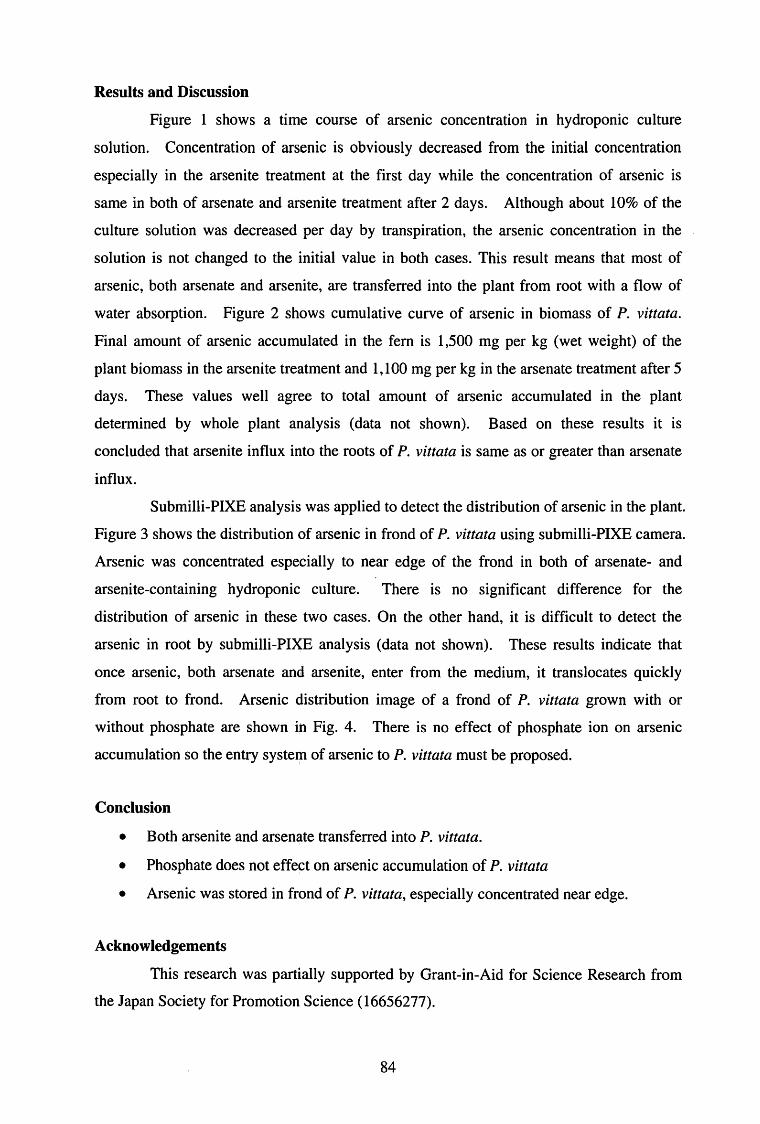
Results and Discussion
Figure 1 shows a time course of arsenic concentration in hydroponic culture
solution. Concentration of arsenic is obviously decreased from the initial concentration
especially in the arsenite treatment at the first day while the concentration of arsenic is
same in both of arsenate and arsenite treatment after 2 days. Although about 10% of the
culture solution was decreased per day by transpiration, the arsenic concentration in the
solution is not changed to the initial value in both cases. This result means that most of
arsenic, both arsenate and arsenite, are transferred into the plant from root with a flow of
water absorption. Figure 2 shows cumulative curve of arsenic in biomass of P. vittata.
Final amount of arsenic accumulated in the fem is 1,500 mg per kg (wet weight) of the
plant biomass in the arsenite treatment and 1, 100 mg per kg in the arsenate treatment after 5
days. These values well agree to total amount of arsenic accumulated in the plant
determined by whole plant analysis (data not shown). Based on these results it is
concluded that arsenite influx into the roots of P. vittata is same as or greater than arsenate
influx.
Submilli-PIXE analysis was applied to detect the distribution of arsenic in the plant.
Figure 3 shows the distribution of arsenic in frond of P. vittata using submilli-PIXE camera.
Arsenic was concentrated especially to near edge of the frond in both of arsenate-and
arsenite-containing hydroponic culture. There is no significant difference for the
distribution of arsenic in these two cases. On the other hand, it is difficult to detect the
arsenic in root by submilli-PIXE analysis (data not shown). These results indicate that
once arsenic, both arsenate and釘 senite,enter from the medium, it translocates quickly
from root to frond. Arsenic distribution image of a frond of P. vittata grown with or
without phosphate are shown in Fig. 4. There is no effect of phosphate ion on arsenic
accumulation so the entry system of arsenic to P. vittata must be proposed.
Conclusion
• Both arsenite and arsenate transferred into P. vittata.
• Phosphate does not effect on arsenic accumulation of P. vittata
• Arsenic was stored in frond of P. vittata, especially concentrated near edge.
Acknowledgements
This research was partially supported by Grant」n-Aidfor Science Research from
the Japan Society for Promotion Science (16656277).
84
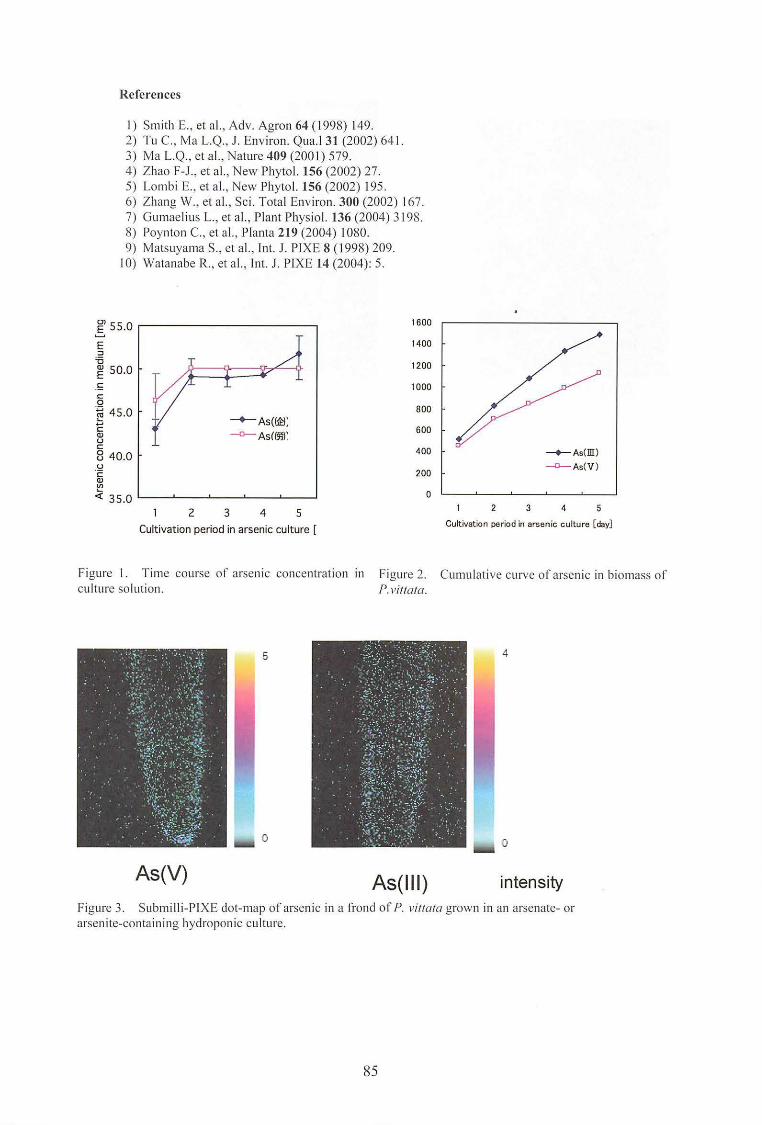
References
I) Smith E., et al., Adv. Agron 64 (1998) 149.
2) Tu C., MaしQ.,J. Environ. Qua.131(2002)641
3) Ma しQ.,et al., Nature 409 (200 I) 579.
4) Zhao F-J., et al., New Phytol. 156 (2002) 27.
5) Lombi E., et al., New Phytol. 156 (2002) 195.
6) Zhang W., et al., Sci. Total Environ. 300 (2002) 167.
7) Gumaelius L., et al., Plant Physiol. 136 (2004) 3198.
8) Poynton C., et al., Planta 219 (2004) I 080.
9) Matsuyama S., et al., Int. J. PIXE 8 ( 1998) 209.
10) Watanabe R., et al., Int. J. PIXE 14 (2004): 5.
一+-As(ill)
~As(V)
1600
1400
1200
1000
800
600
400
一←As(幽:
ー-o-As(悦)!
~ 55.0
ε コて3
E 5o.o c: c: 0
話45.0..... 今J
c: 申u c: 8 40.0 u c: 出‘,、《 35.0
200
1 2 3 4 5
Cultivation回 riodin arsenic culture [da吋
。1 2 3 4 5
Cultivation period in arsenic culture [
Cumulative CUI ve of arsenic in biomass of Figure 2.
P. vittata.
Figure I. Time course of arsenic concentration in
culture solution
4
,:・. 7三一 -v/~b- -・田園|・ ー之ぐ.:;'・>メデート ー・|ト ;~::t·}f: ,':~~チ~-:: I・|| ・ 1・.~. . . :勺1 ・・・・lI . 白川九’.; • -_, •• ~ゾ i . ・・・・lト ー ,i.o:・・_.-.... , ,_,,.;二 ・・・・l
十J :::晶子・:')·:~'守主 -・圃.||巴人 ーィピ:ち:"" 'ずに:ー . . .. | I .. 一 、仇令u : ":"'.''.・ ・冒・・lI . . :~;:.; -.; ;.:_;~- ;~;..;~:' - 田 圃・lIィ五百日;,r0:~s~: .~ E圃|I ... J悼iパー・ 7 4何百 司 ・・・lI . ・ ・ .: .~-i>t:~')~~:ミ~'.·,:・ 1: 町田I . B ・〉』 f w・ム 、 . ・・・・圃
5 一什一九町一上下一ーザミよ乱立性的九UFUJ注文FLFtJhpMydJAー一
一色ス白一一-、j
i
・一、fIJ・九十JJhイJIJ1.h
.0
…ukJY314LjJ
!一
一一⑤一一-L
一戸弓(HIt-吋
rut--朴一一九叫旬、-11一一・ム.J’e
一。
As(lll) Figure 3. Submilli-PIXE doトmapof ars巴nicin a frond of P. vittata grown in an arsenate-or
ars巴nite・containinghydroponic culture.
85
intensity
。
As(V)
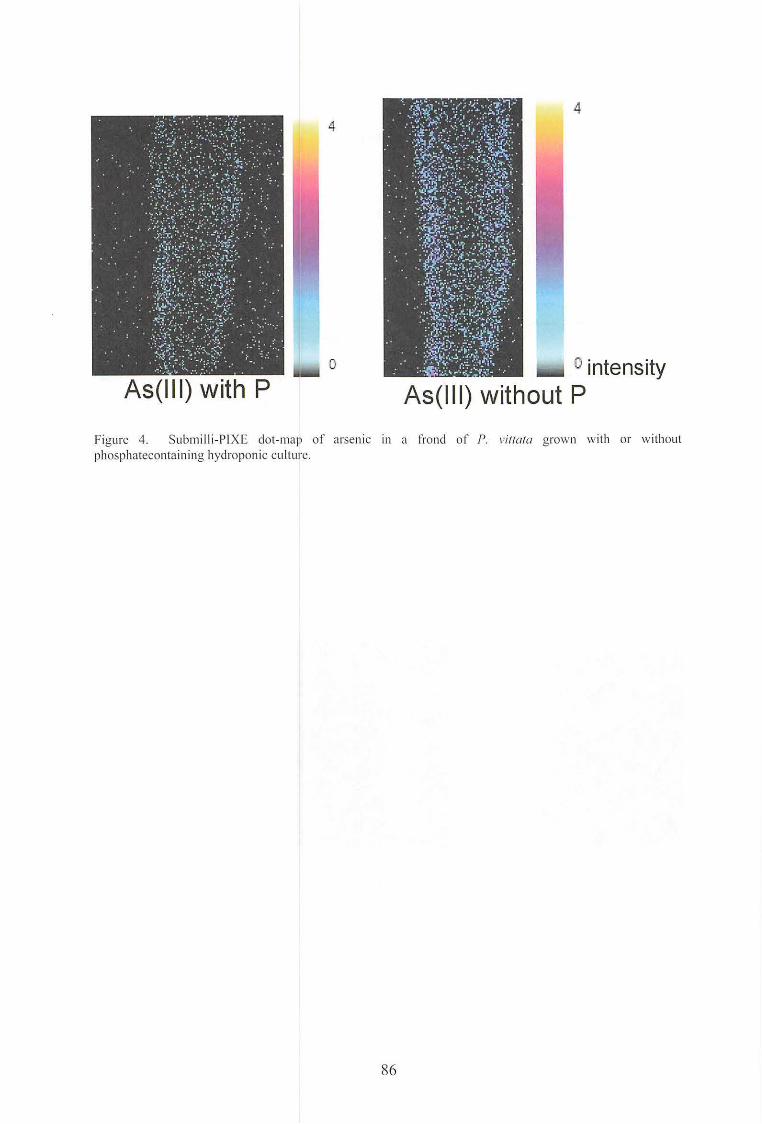
4
0
As(l 11) with P
・.:・.: :.:.'=: .. r ::子 .
~,~~主;持r.·・・・・・・ ~{!}; ドぷ川:均,';.:
3埠:P;や~/_:·;昨今i
:;:減~£~;:務;:内,...
・,~kS .:.~~{~{:';:: .. ・
..九'~~ゐバ妥J語:~?-~守:さT~鮮
. ".:~J1'~}/~必 w.~-...・ぺ:お民:::'.;~:-'t~:・.・.…・判 ・
4
;総当~iJ: 。intensityAs(lll) without P
Figure 4. Submilli-PIXE dot-map of arsenic in a frond of P. vittata grown with or without phosphateconlaining hydroponic culture.
86
CYRIC Annual Report 2005
V. 5. Development of Monitoring System of Aqueous Environment by PIXE VII: Identification of Oxidation States of Trace-Level
Arsenic in Environmental Water Samples
Yαmαzαki H., Ishii K., Mα'fsuyαmαS., Kikuchi Y., Amαγtαivαn Ts.,}(αmaguchi T. Momose G, InomαtαK., Wtαtαnabe Y., lshizαrkiA., OyαmαR,αnd kαwαmura Y.
Graduate School of Engineering,あhokuUniversity
Introduction
A large amount of hazardous chemicals is discharged into the environment in the
process of industrial activities. Thus water quality monitoring becomes increasingly
important as we must use new water resources such as deep underground water. The envi-
ronmental degradation due to inclusion of a harm白lelement into flora and fauna strongly
depends on the element’s oxidation state. In monitoring pollution, it is thus necessary to
determine both the quantity and the chemical state of a harmful element in environmental
samples. Arsenite is more toxic than arsenate to the metabolism of flora and fauna and in
Japan the quality limit of environmental water samples is legally set to lower than 10 ppb
(ng/ml) for arsenic irrespective of the valence state1>. However complex separation and
pre-concentration procedures are required in order to determine arsenic concentrations
below 10 ppb in environmental water samples by using the spectrophotometric method,
graphite furnace atomic absorption spectroscopy or induced coupled plasma atomic
emission spectroscopyト5>. PIXE using 3 MeV protons offers high sensitivity for arsenic6>.
Chemical state analysis of elements in percent-level concentrations can be determined by
using the wavelength-dispersive PIXE technique, but this technique cannot be applied to
assay the oxidation state of arsenic at trace level concentrations 7・8).
Experimental
An enhanced sample preparation method for PIXE analysis was developed for
assaying the oxidation state of arsenic ions dissolved in water samples. Trivalent As033
and pentavalent AsOl・ionsare separately adsorbed at pH 4 with indium hydroxide colloids,
87
generated in the solution by adding competing ions of the sorption reaction such as sulfates
and phosphates. PIXE analyses of the two kinds of targets reveal the fractions of arsenic
of the di妊erentoxidation states. This technique is combined with a 3・steptarget
preparation method, previously developed for soluble and insoluble constituents in仕ace
concentra-tions9・11>. The multi-element analysis capability of PIXE provides information
on elements that are discharged from an arsenic pollution source. These sample
preparation techniques are then applied to analyze the arsenic concentration in a river basin,
where hot springs are located upstream being a possible source for emitting arsenic.
The targets prepared were analyzed in a vacuum chamber by using the
submilli-PIXE camera (3 MeV protons, 0.5-4 nA beam cuπents, 4x4mm scanning area,
irradiation time 5・10minutes) at Tohoku University, Japan12>. A target containing Asal・, Fe3+ and Cu2+ of known amounts (40 ppb in a 25 ml solution) was prepared by a
DBDTC-DBS pre-concentration technique11> and used as an external standard for
normalization of PIXE spectra仕omthe filtration targets. In PIXE-spectrum analysis, we
used a least-squares fitting computer code based on the pa抗emanalysis method, which has
been developed in our laboratory13>.
Results and discussion
Hydroxide colloids of trivalent or tetravalent metals are produced in a solution of
pH > 3.5 and possess anion-exchange property on the acidic side of the isoelectric point
located at pH 7 to 8. By changing the pH value, the collection rates of arsenic of As033・or
Asal・in100 ppb concentrations were examined for hydroxides of Fe3+,Ga3+,In3+ and Zr4+
under the condition of coexistin~ representative constituents of river water like K+, er and S042・inppm-concentrations. In order to confirm separation of ar,鈎nic仕omlead that may
cause an eηor to PIXE spectrum analysis of arsenic, test solutions were prepared containing
Pb2+ in 50 ppb concentrations. None of the four sorbents showed perfect separation for
arsenic of di妊erentoxidation states, but indium hydroxide colloids quantitatively adsorbed
arsenates separating them from lead ions in the pH region of 4 to 5. The adsorption of
coexisting ions in excess of more than 50 times higher concentrations had no adverse e首ect
on the recovery of pentavalent arsenic with metal hydroxide colloids generated in test
solutions. The detection limit was estimated to be 0.3 ppb As in a 25 ml solution based on
exceeding the 3σstatistical e汀orof background counts. It is clear that the quality of
environmental water samples relevant to human life can be assessed for harmful arsenic at
88
the limit く 10ppb by means of PIXE measurement using indium hydroxide targets
scavenging arsenic selectively in a solution. The PIXE analysis’s high sensitivity for
arsenic is attributable to the high pre-concentration factor of 105 in preparation of indium
hydroxide targets scavenging arsenate in solutions.
In order to improve separation of arsenic ions of di貨切・・entoxidation states, indium
hydroxide targets were prepared for arsenic in 100 ppb concentrations by adding sol・and
POl・inppm-concentrations, as shown in Fig. 1. These anions compete with arsenate and
arsenite ions when they are adsorbed with indium hydroxide colloids in a solution of pH 4.
Figure 1-a reveals that sulfate cannot depress sorption of arsenite even in 50 ppm
concen甘ationbut 1 ppm phosphate completely controls the arsenite sorption onto indium
hydroxide colloids. The so中tionof arsenate ions is not sensitive to addition of competing
ions and the arsenate recovery decreases by 15% only in the case of coexistence with 5 ppm
phosphate ions. As shown in Fig. 1・b,addition of 25 ppm sulfate and 1 ppm phosphate
controls the arsenite sorption within 11 % in a wide concentration region of 4 to 50 ppb
arsenite, while almost all of arsenate is collected with hydroxide colloids of indium of 10
ppm concentrations in original solutions. These results indicate that thin and uniform
targets of pentavalent arsenic ions are obtained well separated仕omtrivalent arsenic ions
under acidic condition at pH 4. The separation of AsOl・fromAs033・isascribed to the
fact that metal hydroxides possess an anion-exchange property with higher affinity for
POl・thanfor Cr03 3・. A complete separation of arsenic of di妊erentoxidation states was
also confirmed under the same experimental condition in solutions containing 1 ppm
arsenate or arsenite ions. In the case of separation without coexistence of sulfate, more
than 60% of indium hydroxide colloids were lost in filtration even after aging of colloids in
a solution heated to 80 °C. It is suggested from these findings that coexistence of sulfate
is indispensable to coagulate fine colloids of indium hydroxide into filterable particulates.
In order to confirm the applicability of the sample preparation technique to
monitoring arsenic pollution in the environment, we collected 0.5 dm3 -volume samples at 7
places in the Natori river valley at a length of 35 km, where five di妊erentspas are located
upstreams (Fig.2). Samples were also collected at five spas in ups仕切mlocations and at
one place in a branch of this river where no spas exist. Four kinds of PIXE targets were
prepared from each water sample using the indium hydroxide coprecipitation for arsenic
and the three-step method developed previously, that is, the Nuclepore filtration target for
insoluble constituents, the preconcentration target for trace amount of heavy metal ions
89
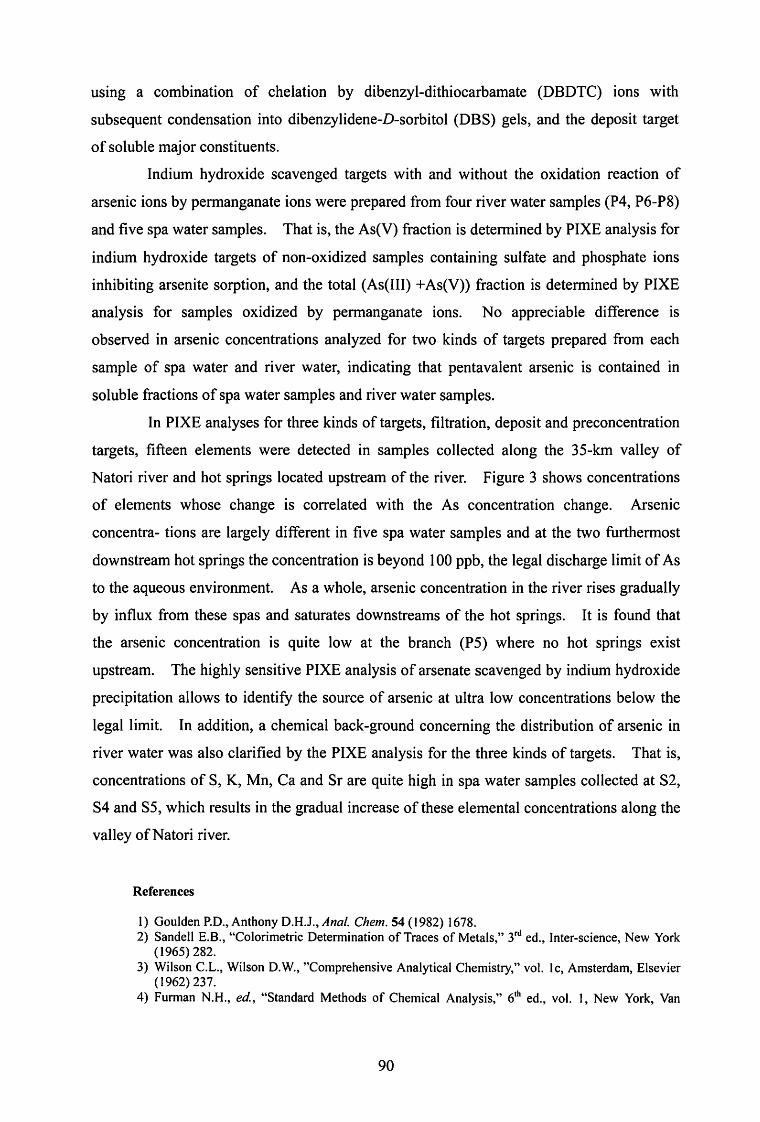
using a combination of chelation by dibenzyl-dithiocarbamate (DBDTC) ions with
subsequent condensation into dibenzylidene-D-sorbitol (DBS) gels, and the deposit target
of soluble m吋orconstituents.
Indium hydroxide scavenged targets with and without the oxidation reaction of
arsenic ions by permanganate ions were prepared from four river water samples (P4, P6-P8)
and five spa water samples. That is, the As(V) fraction is determined by PIXE analysis for
indium hydroxide targets of non-oxidized samples containing sulfate and phosphate ions
inhibiting arsenite sorption, and the total (As(III) +As(V)) fraction is determined by PIXE
analysis for samples oxidized by permanganate ions. No appreciable difference is
observed in arsenic concentrations analyzed for two kinds of targets prepared from each
sample of spa water and river water, indicating that pentavalent arsenic is contained in
soluble fractions of spa water samples and river water samples.
In PIXE analyses for three kinds of targets, filtration, deposit and preconcentration
targets, fifteen elements were detected in samples collected along the 35・kmvalley of
Natori river and hot springs located upstream of the river. Figure 3 shows concentrations
of elements whose change is correlated with the As concentration change. Arsenic
concentra-tions are largely different in five spa water samples and at the two furthermost
downstream hot springs the concentration is beyond 100 ppb, the legal discharge limit of As
to the aqueous environment. As a whole, arsenic concentration in the river rises gradually
by influx from these spas and saturates downstreams of the hot springs. It is found that
the arsenic concentration is quite low at the branch (P5) where no hot springs exist
upstream. The highly sensitive PIXE analysis of arsenate scavenged by indium hydroxide
precipitation allows to identi今thesource of arsenic at ultra low concentrations below the
legal limit. In addition, a chemical back-ground concerning the distribution of arsenic in
river water was also clarified by the PIXE analysis for the three kinds of targets. That is,
concentrations of S, K, Mn, Ca and Sr are quite high in spa water samples collected at S2,
S4 and S5, which results in the gradual increase of these elemental concentrations along the
valley of Natori river.
References
I) Goulden P.O., Anthony D.H.J., Anal. Chem. 54 ( 1982) 1678. 2) Sandell E.B.,“Colorimetric Determination of Traces of Metals,” 3rd ed., Inter-science, New York
(1965) 282.
3) Wilson C.L., Wilson D.W.,”Comprehensive Analytical Chemistry,” vol. 1 c, Amsterdam, Elsevier (1962) 237.
4) Furman N.H., ed,“Standard Methods of Chemical Analysis,” 6th ed., vol. 1, New York, Van
90
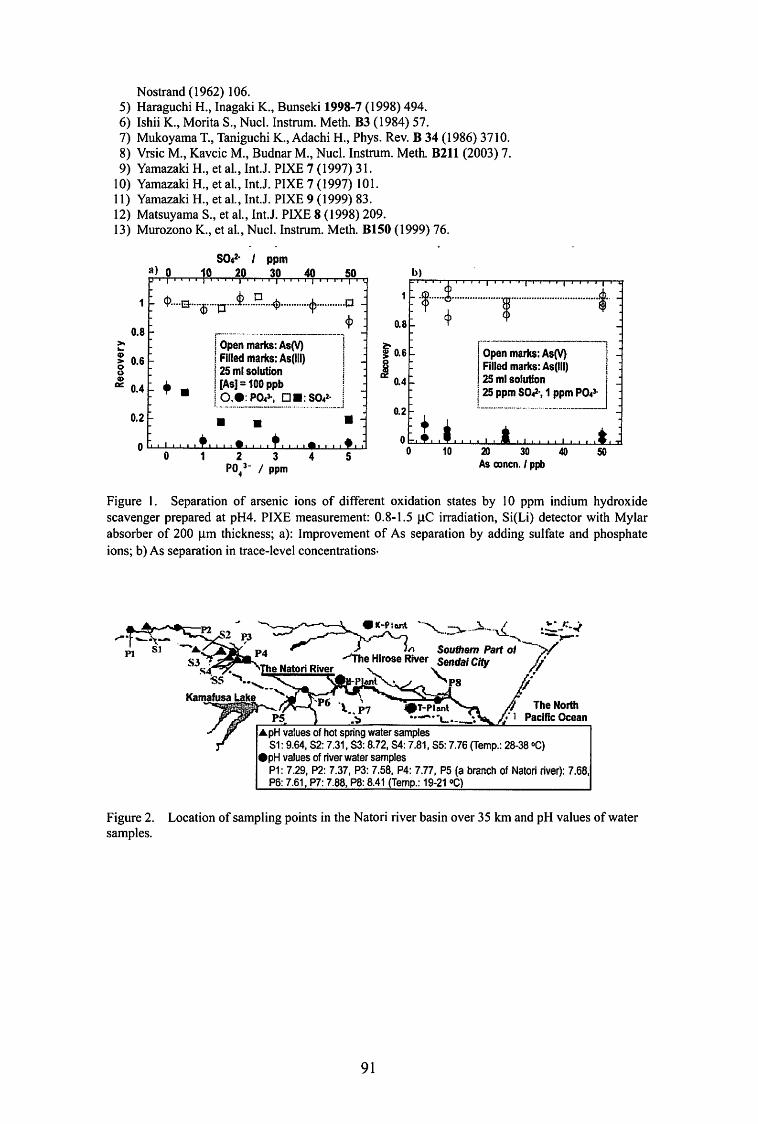
Nostrand (1962) 106. 5) Haraguchi H., Inagaki K., Bunseki 1998-7 ( 1998) 494. 6) Ishii K., Morita S., Nucl. Instrum. Meth. B3 (1984) 57. 7) Mukoyama T., Taniguchi K., Adachi H., Phys. Rev. B 34 ( 1986) 3 710. 8) Vrsic M., Kavcic M., Budnar M., Nucl. Instrum. Meth. B211(2003)7. 9) Yamazaki H., et al., Int.J. P医E7 (1997)31. 10) Yamazaki H., et al., Int.J. PIXE 7 (1997) IO I. 11) Yamazaki H., et al., Int.J. PIXE 9 (1999) 83. 12) Matsuyama S., et al., Int.J. PIXE 8 (1998) 209. 13) Murozono K., et al., Nucl. Instrum. Meth. B150 (1999) 76.
a) 0 S042・ lppm
10 20 30 40
0.8
や“・・・8'・・・・る”..口”..金”...旦.ゆH・H・・・・・φ…・・…ロ
中
。oa
且司
AU
晶
u
hm』@〉。。@巨 争.
i Open marks: As(V) I l Fiiied ma巾s:As(lll) ! I 25 ml solution j I [A吋=100ppb lo.・:PO.cl-,ロ・:SO.c2・ I 園 田 園0.2
。。 2 3 4 PO/-I ppm
50 ‘ .. ,
臥M
l~ ...... ~ ..... ・・・・l・・・ ・・・・・$・
;……1 Filled marks: As(lll) I 25ml s。lutlon i 竺ppmSO.c2・, 1 ppm PO.c川
宮ω
! 0.4
0.2
5 10 却 30 40 As c:oncn. / p肉
卸
Figure l. Separation of arsenic ions of different oxidation states by I 0 ppm indium hydroxide scavenger prepared at pH4. PIXE measurement: 0.8・1.5μC irradiation, Si(Li) detector with Mylar absorber of 200 μm thickness; a): Improvement of As separation by adding sulfate and phosphate
ions; b) As separation in trace-level concentrations-
Figure 2. Location of sampling points in the Natori river basin over 35 km and pH values of water samples.
91
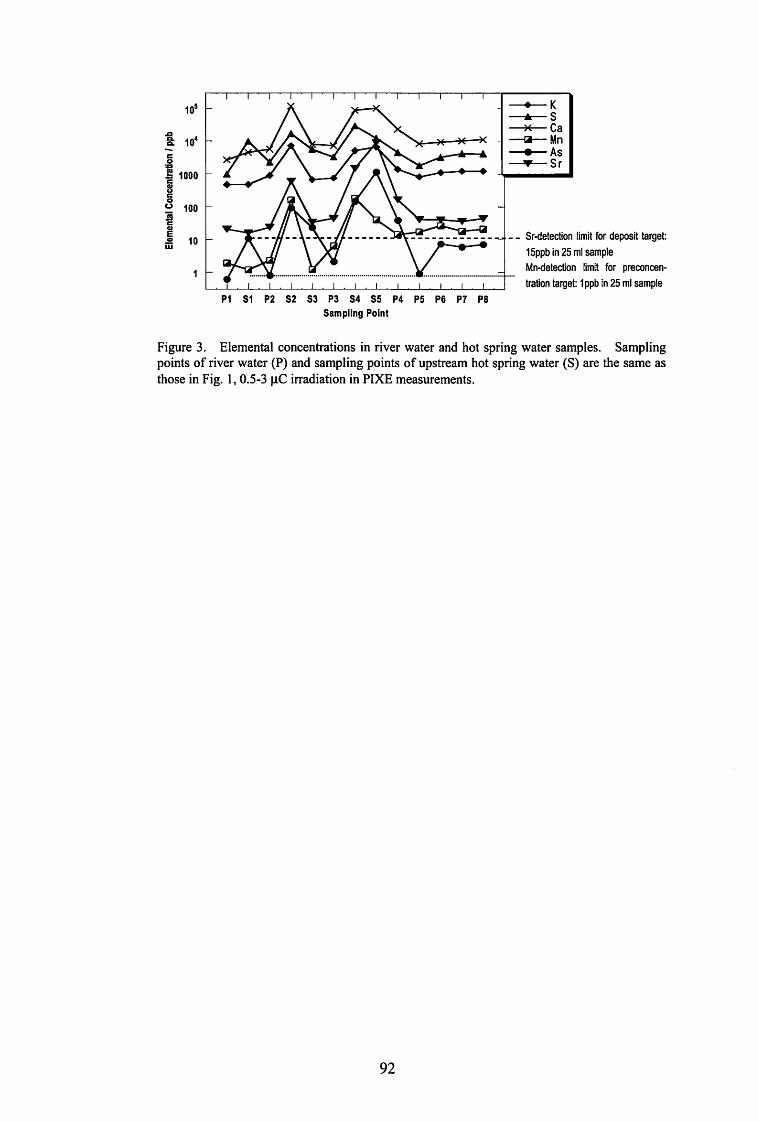
.ca 8: 104
a
u
a
U
A
u
nu
白
u
a
E
a
H
W
4
E
4
・
z。沼田
gzgzou
-azωE曲面
105 一一・-K一一企一一S-→←-Ca -→丑-Mn
-・-As___.,..._Sr
ーーーーーーーーーーーー園時--Sr・detectionlimit for deposit凶rget:
15ppb in 25 ml sample
Mn-detection limit for p悶concen-
tration target: 1 ppb in 25 mt sample
92
Fi忠ire3. Elemental concentrations in river water and hot spring water samples. Sampling points of river water (P) and sampling points of upstream hot spring water (S) are the same as
those in Fig. 1, 0.5・3μC irradiation in PIXE measurements.
P1 81 P2 82 83 P3 84 SS P4 PS P6 P7 PB
Sampling Point
CYRJC Annual Report 2005
V. 6. Transfer Factors of Technetium-99 for Various Plants in Forests
Tagami K. 1, Uchida S. 1, and Sekine戸.
1 Environmental an~ Toxicological Sciences Research Group, National Institute of Radiological Sciences .!Center for the Advancement of High Education, Tohoku University
Introduction
Technetium belongs to the Mn group and it has no stable isotopes. Among its
radioactive isotopes, 99Tc is of potential long-term importance in the environment, because
99Tc is a pure beta emitter (Emax=0.29 keV) and its half-life is 2.11 x 10⁵ y. It is produced
in the fissions of 235U and 239Pu at relatively high ratios of ca. 6%, which is similar to the
values for 137 Cs and 90Sr. Technetium-99 is widely distributed in the environment as a
result of fallout from nuclear weapons testing and discharges from nuclear facilities. The
quantity of 99Tc produced by atmospheric nuclear weapon explosions was estimated to be
140 TBq using an equal fission yield to that of 137 Cs and actual 137 Cs deposition data 1 >.
The release of 99Tc by nuclear industries through 1986, as estimated by Luykx2>, was of the
order of 1000 TBq. This was mainly from nuclear fuel reprocessing and most of the 99Tc
was discharged into the sea and 99Tc concentration in the terrestrial environment is very
low3>. The amount introduced via nuclear medical use of 99mTc (half-life: 6.01 h) is
negligible. For example, the amounts from 99Mo-99mTc generators and 99mTc used during
2004 in Japan were 173 TBq and 325 TBq, respectively4>, which corresponds to ca. 1.6
MBq of 99Tc generation in total.
Due to very low concentration and analytical difficulties for determination of弥 fcin
environmental samples, there is a general lack of data on the levels in the literature.
Therefore, the behavior of 99Tc in the terrestrial environment is not well understood.
However, it is necessary to obtain transfer parameters under natural conditions for a
realistic long-term radiological assessment such as soil-to・planttransfer factors (TFs,
concentration in plant/concentration in soil). Thus, we focused on the Chernobyl site
where 99Tc concentration levels have already been shown to be higher than those企om
global fallout Tc5>. The concentrations of 99Tc in plant leaves collected in three forests
93
near the Chernobyl site were determined. The samples were leaves of raspberry,
strawberry and pink plants, black alder, birch, cowberry and oak trees, and fems. Since
TFs are usually high in leaちFvegetables and grass as reported in Reference 6, leaves of
raspberry, strawberry and pink plants are of the most interest in this study for comparison
pu中oses.
Experimental
A Tc-selective chromatographic resin (Eichrom Industries Inc., TEVA resin) was
used for Tc purification. Deionized water (> 17 .6 Mil) was used throughout the work.
Technetium-95m, which was obtained合oman Nb foil using the reaction 93Nb (a, 2n) 95mTc,
was applied to determine the recovery of99Tc in the samples during the chemical separation
procedure. The 95mTc was 1 made at Cycrotron and Radioisotope Center, Tohoku
University6>. A standard 99Tc solution available合omAmersham (Solution TCZ.44) was
used for calibrating the ICP-MS.
Leaves of 27 plant samples were collected at the Chernobyl site in 1994 and 1995
by the Federal Office for Radiation Protection, Germany, assisted by Moscow State
University, Russia, and the Research and Industrial Association ’Pripyat', Ukraine. The
sampling was carried out in three forests, D 1, D3 and K.2, around the Chernobyl Nuclear
Power Plant. Forests Dl and D3 were 28.5 km and 26 km to the south of the reactor,
respectively, while forest K2 was 6 km to the southeast. Soil samples were also collected at
the same sampling sites and the details were reported previously5>.
A simple wet digestion method in combination with an TEVA resin separation
method was applied for 99Tc. After incineration of the soil samples at 450。C,a certain
amount of 95mTc was added and they were mixed uniformly. Then, Tc was extracted with
4M HN03 while heating the samples at 100。Cin a glass beaker covered with a watch glass.
The residue was removed by filtration and the solution was diluted to obtain the acidity of
ca. O.lM HN03 and passed through a TEVA resin column to puriちrand concentrate Tc
isotopes. Technetium adsorbed on the resin was eluted with 5 mL of 8 M HN03 solution.
The volume of the 99Tc企actionfrom the TEVA column solution was reduced to near
dryness (<70℃) and then dissolved in 5mL of 2% HN03 solution. Radiochemical
recoveries of Tc plant samples were monitored with 95mTc activities. Then the solution
was introduced into an ICP-MS (Yokogawa, PMS-2000).
94
Results and Discussion
Total chemical recoveries throughout the method with 95mTc ranged企om0.48 to
0.92 with an average of 0.76. No relation was found between sample amount and recovery.
Three replicates of samples K2・94F-land D3-94G・lwere used in amounts of 1・2.6g and
1.8 -10.2 g, respectively, and there were no di妊erencesbetween their recoveries.
However, the recoveries of two sub-samples of K2・940・2and D 1-940-1 differed by about
0.1 and Oムrespectively;when sample amounts increased, the recoveries decreased.
Possibly, plant matrices, such as K, Ca and Cl, would affect the 99Tc recovery, especially at
the TEVA resin separation steps.
Technetium-99 concentrations in all samples are listed in Table 1 and they ranged
合omく0.006to 6.0 mBq g・1.For 11 samples, especially in the tree group, it was hard to
determine 99Tc, because of its low concentration.
TF is defined as the ratio of activity concentration in plant (in Bq g-1 dry weight
(DW)) to activity concentration in soil (in Bq g-1 DW). It has been noted that forest under
story plants are expected to take up radionuclides mainly from organic layers and therefore,
concentration of 99Tc in organic soil would be important for estimation of its uptake. Thus,
TFs were calculated in terms of activity concentration in a plant relative to activity
concentration in organic soil. Table 1 also shows the TFs of Tc for all the samples. They
ranged from <0.016 to 0.28 for Fem, 0.009 to 0.47 for Herb and <0.006 to 0.05 for Tree
groups based on the 99Tc contents of the organic layers. The highest TF was found in the
leaves of raspberry. The observed-TFs were lower than the IAEA-compiled values of 8.1
’2600 for leaちrvegetables, fodder and grass7>; other reported values are as listed in Table 2.
Comparing the TF for Tc reported for various plants grown in soil, the present results were
almost the same as the data observed in reclaimed land 10>, although the data from pot
experiments11> were much higher.
From these results, we concluded Tc bioavailability in the natural environment
would be lower than the bioavailabilities obtained from laboratory studies that used Tc04-
to obtain Tc TFs. It is known that the most plant-available form of Tc is Tc04-, and other
forms have less availability to plants. Thus, Tc04-was not the only Tc chemical from in
these forests. Possibly most Tc was in less soluble form, such as organically bound forms,
sesquioxide bound and lower oxidation forms12>.
Concerning the Herb group, the TFs were 0.17・0.47at K.2, 0.20-0.32 at Dl and
0.009・0.086at D3. The TFs for the samples collected at 03 were lower than those at Dl
and K.2. This might be due to the fact that 03 was a so-called wet forest and reducing
95
conditions might possibly exist. The bioavailable Tc was presumably influenced by the
soil redox conditions: Tc would be transformed合omto a lower oxidation and less available
form under a relatively low redox condition. Due to the relatively low redox conditions of
the D3 site, the TFs were lower than those in K2 and DI sites.
Thus, the low TFs we observed in this study implied出at8・9years after 99Tc release
企omthe Chernobyl Nuclear Power Plant, Tc should have been transformed to insoluble or
less plant-available forms. Technetium would not be in readily available form to plants in
the natural environment.
References
I) Aarkrog A., Dahlgaard H., Hallstadius L., Holm E., Mattson S., Rioseco J., Technetium in the Environment (Desmet G.加 dM戸tenaereC. eds.), Elsevier Appl. Sci. Pub., London (1986) 69.
2) Luykx F., Technetium in the Environment (Desmet G. and M戸tenae問 C.eds.), Elsevier Appl. Sci. Pub., London ( 1986) 21.
3) Tagami K., Uchida S., J. Nucl. Radiochem. Sci. 3 (2002) 1. 4) Japan Isotope Association, Statistics on the Use of Radiation in Japan (2005) 38. 5) Uchida S., Tagami K., Wi巾 E.,Rilhm W., Chemosphe問 39(1999) 2757. 6) Sekine T., Konishi M., Kudo H., Tagami K., Uchida S., J. Radioanal. Nucl. Chem. 239 (1999) 483. 7) IAEA, Handbook of Parameter Values for the Prediction of Radionuclide Transfer in Temperate
Environments, Technical Reports Series No. 364. IAEA, Vienna, (1994) 14. 8) Vandecasteele C.M., Dehut J.P., Van Laer S., Deprins D., M戸tenae問 C.,Health Phys. 57 ( 1989)
247. 9) Ho釘manF.O., Garten C.T., Jr., Lucas D.M., Huckabee J.W., Environ. Sci. Technol. 16 (1982) 214. 10) Green N., Wilkins B.T., Davidson M.F., Hammond D.J., J. Environ. Radioactiv. 27 (1995) 35. 11) Echevarria G., Morel J.L., Florentin L., Lecler・c-Cessac,E. J. Environ. Radioact. 70 (2003) 85. 12) Tagami K., Uchida S., Toxicol. Environ. Chem. 56 (1996) 235.
96
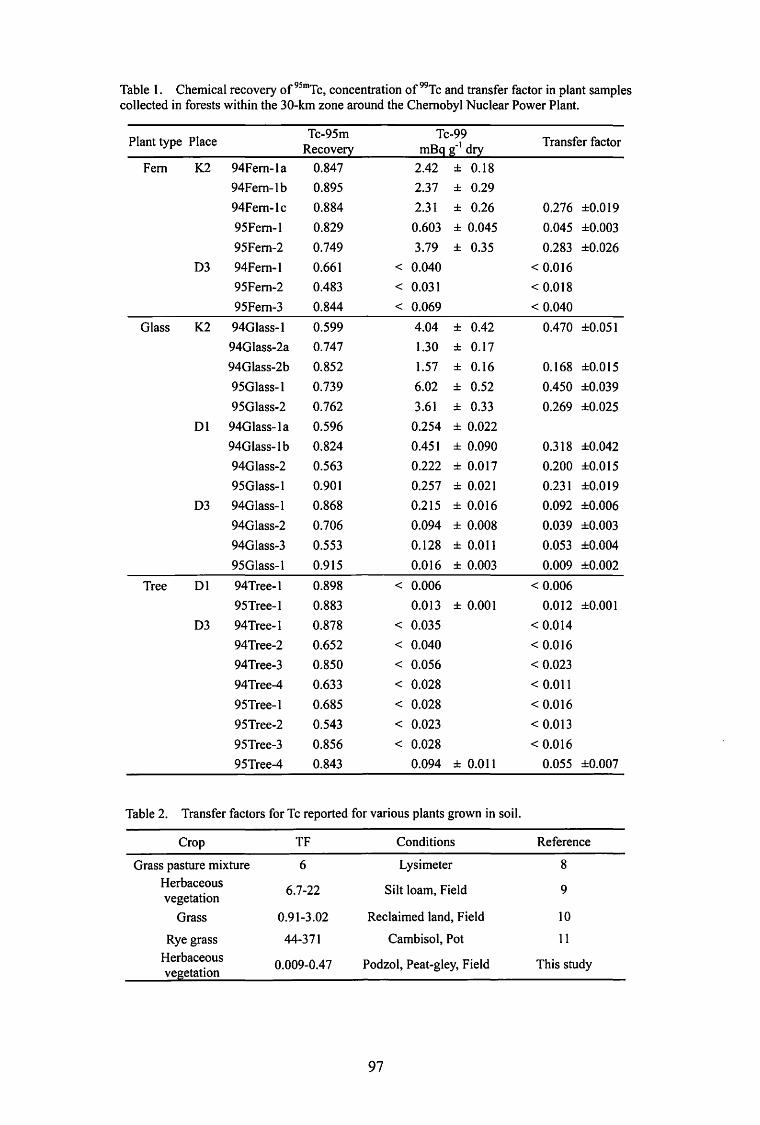
Table 1. Chemical recovery of95mTc, concentration of99Tc and transfer factor in plant samples
collected in forests within the 30・kmzone around the Chernobyl Nuclear Power Plant.
Plant type Place Tc・95m Tc・99
Transfer factor Recove立 mBg~1 d立
Fem K2 94Fem-la 0.847 2.42 土 0.18
94Fem-lb 0.895 2.37 土 0.29
94Fem・le 0.884 2.31 士 0.26 0.276士0.019
95Fem・1 0.829 0.603 士 0.045 0.045 土0.003
95Fem-2 0.749 3.79 土 0.35 0.283 土0.026
D3 94Fem・1 0.661 く 0.040 く 0.016
95Fem・2 0.483 く 0.031 く O.ot8
95Fem-3 0.844 く 0.069 く 0.040
Glass K2 94Glass-l 0.599 4.04 士 0.42 0.470士0.051
94Glass-2a 0.747 1.30 土 0.17
94Glass-2b 0.852 1.57 土 0.16 0.168 土0.015
95Glass-1 0.739 6.02 土 0.52 0.450土0.039
95Glass-2 0.762 3.61 土 0.33 0.269士0.025
D1 94Glass-la 0.596 0.254 土 0.022
94Glass-lb 0.824 0.451 土 0.090 0.318 土0.042
94Glass-2 0.563 0.222 士 0.017 0.200 土O.ot5
95Glass-l 0.901 0.257 土 0.021 0.231 土O.ot9
D3 94Glass-1 0.868 0.215 土 0.016 0.092 土0.006
94Glass-2 0.706 0.094 士 0.008 0.039土0.003
94Glass-3 0.553 0.128 土 0.011 0.053 土0.004
95Glass-1 0.915 0.016 土 0.003 0.009士0.002
Tree D1 94Tree-1 0.898 < 0.006 く 0.006
95Tree-l 0.883 0.013 士 0.001 0.012土0.001
D3 94Tree-1 0.878 く 0.035 < 0.014
94Tree-2 0.652 く 0.040 く 0.016
94Tree-3 0.850 く 0.056 く 0.023
94Tree-4 0.633 く 0.028 く 0.011
95Tree-1 0.685 く 0.028 < 0.016
95Tree-2 0.543 く 0.023 く 0.013
95Tree-3 0.856 く 0.028 く 0.016
95Tree-4 0.843 0.094 土 0.011 0.055 土0.007
Table 2. Transfer factors for Tc reported for various plants grown in soil.
Crop TF Conditions Reference
Grass pasture mixture 6 Lysimeter 8
Herbaceous 6.7-22 Silt loam, Field 9
vegetation
Grass 0.91-3.02 Reclaimed land, Field 10
Rye grass 44-371 Cambisol, Pot 11
Herbaceous 0.009-0.47 Podzol, Peat-gley, Field This study
堂監盟!on
97

VI. RADIOCHE民1ISRTYAND NUCLEAR CHE民1ISTRY
CYRIC Annual Report 2005
VI. 1. Investigation of Excitation Function for 238U (12C,4・6n)244-246Cf
Takamiya K. 2, Kasamatsu Y. 3, Ohtsuki T.1, Yuki H.1, Takabe T. 3, Nakashima K. 3,
Hasegawa HぺShinoharaA. 3, Shibata S. 2, Mitsugashira T. 4, Sato N三SuzukiT三Miyashita Y.5, Shil吹 ukaT. 5, Kikunaga H.ペandNakanishi T.6
1 Laboratory of Nuclear Science, Tohoku Universiη 2Research Reactor Institute, Kyoto肋 iversi砂_,Department of Chemistry, Osaka U11iversiη
4/nstitute of Materials Research, Tohoku Universi砂5Cyclotron Radioisotope Center, Tohoku University 6 Department of Chemistry, Kanazawa Unive rsiか
The investigation for the excitation function of 238U{12C,xn) reaction has been
ca凶edout by on-line and o妊:.line measurement system. An Heてjettransport and a
rotating-wheel measurement system was used for on-line experiments, and off-line
experiments were carried out by radiochemical method. Furthermore, a simple and unique
method of target preparation using a membrane filter of an Ah03 disk (25 μm/cm2 in
thickness) that can be use白lwith precipitation after filtering the target material 1 > was
applied in these experiments. The 238U deposited on prepared Ah03 disk was irradiated
with 12C ions and the isotopes of Cf were produced with 238U(12C,4-6n) reactions. The
obtained excitation functions of 244・246Cfwere compared with those obtained by other
previous results.
The irradiation experiments were carried out using the 930・AVFcyclotron in the
CYRIC. In order to measure isotopes which has various half-lives efficiently, two kinds of
experiments, o百:.lineand on-line experiments, were carried out. In the o妊:.line experiments,
uranium hydroxide collected on the membrane filter of an Ab03 was used as the targets
(300 μg/cm2 in thickness). The target was mounted in an aluminum holder and placed in
the reaction chamber on the end of a beam line as the sample side白ceto the upstream of
ion beam. The energetic 12C ions accelerated by the accelerator was irradiated to the target
through a few aluminum degraders. The reaction products lost their kinetic energies in the
target of filter and remained there. The irradiation time was varied from 20・40min
99
according as the half-life of dominant isotope of Cf at the irradiation energy. The beam
cuπ・ent was typically 150 particle-nA. After the irradiation, the target was dissolved in
hydrochloric acid, and 252Cf and Fe3+ ions were added as carrier materials. Sodium
hydroxide solution was added to produce a precipitate. After repeating these procedures,
the precipitate was dissolved in hydrochloric acid of 9 mol/L and poured into the anion
exchange column (DOWEX 1X8, 200・400mesh). Hydrochloric acid of 9 moνL was
injected to the column to elute the isotopes of Cf. Samarium was added to the eluent as a
carrier material, and after that, ammonia water was added to precipitate as hydroxides of Cf
and Sm. The precipitate was filtered and dried to prepare the measurement source for
α-particle spectroscopy using SSBD.
In the on-line experiments, the same precipitation targets (200 μg/cm2 in thickness)
or electrodeposited targets was used for the irradiation. The target was mounted in an
aluminum holder and placed in the He-gas jet reaction chamber on the end of a beam course.
The reaction chamber was connected to the He-gas (containing KCI clusters) jet transport
system. He-gas (flow rate, 2 L/min) was applied through a KCI・clustergenerator at 640°C.
Reaction products were recoiled out from the targets by nuclear reactions, and kinetic
energies were reduced in He-gas containing KCl clusters. The products adsorbed on the
cluster were then transported with He-gas through a capillary tube to an automated
rotating-wheel chamber placed in the room next door. Six α-particle detectors equipped
with PIN-photodiode were installed in the rotating-wheel chamber to measure the
α-particles emitted from the transported nuclides. The products transported by He-gas
were blown onto polyethylene terephthalate films. The beam current was typically 150
particle-nA, that is almost the same as o任'..lineexperiments. Accumulation of the products
on rotating-wheel and measurements of the α-particles of Cf isotopes was repeated at 10 -
20 min intervals according as the half-live of dominant isotope of Cf.
The α-particle spec甘aof 245Cf and 244CF, produced by 238U(12C, 5n) and 238U(12C,
6n) reactions, respectively, are shown in Fig. 1. The spectra illustrated in the upper and
lower panels in this figure were obtained by o任'..lineand on-line experiments, respectively,
at the irradiation energy of 83 Me V. It was found that the energy resolution of the
spectrum obtained by o住lineexperiment is better than that by on-line experiment. In the
upper panel, the peak at 7 .22 Me V of 244Cf and that at 7 .15 Me V of 245Cf are clearly
identified. On the other side, the spectrum obtained in the on-line experiments could be
separated to several components by calculation with a computer; however, short-lived
isotope of 244Cf could be measured with enough statistics. Finally, we have obtained the
100

cross section of the 238U( 12C,4・6n)reactions in several irradiation energies on target. The
excitation functions of 238U(12C,4-6n)244・246Cfare shown in Fig. 2 with those reported by
Sikkeland et a1.2> as a function oflaboratory energy system. In this figure, open and closed
symbols show the results by the present work and by Sikkeland, respectively. We found
that the cross sections for the 238U{12C,4・6n)were estimated to be one order of magnitude
lower than those reported.
In order to examine the discrepancy between the results by our work and Sikkeland
et al., the maximum cross sections for 5n reaction of 238U and 244Pu as a function of the
proton number of the compound nuclei are shown in Fig. 3. There seems that the cross
section values of the previous reports3-6> decreases as the proton number increases in the
both case of the targets of 238U and 244Pu. It was found that our present result is consistent
with the systematics although the result by Sikkeland is inconsistent.
References
1) Takamiya K., et al., to be published. 2) Sikkeland T., Maly J., Lebeck D., Phys. Rev. 169 (1968) I 000. 3) Andreyev A.N., et al., JINR Rep. E・7・93-57,Dubna (1993) 44. 4) Nishio K., et al., Phys. Rev. Lett. 93 (2004) 162701. 5) Lazarev Yu. A., et al., Phys. Rev. Lett. 75 (1995) 1903. 6) Lazarev Yu. A., et. al., Phys. Rev. C62 (2000) 064307.
60
40
~ § 70 。υ60
so
40
30
20
10
0 6.9
\、
244Cf(7.22 MeV)
7 7.1 7.2 7.3
Eα (MeV)
7.4
Figure 1. The α-particle spectra of245Cf and 244CF produced by 238U(12C, 5n) and 238U(12C, 6n) reactions, respectively. The upper and lower panels show the spectrum for o百二lineand on-line experiments, respectively.
101
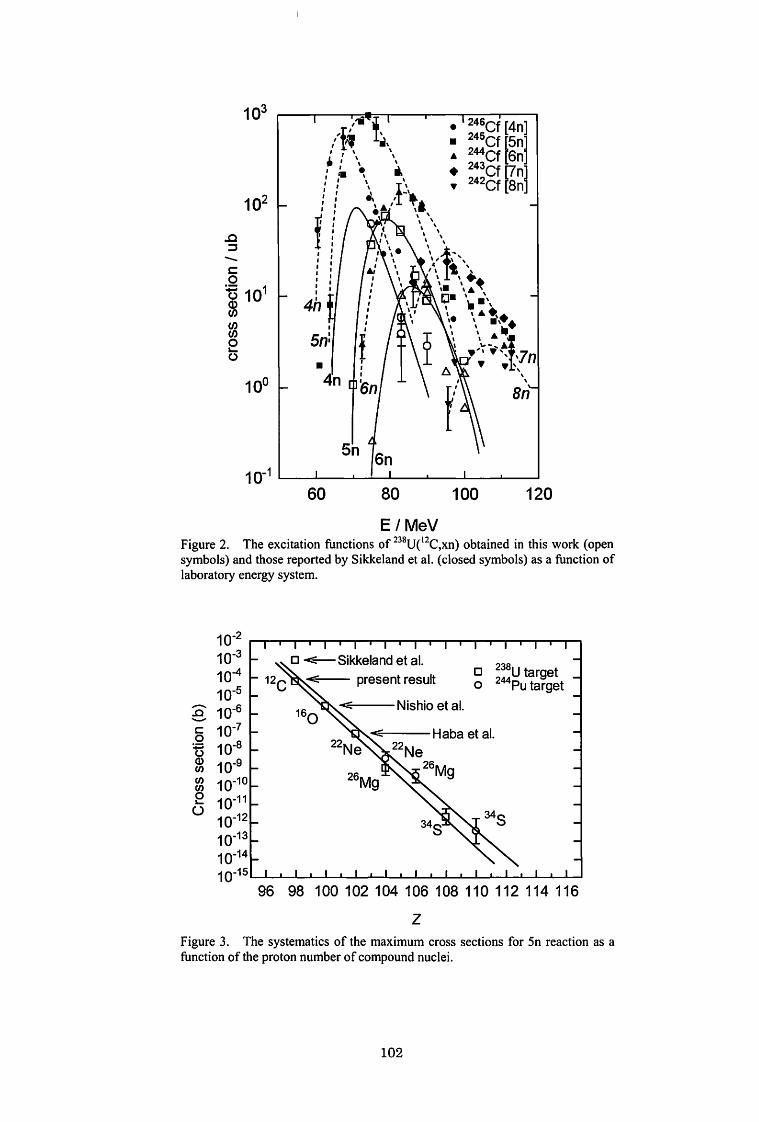
~~~Cf [4n] チ勾Cfr5nl 4刊ctrsn1
;:;g~ fa~1
--aav
’
103
102
10°
..c コc: 0
~ 101
~ 。。
10・1120
E/MeV Figure 2. The excitation functions of 238U{12C,xn) obtained in this work (open symbols) and those reported by Sikkeland et al. (closed symbols) as a function of laboratory energy system.
100 80 60
認しj同 etPu target
ロ0
ロモーSikkelandet al.
~一一ー present result
く Habaet al. 22Nよぐ』22Ne
2sMg
10・210-3 10-4 10・5
10・6
10・7
10・810-9 10・10
10・11
10・12
10・1310・1410・15
96
(
D)
co一ぢωωωωO』O
98 100 102 104 106 108 110 112 114 116
Figure 3. The systematics of the maximum cross sections for 5n reaction as a function of the proton number of compound nuclei.
102
z
CYRIC Annual Report 2005
VI. 2. Measurement of the Cross Section of the 40 Ar(α,2p)42Ar Reaction
Yuki H. 1, Satoh N. 2, Ohtsuki T.1, Shinozuka T. 2, Baba M. 2, ldo T. 2, and Morinaga H. 3
Introduction
1 Laboratory of Nuclear Science, Tohoku University 2Cyclotron and Radioisotope Center,τbhoku University
3τechnische Universitat Munchen
Radiation sources are great important not only for research in basic science, material
science, medical and radiopharmaceutical use but also for education in those area, and even
in that in high school.
A 42 Ar-42K generator was firstly proposed by Morinaga, who produced 42 Ar by the
40 Ar(t, p)42 Ar reaction using tritium accelerator. The half-lives of each nuclide, 42 Ar
(p訂ent)and 42K (daughter),紅e33 ye紅sand 12 hours, respectively, and they are in
correlation of a secular equilibrium as shown in Fig. 1. Therefore, one can use for long
time as a 42K generator if a sufficient amount of 42 Ar is produced.
However, no tritium accelerator is available nowadays. Therefore, 40Ar(α,2p)42Ar
reaction should be used to produce the 42 Ar-42K generator even though the reaction cross
section might be smaller than that of the 40 Ar(t, p )42 Ar reaction. No evaluated data for the
cross section of the 40 Ar(α,2p )42 Ar reaction measured experimentally have been reported so
far. In order to investigate its availability and the effective production of 42 Ar, we have
measured the excitation function of 40 Ar(α,2p)42 Ar reaction1・3)_
Experimental
Since the experimental details have been described in ref.3), here we briefly show the
experimental procedure. The stacked gas cell targets have been irradiated and the
excitation functions has been measured by means of and a y-ray spectroscopy without
chemical separation. Irradiations were carried out five times by changing the beam
energies of Eα=40, 50, 60, 70 and 80 Me V.
The target cells of quartz glass 30 mm long and 30 mm inside diameter with 0.05
103
mm windows of polyirnide foils (Kapton, Goodfellow Metals, England) were used to the
irradiation. The cells were filled with natural argon gas by 1 atm. Thereafter four cells
were set in a cylindrical cell holder at the beam course of CYRIC for the irradiation with the
α-particles. The irradiated time was set in 7-9 hours by 500 nA. After the irradiation, the
y-rays emanating from 42K were measured with a Ge detector coupled with multi-channel
analyzer. Since the 42Ar is 100 % Wdecay nuclide, the amount of 42Ar can be deduced by an
amount of 42K by 1524 keV y ... ray, which is under correlation with a secular equilibrium.
However, the 42K was also produced simultaneously by the 40 Ar(α,pn)42K reaction, An
amount of 42K produced by the decay of 42 Ar was deduced after the decay out of 42K
produced by the 40 Ar(α,pn)42K reaction.
Results and Discussion
The cross sections of 40 Ar(α,2p )42 Ar and 40 Ar(α,pn)42K reactions obtained in the
present work are shown in Fig.2. The energies ofα-particles at midpoints of each target
cell were determined by the calculation of energy degradation in Ar gas, air, Harvar,
polyirnide and Cu foils using TRIM code4>. Horizontal e町orin each energy scale were
calculated by the energy degradation and the straggling ofα-p紅ticlesin Ar gas in each
target cell, and which were almost inside each symbols in Fig. 2. Vertical e町orof the
cross sections dominates the statistical e町orsand the uncertainty of the efficiency of Ge
detector.
The cross section of 40 Ar(α,pn)42K reaction has been presented by Tanaka et al. 5> so
far, and it was also shown in Fig.2. It should be noticed that our result is fair agreement
with that obtained by Tanaka et al. The calculated cross sections by using ALICE code6>
are also given in Fig.2. From the figure, it seems that the calculated values for the cross
section of the 40 Ar(α,2p )42 Ar with ALICE code can be overestimated in 30 Me V < E.α< 60
Me V and that for the 40 Ar(α,pn)42K reaction can also be underestimated in Eα>40MeV.
References
1) Nozomi N., et al., CYRIC Annual Report (2003) 127. 2) Yuki H., et al., CYRIC Annual Report (2003) 130. 3) Yuki H., et al., CYRIC Annual Report (2004) 109. 4) Ziegler J.F., Biersack J.P., Littmark U., The stopping and range of ions in solids, Pergamon, New
York (1984). 5) Tanaka S., Furukawa M., Mikumo T., Iwata S., Yagi M., Amano H., J. Phys. Soc. Jpn. 15 (1960)
952. 6) Blann M., Vonach K.H., Phys. Rev. C 28 (1983) 1475.
104
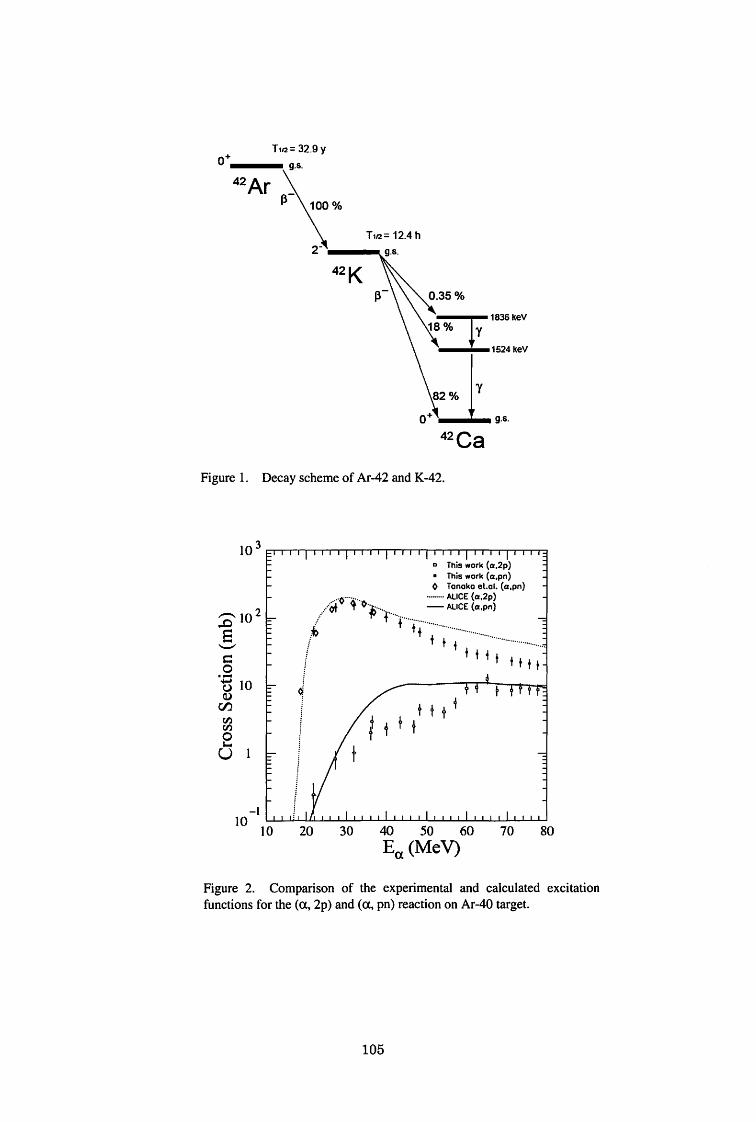
42K
Decay scheme of Ar-42 and k・42.Figure 1.
10 3
/ ....
品 T +・ .I.
・4十 4
ttit t+t十
。
Lム........ 』
20
ロ Thiswork {α,2p) • This work {α,pn) 。Tonokoet.cl. (a,pn}
……ALICE {a,2p} 一-ALICE {a,pn)
-且固官・AVE
Avt
Avt -且@
EE
’ムWE
・-AVE-
-vliv--
’E,EE
~102 呂、.〆ロ。ち10(I)
∞ ω 的。』
υ
80 70 40 50 60
Ea (MeV) 30 10
10
Figure 2. Comparison of the experimental and calculated excitation
functions for the (α,2p) and (α,pn) reaction on Ar-40 target.
105

VII. RADIOPHARMACEUTICAL CHE恥'.IISTRYAND BIOLOGY
CYRIC Annual Report 2005
VII. 1. Development of a Miniature Module for On-column Preparation of [11C]Methionine from [11C]Metyl Triflate
Watanabe T.1, Ishikawa Y.2, lshiwata K.3, Sato T.1, and Iwata R.2
1 Sumitomo Heavy Industries, Ltd.
2Cyclotron and Radioisotope CenteれTohokuUniversiか.JToかoMetropolitan Institute of Gerontology
L-[S-methyl-11C]Methionine ([ 11C]MET) is one of the most widely used amino
acids for PET oncology. Due to its short half-life repeated prep紅 ationsof [11C]MET two
or three times a day are often needed for routine PET practice. Therefore, a simple
synthesis method without HPLC purification or evaporation is desirable for routine
preparations. Pascali et al. developed a simple synthesis method using on-column labeling
on a disposable solid phase extraction column1>. However, this method requires the use of
EtOH in the precursor solution for efficient trap of flowing [ 11C]CH3I and consequently, the
removal of EtOH from a product solution with a rotary evaporator is an inevitable
procedure in Japan according to the regulations. Nagren et al. reported on the method for
synthesizing [11C]MET in an aqueous solution using [11C]CH30Tr2). We combined the
above two methods and realized a simple automated method on a miniature module for
routine preparation of [ 11C]MET.
[11C]CH3I or [11C]CH30Tf was prepared by the gas phase method. Each labeled
precursor was directed to a tC18 Sep-Pak Plus cartridge, which had been loaded with 0.2
mL of a solution of L-homocysteine thiolactone HCI (6 mg dissolved in 1 mL of 0.1 M
NaOH) followed by purging the tubing and the tC18 Sep-Pak Plus cartridge with He and
the radioactive fraction breaking through was trapped in charcoal. The trapping efficiency
by the tC18 was evaluated. The [11C]MET produced on the tC18 cartridge was then eluted
with physiological saline (4 mL). The eluate was passed through a combined ion
exchange cartridges of Accell Plus QMA Light and CM for neutralization. The solution
was finally collected in a vented sterile vial through a 0.22 μm sterile membrane filter.
A miniature module for the above synthesis procedures is shown in Fig. 1. It
consisted of a synthesis block, where microsolenoid valves, Sep-Pak cartridges and vials
107
(15 mL) were assembled on a manifold block (D. 100 x W. 120 x H. 100 mm), a miniature
heater for a AgOTf column, a manifold 6・wayswitching valve and an interface/power
supply/relay box. Advantages of manifolds訂e:
• Reduction of equipment space requirements.
• Elimination of external connections between valves.
• Combination of valves ~d pumps and vessels into a single component.
Reduction of internal volumes between valves and由usloss of materials during
transfers.
The module was controlled using a Lab VIEW progr担nona PC血roughUSB.
[11C]CH30Tf was ・trapped in 98% efficiencies on a tC18 cartridge preloaded the
precursor solution, while [ 11C]CH3I was only住appedin 4%. As shown in Table 1, a
single use of cation exchange cartridge for simply removing Na+ resulted in the decrease in
radiochemical purity down to 84% from a nascent high radiochemical purity of >97%.
This was probably due to the decomposition of [ 11C]MET in a strong acidic condition in the
cartridge where the er brought by the homocysteine thiolactone locally decreased pH of
出epassing reaction solution when Na+ was removed by cation exchange. Thus, no
decrease
in radiochemical purity was observed when the er was first removed with anion exchange. The combination of Sep-Pak Accell Plus QMA Light (Off) and CM (H+) was found
to afford adequate radiochemical purity and pH for an in ection of [11C]MET. Table 2
summarizes the results obtained for the synthesis of [ 11C]methionine using the miniature
module.
In conclusion, [11C]MET was efficiently synthesized using [11C]CH30Tf on a tC18
cartridge preloaded with the aqueous solution of L・homocysteinethiolactone. The
reaction solution was neutr叫izedsimply by passing through QMA Light and CM cartridges
without decreasing radiochemical purity. The synthesis module for the radiosynthesis of
[11C]MET from [11C]CH30Tf was successfully miniaturized by assembling miniature
valves and Sep-Pak cartridges and vials on a small manifold block.
References
1) Pascali C. et al., J. Label. Compd. Radiopharm. 42 (1999) 715. 2) Nagren K. et al., J. Label. Compd. Radiopharm. 41 (1998) 831.
108
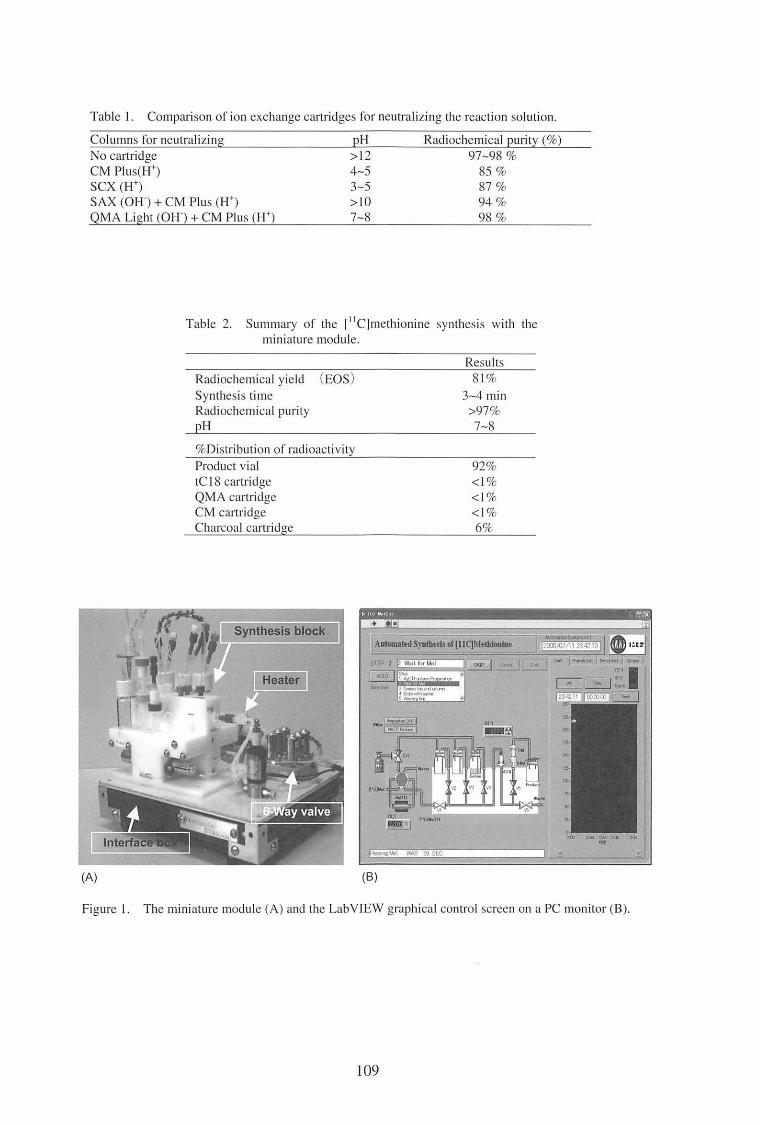
Table I. Compar on of ion巴xchang巴cartridg巴sfor neutralizing the r巴actionsolution.
Columns for neutralizing
No cartridge
CM Plus(H+)
sex CH+) SAX(OH・)+CM Plus (HワQMALi又ht(Off) +CM Plus (H+)
E!i >12 4~5 3『 5>10 7~8
Radiochemical purity(%)
97~98 %
85 %
87 % 94% 98 %
Table 2. Summary of the l 11C]methionine synthesis with the
miniature module.
)
CJ
O
Eμ ft、
d
w
d
e
u
--
L
V
J
P量
制
eM
cnc
mum
e
S
E
LH
引山
LH
C
巴
C
oh
o
d
nd[
aVJan口
R
S
RI
R巴suits
81%
3~4 min
>97% 7~8
%Distribution of radioactivity
Product vial
tC 18 cartridge QMA cartridge
CM C創 t.ridge
Charcoal ca1「tridg巴
92% く1%く1%くl%
6%
Synthesis block
(A) (B)
4・・Mu
唱地l下両I一面「SEC
Figur巴l Th巴miniaturemodule (A) and the Lab VIEW graphical control screen on a PC monitor (B).
109
ι - . 1・..
.- . .ー, t... -ー ・ー - . φ ・φ・1
.、
,'I••
、-
' てー•• ,‘ ’.ー,
, ・ -
・.
. 』..
-、・.、
- '、.・-
町' . '
・.
白 、
・ー
ム・---. . .・・ '
.
, J
. 、ー
守 ・

VIII. NUCLEAR九'.IEDICINE
CYRJC Annual Report 2005
VIII. 1. Functional Neuroimaging of Actual Car-driving
Jeong M. 1・4, Tashiro M. 1, Singh LN. 1, Yamaguchi K. 1, Miyake M.1, Watanuki S.1, Fukuda F.2, Takahashi T.3, and Itoh M.1
1 Cyclotron and Radioisotope CenteκTohoku University, 2/nstitute of Development, Aging and Cancer, Tohoku Unかersity
"Graduate School Program, Tohoku Gakuin University 4 Bio-housing Research Institute, Chonnam National University Medical School
Introduction
Car-driving is a combination of complex neural tasks such as attention, perception,
integration of visual and somatosensory inputs, generation of motor outputs and action
controls. All drivers might sometimes encounter potentially-dangerous si佃ationsinduced
by cognitive and psychomotor deficits due to aging and neurological disorders1>, alcohol
and other sedative drugs2>, and mobile phone use3>, etc. Therefore, elucidation of the brain
mechanism during car-driving is important. New findings regarding neural activities
during simulated car-driving have been demonstrated, using high resolution neuroimaging
techniques such as functional magnetic resonance imaging (fMRI)4-6> and positron emission
tomography (PET)7>. Several investigators detected brain activations in the occipital and
p紅白talregions bilaterally as neural substrates of simulated driving4・1>. However, until
now, no study on actual car-driving has been conducted. Therefore, our aim was to
elucidate brain activation during actual car-driving using PET and [ 18F]2・deoxy-2-fluoro・D・
glucose (FDG), that has a unique property of“metabolic trapping" where neuronal activity
during 30 to 60 min post-injection can be stored8・9>.
Methods
Thirty healthy male volunteers, all right-handed, aged 20 to 56 years old,
participated in the present study. All the subjects had held a driving license for at least 6
months. The study protocol was approved by Clinical Research and Ethics Committee of
Tohoku University Graduate School of Medicine. Each subject provided a written
informed consent for participation to the study after receiving sufficient explanation.
111
The subjects were divided into the following 3 groups: ( 1) the active driving group
(n=lO; mean age± S.D.: 35.8 ± 12.2 y.o.) who drove on an ordinary road; (2) the passive
driving group (n=lO; mean age: 34.8 ± 13.1 y.o.) who remained seated on a front passenger
seat during the driving experiment; and (3) the su句ectsbelonging to the control group
(n=lO; mean age: 32.7 ± 9.6 y.o.) who remained seated on a comfortable chair in a
laboratory building, looking outside of the windows. All subjects were kept in fasting
state for at least 5 hours before the study.
The subjects of the active driving group were問 questedto start driving a testing car,
with automatic transmission, shortly after intravenous injection of FDG. They were
requested to keep driving for 30 min at an approximate speed of 40 km/h along a quiet
driving route around Tohoku University Aoba-yama Campus. The active-driving subjects
were not informed of the details of the driving route in advance, and at each squ訂ethey
followed the directions of an ~nvestigator sitting on the rear seat. The passive-driving
subjects followed the same protocol except for the point that they were sitting on the front
passenger seat simply looking at the landscape ahead of the car throughout the driving
experiment. The control su対ectswere sitting on a soft chair similar to that of the testing
car for 30 min simply looking at the landscape outside and with their e紅 Sunplugged so that
they could he紅 normalconversation around them.
PET emission scan started 45 minutes after FDG injection using an SET-2400W
scanner (Shimadzu Inc., Kyoto, Japan), with spatial resolutions of 4.0, 4.0 and 4.5 mm at
full-width-half-maximum (FWf弘If)in radial, tangential and axial directions, respectively.
The subjects' heads were fixed gently to the head-holder with a plastic spacer inflated with
air to minimize the subjects’head movement. The mean radiological dose given to the
subjects was 40. 7 ± 7.4 MBq ( 1.1 ± 0.2 mCi). Three-dimensional emission scan was
performed for 5 min and post-i町ectiontransmission scan was performed for 8 min using a
68Gef8Ga external rotating line source for tissue attenuation correction. PET image data
were transferred to a supercomputer at the Synergy Center, Tohoku University, for
reconstruction into 128×128×63 matrices based on a filtered back-projection algorithm
using the Colsher Filter with 1 an 8 mm cut-off frequency1°>. Driving-related brain
activation was examined using Statistical Parametric Mapping (SPM) software package.
The peak voxel-based significance of statistics was set at p< 0.001 (Z > 3.18) without
corrections for multiple comp紅 isons.
112
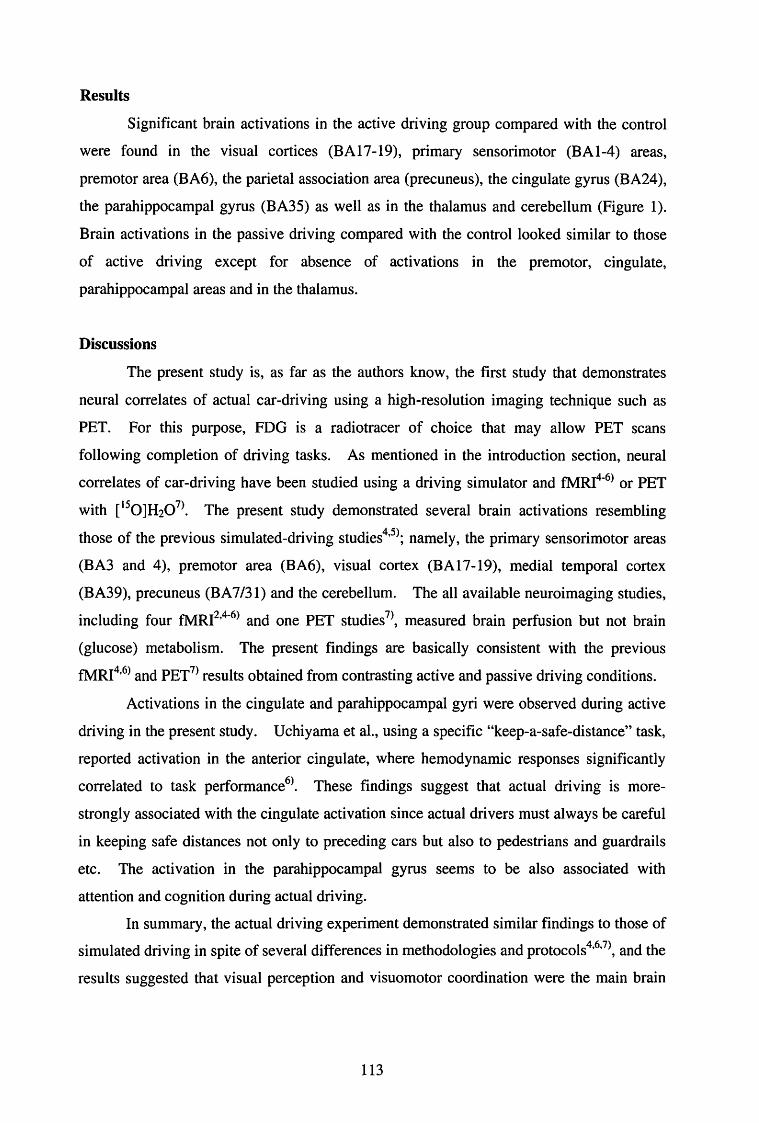
Resul~匂
Significant brain activations in the active driving group compared with the control
were found in the visual cortices (BAl 7・19),primary sensorimotor (BA 1-4)訂eas,
premotor area (BA6), the p訂ietalassociation area (precuneus ), the cingulate gyrus (BA24 ),
the parahippocampal gyrus (BA35) as well as in the thalamus and cerebellum (Figure 1).
Brain activations in the passive driving compared with the control looked similar to those
of active driving except for absence of activations in the premotor, cingulate,
P紅 ahippocampalareas and in the thalamus.
Discussions
The present study is, as far as the authors know, the first study that demonstrates
neural correlates of actual car-driving using a high-resolution imaging technique such as
PET. For this purpose, FDG is a radiotracer of choice that may allow PET scans
following completion of driving tasks. As mentioned in the introduction section, neural
correlates of car-driving have been studied using a driving simulator and fMRI4・6>or PET
with [150]H207>. The present study demonstrated several brain activations resembling
those of the previous simulated-driving studies4・5>; namely, the prim訂ysensorimotor areas
(BA3 and 4), premotor area (BA6), visual cortex (BA17・19),medial temporal cortex
(BA39), precuneus (BA 7 /31) and the cerebellum. The all available neuroimaging studies,
including four fMRI2.4・6>and one PET studies 7>, measured brain perfusion but not brain
(glucose) metabolism. The present findings are basically consistent with the previous
fMRI州 andPET7> results obtained from con佐astingactive and passive driving conditions.
Activations in the cingulate and parahippocampal gyri were observed during active
driving in the present study. Uchiyama et al., using a specific“keep-a-safe-distance”task,
reported activation in the anterior cingulate, where hemodynamic responses significantly
correlated to task performance6>. These findings suggest that actual driving is more-
strongly associated with the cingulate activation since actual drivers must always be careful
in keeping safe distances not only to preceding cars but also to pedestrians and guardrails
etc. The activation in the parahippocampal gyrus seems to be also associated with
attention and cognition during actual driving.
In summ紅 y,the actual driving experiment demonstrated similar findings to those of
simulated driving in spite of several differences in methodologies and protocols4ム1>,and the
results suggested that visual perception and visuomotor coordination were the main brain
113
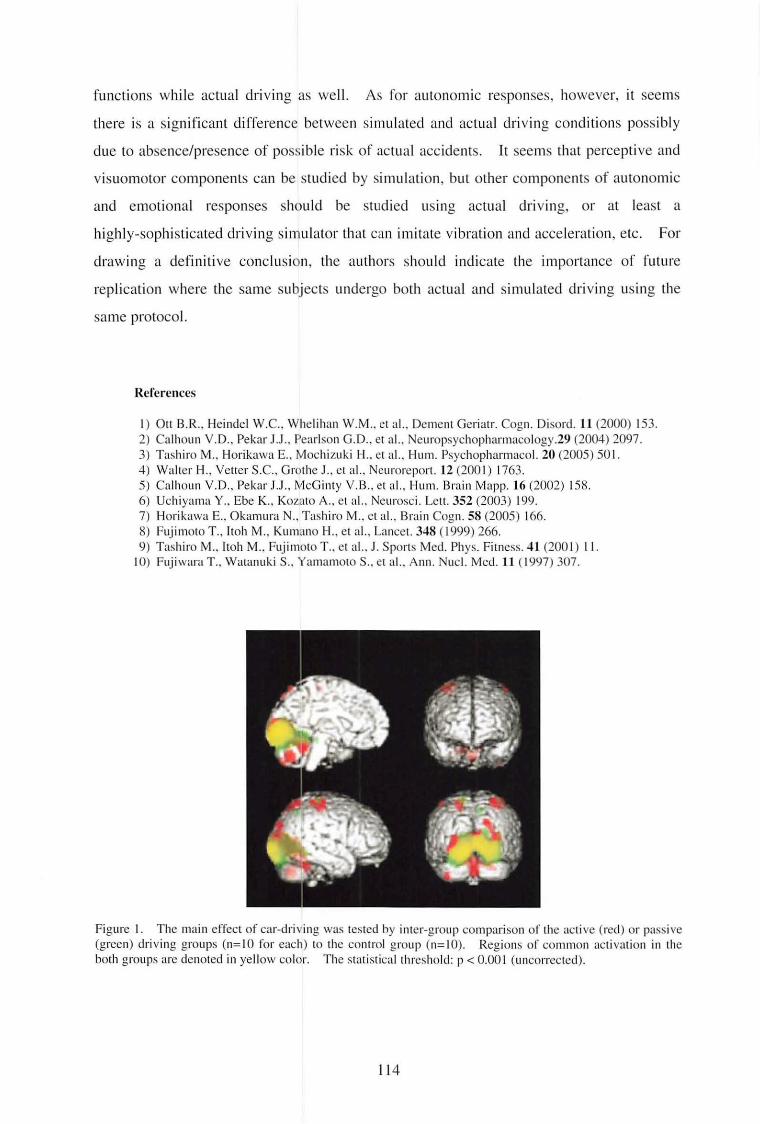
functions while actual driving as well. As for autonomic responses, however, it seems
there is a significant difference between simulated and actual driving conditions possibly
clue to absence/presence of possible risk of actual accidents. It seems that perceptive and
visuomotor components can be studied by simulation, but other components of autonomic
and emotional responses should be studied using actual driving, or at least a
highly-sophisticated driving simulator that can imitate vibration and acceleration, etc. For
drawing a definitive conclusion, the authors should indicate the importance of future
replication where the same subjects undergo both actual and simulated driving using the
same protocol.
References
1) Ott B.R., Heindel W.C.. Whelihan W.M .. et al.. Dem巴ntGeriatr. Cogn. Disord. 11 (2000) 153. 2) Calhoun Y.D .. Pekar J.J .. Pearlson G.D .. et al.. Neuropsychopharmacology.29 (2004) 2097. 3) Tashiro M., Horikawa E., Mochizuki H .. et al.. Hum. Psychopharmacol. 20 (2005) 501. 4) Walter H., V巴tterS.C., Grothe J.,巴lal., Neuroreport. 12 (200り1763.5) Calhoun V.D., Pekar J.J., McGinty Y.B., et al., Hum. Brain Mapp. 16 (2002) 158. 6) Uchiyama Y., Eb巴K.,IくozatoA., et al.. Ncurosci. Lett. 352 (2003) 199. 7) Horikawa E., Okamura N., Tashiro M .. et al.. Brain Cogn. 58 (2005) 166. 8) Fujimoto T.. Itoh M .. Kumano H., et al.. Lancet. 348 (1999) 266.
9) Tashiro M .. ltoh M .. Fujimoto T., et al.. J. Sports Med. Phys. Fitness. 41 (2001) 11. 10) Fujiwara T .. Watanuki S .. Yamamoto S., et al.. Ann. Nucl. Med. 11(1997)307.
Figure I The main effect of car-driving was tested by inter-group comparison of the activ巴(red)or passive (gn巴巴n)driving groups (n=lO for巴ach)to th巴controlgroup (n=IO). Regions of common activation in the both groups are denoted in yellow color. The statistical thr巴shold:pく 0.001(uncorrected).
114
CYRIC Annual Report 2005
VIII. 2. Functional Neuroimaging of Autonomic Nervous Responses During Aroma-therapy Using [18F]FDG PET
Introduction
Duan X. 1, Tashiro M.1, Wu D.2, Yambe T.3, Wang Q.3, Sasaki T.1, Kumagai K.1, Luo Y.3, Nitta S.4, and Itoh M.1
1 Cyclotron and Radioisotope Center, Tohoku University 2 Division of Music Education, Miyagi Universiηof Education
3/nstitute of Development, Aging and Cancer, Tohoku Universiか4 Biomedical Engineering Research Organization, Tohoku University
It is well known that olfactory stimulus has a powerful influence on mammalian
behaviors and physiological functions, and the relationship between olfactory sensation and
autonomic changes has been studied extensively. Various smells can induce autonomic
changes compatible with autonomic relaxation 1・2> or excitation3刈, aswell as changes
compatible with basic emotions5>. Such autonomic changes following treatments with
perfumed fragrances (aroma-therapy) can be detected by power spec住alanalysis (PSA) of
heart rate variability (HRV). A few studies have demonstrated usefulness of HRV
measurement for evaluation of autonomic changes induced by various odorants such as
lavender6・7>. It has been said that“lavender”, one of the most popular flower fragrances
used in aroma-therapy, usually does not induce s町ongemotions but does comfortable
feeling and relaxation. The effects of these fragrances on brain functions do not seem to
be simple. It is expected that many brain regions, including sensory and limbic regions,
紅 einvolved in olfaction. So far, positron emission tomography (PET) and functional
magnetic resonance imaging (fMRI) have been used to investigate regional brain activation
due to various sensory and emotional stimuli. However, functional neuroanatomy of
autonomic changes induced by aroma-therapy has not been studied well using PET. The
aim of the present study is to investigate the effects of lavender fragrance on autonomic
nervous functions in terms of HRV and to observe brain responses in te口nsof brain glucose
metabolic changes measured by PET.
115
Methods
Ten healthy female volunteers, ranging 20 to 27 years old (mean age土 S.D.:23土3.0
years old), were recruited for the present experiment after obtaining their written informed
consent. The present study protocol was approved by the Ethics Committee of Tohoku
University Graduate School of Medicine. Before starting the study, each subject was
interviewed for her preferences to the lavender fragrance, and was also requested to rate her
own stress using the Stress Response Scale (SRS-18). The subjects were requested to be
seated on a comfortable chair with the eyes open in the PET operation room. Holter ECG
recording in the NASA leads (FM・300,Fukuda Denshi, Tokyo, Japan) was performed for
evaluation of the HRV. Respiratory rate was also monitored in order to ensure the absence
of respiratory changes after lavender administration, but the data were lost because of
technical problem. Then, the respiratory data we閃 collectedagain from other 15 subjects
(ranging 20 to 23 years old; mean age+/・ S.D.:21.0 +/ー 1.0years old).
To supply the lavender fragrance, a plaster prepared for aroma-therapy (”Lavender
girlヘTeikokuPharmaceuticals, Tokyo, Japan) was attached on the subjects' right shoulder
shortly before administration of [18F]labeled fluorodeoxyglucose (FDG) injected through
the right cubital vein (3 7 MBq). After 40・min-longuptake phase of FOG, all the
electrodes and the lavender plaster were removed and soon PET scanning procedure was
initiated using SET2400W scanner (Shimadzu Inc., Kyoto, Japan). Subjects were
requested to rate their own stress again using was also requested to rate her own stress using
SRS-18 after PET scanning. PET brain images were analyzed to identi今regionalchanges
of glucose metabolic rate using Statistical Parametric Mapping (SPM210・11>. The threshold
for the significance was set at pく 0.001without corrections for multiple comparisons.
Analyzing HRV in the frequency domain is a valuable method to determine
quantitatively the sympathetic and parasympathetic modulations of heart rate (HR)8'9.
Two main spectral components are most commonly distinguished in the HRV spectrum:
low frequency (LF: 0.04 to 0.15 Hz) and high企equency(HF: 0.15 to 0.4 Hz) components,
respective1y8・9>. For further evaluation, normalized LF and HF (nLF and nHF,
respectively) and low占ighfrequency ratio (LF /HF) were used.
Results
Representative data of HRV measurement taken from a subject are demonstrated in
Fig. 1. R-R intervals tended to be longer later in the experiment compared to the initial
resting condition. The R-R intervals were somewhat shorter in the lavender
116
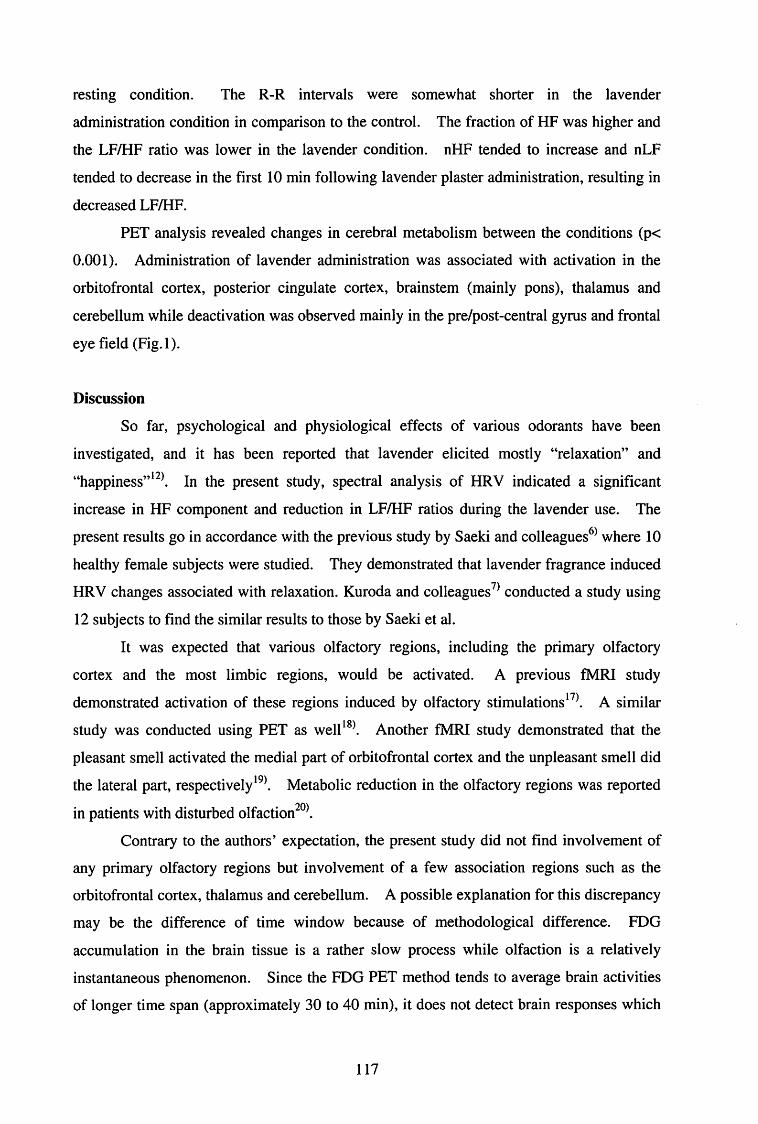
resting condition. The R-R intervals were somewhat shorter in the lavender
administration condition in comparison to the control. The fraction of HF was higher and
the LF.圧IFratio was lower in the lavender condition. nHF tended to increase and nLF
tended to decrease in the first 10 min following lavender plaster administration, resulting in
decreased LF/HF.
PET analysis revealed changes in cerebral metabolism between the conditions (p<
0.001). Administration of lavender administration was associated with activation in the
orbitofrontal cortex, posterior cingulate cortex, brainstem (mainly pons), thalamus and
cerebellum while deactivation was observed mainly in the pre/post-central gyrus and frontal
eye field (Fig. I).
Discussion
So far, psychological and physiological effects of various odorants have been
investigated, and it has been reported that lavender elicited mostly “relaxation”and
“happiness”12>. In the present study, spectral analysis of HRV indicated a significant
increase in HF component and reduction in LF圧IFratios during the lavender use. The
present results go in accordance with the previous study by Saeki and colleagues6> where 10
healthy female subjects were studied. They demonstrated that lavender fragrance induced
HRV changes associated with relaxation. Kuroda and colleagues 7> conducted a study using
12 subjects to find the similar results to those by Saeki et al.
It was expected that various olfactory regions, including the primary olfactory
cortex and the most limbic regions, would be activated. A previous tMRI study
demonstrated activation of these regions induced by olfactory stimulations17>. A similar
study was conducted using PET as well 18>. Another tMRI study demonstrated that the
pleasant smell activated the medial part of orbitofrontal cortex and the unpleasant smell did
the lateral part, respectively19>. Metabolic reduction in the olfactory regions was reported
in patients with disturbed olfaction20>.
Contrary to the authors' expectation, the present study did not find involvement of
any primary olfactory regions but involvement of a few association regions such as the
orbitofrontal cortex, thalamus and cerebellum. A possible explanation for this discrepancy
may be the difference of time window because of methodological difference. FDG
accumulation in the brain tissue is a rather slow process while olfaction is a relatively
instantaneous phenomenon. Since the FDG PET method tends to average brain activities
of longer time span (approximately 30 to 40 min), it does not detect brain responses which
117
may last temporally. Therefore, it seems that an interpretation of the present results
should be done based on the concept of“identifying brain regions influenced by
environmental changes due to lavender fragrance lasting 40 minutes" that would make the
mterpretation easier.
Based on such a standpoint, lack of activation in the anterior cingulate gyms in the
present study would be reasonable because this region is regarded as one of the centers of
sympathetic nervous activities that were possibly suppressed after lavender administration.
Metabolic increase in the brainstem and posterior cingulate gyms, though not usually
included in the olfactory regions, seems to be associated with improved mental functions
during relaxation rather than olfaction itself. The combined finding of a reduced
sensorimotor activity and an improved arousal/cognitive function seem to be a good brain
representation of“physical relaxation" and “improved mental functions" induced by
lavender, as recognized as a calming or relaxing agent20.
In summary, the authors have demonstrated that lavender fragrance can promote
relaxation by depressing sympathetic activity while augmenting p紅 asympatheticactivity in
normal adults. Our findings suggest a possible use of lavender fragrance to住eatpatients
with various types of autonomic dysfunctions.
References
1) Alaoui-Ismaili 0., Vernet-Maury E., Dittmar A., et al., Chem Senses 22 (1997) 237. 2) Nagai M., Wada M., Usui N., et al., Neurosci. Lett. 289 (2000) 227. 3) Brauchli P., Ruegg P.B., Etzweiler F., et al., Chem. Senses 20 (1995) 505. 4) Alaoui-Ismaili 0., Vernet-Maury E., Dittmar A., et al., Chem. Senses 22 (1997) 237. 5) Vernet-Maury E., Alaoui-lsmaili 0., Dittmar A., et al., J. Auton. Nerv. Syst. 75 (1999) 176. 6) Saeki Y ., Complement Ther Med. 8 (2000) 2. 7) Kuroda K., Inoue N., Ito Y., et al., Eur. J. Appl. Physiol. 95 (2005) 107. 8) Novak V., Saul J.P., Eckberg D.L., et al., Circulation 96 (1997) 1056. 9) La Rovere MT., Bigger JT Jr., Marcus FI., et al., Lancet 351(1998)478. 10) Friston K., Ashburner J., Frith C., et al., Human Brain Map. 2 (1995) 165. 11) Friston K.J., Holmes A., Poline J.B., et al., Neuroimage 4 (1996) 223. 12) Vernet-Maury E., Alaoui-Ismaili 0., Dittmar A., et al., J. Auton. Nerv. Syst. 75 (1999) 176. 13) Pomeranz B., Macaulay R.J., Caudill M.A., et al., Am. J. Physiol. 248 (1985) 151. 14) Malliani A吋 LombardiF., Pagani M., Br. Heart J. 71 (1994) I. 15) Dunn C., Sleep J., Collett D., et al., J. Advanced Nursing 21 (1995) 34. 16) Stevensen C.J., Complementary Therapies in Med. 2 (1994) 27. 17) de Araujo I.E., Rolls E.T., Kringelbach M.L., et al., Eur. J. Neurosci. 18 (2003) 2059. 18) Qureshy A., Kawashima R., lmran M.B., et al., J. Neurophysmol. 84 (2000) 1656. 19) Rolls E.T., Kringelbach M.L., de Ara吋oI.E., Eur. J. Neurosci. 26 (2002) 695. 20) Levy L.M., Henkin R.I., Lin C.S., Finley A., J. Comput. Assist. Tomogr. 23 (1999) 767. 21) Buchbauer G., Jirovetz L., Jager W., et al., J. Biosciences 46 (1991) 1067.
118
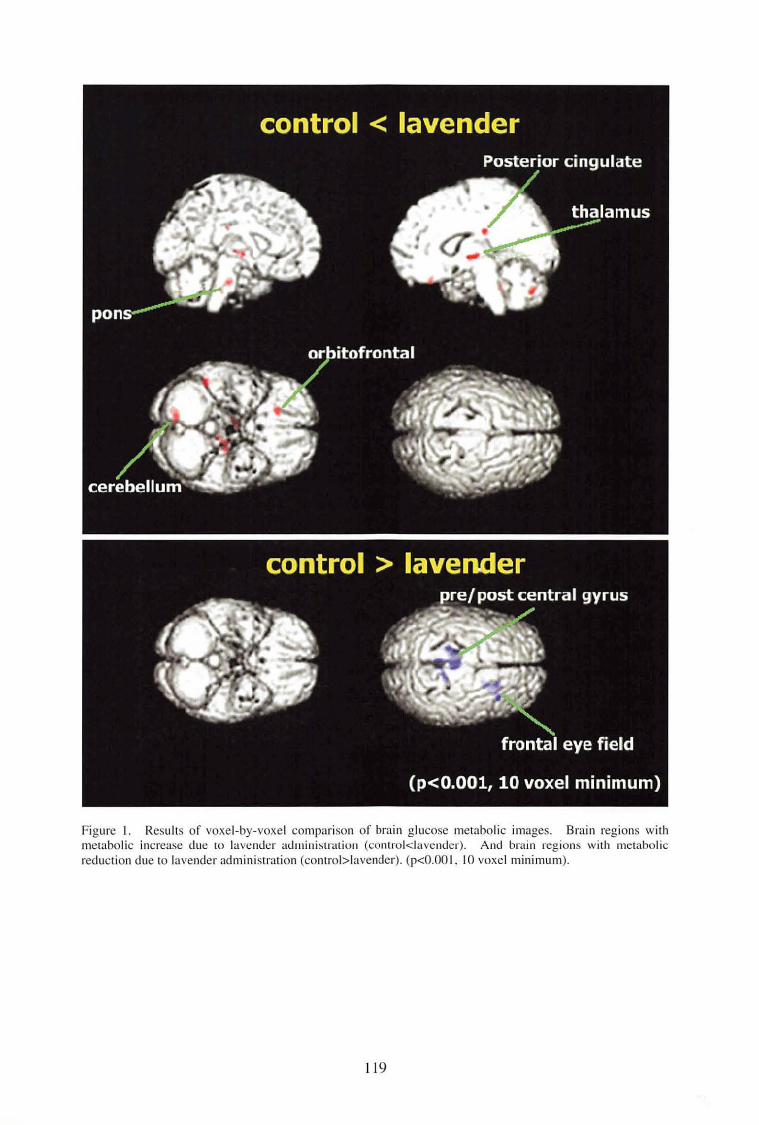
Figure I. Resulls of voxel-by-voxel comparison of brain glucose metabolic images. Brain regions with metabolic increase due to lavender ad111i11istraliu11 (controlくlavender). And brain regions witl】 metabolic
reduction due to lavender administration (control>lavender). (pく0.001,10 voxel minimum).
Ll9
CYRIC Annual Report 2005
VIII. 3. Brain Histamine H1 Receptor Occupancy of Antihistamines, Bepotastine and Diphenhydramine, Measured by [11C]Doxepin PET
Introduction
Duanχ1, Tashiro M. 1, Kato M. 2, M加keM. 1, Watanuki S.1,_ Ishikawa S. 1, Funaki Y. 1, Iwata R. 1, Itoh M. 1, and Yanai. K. '・2
1 Cyclotron and Radioisotope Center, Tohoku University 2Graduare School of Medicine, Tohoku Universiη
Histamine Hl receptor (HlR) antagonists, or antihistamines, are often used for
treatment of allergic disorders such as seasonal rhinitis. Antihistamines mainly act on the
peripheral tissues but can induce sedation. This undesirable central side effect is caused
by blockade of nerve transmission in the histaminergic neuron system which projects from
the tuberomammillary nucleus in the posterior hypothalamus to almost all cortical areas 1・3).
First-generation antihistamines, such as diphenhydramine and d-chlorpheniramine, that can
easily penetr剖eblood-brain barrier (BBB) tend to occupy a large proportion of
post-synaptic H1Rs4・6>. Second-generation antihistamines, such as fexofenadine, cetirizine
and olopatadine, can slightly pene佐ateBBB and HlRs are slightly occupied as having been
demonstrated using positron emission tomography (PET)4・7-9>. Variation in cerebral HlR
occupancy (HlRO) of antihistamines results mainly from their different BBB permeability.
Thus, sedative prope町 ofantiμistamines can be evaluated in terms of HlRO measured
with PET and [11C]doxepin, a rapiopharmaceutical that specifically binds to HlRs.
Methods
The present study was approved by the Committee on Clinical Investigation at
Tohoku Uniyersity Graduate School of Medicine, Japan, and was perlormed in accordance
with the policy of the Declaration of Helsinki. All experiments were performed at the
Cyclotron and Radioisotope Centre, Tohoku University. Eight healthy male volunteers
(mean age+/ー s.d.:24.4 +/・ 3.3ye紅 sold) were studied after single oral administration of
bepotastine 10 mg, diphenhydramine 30 mg or placebo, using PET with [ 11C]doxepin in a
crossover study-design. Binding potential ratio and HlR occupancy values were
120
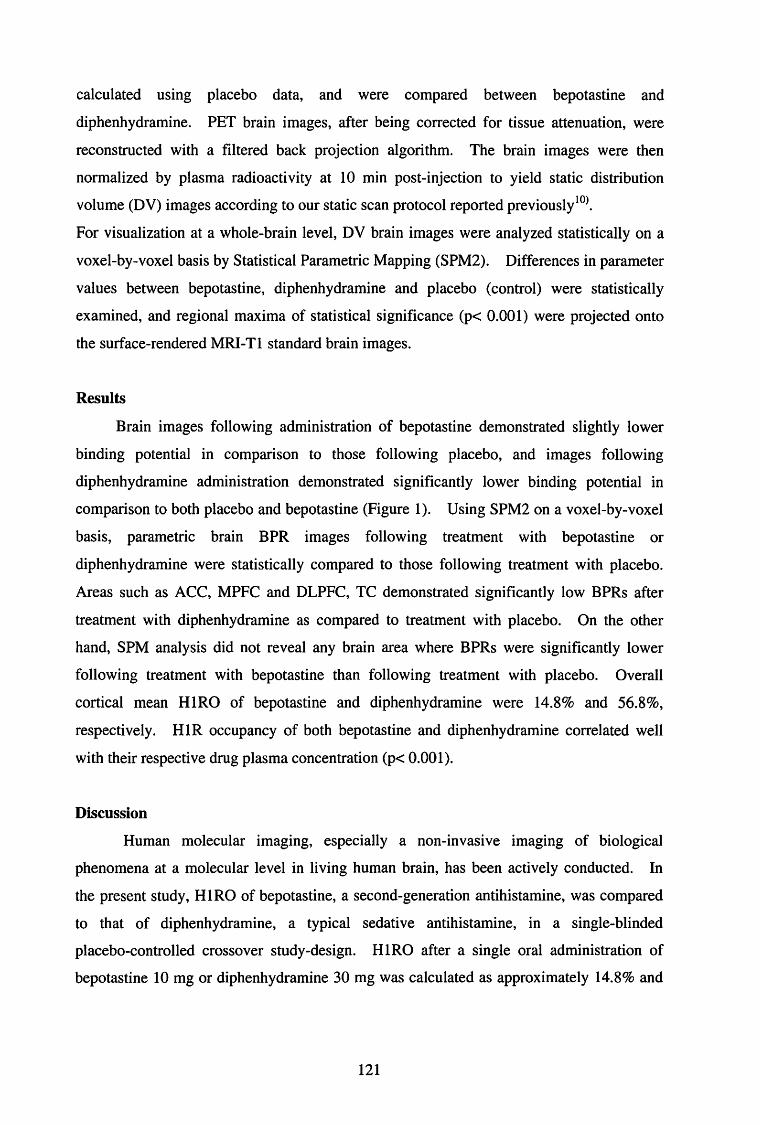
calculated using placebo data, and were compared between bepotastine and
diphenhydramine. PET brain images, after being corrected for tissue attenuation, were
reconstructed with a filtered back projection algorithm. The brain images were then
normalized by plasma radioactivity剖 10min post-injection to yield static distribution
volume (DV) images according to our static scan protocol reported previously10>.
For visualization at a whole-brain level, DV brain images were analyzed statistically on a
voxel-by-voxel basis by Statistical Parametric Mapping (SPM2). Differences in parameter
values between bepotastine, diphenhydramine and placebo (con佐ol)were statistically
examined, and regional maxima of statistical significance (p< 0.001) were projected onto
the surface-rendered MRI-Tl standard brain images.
Results
Brain images following administration of bepotastine demonstrated slightly lower
binding potential in comparison to those following placebo, and images following
diphenhydramine administration demonstrated significantly lower binding potential in
comparison to both placebo and bepotastine (Figure 1). Using SPM2 on a voxel・by-voxel
basis, parametric brain BPR images following treatment with bepotastine or
diphenhydramine were statistically compared to those following treatment with placebo.
Areas such as ACC, MPFC and DLPFC, TC demonstrated significantly low BPRs after
treatment with diphenhydramine as compared to甘eatmentwith placebo. On the other
hand, SPM analysis did not reveal any brain area where BPRs were significantly lower
following treatment with bepotastine than following廿eatmentwith placebo. Overall
cortical mean HlRO of bepotastine and diphenhydramine were 14.8% and 56.8%,
respectively. HlR occupancy of both bepotastine and diphenhydramine correlated well
with their respective drug plasma concentration (pく0.001).
Discussion
Human molecular imaging, especially a non-invasive imaging of biological
phenomena at a molecular level in living human brain, has been actively conducted. In
the present study, HlRO of bepotastine, a second-generation antihistamine, was compared
to that of diphenhydramine, a typical sedative antihistamine, in a single-blinded
placebo-con甘olledcrossover study-design. HlRO after a single oral administration of
bepotastine 10 mg or diphenhydramine 30 mg was calculated as approximately 14.8% and
121
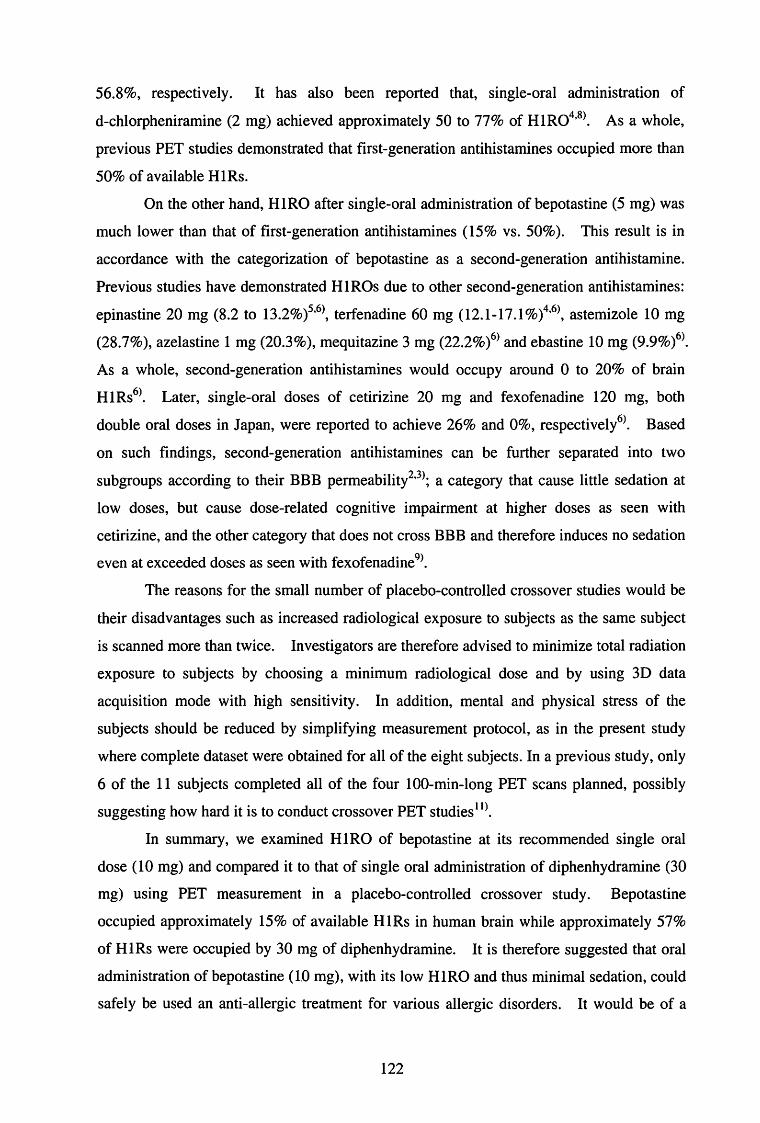
56.8%, respectively. It has also been reported that, single-oral administration of
d-chlorpheniramine (2 mg) achieved approximately 50 to 77% of H1R04・8>. As a whole,
previous PET studies demonstrated that first-generation antihistamines occupied more than
50% of available HlRs.
On the other hand, HlRO after single-oral administration of bepotastine (5 mg) was
much lower than that of first-generation antihistamines (15% vs. 50% ). This result is in
accordance with the categorization of bepotastine as a second-generation antihistamine.
Previous studies have demonstrated HlROs due to other second-generation antihistamines:
epinastine 20 mg (8.2 to 13.2%)5・6>, terfenadine 60 mg (12.1・17.1 % )4・6>, astemizole 10 mg
(28.7%), azelastine 1 mg (20.3%), mequitazine 3 mg (22.2%)6> and ebastine 10 mg (9.9%)6>.
As a whole, second-generation antihistamines would occupy around 0 to 20% of brain
H1Rs6>. Later, single-oral doses of cetirizine 20 mg and fexofenadine 120 mg, both
double oral doses in Japan, were reported to achieve 26% and 0%, respectively6>. Based
on such findings, second-generation antihistamines can be further separated into two
subgroups according to their BBB permeability2・3>; a category that cause little sedation at
low doses, but cause dose-related cognitive impairment at higher doses as seen with
cetirizine, and the other category that does not cross BBB and therefore induces no sedation
even at exceeded doses as seen with fexofenadine9>.
The reasons for the small number of placebo-controlled crossover studies would be
their disadvantages such as increased radiological exposure to subjects as the same subject
is scanned more than twice. Investigators are therefore advised to minimize total radiation
exposure to subjects by choosing a minimum radiological dose and by using 3D data
acquisition mode with high sensitivity. In addition, mental and physical s甘・essof the
subjects should be reduced by . simplifying measurement protocol, as in the present study
where complete dataset were obtained for all of the eight subjects. In a previous study, only
6 of the 11 su対ectscompleted all of the four 100-min-long PET scans planned, possibly
suggesting how hard it is to conduct crossover PET studies 11>.
In summary, we examined HlRO of bepotastine at its recommended single oral
dose ( 10 mg) and compared it to that of single oral administration of diphenhydramine (30
mg) using PET measurement in a placebo-controlled crossover study. Bepotastine
occupied approximately 15% of available HlRs in human brain while approximately 57%
of HlRs were occupied by 30 mg of diphenhydramine. It is therefore suggested that oral
administration of bepotastine (10 mg), with its low HlRO and thus minimal sedation, could
safely be used an anti-allergic treatment for various allergic disorders. It would be of a
122
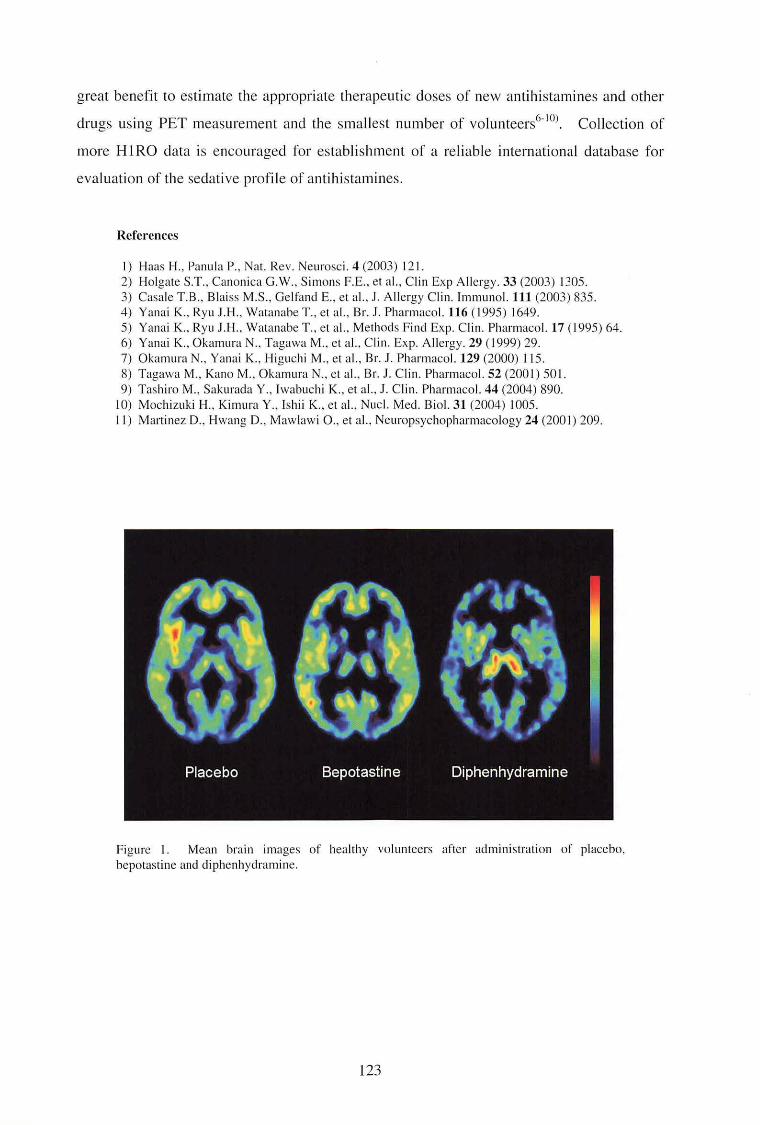
great benefit to estimate the appropriate therapeutic doses of new antihistamines and other
drugs using PET measurement and the smallest number of volunteers6-10)_ Collection of
more HlRO data is encouraged for establishment of a reliable international database for
evaluation of the sedative profile of antihistamines.
References
I) Haas H., Panula P., Nat. Rev. N巴urosci.4(2003)121.
2) Holgate S.T., Canonica G.W., Simons F.E., et al., Clin Exp Allergy. 33 (2003) 1305.
3) Casale T.B., Blaiss M.S., Gelfand E., et al., J. Allergy Clin. lmmunol. 111(2003)835. 4) Yanai K., Ryu J .H., Watanabe T., et al., Br. J. Pharmacol. 116 ( 1995) 1649.
5) Yanai K., Ryu J.H., Watanabe T., et al., Methods Find Exp. Clin. Pharmacol. 17 ( 1995) 64.
6) Yanai K., Okamura N., Tagawa M., et al., Cl in. Exp. Allergy. 29 ( 1999) 29.
7) Okamura N., Yanai K., Higuchi M., et al., Br. J. Pharmacol. 129 (2000) 115.
8) Tagawa M., Kano M., Okamura N., et al., Br目 J.Clin. Pharmacol. 52 (2001) 501.
9) Tashiroル'I.,SakL11・adaY., Iwabuchi K., et al., J. Clin. Pharmacol. 44 (2004) 890.
10) Mochizuki H., Kimura Y., Ishii K., et al.. Nucl. Med. Biol. 31 (2004) 1005.
11) Martinez D., Hwang D., Mawlawi 0., et al., Neuropsychopharmacology 24 (2001) 209.
Figure I Mean brain images of healthy volunteers after administration of placebo,
bepotastine and diphenhydramine.
123
CYRIC Annual Report 2005
VIII. 4. Whole Body Metabolic Imaging for Sport Science
Masud M.1, Fujimoto T人TashiroM. 1, Watanuki S. 1, Miyake M. 1, Iwata R. 1, and Itoh M. 1
1 Cyclotron Radioisotope Center, Tohoku University 2Center for the Advancemellt of Higher Education,
[18町Fluorodeoxy-glucose (18FDG) and three dimensional positron emission
tomography (3DPET) is a useful device for clinical and basic medicine that maps
physiopathology of organs in vivo in humans. 18FDG-3DPET technique assesses the
changes in the muscle usage as well as physiology of organs during tasks. Imaging
analysis of muscle use difference between trained and non-trained subjects would be
helpful for rational body training of future athletes. Inevitably, brain is a vital organ
which has a keen participation at physical task evaluated by PET technique. We propose
the use of 3DPET for sport science.
Measurement of whole body glucose metabolism for sport science
PET technique assesses the metabolic activity of organs in humans in vivo at rest or
during task1-5>_ Figure 1 depicts the whole-body 18FDG distribution at one hour after
i吋ectionwhile the person was in resting state. The highest uptake is seen in the brain than
other organs. During exerci~e, jogging in this case, 18FDG uptake is dramatically
increased in the lower limbs. : In this experiment, the subject ran around our university
campus for a total of 35 minutes, 15 minutes prior and 20 minutes after the intravenous
injection of 18FDG. A group study using seven h叫 thymale volunteers, average age of
32.2 ± 13.5 y (mean±SD) showed redistribution of energy metabolism, i.e., the highest in
lower leg muscles while 18FDG uptake was reduced in other organs except in the brain and
heart (Fig. 2). Whole-body PET imaging was carried out by a series of 9 to 11 scanning
table movements taking 180 sec for each table position. A transmission scan (post
i吋ectiontransmission mode) then followed using the same time schedule as the emission
scan using a 68Ge!68Ga external rotating line source to correct tissue photon attem胤 ionsfor
the emission scans. The exercise strength was below the anaerobic threshold and kept
124
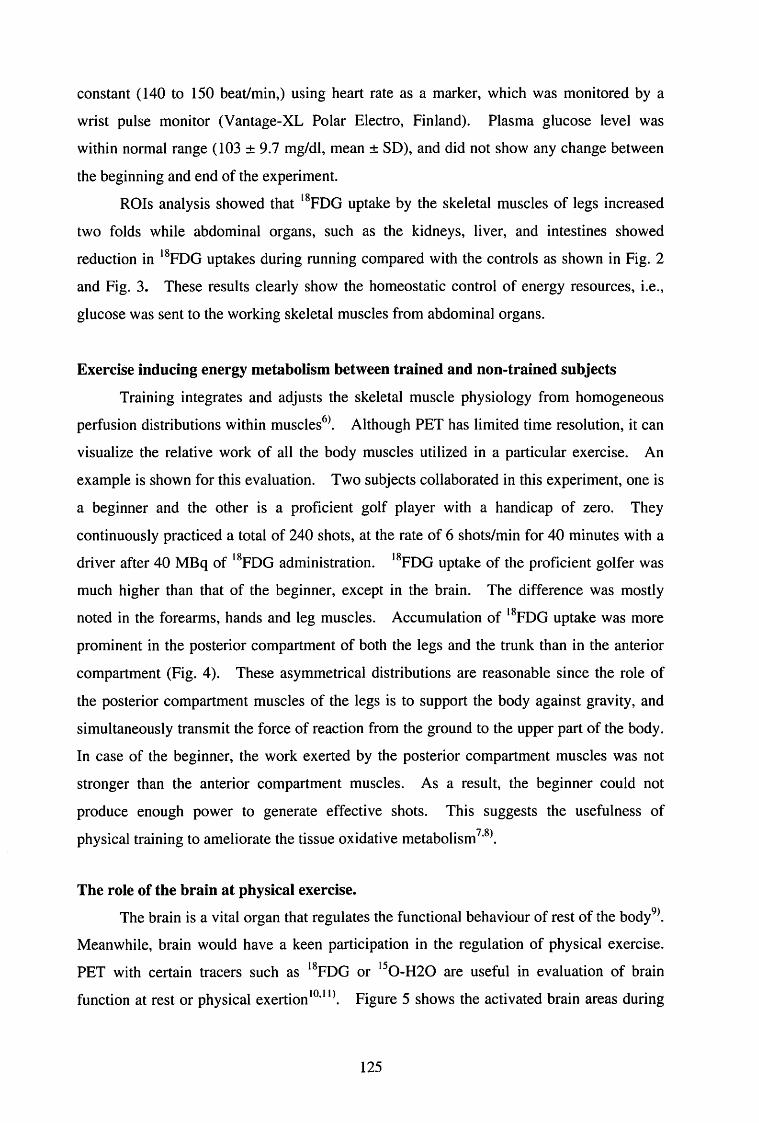
constant (140 to 150 beat/min,) using heart rate as a marker, which was monitored by a
wrist pulse monitor (Vantage-XL Polar Electro, Finland). Plasma glucose level was
within normal range (103 ± 9.7 mg/dl, mean± SD), and did not show any change between
the beginning and end of the experiment.
ROis analysis showed that 18FDG uptake by the skeletal muscles of legs increased
two folds while abdominal organs, such as the kidneys, liver, and intestines showed
reduction in 18FDG uptakes during running compared with the controls as shown in Fig. 2
and Fig. 3. These results clearly show the homeostatic control of energy resources, i.e.,
glucose was sent to the working skeletal muscles from abdominal organs.
Exercise inducing energy metabolism between trained and non-trained subjects
Training integrates and adjusts the skeletal muscle physiology from homogeneous
perfusion distributions within muscles6>. Although PET has limited time resolution, it can
visualize the relative work of all the body muscles utilized in a particular exercise. An
example is shown for this evaluation. Two subjects collaborated in this experiment, one is
a beginner and the other is a proficient golf player with a handicap of zero. They
continuously practiced a total of 240 shots, at the rate of 6 shots/min for 40 minutes with a
driver after 40 MBq of 18FDG administration. 18FDG uptake of the proficient golfer was
much higher than that of the beginner, except in the brain. The difference was mostly
noted in the forearms, hands and leg muscles. Accumulation of 18FDG uptake was more
prominent in the posterior compartment of both the legs and the trunk than in the anterior
compartment (Fig. 4 ). These asymmetrical distributions are reasonable since the role of
the posterior compartment muscles of the legs is to support the body against gravity, and
simultaneously transmit the force of reaction from the ground to the upper part of the body.
In case of the beginner, the work exerted by the posterior compartment muscles was not
stronger than the anterior compartment muscles. As a result, the beginner could not
produce enough power to generate effective shots. This suggests the usefulness of
physical training to ameliorate the tissue oxidative metabolism 7・8>.
The role of the brain at physical exercise.
The brain is a vital organ that regulates the functional behaviour of rest of the body9>.
Meanwhile, brain would have a keen participation in the regulation of physical exercise.
PET with certain tracers such as 18FDG or 150・H20are useful in evaluation of brain
function at rest or physical exertion 10・ 10. Figure 5 shows the activated brain areas during
125
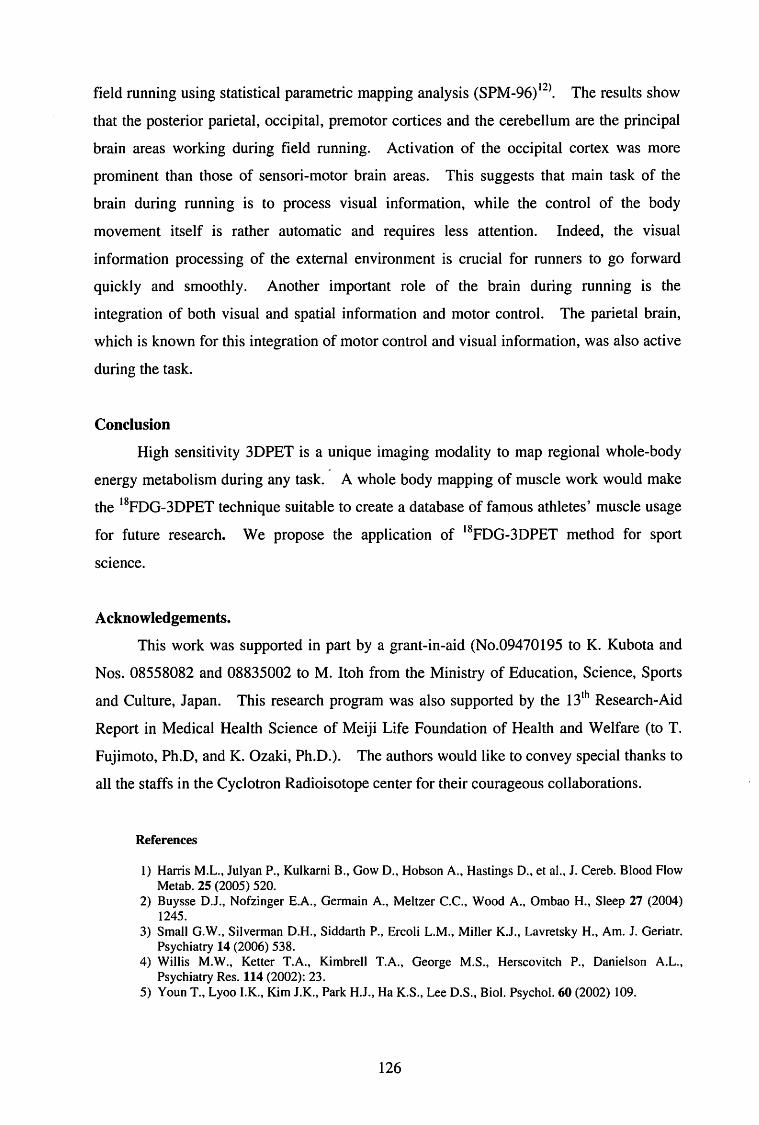
field running using statistical parametric mapping analysis (SPM・96)12>. The results show
that the posterior parietal, occipital, premotor cortices and the cerebellum are the principal
brain areas working during field running. Activation of the occipital cortex was more
prominent than those of sensori-motor brain紅 eas. This suggests that main task of the
brain during running is to process visual information, while the control of the body
movement itself is rather automatic and requires less attention. Indeed, the visual
information processing of the external environment is crucial for runners to go forward
quickly and smoothly. Another important role of the brain during running is the
integration of both visual and spatial information and motor control. The parietal brain,
which is known for this integration of motor control and visual information, was also active
during the task.
Conclusion
High sensitivity 3DPET is a unique imaging modality to map regional whole-body
energy metabolism during any task. A whole body mapping of muscle work would make
the 18FDG-3DPET technique suitable to create a database of famous athletes' muscle usage
for future research. We propose the application of 18FDG-3DPET method for sport
science.
Acknowledgements.
This work was suppo口edin p紅 tby a grant-in-aid (No.09470195 to K. Kubota and
Nos. 08558082 and 08835002 to M. Itoh from the Ministry of Education, Science, Sports
and Culture, Japan. This research program was also supported by the 13th Research-Aid
Report in Medical Health Science of Meiji Life Foundation of Health and Welfare (to T.
F吋imoto,Ph.D, and K. Ozaki, Ph.D.). The authors would like to convey special thanks to
all the staffs in the Cyclotron Radioisotope center for their courageous collaborations.
References
I) Harris M.L., Julyan P., Kulkarni B., Gow D., Hobson A., Hastings D., et al., J. Cereb. Blood Flow Metab. 25 (2005) 520.
2) Buysse D.J., Nofzinger E.A., Germain A., Meltzer C.C., Wood A., Ombao H., Sleep 27 (2004) 1245.
3) Small G.W., Silverman D.H., Siddarth P., Ercoli L.M., Miller K.J., Lavretsky H., Am. J. Geriatr. Psychiatry 14 (2006) 538.
4) Willis M.W., Ketter T.A., Kimbrell T.A., George M.S., Herscovitch P., Danielson A.L., Psychiatry Res. 114 (2002): 23.
5) Youn T., Lyoo I.K., Kim J.K., Park H.J., Ha K.S., Lee D.S., Biol. Psychol. 60 (2002) 109.
126
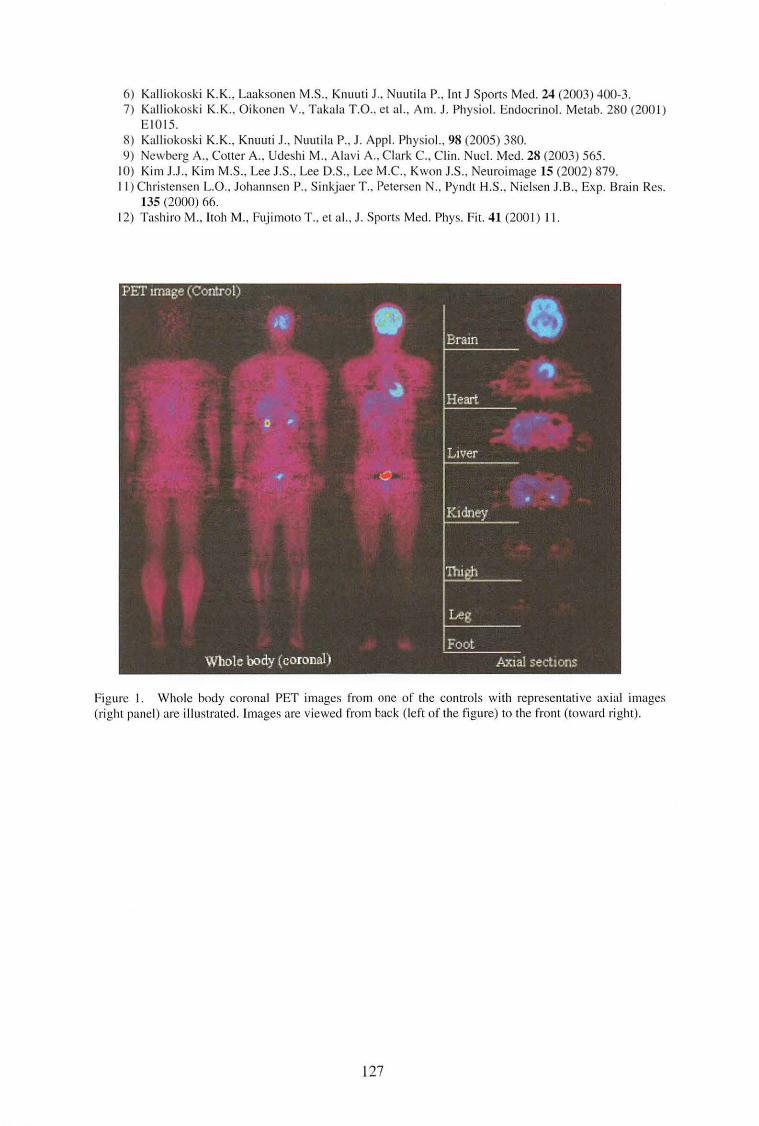
6) Kalliokoski K.K .. Laaksonen M.S., Knuuti J., Nuutila P .. Int J Sports Med. 24 (2003) 400・37) Kalliokoski K.K., Oikonen V .. Takala T.O .. et al., Am. J. Physiol. Endocrinol. Metab. 280 (2001)
EIOIS. 8) Kalliokoski K.K., Knuuti J., Nuutila P., J. Appl. Physiol., 98 (2005) 380. 9) Newberg A., Cotter A .. Udeshi M., Alavi A., Clark C.. Clin. Nucl. Med. 28 (2003) 565. 10) Kim J.J., Kim M.S., Lee J.S., Lee D.S., Lee M.C., Kwon J.S., Neuroimage 15 (2002) 879. I I) Christensen L.O., Johanns巴nP., Sinkjaer T., P巴terscnN., Pyndt H.S., Nielsen J.B., Exp. Brain Res.
135 (2000) 66. 12) Tashiro M., ltoh M., Fujimoto T., et al., J. Sports Med. Phys. Fit. 41 (200 I) 11.
Figure I. Whole body coronal PET images from one of the controls with representative axial images (right panel) are illustrated. Images ar巴vi巴wedfrom back (1巴ftof the figure) to th巴front(toward right).
127
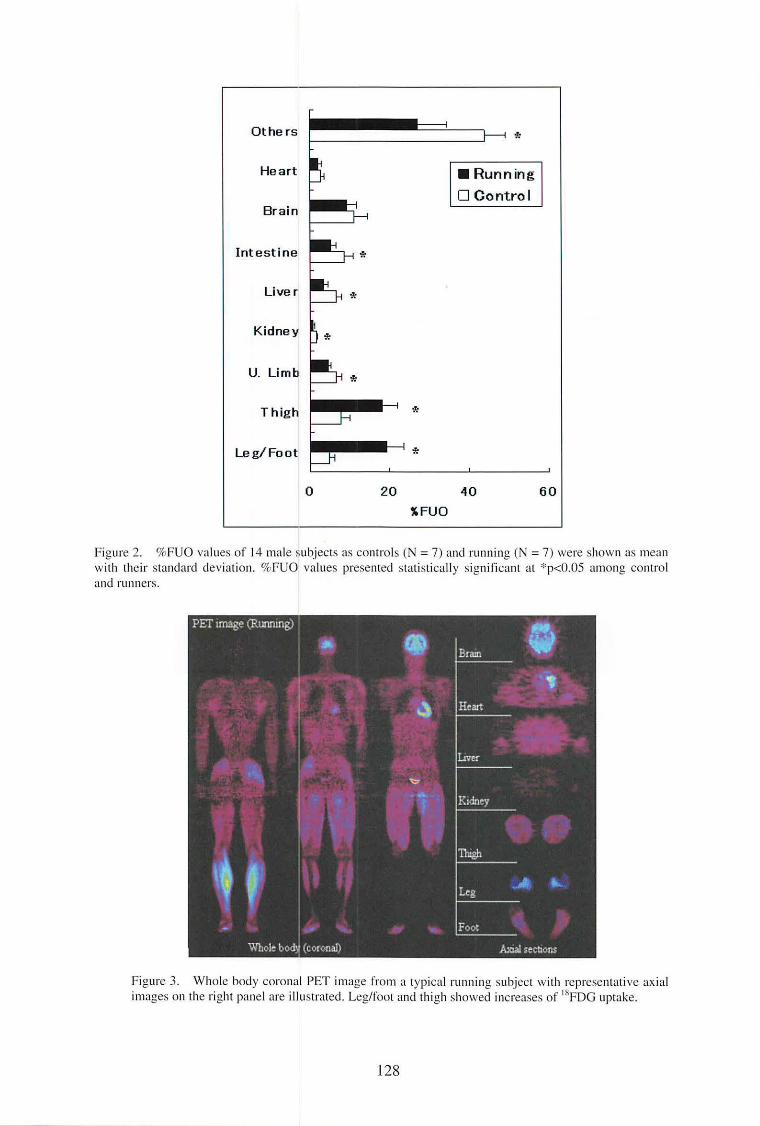
Others
Heart
Brain
Intestine
Liver
Kidney
u_ Limb
Thigh
Leg/Foot
。
品
雪』
20
~FUO
*
•Running
口Control
40 60
Figure 2. %FUO values of 14 mal巴subjectsas controls (N = 7) and running (N = 7) wer巴shownas m巴an
with their standard deviation. %FUO values presented statistically significant at・ヤく0.05among control
and runners.
Figur巴3. Whole body coronal PET image from a typical running subject with representative axial images on the right panel are illustrated.し巴g/footand thigh showed increases of 18FDG uptake_
128
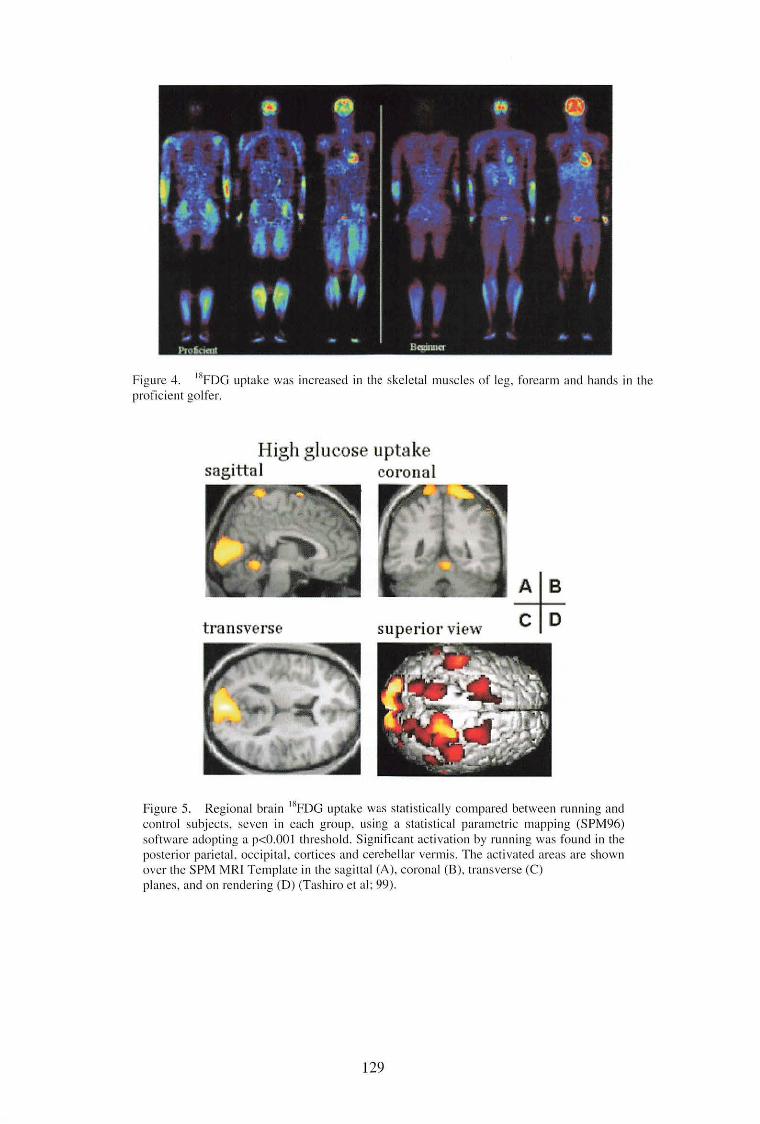
Figur巴4. 18FDG uptake was increased in the skeletal muscles of l巴g,frn・巴armand hands in the proficient golf1巴r.
High glucose uptake sagittal coronal
transverse superior view *
Figure 5. Regional brain 18FDG uptake was statistically compared betwe巴nrunning and control subjects, seven in each group, using a statistical param巴tricmapping (SPM96) soft war巴adoptinga pく0.001threshold. Significant activation by running was found in the posterior parietal, occipital, cortices and ce1己bellarvermis. The activated areas are shown over the SPM MRI Template川 thesagittal (A), coronal (B), transverse (C) plan巴s,and c】nrencleri
129
CYRIC Annual Report 2005
VIII. 5. Differential Activation of the Midbrain Periaqueductal Grey by Experience of Visceral Stimulation in Humans
Hamaguchi T.1, Kano M.1, Kanazawa M.1, Rikimaru H.2, Watanabe S.1, ltoh M.2, Yanai K.1,
and Fukudo S. 1
Introduction
1Graduate School of Medicine, Tohoku University 2Cyclotron Radio Isotope Center, Tohoku University
The midbrain periaqueductal grey (PAG) plays a pivotal role in integrating the
analgesic and cardiovascular responses of an animal to threat, stress or pain°. The PAG is
also an important site for acute opioid actions 2 and the expression of some signs of opioid
withdrawal3). Experience of pain minimizes immediate harm by motivating escape4・6).
Anticipation of pain is mechanism to prevent future harm by learning signs of impending
pain7-10), allowing avoidance of future painful events.
Hypersensitivity to visceral stimulation is major pathophysiology of IBS 11・13,14).
Recent advances in the neurophysiology紅eproviding a series of plausible mechanisms to
explain the development of hyperalgesia of the human gas甘ointestinaltract15-11>. However,
the brain area related to initial programming of sensitization provoked by the visceral
perception is still unknown. Detailed information on brain activation in the initial
programming of sensitization to distention of the descending colon in humans is needed.
This study clarified that brain activation due to the colonic distention is different
between with initial intense stimulation and with intense stimulation after the mild
stimulation. The brain behaves differently in response to the different order of visceral
stimulation. This differential brain activation to colonic distention seems to be due to
summation of central processing.
Methods
Subjects
This study was approved by the Ethics Committee of Tohoku University School of
Medicine. All su吋ectsgave written informed consent. Fifteen normal volunteers ( 4
130
female, 11 male, 20・26years old, all right-handed) participated in this study. All su吋ects
were free from gastrointestinal disorder symptoms or signs. All subjects scored
Spiel berger、State and Trait Anxiety Inventory (STA1)18> and Zung’s Self-rating
Depression Scale (SDS)19> before the experiment.
On the day before examination, the subjects took a low residue diet and at night
(21 :00), they ingested 17 g ( 13 .6%) of magnesium citrate, 7 5 mg of sodium picosulfate, and
24 mg of sennoside A & B to cleanse the colon. By using a colonoscope, a plastic tube
with a thin polyethylene bag (Synectics Medical, Stockholm) was inserted into the
descending colon.
PET scanning
150-Labeled water was i吋ectedinto the right訂mvein at the beginning of colo凶c
distention. rCBF in each subject was measured during 4 scans (70 seconds each) using a
PET scanner in three-dimension sampling mode (HEADTOME V SET-2400W, Shimadzu,
Japan).
The descending colon was distended with a computerized barostat pump
(Medtronics Synectics, Shoreview, MN). To clarify the sensitization process to colonic
distention, orders of stimuli was set with 2 different patterns as follows: group 1: 40 -20 (n
= 8), group 2: 0・20(n = 7). No subject was informed of the order or intensity of stimuli.
After each stimulation, the subjects we陀 askedto report the following 7 items of
visceral perception or emotion: abdominal discomfort, abdominal distention, abdominal
pain, urgency for defecation, perceived stress, sleepiness, and anxiety. Each sensation was
evaluated on an ordinate scale20 from 0 (no sensation) to 10 (maximal sensation).
Data Analyses
PET images were analyzed using SPM2 (Wellcome, Dep訂tmentof Cognitive
Neurology, London, UK) on a MATLAB platform (Mathworks Inc.). To estimate the
neural sensitization to visceral stimulation by stimulus effect of 0, 20, and 40 mmHg
distention, a conjunction analysis were made using‘multi-group, conditions and covariates’
SPM model21). All brain images were analyzed in a co吋unctionanalysis21>, rectified for
gender difference and order effect on this analysis22>. Ordinate visceral perception and
emotion were compared between groups with Mann-Whitney U test.
131
Results
Visceral perception and emotional changes during equivalent stimulus in different order
Visceral perception and emotion were found no difference in equivalent stimuli
depending on stimulus order of the descending colon. Abdominal discomfort (Z = -1.56, p
= 0.12) and abdominal pain (Z =ー0.90,p = 0.37) during 20 mmHg distention after 40
mmHg were lower than during 20 mmHg distention only (not significant, Fig. 1).
rCBF changes during equivalent colonic distention in different order
Colonic distention with 20 mmHg after the experience of 40 mmHg significantly
more activated the midbrain including PAG (Z = 4.95), left insula (BA13, Z = 4.93), right putamen (Z = 3.96), right middle temporal gyrus (Z = 3.94) and cerebellum than that
without prior experience of visceral stimuli (group 3 and 4) (uncorrected p < 0.001, Fig. 2).
rCBF changes by colonic distention
Colonic distention with 20 mmHg and 40 mmHg induced significant activation of
the regional brain; right orbitofrontal gyrus (BA 11 ), bilateral inferior parietal gyrus (BA
40), right putamen, bilateral caudate, bilateral thalamus, and cerebellum (data not shown).
These area are essentially the same brain regions of the first report in our laboratory23>.
Sham distention with 0 mmHg also induced significant activation of the right inferior
parietal gyrus (BA 40) (data not shown), replicating the previous analysis with smaller
sample size23>.
Basic Characteristics of Subjects
There were no difference in age and sex ratio among groups. Moreover, ST AI
and SDS did not differ among groups.
Discussion
By establishing a direct comparison to equivalently visceral stimulus in the
different order, these data show the possibility that the modulation of visceral perception
and emotion by experience of stimulation dependent on neural activity in a specific area of
midbrain, insula, and cerebellum.
The PAG is an important component of the descending noxious inhibitory
system24>, which contains a high concentration of opiate neurons with descending spinal
132
afferents25>. One mechanism by which the PAO modulates visceral perception may
involve the release of endogenous opioids. The PAO contains significant quantities of all
families of endogenous opioid peptides, and it is known that μ opioids act by releasing
PAO pr吋ectioncells from GABAergic inhivition26>. Specific projections of the medial
network to the PAO, hypothalamus, and amygdala presumably mediate integrated
autonomic and antinociceptive responses to acute aversive stimuli24' 27). Activation in the
PAO is significantly increased during attentional modulation of pain intensity25>, and
changes in pain responses attributable to changes in arousal or attention result from the
action of modulatory networks that control the transmission of nociceptive signals of the
brain28>. Therefore, this study suggest that mild (20 mmHg) distention after the experience
of 40 mmHg distention to the descending colon might be enough to reduce visceral
sensation with activating descending pain inhibitory system in normal subjects.
In the previous study has shown in humans that a conditioning stimulus is able to modulate
the perceptual and reflex response to intestinal distention29>. In healthy human subjects
and patients with IBS, repetitive distention of a balloon in the rectum or colon to noxious
pressures altered the perception of colonic distention consistent with the development of
hyperalgesia14・ 30>. Analogous short-term stimulation paradigms have been shown to
induce central sensitization in animal models31 >. Because the development of central
sensitization is modulated by endogenous pain modulation systems, including bulbospinal
descending inhibitory system32>, a short-term sensitization paradigm may detect differences
in the activation of these systems. Our findings indicated an adequate activation of central
perceptional systems in response to preceding visceral stimuli as a possible mechanism in
the etiology of altered visceral perception in functional bowel disorders.
References
1) Bandier R., Shipley M.T., Trends Neurosci. 17 (1994) 379. 2) Yaksh T.L., Yeung J.C., Rudy T.A., Brain Res. 114 (1976) 83. 3) Christie M.J., Williams J.T., Osborne P.B., Bellchambers C.E., Trends Pharmacol. Sci. 18 I
(1997) 34. 4) Tanimoto S., Nakagawa T., Yamauchi Y., Min細川,M.,Satoh M., Eur. J. Neurosci. 18 (2003)
2343. 5) Harmer C.J., Thilo K.V., Rothwell J.C., Goodwin G.M., Nat. Neurosci. 4 (2001) 17. 6) Cipher DJ., Fernandez E., Behav. Res. Ther. 35 (1997) 437. 7) Rainville P., Duncan G.H., Price D.D., Carrier B., Bushnell M.C., Science 277 (1997) 968. 8) Ploghaus A., et al., Science 18 ( 1999) 1979. 9) Rainville P., Curr. Opin. Neurobiol. 12 (2002) 195. 10) Porro C.A., Cettolo V., Francescato M.P., Baraldi P., Neuroimage 19 (2003) 1738. 11) Fukudo S., et al., J. Gastroenterol. 37 (Suppl 14) (2002) 145. 12) Fukudo S., Nomura T., Hongo M., Gut. 42 ( 1998) 845. 13) Kanazawa M., Nomura T., Fukudo S., Hongo M., Neurogastroenterol. Motil. 12 (2000) 87.
133
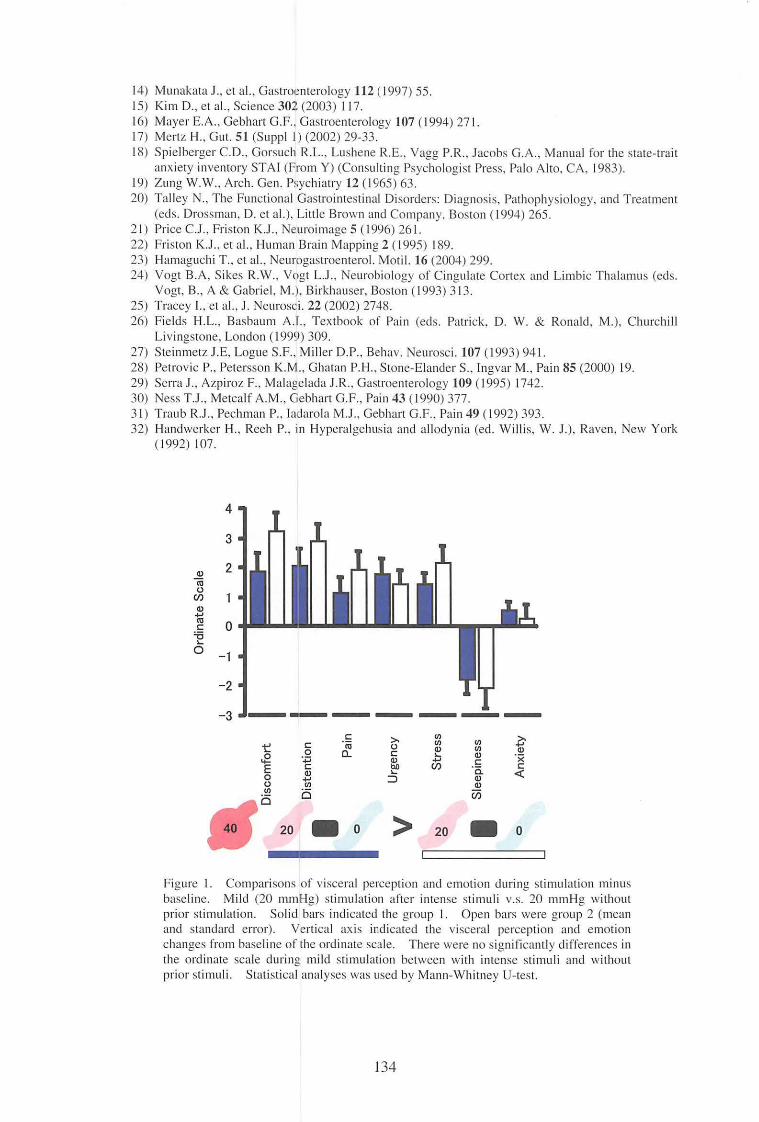
14) Munakata J ., et al., Gastroenterology 112 ( l 997) 55. 15) Kim D., et al., Scienc巴302(2003) 117. 16) May巴rE.A.’G巴l予hartG.F.『 Gastro巴nterology107 (1994) 271. . 17)札for H., Gut. 51 (Suppl I) (2002) 29-33. 18) Spielberg巴rC.D., Go1・suchR.L., Lushene R.E .. Vagg P.R., Jacobs G.A., Manual for the state-trait
anxiety inventory STAI (From Y) (Consulting Psychologist Press, Palo Alto, CA, 1983). 19) Zung W.W., Arch. Gen. Psychiatry 12 (1965) 63. 20) Talley N., The Functional Gastroint巴stinalDisorders: Diagnosis, Pathophysiology, and Treatment
(eds. Drossman, D. et al.), Little Brown and Company, Boston ( 1994) 265. 21) Pric巴C.J.,Friston K.J .. Neuroimage 5 ( 1996) 261. 22) Friston K.J .. et al., Human Brain Mapping 2 ( 1995) 189. 23) Hamaguchi T.. et al., Neurogastro巴nterol.Motil. 16 (2004) 299. 24) Vogt B.A, Sikes R.W .. Vogt L.J., Neurobiology of Cingulate Cortex and Limbic Thalamus (eds.
Vogt, B., A & Gabriel, M.), Birkhauser, Boston (1993) 313. 25) Tracey I.,巴Ial., J. Neurosci. 22 (2002) 2748. 26) Fields H.L., Basbaum A.I., Textbook of Pain (eds. Patrick, D. W. & Ronald, M.), Churchill
Li vi ngstone, London ( 1999) 309 27) Steinmetz j巳しogueS.F., Miller D.P., Behav. Neurosci. 107 (1993) 941. 28) Petrovic P .. Petersson K.M., Ghatan P.H., Ston巴ーElanclerS., lngvar M., Pain 85 (2000) 19. 29) Serra J., Azpiroz F., Malagelada J.R., Gastroenterology 109 (1995) 1742. 30) Ness T.J.. Metcalf A.M., Gebhart G.F., Pain 43 (1990) 377. 31) Traub R.J., Pechman P., Iadarola M.J .. Gebhart G.F., Pain 49 (1992) 393. 32) Handwerker H., Reeh P., in Hyperalgehusia and alloclynia (ed. Willis, W. J.). Raven, New York
( 1992) 107.
4
2
。
3
ω一旬。
ωω判悶
C一万』
O
一2
・・・・・・・・・・・・田・・・・・・・・・・・・・・・・・ .......... .......... .......... . .. 園田・・・・・
、22xc〈
目的
ωc一色ωω一
ω
的目
ω」一Fω
KAOCω凶」コ
C一何色cozcω
判的一。
ゼohFE00
凶一。
-3
。.. 20 〉。. 20
Figure I. Comparisons of visceral perc巴ptionand emotion during stimulation minus baseline. Mild (20 mmHg) stimulation after intense stimuli v.s. 20 mmHg without prior stimulation. Solid bars indicated the group I. Open bars wer巴group2 (mean and standard error). Vertical axis indicated the visceral perception and emotion changes from baseline of the ordinate scale. There were no significantly differences in the ordinate scale during mild stimulation between with int巴ns巴 stimuliand without prior stimuli. Statistical analyses was used by Mann-Whitn巴yU北 st.
134
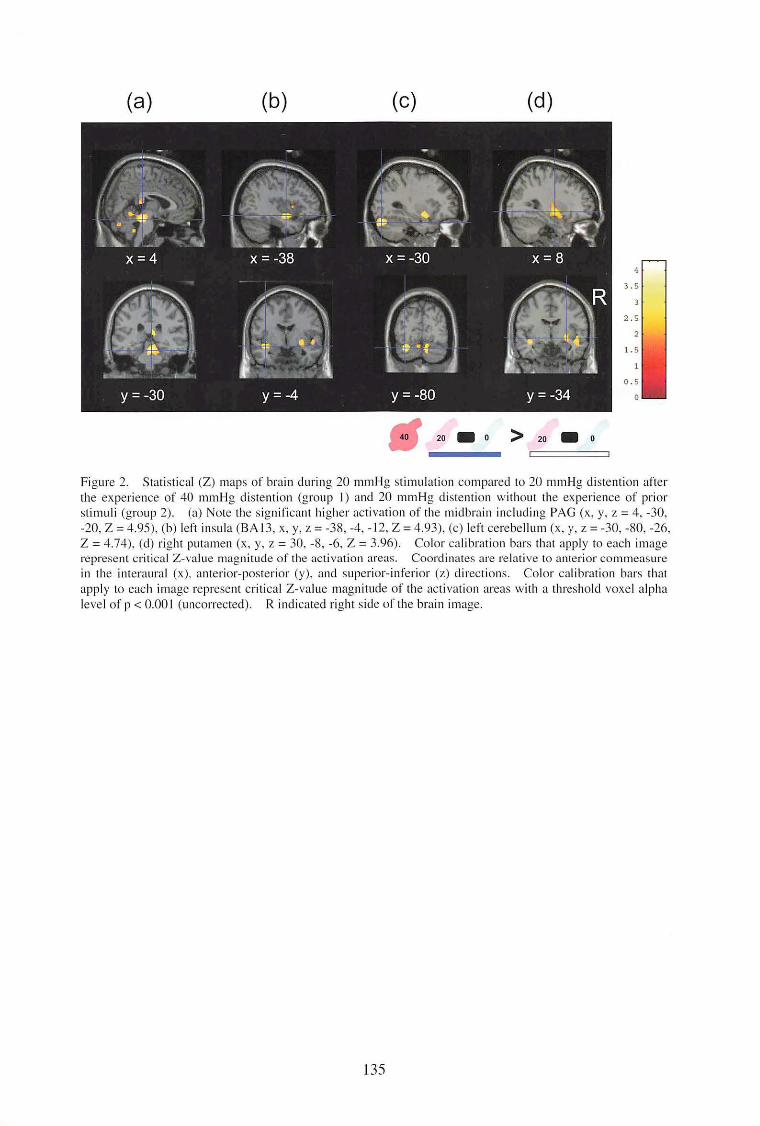
(a) 、、.,,,hu
’’a置、、 (c) (d)
3.5
民d
R
d
区J
、
,
‘
唱
よ
0.5
0
20 .。> 20 • 0
Figu1巴 2. Statistical (Z) maps of brain clur川g20 mmHg stimulation compared to 20 mmHg dist巴ntionafter
th巴 exp巴ri巴neeof 40 111111Hg distention (group I) and 20 mm Hg distention without th巴巴xperienceof prior
stimuli (group 2). (a) Note the significant higher activation of th巴midbrainincluding PAG (x, y, z = 4, -30. ・20,Z = 4.95), (b) I巴ftinsula (BA 13‘x, y, z =・38,-4,ー12,Z = 4.93), (c) left cerebellum (x. y, z = -30,ー80,-26, Z = 4.74). (d) right putamen (x, y, z = 30, -8, -6, Z = 3.96). Color calibration bars that apply to each image rep res巴ntcritical Z一、:aluemagnitude of the activation areas. Coordinates are relative to anterior commeasure
in the int巴raural(x)噌anterior-post巴lior (y), and sup巴rior-inf巴rior(z) di1・巴ctions. Color calibration bars that
apply to each image represent critical Z-value magnitude of the activation areas with a threshold vox巴lalpha
level of pく0.001(uncorrected). R indicat巴dright sid巴ofth巴brainimage.
135
VIII. 6.
CYRIC Annual Report 2005
Relationship between Brain Activity and Natural Killer Cell Activity in Patients with Cancer
Tashiro M.1, Kubota K.2, :Miyake M.1, Watanuki S.1, Kumano K.3, and ltoh M.1
ー 1Cyclotron and Radioisotope Center, Tohoku University
Introduction
.t: Division of Nu~lear Medicine and Radiology, International Medical Center of Japan "'Graduate School of Medicine, The University of Tokyo
Interaction between psychological factors and immune function in human has been
long discussed by various investigators I). Since psychological factors have been discussed
in association with the prognosis of cancer patients2・5>,explanation of how psychosocial
factors result in certain physical outcomes would be of clinical importance. Nowadays,
presence of psycho-neuro-immune (PNI) interaction seems to be doubtless, but its
mechanism is still to be investigated. One of the possible main pathways that mediate this
complex interaction would be the hypothalamic-pituitary-adrenal (HPA) axis. This
hypothesis, however, does not say anything about the roles of higher brain including
neocortex and limbic system. The cerebral co此exand limbic system should also be
included in the pathway of psycho-immune interactions since psychosocial events should
be first recognised and judged before they are felt“stressful”. Our preliminary report
already demonstrated that functional neuroimaging technique would be useful in clinical
research of PNI interaction though the number of subjects were rather small (n=8)6>. In
the present report, updated results with increased number of patients are demonstrated.
Methods
Subjects were 24 patients (mean age +/ー s.d.,62.5 +/ー 11.5)with cancers in v紅 ious
organs at various stages. The study protocol was approved by the Ethics Committee for
Clinical Research of Tohoku University and informed consent was obtained from each
patient. After in ection of [ 18F]fluorodeoxyglucose (FDG), patients were kept under
resting condition throughout uptake time and scanning periods. Details of the data
acquisition and analysis are given in our previous works7・8>. Natural killer cell activity
136
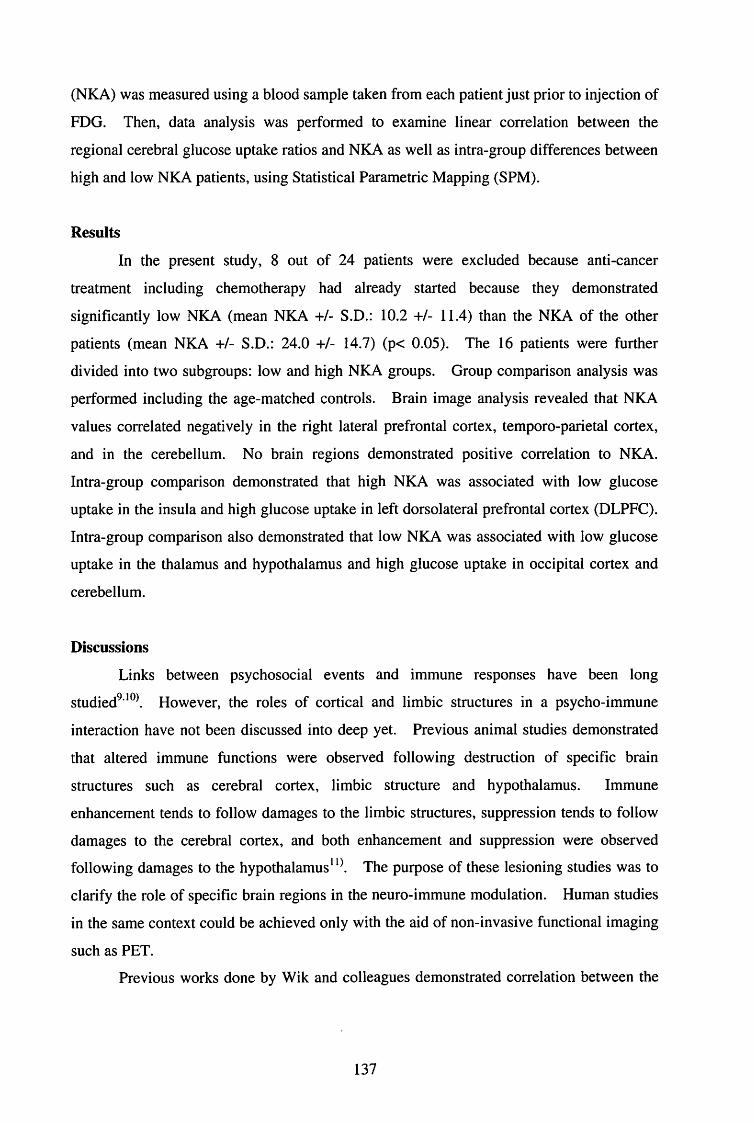
(NKA) was measured using a blood sample taken from each patient just prior to i吋ectionof
FDG. Then, data analysis was performed to examine linear correlation between the
regional cerebral glucose uptake ratios and NKA as well as intra-group differences between
high and low NKA patients, using Statistical Parametric Mapping (SPM).
Results
In the present study, 8 out of 24 patients were excluded because anti-cancer
treatment including chemotherapy had already started because they demonstrated
significantly low NKA (mean NKA +/ー S.D.:10.2 +/-11.4) than the NKA of the other
patients (mean NKA +/-S.D.: 24.0 +/-14.7) (p< 0.05). The 16 patients were further
divided into two subgroups: low and high NKA groups. Group comparison analysis was
performed including the age-matched controls. Brain image analysis revealed that NKA
values correlated negatively in the right lateral prefrontal cortex, temporo・p訂ietalcortex,
and in the cerebellum. No brain regions demonstrated positive correlation to NKA.
Intra-group comparison demonstrated that high NKA was associated with low glucose
uptake in the insula and high glucose uptake in left dorsolateral prefrontal cortex (DLPFC).
Intra-group comparison also demonstrated that low NKA was associated with low glucose
uptake in the thalamus and hypothalamus and high glucose uptake in occipital cortex and
cerebellum.
Discussions
Links between psychosocial events and immune responses have been long
studied9・10>. However, the roles of cortical and limbic structures in a psycho-immune
interaction have not been discussed into deep yet. Previous animal studies demonstrated
that altered immune functions were observed following destruction of specific brain
structures such as cerebral cortex, limbic structure and hypothalamus. Immune
enhancement tends to follow damages to the limbic structures, suppression tends to follow
damages to the cerebral cortex, and both enhancement and suppression were observed
following damages to the hypothalamus11>. The purpose of these lesioning studies was to
clarify the role of specific brain regions in the neuro-immune modulation. Human studies
in the same context could be achieved only with the aid of non-invasive functional imaging
such as PET.
Previous works done by Wik and colleagues demonstrated correlation between the
137
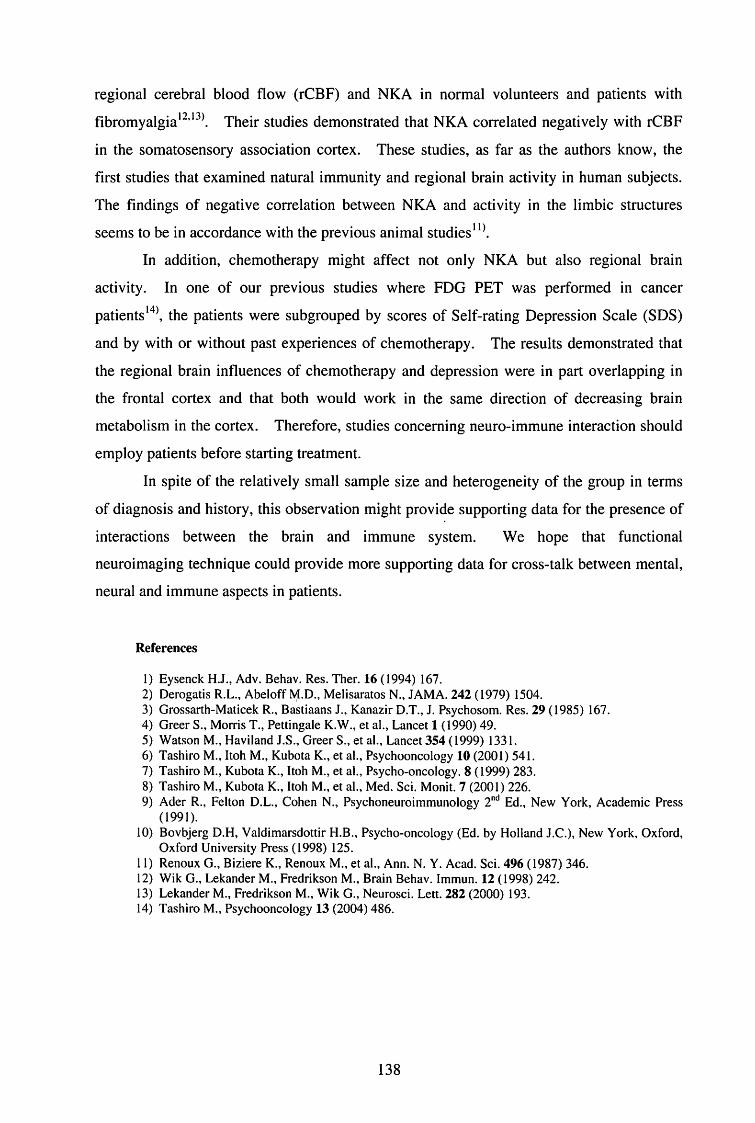
regional cerebral blood flow {rCBF) and NKA in normal volunteers and patients with
fibromyalgia12・13). Their studies demonstrated that NKA correlated negatively with rCBF
in the somatosensory association cortex. These studies, as far as the authors know, the
first studies that examined natural immunity and陀 gionalbrain activity in human subjects.
The findings of negative correlation between NKA and activity in the limbic structures
seems to be in accordance with the previous animal studies">.
In addition, chemotherapy might affect not only NKA but also regional brain
activity. In one of our previous studies where FDG PET was performed in cancer
patients14>, the patients were subgrouped by scores of Self-rating Depression Scale (SDS)
and by with or without past experiences of chemotherapy. The results demonstrated that
the regional brain influences of chemotherapy and depression were in part overlapping in
the frontal cortex and that both would work in the same direction of decreasing brain
metabolism in the cortex. Therefore, studies concerning neuro-immune interaction should
employ patients before starting treatment.
In spite of the relatively small sample size and heterogeneity of the group in terms
of diagnosis and history, this observation might provide supporting data for the presence of
interactions between the brain and immune system. We hope that functional
neuroimaging technique could provide more supporting data for cross-talk between mental,
neural and immune aspects in patients.
References
1) Eysenck H.J., Adv. Behav. Res. Tuer. 16 (1994) 167. 2) Derogatis R.L., Abeloff M.D., Melisaratos N., JAMA. 242 (1979) 1504. 3) Grossarth-Maticek R., Bastiaans J., Kanazir D.T., J. Psychosom. Res. 29 (1985) 167. 4) Greer S., Morris T., Pettingale K.W., et al., Lancet 1(1990)49. 5) Watson M., Haviland J.S叫 GreerS., et al., Lancet 354 ( 1999) 1331. 6) Tashiro M., ltoh M., Kubota K., et al., Psychooncology 10 (2001) 541. 7) Tashiro M., Kubota K., Itoh M., et al., Psycho-oncology. 8 (1999) 283. 8) Tashiro M., Kubota K., Itoh M., et al., Med. Sci. Monit. 7 (2001) 226. 9) Ader R., Felton D.L., Cohen N., Psychoneuroimmunology 2"d Ed., New York, Academic Press
(1991). 10) Bovbjerg D.H, Valdimarsdottir H.B., Psycho-oncology (Ed. by Holland J.C.), New York, Oxford,
Oxford University Press (1998) 125. 11) Renoux G., Biziere K., Renoux M., et al., Ann. N. Y. Acad. Sci. 496 (1987) 346. 12) Wik G叫 LekanderM., Fredrikson M., Brain Behav. Immun. 12 ( 1998) 242. 13) Lekander M., Fredrikson M., Wik G., Neurosci. Lett. 282 (2000) 193. 14) Tashiro M., Psychooncology 13 (2004) 486.
138
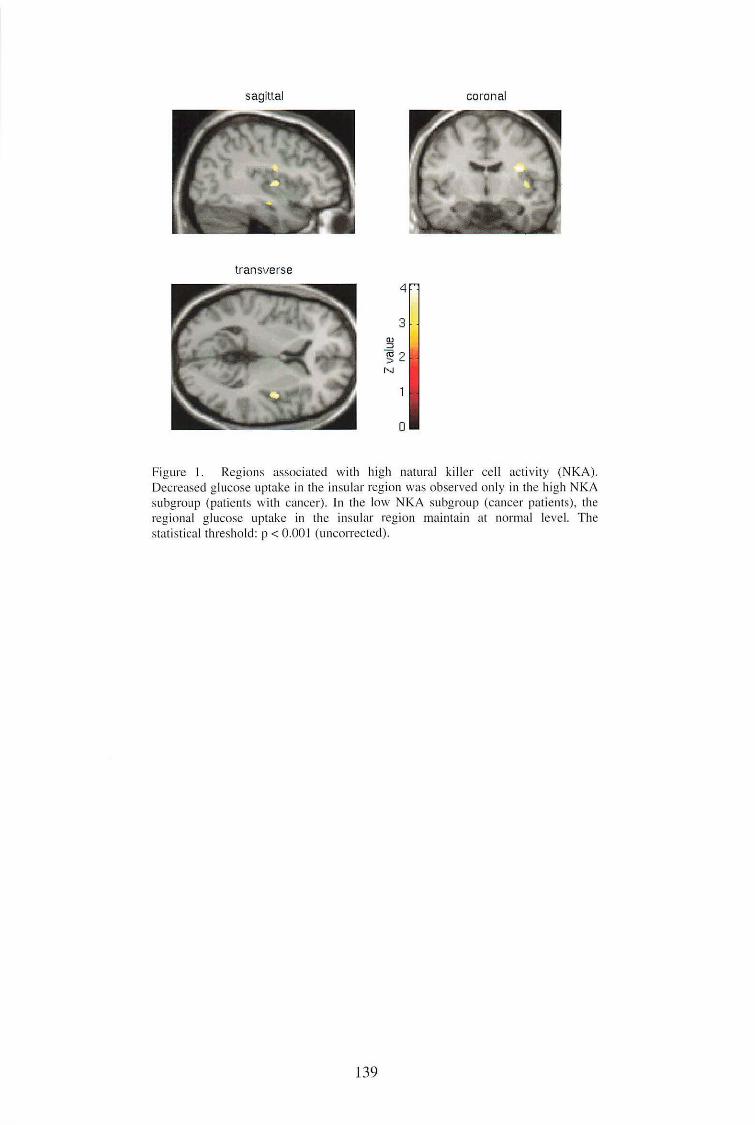
sagittal
transverse
coronal
4
3
円/』
ωコ一回〉
N
。
Figure I. R巴gionsassociated with high natural killer cell activity (NKA).
D巴creas巴dglucos巴uptak巳 inthe insular region was observed only in th巴highNKA
subgroup (patients with cancer). In the low NKA subgroup (cancer patients), the
1・巴gionalglucose uptake in the insular region maintain at normal level. The
statistical threshold: pく 0.00I (uncorrected).
139
CYR/C Annual Report 2005
VIII. 7. Reactivation of Medial Temporal Lobe and Occipital Lobe During the Retrieval of Color Information: a Positron Emission
Tomography Study
Ueno A. 1, Abe N. 1, Suzuki M. 1・2, Hirayama K. 1, Mori E. 1, Tashiro M. ~, Itoh M三andFujii T. 1
1 Graduate School of Medicine, Tohoku Universiη 2Cyclotron and Radioisotope Center, Tohoku University
Functional neuroimaging techniques such as positron emission tomography (PET)
and functional magnetic resonance imaging (fMRI) allow us to monitor the brain activity
associated with encoding and retrieval separately and to identify the brain regions
commonly activated during encoding and retrieval. However, to date, only a relatively
small number of neuroimaging studies have directly assessed whether the neural activity
elicited during encoding is reactivated during retrieval of the encoded information1・5).
The results of the previous studies indicate that some of the association cortices
activated during encoding紅 ealso activated (reactivated) during retrieval. With regard to
the reactivation of the MTL structures, the results of previous studies remain controversial.
Since there紅evarious constituents of the content of an event, it is worthwhile investigating
what circumstances lead to overlapping activation in the MTL and other association
cortices during both encoding and retrieval.
The present study further examined the reactivation hypothesis within the same
sensory modality (i.e., visual modality) by investigating the encoding and retrieval of color
information using PET. Specifically, the research question was whether overlapping
activity would be found in both the MTL and color-related cortical regions during the
encoding and retrieval of color information attached with meaningless shapes. In most
previous imaging studies relevant to the reactivation hypothesis, meaningful stimuli were
used. In the present study, completely arbitrary associative memory tasks between
meaningless shapes and colors were applied to avoid potential confounding of preexisting
binding between constituents of the memory content.
Subjects were presented with 20 stimuli (random shapes for the two encoding and
140
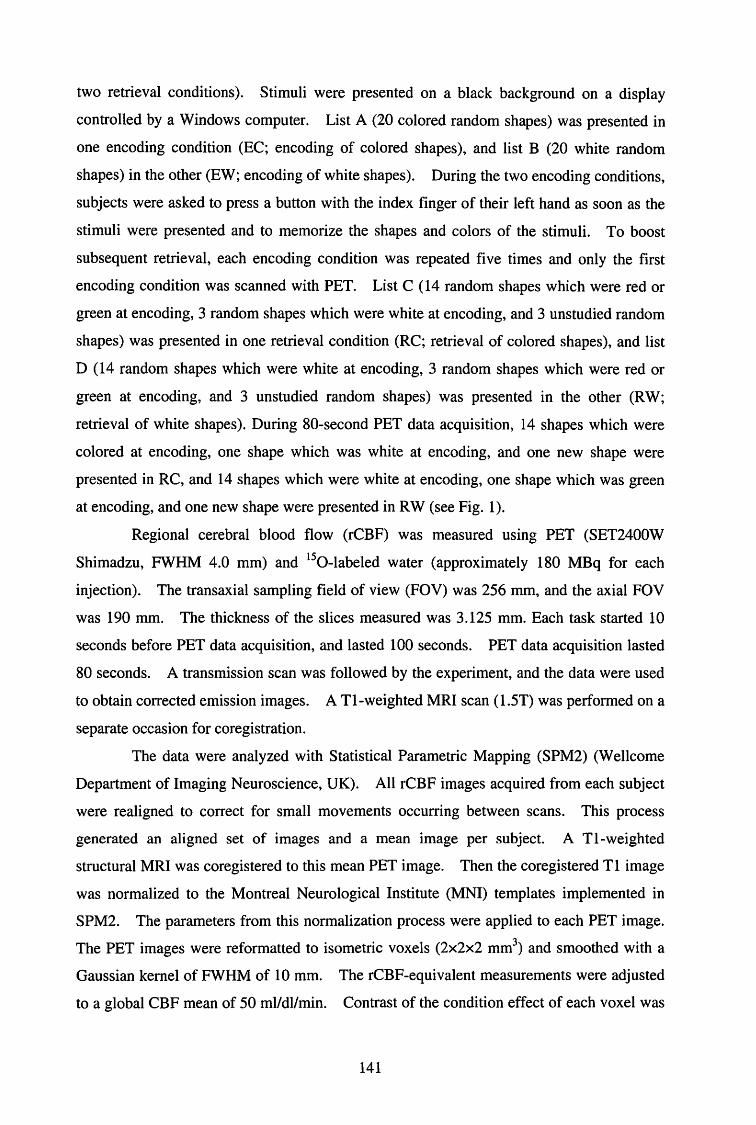
two retrieval conditions). Stimuli were presented on a black background on a display
con町olledby a Windows computer. List A (20 colored random shapes) was presented in
one encoding condition (EC; encoding of colored shapes), and list B (20 white random
shapes) in the other (EW; encoding of white shapes). During the two encoding conditions,
subjects were asked to press a button with the index finger of their left hand as soon as the
stimuli were presented and to memorize the shapes and colors of the stimuli. To boost
subsequent re凶eval,each encoding condition was repeated five times and only the first
encoding condition was scanned with PET. List C (14 random shapes which were red or
green at encoding, 3 random shapes which were white at encoding, and 3 unstudied random
shapes) was presented in one re凶evalcondition (RC; retrieval of colored shapes}, and list
D ( 14 random shapes which were white at encoding, 3 random shapes which were red or
green at encoding, and 3 unstudied random shapes) was presented in the other (RW;
retrieval of white shapes). During 80-second PET data acquisition, 14 shapes which were
colored at encoding, one shape which was white at encoding, and one new shape were
presented in RC, and 14 shapes which were white at encoding, one shape which was green
at encoding, and one new shape were presented in RW (see Fig. 1).
Regional cerebral blood flow (rCBF) was measured using PET (SET2400W
Shimadzu, FWHM 4.0 mm) and 150-labeled water (approximately 180 MBq for each
in ection). The transaxial sampling field of view (FOV) was 256 mm, and the axial FOV
was 190 mm. The thickness of the slices measured was 3.125 mm. Each task started 10
seconds before PET data acquisition, and lasted 100 seconds. PET data acquisition lasted
80 seconds. A transmission scan was followed by the experiment, and the data were used
to obtain corrected emission images. A Tl・weightedMRI scan ( l .5T) was performed on a
sep紅 ateoccasion for coregistration.
The data were analyzed with Statistical Parametric Mapping (SPM2) (Wellcome
Department of Imaging Neuroscience, UK). All rCBF images acquired from each subject
were realigned to co町ectfor small movements occurring between scans. This process
generated an aligned set of images and a mean image per subject. A Tトweighted
structural MRI was coregistered to this mean PET image. Then the coregistered T 1 image
was normalized to the Montreal Neurological Institute (MNI) templates implemented in
SPM2. The p紅白netersfrom this normalization process were applied to each PET image.
The PET images were reformatted to isometric voxels (2×2×2 mm3) and smoothed with a
Gaussian kernel of FWHM of 10 mm. The rCBF-equivalent measurements were adjusted
to a global CBF mean of 50 ml/dl/min. Contrast of the condition effect of each voxel was
141
assessed using t-statistics, resulting in a statistical image (SPMt transformed into an SPMz).
In both standard pairwise con凶 sts(i.e., EC vs. EW and RC vs. RW) and a cognitive
co吋unctionanalysis (i.e., EC vs. EW con unct with RC vs. RW)6>, the threshold of
significance was set at pく 0.001(uncorrected for multiple comparisons). To reduce the
possibility of false-positive results (Type 1 e町ors),we regarded clusters of 25 or more
voxels as signific加 t.
First, EC was comp紅 edwith EW. This contrast showed brain activations in the
bilateral occipital region, the left supramarginal gyrus, the left superior frontal gyrus, and
the left putamen. Second, RC was compared with RW. RC, relative to RW, was
associated with activations in the right lingual gyrus and the left middle occipital gyrus.
Finally, to determine whether brain regions activated during encoding were reactivated at
re凶eval,we used a conjunction analysis (EC vs. EW conjunct with RC vs. RW). This
analysis revealed that the right p紅油ippocampalgyrus, the right lingual gyrus, the right
inferior occipital gyrus, and the left putamen were active in both the encoding contrast and
the retrieval contrast (Table 1 and Fig. 2).
The results showed that overlapping activity was found in the MTL and the
occipital lobe (the lingual and inferior occipital gyri) in the right hemisphere during the
encoding and retrieval of meaningless shapes with color information compared with those
without color information. In EC all stimuli were colored shapes, and in EW all stimuli
were white shapes. By contrast, in both of the retrieval conditions (RC and RW) all
stimuli were white shapes. Therefore, encoding-related activations probably reflect the
on-line processing of color information from the external world (i.e., the process of actual
color perception) and binding it with shapes, whereas retrieval-related activity could not be
attributed to the on-line processing of color information from the external world but rather
to the process of retrieval of color information from the recognized shapes. Hence, this
finding supports the reactivation hypothesis that postulates that the retrieval of specific
event information is associated with the reactivation of both the MTL structures and regions
that were involved during encoding of the same information.
References
1) Nyberg L., Habib R., Mcintosh AR., Tulving E., Proc. Natl. Acad. Sci. USA 97 (2000) 11120. 2) Persson J., Nyberg L., Microsc. Res. Tech. SI (2000) 39. 3) Wheeler M.E., Petersen M.E., Buckner R.L., Proc. Natl. Acad. Sci. USA 97 (2000) 11125. 4) Nyberg L., Petersson K.M., Nilsson L.G., Sandblom J., Aberg C., Ingvar M., Neuroimage 14
(2001) 521. 5) Vaidya C.J., Zhao M., Desmond .JE., Gabrieli J.D.E., Neuropsychologia 40 (2002) 2136.
142
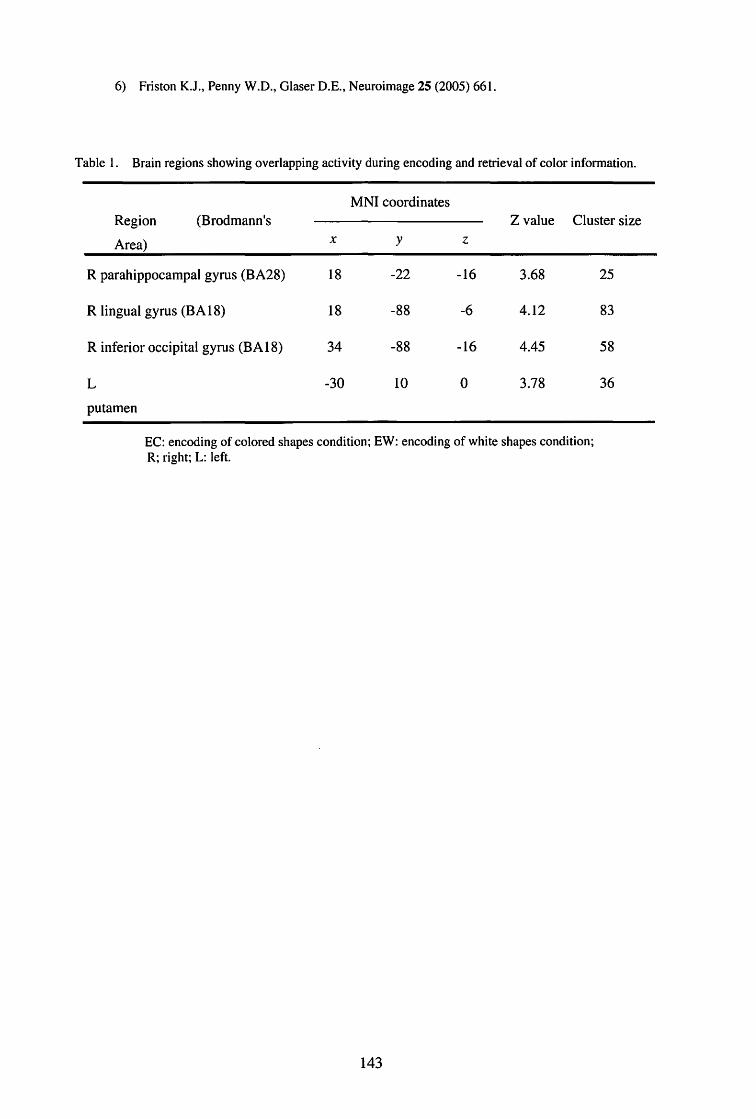
6) Friston K.J., Penny W.D., Glaser D.E., Neuroimage 25 (2005) 661.
Table 1. Brain regions showing overlapping activity durmg encoding and retrieval of color information.
MNI coordinates
Region (Brodmann’s Z value Cluster size
Area) x y z
R parahippocampal gyrus (BA28) 18 -22 -16 3.68 25
R lingual gyrus (BA18) 18 -88 -6 4.12 83
R inferior occipital gyrus (BA18) 34 -88 -16 4.45 58
L -30 10 。 3.78 36
putamen
EC: encoding of colored shapes condition; EW: encoding of white shapes condition; R; right; L: left.
143
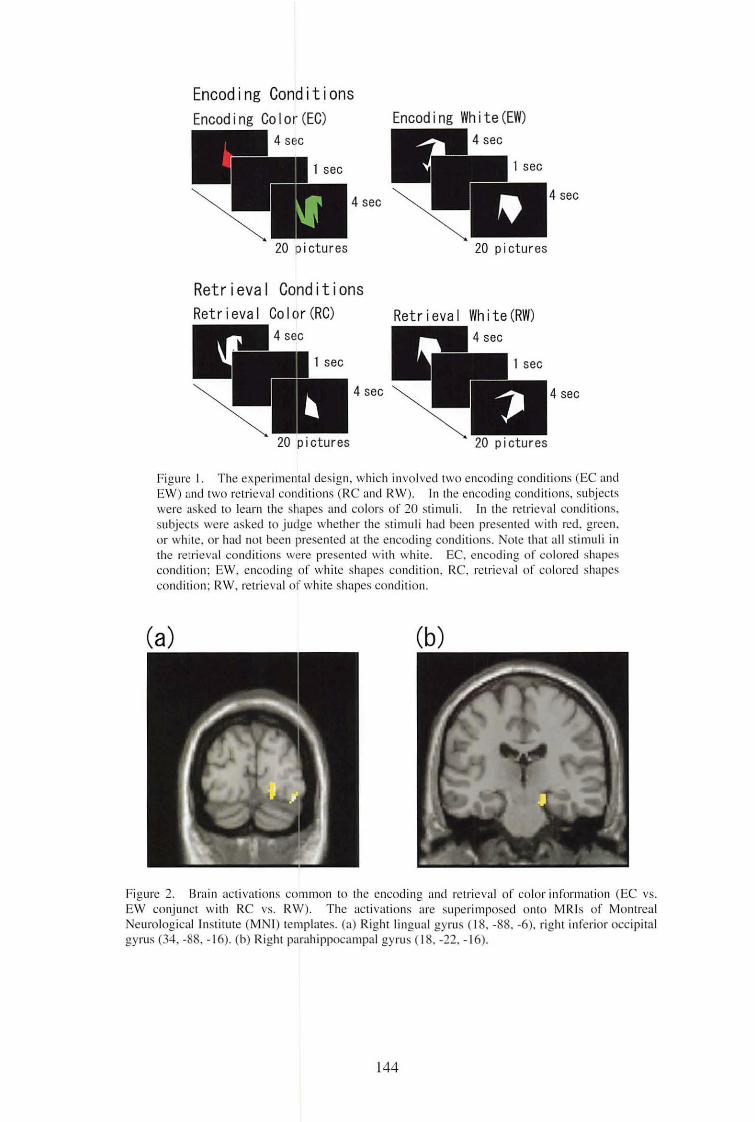
Encoding Conditions
Encoding Color(EC)
4 sec
20 pictures
Retrieval Conditions
Encod i ng Wh i te (EW)
4 sec
20 pictures
4 sec
20 pictures
Figure I. The experimental design, which involved two encoding conditions (EC and EW) and two retri巴valconditions (RC and RW). In the encoding conditions. subjects
were asked to learn the shapes and colors of 20 stimuli. In th巴retrievalconditions.
SU旬ectswere asked to judge whether the stimuli had been presented with 1吋.green.
or white. or had not been presented at the encoding conditions. Note that all stimuli in the retrieval conditions were presented with white. EC. encoding or colored shapes
condition; EW.巴ncodingof white shapes condition. RC, retrieval of colored shapes
condition; RW, retrieval of white shapes condition.
(a) 、、,,,,Enu ,,aE
、、
Figure 2. Brain activations common to th巴 encodingand retrieval of color information (EC vs.
EW COiリunctwith RC vs. RW). The activations are superimposed onto MRls of Montreal Neurological Institute (MNI) templates. (a) Right lingual gyrus ( 18. -88. -6). right inferior occipital
gyrus (34.・88.・16).(b) Right parahippocampal gyrus ( 18.・22.-16).
144

IX. RADIATION PROTECTION AND TRA町INGOF SAFETY HANDLING
CYRIC Annual Report 2005
IX. 1. Beginners Training for Safe Handling of Radiation and Radioisotopes in Tohoku University
BabαM, Miyata主, αndlwα!taR.
Cyclotron and Radioisotope Center, Tohoku University
During 2005, the beginners training for safe handling of radiation and radioisotopes
in Tohoku University was conducted in three courses as usual:
I) Radiation and Isotopes, 2) X-ray Machines and Electron Microscope, and 3) Synchrotron
Radiation (SOR). The training was held twice a year, May and November, under the help
for lectures and practice合omvarious departments and research institutes of the university.
Lectures in English which were started in November of 2002 were continued for
students and/or researchers who are not so familiar with Japanese language, by using PC
projector and text of copies of view graphs (English class). The membership of the
English class is increased markedly from the last year as shown later.
The training for ”Radiation and Radioisotopes”is for persons who use unshielded
radioisotopes and accelerators, and has been conducted from 1977. The contents of
lectures and practices are shown in Table I. The order and content of the lecture was
slightly modified from November aiming at better understanding by trainees: the lecture on
“the e妊ectof radiation on human" was moved to the second to give stronger motivation for
the training course and the following lectures. Along with the change, a new in仕oductory
lecture of“Introduction to radiation" was newly prepared as the first lecture to provide
knowledge required to understand the lecture of“the effect of radiation on human”. In the
fiscal year of 2005, the training was performed for 525 persons (38 persons in the English
class). The departments or institutes to which they belong are given in Table 2.
The training for”X-ray machines and electron microscopes" started at the end of
1983. The training is scheduled twice a year at the same time as that for”Radiation and
Radioisotopes". In this course, only lectures are given with no practice. The contents of
the lectures and the distributions of trainees are shown in Table 3 and Table 4, respectively.
The number of trainees was 478 (44 in the English class).
145

The training for the ”Synchrotron Radiation”began at the end of 1995. The
contents of the lectures are the same as those of the radiation and radioisotopes but no
practice. In 2004, the number of trainees of the SOR course was 94 (6 in the English
class).
Table 1. Contents of the lectures and practices for safe handling ofradiation and radioisotopes in 2005.
Lectures (one day) Hours
Introduction to radiation 0.5 E旺ectsof radiation on human 1.0
Radiation physics and measurements 1.0
Chemistry of radioisotopes 1.0 Radiological protection ordinance including video 1.5
Safe handling of radioisotopes 1.5
加一
ω一川一ω
Practices ( one day)
Treatment of unsealed radioactive solution
Measurement of surface contamination and decontamination
Table 2. Distribution of trainees for “Radiation and Radioisotopes”in 2005.
Department Staff Student Total English class
CYRIC 5 6 2
Medicine 18 53 71 5
Dentistry 。 11 11 。Pharmacy 。 57 57 5
Science 2 59 61 2
Engineering 4 80 84 8
Agriculture 80 81 3
Research Institutes 11 104 115 13
The others 。 。Total 37 450 487 38
146
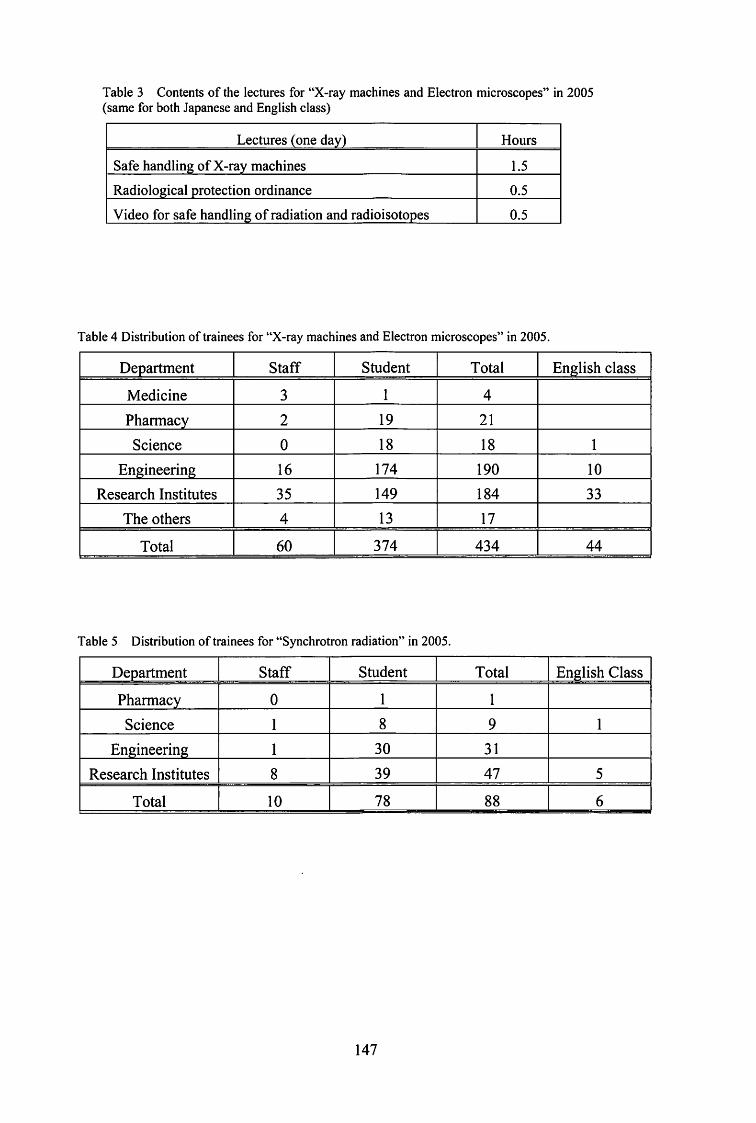
Table 3 Contents of the lectures for “X-ray machines and Electron microscopes" in 2005 (same for both Japanese and English class)
Lectures (one day) Hours
Safe handling of X-ray machines 1.5
Radiological protection ordinance 0.5
Video for safe handling of radiation and radioisotopes 0.5
Table 4 Distribution of trainees for“X-ray machines and Electron microscopes" in 2005.
Department Staff Student Total English class
Medicine 3 4
Pharmacy 2 19 21
Science 。 18 18
Engineering 16 174 190 10
Research Institutes 35 149 184 33
The others 4 13 17
Total 60 374 434 44
Table 5 Distribution of trainees for“Synchrotron radiation" in 2005.
Department Staff Student Total English Class
Pharmacy 。Science 8 9
Engineering 30 31
Research Institutes 8 39 47 5
Total 10 78 88 6
147
( 1) Overview
CYRICAnnuαi Report 2005
IX. 2. Ra~iation Protection and Management
Miyata T.1, Baba M1, and Nakae H.2
1 Cyclotron and Radioisotope Cente1:おhokuUniversity 2Japan Radiation Protection Co., Ltd.
During the fiscal year of 2005, research and education in the center were conducted
as active as usual.
New 7Li(p,n) neutron source installed at the 3・2course of CYRIC last year has
been used for ac旬alexperiments and proved very effective in study of neutron induced
cross -sections and irradiation of semiconductors devices. This source was designed to
achieve a highest level neutron flux over the world by enabling a short distance between
target and sample or detector down to one meter. Now the source is served to experiments
using mono-energy neutrons and semiconductor test experiments.
Last yea巳“P・rayanalysis room”in Radio Isope Room was converted into PET
Research Room to promote life science reaserch using PET and a y-camera. The 931 PET
placed in Research Building was moved to the room after conversion of the room and
approval of radiation licensing.
The new online radiation protection and management system of CYRIC which was
installed in 2002 worked fairly reliably except for some problems slowing down of the
system response when the data transfer rate is so high. The radiation detectors connected
with the monitoring system performed reliably too while one gamma detector should be
repaired.
Along with the change of organization of the university, measurement of
radioactivity concentration is continued periodically but the observed level was low enough
generally. Devices and gas counters with automatic sample changer for radioactivity
concentration measurement (samplers, α-~ automatic counters) we問 routinelyused without
serious problems by several radiation facilities in Tohoku University.
148

(2) Unsealed radio nuclides used in CYRIC
The species and amounts of unsealed radio nuclides handled in CYRIC during the
fiscal year of 2003 are summarized in Table 1. The table includes the isotopes produced
by the cyclotron as well as those purchased from the Japan Radio Isotope Association or
taken over合omother radioisotope institutes.
(3) Radiation exposure dose of individual worker
The exposure doses of the workers in CYRIC during 2005 are given in Table 2.
The doses were sufficiently lower than the legal dose limits.
( 4) Radiation monitoring of the workplace
Radiation dose rates inside and outside of the controlled areas in CYRIC were
monitored periodically and occasionally when needed. They were generally below the
legal dose limits although there are several “hot spots”in mSv/hr range like slits or beam
stopper and so on. Surface contamination levels of the floors inside the controlled areas
were also measured with a smear method and a survey meter method. They were under
the legal regulation levels.
(5) Wastes management
The radioactive wastes were delivered to the Japan Radio Isotope Association
twice in the fiscal year of 2005.
The concentration of radioisotopes in the air released from the stack after filtration
was monitored with stack gas monitors. The values on concentration were lower than the
legal regulation levels. The radioactive water was stocked in the ta凶csat least for 3 days
and then released to the sewerage after confirming that the concentration was lower than the
legal regulation levels.
Radioactive organic scintillator waste of 800 litter was treated by incinerator
provided by Fuji-kogyo Co.Ltd. The incinerator was overhauled last year.
149
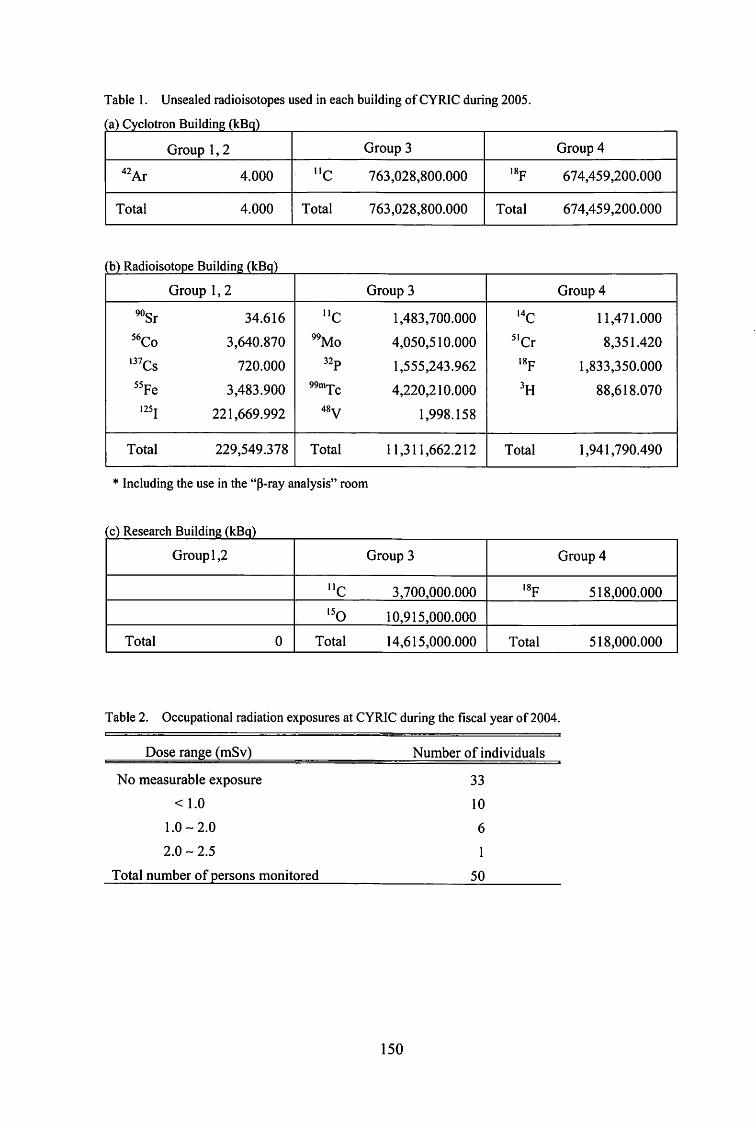
Table I. Unsealed radioisotopes used in each building of CYRIC during 2005.
a) Cyclotron Building (kBq)
Group l, 2 Group 3 Group 4
42Ar 4.000 uc 763,028,800.。。。 IBp 674,459,200.000
Total 4.000 Total 7 63 ,028,800.。。。 Total 674,459,200.000
b) Radioisotope Building (kBq)
Group l, 2 Group 3 Group 4
90Sr 34.616 lie 1,483,700.000 14c 11,471.000
s6Co 3,640.870 99Mo 4,050,510.000 s1cr 8,351.420
137Cs 720.000 32p 1,555,243.962 IBp 1,833,350.000
ssFe 3,483.900 99mTc 4,220,210.000 3H 88,618.070
221,669.992 48y 1,998.158
Total 229,549.378 Total 11,311,662.212 Total 1,941,790.490
* Including the use in the “P・rayanalysis" room
c) Research Building (kBq)
Groupl,2 Group 3 Group 4
lie 3,700,000.000 18p 518,000.000
150 10,915,000.000
Total 。Total 14,615,000.000 Total 518,000.000
Table 2. Occupational radiation exposures at CYRIC during the fiscal year of2004.
Dose range ( mSv)
No measurable exposure
< 1.0
1.0 -2.0
2.0~ 2.5
Total number of persons monitored
Number of individuals
3
0
6
1
0
3
1
5
150

X. PUBLICATIONS
CYRIC Annual Report 2005
X. PUBLICATIONS
[636] A New Passive Dosemeter Using an Imaging Plate and Annealing. Hiroko Ohuchi, Al<lra Yamadera, Mamoru Baba. Radioisotopes, 53 (2004) 115-122.
[637] Application of Imaging Plates to Cumulative Dosemeter for High X-ray Radiation Fields. H. Ohuchi, A. Yamadera. よNucl.Sci. Tech., Suppl. 4 (2004) 140-143.
[638] Measurement of Low-Level Radioactive Liquid Waste with Imaging Plates. H. Ohuchi, A. Yamadera, M. Baba. J. Nucl. Sci. Tech., Suppl. 4 (2004) 196・199.
[639] Measurement of the g-Factor of the 2T High-Spin Isomer State of 152Dy. M. Fujita, T. Endo, A. Yamazaki, T. Sonada, T. Miyake, E. Tanaka, T. Shinozuka, T. Suzuki, A. Goto, Y. Miyashita, N. Sato, Y. Wakabayashi, N. Hokoiwa, M. Kibe, Y. Gono, T. Fukuchi and A. Odahara. Hyperfine Interact .. , 159 (2004) 245・249.
[640] Upgraded sinusoidal beam chopping system at CYRIC. A. Terakawa, M. Tanigaki, K. Itoh, M. F吋ita,T. Shinozuka, H. Orihara. Nucl. Instrum. Methods .Phys. Res., A 538 (2005) 218-224.
[641] Preclinical and clinical evaluation of 0・[11C)methyl-L-tyrosine for tumor imaging by positron emission tomography. Kiichi Ishiwata, Hideo Tsukada, Kazuo Kubota, Tadashi Nariai, Norihiro Harada, Kazunori Kawamura, Yuichi Kimura, Keiichi Oda, Ren Iwata, Ke吋iIshii. Nucl. Med. Biol., 32 (2005) 253・262.
[642] Increased [18F]Fluorodeoxyglucose Accumulation in Right ventricular Free Wall in Patients with Pulmonary Hypertension and Effect of Epoprostenol. Minako Oikawa, Yutaka Kagaya, Hiraki Otani, Masahito Sakuma, Jun Demachi, Jun Suzuki, Tohru Takahashi, Jun Nawata, Tatsuo Ido, Jun Watanabe, Kunio Shirato. J. Amer. Coll. Cardiology, 45 (2005) 1849-1855.
[643~ Determination of the Gamow-Teller quenching factor from charge exchange reaction on 90Zr. K. Yako, H. Sakai, M.B. Greenfield, K. Hatanaka, M. Hatano, J. Kamiya, H. Kato, Y. Kitamura, Y. Maeda, C.L. Mo町is,H. Okamura, J. Rapaport, T. Saito, Y. Sakemi, K. Sekiguchi, Y. Shimizu, K. Suda, A. Tamii, N. Uchigashima, T. Wakase .. Phys. Lett., B615 (2005) 193-199.
151
[ 644] Response of a germanium detector to energetic heavy ions. R.T紘i,H. Okamura, N. Fukunishi, H. Ryuto, N. Sak創noto,K. Sekiguchi, A. Goto. Nucl. lnstrum. Methods .Phys. Res., A 545 (2005) 269・272.
[645] Classical conditioned response of rectosigmoid motility and regional cerebral in humans. M. Kanazawa, M. Endo, K. Yamaguchi, T. Hamaguchi, W.E. Whitehead, M. Itoh, and S. Fukudo. Neurogastr. Moti,l 11 (2005) 705・713.
[646] Resolving the Discrepancy of 135 MeV pd Elastic Scattering Cross Sections and Relativistic Effects. K. Sekiguchi, H. Sakai, H. Witala, W. Glockle, J. Golak, K. Hatanaka, M. Hatano, K. ltoh, H. Kamada, K. Kuboki, Y. Maeda, A. Nogga, H. Okamura, T. Saito, N. Sakamoto, Y. Sakemi, M. Sasano, Y. Shimizu, K. Suda, A. Tamii, T. Uesaka, T. Wakasa, and K. Yako. Phys. Rev. Lett., 95 (2005) 162301.
[647] Measurement of Neutron Emission Spectra in Li(d,xn) Reaction with Thick and Thin t訂getsfor 40・MeV Deuterons. M. Hagiwara, T. ltoga, N. Kawata, N. Hirabayashi, T. Oishi, T. Yamauchi, M. Baba, M. Sugimoto, T. Muroga .. Fusion Sci. Tech., 48 (2005) 1320由 1328.
[648] Microbeam Analysis at Tohoku University for Biological Studies. S. Matsuyama, K. Ishii, S. Abe, H. Ohtsu, H. Yamazaki, Y. Kikuchi, Ts. Amartaivan, K. Inomata, Y. Watanabe, A. lshizaki, Y. Barbotteau, A. Suzuki, T. Yamaguchi, G. Momose and H. Imaseki. Int. J. PIXE, 15 (2005) 41-45.
[649] Microbeam Analysis of Single Aerosol Particles at Tohoku University. S. Matsuyama, K. Ishii, H. Yamazaki, Y. Kikuchi, Ts. Amartaivan, S. Abe, K. lnomata, Y. Watanabe, A. Ishizaki, R. Oyama, Y. Kawamura, A. Suzuki, T. G. Momose T. Yamaguchi and H. Imaseki. Int. J. PIXE, 15 (2005) 257-262.
[650] Detection of nuclear de-exceitation gamma-rays in water Cherenkov detector. K. Kobayashi, Y. ltow, M. Shinozawa, M. Y osoi, H. Akimune, H.司iri,H. Fujimura, M. F吋iwara,K. Hara, K.Y. Hara, T. Ishikawa, M. ltoh, T. Kawabata, M. Nakamura, H. Sakaguchi, Y. Sakemi, H. Takeda, M. Uchida, T. Yamada, Y. Yasuda, H.P.Yoshida and R.G.T. Zegers. Nucl. Phys., B (Proc. Suppl.) 139 (2005) 72-76.
[651] Analyzing powers for exclusive ls112 proton knockout from light nuclei. T. Noro, T. Yonemura, S. Asaji, N.S. Chant, K. Fujita, Y. Hagihara, K. Hatanaka, G.C. Hillhouse, T. Ishida, M. ltoh, S. Kishi, M. Nakamura, Y. Nagasue, H. Sakaguchi, Y. Sakemi, Y. Shimizu, H. Takeda, Y. Tamesige, S. Terashima, M. Uchida, T. Wakasa, Y. Yasuda, H.P. Yoshida, and M. Yosoi. Phys. Rev., C 72 (2005) 041602.
152
[ 652] Automated prep紅ationof hypoxic cell marker [ 18F]FRP-170 by on-column hydrolysis. Y. Ishikawa, R. Iawata, S. Furumoto, Y. Takai. Appl. Radiat. /sot., 62 (2005) 705-710.
[653] Preclinical and clinical evaluation of 0-[11C]methyl-L-tyrosine for tumor imaging by positron emission tomography. K. Ishiwata, H. Tsukada, K. Kubota, T. Nariai, N. Harada, K. Kawamura, Y. Kimura, K. Oda, R. Iwata, and K. Ishii. Nucl. Med. Biol., 32 (2005) 253・262.
[654] Simple automated preparation of [11C]O・methyl-L-tyrosinefor routine clinical use. Y. Ishikawa, R. Iwata, S. Furumoto, C. Pascali, A. Bogni, K. Kubota and K. Ishiwata. Appl. Radiat. /sot., 63 (2005) 55・61.
[655] Use of reference tissue models for quantification of histamine Hl receptors in human brain by using posi町onemission tomography and [ 11C]doxepin. A. Suzuki, M. Tashiro, Y. Kimura, H. Mochizuki, K. Ishii, H. Watabe, K. Yanai, K. Ishiwata, K. Ishii. Ann. Nucl. Med., 19 (2005) 425・433.
[ 656] An experimental study on 0・[18F]fluoromethyl-L-tyrosine for differentiation between tumor and inflammatory tissues. M. Suzuki, K. Yamaguchi, G. Honda, R. Iwata, S. Furumoto, M. Jeong, H. Fukuda and M. Itoh. Ann. Nucl. Med., 19 (2005) 589-595.
[657] Histamine Hl receptors in schizophrenic patients measured by positron emission tomography. K. Iwabuchi, C. Ito, M. Tashiro, H. Mochizuki, M. Kato, M. Kano, K. Ishii, K. Ishiwata, M. ltoh, R. Iwata, H. Matsuoka, M. Sato and K. Yanai. Eur. Neuropsychopharmacol., 15 (2005) 185-191.
[658] Mild cognitive impairment after adjuvant chemotherapy in breast cancer patients-evaluation of appropriate research design and methodology to measure symptoms. T. Matsuda, T. Takayama, M. Tashiro, Y. Nakamura, Y. Ohashi, K. Shinozuma. Breast Cancer, 12 (2005) 279-287.
[ 659] Effects of fexofenadine and hydroxyzine on brake reaction time during car-driving with cellular phone use. M. Tashiro, E. Horikawa, H. Mochizuki, Y. Sakurada, M. Kato, T. Inokuchi, F. Ridout, I. Hindmarch, K. Yanai. Hum. Psychopharmacol., 20 (2005) 501-509.
[660] The neural correlates of driving performance identified using positron emission tomography. E. Horikawa, N. Okamura, M. Tashiro, Y. Sakurada, M. Maruyama, H. Arai, K. Yamaguchi, H. Sasaki, K. Yanai, M. Itoh. Brain Cogn., 585 (2005) 166・171.
153

XI. MEMBERS OF COMl¥但TTEE

CYRJC Annual R句port2005
XI. MEMBERS OF COMMITTEE (as of Jan. 1, 2006)
General
(Chairman) Keizo Ishii (Graduate School of Engineering)
Tetsuo Shoji (Executive Vice President)
Osamu Hashimoto (Graduate School of Science)
Kazuaki Iwasa (Graduate School of Science)
Akira Takahashi (Graduate School of Medicine)
Ke ii chi Sasaki (Graduate School of Dentistry)
Koji Fukunaga (Graduate School of Pharmaceutical Sciences)
Katsunori Abe (Graduate School of Engineering)
Ryoichi Katsumata (Graduate School of Agricultural Science)
K鉱山iko Nishitani (Graduate School of Life Science)
Isamu Sato (Institute for Materials Research)
Hiroshi F叫ruda (Institute for Development, Aging and Cancer)
Osamu Tochiyama (Institute of Multidisciplinary Research for
advanced Materials)
Syoki Takahashi (University Hospital)
Jirohta Kasagi (Laboratory of Nuclear Science)
Tatsuo Ido (CYRIC)
Masatoshi ltoh (CYRIC)
Mamoru Baba (CYRIC)
Ren Iwata (CYRIC)
Hiro戸水i Okamura (CYRIC)
Tsu to mu Shinozuka (CYRIC)
Toshio Kobayashi (Graduate School of Science)
Kazuhiko Yanai (Graduate School of Medicine)
Tetsuya Ono (Radiation Safety Committee, Research
Promotion Council)
(Observer) Ryuko Yoshida (Head of Administration Office, Graduate School of Information Science)
155

Cyclotron
(Chairman) Hiro抑止i Okamura (CYRIC)
Osamu Hashimoto (Graduate School of Science)
Toshio Kobayashi (Graduate School of Science)
Hideya Onodera (Graduate School of Science)
Tsutomu Sekine (Centre for the Advancement of Higher
Education)
Kazushige Maeda (Graduate School of Science)
Hirokazu Tamura (Graduate School of Science)
Keizo Ishii (Graduate School of Engineering)
Akira Hasegawa (Graduate School of Engineering)
Isamu Sato (Institute for Materials Research)
Masao Saitoh (Institute of Multidisciplinary Research for
advanced Materials)
Tsutomu Otsuki (Laboratory of Nuclear Science)
Masatoshi ltoh (CYRIC)
Mamoru Baba (CYRIC)
Ren Iwata (CYRIC)
Tsutomu Shinozuka (CYRIC)
Radiation Protection and Training of Safe Handling
(Chairman) Mamoru Baba (CY悶C)
K位 uaki Iwasa (Graduate School of Science)
Yoshihiko Uehara (Graduate School of Medicine)
Yasushi Yamazoe (Graduate School of Pharmaceutical
Sciences)
Keizo Ishii (Graduate School of Engineering)
Toshiyasu Yamaguchi (Graduate School of Agricultural Science)
Kazuhiro Sogawa (Graduate School of Life Science)
Masayuki Hasegawa (Institute for Materials Research)
Hiroshi Fukuda (Institu句お1rDevelopmentヲAgingand Cancer)
Tomohiro Kaneta (University Hospital)
Tsutomu Shinozuka (CYRIC)
156

Life Science
(Chairman) Masatoshi Itoh (CYRIC)
Noriaki Ohuchi (Graduate School of Medic泊e)
Shogo Yamada (Graduate School of Medicine)
Syoki Takahashi (Graduate School of Medicine)
Teiji Tominaga (Graduate School of Medicine)
Masahiko Yamamoto (Graduate School of Medicine)
Yukitsuka Kudo (Biomedical Engineering Research
Organization)
Makoto Watanabe (Graduate School of Dentistry)
Sumio Oh印刷 (Graduate School, Division of
Pharmaceutical Sciences)
Keizo Ishii (Graduate School of Engineering)
Kazuo Yamamoto (Graduate School of Life Science)
Hiroshi Fukuda (Ins帥 tefor Development, Aging and Cancぽ)
Junie hi Gotoh (University Hospital)
Yoshihiro Takai (College of Medical Sciences)
Ren Iwata (CYRIC)
Mana bu Tashiro (CYRIC)
Yoshihito Funaki (CYRIC)
Prevention of Radiation Hazards
(Chairman) Mamoru Baba (CYRIC)
Osamu Hashimoto (Graduate School of Science)
Tsutomu Se kine (Graduate School of Science)
Keizo Ishii (Graduate School of Engineering)
Ren Iwata (CYRIC)
Tsutomu Shinozuka (CY則 C)
Masashi Koseki (CYRIC)
Takamoto Miyata (CYRIC)
157

Research Program
(Chairman) Mamoru Baba (CYRIC)
Masatoshi ltoh (CYRIC)
Ren Iwata (CYRIC)
Hiroyuki Okamura (CYRIC)
Tsutomu Shinozuka (CYRIC)
Osamu Hashimoto (Graduate School of Science)
Tsutomu Se kine (Centre for the Advancement of Higher
Education)
Kazuhiko Yanai (Graduate School of Medicine)
Akira Takahashi (Graduate School of Medicine)
Katsunori Abe (Graduate School of Engineering)
Hiromichi Yamazaki (Graduate School of Engineering)
Isamu Sato (Institute for Materials Research)
Hiroshi Fukuda (Institute for Development, Aging and Cancer)
Syoki Takahashi (University Hospi旬1)
Jirohta Kasagi (Laboratory of Nuclear Science)
Toshio Kobayashi (Graduate School of Science)
Kazushige Maeda (Graduate School of Science)
Hirokazu Tamura (Graduate School of Science)
158

XII. STAFF

XII. STAFF (as of Jan. I, 2006)
Director Keizo Ishii
Division of Accelerator
Osamu Hashimoto 1 >
Tsu to mu Shinozuka
Takashi Wakui
Mi白戸l Ukai
Akiyoshi Yamazaki
Shizuo Chiba5>
Yasuaki Ohmiya5>
Naoto Takahashi 5>
Shigenaga Yokokawa5>
Akihiko Matsumura5>
Takaaki Nakahara5>
Division of Instrumentations
Hiroyuki Okamura
Toshio Kobayashi 1 >
Hikonojo Orihara4>
Masatoshi Itoh
Sho・ichi Watanuki
Kazutaka Ohzeki
Division of Radiopharmaceutical Chemistry
Ren
Yukitsuka
Yoshihito
Yohichi
Shozo
Iwata
Kudo3>
Funaki
Ishikawa
Furn町1oto3>
159
CYRIC Annual Report 2005

Division of Cyclotron Nuclear Medicine
Masatoshi Itoh
Kazuhiko Yanai2>
Keiichiro Yamaguchi4>
Kohichiro Kawashima4>
Mana bu Tashiro
Masayasu Miyake
Maki Suzuki
Kazuaki Kumagai
Kyokutoh Dan
Mehedi Masud
Sabina Khond Kar
Manami Suzuki
Goh Honda
Takehisa Sasaki
Targino Rodrigues Dos Santos
Division of Radiation Protection and Safety Control
Mamoru Baba
Takashi Nakamura4>
Takamoto
Morio
Hirokazu
MYNN
陶h6e戸ωb
Graduate Student and Researcher
Tomokazu Suzuki
Yuてji Miyashita
Nozomi Sato
Miharu Ohkuma
Naoya Sugimoto
Shin go Fukushima
Tomohiro Terazono
Ryo Matsuo
160
(Graduate School of Science)
(Graduate School of Science)
(Graduate School of Science)
(Graduate School of Science)
(Graduate School of Science)
(Graduate School of Science)
(Graduate School of Science)
(Graduate School of Science)

Kimihiko Sato (Gr叫ua低SchooiDi吋sionofPham盟関凶回lScien錨)
Yoshio Honda (Gr袖 1御 Schooirn市 onofP凶nna閃叫剖Scien錨)
Akihiro Sugawara (Graduate School, Division of Medicine)
Margaretha Sulistyoningsih( Graduate School of Engineering)
Masayuki Hagiwara (Graduate School of Engineering)
Toshiro ltoga (Graduate School of Engineering)
Takuji Ohishi (Graduate School of Engineering)
Mohammad Nakhostin (Graduate School of Engineering)
Akram Mohammadi (Graduate School of Engineering)
Takashi Sasaki (Graduate School of Engineering)
Takahiro Makino (Graduate School of Engineering)
Yasuhiro Unno (Graduate School of Engineering)
Soh Kama ta (Graduate School of Engineering)
Wataru Takahashi (Graduate School of Engineering)
Office Staff
Ryuko
Masashi
a
o
y
k
O
D
u
内
川
崎
’
u
n
P
3
nu
-6E島
町
uuu
T
Y
M
Kyoko
Fumiko
Masakatsu
Kietu
Kimiko
Asami
Yoshiro
Ai
Shurikeiko
Yoshida
Koseki
Yonezawa
Yamashita
Endo
Fujisawa
Mayama
ltoh
Takahashi
Abe
Sawada
Sukegawa
Endo
Fujimoto
I) Graduate School of Science
2) Graduate School of Medicine
3) TUBERO 4) Visiting Professor
5) SU恥fl-JUAccelerator Service Ltd.
6) Japan Radiation Protection Co., Ltd.
161
.・・司 ・ e・' :•·:· . ・一・..・ ' ・一 •.
.
’
」
’
.,.- !
| .
,‘
,
.
-a ..
..
. ,.
・,/.ーー
.
a .
a .
.. , . ・・ .
,. .一一・ ,, . A・. ・・;: • ~ l 'cd
』‘ .
--- BY
・.
.
’
o
’
.
,
a
.. --
-d
i;
--
L
1
・..
. .
1 ・
4
・.
4
‘
‘
. .
’
-- tt !・
.
J・l
, .
, .
3
・副
司・py-
--- ,d,
.
0【
.
-
a
’’ ,.
,
‘
1
}
.
4
. .
..
~ • ) ;1 ' ".'! • ~ . 一日
-
IF
-
-
-- . ,
司
ar ..
・ザ
•. ’ ・・・・」‘ も ι •• :
p’', I
Ir' • _4 ' . ,. ,,
白
.
.
1A .
’. 』
..
..
.
、A,
ζ.. ’ 4 干.、·~· : ' .一,-一. ι., . ー・-・ 、 ・↓ 一ー
l
-
-
e-
I .
e
・-、,
-
0
・E
,
p
・・
. 1J.
-
.::
1・.,.‘
'
•I 1.
c • .→』...一
, .
.
1a ii
,Z
7
・、
一、 J.
. '
! ’
.
.
’J
白-司1
7
付行
.・4・・2,’
,!;
1・
r
・1
・
'.
. '
、, z
. .・'・.
.. ’ a