Embed Size (px)
Citation preview
1
Workforce Investment Act
PY 2015
Annual Report Narrative
2
Contents:
SECTION ONE
Introduction……………………………….…………………………………………………………………………….…………………………3
Highlights………………………………………………………………………………………………………….…………………………..……3
Sector Strategies……………………………………………………………………………..………………….………………………………4
Rapid Response Training Summary……………………………………………………….…………………………………………...6
SECTION TWO
Program Performance and Participant Information………………………………………………………………………….…9
Customer Satisfaction Data…………………………………………………………………………………………………………….…16
State Evaluation Activities………………………………………………………………………………………………………………...19
Cost of Workforce Investment Activities…………………………………………………………………………………………...21
Uniform Reporting…………………………………………………………………………………………………………………………….22
Waivers…………………………………………………………………………………………………………………………………………….23
Additional agency and organization information…………………………………………………………………………….…24
3
SECTION ONE
Introduction Program Year 2015* was busy for the workforce system in the State of Oregon. The Workforce Innovation and Opportunity Act (WIOA) was signed into law on July 22, 2014, and many aspects of the Act took effect beginning July 1, 2015. It is the first legislative reform of the public workforce system in 15 years, and has wide-ranging implications for nearly everyone involved with the workforce system. The successful transition from the WIA to WIOA was an overarching priority, influencing all activities during the year. However, Oregon continued to innovate, implement new, successful programs, and realize significant accomplishment during the program year in addition to the implementation of WIOA. The first section of this report highlights a few of the many successes, innovations, and accomplishments during PY 2015; the latter section includes specific program and performance-related topics.
Highlights In March 2014, the Governor issued a letter inviting Local Workforce Boards and chief local elected officials to consider realigning local workforce investment area boundaries. By the time the process was completed, 30 of the 36 counties in Oregon experienced changes to their local area configuration – as Oregon transitioned from seven local workforce investment areas (LWAs) to nine LWAs. These new areas (and the boards that serve and support them) were established and formally recognized on July 1, 2015, and required a significant amount of effort locally and at the state level during PY 2015 to stand them up successfully. The Oregon Workforce Investment Board (OWIB) and the Office of Community Colleges and Workforce Development (CCWD) held a series of Community Forums at nine locations throughout Oregon. With approximately 700 business and local government representatives attending various urban and rural forums, the OWIB was able to gather valuable stakeholder feedback for its Strategic Plan and the Oregon Unified State Plan, both developed during PY 2015. The WorkSource Oregon (WSO) Operational Standards were finalized and informational presentations
were held at WSO Centers around the State. The Standards provide the minimum-level
content/services(s) required to be available at all WSO centers. They also build-in an accountability
mechanism to ensure that this effort will come to fruition across the entire state. Finally, they offer an
opportunity to work together to continually improve the system, engage new partners, and better serve
Oregon’s job seekers, workers and businesses. Read the WSO Operational Standards here:
http://wsostandards.weebly.com/read-the-worksource-oregon-operational-standards-here.html
The Oregon Talent Council was formed by the legislature, and members were appointed by the Director
of the Oregon Employment Department (OED). The Oregon Talent Plan was adopted and a total of $3.4
million in grants were awarded during PY 2015 for nine projects that met the urgent talent needs
identified by the Council in the Talent Plan.
*(Program Year 2015 = July 1, 2015 through June 30, 2016. Also referred to as PY 2015, or PY15)
4
Grants Received:
The American Apprenticeship Grant ($3 million), received from the Department of Labor (DOL)
in October 2015, focuses on expanding and creating new apprenticeships in advanced
manufacturing.
Sector Partnership National Emergency Grant. In June 2014, the Office of Community Colleges
and Workforce Development Dislocated Worker Unit applied for and received a $6,764,526 US
DOL/ETA Sector Partnership National Emergency Grant to implement statewide initiatives that
will enable Oregon’s Workforce Regions to support eligible dislocated workers in the attainment
of the skills they need to pursue new employment opportunities within the state’s in-demand,
sector-driven occupations. Sector partnership efforts increased throughout Program Year 2015.
Back to Work Oregon, launched in 2011, is still assisting job seekers and employers – and support
continues to grow. The program consists of two components: On-the-Job Training (OJT) and Oregon’s
National Career Readiness Certificate (NCRC). Since its inception, the program has been resourced with
more than $10 million from the Oregon Legislature, matched by Oregon’s Local Workforce Investment
Boards (LWIBs), and supported by the Oregon Employment Department.
To date, 2,694 state-funded OJTs have been completed, which has been matched by the LWIBs
with an additional 2,483 OJTs, for a total of 5,177 Oregonians into OJTs. Of the total OJTs
completed, more than 46% of participants have earned a National Career Readiness
Certificate.
For every OJT opportunity funded with state general funds, the LWIBs have leveraged funds to
contribute a one-to-one match.
Oregonians continue to assess and certify their work-readiness skills with the National Career Readiness
Certificate, with a total of 57,627 issued to date.
The Oregon legislature approved a $10.9 million general fund investment to support workforce
development.
Sector Strategies
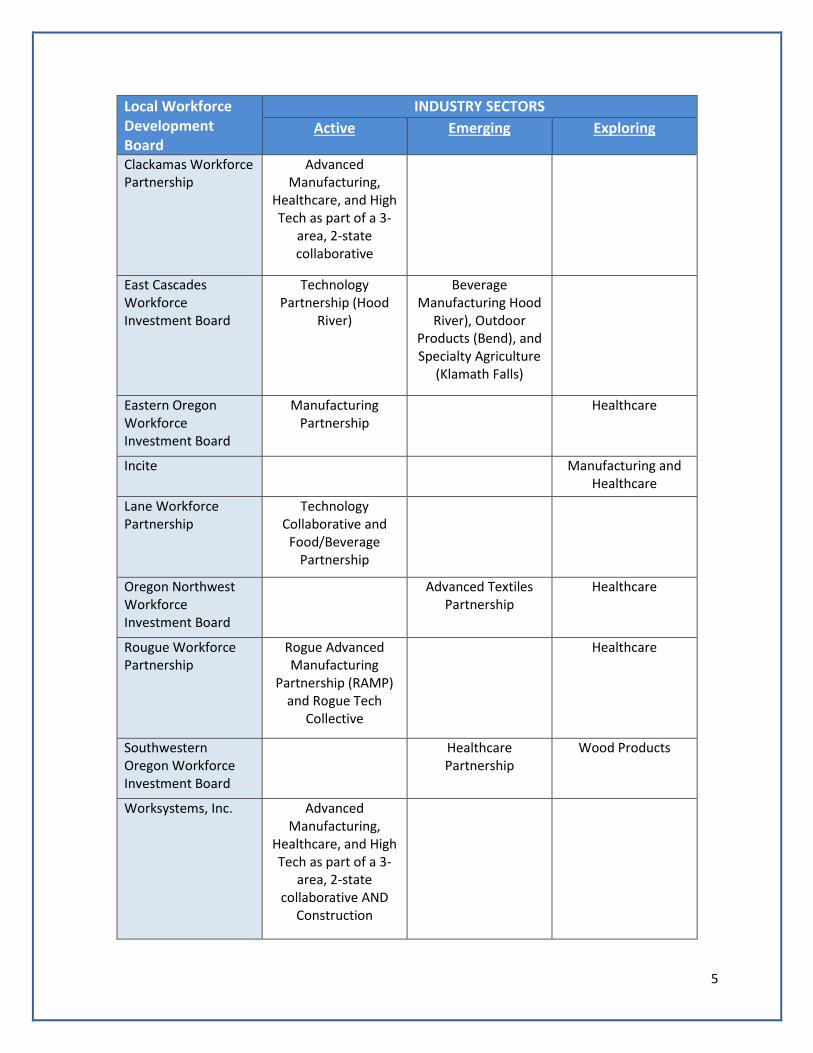
By the close of PY 2015, all Local Workforce Investment Boards* (LWIBs) in Oregon were pursuing sector strategies. Sector strategy has been a statewide priority since 2012, when it was included in the Oregon Workforce Development Strategic Plan, and Oregon will continue to expand and innovate going forward. The array of engagement by LWIBs is outlined in the following table. Recently, the Lane Workforce Partnership’s Technology Collaborative was recognized in ETA Sector Strategies Technical Assistance Initiative: Workforce Boards as Sector Intermediaries reflecting significant work and progress during PY 2015. In addition, the Office of Community Colleges and Workforce Development and the OWIB also hosted two statewide training events on sector strategies and the state technical assistance team has supported LWIBs to launch multiple local sector partnerships across the state.
*(Under WIOA, LWIBs are referred to as Local Workforce Development Boards or LWDBs).
5
Local Workforce Development Board
INDUSTRY SECTORS
Active Emerging Exploring
Clackamas Workforce Partnership
Advanced Manufacturing,
Healthcare, and High Tech as part of a 3-
area, 2-state collaborative
East Cascades Workforce Investment Board
Technology Partnership (Hood
River)
Beverage Manufacturing Hood
River), Outdoor Products (Bend), and Specialty Agriculture
(Klamath Falls)
Eastern Oregon Workforce Investment Board
Manufacturing Partnership
Healthcare
Incite Manufacturing and Healthcare
Lane Workforce Partnership
Technology Collaborative and
Food/Beverage Partnership
Oregon Northwest Workforce Investment Board
Advanced Textiles Partnership
Healthcare
Rougue Workforce Partnership
Rogue Advanced Manufacturing
Partnership (RAMP) and Rogue Tech
Collective
Healthcare
Southwestern Oregon Workforce Investment Board
Healthcare Partnership
Wood Products
Worksystems, Inc. Advanced Manufacturing,
Healthcare, and High Tech as part of a 3-
area, 2-state collaborative AND
Construction
6
Rapid Response Training Summary
The Oregon Dislocated Worker Unit, Office of Community Colleges and Workforce Development, Higher Education Coordinating Commission provided Rapid Response Training across Oregon between February and September 2016.
15 training sessions 180 participants 8 locations
The Oregon Dislocated Worker Unit brought together local workforce areas’ Rapid Response staff and partners, including Local Workforce Development Board Directors, Oregon Employment Department (OED) Managers, Dislocated Worker Liaisons, Rapid Response Coordinators, and Trade Act Navigators. This training set the groundwork for moving forward with WIOA, providing the same foundational message and the same new Dislocated Worker Unit materials to local areas, and this collaboration provided a unique opportunity for staff from each area to learn from each other and interact together.
The Rapid Response training expanded as additional partners requested the training. In addition to the groups listed above, OED Supervisors, the Business Services Team in the Portland area, and all WorkSource Eastern Oregon staff and partners, including Department of Human Services staff and Veterans’ Representatives attended training sessions. The Oregon Dislocated Worker Unit adopted the Practitioner’s Guide to Rapid Response, produced by the United States Department of Labor, as the foundational base for Rapid Response in Oregon. Over 140 copies of the guide were provided to staff across the state with the promise of the guide being a living document; as updates are made to the guide, the Oregon Dislocated Worker Unit will pass on those updates. The training materials developed for the Rapid Response Training were pulled from material provided for in the Practitioner’s Guide to Rapid Response “Doing the Job” section. The training material covered these main areas:
1. Overview of Oregon’s Rapid Response Framework, the items moving from a MAY to a MUST moving from WIA to WIAO, Rapid Response Self-Assessment Tool
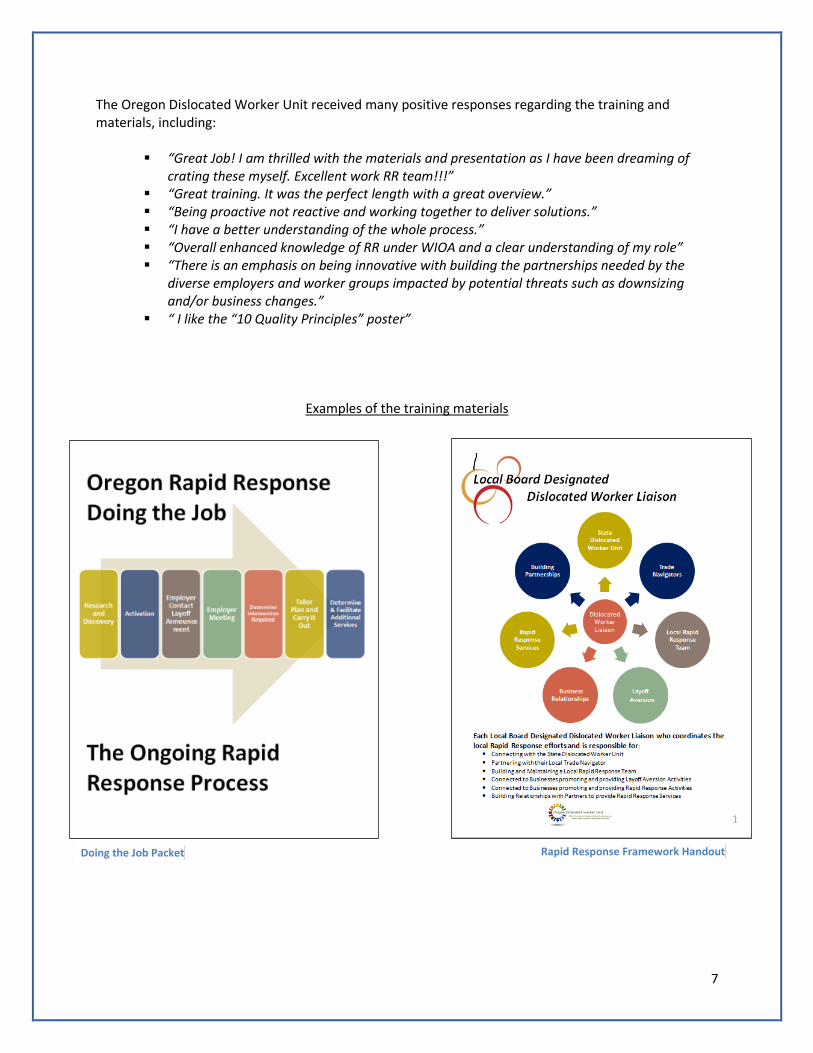
2. Doing the Job - Seven phase process: Research & Discovery, Activation, Employer Contact &/or Layoff Notice, Meet with Company/ Employer, Determine Intervention Required, Tailor Plan & Carry It Out, and Determine & Facilitate Additional Services
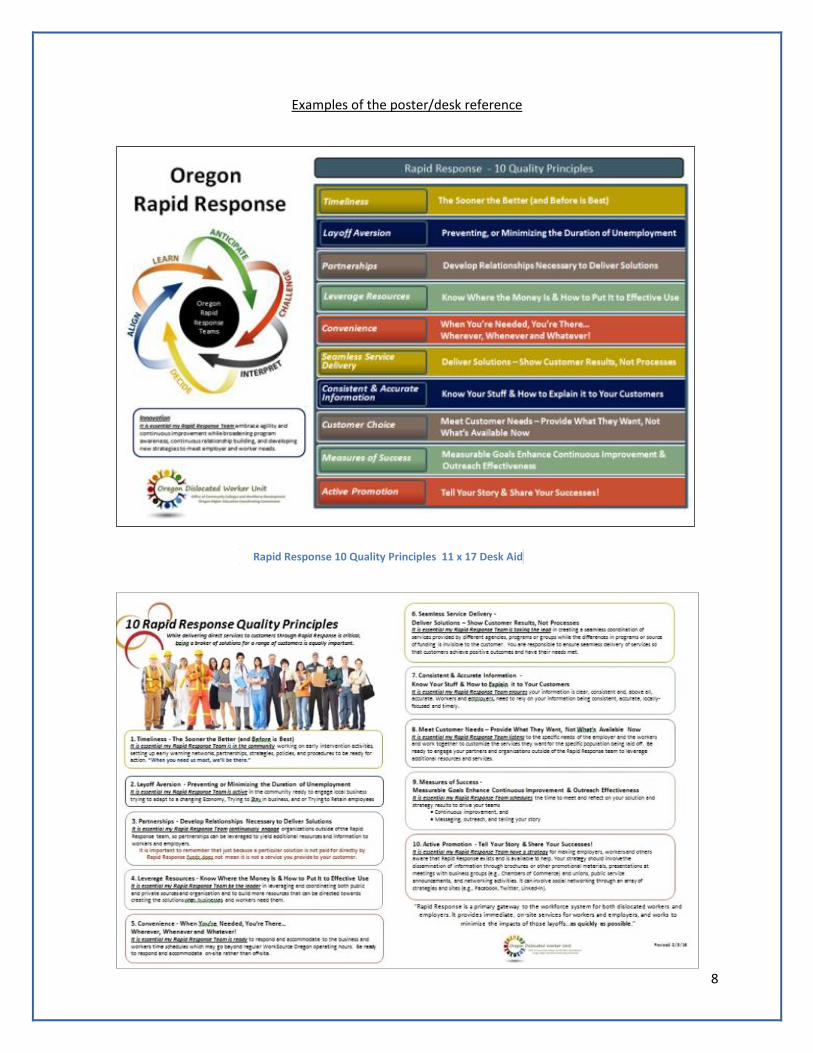
3. Rapid Response 10 Quality Principles Timeliness, Layoff Aversion, Partnerships, Leverage Resources, Convenience, Seamless Service Delivery, Consistent & Accurate Information, Customer Choice, Measures of Success, and Active Promotion
7
The Oregon Dislocated Worker Unit received many positive responses regarding the training and materials, including:
“Great Job! I am thrilled with the materials and presentation as I have been dreaming of crating these myself. Excellent work RR team!!!”
“Great training. It was the perfect length with a great overview.” “Being proactive not reactive and working together to deliver solutions.” “I have a better understanding of the whole process.” “Overall enhanced knowledge of RR under WIOA and a clear understanding of my role” “There is an emphasis on being innovative with building the partnerships needed by the
diverse employers and worker groups impacted by potential threats such as downsizing and/or business changes.”
“ I like the “10 Quality Principles” poster”
Examples of the training materials
Doing the Job Packet Rapid Response Framework Handout
8
Examples of the poster/desk reference
Rapid Response 10 Quality Principles 11 x 17 Desk Aid
9
SECTION TWO
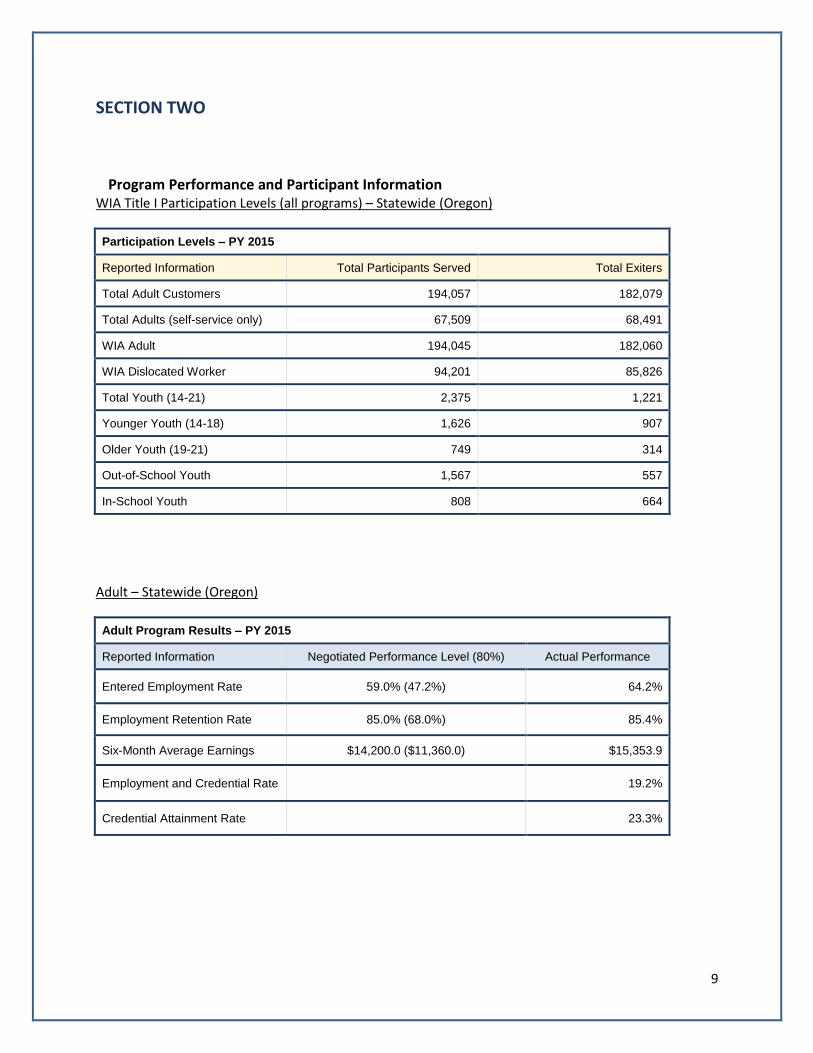
Program Performance and Participant Information WIA Title I Participation Levels (all programs) – Statewide (Oregon)
Participation Levels – PY 2015
Reported Information Total Participants Served Total Exiters
Total Adult Customers 194,057 182,079
Total Adults (self-service only) 67,509 68,491
WIA Adult 194,045 182,060
WIA Dislocated Worker 94,201 85,826
Total Youth (14-21) 2,375 1,221
Younger Youth (14-18) 1,626 907
Older Youth (19-21) 749 314
Out-of-School Youth 1,567 557
In-School Youth 808 664
Adult – Statewide (Oregon)
Adult Program Results – PY 2015
Reported Information Negotiated Performance Level (80%) Actual Performance
Entered Employment Rate 59.0% (47.2%) 64.2%
Employment Retention Rate 85.0% (68.0%) 85.4%
Six-Month Average Earnings $14,200.0 ($11,360.0) $15,353.9
Employment and Credential Rate 19.2%
Credential Attainment Rate 23.3%
10
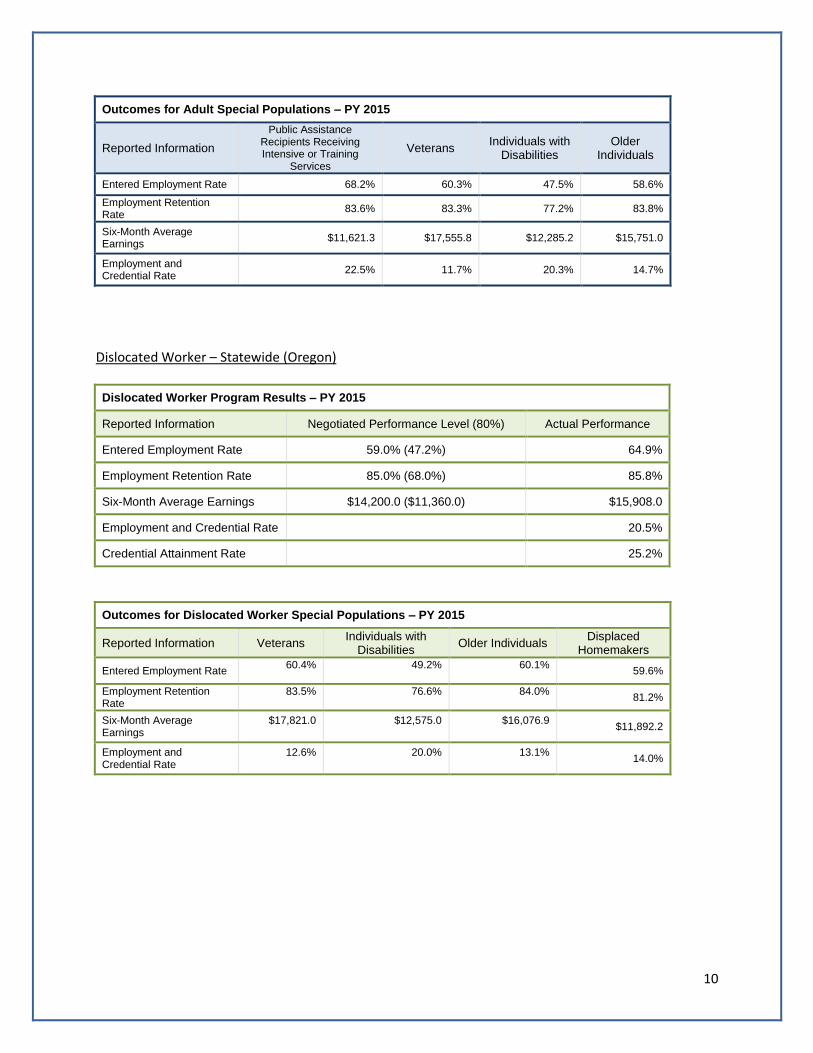
Outcomes for Adult Special Populations – PY 2015
Reported Information
Public Assistance Recipients Receiving Intensive or Training
Services
Veterans Individuals with
Disabilities Older
Individuals
Entered Employment Rate 68.2% 60.3% 47.5% 58.6%
Employment Retention Rate
83.6% 83.3% 77.2% 83.8%
Six-Month Average Earnings
$11,621.3 $17,555.8 $12,285.2 $15,751.0
Employment and Credential Rate
22.5% 11.7% 20.3% 14.7%
Dislocated Worker – Statewide (Oregon)
Dislocated Worker Program Results – PY 2015
Reported Information Negotiated Performance Level (80%) Actual Performance
Entered Employment Rate 59.0% (47.2%) 64.9%
Employment Retention Rate 85.0% (68.0%) 85.8%
Six-Month Average Earnings $14,200.0 ($11,360.0) $15,908.0
Employment and Credential Rate 20.5%
Credential Attainment Rate 25.2%
Outcomes for Dislocated Worker Special Populations – PY 2015
Reported Information Veterans Individuals with
Disabilities Older Individuals
Displaced Homemakers
Entered Employment Rate 60.4%
49.2%
60.1%
59.6%
Employment Retention Rate
83.5%
76.6%
84.0%
81.2%
Six-Month Average Earnings
$17,821.0
$12,575.0
$16,076.9
$11,892.2
Employment and Credential Rate
12.6%
20.0%
13.1%
14.0%
11
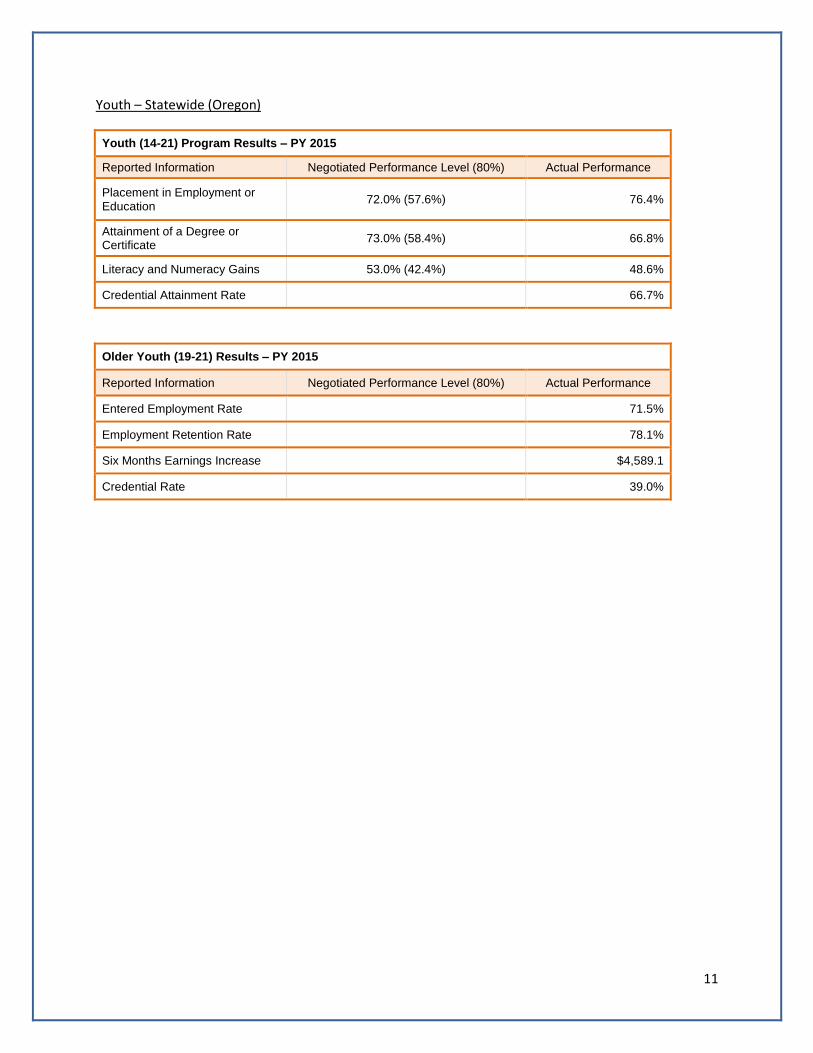
Youth – Statewide (Oregon)
Youth (14-21) Program Results – PY 2015
Reported Information Negotiated Performance Level (80%) Actual Performance
Placement in Employment or Education
72.0% (57.6%) 76.4%
Attainment of a Degree or Certificate
73.0% (58.4%) 66.8%
Literacy and Numeracy Gains 53.0% (42.4%) 48.6%
Credential Attainment Rate 66.7%
Older Youth (19-21) Results – PY 2015
Reported Information Negotiated Performance Level (80%) Actual Performance
Entered Employment Rate 71.5%
Employment Retention Rate 78.1%
Six Months Earnings Increase $4,589.1
Credential Rate 39.0%
12
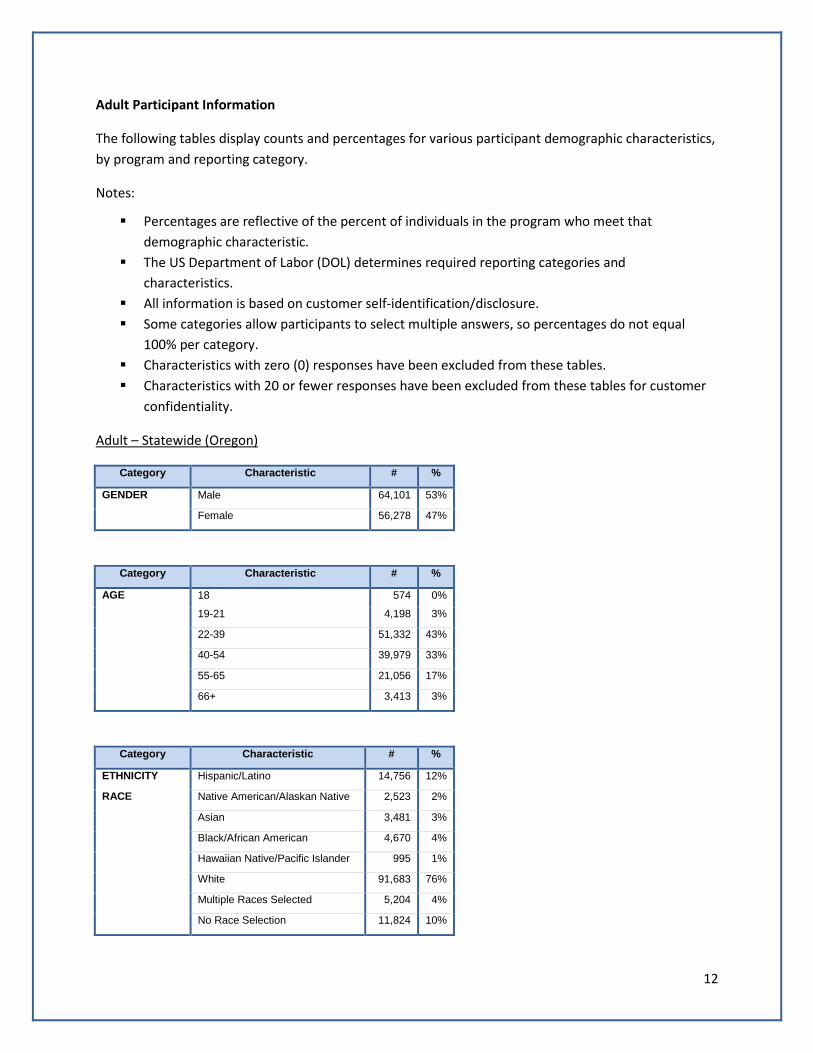
Adult Participant Information
The following tables display counts and percentages for various participant demographic characteristics,
by program and reporting category.
Notes:
Percentages are reflective of the percent of individuals in the program who meet that
demographic characteristic.
The US Department of Labor (DOL) determines required reporting categories and
characteristics.
All information is based on customer self-identification/disclosure.
Some categories allow participants to select multiple answers, so percentages do not equal
100% per category.
Characteristics with zero (0) responses have been excluded from these tables.
Characteristics with 20 or fewer responses have been excluded from these tables for customer
confidentiality.
Adult – Statewide (Oregon)
Category Characteristic # %
GENDER Male 64,101 53%
Female 56,278 47%
Category Characteristic # %
AGE 18 574 0%
19-21 4,198 3%
22-39 51,332 43%
40-54 39,979 33%
55-65 21,056 17%
66+ 3,413 3%
Category Characteristic # %
ETHNICITY Hispanic/Latino 14,756 12%
RACE Native American/Alaskan Native 2,523 2%
Asian 3,481 3%
Black/African American 4,670 4%
Hawaiian Native/Pacific Islander 995 1%
White 91,683 76%
Multiple Races Selected 5,204 4%
No Race Selection 11,824 10%
13
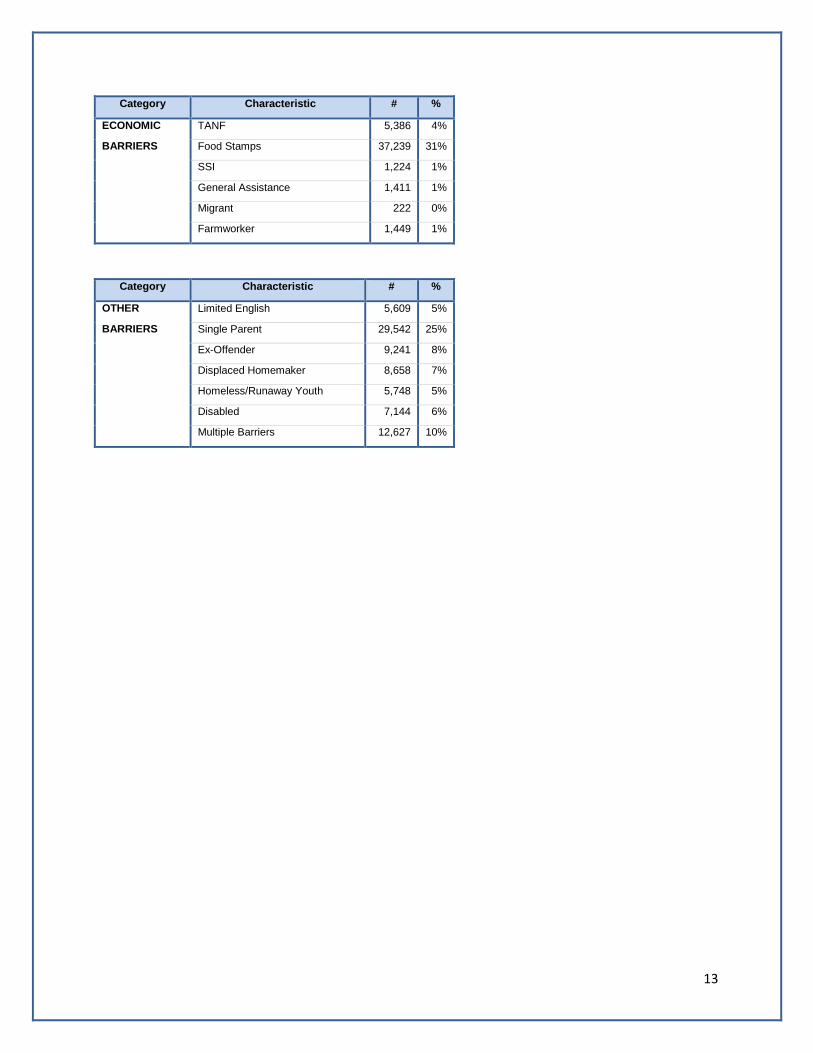
Category Characteristic # %
ECONOMIC TANF 5,386 4%
BARRIERS Food Stamps 37,239 31%
SSI 1,224 1%
General Assistance 1,411 1%
Migrant 222 0%
Farmworker 1,449 1%
Category Characteristic # %
OTHER Limited English 5,609 5%
BARRIERS Single Parent 29,542 25%
Ex-Offender 9,241 8%
Displaced Homemaker 8,658 7%
Homeless/Runaway Youth 5,748 5%
Disabled 7,144 6%
Multiple Barriers 12,627 10%
14
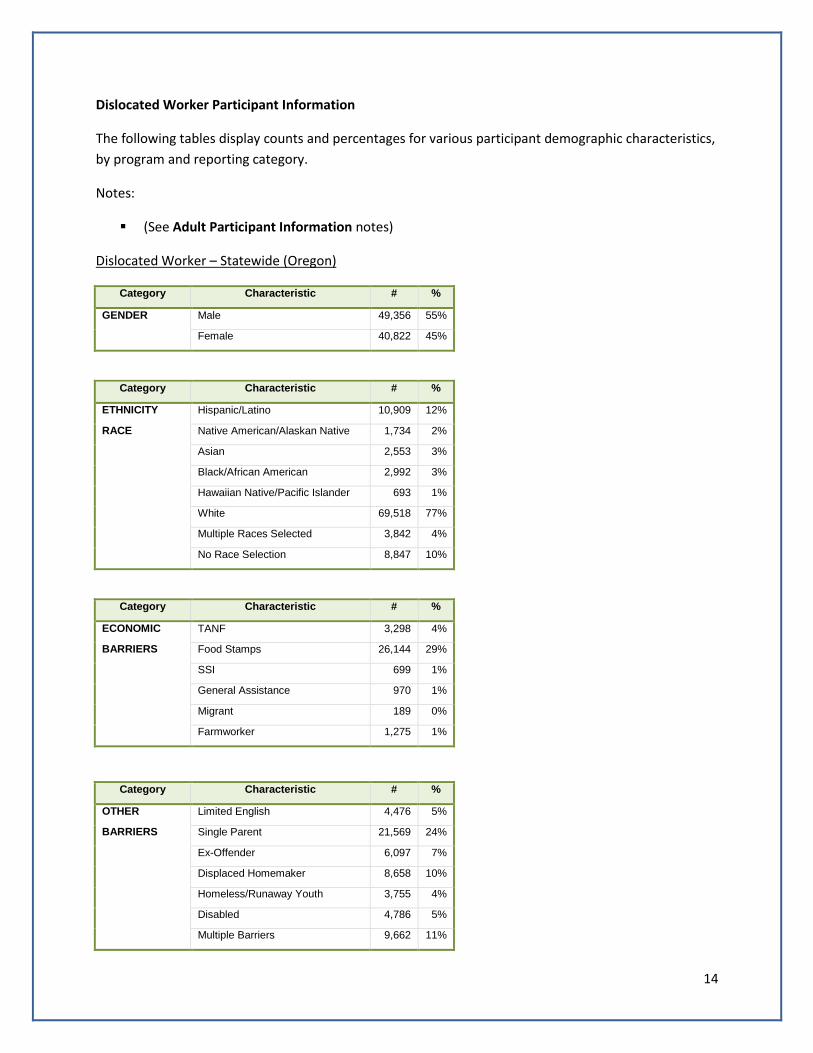
Dislocated Worker Participant Information
The following tables display counts and percentages for various participant demographic characteristics,
by program and reporting category.
Notes:
(See Adult Participant Information notes)
Dislocated Worker – Statewide (Oregon)
Category Characteristic # %
GENDER Male 49,356 55%
Female 40,822 45%
Category Characteristic # %
ETHNICITY Hispanic/Latino 10,909 12%
RACE Native American/Alaskan Native 1,734 2%
Asian 2,553 3%
Black/African American 2,992 3%
Hawaiian Native/Pacific Islander 693 1%
White 69,518 77%
Multiple Races Selected 3,842 4%
No Race Selection 8,847 10%
Category Characteristic # %
ECONOMIC TANF 3,298 4%
BARRIERS Food Stamps 26,144 29%
SSI 699 1%
General Assistance 970 1%
Migrant 189 0%
Farmworker 1,275 1%
Category Characteristic # %
OTHER Limited English 4,476 5%
BARRIERS Single Parent 21,569 24%
Ex-Offender 6,097 7%
Displaced Homemaker 8,658 10%
Homeless/Runaway Youth 3,755 4%
Disabled 4,786 5%
Multiple Barriers 9,662 11%
15
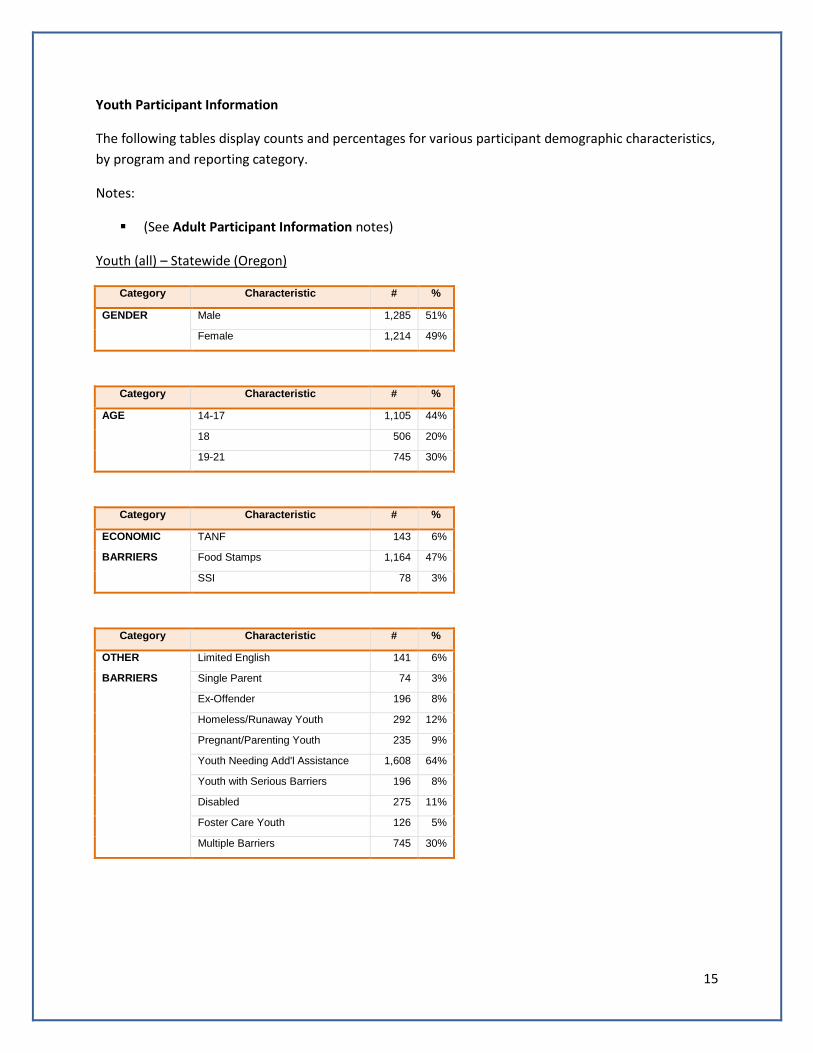
Youth Participant Information
The following tables display counts and percentages for various participant demographic characteristics,
by program and reporting category.
Notes:
(See Adult Participant Information notes)
Youth (all) – Statewide (Oregon)
Category Characteristic # %
GENDER Male 1,285 51%
Female 1,214 49%
Category Characteristic # %
AGE 14-17 1,105 44%
18 506 20%
19-21 745 30%
Category Characteristic # %
ECONOMIC TANF 143 6%
BARRIERS Food Stamps 1,164 47%
SSI 78 3%
Category Characteristic # %
OTHER Limited English 141 6%
BARRIERS Single Parent 74 3%
Ex-Offender 196 8%
Homeless/Runaway Youth 292 12%
Pregnant/Parenting Youth 235 9%
Youth Needing Add'l Assistance 1,608 64%
Youth with Serious Barriers 196 8%
Disabled 275 11%
Foster Care Youth 126 5%
Multiple Barriers 745 30%
16
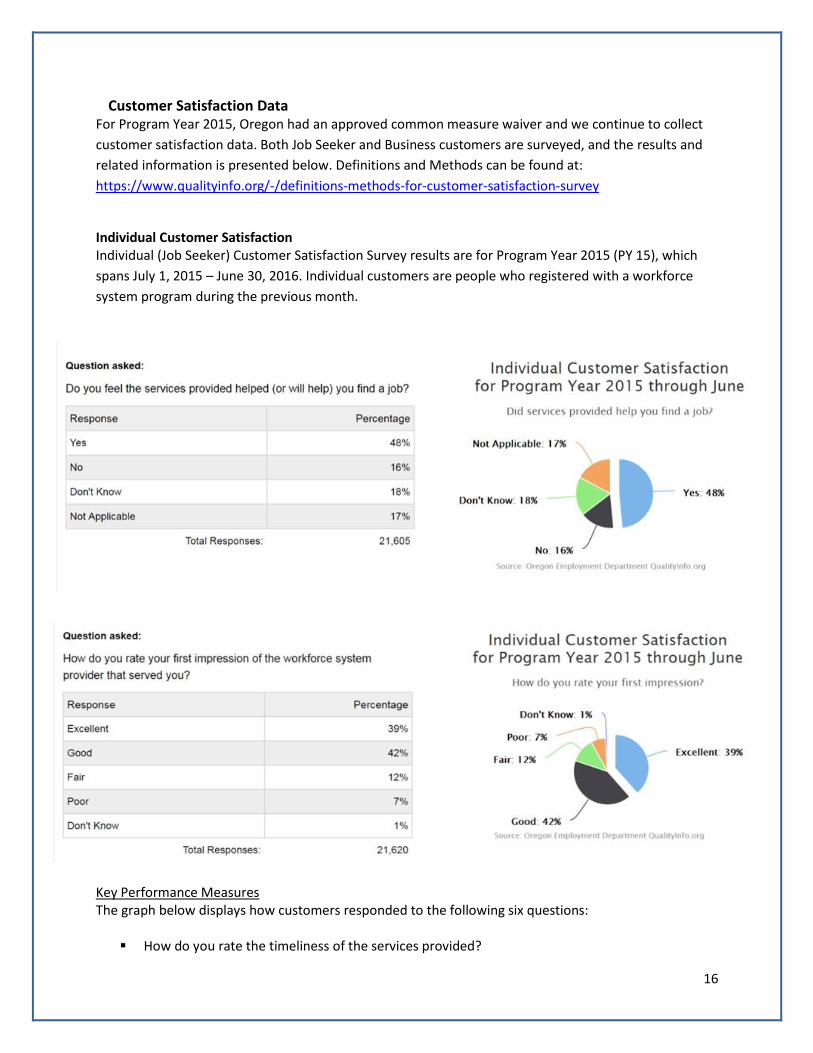
Customer Satisfaction Data For Program Year 2015, Oregon had an approved common measure waiver and we continue to collect
customer satisfaction data. Both Job Seeker and Business customers are surveyed, and the results and
related information is presented below. Definitions and Methods can be found at:
https://www.qualityinfo.org/-/definitions-methods-for-customer-satisfaction-survey
Individual Customer Satisfaction Individual (Job Seeker) Customer Satisfaction Survey results are for Program Year 2015 (PY 15), which
spans July 1, 2015 – June 30, 2016. Individual customers are people who registered with a workforce
system program during the previous month.
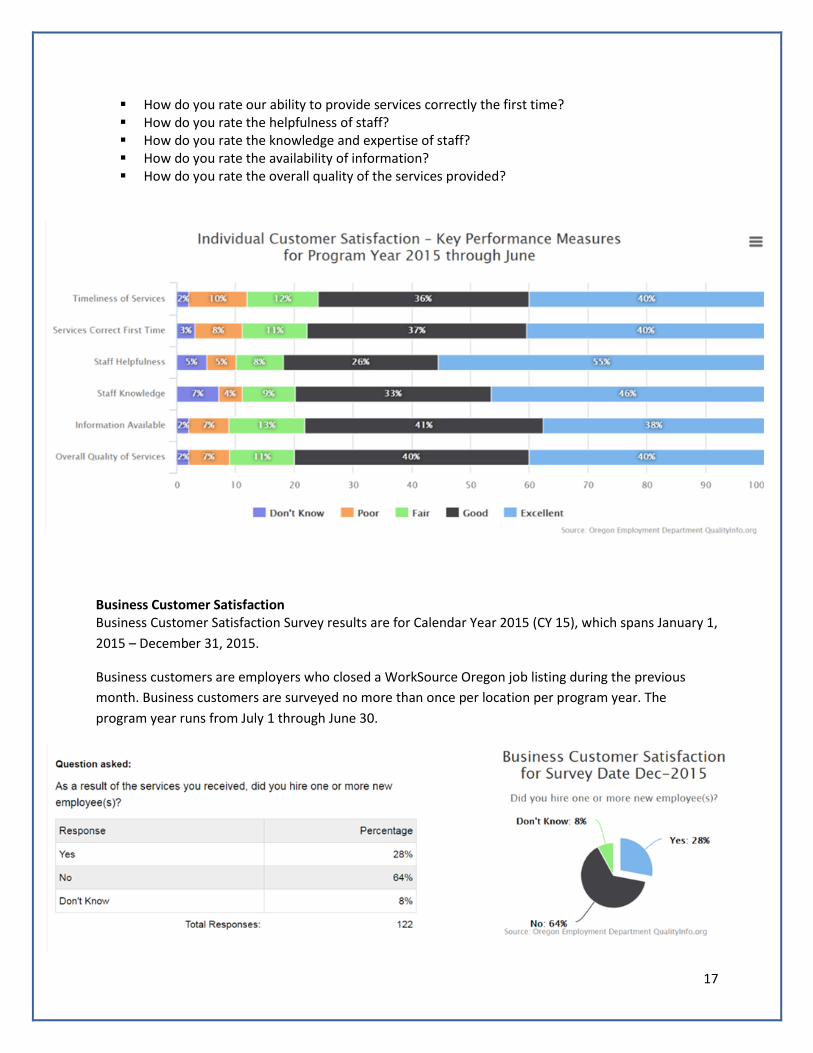
Key Performance Measures The graph below displays how customers responded to the following six questions:
How do you rate the timeliness of the services provided?
17
How do you rate our ability to provide services correctly the first time? How do you rate the helpfulness of staff? How do you rate the knowledge and expertise of staff? How do you rate the availability of information? How do you rate the overall quality of the services provided?
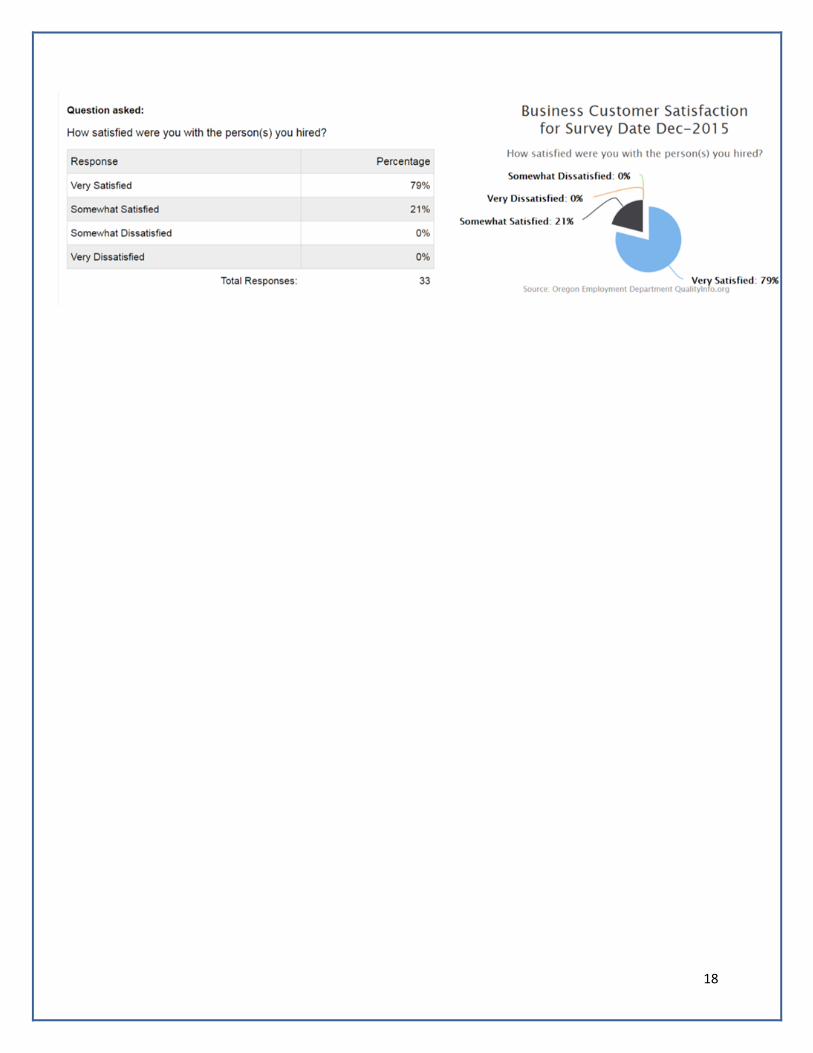
Business Customer Satisfaction Business Customer Satisfaction Survey results are for Calendar Year 2015 (CY 15), which spans January 1,
2015 – December 31, 2015.
Business customers are employers who closed a WorkSource Oregon job listing during the previous
month. Business customers are surveyed no more than once per location per program year. The
program year runs from July 1 through June 30.
18
19
State Evaluation Activities Oregon’s evaluation studies are designed to promote, establish, and implement methods for continuous improvement in the efficiency and effectiveness of the statewide workforce investment system in improving employability for job seekers and competitiveness for employers. As we transition from WIA to WIOA, we are discussing how our evaluation efforts and activities might be affected. While these are “works in progress”, Oregon continues to track, present, and analyze data, including trends over time. Evaluation activities include straight-up analysis of current business needs or local area performance, multi-year trend analysis of labor market information, cross-agency reports, near real-time trend reports, and more. Below are a few examples:
In the fourth quarter of 2015, the Oregon Employment Department produced the Oregon Business Employment Dynamics Report, examining private sector job gains and losses as percent of employment, the number of establishments gaining and losing employment, and job gains and losses by industry. A copy of the report is available at: https://www.qualityinfo.org/documents/10182/13336/Business+Employment+Dynamics?version=1.11
Annual quality assurance reviews address multiple aspects of program compliance and program
improvement.
Oregon’s Labor Market Information System (OLMIS) continues to be responsive to state and
local Workforce Investment Board needs by supplying information and analysis that assists with
evaluation initiatives. Recent studies have included job and industry growth analysis, industry
cluster analysis, studies of the occupational needs and growth of various industries and industry
groupings, prioritization of occupations for training, green jobs surveys, employer vacancy
surveys, and local/regional profiles; all of these assist in the evaluation of the effectiveness of
workforce programs in the state and in developing more targeted and effective programming.
OLMIS reports can be found at: www.qualityinfo.org
Data from Oregon’s system-wide performance measures continues to be available for the employment
related indicators, basic skills attainment, and Temporary Assistance to Needy Families (TANF) caseload
management. Oregon’s cross-system outcomes accountability system, Performance Reporting
Information System (PRISM), gathers demographic data on customers served by nearly all workforce
partners, ensuring analysis and evaluation can occur based on customer cohorts (e.g., racial/ethnic
minority status, age group, or educational attainment level). Many results are available at a statewide
level, by agency/partner program, and/or by local area – or by combinations. These system-wide
performance data are available at www.prism.state.or.us
While this format is different from a formal evaluation study, the nearly real-time information,
combined with the ability to filter results and compare trends over time, gives program managers,
stakeholders, and even the general public the ability view, analyze, and evaluate various performance-
related measures across Oregon’s workforce system.
20
Performance Metrics Used By State and Local Areas to Measure the Effectiveness of Veterans’ Services and Current Available Performance Data Five Year JVSG State Plan Every five years the Veterans Program Coordinator submits a 5-year plan outlining how the state will provide priority of service to veterans and eligible spouses, how Disabled Veterans Outreach Program representatives (DVOPs) will provide intensive employment services and case management to eligible veterans and spouses, and outreach initiatives. The following initiatives have been implemented in accordance with the 5-year JVSG plan:
The completion of local and statewide Veterans Priority of Service Plans The development of outreach initiatives for veterans ages 18-24 Partnership with Vocational Rehabilitation service providers DVOP Outreach initiatives at veteran incarceration reentry programs DVOP Outreach initiatives at VA centers DVOP Outreach initiatives at homeless shelters Creating partnerships with National Guard and Reserve units
Technical Performance Narrative (TPN) Each Fiscal quarter the Veterans Program Coordinator submits a TPN to the DOL-VETS State Director (DVET) outlining the states performance rates compared to the State’s negotiated performance rates and new employment initiatives and special projects related to providing employment services to veterans. Quarterly Manager’s Report on Veteran Services Each DVOP and LVER are required to work with their field office managers to submit a quarterly report to the Veterans Program Coordinator for review prior to the final submission of the reports to the State DVET. Each report outlines the number of veterans that have been provided intensive services and case management services by DVOP staff. The report also contains information on how each office provides priority of service to veterans and eligible spouses, DVOP regional outreach initiatives and veteran success stories. DVET audits Each fiscal year the state DVET audits a percentage of the WSO offices with DVOP and LVER staff to ensure compliance with the veterans program negotiated performance goals, and to ensure that each office provides priority of service to veterans in all employment and training programs funded in part or whole by the DOL.
21
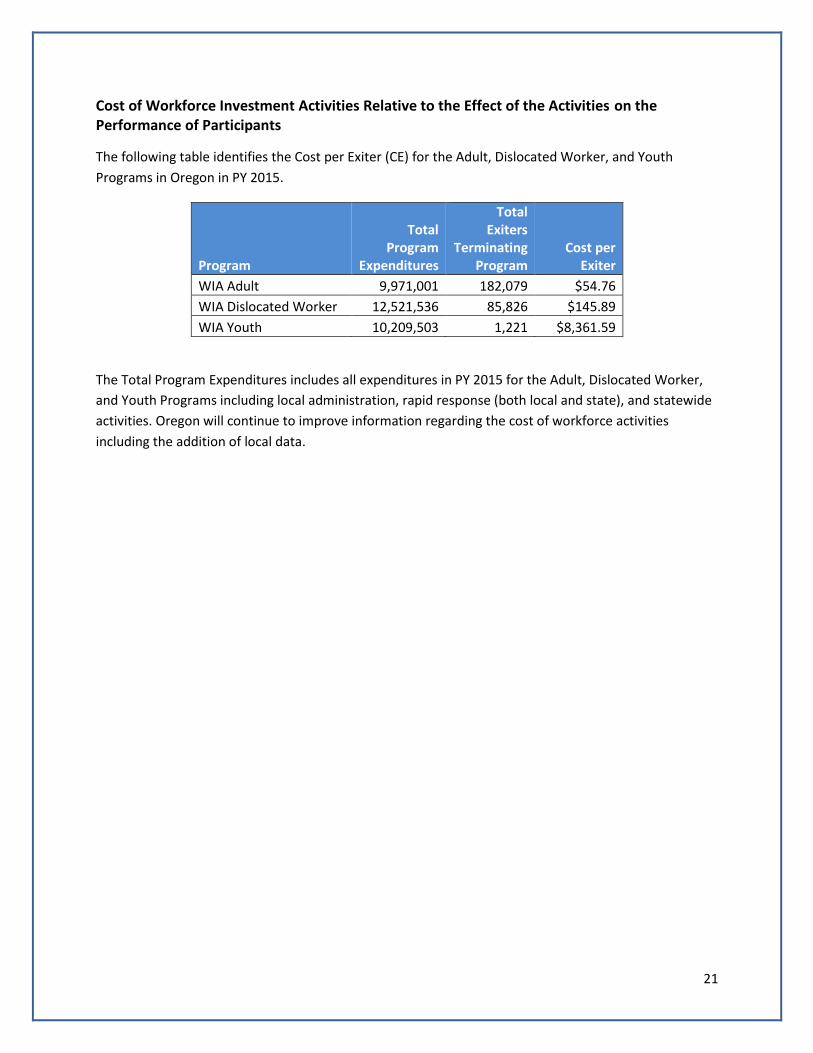
Cost of Workforce Investment Activities Relative to the Effect of the Activities on the Performance of Participants
The following table identifies the Cost per Exiter (CE) for the Adult, Dislocated Worker, and Youth
Programs in Oregon in PY 2015.
Program
Total Program
Expenditures
Total Exiters
Terminating Program
Cost per Exiter
WIA Adult 9,971,001 182,079 $54.76
WIA Dislocated Worker 12,521,536 85,826 $145.89
WIA Youth 10,209,503 1,221 $8,361.59
The Total Program Expenditures includes all expenditures in PY 2015 for the Adult, Dislocated Worker,
and Youth Programs including local administration, rapid response (both local and state), and statewide
activities. Oregon will continue to improve information regarding the cost of workforce activities
including the addition of local data.
22
Uniform Reporting Transforming multiple diverse systems into one integrated system has been an incremental process that
has resulted in challenges to reporting aggregate numbers accurately.
Oregon’s common customer registration process determines a customer’s eligibility for WIA Adult,
Dislocated Worker and Wagner-Peyser (W-P) programs, although services are still tracked separately.
The user interface layer of this shared system is the WorkSource Oregon Management Information
System (WOMIS), a multi-application customer- and staff-accessed system that comprises Customer
Registration, Program Eligibility Determination, labor exchange services, Trade Adjustment Assistance,
some WIA Service Tracking, and other customer services and resources.
Implementing and enhancing WOMIS requires ongoing analysis and research, extensive information
technology programming and coding, statewide hardware and software changes, and continuing fine-
tuning, enhancements, and troubleshooting. User groups made up of state and local staff, continue to
monitor the MIS elements for consistency and needed changes.
In addition to WOMIS, each Local Workforce Investment Area (LWIA) must use a management
information system to record, track, and report on customer data for individuals participating in WIA-
funded services and activities.
CCWD encourages all local areas to deploy a customer record tracking and retention process that is
efficient and effective for staff and customers, supports a data and file structure that is consistent
statewide, and honors the federal Paperwork Reduction Act and state paperless initiatives.
Discussions between CCWD and the Oregon Workforce Partnership (OWP) spotlighted the benefits of a
single statewide WIA customer tracking system. The OWP selected a system that they feel meets their
individual and collective business need(s), and all LWIAs statewide use a single MIS system, named I-
Trac. Customer demographic and service data is consolidated and checked for errors at the state level
before being reported to DOL. At the state level, MIS elements are being reported uniformly, and
Oregon’s goal is standardization of reporting elements at the local level as well.
23
Waivers Below are the waivers approved for Oregon during PY 2015, with information on how the waivers have
changed the activities of the state and local areas, and how activities carried out under the waivers have
directly or indirectly affected state and local area performance outcomes, where known.
Waiver to allow the Oregon workforce system to forego reporting of the WIA required performance measures and adopt and report the “Common Measures” for federal job training and employment programs. The simplified performance management and reporting across systems allowed by this waiver has been instrumental in developing a fully integrated workforce system as the service delivery system now has the same outcome measures regardless of the agency and funding source. The simplification has reduced the administrative burden, freeing up funding to serve more participants. The ability for the system to focus on common measures has allowed local boards to hold providers accountable to more relevant and easily understandable measures. It has also simplified the job of the line workers allowing them to serve Oregonians more effectively. Waiver to permit local areas to use a portion of local Adult and Dislocated Worker funds for Incumbent Worker Training. No local workforce investment areas or boards reported taking advantage of this waiver. Waiver to permit states to use a portion of rapid response funds for Incumbent Worker Training. Oregon is currently evaluating the effects to program performance and services that resulted from this waiver, and is appreciative of the flexibility it provides.
24
Additional agency and organization information Oregon Office of Community Colleges and Workforce Development (CCWD)
The mission of the agency is to contribute leadership and resources to increase the skills, knowledge and
career opportunities of Oregonians. The mission is accomplished through Oregon’s network of 17
community colleges, 18 adult basic skills programs, seven local workforce areas, community-based
organizations, and other partnerships. CCWD is responsible for implementing policies, procedures, and
strategies consistent with the Governor’s education and workforce priorities and the goals of the OWIB,
the State Board of Education, the Joint Boards of Education, Oregon Education Investment Board, and
the Commissioner of CCWD.
The Department ensures services are provided to future, transitional, and current workers. Each year,
CCWD supports over 300,000 Oregonians attending community colleges and thousands of unemployed,
underemployed, low skilled adults and youth, ages 14 and older, with serious employment obstacles.
CCWD assists these Oregonians to obtain secondary and post-secondary credentials and knowledge and
skills necessary for work, further education, family self-sufficiency and community.
http://www.oregon.gov/ccwd/Pages/index.aspx
Oregon Employment Department (OED)
The mission of the Employment Department is to promote employment of Oregonians through
developing a diversified, multi-skilled workforce, and providing support during periods of
unemployment. http://www.oregon.gov/EMPLOY/pages/index.aspx
Its mission is to:
Support economic stability for Oregonians and communities during times of unemployment
through the payment of unemployment benefits.
Serve businesses by recruiting and referring the best-qualified applicants to jobs, and provide
resources to diverse job seekers in support of their employment needs.
Develop and distribute quality workforce and economic information to promote informed
decision-making.
Higher Education Coordinating Commission (HECC) Agency
The Oregon Higher Education Coordinating Commission (HECC) is dedicated to fostering and sustaining
the best, most rewarding pathways to opportunity and success for all Oregonians through an accessible,
affordable and coordinated network for educational achievement beyond a high school diploma.
Oregon’s higher education and workforce system serves hundreds of thousands of learners through
seven public universities, 17 public community colleges, private and independent colleges and
universities, workforce programs, and private career and trade schools.
25
The executive director oversees the work of seven offices listed below:
The Office of the Executive Director, Policy, and Communications
The Office of Community Colleges and Workforce Development (CCWD)
The Office of Operations
The Office of Private Postsecondary Education
The Office of Research and Data
The Office of Student Access & Completion (OSAC)
The Office of University Coordination
The Oregon Workforce Investment Board (OWIB)
The Oregon Workforce Investment Board is the overall advisory board to the Governor on workforce
matters. The OWIB is made up of leaders representing private sector businesses, labor, state, local
governments, and government agencies.
A majority of the nearly 40 members represent the private sector. One of the chief duties of the OWIB is
to assist the Governor by developing a strategic plan for Oregon's comprehensive workforce system.
Oregon Workforce Partnership (OWP)
Oregon’s nine Local Workforce Boards comprise the OWP. The local boards are business-led
private/public partnerships that invest in worker training based on community and industry needs.
Locally, they convene those with the skills and knowledge to create effective solutions to the workforce
needs of business. They create innovative program models, aligning and leveraging resources for greater
impact. OWP represents: 114 businesses and business associations working in construction,
manufacturing (from food processing to wood products to biotech and solar), healthcare, hospitality,
staffing services and other sectors; 16 labor union representatives, non-profit organizations, locally
elected officials, community colleges, school districts, educational service districts, governmental
agencies, economic development organizations, tribal nations and universities.
Oregon Workforce Partnership home page: http://oregonwfpartnership.org/
26
_________________________________ ___________________________________
Recognition and gratitude goes to the OED, OWIB, LWIBs, and all WSO partners (agencies, organizations, and individuals)
that provided information for this report. Oregon continues to develop innovative and responsive methods for meeting the
demands of our ever-changing economic climate.
If you have questions regarding this report’s content please contact:
Kurt Tackman
To conserve resources and be more environmentally friendly, this report was originally published in an electronic-only format.