Embed Size (px)
Citation preview
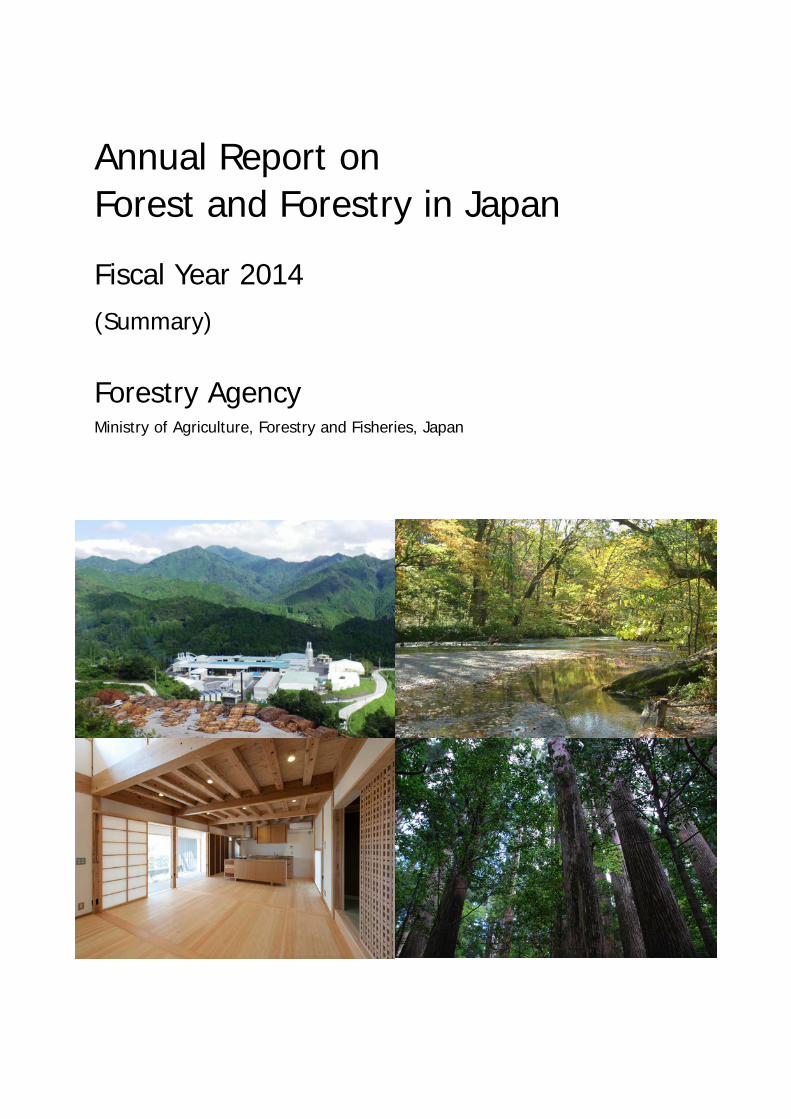
Annual Report on Forest and Forestry in Japan
Fiscal Year 2014 (Summary)
Forestry Agency Ministry of Agriculture, Forestry and Fisheries, Japan

The “Annual Report on Forest and Forestry” is a report which the Japanese Government submits to the Diet every year, in accordance with article X of the “Forest and Forestry Basic Act.” This document is a summary of the annual report for FY2014.
Table of Contents
Forest and Forestry Topics in FY2014 ....................................................................... 1
Chapter I Wood Products Industry Leading Circular Utilization of Forest Resources . 3
Chapter II Forest Management and Conservation ................................................. 9
Chapter III Forestry and Rural Mountain Communities ....................................... 14
Chapter IV Wood Demand/Supply and Wood Use ................................................ 18
Chapter V National Forest Management .............................................................. 21
Chapter VI Reconstruction from the Great East Japan Earthquake ...................... 23
Appendix ................................................................................................................ 25
Note: The maps of Japan included in this summary report do not necessarily represent the territory of Japan comprehensively.
1
Forest and Forestry Topics in FY2014
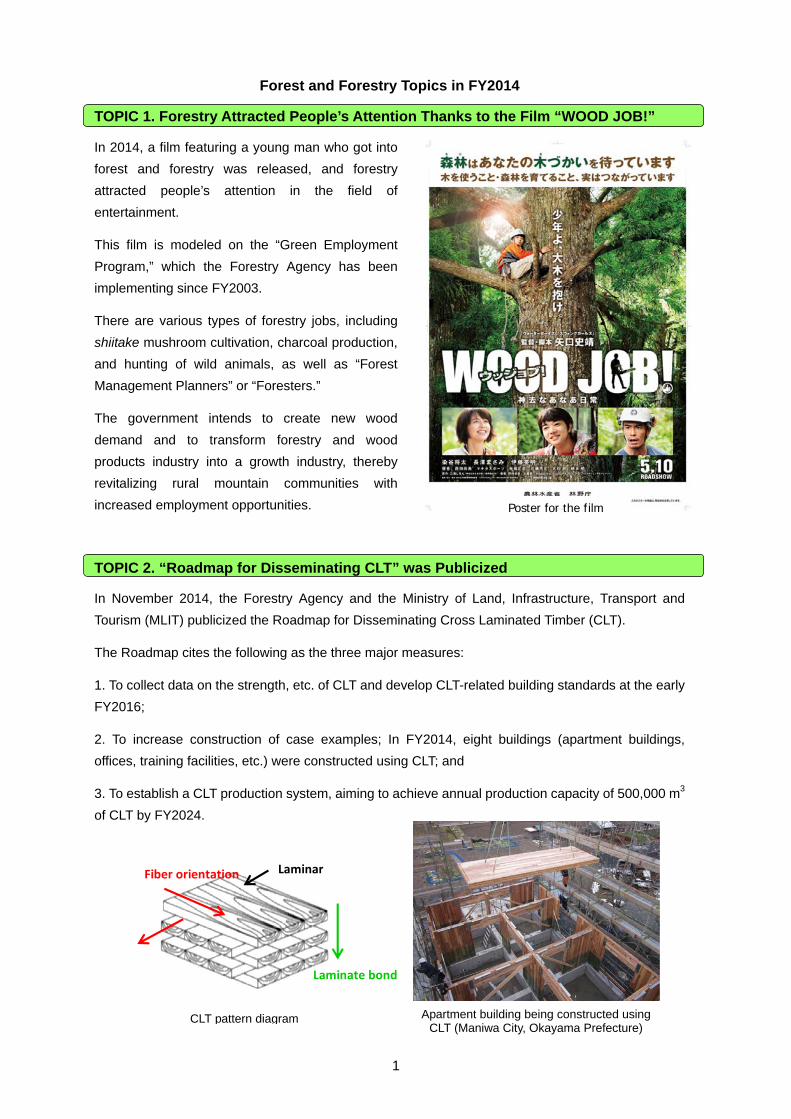
TOPIC 1. Forestry Attracted People’s Attention Thanks to the Film “WOOD JOB!”
In 2014, a film featuring a young man who got into
forest and forestry was released, and forestry
attracted people’s attention in the field of
entertainment.
This film is modeled on the “Green Employment
Program,” which the Forestry Agency has been
implementing since FY2003.
There are various types of forestry jobs, including
shiitake mushroom cultivation, charcoal production,
and hunting of wild animals, as well as “Forest
Management Planners” or “Foresters.”
The government intends to create new wood
demand and to transform forestry and wood
products industry into a growth industry, thereby
revitalizing rural mountain communities with
increased employment opportunities.
TOPIC 2. “Roadmap for Disseminating CLT” was Publicized
In November 2014, the Forestry Agency and the Ministry of Land, Infrastructure, Transport and
Tourism (MLIT) publicized the Roadmap for Disseminating Cross Laminated Timber (CLT).
The Roadmap cites the following as the three major measures:
1. To collect data on the strength, etc. of CLT and develop CLT-related building standards at the early
FY2016;
2. To increase construction of case examples; In FY2014, eight buildings (apartment buildings,
offices, training facilities, etc.) were constructed using CLT; and
3. To establish a CLT production system, aiming to achieve annual production capacity of 500,000 m3
of CLT by FY2024.
Poster for the film
CLT pattern diagram Apartment building being constructed using CLT (Maniwa City, Okayama Prefecture)
LaminarFiber orientation
Laminate bond
2
TOPIC 3. A New National Holiday “Mountain Day” was Established
In May 2014, the Act on National Holidays was revised and August 11 was established as Mountain
Day. The day was set up with the hope to provide more opportunities for the nation to get familiar with
mountains and appreciate blessings from mountains. Mountain Day will be a national holiday from
2016 onward.
In Japan, most mountainous areas are covered with forests. The Forestry Agency has been
promoting forest management and forest conservation so that its multiple functions, which can be
taken as blessings of mountains, are sustainably fulfilled.
The Forestry Agency has also provided the nation with opportunities to get familiar with mountains
through supporting forest environmental education and designating specific National Forests with
spectacular landscape suitable for recreational activities as “Recreational Forests.”
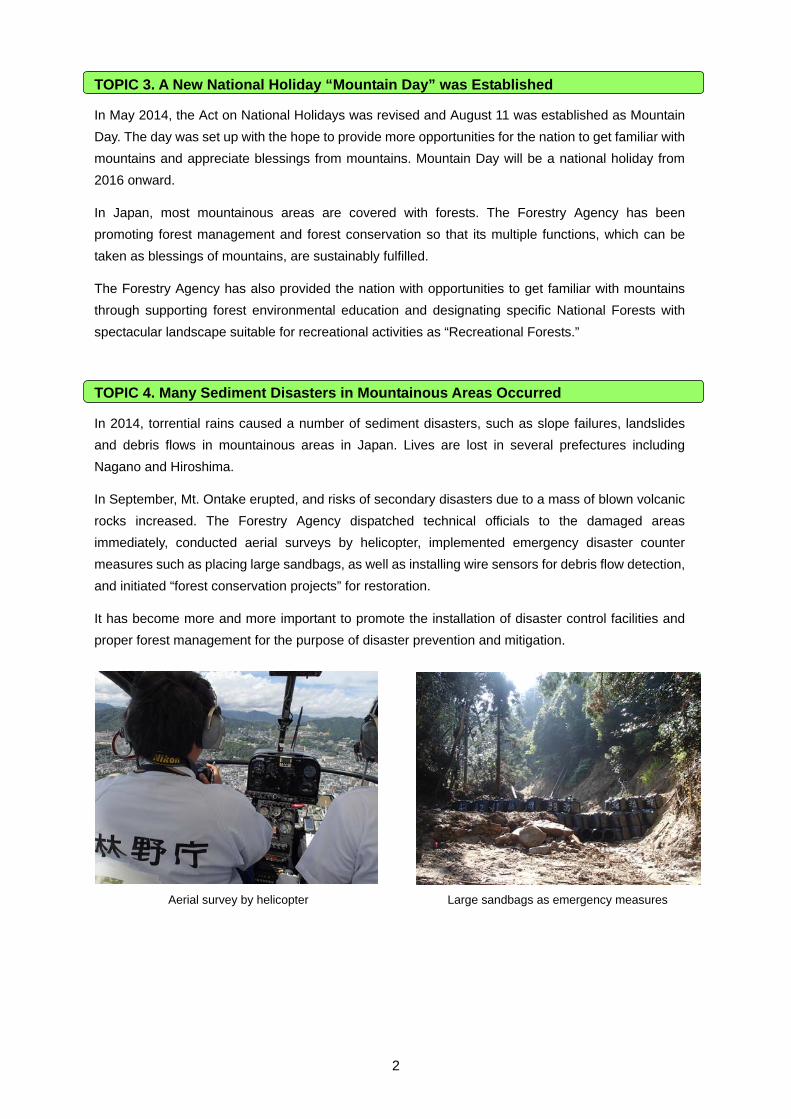
TOPIC 4. Many Sediment Disasters in Mountainous Areas Occurred
In 2014, torrential rains caused a number of sediment disasters, such as slope failures, landslides
and debris flows in mountainous areas in Japan. Lives are lost in several prefectures including
Nagano and Hiroshima.
In September, Mt. Ontake erupted, and risks of secondary disasters due to a mass of blown volcanic
rocks increased. The Forestry Agency dispatched technical officials to the damaged areas
immediately, conducted aerial surveys by helicopter, implemented emergency disaster counter
measures such as placing large sandbags, as well as installing wire sensors for debris flow detection,
and initiated “forest conservation projects” for restoration.
It has become more and more important to promote the installation of disaster control facilities and
proper forest management for the purpose of disaster prevention and mitigation.
Aerial survey by helicopter Large sandbags as emergency measures
3
Chapter I Wood Products Industry Leading Circular Utilization of Forest Resources
1. Circular Utilization of Forest Resources and Wood Products Industry
1.1 Wood Products Industry Linking Forest Resources to Wood Use
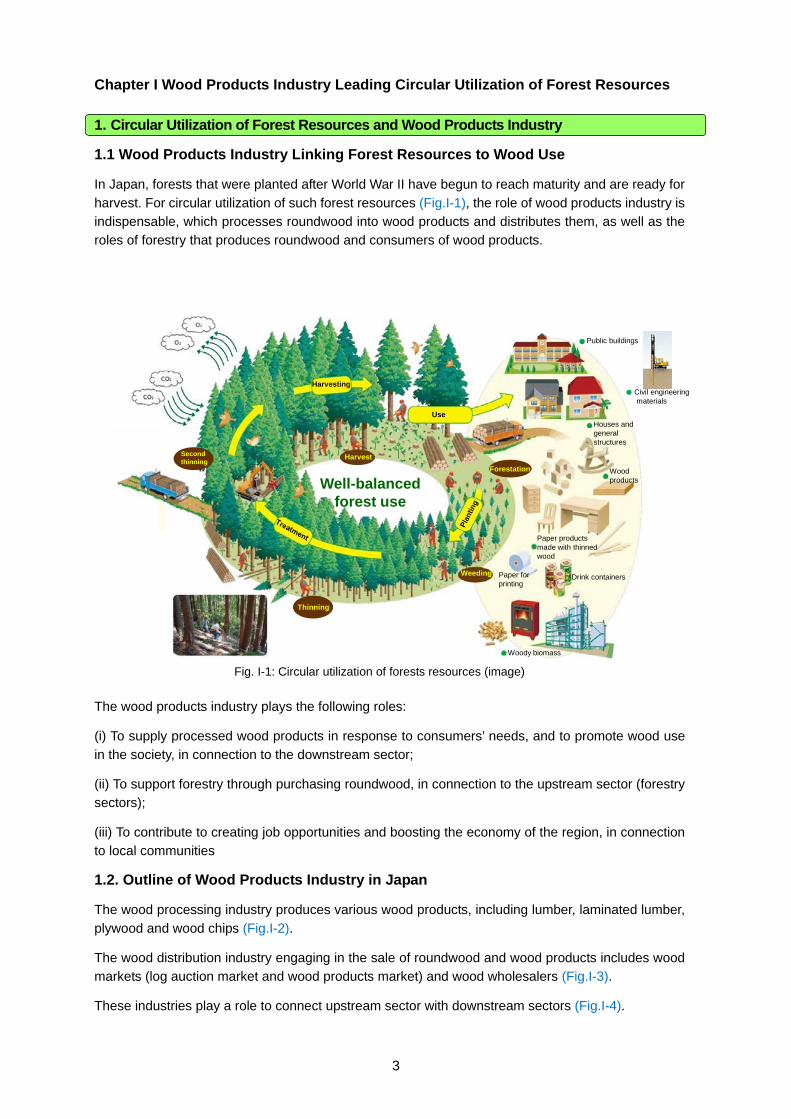
In Japan, forests that were planted after World War II have begun to reach maturity and are ready for
harvest. For circular utilization of such forest resources (Fig.I-1), the role of wood products industry is indispensable, which processes roundwood into wood products and distributes them, as well as the roles of forestry that produces roundwood and consumers of wood products.
The wood products industry plays the following roles:
(i) To supply processed wood products in response to consumers’ needs, and to promote wood use in the society, in connection to the downstream sector;
(ii) To support forestry through purchasing roundwood, in connection to the upstream sector (forestry sectors);
(iii) To contribute to creating job opportunities and boosting the economy of the region, in connection to local communities
1.2. Outline of Wood Products Industry in Japan
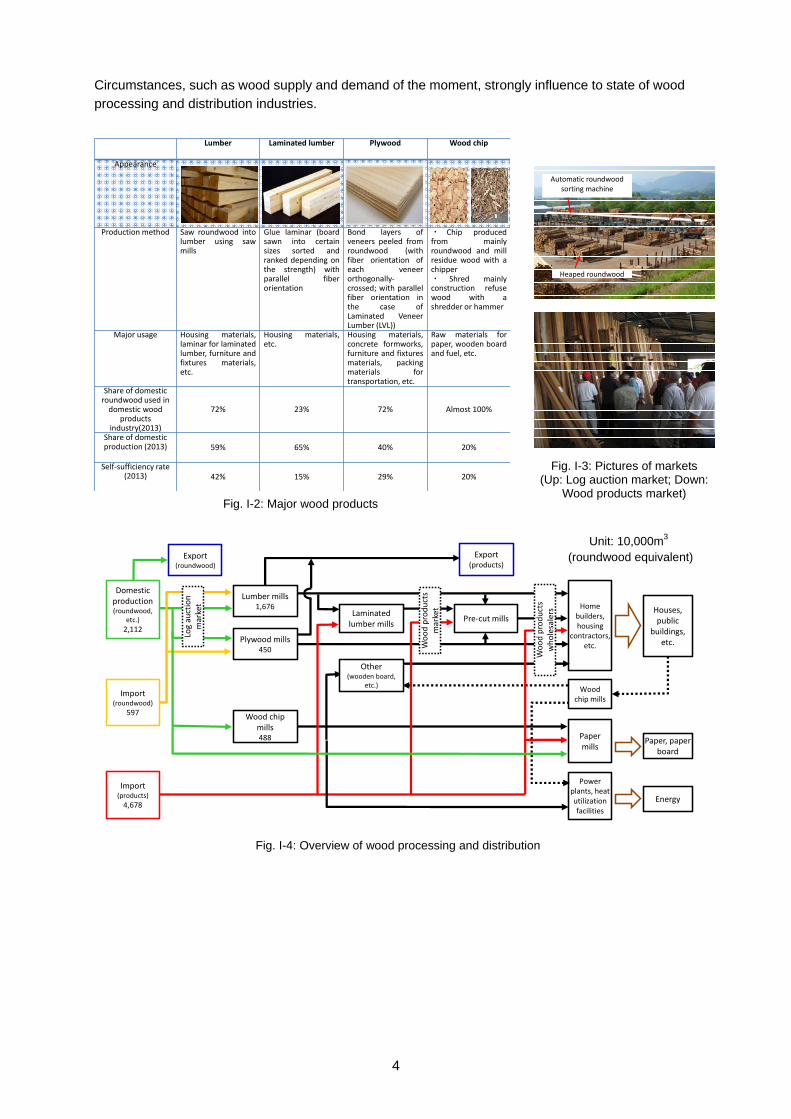
The wood processing industry produces various wood products, including lumber, laminated lumber,
plywood and wood chips (Fig.I-2).
The wood distribution industry engaging in the sale of roundwood and wood products includes wood markets (log auction market and wood products market) and wood wholesalers (Fig.I-3).
These industries play a role to connect upstream sector with downstream sectors (Fig.I-4).
Harvesting
Harvest
Use
Public buildings
Houses and general structures
Wood products
Forestation
Second thinning
Paper products made with thinned wood
Paper for printing
Drink containers
Woody biomass
Weeding
Thinning
Well-balanced forest use
● Civil engineering materials
Fig. I-1: Circular utilization of forests resources (image)
4
Circumstances, such as wood supply and demand of the moment, strongly influence to state of wood processing and distribution industries.
自動選木機
椪
Export (roundwood)
Home builders, housing
contractors, etc.
Houses, public
buildings, etc.
Export (products)
Paper mills
Pre‐cut mills
Power plants, heat utilization facilities
Energy
Paper, paper board
Wood chip mills
Other (wooden board,
etc.)
Laminated lumber mills
Wood chip mills488
Lumber mills1,676
Plywood mills450
Import (roundwood)
597
Domestic production(roundwood,
etc.)
2,112
Import (products)
4,678
Log auction
market
Wood products
market
Wood products
wholesalers
Fig. I-2: Major wood products
Fig. I-3: Pictures of markets (Up: Log auction market; Down:
Wood products market)
Fig. I-4: Overview of wood processing and distribution
Unit: 10,000m3
(roundwood equivalent)
Automatic roundwood sorting machine
Heaped roundwood
Lumber Laminated lumber Plywood Wood chip
Appearance
Production method Saw roundwood intolumber using sawmills
Glue laminar (boardsawn into certainsizes sorted andranked depending onthe strength) withparallel fiberorientation
Bond layers ofveneers peeled fromroundwood (withfiber orientation ofeach veneerorthogonally‐crossed; with parallelfiber orientation inthe case ofLaminated VeneerLumber (LVL))
・ Chip producedfrom mainlyroundwood and millresidue wood with achipper・ Shred mainlyconstruction refusewood with ashredder or hammer
Major usage Housing materials,laminar for laminatedlumber, furniture andfixtures materials,etc.
Housing materials,etc.
Housing materials,concrete formworks,furniture and fixturesmaterials, packingmaterials fortransportation, etc.
Raw materials forpaper, wooden boardand fuel, etc.
Share of domestic roundwood used in domestic wood
products industry(2013)
72% 23% 72% Almost 100%
Share of domestic production (2013) 59% 65% 40% 20%
Self‐sufficiency rate (2013) 42% 15% 29% 20%

5
2. Changes in Wood Demand/Supply and Responses by Wood Products Industry
2.1. Demand Expansion Period (After World War II to Around 1973)
During the recovery period after World War II and the subsequent rapid economic growth period,
wood demand expanded due to increases in new housing starts and paper and paperboard production (Fig.I-5). In response to the demand, domestic wood supply increased in the beginning. However, its upward trend peaked out in 1967 due to the constraint of forest resources that were
available at that time.
Accordingly, roundwood importation was liberalized. As a result, the volume of imported roundwood increased by eight times from 1960 to 1973. The volume of wood import exceeded that of domestic
wood supply since 1969.
Under such circumstances, small-sized lumber mills increased mainly in mountainous forestry areas,
and large mills that processed imported roundwood were constructed in the coastal areas since 1955.
The plywood industry, that imported south-sea roundwood as raw material, achieved rapid growth
through export in the beginning and domestic sales thereafter. The wood chip industry expanded its production by mainly consuming mill residue wood and hardwood.
Auction markets for transaction of domestic roundwood and lumber had developed as they were suitable for small-sized entities while trading companies played leading roles in transaction of
imported wood.
2.2. Stagnant Demand Period (From Around 1973 to Around 1996)
After peaking out in 1973, wood demand fluctuated and then stayed at around 100 million m3. Wood demand for lumber and plywood began to decline due to decrease in the number of new housing
starts. on the other hand, wood demand for chip and pulp production increased due to an increase of paper and paperboard production and reached a record high in 1995.
Continued decline of wood prices and increase of forest management costs, made profitability of
forestry to be deteriorated and made log harvesting activities stagnant. In this situation, domestic wood supply declined until 2002.
0
2,000
4,000
6,000
8,000
10,000
12,000
1960 1970 1980 1990 2000 2010
Lumber Plywood
Pulp and wood chips Others
11,758(1973)
11,250(1996)
Demand expansion period
Stagnant demand period
Demand decline period
(10,000m3)
(Year)
30
40
50
60
70
80
90
100
0
50
100
150
200
1960 1970 1980 1990 2000 2010
Number of new housing starts
Of which, wooden houses
Share of wooden houses (right axis)
(10,000 houses) (%)1.91 million houses
(1973)
1.12 million houses(1973)
59%(1973)
1.64 million houses(1996)
0.79 million houses(2009)
(Year)
20
30
40
50
60
70
0
500
1,000
1,500
2,000
2,500
3,000
3,500
1960 1970 1980 1990 2000 2010
Production of paper and paper board
Consumption of used paper
Percentage of consumption of used paperagainst production (right axis)
(10,000 tons)(%)
(Year)
Fig. I-5: Wood demand, number of new housing starts, and production of paper and paperboard
(roundwood equivalent)
6
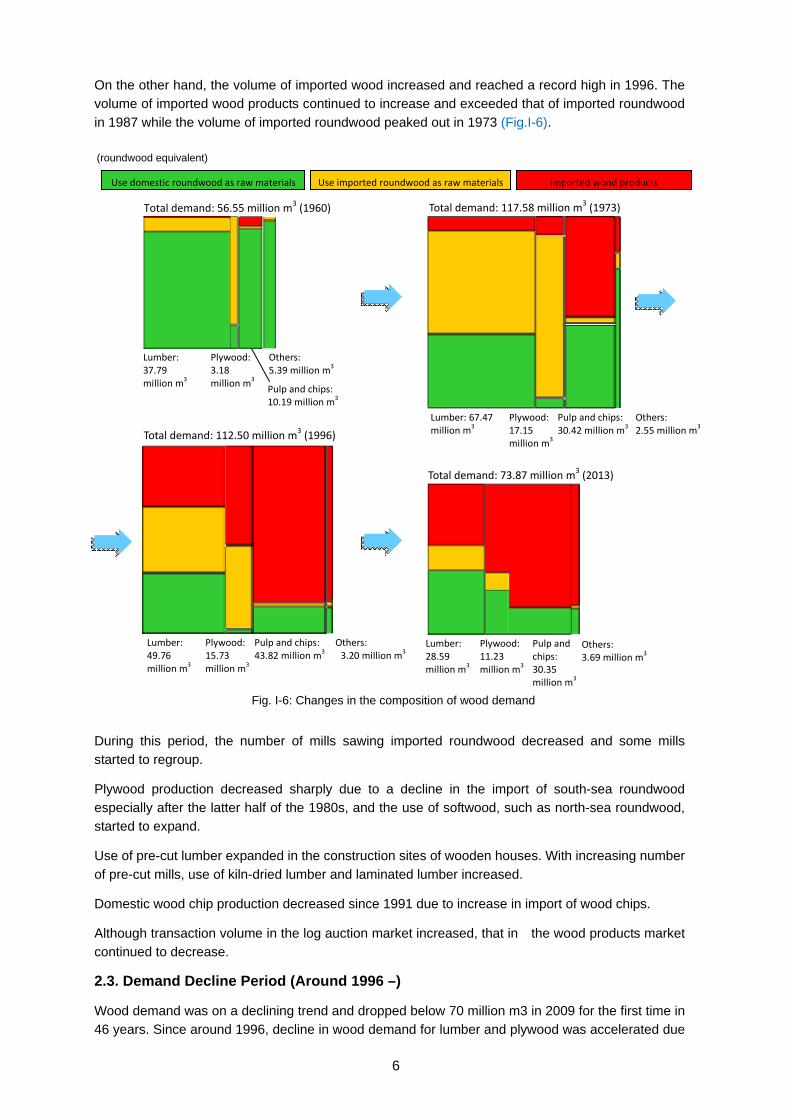
On the other hand, the volume of imported wood increased and reached a record high in 1996. The volume of imported wood products continued to increase and exceeded that of imported roundwood
in 1987 while the volume of imported roundwood peaked out in 1973 (Fig.I-6).
During this period, the number of mills sawing imported roundwood decreased and some mills started to regroup.
Plywood production decreased sharply due to a decline in the import of south-sea roundwood especially after the latter half of the 1980s, and the use of softwood, such as north-sea roundwood, started to expand.
Use of pre-cut lumber expanded in the construction sites of wooden houses. With increasing number
of pre-cut mills, use of kiln-dried lumber and laminated lumber increased.
Domestic wood chip production decreased since 1991 due to increase in import of wood chips.
Although transaction volume in the log auction market increased, that in the wood products market continued to decrease.
2.3. Demand Decline Period (Around 1996 –)
Wood demand was on a declining trend and dropped below 70 million m3 in 2009 for the first time in 46 years. Since around 1996, decline in wood demand for lumber and plywood was accelerated due
Total demand: 56.55 million m3 (1960) Total demand: 117.58 million m3 (1973)
Total demand: 112.50 million m3 (1996)
Total demand: 73.87 million m3 (2013)
Imported wood productsUse imported roundwood as raw materialsUse domestic roundwood as raw materials
Lumber: 37.79 million m
3
Others: 5.39 million m
3
Plywood: 3.18 million m
3 Pulp and chips:10.19 million m
3
Lumber: 67.47 million m
3Others:2.55 million m
3
Plywood: 17.15 million m
3
Pulp and chips: 30.42 million m
3
Lumber: 28.59 million m
3
Others: 3.69 million m
3
Plywood: 11.23 million m
3
Pulp and chips: 30.35 million m
3
Lumber: 49.76 million m
3
Others: 3.20 million m
3
Plywood: 15.73 million m
3
Pulp and chips: 43.82 million m
3
Fig. I-6: Changes in the composition of wood demand
(roundwood equivalent)
7
5,274
1,608 2,112
5,249
597
6,537
4,678
0
20
40
60
80
100
0
2,000
4,000
6,000
8,000
10,000
12,000
14,000
1960 1965 1970 1975 1980 1985 1990 1995 2000 2005 2010
(10,000m3) (%)
(Year)
Supply of domestic wood peaked out in 1967
Supply of imported roundwood peaked out in 1973
Supply of imported wood products
peaked out in 1997
Supply of domestic wood hit the bottom in 2002
28.6%
36.7%
78.0%
Domestic wood
Imported roundwood
Imported wood products
Wood self‐sufficiency rate (right axis)Share of domestic production of wood products (right axis)Share of domestic wood used in domestic production (right axis)
to a decrease in number of new housing starts, and wood demand for chip and pulp production decreased.
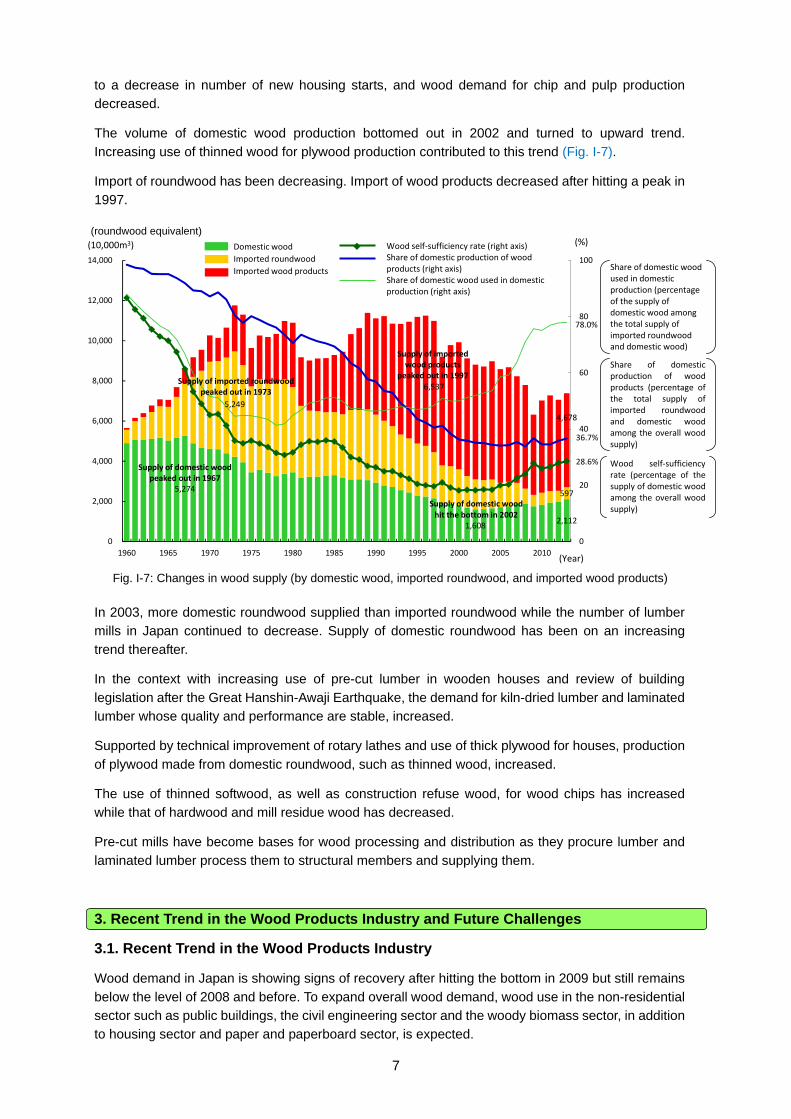
The volume of domestic wood production bottomed out in 2002 and turned to upward trend.
Increasing use of thinned wood for plywood production contributed to this trend (Fig. I-7).
Import of roundwood has been decreasing. Import of wood products decreased after hitting a peak in 1997.
In 2003, more domestic roundwood supplied than imported roundwood while the number of lumber mills in Japan continued to decrease. Supply of domestic roundwood has been on an increasing trend thereafter.
In the context with increasing use of pre-cut lumber in wooden houses and review of building
legislation after the Great Hanshin-Awaji Earthquake, the demand for kiln-dried lumber and laminated lumber whose quality and performance are stable, increased.
Supported by technical improvement of rotary lathes and use of thick plywood for houses, production
of plywood made from domestic roundwood, such as thinned wood, increased.
The use of thinned softwood, as well as construction refuse wood, for wood chips has increased while that of hardwood and mill residue wood has decreased.
Pre-cut mills have become bases for wood processing and distribution as they procure lumber and
laminated lumber process them to structural members and supplying them.
3. Recent Trend in the Wood Products Industry and Future Challenges
3.1. Recent Trend in the Wood Products Industry
Wood demand in Japan is showing signs of recovery after hitting the bottom in 2009 but still remains
below the level of 2008 and before. To expand overall wood demand, wood use in the non-residential sector such as public buildings, the civil engineering sector and the woody biomass sector, in addition to housing sector and paper and paperboard sector, is expected.
Fig. I-7: Changes in wood supply (by domestic wood, imported roundwood, and imported wood products)
Share of domestic wood used in domestic production (percentage of the supply of domestic wood among the total supply of imported roundwood and domestic wood)
Share of domestic production of wood products (percentage of the total supply of imported roundwood and domestic wood among the overall wood supply)
Wood self‐sufficiency rate (percentage of the supply of domestic wood among the overall wood supply)
(roundwood equivalent)
8
Planted forest resources, in particular, are now ready for harvest in Japan. To utilize such resources, building an efficient and stable wood supply system, in response to changing demands, is one of
challenges for forestry and the wood products industry.
Wood import has been on a declining trend, but imported wood still accounts for more than 70% of the total wood demand of which approximately 90%, is imported in the form of wood products. It represents that only around 40% of all the wood products in Japan is produced domestically.
In the meantime, the share of domestic roundwood consumed by the wood processing industry in Japan has risen to nearly 80%. In 2014, the forestry sector and wood products industry sector released the first-ever joint action declaration on the further promotion of wood use.
3.2. Challenges to be tackled by the Wood Products Industry
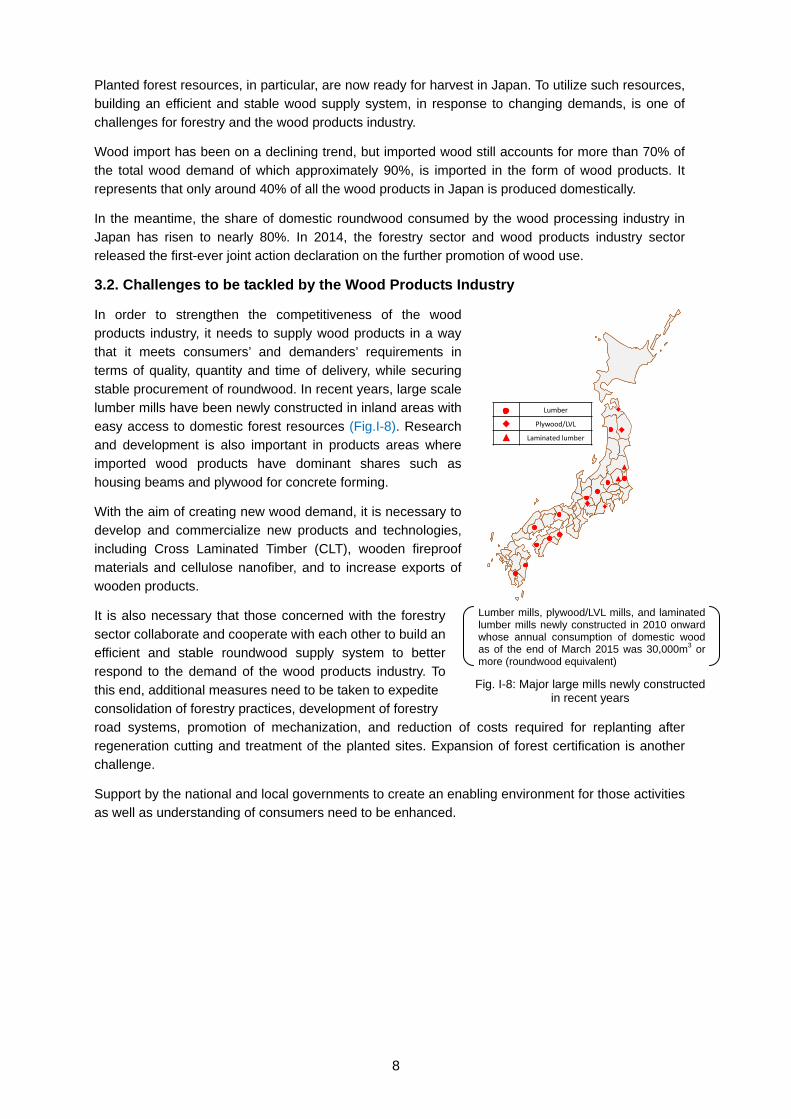
In order to strengthen the competitiveness of the wood products industry, it needs to supply wood products in a way that it meets consumers’ and demanders’ requirements in
terms of quality, quantity and time of delivery, while securing stable procurement of roundwood. In recent years, large scale lumber mills have been newly constructed in inland areas with
easy access to domestic forest resources (Fig.I-8). Research and development is also important in products areas where imported wood products have dominant shares such as
housing beams and plywood for concrete forming.
With the aim of creating new wood demand, it is necessary to develop and commercialize new products and technologies, including Cross Laminated Timber (CLT), wooden fireproof
materials and cellulose nanofiber, and to increase exports of wooden products.
It is also necessary that those concerned with the forestry
sector collaborate and cooperate with each other to build an efficient and stable roundwood supply system to better respond to the demand of the wood products industry. To
this end, additional measures need to be taken to expedite consolidation of forestry practices, development of forestry road systems, promotion of mechanization, and reduction of costs required for replanting after
regeneration cutting and treatment of the planted sites. Expansion of forest certification is another challenge.
Support by the national and local governments to create an enabling environment for those activities as well as understanding of consumers need to be enhanced.
Lumber
Plywood/LVL
Laminated lumber
Fig. I-8: Major large mills newly constructed in recent years
Lumber mills, plywood/LVL mills, and laminated lumber mills newly constructed in 2010 onward whose annual consumption of domestic wood as of the end of March 2015 was 30,000m3 or more (roundwood equivalent)

9
Chapter II Forest Management and Conservation
1. Current State of Forests and Basic Policy for Forest Management and Conservation
1.1. Forest Resources and Multiple Functions
Two-thirds of Japan’s land area is covered
with forests, with a total forested area of 25 million hectares. Approximately 40% of these forests are artificially planted forests.
The total growing stock is increasing by around 100 million m3 annually, and has now reached approximately 4.9 billion m3
(Fig.II-1).
Forests now provide a variety of goods and services indispensable for people’s lives
and national economy in Japan through the fulfilment of multiple functions such as land conservation, watershed conservation, and mitigation of global warming, among others.
1.2. Fundamental Policy on Forest and Forestry
Forest management and conservation activities are being implemented based on the “Forest and Forestry Basic Plan” (July 2011) which was formulated in accordance with the “Forest and Forestry Basic Act” as well as the “National Forest Plan” (October 2013), formulated in accordance with the
“Forest Act.”
National strategies, the “Japan Revitalization Strategy” and the “Plan for Creating Dynamism through Agriculture, Forestry and Fishery Industries and Local Communities” state such objectives as transforming forestry into a growth industry through the creation of new wood demand and promoting
forest sink activities through forest management and conservation in view of enhancing contribution of the forest sectors to the mitigation of global warming.
2. Forest Management
2.1. Promotion of Forest Management
Thinning practices and replanting after regeneration cutting, which are crucial for the maintenance of forest conditions, have been carried out while promoting proper use of forest resources. In some forests, depending on the respective locational conditions, management practices for developing
multi-storied forests and long-rotation management have been conducted. It is necessary to carry out thinning as extensively as a total of 520 thousand hectares annually in order to ensure the carbon sequestration required for achieving Japan’s greenhouse gas (GHG) emission reduction target. In
FY2013, the total area of thinned forests was 520,000 hectares as the same as the target.
The urgent challenge is how to secure stable financial resources for forest management to back up thinning practices required for meeting the GHG emission reduction target, while currently such
forest management is implemented by national programs.
The revised “Forest Act” in 2011 introduced the administrative order system to halt logging which has been practiced without giving notification to the authority and oblige those loggers to replant on the site as well as the assurance system of proper management of forests even in cases where the forest
owners are unidentified. The Forestry Agency is conducting a survey on forest acquisition by foreigners and 14 cases (totaling 194 hectares) were reported in 2013.
Fig. II-1: Growing stock in forest
5.6 8.0 13.6 18.9 23.4 26.5 30.4
13.3 13.9 15.0
15.9 17.0
17.8 18.6
18.9 21.9
28.6 34.8
40.4 44.3
49.0
0
10
20
30
40
50
60
1966 1976 1986 1995 2002 2007 2012
Natural and other forest
Planted forest
(100 million m3)
(Year)
10
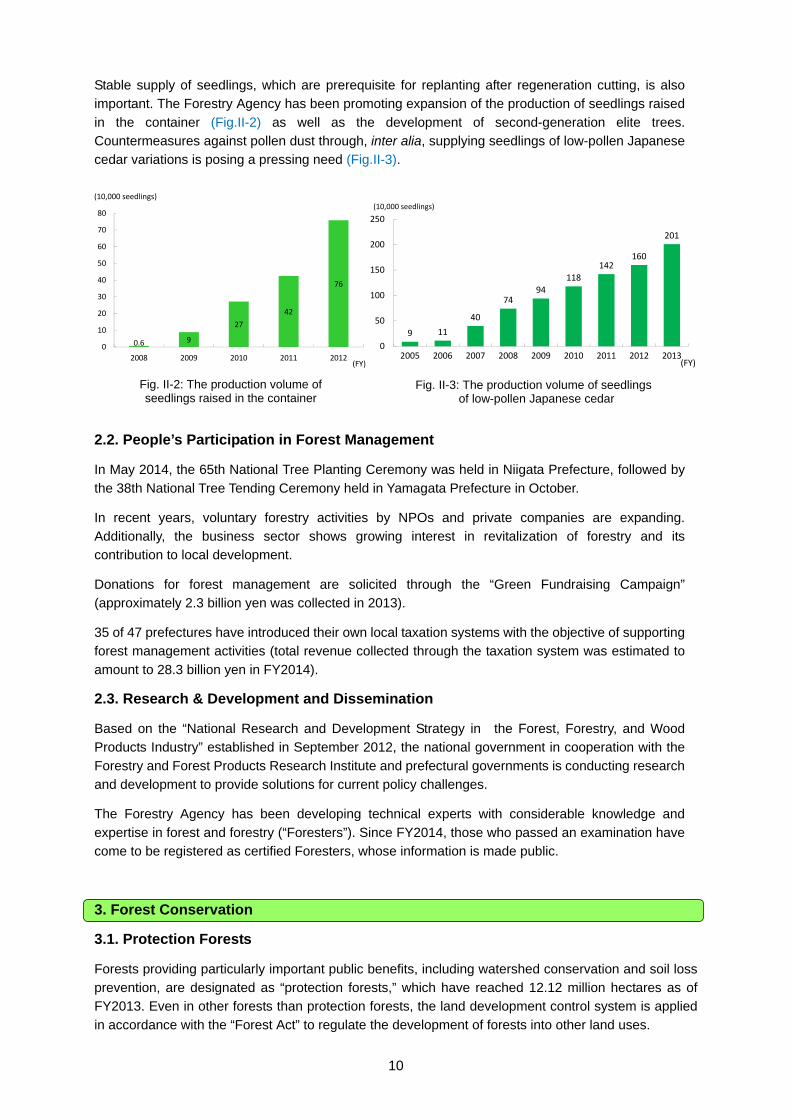
Stable supply of seedlings, which are prerequisite for replanting after regeneration cutting, is also important. The Forestry Agency has been promoting expansion of the production of seedlings raised
in the container (Fig.II-2) as well as the development of second-generation elite trees. Countermeasures against pollen dust through, inter alia, supplying seedlings of low-pollen Japanese cedar variations is posing a pressing need (Fig.II-3).
2.2. People’s Participation in Forest Management
In May 2014, the 65th National Tree Planting Ceremony was held in Niigata Prefecture, followed by
the 38th National Tree Tending Ceremony held in Yamagata Prefecture in October.
In recent years, voluntary forestry activities by NPOs and private companies are expanding. Additionally, the business sector shows growing interest in revitalization of forestry and its contribution to local development.
Donations for forest management are solicited through the “Green Fundraising Campaign” (approximately 2.3 billion yen was collected in 2013).
35 of 47 prefectures have introduced their own local taxation systems with the objective of supporting forest management activities (total revenue collected through the taxation system was estimated to
amount to 28.3 billion yen in FY2014).
2.3. Research & Development and Dissemination
Based on the “National Research and Development Strategy in the Forest, Forestry, and Wood Products Industry” established in September 2012, the national government in cooperation with the
Forestry and Forest Products Research Institute and prefectural governments is conducting research and development to provide solutions for current policy challenges.
The Forestry Agency has been developing technical experts with considerable knowledge and
expertise in forest and forestry (“Foresters”). Since FY2014, those who passed an examination have come to be registered as certified Foresters, whose information is made public.
3. Forest Conservation
3.1. Protection Forests
Forests providing particularly important public benefits, including watershed conservation and soil loss prevention, are designated as “protection forests,” which have reached 12.12 million hectares as of FY2013. Even in other forests than protection forests, the land development control system is applied
in accordance with the “Forest Act” to regulate the development of forests into other land uses.
Fig. II-3: The production volume of seedlings of low-pollen Japanese cedar
Fig. II-2: The production volume of seedlings raised in the container
0.6 9
27
42
76
0
10
20
30
40
50
60
70
80
2008 2009 2010 2011 2012(FY)
(10,000 seedlings)
9 11
40
7494
118
142160
201
0
50
100
150
200
250
2005 2006 2007 2008 2009 2010 2011 2012 2013
(10,000 seedlings)
(FY)
11
3.2. Disaster Control
In response to natural disasters which occured in mountainous areas, the Forestry Agency dispatched technical officials to the damaged areas to conduct surveys of the extent of the damage as well as to
elaborate recovery work.
The Forestry Agency and prefectural governments conduct “forest conservation projects.” The projects include installation of disaster control facilities, replanting trees for the stabilization of mountain slopes,
restoration of devastated mountain streams and development of coastal disaster-prevention forests.
3.3. Conservation of Forest Biodiversity
The Forestry Agency is promoting appropriate thinning, the development of ecologically diversified forests and the conservation of wilderness forest ecosystems, based on the “National Biodiversity
Strategy of Japan 2012-2020,” which was adopted by the Government of Japan (GOJ) in September 2012.
The Forestry Agency is also promoting the conservation of forests including those identified as World Heritage sites. In 2014, “Tadami” and “Minami-Alps” were newly added to the World Network of
Biosphere Reserves while the area of the “Shiga Highlands Biosphere Reserve” was expanded.
3.4. Wildlife and Pest Control
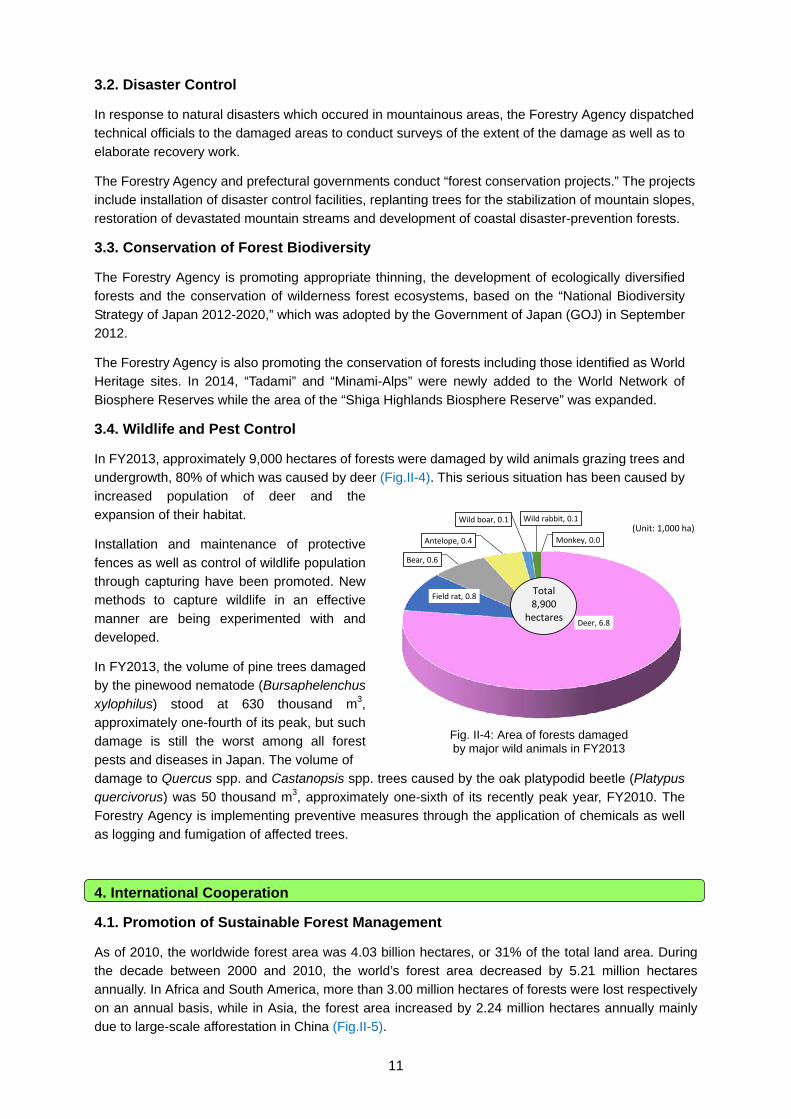
In FY2013, approximately 9,000 hectares of forests were damaged by wild animals grazing trees and undergrowth, 80% of which was caused by deer (Fig.II-4). This serious situation has been caused by
increased population of deer and the expansion of their habitat.
Installation and maintenance of protective
fences as well as control of wildlife population through capturing have been promoted. New methods to capture wildlife in an effective
manner are being experimented with and developed.
In FY2013, the volume of pine trees damaged by the pinewood nematode (Bursaphelenchus
xylophilus) stood at 630 thousand m3, approximately one-fourth of its peak, but such damage is still the worst among all forest
pests and diseases in Japan. The volume of damage to Quercus spp. and Castanopsis spp. trees caused by the oak platypodid beetle (Platypus quercivorus) was 50 thousand m3, approximately one-sixth of its recently peak year, FY2010. The
Forestry Agency is implementing preventive measures through the application of chemicals as well as logging and fumigation of affected trees.
4. International Cooperation
4.1. Promotion of Sustainable Forest Management
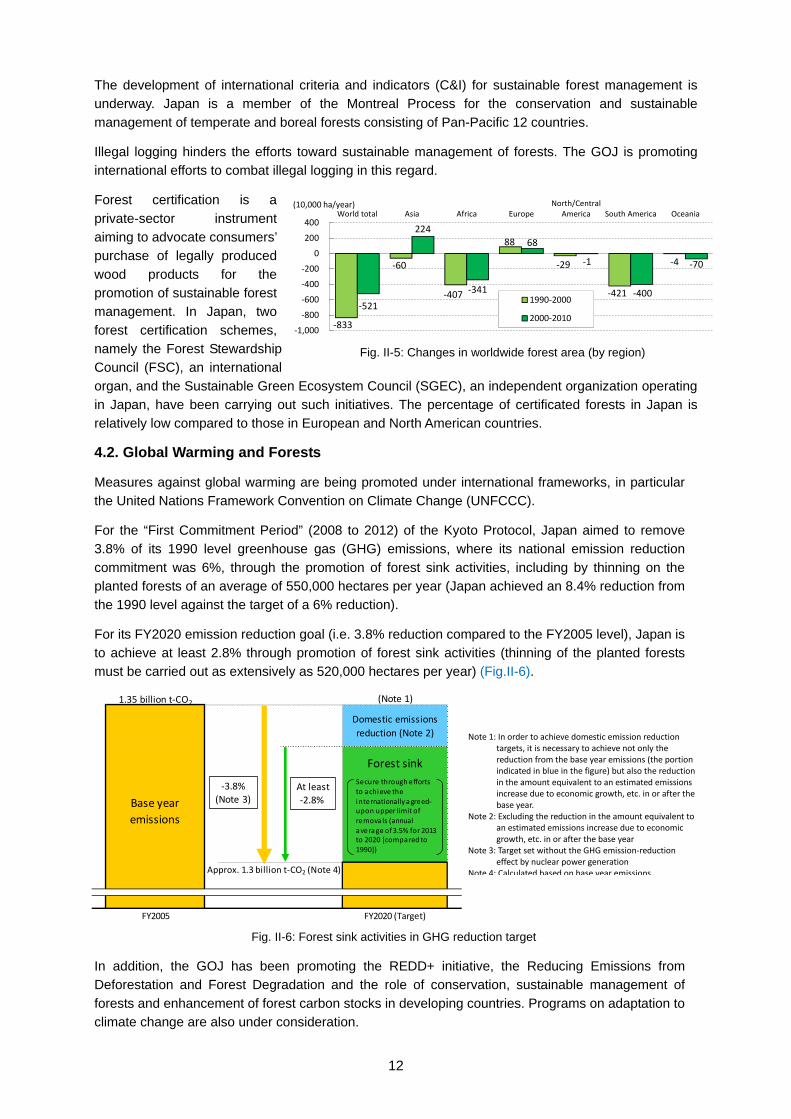
As of 2010, the worldwide forest area was 4.03 billion hectares, or 31% of the total land area. During the decade between 2000 and 2010, the world’s forest area decreased by 5.21 million hectares annually. In Africa and South America, more than 3.00 million hectares of forests were lost respectively
on an annual basis, while in Asia, the forest area increased by 2.24 million hectares annually mainly due to large-scale afforestation in China (Fig.II-5).
Deer, 6.8
Field rat, 0.8
Bear, 0.6
Antelope, 0.4
Wild boar, 0.1 Wild rabbit, 0.1
Monkey, 0.0
(Unit: 1,000 ha)
Total8,900
hectares
Fig. II-4: Area of forests damaged by major wild animals in FY2013
12
The development of international criteria and indicators (C&I) for sustainable forest management is underway. Japan is a member of the Montreal Process for the conservation and sustainable
management of temperate and boreal forests consisting of Pan-Pacific 12 countries.
Illegal logging hinders the efforts toward sustainable management of forests. The GOJ is promoting international efforts to combat illegal logging in this regard.
Forest certification is a
private-sector instrument aiming to advocate consumers’ purchase of legally produced
wood products for the promotion of sustainable forest management. In Japan, two
forest certification schemes, namely the Forest Stewardship Council (FSC), an international
organ, and the Sustainable Green Ecosystem Council (SGEC), an independent organization operating in Japan, have been carrying out such initiatives. The percentage of certificated forests in Japan is relatively low compared to those in European and North American countries.
4.2. Global Warming and Forests
Measures against global warming are being promoted under international frameworks, in particular the United Nations Framework Convention on Climate Change (UNFCCC).
For the “First Commitment Period” (2008 to 2012) of the Kyoto Protocol, Japan aimed to remove 3.8% of its 1990 level greenhouse gas (GHG) emissions, where its national emission reduction
commitment was 6%, through the promotion of forest sink activities, including by thinning on the planted forests of an average of 550,000 hectares per year (Japan achieved an 8.4% reduction from the 1990 level against the target of a 6% reduction).
For its FY2020 emission reduction goal (i.e. 3.8% reduction compared to the FY2005 level), Japan is to achieve at least 2.8% through promotion of forest sink activities (thinning of the planted forests must be carried out as extensively as 520,000 hectares per year) (Fig.II-6).
In addition, the GOJ has been promoting the REDD+ initiative, the Reducing Emissions from Deforestation and Forest Degradation and the role of conservation, sustainable management of
forests and enhancement of forest carbon stocks in developing countries. Programs on adaptation to climate change are also under consideration.
‐833
‐60
‐407
88
‐29
‐421
‐4
‐521
224
‐341
68
‐1
‐400
‐70
‐1,000
‐800
‐600
‐400
‐200
0
200
400World total Asia Africa Europe
North/CentralAmerica South America Oceania
(10,000 ha/year)
1990‐2000
2000‐2010
Fig. II-5: Changes in worldwide forest area (by region)
Note 1: In order to achieve domestic emission reduction targets, it is necessary to achieve not only the reduction from the base year emissions (the portion indicated in blue in the figure) but also the reduction in the amount equivalent to an estimated emissions increase due to economic growth, etc. in or after the base year.
Note 2: Excluding the reduction in the amount equivalent to an estimated emissions increase due to economic growth, etc. in or after the base year
Note 3: Target set without the GHG emission‐reduction effect by nuclear power generation
Note 4: Calculated based on base year emissions
1.35 billion t‐CO2 (Note 1)
Approx. 1.3 billion t‐CO2 (Note 4)
FY2005 FY2020 (Target)
Domestic emissions
reduction (Note 2)
Base year
emissions
Forest sink
‐3.8%(Note 3)
At least
‐2.8%
Secure through efforts
to achieve the
internationally agreed‐upon upper limit of
removals (annual
average of 3.5% for 2013 to 2020 [compared to
1990])
Fig. II-6: Forest sink activities in GHG reduction target

13
4.3. International Discussions on Biodiversity
It is estimated that at least 80% of the earth’s remaining terrestrial biodiversity is found in forests. As of December 2014, the Convention on Biological Diversity has been signed by 193 countries and the
European Union (EU).
4.4. Japan’s Cooperation
Japan is implementing international cooperation for the promotion of sustainable forest management in developing countries by providing technical and financial assistance through bilateral and
multilateral schemes.
14
Chapter III Forestry and Rural Mountain Communities
1. Forestry
1.1. Forestry Production
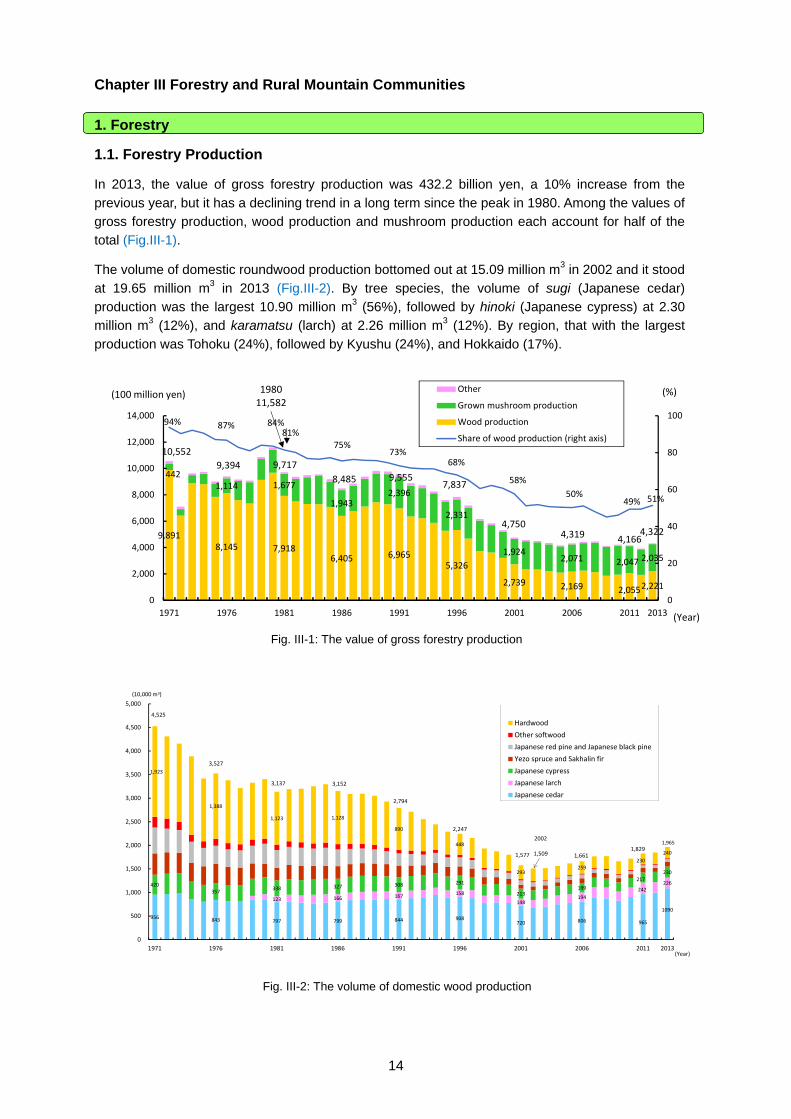
In 2013, the value of gross forestry production was 432.2 billion yen, a 10% increase from the
previous year, but it has a declining trend in a long term since the peak in 1980. Among the values of gross forestry production, wood production and mushroom production each account for half of the total (Fig.III-1).
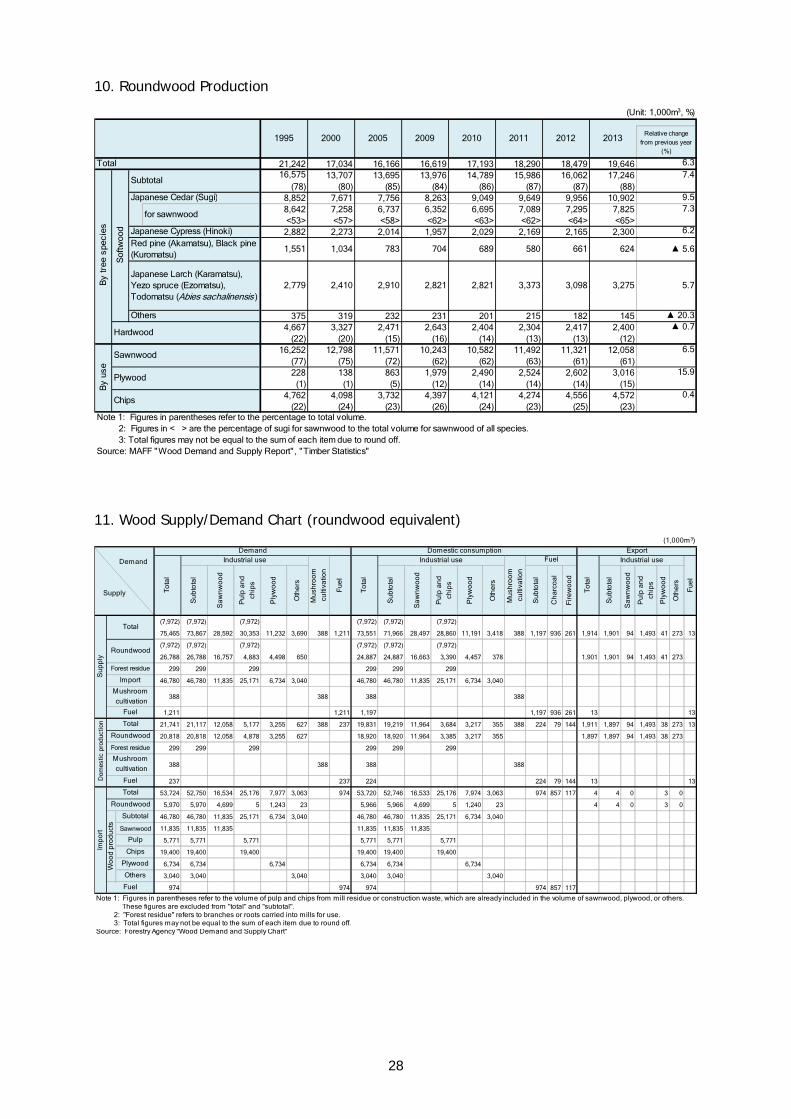
The volume of domestic roundwood production bottomed out at 15.09 million m3 in 2002 and it stood
at 19.65 million m3 in 2013 (Fig.III-2). By tree species, the volume of sugi (Japanese cedar) production was the largest 10.90 million m3 (56%), followed by hinoki (Japanese cypress) at 2.30 million m3 (12%), and karamatsu (larch) at 2.26 million m3 (12%). By region, that with the largest
production was Tohoku (24%), followed by Kyushu (24%), and Hokkaido (17%).
9,8918,145 7,918
6,405 6,9655,326
2,739 2,169 2,0552,221
4421,114 1,677
1,9432,396
2,331
1,9242,071 2,047 2,035
10,552
9,394 9,717
8,485 9,5557,837
4,7504,319 4,322
94% 87% 84%81%
75% 73%
68%
58%
50% 49% 51%
0
20
40
60
80
100
0
2,000
4,000
6,000
8,000
10,000
12,000
14,000
1971 1976 1981 1986 1991 1996 2001 2006 2011
Other
Grown mushroom production
Wood production
Share of wood production (right axis)
(100 million yen) (%)198011,582
(Year)2013
4,166
956 843 797 799 844 908 720 806 965
1090
123 166 167 158
148 194
242 226 420
357 338 327 308 291
213 199
217
230
1,923
1,388
1,123 1,128
890
448
293 259
230
240
3,137 3,152
2,794
2,247
1,577
2002
1,509 1,661 1,829
1,965
0
500
1,000
1,500
2,000
2,500
3,000
3,500
4,000
4,500
5,000
1971 1976 1981 1986 1991 1996 2001 2006 2011 2013
Hardwood
Other softwood
Japanese red pine and Japanese black pine
Yezo spruce and Sakhalin fir
Japanese cypress
Japanese larch
Japanese cedar
4,525
(10,000 m3)
(Year)
3,527
Fig. III-1: The value of gross forestry production
Fig. III-2: The volume of domestic wood production
15
1.2. Forestry Management
In Japan, most of the private forests are owned by a large number of small scale forest owners.
Aging of forest owners and increasing number of forest owners who live away from their forests make
it more onerous to identify forest owners and forest boundaries. The revised “Forest Act” in 2011 introduced a mandatory notification system that requires new forest owners to register with the local municipality and also promotes the sharing of forest owners’ information within relevant departments
of local governments. Cadastral surveys are being conducted in forests.
Small portion of forest owners depends for their livelihood on the income derived from forestry activities. Generally, small-scale forest owners entrust the management of their forests with others such as the Forest Owners’ Cooperatives, but some of them conduct thinning operations by
themselves and transport the thinned wood to sell to chip mills, firewood consumers or woody biomass energy plants.
The Forest Owners’ Cooperatives are major forest management bodies, accounting for more than
half of forestry activities, including planting, weeding and thinning. Approximately 70% of regeneration cutting is conducted by private forestry contractors.
1.3. Improvement of Forestry Productivity
To improve forestry productivity, the “coordination and consolidation of forestry practices” among
groups of small-scale forest owners is necessary. To this end, the Forestry Agency is implementing the training program for “Forest Management Planners” who should lead proposal-based coordination with forest owners and consolidation of forestry practices, taking major responsibility in
operating the forest management planning system under the “Forest Act” in a flexible manner in accordance with the on-the-ground situation. Conducting field surveys and consensus-building activities are supported for this purpose.
It is a matter of importance to accelerate the development of the forestry road system using the best
applicable combination of three forest road types: the mainline “forest road” for general vehicles, the “forestry exclusive road” for truck vehicles and the “forestry operation road” for forestry machinery. Fostering technical experts who can implement the planning and construction of forestry road
systems is also needed.
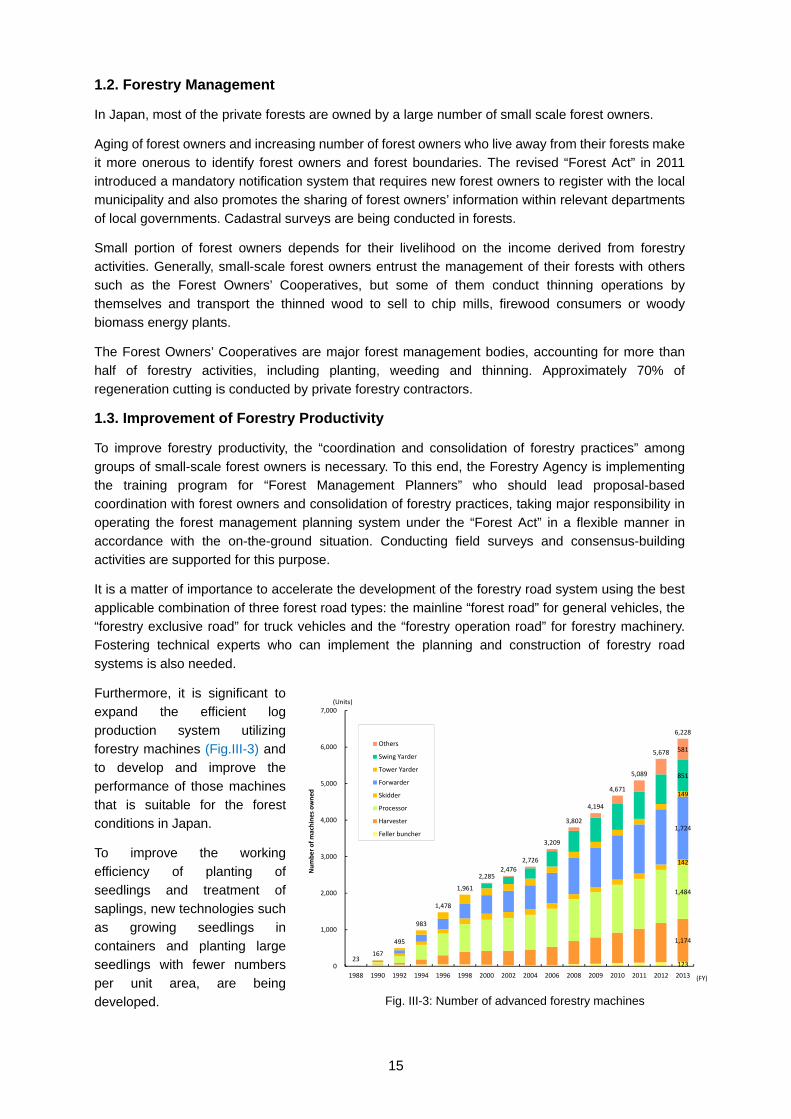
Furthermore, it is significant to expand the efficient log
production system utilizing forestry machines (Fig.III-3) and to develop and improve the
performance of those machines that is suitable for the forest conditions in Japan.
To improve the working
efficiency of planting of seedlings and treatment of saplings, new technologies such
as growing seedlings in containers and planting large seedlings with fewer numbers
per unit area, are being developed.
Fig. III-3: Number of advanced forestry machines
123
1,174
1,484
142
1,724
149
851
581
23 167
495
983
1,478
1,961
2,285 2,476
2,726
3,209
3,802
4,194
4,671
5,089
5,678
6,228
0
1,000
2,000
3,000
4,000
5,000
6,000
7,000
1988 1990 1992 1994 1996 1998 2000 2002 2004 2006 2008 2009 2010 2011 2012 2013
Others
Swing Yarder
Tower Yarder
Forwarder
Skidder
Processor
Harvester
Feller buncher
(Units)
(FY)
Number of machines owned
16
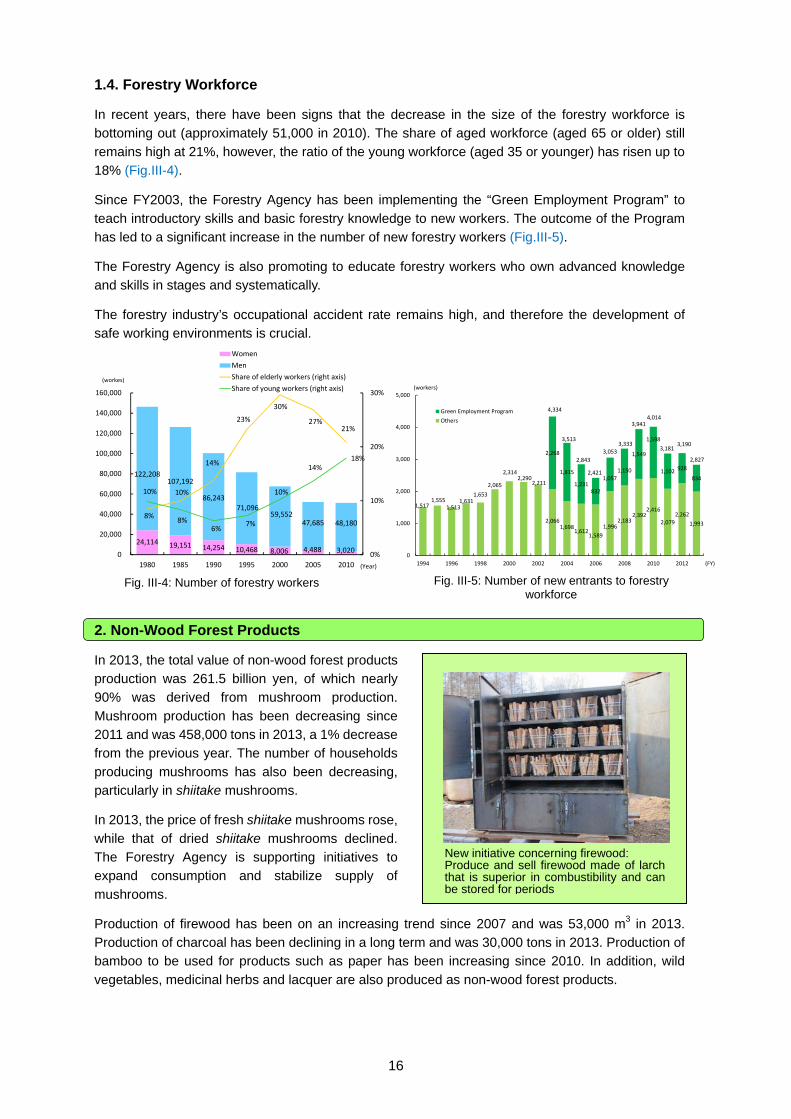
1.4. Forestry Workforce
In recent years, there have been signs that the decrease in the size of the forestry workforce is bottoming out (approximately 51,000 in 2010). The share of aged workforce (aged 65 or older) still
remains high at 21%, however, the ratio of the young workforce (aged 35 or younger) has risen up to 18% (Fig.III-4).
Since FY2003, the Forestry Agency has been implementing the “Green Employment Program” to
teach introductory skills and basic forestry knowledge to new workers. The outcome of the Program has led to a significant increase in the number of new forestry workers (Fig.III-5).
The Forestry Agency is also promoting to educate forestry workers who own advanced knowledge and skills in stages and systematically.
The forestry industry’s occupational accident rate remains high, and therefore the development of safe working environments is crucial.
2. Non-Wood Forest Products
In 2013, the total value of non-wood forest products production was 261.5 billion yen, of which nearly 90% was derived from mushroom production.
Mushroom production has been decreasing since 2011 and was 458,000 tons in 2013, a 1% decrease from the previous year. The number of households
producing mushrooms has also been decreasing, particularly in shiitake mushrooms.
In 2013, the price of fresh shiitake mushrooms rose,
while that of dried shiitake mushrooms declined. The Forestry Agency is supporting initiatives to expand consumption and stabilize supply of
mushrooms.
Production of firewood has been on an increasing trend since 2007 and was 53,000 m3 in 2013. Production of charcoal has been declining in a long term and was 30,000 tons in 2013. Production of bamboo to be used for products such as paper has been increasing since 2010. In addition, wild
vegetables, medicinal herbs and lacquer are also produced as non-wood forest products.
Fig. III-5: Number of new entrants to forestry workforce
Fig. III-4: Number of forestry workers
24,114 19,151 14,254 10,468 8,006 4,488 3,020
122,208 107,192
86,24371,096
59,55247,685 48,180
8%
10%
14%
23%
30%
27%21%
10%
8%6%
7%
10%
14%18%
0%
10%
20%
30%
0
20,000
40,000
60,000
80,000
100,000
120,000
140,000
160,000
1980 1985 1990 1995 2000 2005 2010
Women
Men
Share of elderly workers (right axis)
Share of young workers (right axis)(workes)
(Year)
2,0661,698
1,6121,589
1,9962,183
2,3922,416
2,079
2,262
1,993
2,268
1,815
1,231832
1,057
1,150
1,549
1,598
1,102 928
834
1,5171,555
1,5131,631
1,653
2,065
2,3142,290
2,211
4,334
3,513
2,843
2,421
3,0533,333
3,9414,014
3,1813,190
2,827
0
1,000
2,000
3,000
4,000
5,000
1994 1996 1998 2000 2002 2004 2006 2008 2010 2012
Green Employment Program
Others
(workers)
(FY)
New initiative concerning firewood: Produce and sell firewood made of larch that is superior in combustibility and can be stored for periods
17
3. Rural Mountain Communities
3.1. Current state of Rural Mountain Communities
Rural mountain communities, where people engaging in forestry are living, play a significant role in
securing multiple functions of forests. In Japan, mountain village areas due for development designated pursuant to the “Mountain Villages Development Act” cover 50% of the total land area, accounting for 60% of the total forest area. It is becoming more difficult to maintain the management
of forests due to continuing depopulation and aging population in such communities.
On the other hand, some of urban residents have come to show greater interests in the life of rural mountain communities as they are equipped with rich forest and water resources, beautiful
landscapes, traditions and cultures.
3.2. Revitalization of Rural Mountain Communities
The comprehensive strategy for regional revitalization, which was established in December 2014 by the GOJ, states that it is necessary to transform forestry into a growth industry, while ensuring
circular utilization of forest resources.
The Forestry Agency promotes the development of forestry and wood products industries, which are backbone of industries in rural areas as well as the creation of new businesses that utilize forest resources, including energy generation from woody biomass. In March 2015, the “Mountain Villages
Development Act” was revised and extended with the aim of enhancing measures for developing rural mountain communities.
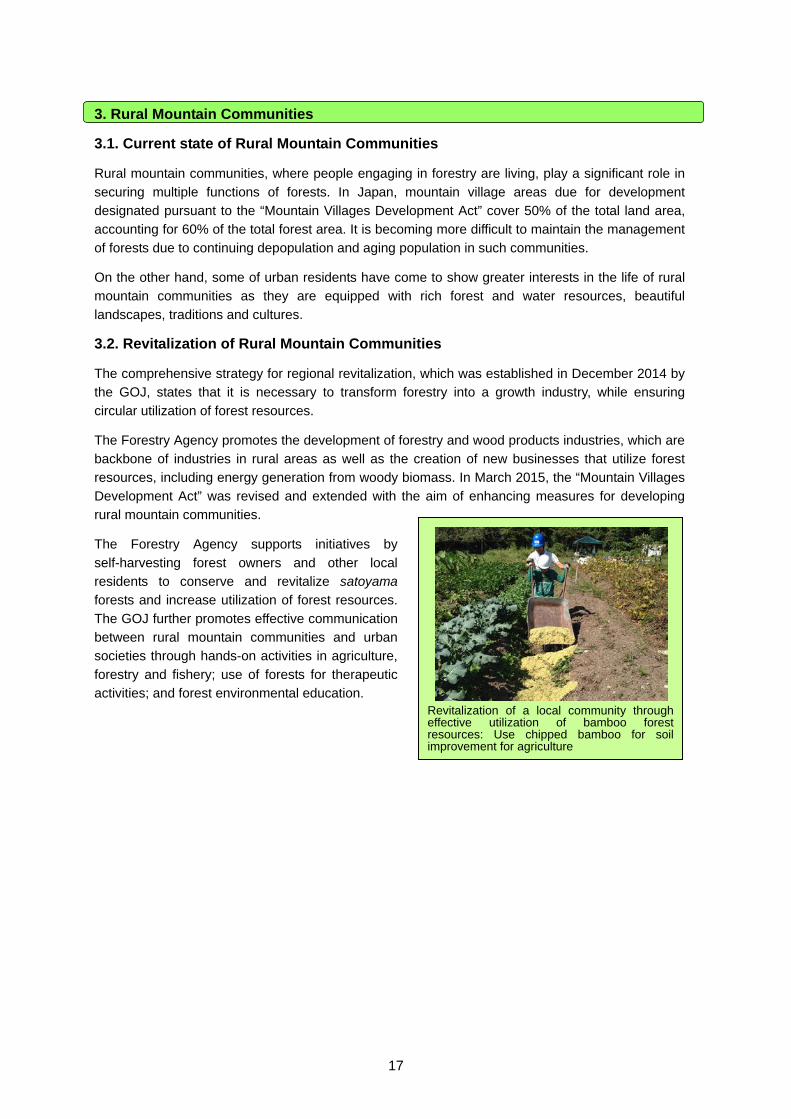
The Forestry Agency supports initiatives by
self-harvesting forest owners and other local residents to conserve and revitalize satoyama forests and increase utilization of forest resources.
The GOJ further promotes effective communication between rural mountain communities and urban societies through hands-on activities in agriculture,
forestry and fishery; use of forests for therapeutic activities; and forest environmental education.
Revitalization of a local community through effective utilization of bamboo forest resources: Use chipped bamboo for soil improvement for agriculture
18
Chapter IV Wood Demand/Supply and Wood Use
1. Demand and Supply
1.1. World Wood Demand and Supply
The total volume of industrial roundwood consumption in the global level had decreased since the
autumn of 2008 but turned to increase again in 2010. Sawn softwood consumption is recovering in North America but continues to remain stagnant in Europe, where export of sawn softwood increased.
In Russia, exports of industrial roundwood are decreasing, while exports of sawn softwood are
increasing. China is increasing both imports of industrial roundwood and exports of plywood.
1.2. Wood Demand and Supply in Japan
Japan’s wood demand is showing signs of recovery after hitting the bottom in 2009 and increased by 4.6% from the previous year in 2013, reaching 73.87 million m3 (roundwood equivalent), with
increase in the number of new housing starts.
Domestic wood supply has been increasing since bottoming out in 2002. In 2013, it increased by 7.3% from the previous year, reaching 21.12 million m3 (roundwood equivalent).
The volume of imported wood increased to 52.75 million m3 (roundwood equivalent), up by 3.5%
from the previous year, due to the increase in the total demand, in 2013.
The self-sufficiency rate for wood has been recovering since bottoming out in 2002, and was 28.6% in 2013, up by 0.7 points from the previous year.
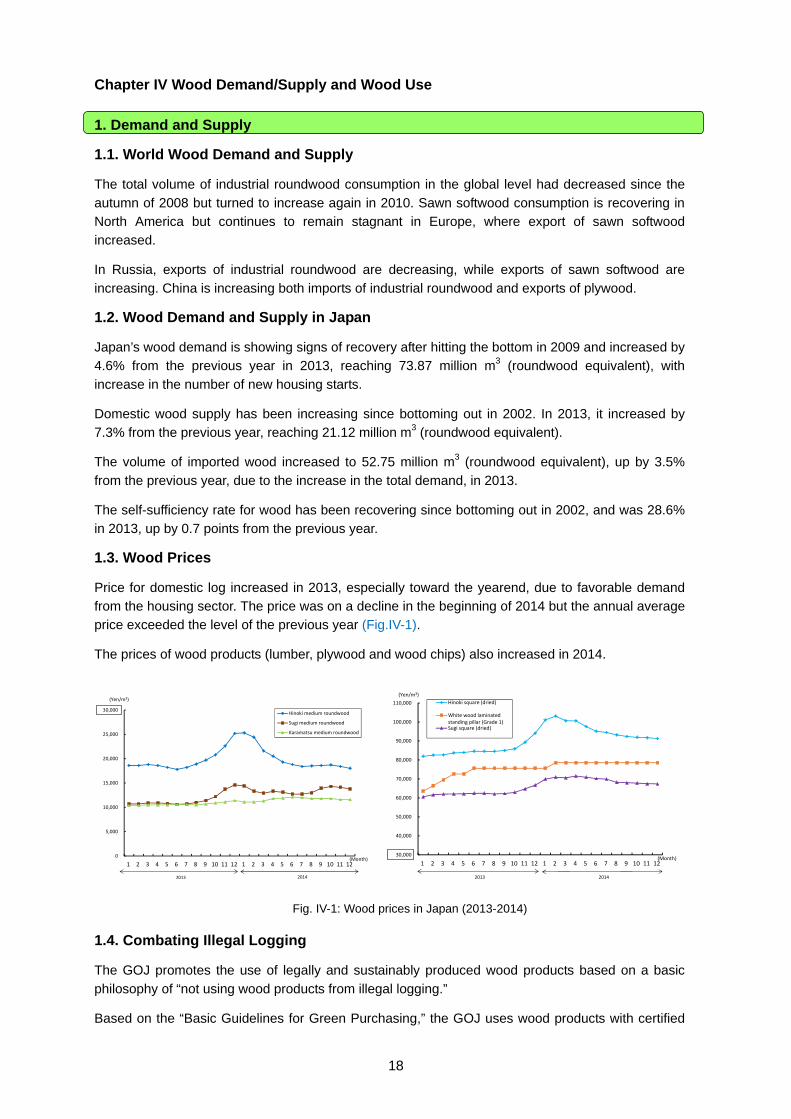
1.3. Wood Prices
Price for domestic log increased in 2013, especially toward the yearend, due to favorable demand from the housing sector. The price was on a decline in the beginning of 2014 but the annual average price exceeded the level of the previous year (Fig.IV-1).
The prices of wood products (lumber, plywood and wood chips) also increased in 2014.
0
5,000
10,000
15,000
20,000
25,000
30,000
1 2 3 4 5 6 7 8 9 10 11 12 1 2 3 4 5 6 7 8 9 10 11 12
Hinoki medium roundwood
Sugi medium roundwood
Karamatsu medium roundwood
(Month)
20142013
(Yen/m3)
30,000
40,000
50,000
60,000
70,000
80,000
90,000
100,000
110,000
1 2 3 4 5 6 7 8 9 10 11 12 1 2 3 4 5 6 7 8 9 10 11 12
Hinoki square (dried)
White wood laminatedstanding pillar (Grade 1)Sugi square (dried)
(Yen/m3)
(Month)
20142013
1.4. Combating Illegal Logging
The GOJ promotes the use of legally and sustainably produced wood products based on a basic
philosophy of “not using wood products from illegal logging.”
Based on the “Basic Guidelines for Green Purchasing,” the GOJ uses wood products with certified
Fig. IV-1: Wood prices in Japan (2013-2014)
19
legality and sustainability in government procurements. It is also engaging in dissemination activities that encourage private companies and general consumers to use legally-harvested wood products.
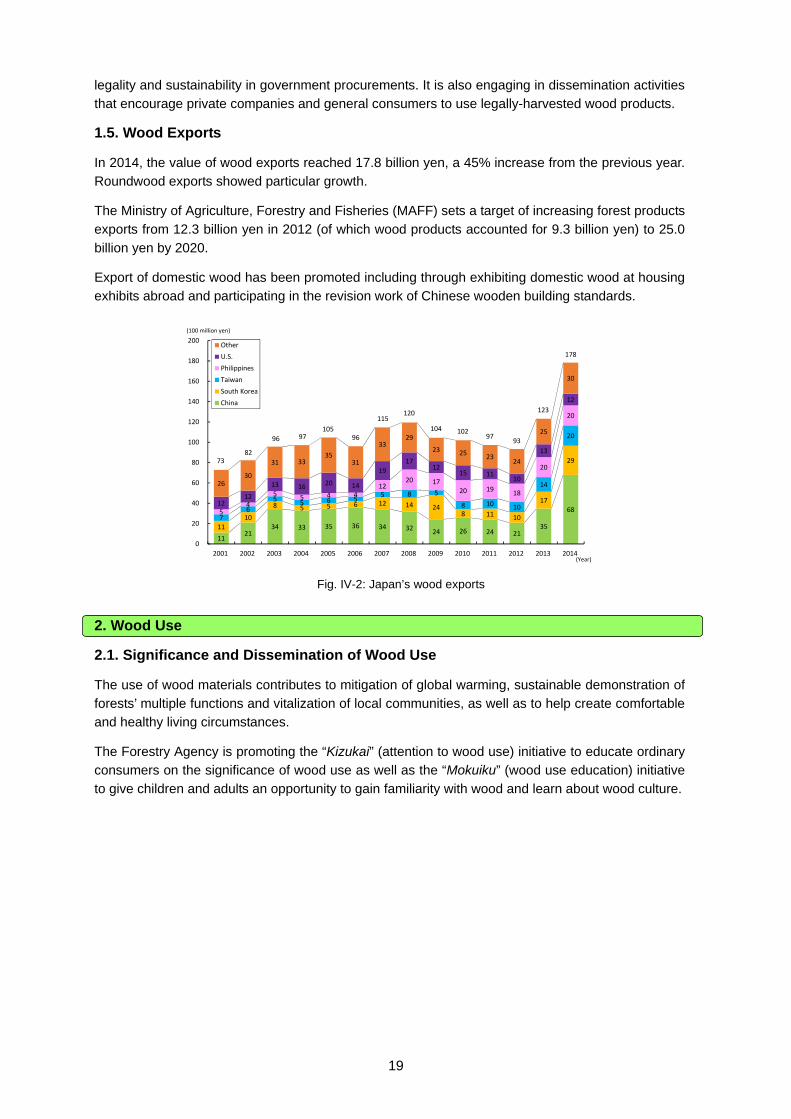
1.5. Wood Exports
In 2014, the value of wood exports reached 17.8 billion yen, a 45% increase from the previous year. Roundwood exports showed particular growth.
The Ministry of Agriculture, Forestry and Fisheries (MAFF) sets a target of increasing forest products exports from 12.3 billion yen in 2012 (of which wood products accounted for 9.3 billion yen) to 25.0
billion yen by 2020.
Export of domestic wood has been promoted including through exhibiting domestic wood at housing exhibits abroad and participating in the revision work of Chinese wooden building standards.
11 21
34 33 35 36 34 32 24 26 24 21
35
68
11
10
8 5 5 6 12 14 24 8 11 10
17
29
7 6
5 5 6 5
5 8 5
8 10 10
14
20
5 4
5 5 4 4 12
20 17 20 19
18
20
20
12 12
13 16 20 14
19
17 12
15 11 10
13
12
26 30
31 33 35
31
33 29
23 25 23
24
25
30
0
20
40
60
80
100
120
140
160
180
200
2001 2002 2003 2004 2005 2006 2007 2008 2009 2010 2011 2012 2013 2014
Other
U.S.
Philippines
Taiwan
South Korea
China
7382
96 97105
96
115120
104 10297
93
123
(Year)
(100 million yen)
178
2. Wood Use
2.1. Significance and Dissemination of Wood Use
The use of wood materials contributes to mitigation of global warming, sustainable demonstration of forests’ multiple functions and vitalization of local communities, as well as to help create comfortable and healthy living circumstances.
The Forestry Agency is promoting the “Kizukai” (attention to wood use) initiative to educate ordinary consumers on the significance of wood use as well as the “Mokuiku” (wood use education) initiative to give children and adults an opportunity to gain familiarity with wood and learn about wood culture.
Fig. IV-2: Japan’s wood exports
20
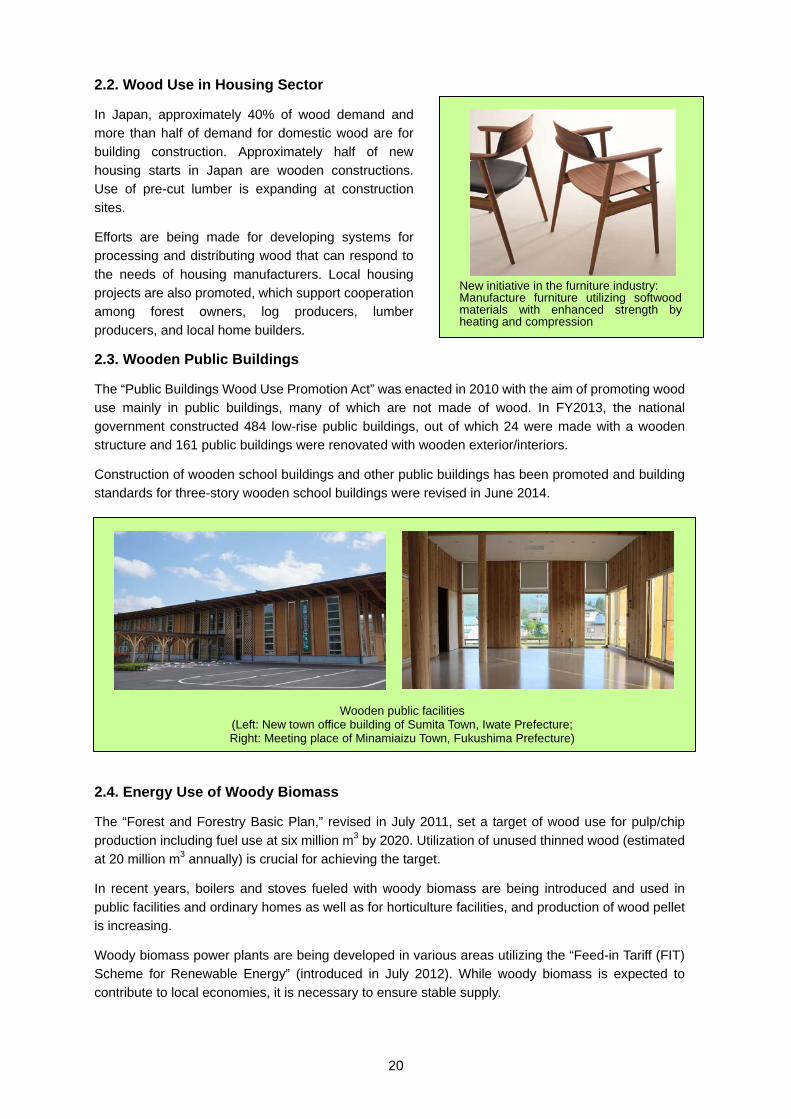
2.2. Wood Use in Housing Sector
In Japan, approximately 40% of wood demand and more than half of demand for domestic wood are for
building construction. Approximately half of new housing starts in Japan are wooden constructions. Use of pre-cut lumber is expanding at construction
sites.
Efforts are being made for developing systems for processing and distributing wood that can respond to
the needs of housing manufacturers. Local housing projects are also promoted, which support cooperation among forest owners, log producers, lumber
producers, and local home builders.
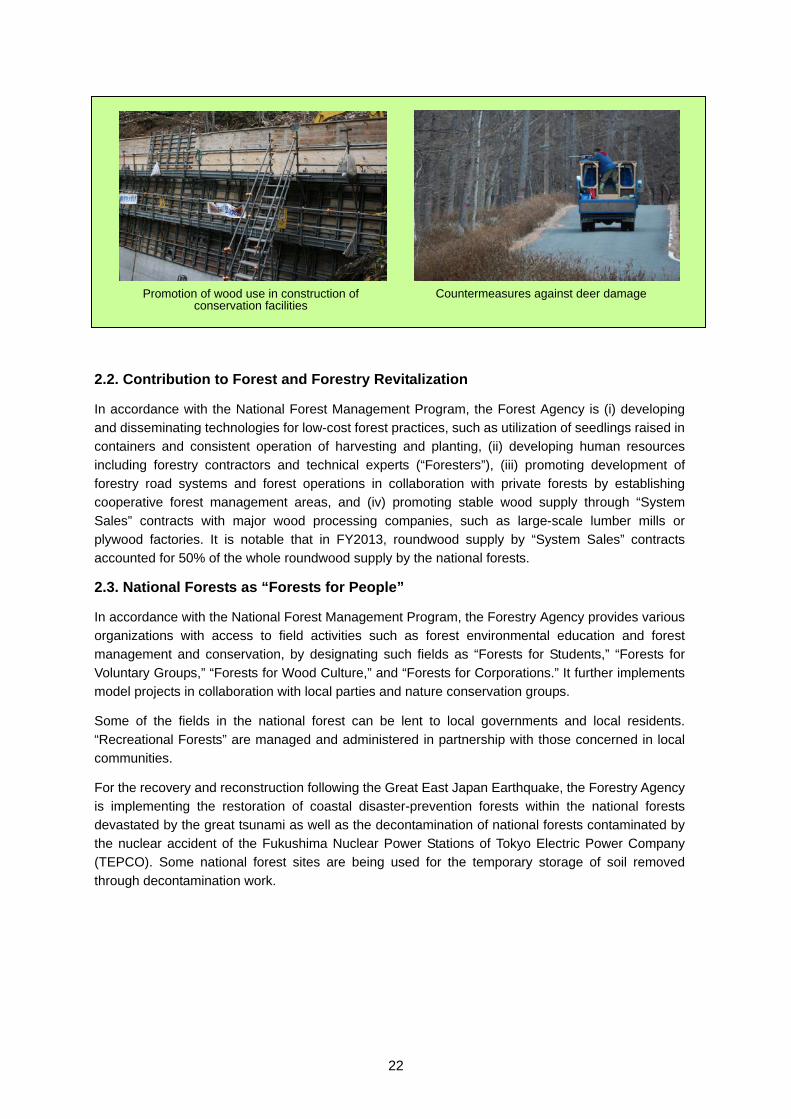
2.3. Wooden Public Buildings
The “Public Buildings Wood Use Promotion Act” was enacted in 2010 with the aim of promoting wood use mainly in public buildings, many of which are not made of wood. In FY2013, the national
government constructed 484 low-rise public buildings, out of which 24 were made with a wooden structure and 161 public buildings were renovated with wooden exterior/interiors.
Construction of wooden school buildings and other public buildings has been promoted and building standards for three-story wooden school buildings were revised in June 2014.
2.4. Energy Use of Woody Biomass
The “Forest and Forestry Basic Plan,” revised in July 2011, set a target of wood use for pulp/chip
production including fuel use at six million m3 by 2020. Utilization of unused thinned wood (estimated at 20 million m3 annually) is crucial for achieving the target.
In recent years, boilers and stoves fueled with woody biomass are being introduced and used in
public facilities and ordinary homes as well as for horticulture facilities, and production of wood pellet is increasing.
Woody biomass power plants are being developed in various areas utilizing the “Feed-in Tariff (FIT) Scheme for Renewable Energy” (introduced in July 2012). While woody biomass is expected to
contribute to local economies, it is necessary to ensure stable supply.
New initiative in the furniture industry:Manufacture furniture utilizing softwood materials with enhanced strength by heating and compression
Wooden public facilities (Left: New town office building of Sumita Town, Iwate Prefecture; Right: Meeting place of Minamiaizu Town, Fukushima Prefecture)

21
Chapter V National Forest Management
1. Roles of National Forests
1.1. Distribution of National Forests and Their Roles Expected
National Forests represent approximately 30% of the total forest area, or almost 20% of the total land
area in Japan. Widely distributed in remote mountainous areas and headwater areas, National Forests perform vital roles in fulfillment of multiple functions of forests, including land conservation, watershed conservation, and biodiversity conservation.
90% of the National Forests are designated as protection forests in accordance with the “Forest Act.”
Furthermore, 95% of the land designated as World Natural Heritage sites in Japan (Shiretoko, Shirakami Sanchi, Ogasawara Islands, and Yakushima) is located in National Forests.
1.2. National Forest Management
National forests, an important asset of the country, are managed in an integrated manner under the
National Forest Management Program. Since FY2013, this program has being executed under the General Account Budget with a view to further promoting sound management of national forests aiming to enhance public benefits and to contribute to revitalization of Japan’s forests and forestry.
2. Specific Initiatives under the National Forest Management Program
2.1. Further Promotion of Management with Emphasis on Public Benefit
The Forestry Agency manages national forests in accordance with the five forest types categorized based on the functions they are primarily expected to play, namely “landslide prevention,” “natural
conservation,” “recreational use,” “comfortable environment development” and “watershed conservation.” It implements the forest conservation projects aiming at the restoration of devastated areas to maintain protection forests. The restoration project is carried out by the Forestry Agency in
private forests where their damage is severe.
In managing national forests, some key thematic activities such as thinning as a forest sink activity and wood use in forest conservation projects are also pursued.
Furthermore, in order to conserve biodiversity, the Forestry Agency designates and manages
“Protected Forests” which have seven classifications, including Forest Ecosystem Reserves as well as “Green Corridors.” It is also executing measures to deal with damage by deer and other wild animals.
Based on “Agreements for Maintenance and Development of the Public Benefits of Forests” with private forest owners, the Forestry Agency manages private forests located in close proximity to national forests in an integrated manner. It has concluded five agreements for forests of 143 hectares
as of the end of FY2013.
22
2.2. Contribution to Forest and Forestry Revitalization
In accordance with the National Forest Management Program, the Forest Agency is (i) developing and disseminating technologies for low-cost forest practices, such as utilization of seedlings raised in containers and consistent operation of harvesting and planting, (ii) developing human resources
including forestry contractors and technical experts (“Foresters”), (iii) promoting development of forestry road systems and forest operations in collaboration with private forests by establishing cooperative forest management areas, and (iv) promoting stable wood supply through “System
Sales” contracts with major wood processing companies, such as large-scale lumber mills or plywood factories. It is notable that in FY2013, roundwood supply by “System Sales” contracts accounted for 50% of the whole roundwood supply by the national forests.
2.3. National Forests as “Forests for People”
In accordance with the National Forest Management Program, the Forestry Agency provides various organizations with access to field activities such as forest environmental education and forest management and conservation, by designating such fields as “Forests for Students,” “Forests for
Voluntary Groups,” “Forests for Wood Culture,” and “Forests for Corporations.” It further implements model projects in collaboration with local parties and nature conservation groups.
Some of the fields in the national forest can be lent to local governments and local residents.
“Recreational Forests” are managed and administered in partnership with those concerned in local communities.
For the recovery and reconstruction following the Great East Japan Earthquake, the Forestry Agency is implementing the restoration of coastal disaster-prevention forests within the national forests
devastated by the great tsunami as well as the decontamination of national forests contaminated by the nuclear accident of the Fukushima Nuclear Power Stations of Tokyo Electric Power Company (TEPCO). Some national forest sites are being used for the temporary storage of soil removed
through decontamination work.
Promotion of wood use in construction of conservation facilities
Countermeasures against deer damage
23
Chapter VI Reconstruction from the Great East Japan Earthquake
1. Recovery of Forest, Forestry, and Wood Products Industry
1.1. Recovery of Forest, Forestry, and Wood Products Industry
Following the Great East Japan Earthquake, there were reports of damaged forest conservation
facilities and forest roads as well as collapsed hillslopes in 15 prefectures. Recovery works have been implemented in more than 90% of the damaged areas, the majority of which have already been completed.
As many as 115 wood processing/distribution facilities also suffered major damage by the earthquake throughout Japan. The Forestry Agency is helping those damaged firms to abolish, restore or
reconstruct, while 98 of them have resumed operation to date.
1.2. Restoration of Coastal Forests
The tsunami caused by the Great East Japan Earthquake damaged a total of around 140km of
coastal disaster-prevention forests in six prefectures.
The recovery works in the damaged coastal disaster-prevention forests are underway, with a timeline target of completing the recovery works within ten years. The recovery works have been commenced
in a total of around 107km of coastal disaster-prevention forests, except for areas requiring adjustments with local reconstruction
plans, while the works have been completed in 28km. Verification tests for various tree types and planting methods are also being conducted.
In the course of recovery works, citizens’
participation in planting and tending of trees is being promoted. For the completion of the recovery, stable supply of a large number of
seedlings as well as continuous treatment of planted trees needs to be assured.
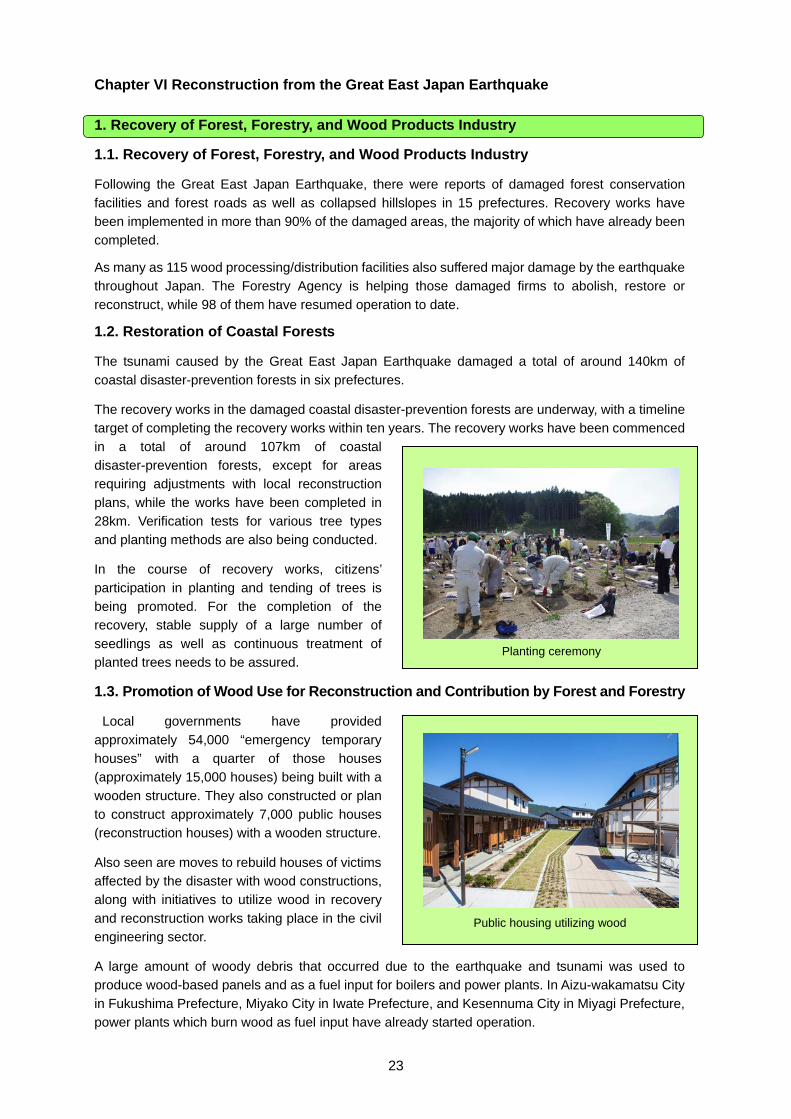
1.3. Promotion of Wood Use for Reconstruction and Contribution by Forest and Forestry
Local governments have provided
approximately 54,000 “emergency temporary houses” with a quarter of those houses (approximately 15,000 houses) being built with a
wooden structure. They also constructed or plan to construct approximately 7,000 public houses (reconstruction houses) with a wooden structure.
Also seen are moves to rebuild houses of victims affected by the disaster with wood constructions, along with initiatives to utilize wood in recovery
and reconstruction works taking place in the civil engineering sector.
A large amount of woody debris that occurred due to the earthquake and tsunami was used to produce wood-based panels and as a fuel input for boilers and power plants. In Aizu-wakamatsu City
in Fukushima Prefecture, Miyako City in Iwate Prefecture, and Kesennuma City in Miyagi Prefecture, power plants which burn wood as fuel input have already started operation.
Planting ceremony
Public housing utilizing wood
24
2. Reconstruction from Nuclear Accident
2.1. Measures for Radioactive Materials in Forests
The GOJ and municipalities concerned are conducting decontamination work such as through
removing fallen leaves and placing higher priority on forests in the neighborhood of communities.
Decontamination work in forests is carried out by the Ministry of the Environment (MoE) in the “Special Decontamination Areas,” by the local municipalities in the “Intensive Contamination Survey
Areas” within private forests and by the Forestry Agency within national forests.
The Forestry Agency has been conducting a survey on the distribution of radioactive materials in forests on an ongoing basis as well as monitoring and verification tests on the performance of decontamination work in forests.
In implementing decontamination work which handles contaminated soils, as well as forest management activities in forests where spatial doses exceed 2.5 μSv/h, dose measurement and other measures for the safety of the workers are ensured.
2.2. Supply of Safe Forest Products
As of December 2014, shipment restriction orders were effective with 22 non-wood forest products including mushrooms and wild plant shoots, in which radioactive cesium was found to exceed the standard values (100 Bq/kg for general food).
Shipment restrictions are lifted when it is determined that cultivation management is being practiced
based on the “Guidelines Concerning Management of Mushroom Cultivation from Roundwood to Decrease Radioactive Cesium” (established in October 2013) and that no mushrooms exceeding the standard values are produced. The Forestry Agency is providing support for continuation or
resumption of mushroom production.
In response to a decreasing supply of roundwood for cultivating mushrooms from Fukushima prefecture, the Forestry Agency is also providing matching assistance to help coordinate the supply
and demand of roundwood used for mushroom production.
2.3. Disposal of Contaminated Bark and Roundwood for Mushroom Production
Some of the tree bark from lumber mills in Fukushima and neighboring prefectures, which had been generally used as fuel or compost, is retained in the lumber mills due to the possibility of
contamination with radioactive cesium. The GOJ is also providing assistance in the disposal of the bark in waste disposal sites and the amount of retained bark is decreasing. The disposal of roundwood for cultivating mushrooms which can no longer be used has also become a challenge.
2.4. Damage Compensation
Forestry organizations and mushroom growers in Fukushima and other prefectures are requesting compensation for inconvenience in their business caused by evacuation orders as well as for damages and/or losses concerning roundwood for shiitake mushroom production. In September
2014, the acceptance of applications for the compensation for the loss of value in real estate pertaining to the forests in evacuation order areas started.
25
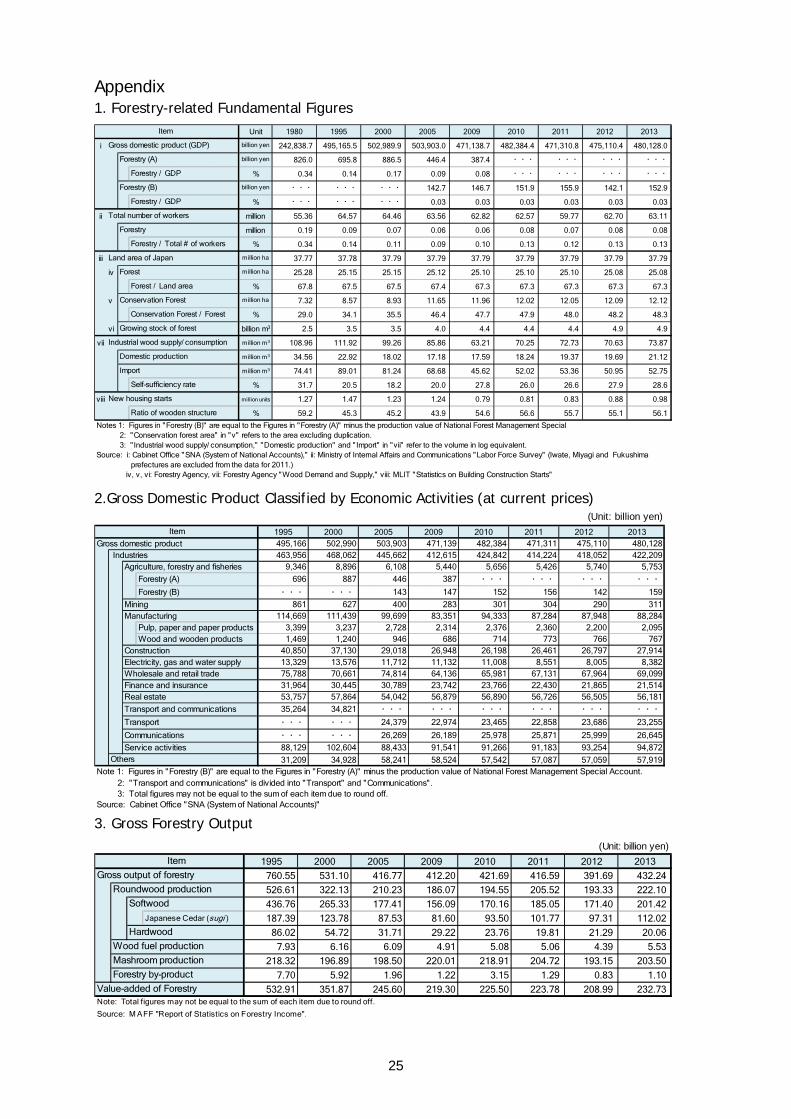
Appendix 1. Forestry-related Fundamental Figures
Unit 1980 1995 2000 2005 2009 2010 2011 2012 2013
i billion yen 242,838.7 495,165.5 502,989.9 503,903.0 471,138.7 482,384.4 471,310.8 475,110.4 480,128.0
billion yen 826.0 695.8 886.5 446.4 387.4 ・・・ ・・・ ・・・ ・・・
% 0.34 0.14 0.17 0.09 0.08 ・・・ ・・・ ・・・ ・・・billion yen ・・・ ・・・ ・・・ 142.7 146.7 151.9 155.9 142.1 152.9
% ・・・ ・・・ ・・・ 0.03 0.03 0.03 0.03 0.03 0.03
ii million 55.36 64.57 64.46 63.56 62.82 62.57 59.77 62.70 63.11
million 0.19 0.09 0.07 0.06 0.06 0.08 0.07 0.08 0.08
% 0.34 0.14 0.11 0.09 0.10 0.13 0.12 0.13 0.13
iii million ha 37.77 37.78 37.79 37.79 37.79 37.79 37.79 37.79 37.79
iv million ha 25.28 25.15 25.15 25.12 25.10 25.10 25.10 25.08 25.08
% 67.8 67.5 67.5 67.4 67.3 67.3 67.3 67.3 67.3
v million ha 7.32 8.57 8.93 11.65 11.96 12.02 12.05 12.09 12.12
% 29.0 34.1 35.5 46.4 47.7 47.9 48.0 48.2 48.3
vi billion m3 2.5 3.5 3.5 4.0 4.4 4.4 4.4 4.9 4.9
vii million m3 108.96 111.92 99.26 85.86 63.21 70.25 72.73 70.63 73.87
million m3 34.56 22.92 18.02 17.18 17.59 18.24 19.37 19.69 21.12
million m3 74.41 89.01 81.24 68.68 45.62 52.02 53.36 50.95 52.75
% 31.7 20.5 18.2 20.0 27.8 26.0 26.6 27.9 28.6
viii million units 1.27 1.47 1.23 1.24 0.79 0.81 0.83 0.88 0.98
% 59.2 45.3 45.2 43.9 54.6 56.6 55.7 55.1 56.1
2: "Conservation forest area" in "v" refers to the area excluding duplication. 3: " Industrial wood supply/ consumption," "Domestic production" and "Import" in "vii" refer to the volume in log equivalent.Source: i: Cabinet Office "SNA (System of National Accounts)," ii: Ministry of Internal Affairs and Communications "Labor Force Survey" (Iwate, Miyagi and Fukushima
prefectures are excluded from the data for 2011.) iv, v, vi: Forestry Agency, vii: Forestry Agency "Wood Demand and Supply," viii: MLIT "Statistics on Building Construction Starts"
Self-sufficiency rate
Total number of workers
Forestry / GDP
Forest
Forest / Land area
Notes 1: Figures in "Forestry (B)" are equal to the Figures in "Forestry (A)" minus the production value of National Forest Management Special
Conservation Forest
Forestry
New housing starts
Ratio of wooden structure
Gross domestic product (GDP)
Forestry (A)
Forestry / GDP
Item
Forestry (B)
Conservation Forest / Forest
Growing stock of forest
Industrial wood supply/ consumption
Domestic production
Import
Forestry / Total # of workers
Land area of Japan
2.Gross Domestic Product Classified by Economic Activities (at current prices)
(Unit: billion yen)
1995 2000 2005 2009 2010 2011 2012 2013495,166 502,990 503,903 471,139 482,384 471,311 475,110 480,128463,956 468,062 445,662 412,615 424,842 414,224 418,052 422,209
9,346 8,896 6,108 5,440 5,656 5,426 5,740 5,753
Forestry (A) 696 887 446 387 ・・・ ・・・ ・・・ ・・・Forestry (B) ・・・ ・・・ 143 147 152 156 142 159
861 627 400 283 301 304 290 311114,669 111,439 99,699 83,351 94,333 87,284 87,948 88,284
Pulp, paper and paper products 3,399 3,237 2,728 2,314 2,376 2,360 2,200 2,095Wood and wooden products 1,469 1,240 946 686 714 773 766 767
40,850 37,130 29,018 26,948 26,198 26,461 26,797 27,91413,329 13,576 11,712 11,132 11,008 8,551 8,005 8,38275,788 70,661 74,814 64,136 65,981 67,131 67,964 69,09931,964 30,445 30,789 23,742 23,766 22,430 21,865 21,51453,757 57,864 54,042 56,879 56,890 56,726 56,505 56,181
35,264 34,821 ・・・ ・・・ ・・・ ・・・ ・・・ ・・・・・・ ・・・ 24,379 22,974 23,465 22,858 23,686 23,255
・・・ ・・・ 26,269 26,189 25,978 25,871 25,999 26,645
88,129 102,604 88,433 91,541 91,266 91,183 93,254 94,872
31,209 34,928 58,241 58,524 57,542 57,087 57,059 57,919Note 1: Figures in "Forestry (B)" are equal to the Figures in "Forestry (A)" minus the production value of National Forest Management Special Account.
3: Total figures may not be equal to the sum of each item due to round off.Source: Cabinet Office "SNA (System of National Accounts)"
2: "Transport and communications" is divided into "Transport" and "Communications".
Real estate
Transport and communications
Service activities
Item
Transport
Communications
MiningManufacturing
Others
Gross domestic product Industries
Agriculture, forestry and fisheries
ConstructionElectricity, gas and water supplyWholesale and retail tradeFinance and insurance
3. Gross Forestry Output
(Unit: billion yen)
1995 2000 2005 2009 2010 2011 2012 2013
760.55 531.10 416.77 412.20 421.69 416.59 391.69 432.24
526.61 322.13 210.23 186.07 194.55 205.52 193.33 222.10
436.76 265.33 177.41 156.09 170.16 185.05 171.40 201.42Japanese Cedar (sugi ) 187.39 123.78 87.53 81.60 93.50 101.77 97.31 112.02
86.02 54.72 31.71 29.22 23.76 19.81 21.29 20.06
7.93 6.16 6.09 4.91 5.08 5.06 4.39 5.53
218.32 196.89 198.50 220.01 218.91 204.72 193.15 203.50
7.70 5.92 1.96 1.22 3.15 1.29 0.83 1.10
532.91 351.87 245.60 219.30 225.50 223.78 208.99 232.73Note: Total figures may not be equal to the sum of each item due to round off.
Source: M AFF "Report of Statistics on Forestry Income".
Wood fuel production
Mashroom production
Forestry by-product
Value-added of Forestry
Item
Gross output of forestry
Roundwood production
Softwood
Hardwood
26
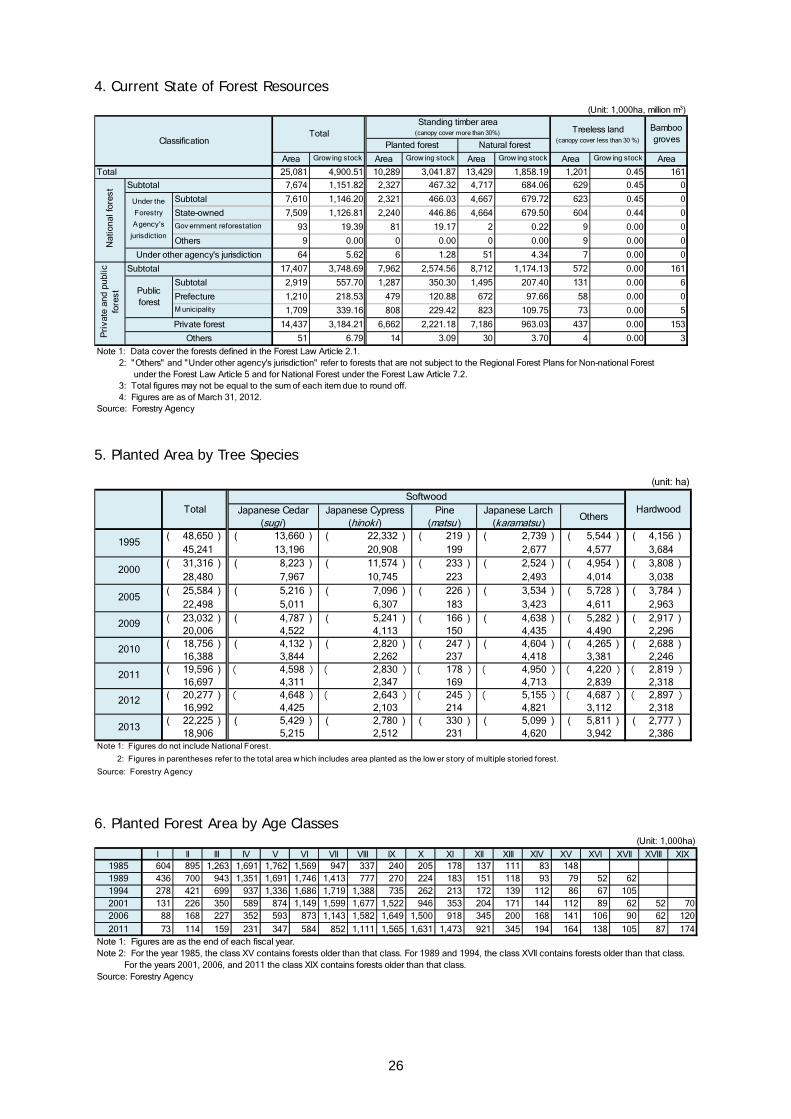
4. Current State of Forest Resources
(Unit: 1,000ha, million m3)
Area Grow ing stock Area Grow ing stock Area Grow ing stock Area Grow ing stock Area
25,081 4,900.51 10,289 3,041.87 13,429 1,858.19 1,201 0.45 161
7,674 1,151.82 2,327 467.32 4,717 684.06 629 0.45 0
Subtotal 7,610 1,146.20 2,321 466.03 4,667 679.72 623 0.45 0
State-owned 7,509 1,126.81 2,240 446.86 4,664 679.50 604 0.44 0Gov ernment reforestation 93 19.39 81 19.17 2 0.22 9 0.00 0
Others 9 0.00 0 0.00 0 0.00 9 0.00 0
64 5.62 6 1.28 51 4.34 7 0.00 0
17,407 3,748.69 7,962 2,574.56 8,712 1,174.13 572 0.00 161
Subtotal 2,919 557.70 1,287 350.30 1,495 207.40 131 0.00 6
Prefecture 1,210 218.53 479 120.88 672 97.66 58 0.00 0M unicipality 1,709 339.16 808 229.42 823 109.75 73 0.00 5
14,437 3,184.21 6,662 2,221.18 7,186 963.03 437 0.00 153
51 6.79 14 3.09 30 3.70 4 0.00 3
Note 1: Data cover the forests defined in the Forest Law Article 2.1.
3: Total figures may not be equal to the sum of each item due to round off. 4: Figures are as of March 31, 2012.Source: Forestry Agency
under the Forest Law Article 5 and for National Forest under the Forest Law Article 7.2.
Nat
iona
l for
est Subtotal
Under other agency's jurisdiction
Pri
vate
and
pub
licfo
rest
Subtotal
Publicforest
Private forest
Under the
Forestry
Agency's
jurisdiction
2: "Others" and "Under other agency's jurisdiction" refer to forests that are not subject to the Regional Forest Plans for Non-national Forest
Others
Total
BamboogrovesClassification
TotalStanding timber area
(canopy cover more than 30%) Treeless land(canopy cover less than 30 %)
Planted forest Natural forest
5. Planted Area by Tree Species
(unit: ha)
Others
( 48,650 ) ( 13,660 ) ( 22,332 ) ( 219 ) ( 2,739 ) ( 5,544 ) ( 4,156 )45,241 13,196 20,908 199 2,677 4,577 3,684
( 31,316 ) ( 8,223 ) ( 11,574 ) ( 233 ) ( 2,524 ) ( 4,954 ) ( 3,808 )28,480 7,967 10,745 223 2,493 4,014 3,038
( 25,584 ) ( 5,216 ) ( 7,096 ) ( 226 ) ( 3,534 ) ( 5,728 ) ( 3,784 )22,498 5,011 6,307 183 3,423 4,611 2,963
( 23,032 ) ( 4,787 ) ( 5,241 ) ( 166 ) ( 4,638 ) ( 5,282 ) ( 2,917 )20,006 4,522 4,113 150 4,435 4,490 2,296
( 18,756 ) ( 4,132 ) ( 2,820 ) ( 247 ) ( 4,604 ) ( 4,265 ) ( 2,688 )16,388 3,844 2,262 237 4,418 3,381 2,246
( 19,596 ) ( 4,598 )( 2,830 )( 178 )( 4,950 )( 4,220 )( 2,819 )16,697 4,311 2,347 169 4,713 2,839 2,318
( 20,277 ) ( 4,648 )( 2,643 )( 245 )( 5,155 )( 4,687 )( 2,897 )16,992 4,425 2,103 214 4,821 3,112 2,318
( 22,225 ) ( 5,429 ) ( 2,780 ) ( 330 ) ( 5,099 ) ( 5,811 ) ( 2,777 )18,906 5,215 2,512 231 4,620 3,942 2,386
Note 1: Figures do not include National Forest.
2: Figures in parentheses refer to the total area w hich includes area planted as the low er story of multiple storied forest.
Source: Forestry Agency
Japanese Larch(karamatsu )
2000
1995
TotalSoftwood
HardwoodJapanese Cedar(sugi )
Japanese Cypress(hinoki )
2012
2010
2013
2009
Pine(matsu )
2005
2011
6. Planted Forest Area by Age Classes
(Unit: 1,000ha)
l ll lll lV V Vl Vll Vlll lX X Xl Xll Xlll XlV XV XVl XVll XVlll XlX1985 604 895 1,263 1,691 1,762 1,569 947 337 240 205 178 137 111 83 1481989 436 700 943 1,351 1,691 1,746 1,413 777 270 224 183 151 118 93 79 52 621994 278 421 699 937 1,336 1,686 1,719 1,388 735 262 213 172 139 112 86 67 1052001 131 226 350 589 874 1,149 1,599 1,677 1,522 946 353 204 171 144 112 89 62 52 702006 88 168 227 352 593 873 1,143 1,582 1,649 1,500 918 345 200 168 141 106 90 62 120
2011 73 114 159 231 347 584 852 1,111 1,565 1,631 1,473 921 345 194 164 138 105 87 174Note 1: Figures are as the end of each fiscal year.Note 2: For the year 1985, the class XV contains forests older than that class. For 1989 and 1994, the class XVll contains forests older than that class. For the years 2001, 2006, and 2011 the class XlX contains forests older than that class.Source: Forestry Agency
27
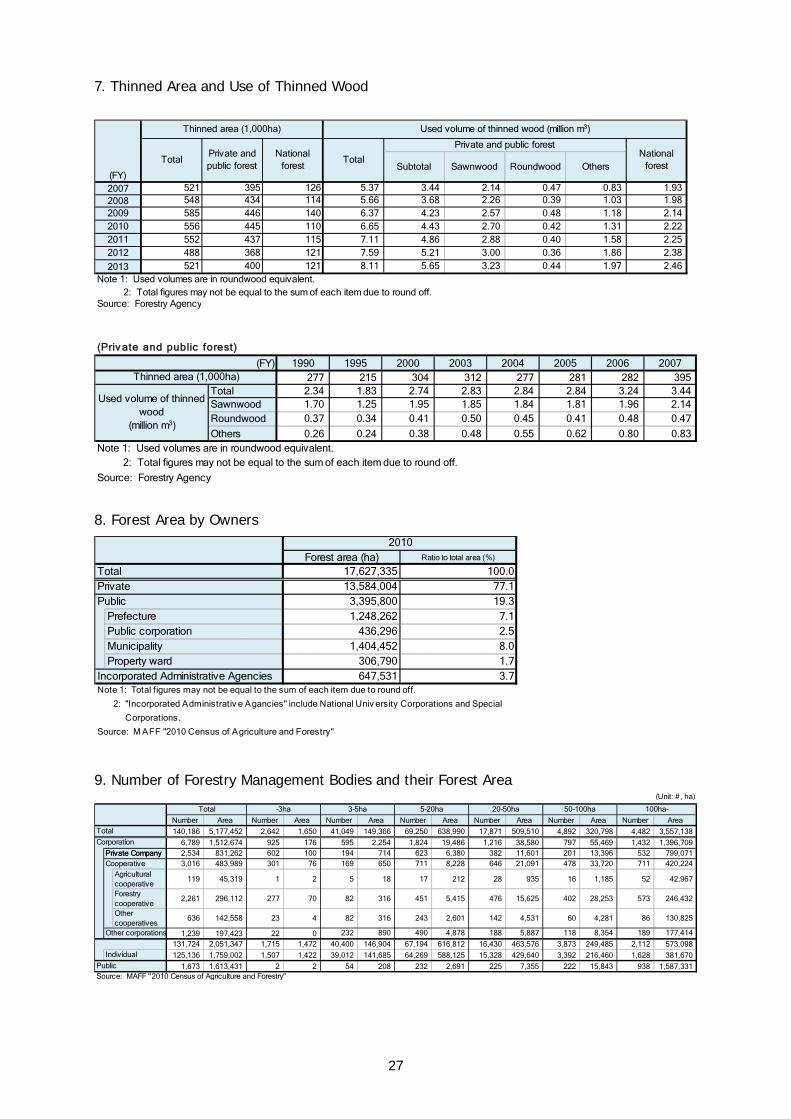
7. Thinned Area and Use of Thinned Wood
Subtotal Sawnwood Roundwood Others
2007 521 395 126 5.37 3.44 2.14 0.47 0.83 1.932008 548 434 114 5.66 3.68 2.26 0.39 1.03 1.982009 585 446 140 6.37 4.23 2.57 0.48 1.18 2.142010 556 445 110 6.65 4.43 2.70 0.42 1.31 2.222011 552 437 115 7.11 4.86 2.88 0.40 1.58 2.252012 488 368 121 7.59 5.21 3.00 0.36 1.86 2.38
2013 521 400 121 8.11 5.65 3.23 0.44 1.97 2.46Note 1: Used volumes are in roundwood equivalent. 2: Total figures may not be equal to the sum of each item due to round off.Source: Forestry Agency
(FY)
Used volume of thinned wood (million m3)
Private and public forestNational
forestTotal
Thinned area (1,000ha)
TotalPrivate andpublic forest
Nationalforest
(Priv ate and public forest)
(FY) 1990 1995 2000 2003 2004 2005 2006 2007277 215 304 312 277 281 282 395
Total 2.34 1.83 2.74 2.83 2.84 2.84 3.24 3.44Sawnwood 1.70 1.25 1.95 1.85 1.84 1.81 1.96 2.14Roundwood 0.37 0.34 0.41 0.50 0.45 0.41 0.48 0.47
Others 0.26 0.24 0.38 0.48 0.55 0.62 0.80 0.83Note 1: Used volumes are in roundwood equivalent. 2: Total figures may not be equal to the sum of each item due to round off.
Source: Forestry Agency
Thinned area (1,000ha)
Used volume of thinnedwood
(million m3)
8. Forest Area by Owners
Forest area (ha) Ratio to total area (%)
17,627,335 100.013,584,004 77.1
3,395,800 19.3Prefecture 1,248,262 7.1Public corporation 436,296 2.5Municipality 1,404,452 8.0Property ward 306,790 1.7
647,531 3.7Note 1: Total figures may not be equal to the sum of each item due to round off.
Source: M AFF "2010 Census of Agriculture and Forestry"
Corporations.
2010
TotalPrivatePublic
Incorporated Administrative Agencies
2: "Incorporated Administrativ e Agancies" include National Univ ersity Corporations and Special
9. Number of Forestry Management Bodies and their Forest Area (Unit: #, ha)
Number Area Number Area Number Area Number Area Number Area Number Area Number Area
140,186 5,177,452 2,642 1,650 41,049 149,366 69,250 638,990 17,871 509,510 4,892 320,798 4,482 3,557,138
6,789 1,512,674 925 176 595 2,254 1,824 19,486 1,216 38,580 797 55,469 1,432 1,396,7092,534 831,262 602 100 194 714 623 6,380 382 11,601 201 13,396 532 799,0713,016 483,989 301 76 169 650 711 8,228 646 21,091 478 33,720 711 420,224
Agriculturalcooperative
119 45,319 1 2 5 18 17 212 28 935 16 1,185 52 42,967
Forestrycooperative
2,261 296,112 277 70 82 316 451 5,415 476 15,625 402 28,253 573 246,432
Othercooperatives
636 142,558 23 4 82 316 243 2,601 142 4,531 60 4,281 86 130,825
1,239 197,423 22 0 232 890 490 4,878 188 5,887 118 8,354 189 177,414
131,724 2,051,347 1,715 1,472 40,400 146,904 67,194 616,812 16,430 463,576 3,873 249,485 2,112 573,098
125,136 1,759,002 1,507 1,422 39,012 141,685 64,269 588,125 15,328 429,640 3,392 216,460 1,628 381,670
1,673 1,613,431 2 2 54 208 232 2,691 225 7,355 222 15,843 938 1,587,331Source: MAFF "2010 Census of Agriculture and Forestry"
Individual
5-20ha
Private CompanyPrivate CompanyCooperative
Other corporations
20-50ha
Public
50-100ha 100ha-
Total
Corporation
Total -3ha 3-5ha
28
10. Roundwood Production
(Unit: 1,000m3, %)
Relative changefrom previous year
(%)
21,242 17,034 16,166 16,619 17,193 18,290 18,479 19,646 6.316,575 13,707 13,695 13,976 14,789 15,986 16,062 17,246 7.4
(78) (80) (85) (84) (86) (87) (87) (88)8,852 7,671 7,756 8,263 9,049 9,649 9,956 10,902 9.58,642 7,258 6,737 6,352 6,695 7,089 7,295 7,825 7.3<53> <57> <58> <62> <63> <62> <64> <65>
2,882 2,273 2,014 1,957 2,029 2,169 2,165 2,300 6.2
1,551 1,034 783 704 689 580 661 624 ▲ 5.6
2,779 2,410 2,910 2,821 2,821 3,373 3,098 3,275 5.7
375 319 232 231 201 215 182 145 ▲ 20.34,667 3,327 2,471 2,643 2,404 2,304 2,417 2,400 ▲ 0.7
(22) (20) (15) (16) (14) (13) (13) (12)16,252 12,798 11,571 10,243 10,582 11,492 11,321 12,058 6.5
(77) (75) (72) (62) (62) (63) (61) (61)228 138 863 1,979 2,490 2,524 2,602 3,016 15.9
(1) (1) (5) (12) (14) (14) (14) (15)4,762 4,098 3,732 4,397 4,121 4,274 4,556 4,572 0.4
(22) (24) (23) (26) (24) (23) (25) (23)Note 1: Figures in parentheses refer to the percentage to total volume. 2: Figures in < > are the percentage of sugi for sawnwood to the total volume for sawnwood of all species. 3: Total figures may not be equal to the sum of each item due to round off.Source: MAFF "Wood Demand and Supply Report" , "Timber Statistics"
20112010
for sawnwood
Japanese Cypress (Hinoki)Red pine (Akamatsu), Black pine(Kuromatsu)
Others
2005
By
use
Sawnwood
Plywood
Chips
Hardwood
Japanese Larch (Karamatsu),Yezo spruce (Ezomatsu),Todomatsu (Abies sachalinensis )
By
tree
spe
cies
Sof
twoo
d
Subtotal
Japanese Cedar (Sugi)
2012 20132009
Total
1995 2000
11. Wood Supply/Demand Chart (roundwood equivalent) (1,000m3)
Su
bto
tal
Sa
wn
wo
od
Pu
lp a
nd
chip
s
Ply
wo
od
Oth
ers
Su
bto
tal
Sa
wn
wo
od
Pu
lp a
nd
chip
s
Ply
wo
od
Oth
ers
Su
bto
tal
Ch
arc
oa
l
Fir
ew
oo
d
Su
bto
tal
Sa
wn
wo
od
Pu
lp a
nd
chip
s
Ply
wo
od
Oth
ers
(7,972) (7,972) (7,972) (7,972) (7,972) (7,972)
75,465 73,867 28,592 30,353 11,232 3,690 388 1,211 73,551 71,966 28,497 28,860 11,191 3,418 388 1,197 936 261 1,914 1,901 94 1,493 41 273 13
(7,972) (7,972) (7,972) (7,972) (7,972) (7,972)
26,788 26,788 16,757 4,883 4,498 650 24,887 24,887 16,663 3,390 4,457 378 1,901 1,901 94 1,493 41 273
299 299 299 299 299 299
46,780 46,780 11,835 25,171 6,734 3,040 46,780 46,780 11,835 25,171 6,734 3,040
388 388 388 388
1,211 1,211 1,197 1,197 936 261 13 13
21,741 21,117 12,058 5,177 3,255 627 388 237 19,831 19,219 11,964 3,684 3,217 355 388 224 79 144 1,911 1,897 94 1,493 38 273 13
20,818 20,818 12,058 4,878 3,255 627 18,920 18,920 11,964 3,385 3,217 355 1,897 1,897 94 1,493 38 273
299 299 299 299 299 299
388 388 388 388
237 237 224 224 79 144 13 13
53,724 52,750 16,534 25,176 7,977 3,063 974 53,720 52,746 16,533 25,176 7,974 3,063 974 857 117 4 4 0 3 0
5,970 5,970 4,699 5 1,243 23 5,966 5,966 4,699 5 1,240 23 4 4 0 3 0
Subtotal 46,780 46,780 11,835 25,171 6,734 3,040 46,780 46,780 11,835 25,171 6,734 3,040
Sawnwood 11,835 11,835 11,835 11,835 11,835 11,835
Pulp 5,771 5,771 5,771 5,771 5,771 5,771
Chips 19,400 19,400 19,400 19,400 19,400 19,400
Plywood 6,734 6,734 6,734 6,734 6,734 6,734
Others 3,040 3,040 3,040 3,040 3,040 3,040
974 974 974 974 857 117
Note 1: Figures in parentheses refer to the volume of pulp and chips from mill residue or construction waste, which are already included in the volume of sawnwood, plywood, or others. These figures are excluded from "total" and "subtotal". 2: "Forest residue" refers to branches or roots carried into mills for use. 3: Total figures may not be equal to the sum of each item due to round off.Source: Forestry Agency "Wood Demand and Supply Chart"
Demand
Supply
Demand Domestic consumption Export
To
tal
Industrial use
Mu
shro
om
culti
vatio
n
Fu
el
To
tal
Industrial use
Mu
shro
om
culti
vatio
n
Fuel
To
tal
Industrial use
Fu
el
Fuel
Su
pp
ly
Total
Roundwood
Forest residue
Import
Mushroom
cultivation
Fuel
Imp
ort
Total
Roundwood
Wo
od
pro
du
cts
Fuel
Dom
estic
pro
duct
ion Total
Roundwood
Forest residue
Mushroom
cultivation
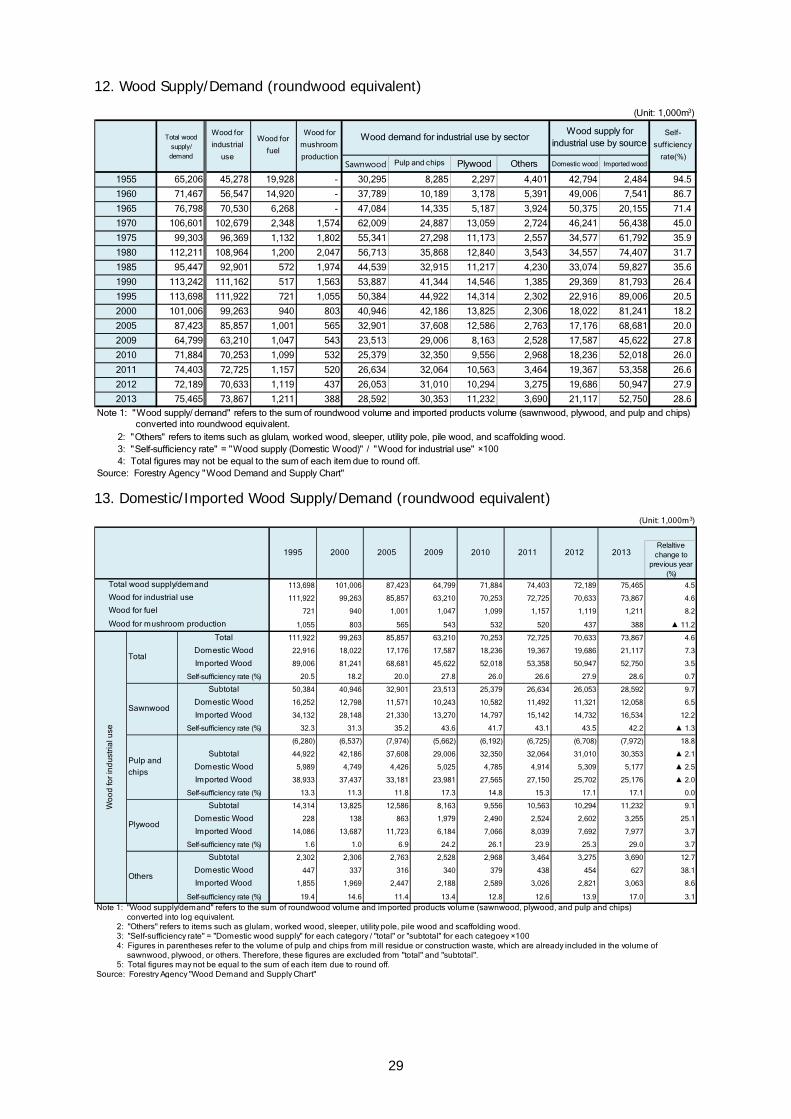
29
12. Wood Supply/Demand (roundwood equivalent)
Sawnwood Pulp and chips Plywood Others Domestic wood Imported wood
1955 65,206 45,278 19,928 - 30,295 8,285 2,297 4,401 42,794 2,484 94.5
1960 71,467 56,547 14,920 - 37,789 10,189 3,178 5,391 49,006 7,541 86.7
1965 76,798 70,530 6,268 - 47,084 14,335 5,187 3,924 50,375 20,155 71.4
1970 106,601 102,679 2,348 1,574 62,009 24,887 13,059 2,724 46,241 56,438 45.0
1975 99,303 96,369 1,132 1,802 55,341 27,298 11,173 2,557 34,577 61,792 35.9
1980 112,211 108,964 1,200 2,047 56,713 35,868 12,840 3,543 34,557 74,407 31.7
1985 95,447 92,901 572 1,974 44,539 32,915 11,217 4,230 33,074 59,827 35.6
1990 113,242 111,162 517 1,563 53,887 41,344 14,546 1,385 29,369 81,793 26.4
1995 113,698 111,922 721 1,055 50,384 44,922 14,314 2,302 22,916 89,006 20.5
2000 101,006 99,263 940 803 40,946 42,186 13,825 2,306 18,022 81,241 18.2
2005 87,423 85,857 1,001 565 32,901 37,608 12,586 2,763 17,176 68,681 20.0
2009 64,799 63,210 1,047 543 23,513 29,006 8,163 2,528 17,587 45,622 27.8
2010 71,884 70,253 1,099 532 25,379 32,350 9,556 2,968 18,236 52,018 26.0
2011 74,403 72,725 1,157 520 26,634 32,064 10,563 3,464 19,367 53,358 26.6
2012 72,189 70,633 1,119 437 26,053 31,010 10,294 3,275 19,686 50,947 27.9
2013 75,465 73,867 1,211 388 28,592 30,353 11,232 3,690 21,117 52,750 28.6
Note 1: "Wood supply/ demand" refers to the sum of roundwood volume and imported products volume (sawnwood, plywood, and pulp and chips)
2: "Others" refers to items such as glulam, worked wood, sleeper, utility pole, pile wood, and scaffolding wood. 3: "Self-sufficiency rate" = "Wood supply (Domestic Wood)" / "Wood for industrial use" ×100 4: Total figures may not be equal to the sum of each item due to round off.Source: Forestry Agency "Wood Demand and Supply Chart"
converted into roundwood equivalent.
Wood supply forindustrial use by source
Self-
sufficiency
rate(%)
(Unit: 1,000m3)
Total woodsupply/demand
Wood for
industrial
use
Wood for
fuel
Wood for
mushroom
production
Wood demand for industrial use by sector
13. Domestic/Imported Wood Supply/Demand (roundwood equivalent) (Unit: 1,000m3)
Relaltivechange to
previous year(%)
113,698 101,006 87,423 64,799 71,884 74,403 72,189 75,465 4.5
111,922 99,263 85,857 63,210 70,253 72,725 70,633 73,867 4.6
721 940 1,001 1,047 1,099 1,157 1,119 1,211 8.2
1,055 803 565 543 532 520 437 388 ▲ 11.2
Total 111,922 99,263 85,857 63,210 70,253 72,725 70,633 73,867 4.6
Domestic Wood 22,916 18,022 17,176 17,587 18,236 19,367 19,686 21,117 7.3
Imported Wood 89,006 81,241 68,681 45,622 52,018 53,358 50,947 52,750 3.5
Self-sufficiency rate (%) 20.5 18.2 20.0 27.8 26.0 26.6 27.9 28.6 0.7
Subtotal 50,384 40,946 32,901 23,513 25,379 26,634 26,053 28,592 9.7
Domestic Wood 16,252 12,798 11,571 10,243 10,582 11,492 11,321 12,058 6.5
Imported Wood 34,132 28,148 21,330 13,270 14,797 15,142 14,732 16,534 12.2
Self-sufficiency rate (%) 32.3 31.3 35.2 43.6 41.7 43.1 43.5 42.2 ▲ 1.3
(6,280) (6,537) (7,974) (5,662) (6,192) (6,725) (6,708) (7,972) 18.8
Subtotal 44,922 42,186 37,608 29,006 32,350 32,064 31,010 30,353 ▲ 2.1
Domestic Wood 5,989 4,749 4,426 5,025 4,785 4,914 5,309 5,177 ▲ 2.5
Imported Wood 38,933 37,437 33,181 23,981 27,565 27,150 25,702 25,176 ▲ 2.0
Self-sufficiency rate (%) 13.3 11.3 11.8 17.3 14.8 15.3 17.1 17.1 0.0
Subtotal 14,314 13,825 12,586 8,163 9,556 10,563 10,294 11,232 9.1
Domestic Wood 228 138 863 1,979 2,490 2,524 2,602 3,255 25.1
Imported Wood 14,086 13,687 11,723 6,184 7,066 8,039 7,692 7,977 3.7
Self-sufficiency rate (%) 1.6 1.0 6.9 24.2 26.1 23.9 25.3 29.0 3.7
Subtotal 2,302 2,306 2,763 2,528 2,968 3,464 3,275 3,690 12.7
Domestic Wood 447 337 316 340 379 438 454 627 38.1
Imported Wood 1,855 1,969 2,447 2,188 2,589 3,026 2,821 3,063 8.6
Self-sufficiency rate (%) 19.4 14.6 11.4 13.4 12.8 12.6 13.9 17.0 3.1
Note 1: "Wood supply/demand" refers to the sum of roundwood volume and imported products volume (sawnwood, plywood, and pulp and chips) converted into log equivalent. 2: "Others" refers to items such as glulam, worked wood, sleeper, utility pole, pile wood and scaffolding wood. 3: "Self-sufficiency rate" = "Domestic wood supply" for each category / "total" or "subtotal" for each categoey ×100 4: Figures in parentheses refer to the volume of pulp and chips from mill residue or construction waste, which are already included in the volume of sawnwood, plywood, or others. Therefore, these figures are excluded from "total" and "subtotal". 5: Total figures may not be equal to the sum of each item due to round off.Source: Forestry Agency "Wood Demand and Supply Chart"
Total wood supply/demand
Wood for industrial use
Wood for mushroom production
20131995 2000 20102009 2011
Others
Wo
od
for
ind
ust
ria
l use
Wood for fuel
2012
Total
Plywood
2005
Sawnwood
Pulp and
chips
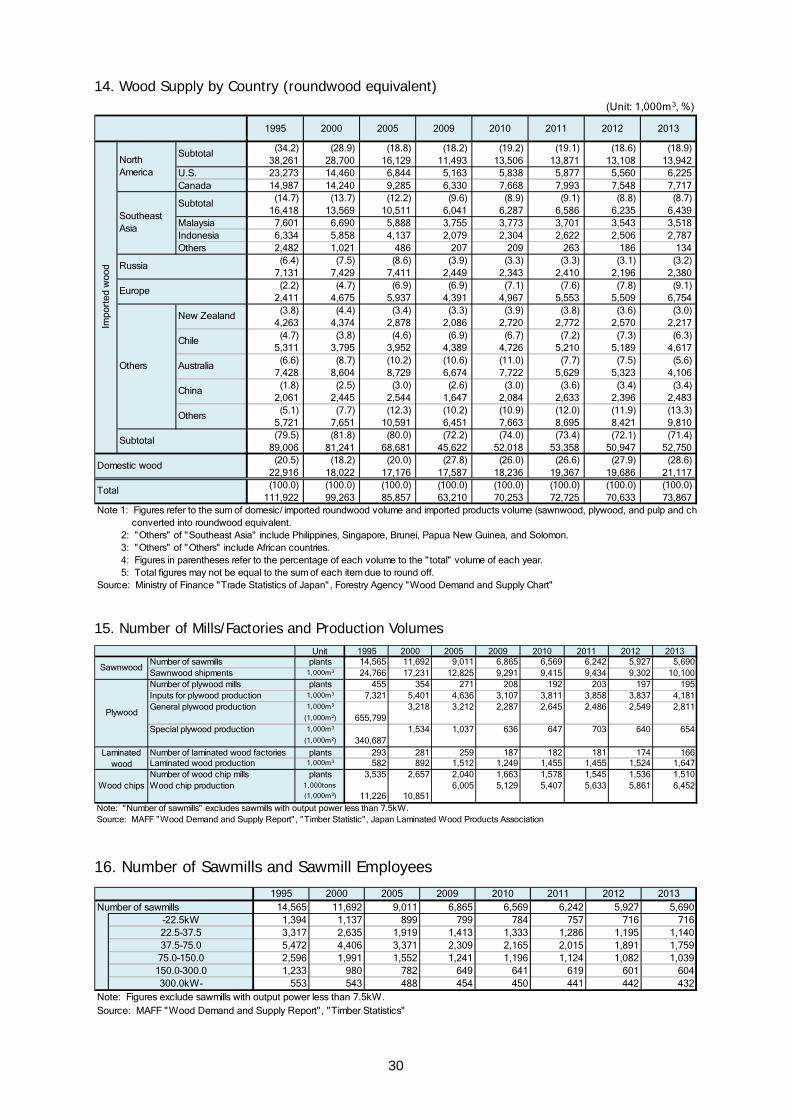
30
14. Wood Supply by Country (roundwood equivalent) (Unit: 1,000m3, %)
1995 2000 2005 2009 2010 2011 2012 2013
(34.2) (28.9) (18.8) (18.2) (19.2) (19.1) (18.6) (18.9)38,261 28,700 16,129 11,493 13,506 13,871 13,108 13,942
U.S. 23,273 14,460 6,844 5,163 5,838 5,877 5,560 6,225Canada 14,987 14,240 9,285 6,330 7,668 7,993 7,548 7,717
(14.7) (13.7) (12.2) (9.6) (8.9) (9.1) (8.8) (8.7)16,418 13,569 10,511 6,041 6,287 6,586 6,235 6,439
Malaysia 7,601 6,690 5,888 3,755 3,773 3,701 3,543 3,518Indonesia 6,334 5,858 4,137 2,079 2,304 2,622 2,506 2,787Others 2,482 1,021 486 207 209 263 186 134
(6.4) (7.5) (8.6) (3.9) (3.3) (3.3) (3.1) (3.2)7,131 7,429 7,411 2,449 2,343 2,410 2,196 2,380
(2.2) (4.7) (6.9) (6.9) (7.1) (7.6) (7.8) (9.1)2,411 4,675 5,937 4,391 4,967 5,553 5,509 6,754
(3.8) (4.4) (3.4) (3.3) (3.9) (3.8) (3.6) (3.0)4,263 4,374 2,878 2,086 2,720 2,772 2,570 2,217
(4.7) (3.8) (4.6) (6.9) (6.7) (7.2) (7.3) (6.3)5,311 3,795 3,952 4,389 4,726 5,210 5,189 4,617
(6.6) (8.7) (10.2) (10.6) (11.0) (7.7) (7.5) (5.6)7,428 8,604 8,729 6,674 7,722 5,629 5,323 4,106
(1.8) (2.5) (3.0) (2.6) (3.0) (3.6) (3.4) (3.4)2,061 2,445 2,544 1,647 2,084 2,633 2,396 2,483
(5.1) (7.7) (12.3) (10.2) (10.9) (12.0) (11.9) (13.3)5,721 7,651 10,591 6,451 7,663 8,695 8,421 9,810(79.5) (81.8) (80.0) (72.2) (74.0) (73.4) (72.1) (71.4)
89,006 81,241 68,681 45,622 52,018 53,358 50,947 52,750(20.5) (18.2) (20.0) (27.8) (26.0) (26.6) (27.9) (28.6)
22,916 18,022 17,176 17,587 18,236 19,367 19,686 21,117(100.0) (100.0) (100.0) (100.0) (100.0) (100.0) (100.0) (100.0)
111,922 99,263 85,857 63,210 70,253 72,725 70,633 73,867Note 1: Figures refer to the sum of domesic/ imported roundwood volume and imported products volume (sawnwood, plywood, and pulp and ch converted into roundwood equivalent. 2: "Others" of "Southeast Asia" include Philippines, Singapore, Brunei, Papua New Guinea, and Solomon. 3: "Others" of "Others" include African countries. 4: Figures in parentheses refer to the percentage of each volume to the " total" volume of each year. 5: Total figures may not be equal to the sum of each item due to round off.Source: Ministry of Finance "Trade Statistics of Japan", Forestry Agency "Wood Demand and Supply Chart"
Impo
rted
woo
d
NorthAmerica
Subtotal
SoutheastAsia
Subtotal
Subtotal
Domestic wood
Total
Russia
Europe
Others
New Zealand
Chile
Australia
China
Others
15. Number of Mills/Factories and Production Volumes Unit 1995 2000 2005 2009 2010 2011 2012 2013
Number of sawmills plants 14,565 11,692 9,011 6,865 6,569 6,242 5,927 5,690Sawnwood shipments 1,000m3 24,766 17,231 12,825 9,291 9,415 9,434 9,302 10,100Number of plywood mills plants 455 354 271 208 192 203 197 195Inputs for plywood production 1,000m3 7,321 5,401 4,636 3,107 3,811 3,858 3,837 4,181General plywood production 1,000m3 3,218 3,212 2,287 2,645 2,486 2,549 2,811
(1,000m2) 655,799Special plywood production 1,000m3 1,534 1,037 636 647 703 640 654
(1,000m2) 340,687Number of laminated wood factories plants 293 281 259 187 182 181 174 166Laminated wood production 1,000m3 582 892 1,512 1,249 1,455 1,455 1,524 1,647Number of wood chip mills plants 3,535 2,657 2,040 1,663 1,578 1,545 1,536 1,510Wood chip production 1,000tons 6,005 5,129 5,407 5,633 5,861 6,452
(1,000m3) 11,226 10,851Note: "Number of sawmills" excludes sawmills with output power less than 7.5kW.Source: MAFF "Wood Demand and Supply Report" , "Timber Statistic", Japan Laminated Wood Products Association
Sawnwood
Plywood
Wood chips
Laminatedwood
16. Number of Sawmills and Sawmill Employees
1995 2000 2005 2009 2010 2011 2012 201314,565 11,692 9,011 6,865 6,569 6,242 5,927 5,690
-22.5kW 1,394 1,137 899 799 784 757 716 71622.5-37.5 3,317 2,635 1,919 1,413 1,333 1,286 1,195 1,14037.5-75.0 5,472 4,406 3,371 2,309 2,165 2,015 1,891 1,759
75.0-150.0 2,596 1,991 1,552 1,241 1,196 1,124 1,082 1,039150.0-300.0 1,233 980 782 649 641 619 601 604300.0kW- 553 543 488 454 450 441 442 432
Note: Figures exclude sawmills with output power less than 7.5kW.Source: MAFF "Wood Demand and Supply Report" , "Timber Statistics"
Number of sawmills

Full text (in Japanese) of the “Annual Report on Forest and Forestry for FY2014” is available on the website of the Forestry Agency: http://www.rinya.maff.go.jp/j/kikaku/hakusyo/26hakusyo/index.html Please refer to those texts for further information on the issues contained in this brochure, or ask the Annual Report Group of the Forestry Agency: Annual Report Group Policy Planning Division, Forestry Agency Ministry of Agriculture, Forestry, and Fisheries (MAFF) 1-2-1 Kasumigaseki, Chiyoda-ku, TOKYO 100-8952 JAPAN e-mail: [email protected]


![Tender Notice - GujaratTender Notice. Title: Tender for empanelment of agencies interested in carrying out forestry related. works in Forest Division of Surat;]ZT. ... Tender document](https://img.pdfslide.tips/doc/110x75/5e59b5e61293533d8444c0c1/tender-notice-gujarat-tender-notice-title-tender-for-empanelment-of-agencies.jpg)