Embed Size (px)
Citation preview
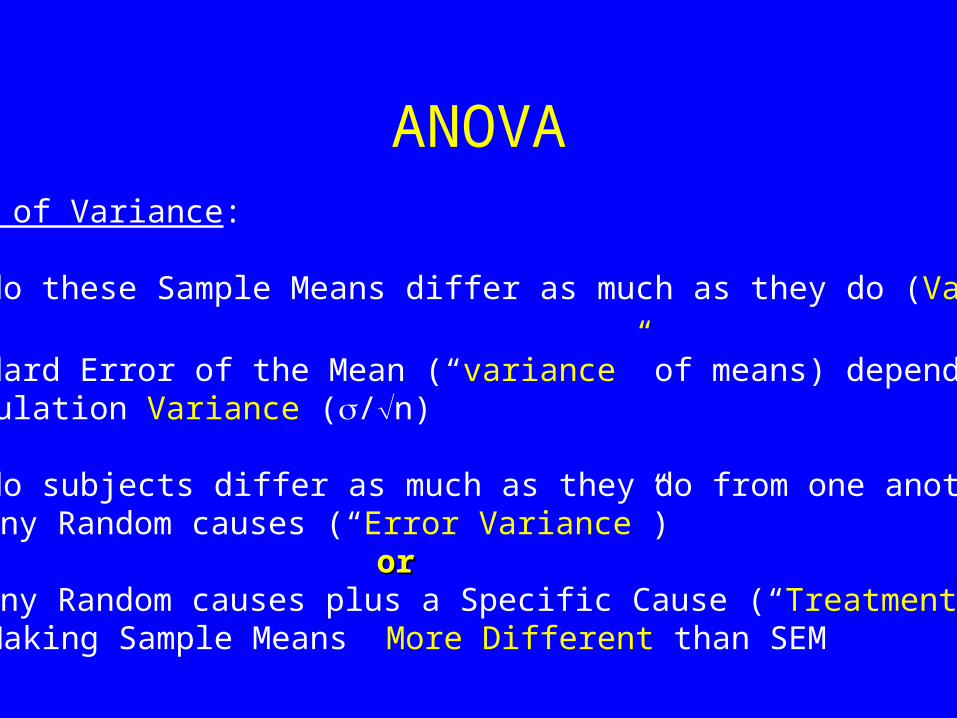
ANOVAAnalysis of Variance:
•Why do these Sample Means differ as much as they do (Variance)?
•Standard Error of the Mean (“variance” of means) depends uponPopulation Variance (/n)
•Why do subjects differ as much as they do from one another?Many Random causes (“Error Variance”)
ororMany Random causes plus a Specific Cause (“Treatment”)
Making Sample Means More Different than SEM
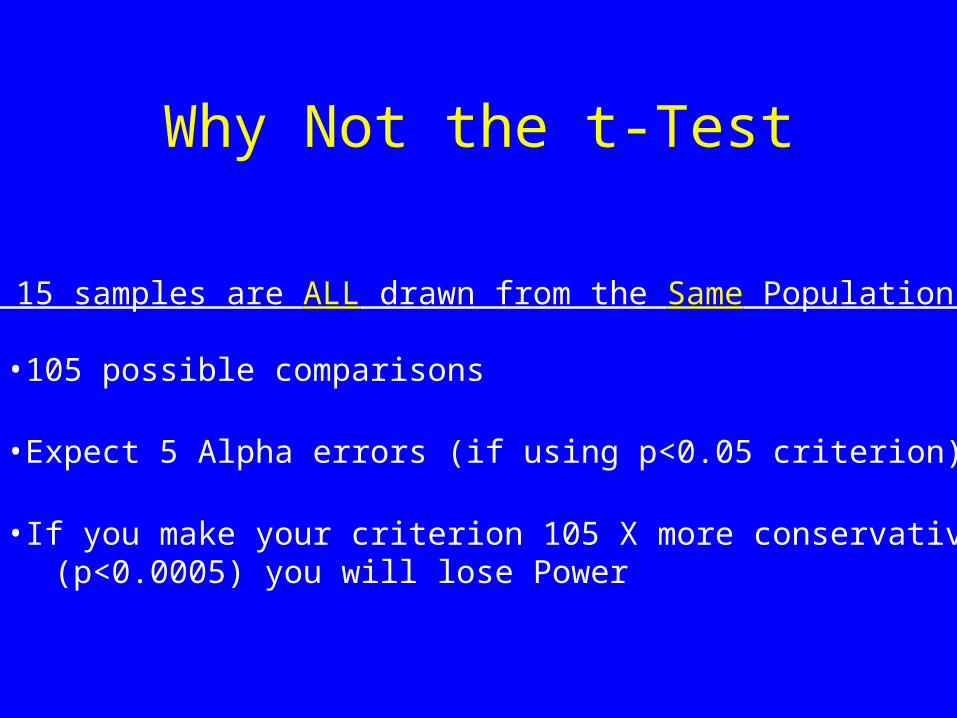
Why Not the t-Test
If 15 samples are ALL drawn from the Same Populations:
•105 possible comparisons
•Expect 5 Alpha errors (if using p<0.05 criterion)
•If you make your criterion 105 X more conservative(p<0.0005) you will lose Power
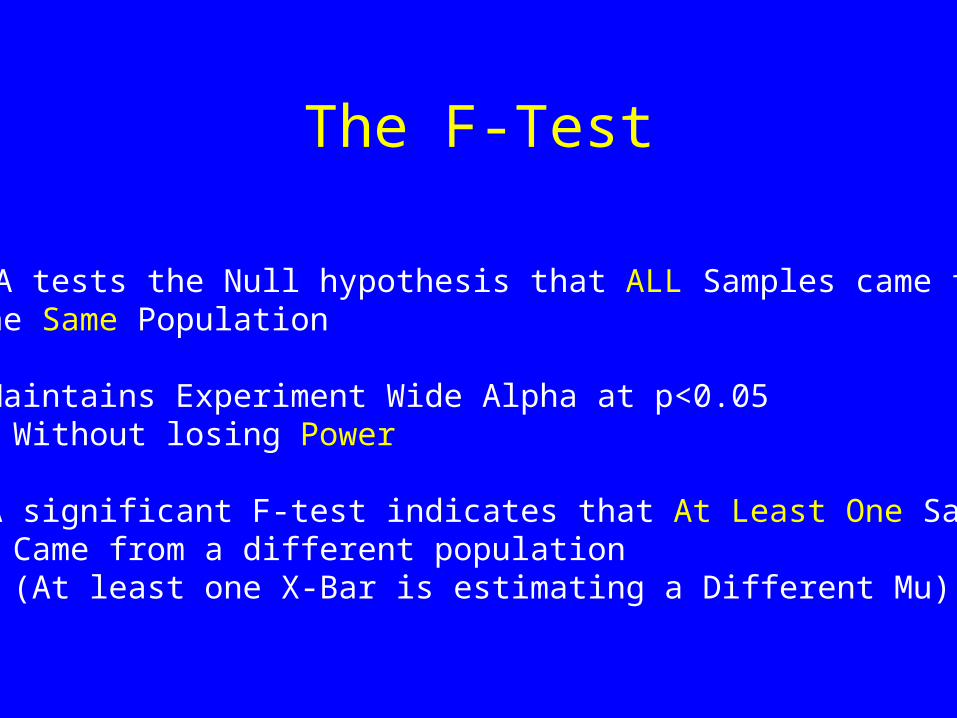
The F-Test
ANOVA tests the Null hypothesis that ALL Samples came fromThe Same Population
•Maintains Experiment Wide Alpha at p<0.05Without losing Power
•A significant F-test indicates that At Least One SampleCame from a different population(At least one X-Bar is estimating a Different Mu)
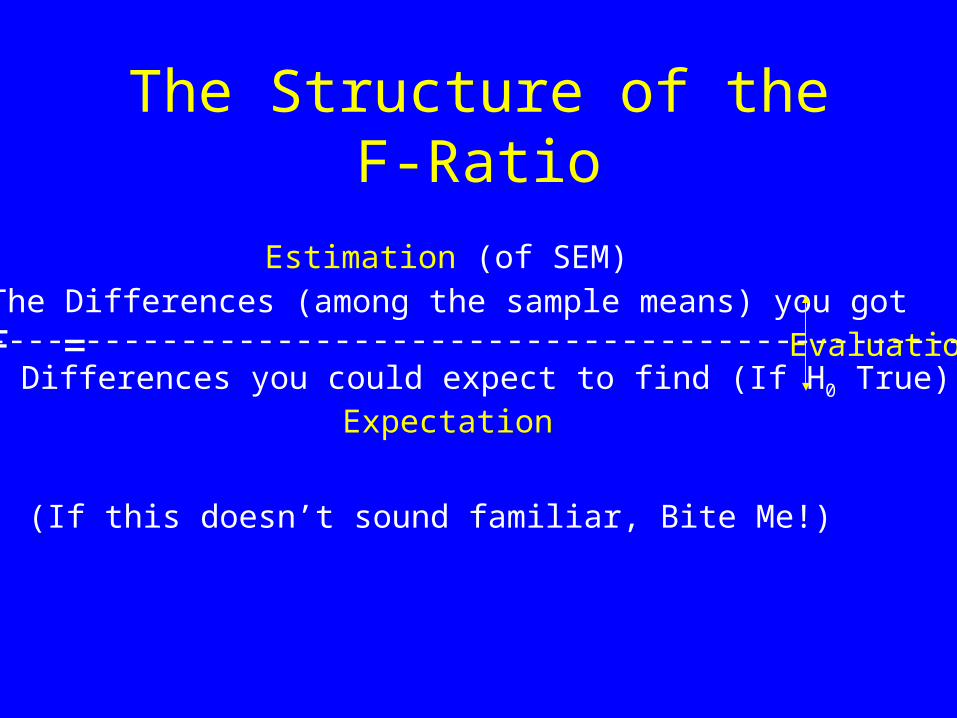
The Structure of the F-Ratio
F = The Differences (among the sample means) you got
----------------------------------------------------------------The Differences you could expect to find (If H0 True)
Expectation
(If this doesn’t sound familiar, Bite Me!)
Evaluation
Estimation (of SEM)
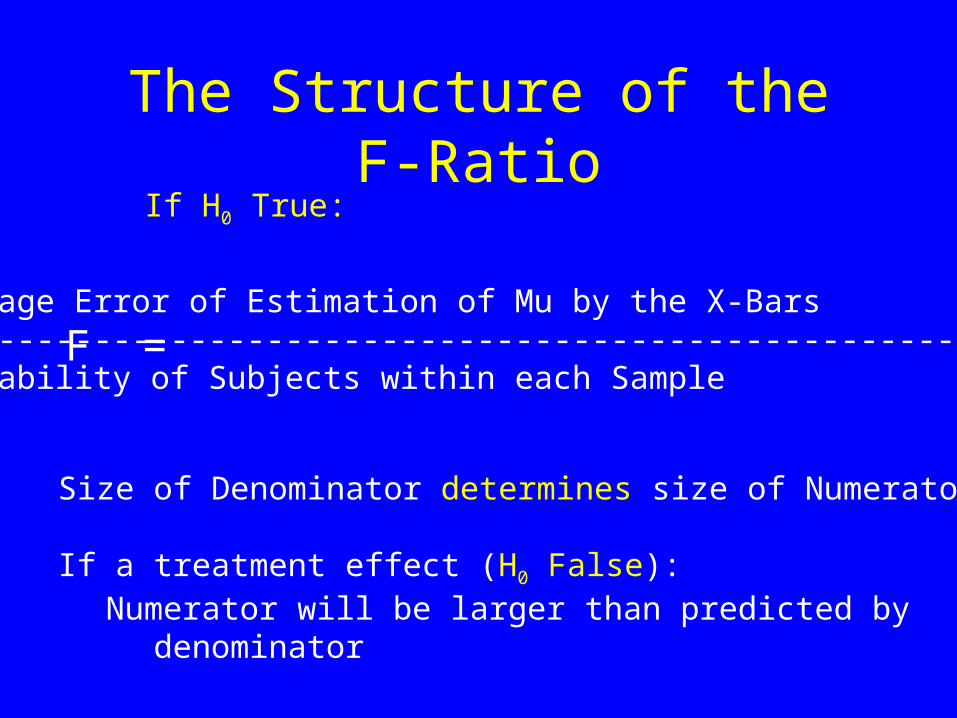
The Structure of the F-Ratio
F = Average Error of Estimation of Mu by the X-Bars----------------------------------------------------------------Variability of Subjects within each Sample
If H0 True:
Size of Denominator determines size of Numerator
If a treatment effect (H0 False):Numerator will be larger than predicted by
denominator
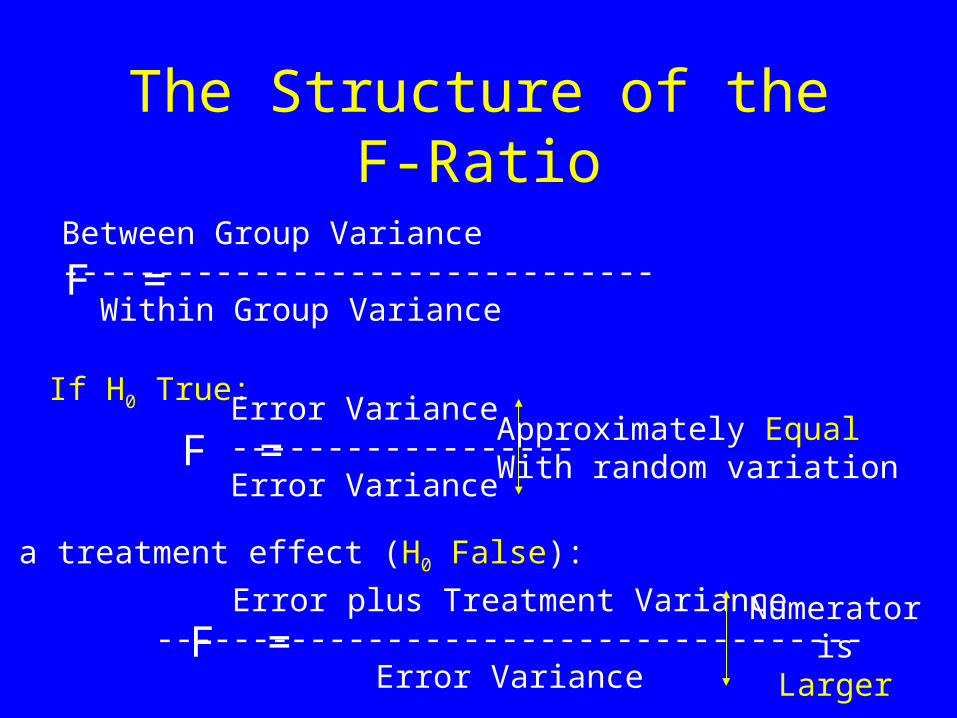
The Structure of the F-Ratio
F = Between Group Variance------------------------------- Within Group Variance
If a treatment effect (H0 False):
If H0 True:
F = Error Variance------------------Error Variance
Approximately EqualWith random variation
F = Error plus Treatment Variance-------------------------------------
Error Variance
Numeratoris
Larger
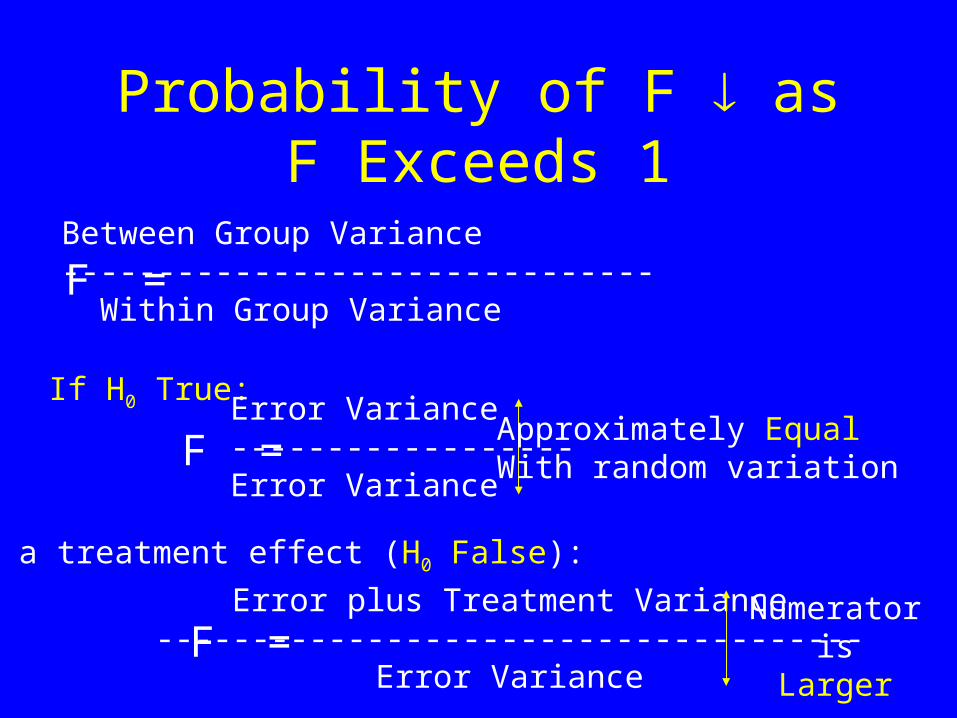
Probability of F as F Exceeds 1
F = Between Group Variance------------------------------- Within Group Variance
If a treatment effect (H0 False):
If H0 True:
F = Error Variance------------------Error Variance
Approximately EqualWith random variation
F = Error plus Treatment Variance-------------------------------------
Error Variance
Numeratoris
Larger
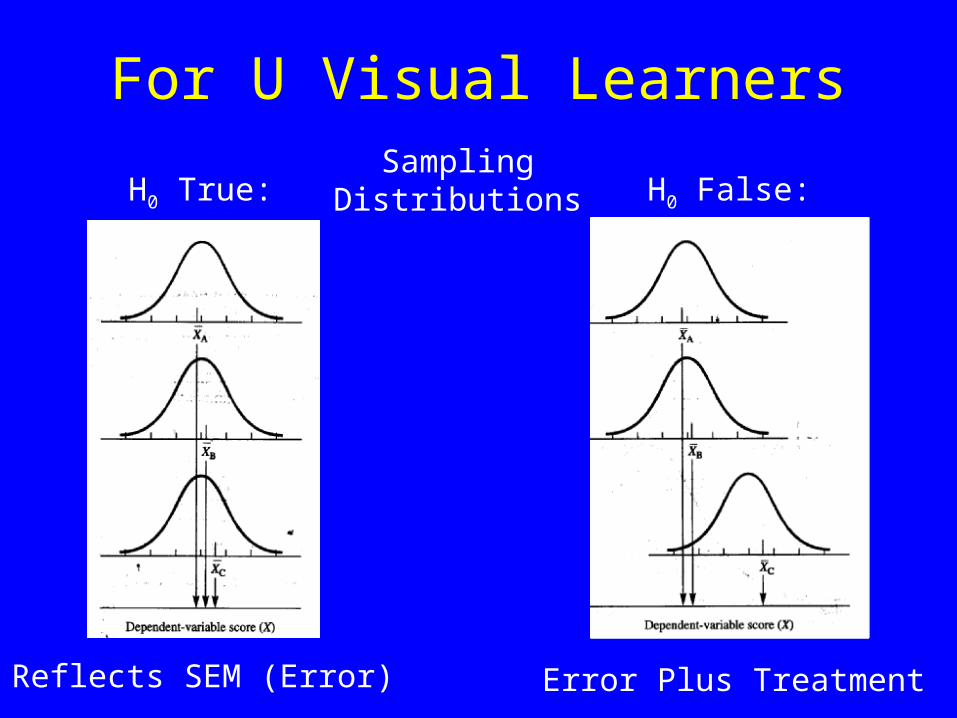
For U Visual Learners
Reflects SEM (Error)
H0 True:
Error Plus Treatment
H0 False:Sampling
Distributions
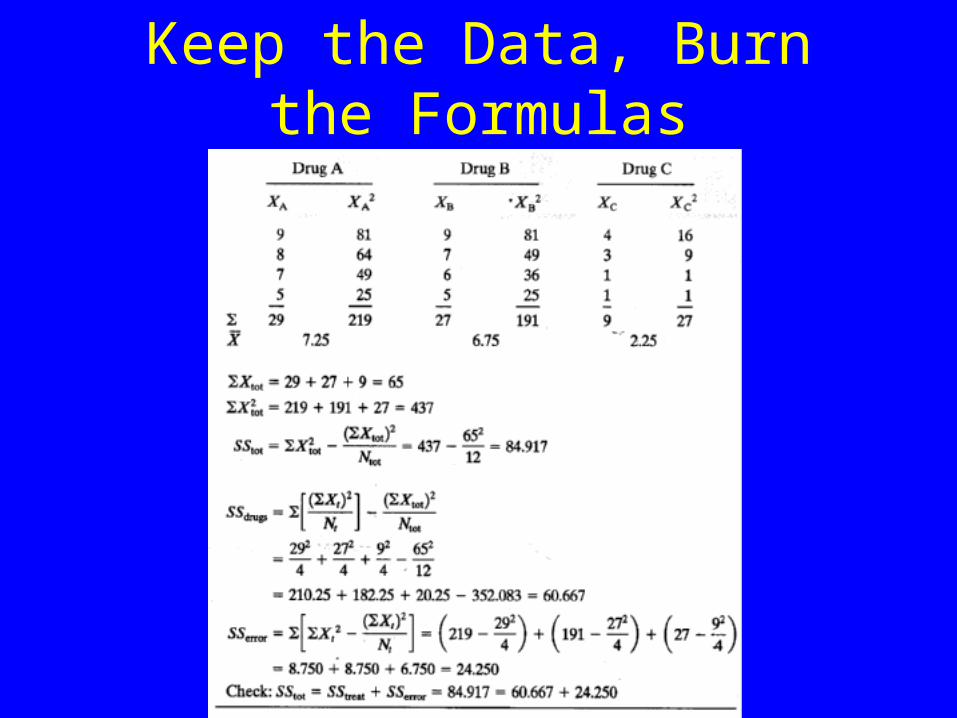
Keep the Data, Burn the Formulas
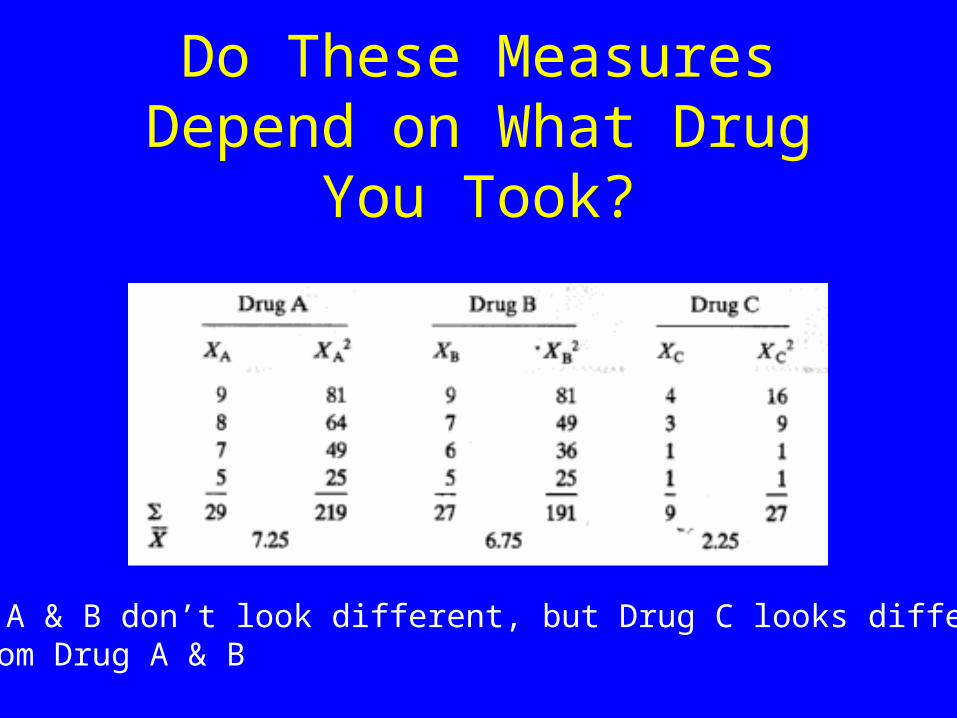
Do These Measures Depend on What Drug You Took?
Drug A & B don’t look different, but Drug C looks differentFrom Drug A & B
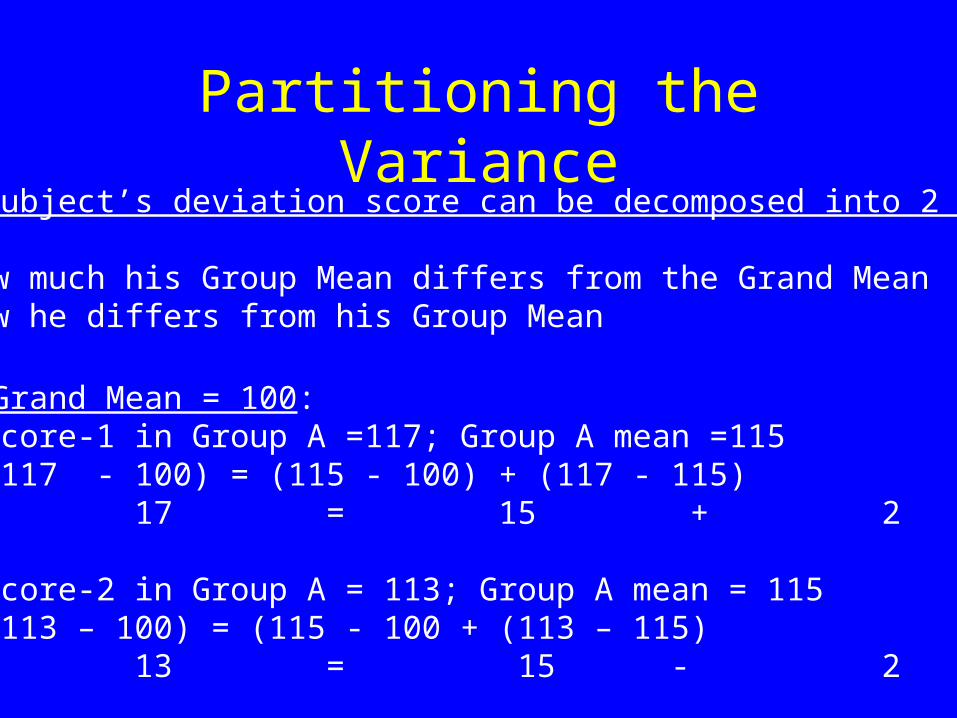
Partitioning the VarianceEach Subject’s deviation score can be decomposed into 2 parts:
•How much his Group Mean differs from the Grand Mean•How he differs from his Group Mean
If Grand Mean = 100:Score-1 in Group A =117; Group A mean =115(117 - 100) = (115 - 100) + (117 - 115) 17 = 15 + 2
Score-2 in Group A = 113; Group A mean = 115(113 – 100) = (115 - 100 + (113 – 115) 13 = 15 - 2
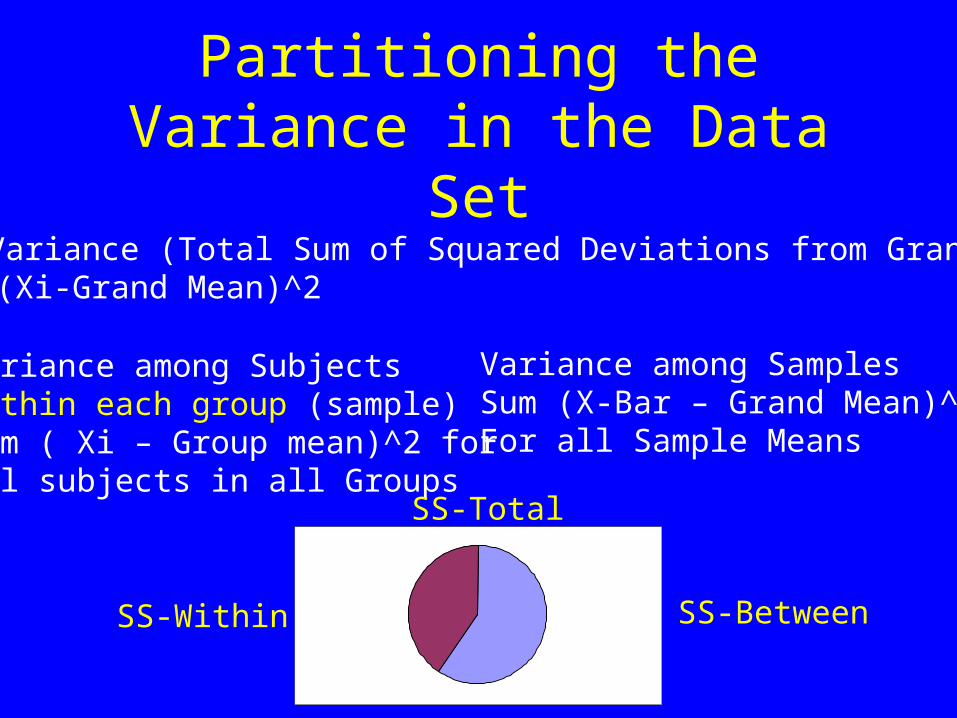
Partitioning the Variance in the Data Set
Total Variance (Total Sum of Squared Deviations from Grand Mean)Sum (Xi-Grand Mean)^2
Variance among SubjectsWithin each group (sample)Sum ( Xi – Group mean)^2 forAll subjects in all Groups
Variance among SamplesSum (X-Bar – Grand Mean)^2For all Sample Means
SS-Total
SS-Within SS-Between
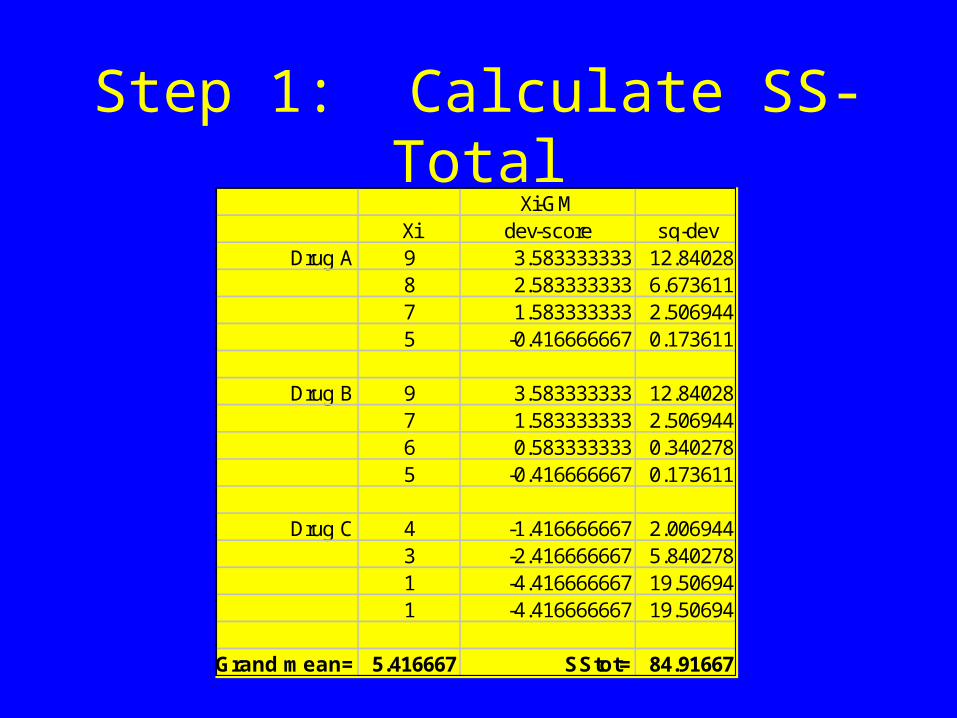
Step 1: Calculate SS-TotalXi-GM
Xi dev-score sq-devDrug A 9 3.583333333 12.84028
8 2.583333333 6.6736117 1.583333333 2.5069445 -0.416666667 0.173611
Drug B 9 3.583333333 12.84028
7 1.583333333 2.5069446 0.583333333 0.3402785 -0.416666667 0.173611
Drug C 4 -1.416666667 2.006944
3 -2.416666667 5.8402781 -4.416666667 19.506941 -4.416666667 19.50694
Grand mean= 5.416667 SStot= 84.91667
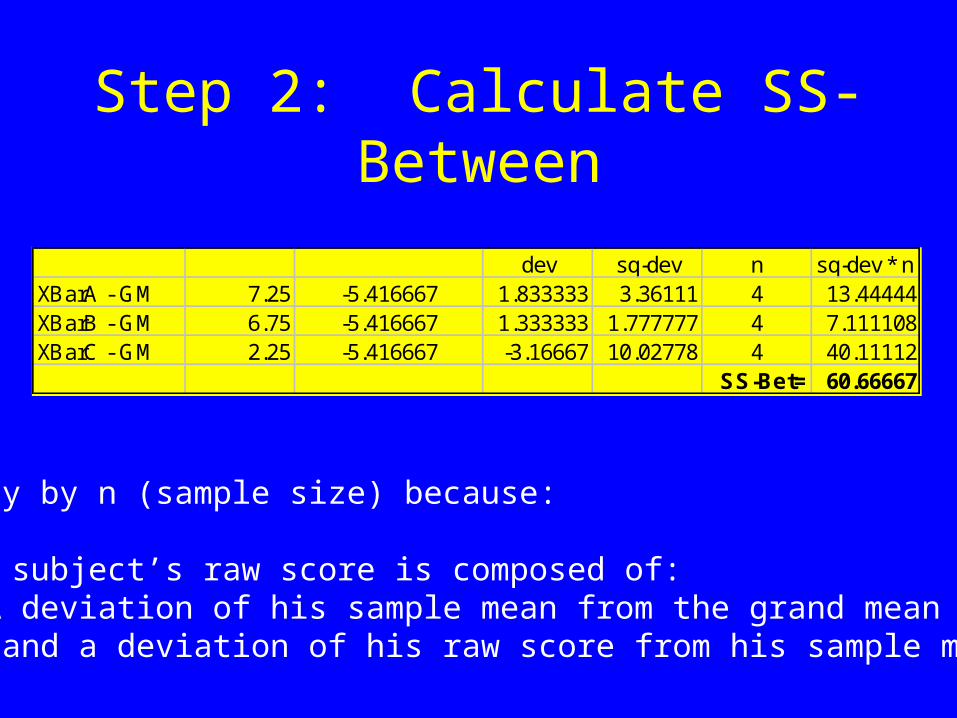
Step 2: Calculate SS-Between
dev sq-dev n sq-dev * nXBarA - GM 7.25 -5.416667 1.833333 3.36111 4 13.44444XBarB - GM 6.75 -5.416667 1.333333 1.777777 4 7.111108XBarC - GM 2.25 -5.416667 -3.16667 10.02778 4 40.11112
SS-Bet= 60.66667
Multiply by n (sample size) because:
Each subject’s raw score is composed of:•A deviation of his sample mean from the grand mean•(and a deviation of his raw score from his sample mean)
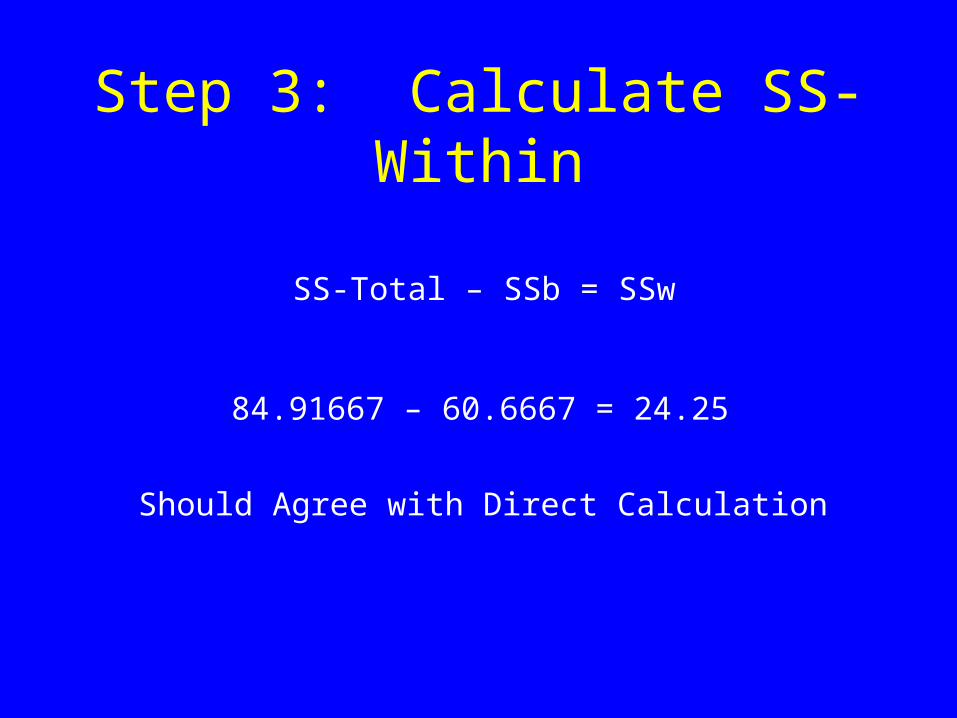
Step 3: Calculate SS-Within
SS-Total – SSb = SSw
84.91667 – 60.6667 = 24.25
Should Agree with Direct Calculation
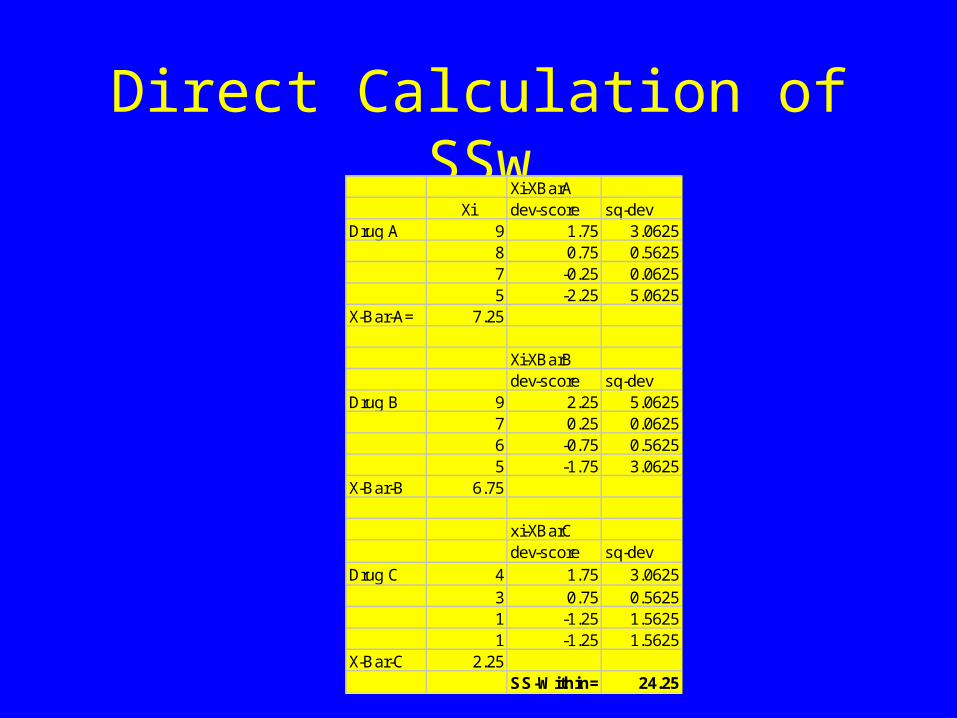
Direct Calculation of SSwXi-XBarA
Xi dev-score sq-devDrug A 9 1.75 3.0625
8 0.75 0.56257 -0.25 0.06255 -2.25 5.0625
X-Bar-A= 7.25
Xi-XBarBdev-score sq-dev
Drug B 9 2.25 5.06257 0.25 0.06256 -0.75 0.56255 -1.75 3.0625
X-Bar-B 6.75
xi-XBarCdev-score sq-dev
Drug C 4 1.75 3.06253 0.75 0.56251 -1.25 1.56251 -1.25 1.5625
X-Bar-C 2.25SS-Within= 24.25
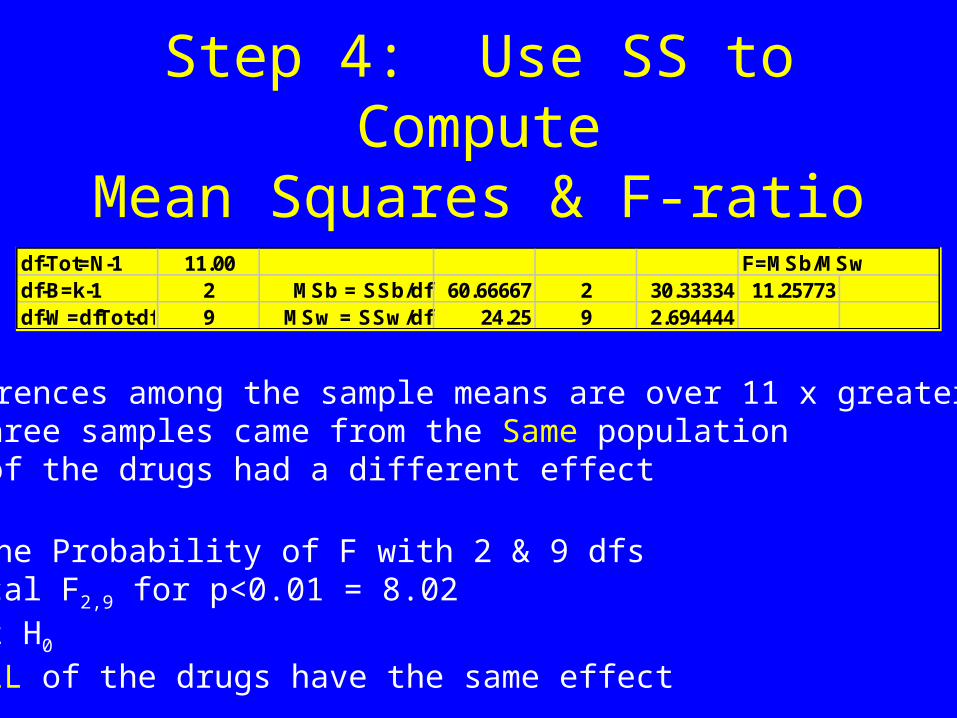
Step 4: Use SS to ComputeMean Squares & F-ratio
df-Tot=N-1 11.00 F=MSb/MSwdf-B=k-1 2 MSb = SSb/df 60.66667 2 30.33334 11.25773df-W=dfTot-dfB 9 MSw = SSw/df 24.25 9 2.694444
The differences among the sample means are over 11 x greater than if:•All three samples came from the Same population•None of the drugs had a different effect
Look up the Probability of F with 2 & 9 dfs•Critical F2,9 for p<0.01 = 8.02•Reject H0
•Not ALL of the drugs have the same effect
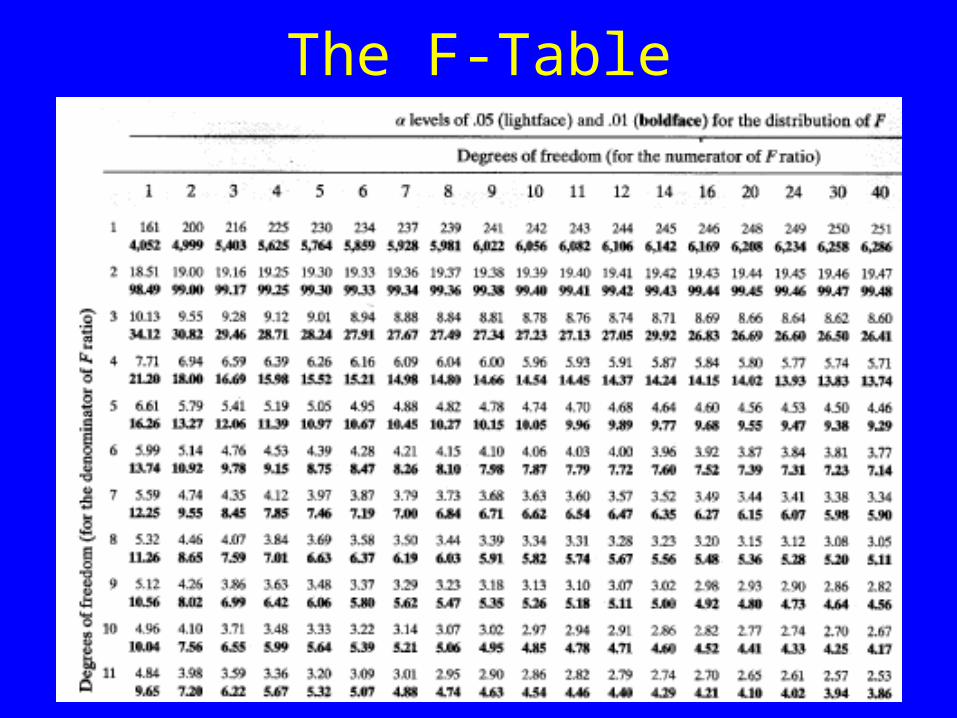
The F-Table
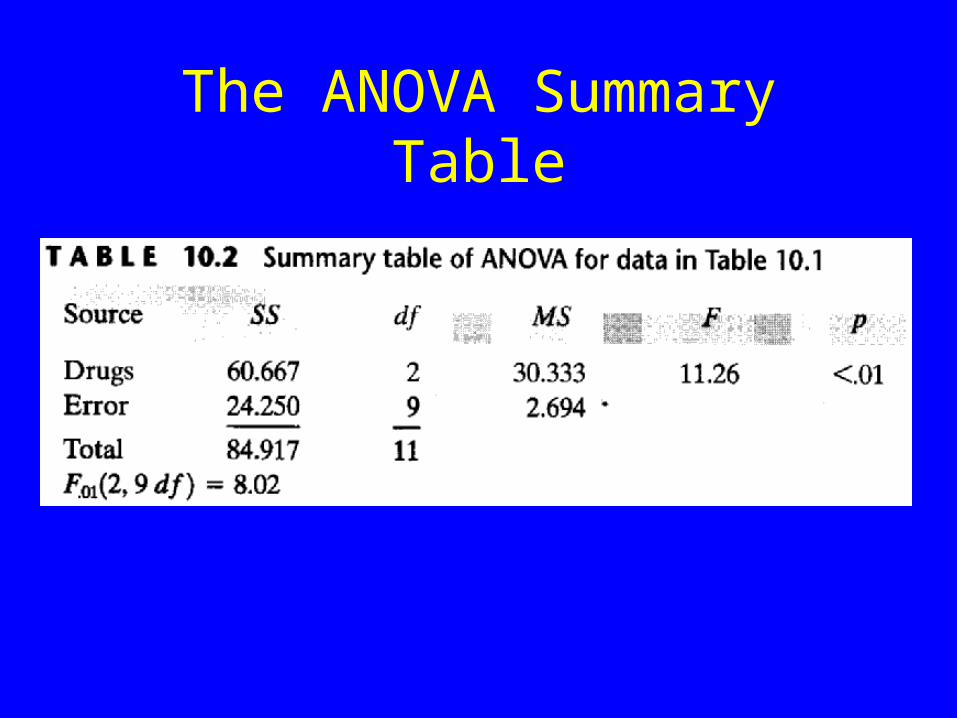
The ANOVA Summary Table
What Do You Do Now?
A Significant F-ratio means at least one Sample came from aDifferent Population.
What Samples are different from what other Samples?
Use Tukey’s Honestly Significant Difference (HSD) Test
Tukey’s HSD Test
Can only be used if overall ANOVA is SignificantA “Post Hoc” TestUsed to make “Pair-Wise” comparisons
Structure:Analogous to t-testBut uses estimated Standard Error of the Mean in the Denominator
Hence a different critical value (HSD) table
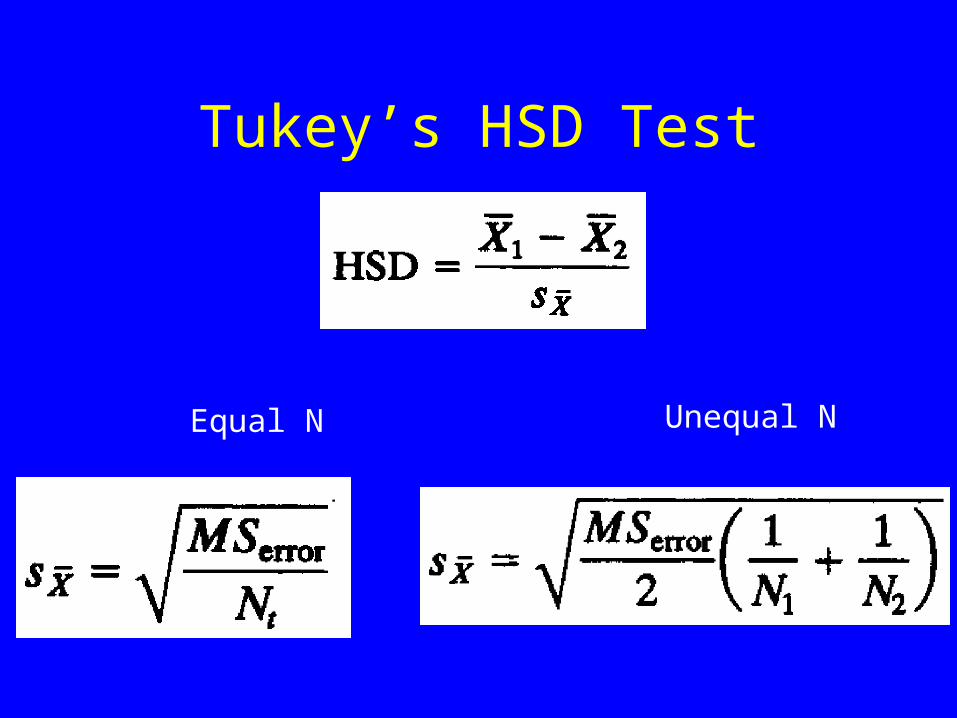
Tukey’s HSD Test
Equal N Unequal N
Assumptions of ANOVA
1. All Populations Normally distributed2. Homogeneity of Variance3. Random Assignment
ANOVA is robust to all but gross violations of these theoreticalassumptions
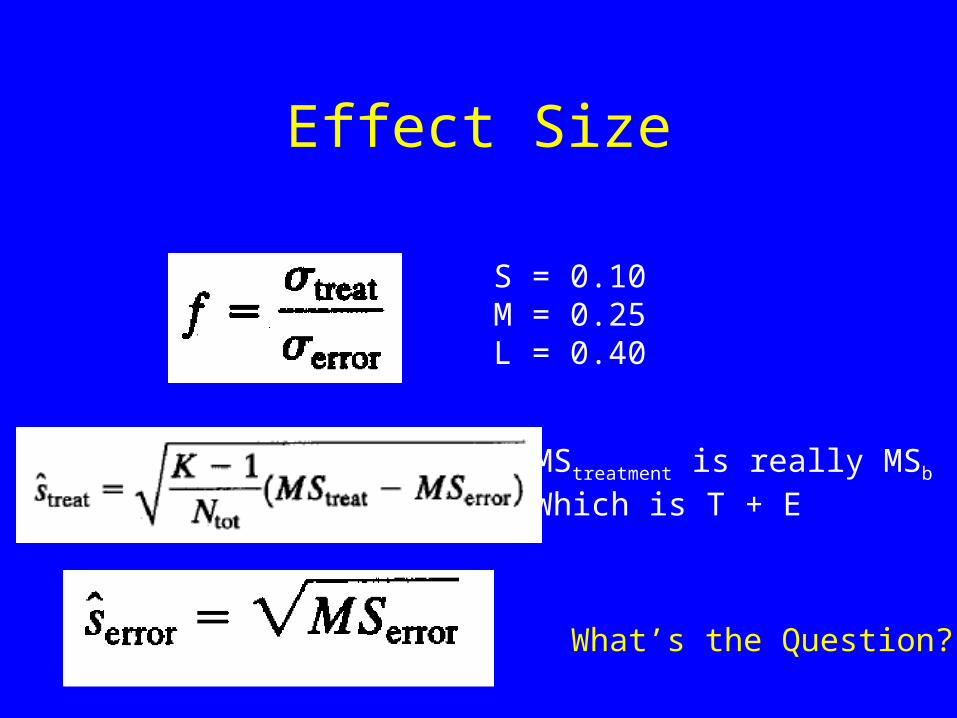
Effect Size
MStreatment is really MSb
Which is T + E
S = 0.10M = 0.25L = 0.40
What’s the Question?