Embed Size (px)
DESCRIPTION
ANOVA Template
Citation preview
Group group 1 group 2 group 3 group 4 group 5 ANOVA:8 8 1 1 5 523 n =
0 7 0 2 10 3599 k =
5 6 8 7 9 273368
9 2 8 6 2 Xbar1 = 5.32
5 5 9 4 6 Xbar2 = 5.15
1 2 5 1 8 Xbar3 = 5.54
2 0 7 2 9 Xbar4 = 4.38
5 5 8 9 3 Xbar5 = 5.755 7 1 4 9 Sums of Squares2 1 4 5 5 SSBetween 21.967 10 5 3 4 SSWithin 843.10 9 9 0 3 3 SSTotal = 865.079 7 8 10 77 9 9 4 10 Degrees of Freedom4 3 10 2 6 df between = 4 (k-1 = 5-1)8 3 3 7 0 df within = 95 (n-k = 100-5) 3 5 4 3 3 df total = 99 (n-1 = 100-1) 8 4 8 3 3
10 7 3 4 5 Mean Square Errors1 2 9 8 6 MSEBetween 5.49
MSEWithin 9.11
Average 5.32 5.15 5.54 4.38 5.75 F RatioSum 106 103 111 88 115 F(4, 95) = 0.60Std_Dev 3.13 3.00 3.26 2.61 2.86 p < 0.6613 Sig?Count 20.00 20.00 20.00 20.00 20.00
Std_Error 0.70 0.67 0.73 0.58 0.64 t testGroup Mean Diff1 & 2 0.17 0.9691 & 3 -0.22 1.011 & 4 0.94 0.911 & 5 -0.43 0.9472 & 3 -0.39 0.9912 & 4 0.77 0.8892 & 5 -0.59 0.9273 & 4 1.16 0.9333 & 5 -0.21 0.9694 & 5 -1.37 0.865
ΣX =
ΣX2 =
Σ(X)2 =
ΣX1 =
ΣX2 =
ΣX3 =
ΣX4 =
ΣX5 =
σX-Y
1 2 3 4 50
1
2
3
4
5
6
7
Group
Re
su
lt
100
5
106 11326
103 10624
111 12276
88 7677
115 13210
(k-1 = 5-1)(n-k = 100-5) (n-1 = 100-1)
No!
t df p < sig?0.173 38 0.864 No!0.217 38 0.830 No!1.033 38 0.308 No!0.449 38 0.656 No!0.39 38 0.699 No!
0.869 38 0.390 No!0.64 38 0.526 No!
1.242 38 0.222 No!0.214 38 0.832 No!1.579 38 0.123 No!
# Sig = 0
ΣX12 =
ΣX22 =
ΣX32 =
ΣX42 =
ΣX52 =
Partitioning of the Sums of Squares
SSBetween SSWithin
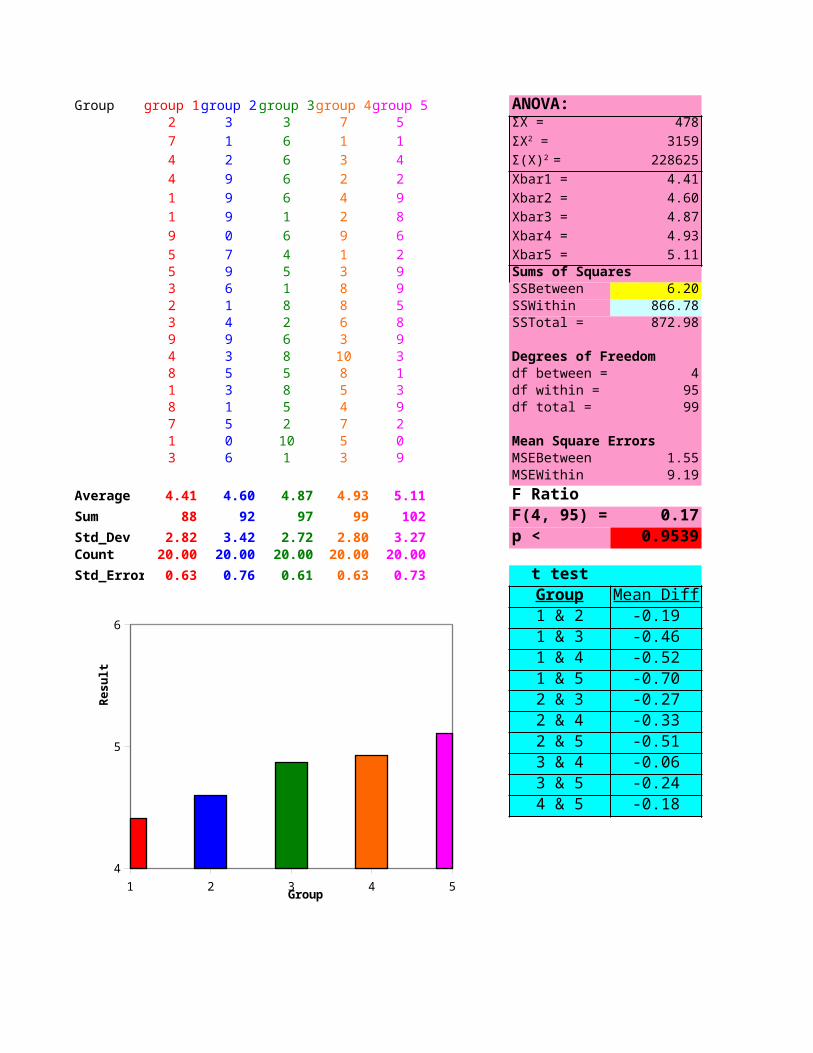
To begin this simulation, start in the green box below. Click the "delete" key. This will produce a new set of random numbers. The spreadsheet will calculate whether there is a significant difference between the conditions using an ANOVA versus using ten independent t tests for multiple comparisons of the group means.
Please look in the red boxes for the results of both tests (ANOVA and T TESTS). Please record on the tally sheet A) the F ratio, B) if the ANOVA yielded a significant result by typing a 1 for "yes" and a 0 for "no." C) For the t test, count the number of significant "results" you obtained, and indicate this number on the tally sheet as well.
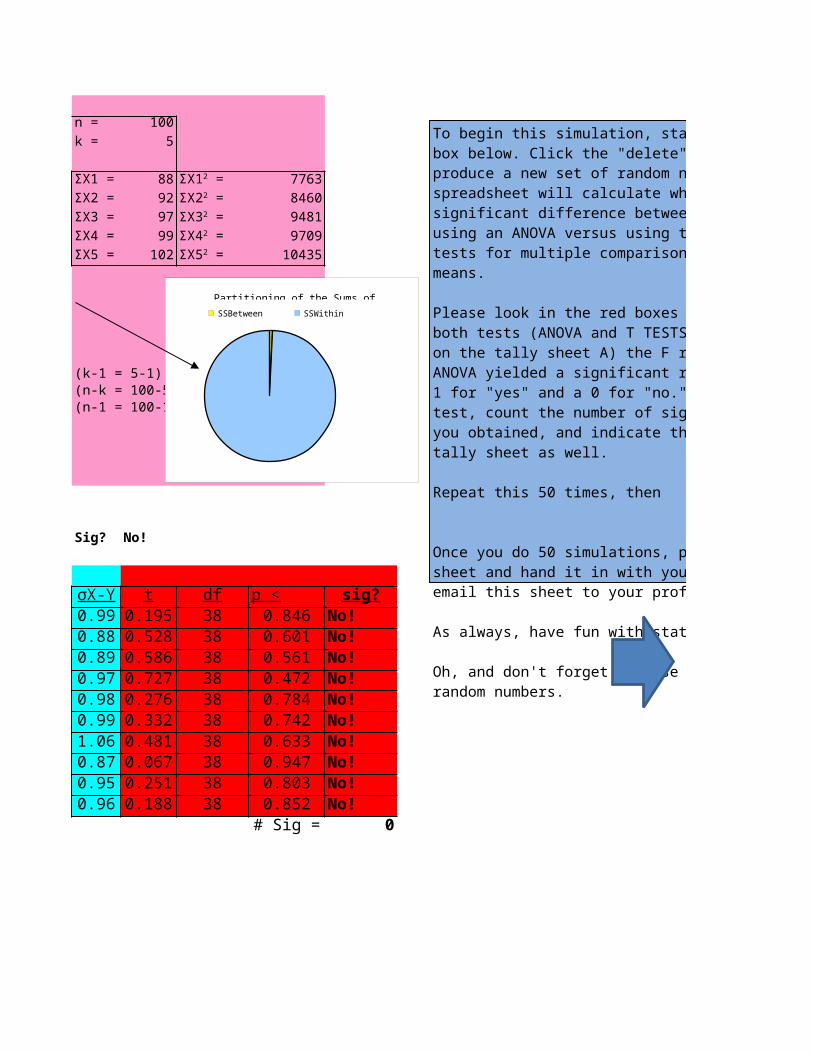
Repeat this 50 times, then
Once you do 50 simulations, print out the tally sheet and hand it in with your homework, and email this sheet to your professor as well!
As always, have fun with statistics and LEARN.
Oh, and don't forget...these data are simply random numbers.

To begin this simulation, start in the green box below. Click the "delete" key. This will produce a new set of random numbers. The spreadsheet will calculate whether there is a significant difference between the conditions using an ANOVA versus using ten independent t tests for multiple comparisons of the group means.
Please look in the red boxes for the results of both tests (ANOVA and T TESTS). Please record on the tally sheet A) the F ratio, B) if the ANOVA yielded a significant result by typing a 1 for "yes" and a 0 for "no." C) For the t test, count the number of significant "results" you obtained, and indicate this number on the tally sheet as well.
Repeat this 50 times, then
Once you do 50 simulations, print out the tally sheet and hand it in with your homework, and email this sheet to your professor as well!
As always, have fun with statistics and LEARN.
Oh, and don't forget...these data are simply random numbers.
Attempt F Ratio ANOVA Sig? T TEST Sig?123456789
1011121314151617181920212223242526272829303132333435363738394041424344454647484950
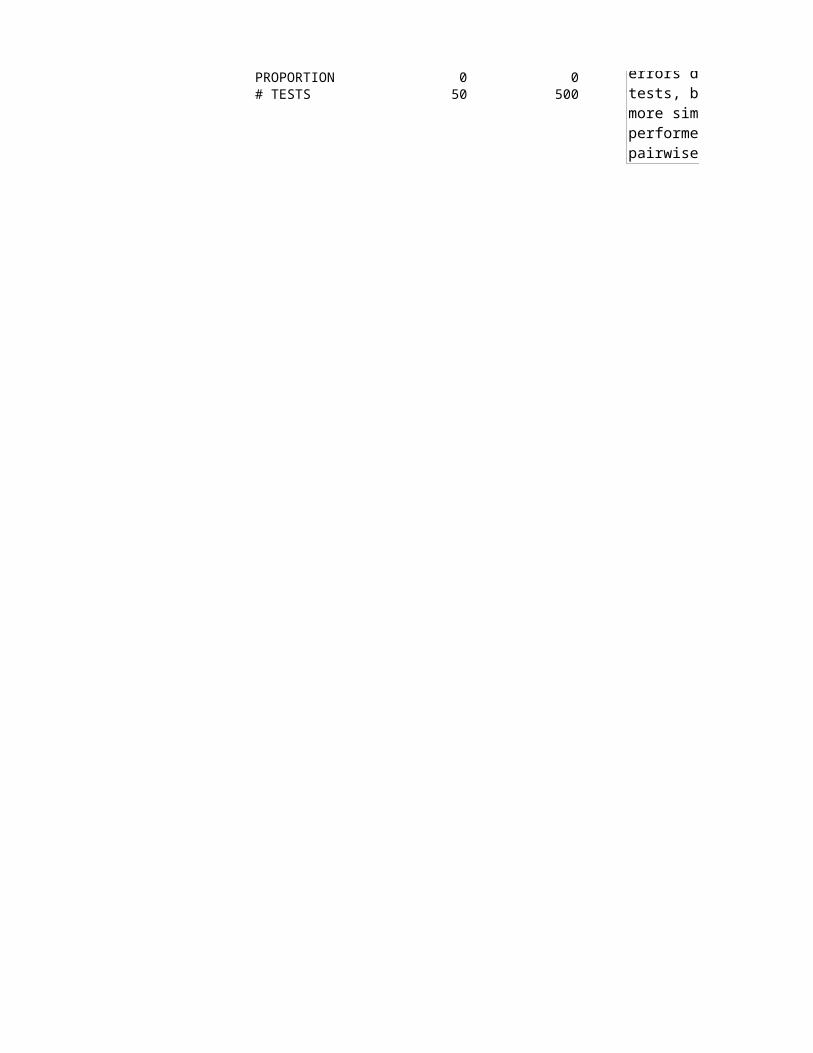
ABSOLUTE # 0 0PROPORTION 0 0# TESTS 50 500
Note how the absolute number of type I errors differs for the ANOVA and t tests, but that the proportions are more similar....remember...you performed only 50 ANOVAs, but 500 pairwise t tests!
Note how the absolute number of type I errors differs for the ANOVA and t tests, but that the proportions are more similar....remember...you performed only 50 ANOVAs, but 500 pairwise t tests!
Note how the absolute number of type I errors differs for the ANOVA and t tests, but that the proportions are more similar....remember...you performed only 50 ANOVAs, but 500 pairwise t tests!
Note how the absolute number of type I errors differs for the ANOVA and t tests, but that the proportions are more similar....remember...you performed only 50 ANOVAs, but 500 pairwise t tests!
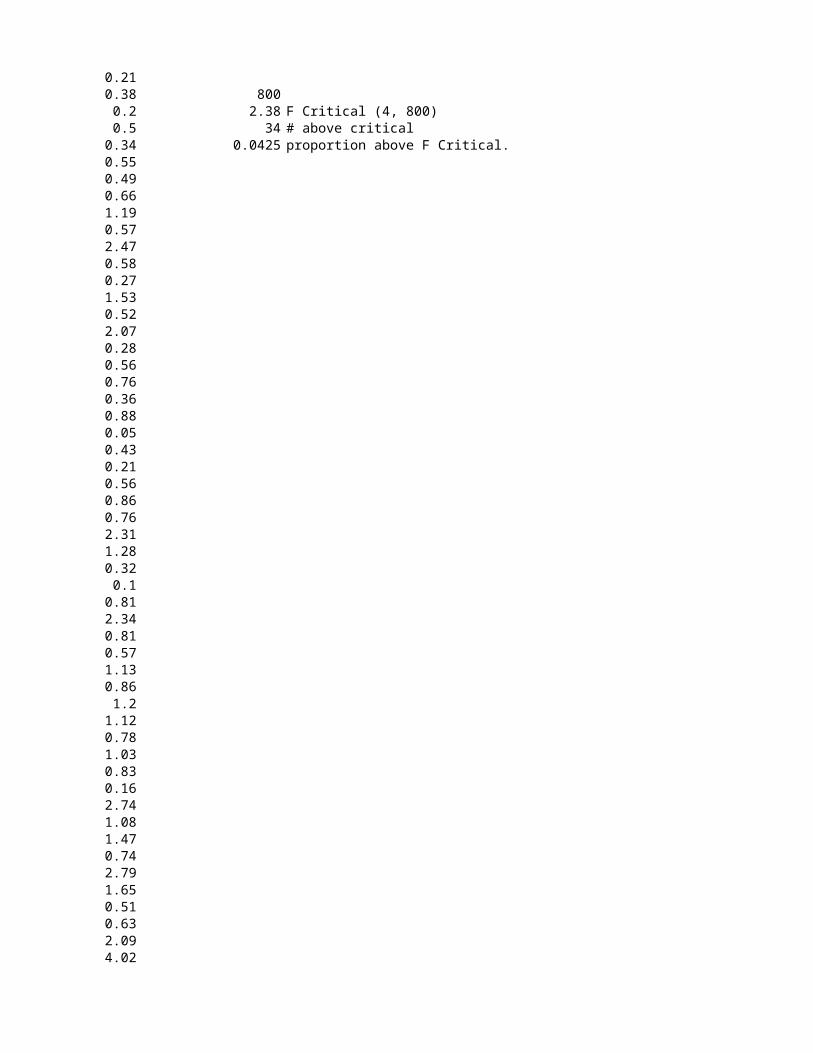
0.210.38 800
0.2 2.38 F Critical (4, 800)0.5 34 # above critical
0.34 0.0425 proportion above F Critical. 0.550.490.661.190.572.470.580.271.530.522.070.280.560.760.360.880.050.430.210.560.860.762.311.280.32
0.10.812.340.810.571.130.86
1.21.120.781.030.830.162.741.081.470.742.791.650.510.632.094.020.27
0.31.190.71
2.030.911.070.441.190.322.040.890.87
0.72.111.43
0.70.231.080.851.660.470.541.171.550.330.420.710.270.681.23
1.30.440.180.370.990.391.840.521.251.29
0.41.680.151.052.061.132.941.811.821.290.161.660.820.580.411.29
1.31.6
1.041.74
0.960.761.082.491.160.991.480.060.92
3.81.1
0.951.3
0.541.2
0.741.660.590.190.471.651.180.290.42
1.50.630.090.370.932.460.540.770.821.040.580.271.070.970.88
1.80.622.120.811.320.930.471.94
21.12
0.70.61.80.92.7
0.460.51.8
2.21.1
0.540.830.120.45
0.60.681.670.540.86
1.61.2
0.221.5
0.581.41.31.3
0.862.41.3
0.421.120.22
2.31.71.5
0.941.6
0.652.71.6
0.411.3
0.940.760.940.430.810.560.250.551.45
11.20.51.2
0.970.110.16
0.60.913.740.241.111.49
0.750.361.262.351.560.68
0.91.91
1.80.791.060.120.911.190.180.741.160.010.421.771.030.610.540.25
30.48
1.90.310.740.550.560.181.160.431.351.560.860.541.340.882.032.141.140.731.350.720.440.812.06
1.80.230.280.980.88
0.90.40.4
1.41.4
0.130.81.4
1.042.9
0.290.211.220.091.420.180.381.220.06
0.30.8
20.990.870.541.44
1.50.580.950.67
0.61.40.81.8
0.660.580.83
0.50.60.50.40.41.2
0.261.920.380.760.770.441.373.07
1.73.20.42.60.50.4
20.950.42
0.860.460.310.160.720.550.080.530.070.34
0.40.6
0.120.50.6
0.120.340.120.690.940.260.850.480.670.770.970.260.360.080.38
0.20.2
0.310.890.321.15
20.31.4
0.750.211.120.320.240.570.820.660.230.381.061.360.620.85
1.60.752.020.77
0.240.26
0.60.070.041.121.671.050.310.650.971.59
0.71.7
0.140.590.850.710.390.19
1.30.050.911.051.12
0.80.551.080.110.470.24
1.50.24
1.90.240.620.530.762.52
11
0.321.131.290.520.190.781.272.110.960.760.260.283.32
1.30.140.07
1.440.80.71.61.41.31.4
0.341.40.61.5
2.160.761.421.321.632.692.640.921.181.020.770.270.332.11
0.11.080.191.370.320.770.672.332.191.250.710.181.69
10.9
0.690.96
2.50.691.180.73
0.20.630.650.520.841.720.550.470.430.170.45
0.830.380.860.79
0.50.992.181.311.250.341.45
0.90.071.280.120.75
10.44
1.50.550.87
10.081.880.810.250.290.290.490.180.480.430.260.532.55
10.61.3
0.062.840.270.510.481.98
0.80.31.6
11
1.10.360.52
1.51.3
1.170.9
0.95
0.220.551.650.990.481.491.14
0.92.740.560.150.870.811.250.452.630.290.560.84
0.70.331.150.961.981.011.251.151.251.790.180.050.560.870.38
0.80.581.19
2.70.330.910.630.88
0.20.32
0.41.810.210.560.720.512.671.060.462.230.410.920.61
0.830.97
0.50.551.171.880.830.771.411.632.070.61
0.71.510.311.26
0.91.921.982.181.150.432.540.470.120.670.940.491.330.691.160.210.370.921.860.441.321.692.240.980.730.340.17
0.72.110.16
10.450.110.281.380.862.48
2.11.01
0.81.59
0.570.340.690.072.190.570.951.320.950.740.950.810.61
0.70.550.671.970.210.430.650.190.210.510.641.741.270.210.42
0.90.6
0.090.823.190.390.710.63
0.62.091.18
0.51.240.110.46
1.80.290.170.111.441.350.29
0.40.760.570.510.990.28
0.8
0.680.280.29
1.42.370.091.391.420.750.120.860.551.631.540.88
1.11.131.643.142.14
0.20.6
1.340.260.270.450.641.32
0.61.230.750.340.860.991.230.75
0.90.50.60.50.42.4
0.280.990.610.370.532.610.240.25
0.20.64
1.60.42
1.41.90.8
0.961.2

SSTOTAL group 1 group 2 group 3 group 4 group 5
61.75738 65.44205 1.976683 0.996556 26.36895
0.02919 52.43164 0.122639 3.665561 90.87345
27.58759 39.00137 63.80805 51.16503 89.15593
74.71644 2.453422 64.88563 30.41114 4.98671421.63769 25.9711 75.73877 12.882 32.188640.364494 3.335616 28.83561 0.603455 69.791335.041626 0.004664 48.71927 3.771051 90.1380621.18354 28.4322 64.06606 73.08251 7.68195728.95901 47.43525 0.802022 19.96177 80.821254.596298 0.942305 13.54257 25.30245 24.4047251.92637 94.10458 27.35256 8.664625 17.3278185.13202 88.74065 0.000608 10.66289 7.90930374.76925 43.77118 71.00227 93.11104 49.7916454.86798 89.34079 81.58078 19.01627 94.1343212.97783 10.21622 92.45475 3.846837 40.1488662.39382 9.404812 8.256911 54.93181 0.1301196.928158 26.57725 16.96811 10.89202 10.90503
62.098 17.70967 70.5403 7.114475 7.39406494.77756 54.87477 8.434293 15.14788 29.995740.400315 2.331049 76.39986 67.73871 41.4812
Shhh....Don't play with this sheet...this is our secret page where we do some of the background math that makes this work!