Embed Size (px)
Citation preview

172
Australian Criminal Intelligence Commission Illicit Drug Data Report 2017–18
APPENDIX
APPENDIX 1SIGNIFICANT BORDER DETECTIONS IN 2017–18(SOURCE: DEPARTMENT OF HOME AFFAIRS)
ATSSignificant border detections of ATS (excluding MDMA) in 2017–18 include:
� 1,000.0 kilograms of crystal methylamphetamine detected via sea cargo
� 437.0 kilograms of methylamphetamine detected via sea cargo from Thailand
� 250.0 kilograms of methylamphetamine detected via air cargo from the United States (US)
� 74.0 kilograms of methylamphetamine detected via air cargo from the US
� 40.0 kilograms of methylamphetamine detected via air cargo from the US.
These 5 detections have a combined weight of 1,801.0 kilograms and account for 61.0 per cent of the total weight of ATS (excluding MDMA) detected at the Australian border in 2017–18.
Significant border detections of MDMA in 2017–18 include:
� 324.0 kilograms detected via air cargo from the Netherlands
� 144.0 kilograms detected via air cargo from the Netherlands
� 12.0 kilograms detected via air cargo from Spain
� 8.4 kilograms detected via international mail from the Netherlands
� 6.5 kilograms detected via international mail from the Netherlands.
These 5 detections have a combined weight of 494.9 kilograms and account for 34.8 per cent of the total weight of MDMA detected at the Australian border in 2017–18.
CANNABISSignificant border detections of cannabis in 2017–18 include:
� 122.9 kilograms of cannabis detected via air cargo from the US
� 15.0 kilograms of cannabis detected via international mail from Germany
� 9.8 kilograms of cannabis detected via air cargo from Serbia
� 9.6 kilograms of cannabis detected via air cargo from the US
� 5.0 kilograms of cannabis detected via international mail from the Netherlands.
These 5 detections have a combined weight of 162.3 kilograms and account for 28.0 per cent of the total weight of cannabis detected at the Australian border in 2017–18.

173
Australian Criminal Intelligence Commission Illicit Drug Data Report 2017–18
APPENDIX
HEROINSignificant border detections of heroin in 2017–18 include:
� 16.0 kilograms of heroin detected via air cargo from Thailand
� 13.6 kilograms of heroin detected via international mail from Thailand
� 12.2 kilograms of heroin detected via international mail from Laos
� 11.0 kilograms of heroin detected via international mail from Thailand
� 9.1 kilograms of heroin detected via international mail from Laos.
These 5 detections have a combined weight of 61.9 kilograms and account for 32.6 per cent of the total weight of heroin detected at the Australian border in 2017–18.
COCAINESignificant border detections of cocaine in 2017–18 include:
� 450.0 kilograms of cocaine detected via air cargo from South Africa
� 50.0 kilograms of cocaine detected via air cargo from Mexico
� 40.0 kilograms of cocaine detected via air cargo from China (Hong Kong)
� 36.0 kilograms of cocaine detected via air cargo from Mexico
� 30.0 kilograms of cocaine detected via air cargo from Mexico.
These 5 detections have a combined weight of 606.0 kilograms and account for 65.4 per cent of the total weight of cocaine detected at the Australian border in 2017–18.
PRECURSORSSignificant border detections of ATS (excluding MDMA) precursors in 2017–18 include:
� 8.0 kilograms of ephedrine detected via air cargo from Malaysia
� 8.0 kilograms of ephedrine detected via air cargo from the United Kingdom
� 8.0 kilograms of ephedrine detected via international mail from China
� 7.5 kilograms of ephedrine detected via air cargo from China
� 7.2 kilograms of ephedrine detected via air cargo from China (Hong Kong).
These 5 detections have a combined weight of 38.7 kilograms and account for less than 1.0 per cent of the total weight of ATS (excluding MDMA) precursors detected at the Australian border in 2017–18.
No significant border detections of MDMA precursors were identified in 2017–18.

174
Australian Criminal Intelligence Commission Illicit Drug Data Report 2017–18
APPENDIX
APPENDIX 2ENIPID FORENSIC PROFILING DATA (SOURCE: AUSTRALIAN FEDERAL POLICE, FORENSIC DRUG INTELLIGENCE)TABLE 1: Synthetic route of manufacture of methylamphetamine ENIPID samples as a proportion of analysed jurisdictional samples, classified by precursor, 2011–June 2018
Year Jurisdiction
Synthetic Route
Total % Eph/PSE %
P2P % Mixed/
Unclassified %
Jan–Jun 2018
NSW 19.6 29.0 8.0 56.6
NT 13.8 1.4 1.4 16.6
Vic 17.4 4.3 5.1 26.8
Total 50.8 34.7 14.5 100
2017
ACT 2.2 0.3 0.3 2.8
NSW 29.7 6.3 9.1 45.1
NT 6.6 0.7 1.4 8.7
SA 14.3 2.5 10.9 27.7
Vic 11.9 1.4 2.1 15.4
WA 0.3 – – 0.3
Total 65.0 11.2 23.8 100
2016
ACT 2.8 – 0.1 2.9
NSW 25.2 1.7 3.5 30.4
NT 7.4 0.2 0.4 8.0
Qld – – – –
SA 10.4 0.8 3.2 14.4
Tas 0.2 – – 0.2
Vic 11.8 0.9 1.1 13.8
WA 28.2 1.1 1.0 30.3
Total 86.0 4.7 9.3 100
2015
ACT 1.1 – – 1.1
NSW 30.5 2.3 2.0 34.8
NT 5.1 0.5 – 5.6
Qld – – – –
SA 6.8 0.6 1.0 8.4
Tas 0.1 – – 0.1
Vic 10.2 0.1 0.4 10.7
WA 34.9 1.9 2.5 39.3
Total 88.7 5.4 5.9 100

175
Australian Criminal Intelligence Commission Illicit Drug Data Report 2017–18
APPENDIX
TABLE 1: Synthetic route of manufacture of methylamphetamine ENIPID samples as a proportion of analysed jurisdictional samples, classified by precursor, 2011–June 2018 (continued)
Year Jurisdiction
Synthetic Route
Total %Eph/PSE %
P2P % Mixed/
Unclassified %
2014
NSW 31.4 3.9 3.1 38.4
NT 3.7 0.9 0.4 5.0
Qld – – 0.1 0.1
SA 2.4 1.6 1.2 5.2
Tas 0.8 – 0.5 1.3
Vic 1.2 – 0.3 1.5
WA 38.9 4.8 4.8 48.5
Total 78.4 11.2 10.4 100
2013
NSW 28.4 4.5 0.9 33.8
NT 3.3 0.2 0.9 4.5
Tas 2.4 0.2 – 2.6
Vic – 0.2 – 0.2
WA 40.7 10.9 7.3 58.9
Total 74.7 16.1 9.2 100
2012
ACT 4.7 – – 4.7
NSW 38.2 0.6 6.2 45.0
NT 7.9 – 0.3 8.2
Tas 0.6 – – 0.6
WA 34.4 4.4 2.7 41.5
Total 85.8 5.0 9.2 100
2011
NSW 13.7 0.9 2.4 17.0
NT 5.7 0.5 – 6.2
Tas 2.4 – – 2.4
WA 46.0 1.9 26.5 74.4
Total 67.8 3.3 28.9 100
Note: Due to a lack of available data, some samples were classified based on sample collection date in place of sample seizure date.
176
Australian Criminal Intelligence Commission Illicit Drug Data Report 2017–18
APPENDIX
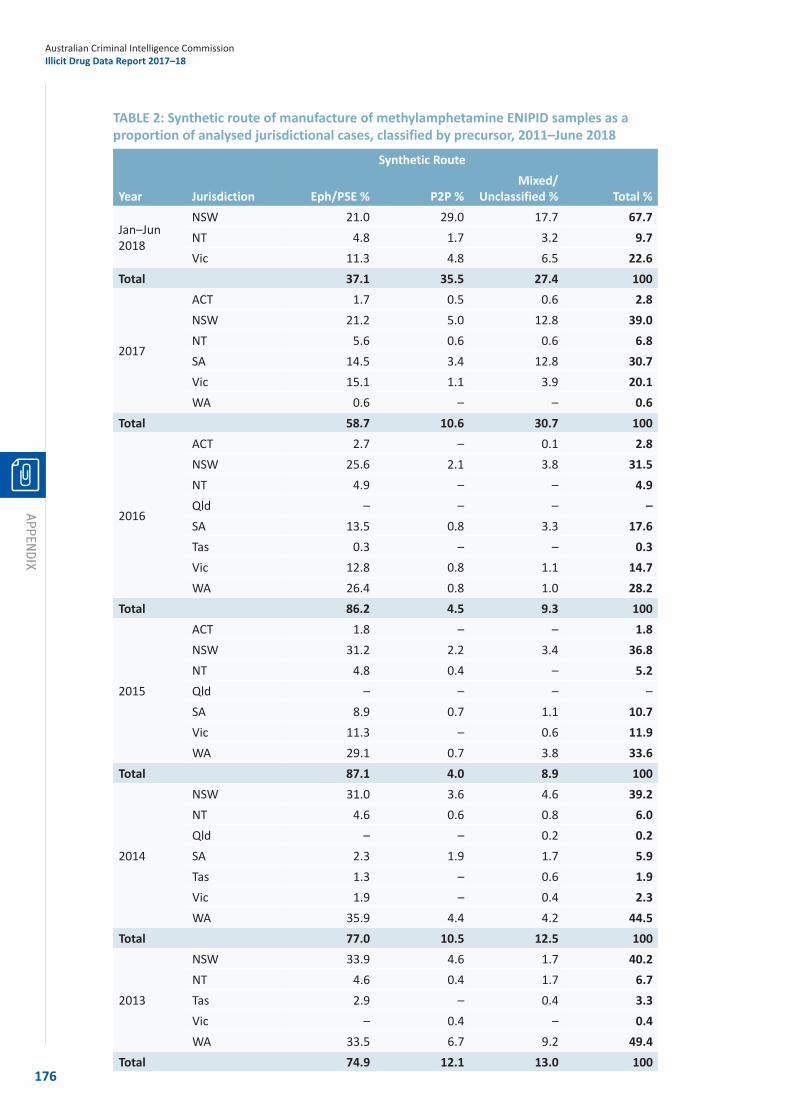
TABLE 2: Synthetic route of manufacture of methylamphetamine ENIPID samples as a proportion of analysed jurisdictional cases, classified by precursor, 2011–June 2018
Year Jurisdiction
Synthetic Route
Total % Eph/PSE %
P2P % Mixed/
Unclassified %
Jan–Jun 2018
NSW 21.0 29.0 17.7 67.7NT 4.8 1.7 3.2 9.7Vic 11.3 4.8 6.5 22.6
Total 37.1 35.5 27.4 100
2017
ACT 1.7 0.5 0.6 2.8NSW 21.2 5.0 12.8 39.0NT 5.6 0.6 0.6 6.8SA 14.5 3.4 12.8 30.7Vic 15.1 1.1 3.9 20.1WA 0.6 – – 0.6
Total 58.7 10.6 30.7 100
2016
ACT 2.7 – 0.1 2.8NSW 25.6 2.1 3.8 31.5NT 4.9 – – 4.9Qld – – – –SA 13.5 0.8 3.3 17.6Tas 0.3 – – 0.3Vic 12.8 0.8 1.1 14.7WA 26.4 0.8 1.0 28.2
Total 86.2 4.5 9.3 100
2015
ACT 1.8 – – 1.8NSW 31.2 2.2 3.4 36.8NT 4.8 0.4 – 5.2Qld – – – –SA 8.9 0.7 1.1 10.7Vic 11.3 – 0.6 11.9WA 29.1 0.7 3.8 33.6
Total 87.1 4.0 8.9 100
2014
NSW 31.0 3.6 4.6 39.2NT 4.6 0.6 0.8 6.0Qld – – 0.2 0.2SA 2.3 1.9 1.7 5.9Tas 1.3 – 0.6 1.9Vic 1.9 – 0.4 2.3WA 35.9 4.4 4.2 44.5
Total 77.0 10.5 12.5 100
2013
NSW 33.9 4.6 1.7 40.2NT 4.6 0.4 1.7 6.7Tas 2.9 – 0.4 3.3Vic – 0.4 – 0.4WA 33.5 6.7 9.2 49.4
Total 74.9 12.1 13.0 100

177
Australian Criminal Intelligence Commission Illicit Drug Data Report 2017–18
APPENDIX
TABLE 2: Synthetic route of manufacture of methylamphetamine ENIPID samples as a proportion of analysed jurisdictional cases, classified by precursor, 2011–June 2018 (continued)
Year Jurisdiction
Synthetic Route
Total %Eph/PSE %
P2P %Mixed/
Unclassified %
2012
ACT 3.5 – – 3.5NSW 41.3 0.5 5.5 47.3NT 11.4 – 0.5 11.9Tas 1.0 – – 1.0WA 26.8 5.0 4.5 36.3
Total 84.0 5.5 10.5 100
2011
NSW 13.5 1.8 4.5 19.8NT 8.1 1.0 – 9.1Tas 4.5 – – 4.5WA 32.4 2.7 31.5 66.6
Total 58.5 5.5 36.0 100
Note: Due to a lack of available data, some samples were classified based on sample collection date in place of sample seizure date.

178
Australian Criminal Intelligence Commission Illicit Drug Data Report 2017–18
APPENDIX
TABLE 3: Geographical origin of heroin ENIPID samples as a proportion of analysed jurisdictional samples, 2011–June 2018
Geographical origin
Total %Year JurisdictionSouth-East
Asia %South-West
Asia %Mixed/
Unclassified %Jan–Jun 2018 WA 66.7 33.3 – 100
Total 66.7 33.3 – 100
2017
ACT 2.8 – – 2.8NSW 13.9 33.3 – 47.2SA 2.8 – – 2.8Vic 22.2 – 8.3 30.5WA 8.3 5.6 2.8 16.7
Total 50.0 38.9 11.1 100
2016
ACT 4.9 2.5 – 7.4NSW 24.7 1.2 – 25.9NT 1.2 – – 1.2SA 6.2 – – 6.2Vic 37.1 1.2 1.2 39.5WA 19.8 – – 19.8
Total 93.9 4.9 1.2 100
2015
ACT 7.2 – – 7.2NSW 36.1 4.1 5.2 45.4Tas 1.0 – – 1.0Vic 38.1 2.1 – 40.2WA 6.2 – – 6.2
Total 88.6 6.2 5.2 100
2014
NSW 47.6 7.2 – 54.8SA – 2.4 – 2.4Vic – 7.1 – 7.1WA 35.7 – – 35.7
Total 80.3 16.7 – 100
2013NSW 45.7 – 2.9 48.6WA 34.3 17.1 – 51.4
Total 80.0 17.1 2.9 100
2012ACT 8.5 – – 8.5NSW 55.3 12.8 12.8 80.9WA 2.1 8.5 – 10.6
Total 65.9 21.3 2.9 100
2011NSW 9.8 2.0 3.9 15.7WA 82.3 – 2.0 84.3
Total 92.1 2.0 5.9 100
Note: Due to a lack of available data, some samples were classified based on sample collection date in place of sample seizure date.

179
Australian Criminal Intelligence Commission Illicit Drug Data Report 2017–18
APPENDIX
TABLE 4: Geographical origin of heroin ENIPID samples as a proportion of analysed jurisdictional cases, 2011–June 2018
Geographical origin
Total %Year JurisdictionSouth-East
Asia %South-West
Asia %Mixed/
Unclassified %Jan–Jun 2018 WA 66.7 33.3 – 100
Total 66.7 33.3 – 100
2017
ACT 3.8 – – 3.8NSW 15.4 15.4 3.8 34.6SA 3.8 – – 3.8Vic 26.9 – 11.6 38.5WA 11.7 3.8 3.8 19.3
Total 61.6 19.2 19.2 100
2016
ACT 4.9 1.6 – 6.6NSW 31.1 1.6 – 32.8NT 1.6 – – 1.6SA 6.6 – – 6.6Vic 36.1 – 3.3 39.3WA 13.1 – – 13.1
Total 93.4 3.3 3.3 100
2015
ACT 3.1 – – 3.1NSW 35.4 6.1 6.2 47.7Tas 1.5 – – 1.5Vic 35.4 3.1 – 38.5WA 9.2 – – 9.2
Total 84.6 9.2 6.2 100
2014
NSW 51.7 10.3 – 62.0SA – 3.5 – 3.5Vic – 3.5 – 3.5WA 31.0 – – 31.0
Total 82.7 17.3 – 100
2013NSW 50.0 0.0 5.6 55.6WA 33.3 11.1 0.0 44.4
Total 83.3 11.1 5.6 100
2012ACT 9.4 – – 9.4NSW 46.9 12.5 18.7 78.1WA 3.1 9.4 – 12.5
Total 59.4 21.9 18.7 100
2011NSW 18.8 6.2 12.5 37.5WA 56.3 – 6.2 62.5
Total 75.1 6.2 18.7 100
Note: Due to a lack of available data, some samples were classified based on sample collection date in place of sample seizure date.

180
Australian Criminal Intelligence Commission Illicit Drug Data Report 2017–18
APPENDIX
TABLE 5: Geographical origin of cocaine ENIPID samples, as a proportion of analysed jurisdictional samples, 2014–June 2018
Geographical origin
Total %Year Jurisdiction Colombia % Peru % Bolivia %Mixed/
Unclassified %Jan–Jun
2018
NSW 34.4 3.1 – 53.1 90.6Vic 9.4 – – – 9.4
Total 43.8 3.1 – 53.1 100
2017
ACT 4.6 – – – 4.6NSW 40.7 13.9 – 20.4 75.0NT 0.9 – – – 0.9SA 8.3 – – 1.9 10.2Vic 6.5 0.9 – 1.9 9.3
Total 61.0 14.8 – 24.2 100
2016
ACT 3.5 – – 0.6 4.1NSW 47.4 0.6 – 21.4 69.4NT 2.3 – – – 2.3SA 4.0 – – – 4.0Vic 2.9 – – 0.6 3.5WA 6.9 0.6 – 9.2 16.7
Total 67.0 1.2 – 31.8 100
2015
ACT 1.1 – – – 1.1NSW 38.1 16.5 – 15.9 70.5NT 0.6 – – – 0.6SA 2.8 – – – 2.8Vic 2.8 – – 3.4 6.2WA 5.1 8.0 – 5.7 18.8
Total 50.5 24.5 – 25.0 100
2014
NSW 10.0 26.7 – 3.3 40.0NT 1.7 1.7 – – 3.3Qld 1.7 3.3 – – 5.0Vic 10.0 – – – 10.0WA 30.0 6.7 – 5.0 41.7
Total 53.3 38.4 – 8.3 100
Note: Due to a lack of available data, some samples were classified based on sample collection date in place of sample seizure date.

181
Australian Criminal Intelligence Commission Illicit Drug Data Report 2017–18
APPENDIX
TABLE 6: Geographical origin of cocaine ENIPID samples as a proportion of analysed jurisdictional cases, 2014–June 2018
Geographical origin
Year Jurisdiction Colombia % Peru % Bolivia %Mixed/
Unclassified % Total %
Jan–Jun 2018
NSW 34.7 3.8 – 50.0 88.5Vic 11.5 – – – 11.5
Total 46.2 3.8 – 50.0 100
2017
ACT 5.9 – – – 5.9NSW 44.1 13.2 – 19.1 76.4NT 1.5 – – – 1.5SA 5.9 – – 1.5 7.4Vic 5.9 – – 2.9 8.8
Total 63.3 13.2 – 23.5 100
2016
ACT 3.5 – – 0.9 4.4NSW 46.5 – – 26.3 72.8NT 0.9 – – – 0.9SA 5.2 – – – 5.2Vic 3.5 – – 0.9 4.4WA 7.0 0.9 – 4.4 12.3
Total 66.6 0.9 – 32.5 100
2015
ACT 1.9 – – – 1.9NSW 38.0 14.8 – 20.4 73.2NT 0.9 – – – 0.9SA 2.8 – – – 2.8Vic 4.6 – – 4.6 9.2WA 2.8 0.9 – 8.3 12.0
Total 51.0 15.7 – 33.3 100
2014
NSW 13.5 13.5 – 5.4 32.4NT 2.7 2.7 – – 5.4Qld 2.7 5.4 – – 8.1Vic 16.2 – – – 16.2WA 24.3 2.7 – 10.8 37.8
Total 59.4 24.3 – 16.2 100
Note: Due to a lack of available data, some samples were classified based on sample collection date in place of sample seizure date.

182
Australian Criminal Intelligence Commission Illicit Drug Data Report 2017–18
NOTES
NOTES


© Commonwealth of Australia 2019