Embed Size (px)
DESCRIPTION
Draft Environmental Impact Report CALAM MONTEREY PENINSULA WATER SUPPLY PROJECT April 2015, Appendix D3Water Quality Analysis of the Discharges
Citation preview
Appendix D3 Water Quality Analysis of the Discharges

550 Kearny Street
Suite 800
San Francisco, CA 94108
415.896.5900 phone
415.896.0332 fax
www.esassoc.com
Appendix D3
memorandum
date April 20, 2015 to Eric Zigas from Asavari Devadiga subject Water Quality Analysis of the Discharges Associated with the Operation of the Monterey Peninsula
Water Supply Project and the Project Variant
Introduction ESA has developed this technical memorandum in the support of the analysis and determination of the water quality impact under the California Environmental Quality Act (CEQA) for the Monterey Peninsula Water Supply Project (MPWSP) Environmental Impact Report (EIR). The analysis in this memorandum focuses on the water quality of the point discharges resulting from the operation of 1) the MPWSP proposed by California American Company or CalAm (the proposed project or the operation of a 9.6-million gallons per day (MGD) MPWSP Desalination Plant) in Section A, and, 2) the Project Variant in Section B. The Project Variant would consist of operating a lower capacity desalination plant – of a 6.4-MGD MPWSP Desalination Plant – along with the Groundwater Project (GWR Project) proposed by the Monterey Regional Water Pollution Control Agency (MRWPCA) herein referred to as the “MRWPCA-proposed GWR Project”.
The intent of this memorandum is to present the water quality analysis, conducted utilizing the best available data, and to identify any potential violations of water quality standards resulting from discharges associated with either the proposed project (MPWSP) or the MRWPCA-proposed GWR Project. This memorandum describes the methodology used to analyze the available water quality data, and then presents and discusses the results. This memorandum also incorporates results from a separate water quality study undertaken by MRWPCA for both the proposed project and Project Variant and prepared by Trussell Technologies, Inc. (2015). Subsequent to the data analysis developed as part of this memorandum, MRWPCA prepared an additional study in late April 2015 for the proposed project and the Project Variant; the results of this study are presented at the end of each section. The memorandum does not make any impact conclusions related to CEQA.
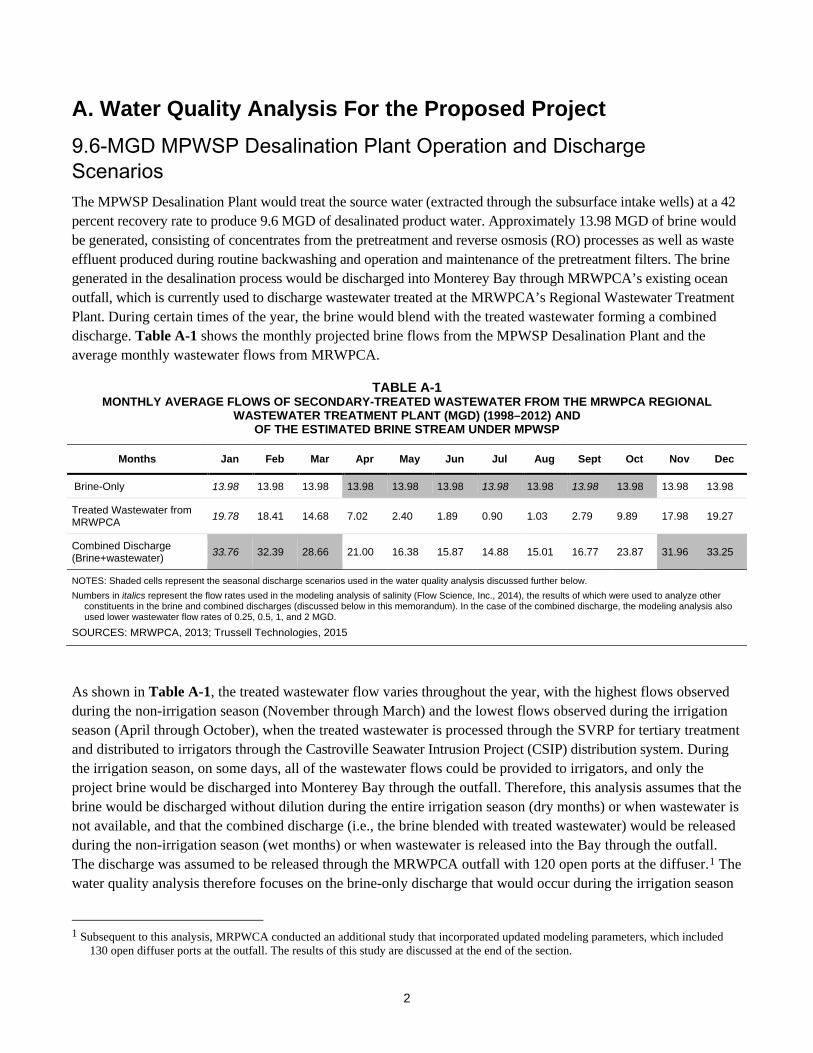
A. Water Quality Analysis For the Proposed Project 9.6-MGD MPWSP Desalination Plant Operation and Discharge Scenarios The MPWSP Desalination Plant would treat the source water (extracted through the subsurface intake wells) at a 42 percent recovery rate to produce 9.6 MGD of desalinated product water. Approximately 13.98 MGD of brine would be generated, consisting of concentrates from the pretreatment and reverse osmosis (RO) processes as well as waste effluent produced during routine backwashing and operation and maintenance of the pretreatment filters. The brine generated in the desalination process would be discharged into Monterey Bay through MRWPCA’s existing ocean outfall, which is currently used to discharge wastewater treated at the MRWPCA’s Regional Wastewater Treatment Plant. During certain times of the year, the brine would blend with the treated wastewater forming a combined discharge. Table A-1 shows the monthly projected brine flows from the MPWSP Desalination Plant and the average monthly wastewater flows from MRWPCA.
TABLE A-1 MONTHLY AVERAGE FLOWS OF SECONDARY-TREATED WASTEWATER FROM THE MRWPCA REGIONAL
WASTEWATER TREATMENT PLANT (MGD) (1998–2012) AND OF THE ESTIMATED BRINE STREAM UNDER MPWSP
Months Jan Feb Mar Apr May Jun Jul Aug Sept Oct Nov Dec
Brine-Only 13.98 13.98 13.98 13.98 13.98 13.98 13.98 13.98 13.98 13.98 13.98 13.98
Treated Wastewater from MRWPCA 19.78 18.41 14.68 7.02 2.40 1.89 0.90 1.03 2.79 9.89 17.98 19.27
Combined Discharge (Brine+wastewater) 33.76 32.39 28.66 21.00 16.38 15.87 14.88 15.01 16.77 23.87 31.96 33.25
NOTES: Shaded cells represent the seasonal discharge scenarios used in the water quality analysis discussed further below. Numbers in italics represent the flow rates used in the modeling analysis of salinity (Flow Science, Inc., 2014), the results of which were used to analyze other
constituents in the brine and combined discharges (discussed below in this memorandum). In the case of the combined discharge, the modeling analysis also used lower wastewater flow rates of 0.25, 0.5, 1, and 2 MGD.
SOURCES: MRWPCA, 2013; Trussell Technologies, 2015
As shown in Table A-1, the treated wastewater flow varies throughout the year, with the highest flows observed during the non-irrigation season (November through March) and the lowest flows observed during the irrigation season (April through October), when the treated wastewater is processed through the SVRP for tertiary treatment and distributed to irrigators through the Castroville Seawater Intrusion Project (CSIP) distribution system. During the irrigation season, on some days, all of the wastewater flows could be provided to irrigators, and only the project brine would be discharged into Monterey Bay through the outfall. Therefore, this analysis assumes that the brine would be discharged without dilution during the entire irrigation season (dry months) or when wastewater is not available, and that the combined discharge (i.e., the brine blended with treated wastewater) would be released during the non-irrigation season (wet months) or when wastewater is released into the Bay through the outfall. The discharge was assumed to be released through the MRWPCA outfall with 120 open ports at the diffuser.1 The water quality analysis therefore focuses on the brine-only discharge that would occur during the irrigation season
1 Subsequent to this analysis, MRPWCA conducted an additional study that incorporated updated modeling parameters, which included 130 open diffuser ports at the outfall. The results of this study are discussed at the end of the section.
2
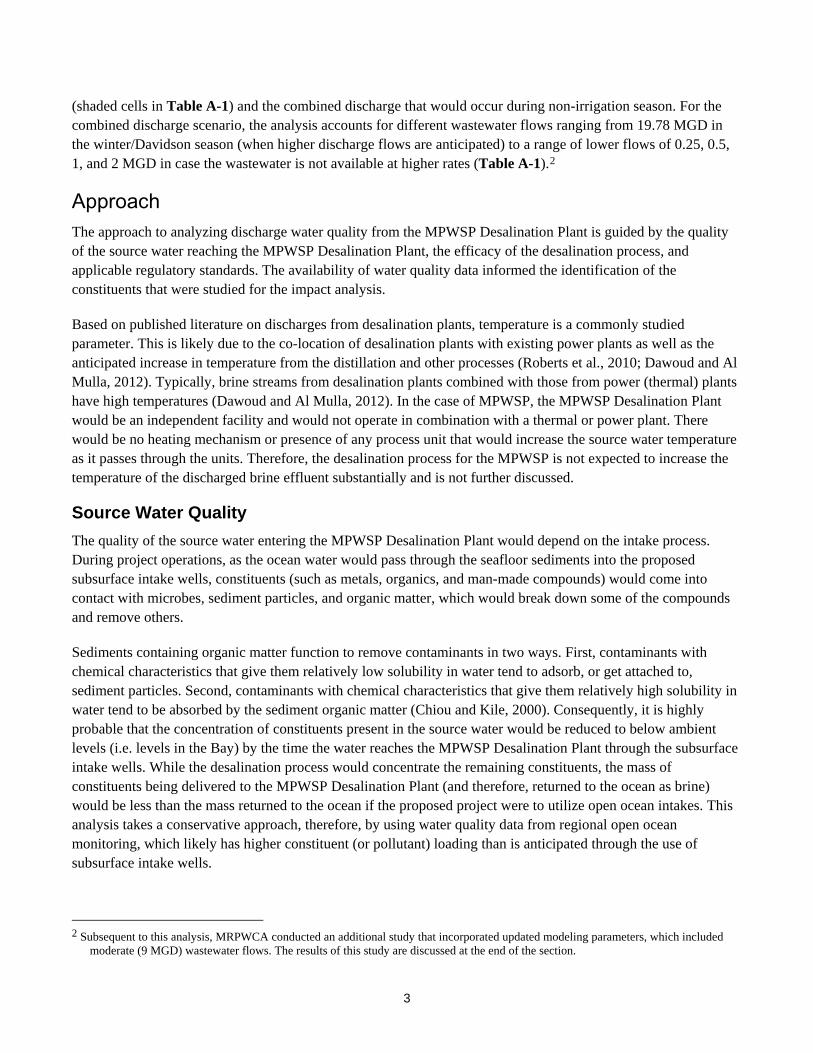
(shaded cells in Table A-1) and the combined discharge that would occur during non-irrigation season. For the combined discharge scenario, the analysis accounts for different wastewater flows ranging from 19.78 MGD in the winter/Davidson season (when higher discharge flows are anticipated) to a range of lower flows of 0.25, 0.5, 1, and 2 MGD in case the wastewater is not available at higher rates (Table A-1).2
Approach The approach to analyzing discharge water quality from the MPWSP Desalination Plant is guided by the quality of the source water reaching the MPWSP Desalination Plant, the efficacy of the desalination process, and applicable regulatory standards. The availability of water quality data informed the identification of the constituents that were studied for the impact analysis.
Based on published literature on discharges from desalination plants, temperature is a commonly studied parameter. This is likely due to the co-location of desalination plants with existing power plants as well as the anticipated increase in temperature from the distillation and other processes (Roberts et al., 2010; Dawoud and Al Mulla, 2012). Typically, brine streams from desalination plants combined with those from power (thermal) plants have high temperatures (Dawoud and Al Mulla, 2012). In the case of MPWSP, the MPWSP Desalination Plant would be an independent facility and would not operate in combination with a thermal or power plant. There would be no heating mechanism or presence of any process unit that would increase the source water temperature as it passes through the units. Therefore, the desalination process for the MPWSP is not expected to increase the temperature of the discharged brine effluent substantially and is not further discussed.
Source Water Quality The quality of the source water entering the MPWSP Desalination Plant would depend on the intake process. During project operations, as the ocean water would pass through the seafloor sediments into the proposed subsurface intake wells, constituents (such as metals, organics, and man-made compounds) would come into contact with microbes, sediment particles, and organic matter, which would break down some of the compounds and remove others.
Sediments containing organic matter function to remove contaminants in two ways. First, contaminants with chemical characteristics that give them relatively low solubility in water tend to adsorb, or get attached to, sediment particles. Second, contaminants with chemical characteristics that give them relatively high solubility in water tend to be absorbed by the sediment organic matter (Chiou and Kile, 2000). Consequently, it is highly probable that the concentration of constituents present in the source water would be reduced to below ambient levels (i.e. levels in the Bay) by the time the water reaches the MPWSP Desalination Plant through the subsurface intake wells. While the desalination process would concentrate the remaining constituents, the mass of constituents being delivered to the MPWSP Desalination Plant (and therefore, returned to the ocean as brine) would be less than the mass returned to the ocean if the proposed project were to utilize open ocean intakes. This analysis takes a conservative approach, therefore, by using water quality data from regional open ocean monitoring, which likely has higher constituent (or pollutant) loading than is anticipated through the use of subsurface intake wells.
2 Subsequent to this analysis, MRPWCA conducted an additional study that incorporated updated modeling parameters, which included moderate (9 MGD) wastewater flows. The results of this study are discussed at the end of the section.
3
Desalination Process The proposed desalination process at the MPWSP Desalination Plant would primarily utilize physical separation and filtration processes of coagulation, flocculation, and membrane filtration, followed by RO treatment to remove salts and other minerals from the source water. The salts and other minerals that would not be metabolized, consumed, or converted into other substances during filtration or desalination would be discharged as brine.
Regulatory Standards The brine discharged from the MPWSP Desalination Plant via the existing MRWPCA’s ocean outfall would be a point discharge that would be characterized as a “waste discharge” under the California Ocean Plan. The MRWPCA’s NPDES permit for its Regional Wastewater Treatment Plant3 regulates the existing wastewater discharge through the outfall, therefore, it is expected that the brine discharge would be incorporated as a new discharge or as a modification to the existing discharge as part of the amendment of the NPDES permit. The discharge would then be regulated through the Amended NPDES permit. The current NPDES permit does not list objectives for discharges from desalination plants, and the effluent limitations established through the NPDES permit amendment would be specific to the discharge that incorporates brine from the MPWSP Desalination Plant.
The effluent limitations for brine discharge from the MPWSP Desalination Plant would be based on water quality objectives established in the Ocean Plan (2012b). Currently, none of the water quality objectives in the Ocean Plan are specifically applicable to waste discharges from desalination facilities such as the MPWSP Desalination Plant. However, there are current regulatory standards for other waste discharges such as the treated wastewater currently discharged through the MRWPCA outfall. Therefore, in the absence of directly applicable regulatory standards for brine discharges, this approach utilizes the water quality objectives in the Ocean Plan as the guiding regulatory standards for those constituents for which source water quality data is available. The Ocean Plan water quality objectives would apply to both the brine-only and combined discharges.
Discharges typically result in two types of plumes, a buoyant (rising) plume in the case of a fresh or brackish water discharge, or a negatively buoyant (sinking) plume in the case of discharges with high salinity. For both types of discharges, there is rapid dilution in a zone called the zone of initial dilution (ZID) and the standards apply at the edge of this ZID. The SWRCB (2012) recommends that the regulatory mixing zone include the near field and that the water quality objectives be met at the edge of a regulatory mixing zone—in this case, at the edge of the ZID. The ZID can be defined as the zone immediately adjacent to a discharge where momentum and buoyancy-driven mixing produces rapid dilution of the discharge (Flow Science, Inc., 2014). The outer boundary of the ZID is the point at which a buoyant discharge achieves density equal to that of the ambient water. For negatively buoyant discharges such as the brine-only discharge during the irrigation season, the outer boundary of the ZID is defined as the point at which the discharge contacts the seafloor. This analysis is developed by studying the constituent levels resulting from the brine and combined discharges at the edge of the ZID.
Based on the factors above, this analysis determines if the brine-only and combined discharges to Monterey Bay would exceed water quality objectives established in the Ocean Plan at the edge of the ZID and identifies the constituents that are estimated to exceed the water quality objectives.
3 Order No. R3-2014-0013, NPDES Permit No. CA0048551.
4
Methodology The water quality of the brine was studied using source water data and the efficacy of the desalination process. Two sets of available data were used to characterize source water quality that would enter the MPWSP Desalination Plant:
1) Well data obtained from water quality monitoring conducted by Trussell Technologies, Inc. (2010) for Marina Coast Water District (MCWD) as part of a proposed desalination project. The well is located approximately 5,000 feet south of the proposed subsurface intake wells for MPWSP.
2) Water quality data for Monterey Bay obtained from the Central Coast Long-term Environmental Assessment Network (CCLEAN). Time-integrated ocean samples collected over 30-day periods in both the wet season and dry season from September 2008 through April of 2013 were obtained for two sites: the Southern Monterey Bay site and the Northern Monterey Bay site, located approximately 4 and 12 miles respectively, from the MPWSP-discharge site. These water quality data were used to calculate maximum constituent concentrations in Monterey Bay.
Neither of the two data sets for source water covered the entire suite of constituents regulated under the Ocean Plan, therefore this analysis is developed based on a subset – and not the entire list – of constituents regulated by the Ocean Plan. With the absence of specific source water data, both the data sets were used. Using two different data sets to characterize the source water quality allowed for a comparative study as well as a validation of the conclusions drawn from the analysis (see the tables and results that follow). Further, the data tested under CCLEAN were accurate to a substantially lower concentration limit for the monitored constituents due to the much lower method reporting limits used (in nanograms per liter [ng/L]) in laboratory analysis of the CCLEAN samples as compared to the tests for the well data (milligrams per liter [mg/L]). Due to the higher reporting limits used for the well data, several constituents could not be detected; the same constituents that were tested under CCLEAN showed a detectable, and a much lower concentration value.
Because the data sets employed different testing technologies and reporting limits and showed a wide range of concentrations for several constituents, a tiered approach was taken to best utilize the existing data for a conservative analysis. The constituent concentrations in the brine were studied first by using the well-data, which had higher reporting limits but analyzed samples for a wider variety of water quality constituents, and then by using the CCLEAN-data which was analyzed using substantially lower reporting limits, but had results for fewer constituents as compared to the well-data.
In the case of the well data, only one data point was available, i.e., one set of constituent concentrations that were used to generate the brine water quality. In the case of CCLEAN data, maximum concentrations over all 20 samples were used. In both the cases, the constituent levels were concentrated in the brine by the amount of freshwater removed from the ocean water during the RO process (i.e., the masses of contaminants in source water were concentrated into 13.84 MGD of brine) using 42% efficacy of the desalination process. This concentration was then multiplied by the dilution factor (1:16)4 achieved upon the discharge of the brine (estimated by Flow Science, Inc., 2014)5 and used as the concentration resulting at the edge of the ZID. The calculated concentrations were then compared against the water quality objectives. The brine-only discharge is anticipated to occur during the dry season.
4 The dilution ratio for the discharge is shown in terms of ‘parts of discharge : parts of seawater’. 5 Flow Science, Inc. (2014) estimated the dilution factor at the edge of the ZID as part of near-field modeling analysis of salinity. A similar
modeling analysis could be undertaken for other constituents.
5
During the wet season, when MRWPCA-treated wastewater would be available, the brine along with the treated wastewater would form a combined discharge into the Bay. To evaluate the contaminant concentrations in the combined discharge, water quality data for the wastewater was obtained from Trussell Technologies, Inc. (2014). The data included flow-proportioned maximum concentrations that were collected over 30-day-periods in both the wet season and dry season for treated wastewater from the MRWPCA Regional Wastewater Treatment Plant from September 2008 through April of 2013. The concentrations for the same list of constituents (as brine) were calculated for the combined discharge.
The constituent concentrations in the combined discharge were calculated based on the relative proportions of the brine and the treated wastewater in the discharge and multiplied by the dilution factor (1:68) estimated under the near-field analysis by Flow Science, Inc., (2014). The concentrations were evaluated for the Davidson oceanographic period, when the demand for reclaimed water from the MRWPCA Regional Wastewater for agricultural uses is considered very low and hence the brine would combine with the treated wastewater prior to discharge. These concentrations at the edge of the ZID were then compared against the water quality objectives. This calculation would apply to combined discharges, which are anticipated to occur during wet or other seasons when treated wastewater from the MRWPCA Regional Wastewater Treatment would be discharged into the outfall as discussed above.
As shown in Table A-1, wastewater flows vary throughout the year and therefore, the brine may not combine with an average of 19.78-MGD wastewater flow consistently through the year. To account for the variability, conservative scenarios of low wastewater flows combining with brine were studied by using 0.25, 0.5, 1, and 2 MGD of wastewater flows (Flow Science, Inc., 2014). This analysis uses the most conservative or low flow of 0.25-MGD wastewater for the combined discharge, which was estimated to have a dilution ratio of 1:17 (Flow Science, Inc., 2014).
Results Table A-2 below presents the estimated constituent levels in the brine-only and combined discharges using the well data for source water quality. The table also shows how the levels at the edge of the ZID shown in two pale grey columns compare with the Ocean Plan water quality objectives (the most conservative value among the 6-month median, 30-day average, and daily and instantaneous maximums are used) shown in the dark grey column.
Table A-2 also includes the constituents with ocean water quality objectives that were tested in the MRWPCA-wastewater and not in the well (or source) water. Concentrations for these constituents therefore could not be calculated for the brine discharge and hence also when the brine combines with wastewater. Therefore concentrations for these constituents under the brine-only and combined discharges are not provided.
The MCWD well data was collected using higher water concentration limits than the water quality objectives for discharges. At the reporting limits of the test method, a substantive number of constituents were not detected and therefore recorded using their reporting limits. For example, a constituent not detected at a reporting limit of 0.01 micrograms per liter (µg/L) was reported at a concentration less than 0.01 µg/L or <0.01 µg/L, hence the concentration of the constituent would range between 0 and 0.01 µg/L. Here, the analysis used a conservative approach and assumed the highest value in the range, that of 0.01 µg/L as the concentration of the constituent. In the case of reporting limits higher than the Ocean Plan water quality objective, the constituent, upon further concentration as part of the desalination process, was expectedly found to exceed the water quality objective from the brine discharge. Thus, the well data showed exceedances under the brine and combined discharge scenarios for the constituents, which were not detected in the source water. All the detected constituents were however found to be lower than, and in compliance with, the Ocean Plan water quality objectives.
6
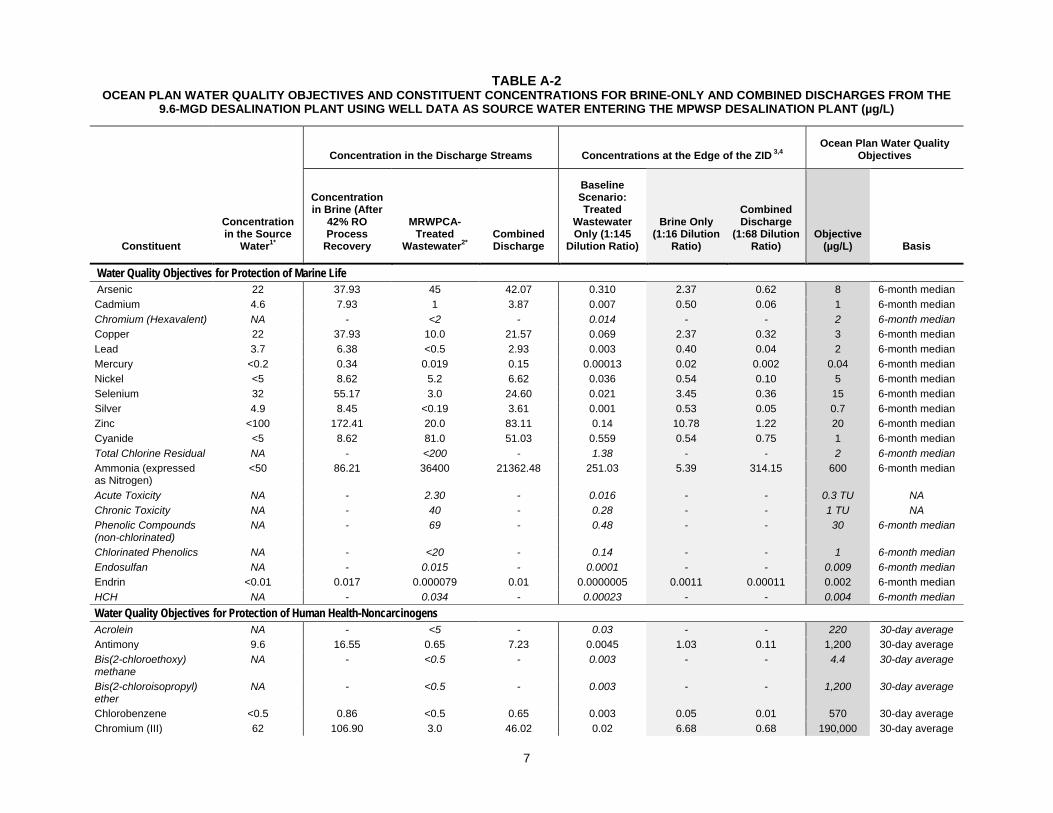
TABLE A-2 OCEAN PLAN WATER QUALITY OBJECTIVES AND CONSTITUENT CONCENTRATIONS FOR BRINE-ONLY AND COMBINED DISCHARGES FROM THE
9.6-MGD DESALINATION PLANT USING WELL DATA AS SOURCE WATER ENTERING THE MPWSP DESALINATION PLANT (µg/L)
Constituent
Concentration in the Source
Water1*
Concentration in the Discharge Streams Concentrations at the Edge of the ZID 3,4 Ocean Plan Water Quality
Objectives
Concentration in Brine (After
42% RO Process
Recovery
MRWPCA- Treated
Wastewater2* Combined Discharge
Baseline Scenario: Treated
Wastewater Only (1:145
Dilution Ratio)
Brine Only (1:16 Dilution
Ratio)
Combined Discharge
(1:68 Dilution Ratio)
Objective (µg/L) Basis
Water Quality Objectives for Protection of Marine Life Arsenic 22 37.93 45 42.07 0.310 2.37 0.62 8 6-month median Cadmium 4.6 7.93 1 3.87 0.007 0.50 0.06 1 6-month median Chromium (Hexavalent) NA - <2 - 0.014 - - 2 6-month median Copper 22 37.93 10.0 21.57 0.069 2.37 0.32 3 6-month median Lead 3.7 6.38 <0.5 2.93 0.003 0.40 0.04 2 6-month median Mercury <0.2 0.34 0.019 0.15 0.00013 0.02 0.002 0.04 6-month median Nickel <5 8.62 5.2 6.62 0.036 0.54 0.10 5 6-month median Selenium 32 55.17 3.0 24.60 0.021 3.45 0.36 15 6-month median Silver 4.9 8.45 <0.19 3.61 0.001 0.53 0.05 0.7 6-month median Zinc <100 172.41 20.0 83.11 0.14 10.78 1.22 20 6-month median Cyanide <5 8.62 81.0 51.03 0.559 0.54 0.75 1 6-month median Total Chlorine Residual NA - <200 - 1.38 - - 2 6-month median Ammonia (expressed as Nitrogen)
<50 86.21 36400 21362.48 251.03 5.39 314.15 600 6-month median
Acute Toxicity NA - 2.30 - 0.016 - - 0.3 TU NA Chronic Toxicity NA - 40 - 0.28 - - 1 TU NA Phenolic Compounds (non-chlorinated)
NA - 69 - 0.48 - - 30 6-month median
Chlorinated Phenolics NA - <20 - 0.14 - - 1 6-month median Endosulfan NA - 0.015 - 0.0001 - - 0.009 6-month median Endrin <0.01 0.017 0.000079 0.01 0.0000005 0.0011 0.00011 0.002 6-month median HCH NA - 0.034 - 0.00023 - - 0.004 6-month median Water Quality Objectives for Protection of Human Health-Noncarcinogens Acrolein NA - <5 - 0.03 - - 220 30-day average Antimony 9.6 16.55 0.65 7.23 0.0045 1.03 0.11 1,200 30-day average Bis(2-chloroethoxy) methane
NA - <0.5 - 0.003 - - 4.4 30-day average
Bis(2-chloroisopropyl) ether
NA - <0.5 - 0.003 - - 1,200 30-day average
Chlorobenzene <0.5 0.86 <0.5 0.65 0.003 0.05 0.01 570 30-day average Chromium (III) 62 106.90 3.0 46.02 0.02 6.68 0.68 190,000 30-day average
7
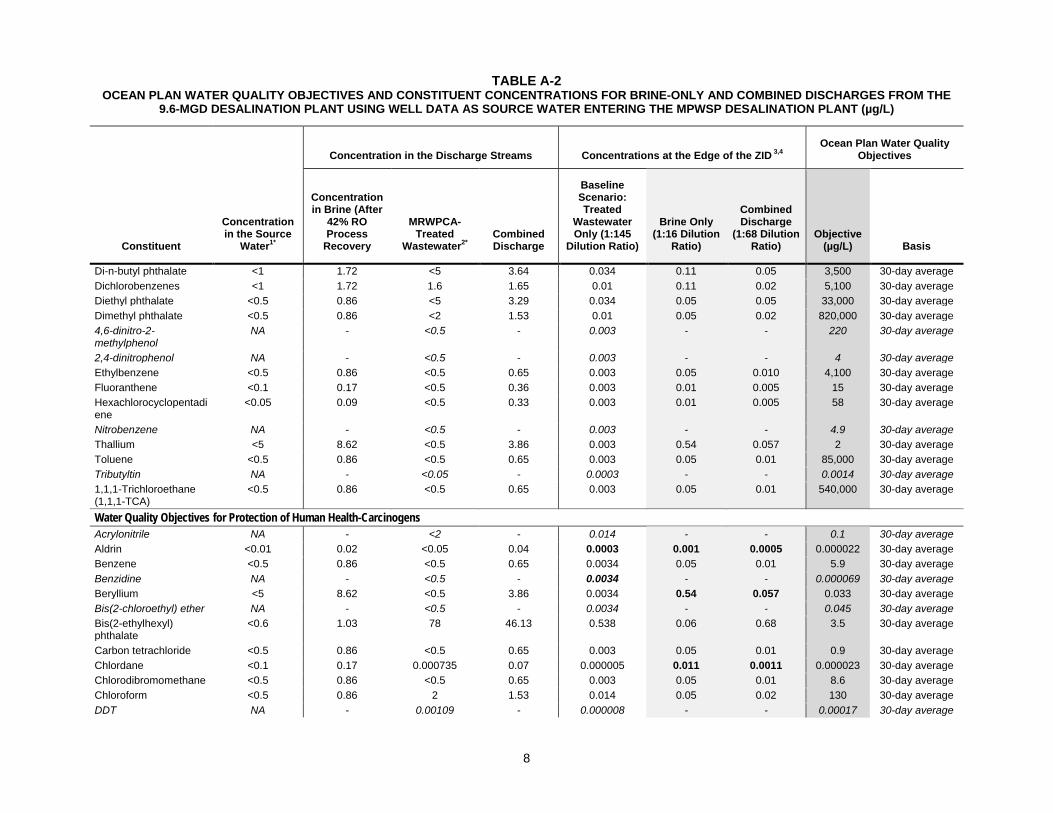
TABLE A-2 OCEAN PLAN WATER QUALITY OBJECTIVES AND CONSTITUENT CONCENTRATIONS FOR BRINE-ONLY AND COMBINED DISCHARGES FROM THE
9.6-MGD DESALINATION PLANT USING WELL DATA AS SOURCE WATER ENTERING THE MPWSP DESALINATION PLANT (µg/L)
Constituent
Concentration in the Source
Water1*
Concentration in the Discharge Streams Concentrations at the Edge of the ZID 3,4 Ocean Plan Water Quality
Objectives
Concentration in Brine (After
42% RO Process
Recovery
MRWPCA- Treated
Wastewater2* Combined Discharge
Baseline Scenario: Treated
Wastewater Only (1:145
Dilution Ratio)
Brine Only (1:16 Dilution
Ratio)
Combined Discharge
(1:68 Dilution Ratio)
Objective (µg/L) Basis
Di-n-butyl phthalate <1 1.72 <5 3.64 0.034 0.11 0.05 3,500 30-day average Dichlorobenzenes <1 1.72 1.6 1.65 0.01 0.11 0.02 5,100 30-day average Diethyl phthalate <0.5 0.86 <5 3.29 0.034 0.05 0.05 33,000 30-day average Dimethyl phthalate <0.5 0.86 <2 1.53 0.01 0.05 0.02 820,000 30-day average 4,6-dinitro-2-methylphenol
NA - <0.5 - 0.003 - - 220 30-day average
2,4-dinitrophenol NA - <0.5 - 0.003 - - 4 30-day average Ethylbenzene <0.5 0.86 <0.5 0.65 0.003 0.05 0.010 4,100 30-day average Fluoranthene <0.1 0.17 <0.5 0.36 0.003 0.01 0.005 15 30-day average Hexachlorocyclopentadiene
<0.05 0.09 <0.5 0.33 0.003 0.01 0.005 58 30-day average
Nitrobenzene NA - <0.5 - 0.003 - - 4.9 30-day average Thallium <5 8.62 <0.5 3.86 0.003 0.54 0.057 2 30-day average Toluene <0.5 0.86 <0.5 0.65 0.003 0.05 0.01 85,000 30-day average Tributyltin NA - <0.05 - 0.0003 - - 0.0014 30-day average 1,1,1-Trichloroethane (1,1,1-TCA)
<0.5 0.86 <0.5 0.65 0.003 0.05 0.01 540,000 30-day average
Water Quality Objectives for Protection of Human Health-Carcinogens Acrylonitrile NA - <2 - 0.014 - - 0.1 30-day average Aldrin <0.01 0.02 <0.05 0.04 0.0003 0.001 0.0005 0.000022 30-day average Benzene <0.5 0.86 <0.5 0.65 0.0034 0.05 0.01 5.9 30-day average Benzidine NA - <0.5 - 0.0034 - - 0.000069 30-day average Beryllium <5 8.62 <0.5 3.86 0.0034 0.54 0.057 0.033 30-day average Bis(2-chloroethyl) ether NA - <0.5 - 0.0034 - - 0.045 30-day average Bis(2-ethylhexyl) phthalate
<0.6 1.03 78 46.13 0.538 0.06 0.68 3.5 30-day average
Carbon tetrachloride <0.5 0.86 <0.5 0.65 0.003 0.05 0.01 0.9 30-day average Chlordane <0.1 0.17 0.000735 0.07 0.000005 0.011 0.0011 0.000023 30-day average Chlorodibromomethane <0.5 0.86 <0.5 0.65 0.003 0.05 0.01 8.6 30-day average Chloroform <0.5 0.86 2 1.53 0.014 0.05 0.02 130 30-day average DDT NA - 0.00109 - 0.000008 - - 0.00017 30-day average
8
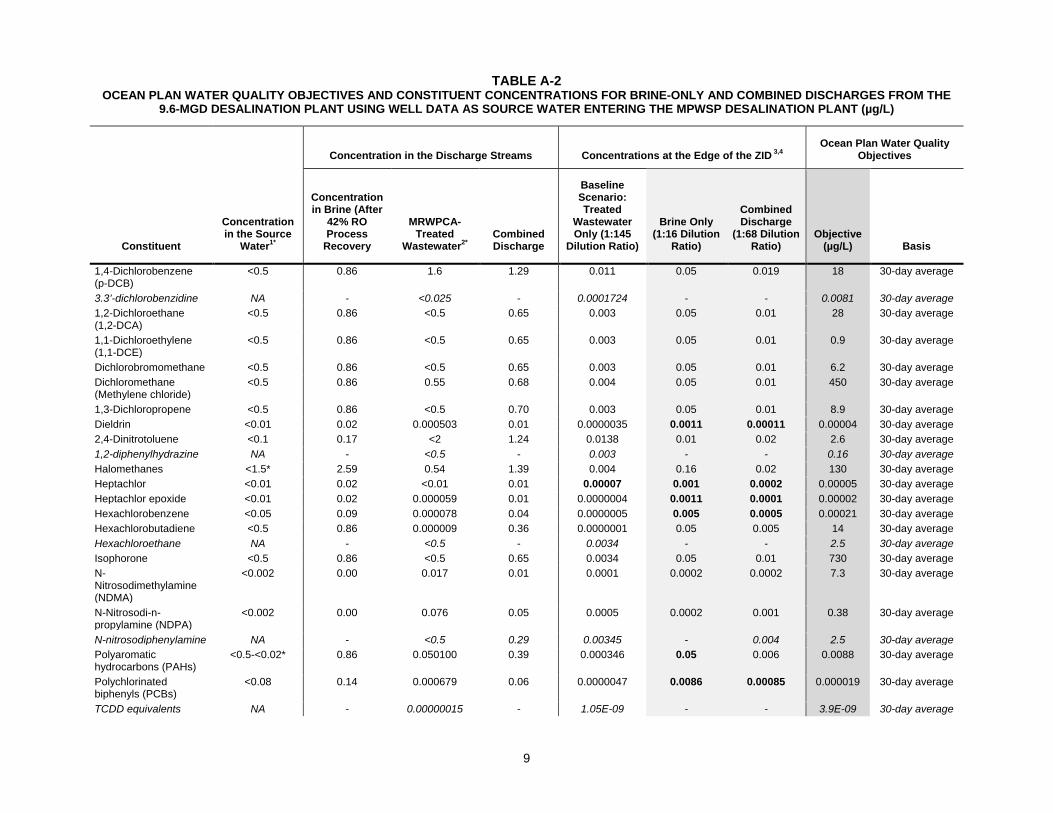
TABLE A-2 OCEAN PLAN WATER QUALITY OBJECTIVES AND CONSTITUENT CONCENTRATIONS FOR BRINE-ONLY AND COMBINED DISCHARGES FROM THE
9.6-MGD DESALINATION PLANT USING WELL DATA AS SOURCE WATER ENTERING THE MPWSP DESALINATION PLANT (µg/L)
Constituent
Concentration in the Source
Water1*
Concentration in the Discharge Streams Concentrations at the Edge of the ZID 3,4 Ocean Plan Water Quality
Objectives
Concentration in Brine (After
42% RO Process
Recovery
MRWPCA- Treated
Wastewater2* Combined Discharge
Baseline Scenario: Treated
Wastewater Only (1:145
Dilution Ratio)
Brine Only (1:16 Dilution
Ratio)
Combined Discharge
(1:68 Dilution Ratio)
Objective (µg/L) Basis
1,4-Dichlorobenzene (p-DCB)
<0.5 0.86 1.6 1.29 0.011 0.05 0.019 18 30-day average
3.3’-dichlorobenzidine NA - <0.025 - 0.0001724 - - 0.0081 30-day average 1,2-Dichloroethane (1,2-DCA)
<0.5 0.86 <0.5 0.65 0.003 0.05 0.01 28 30-day average
1,1-Dichloroethylene (1,1-DCE)
<0.5 0.86 <0.5 0.65 0.003 0.05 0.01 0.9 30-day average
Dichlorobromomethane <0.5 0.86 <0.5 0.65 0.003 0.05 0.01 6.2 30-day average Dichloromethane (Methylene chloride)
<0.5 0.86 0.55 0.68 0.004 0.05 0.01 450 30-day average
1,3-Dichloropropene <0.5 0.86 <0.5 0.70 0.003 0.05 0.01 8.9 30-day average Dieldrin <0.01 0.02 0.000503 0.01 0.0000035 0.0011 0.00011 0.00004 30-day average 2,4-Dinitrotoluene <0.1 0.17 <2 1.24 0.0138 0.01 0.02 2.6 30-day average 1,2-diphenylhydrazine NA - <0.5 - 0.003 - - 0.16 30-day average Halomethanes <1.5* 2.59 0.54 1.39 0.004 0.16 0.02 130 30-day average Heptachlor <0.01 0.02 <0.01 0.01 0.00007 0.001 0.0002 0.00005 30-day average Heptachlor epoxide <0.01 0.02 0.000059 0.01 0.0000004 0.0011 0.0001 0.00002 30-day average Hexachlorobenzene <0.05 0.09 0.000078 0.04 0.0000005 0.005 0.0005 0.00021 30-day average Hexachlorobutadiene <0.5 0.86 0.000009 0.36 0.0000001 0.05 0.005 14 30-day average Hexachloroethane NA - <0.5 - 0.0034 - - 2.5 30-day average Isophorone <0.5 0.86 <0.5 0.65 0.0034 0.05 0.01 730 30-day average N-Nitrosodimethylamine (NDMA)
<0.002 0.00 0.017 0.01 0.0001 0.0002 0.0002 7.3 30-day average
N-Nitrosodi-n-propylamine (NDPA)
<0.002 0.00 0.076 0.05 0.0005 0.0002 0.001 0.38 30-day average
N-nitrosodiphenylamine NA - <0.5 0.29 0.00345 - 0.004 2.5 30-day average Polyaromatic hydrocarbons (PAHs)
<0.5-<0.02* 0.86 0.050100 0.39 0.000346 0.05 0.006 0.0088 30-day average
Polychlorinated biphenyls (PCBs)
<0.08 0.14 0.000679 0.06 0.0000047 0.0086 0.00085 0.000019 30-day average
TCDD equivalents NA - 0.00000015 - 1.05E-09 - - 3.9E-09 30-day average
9
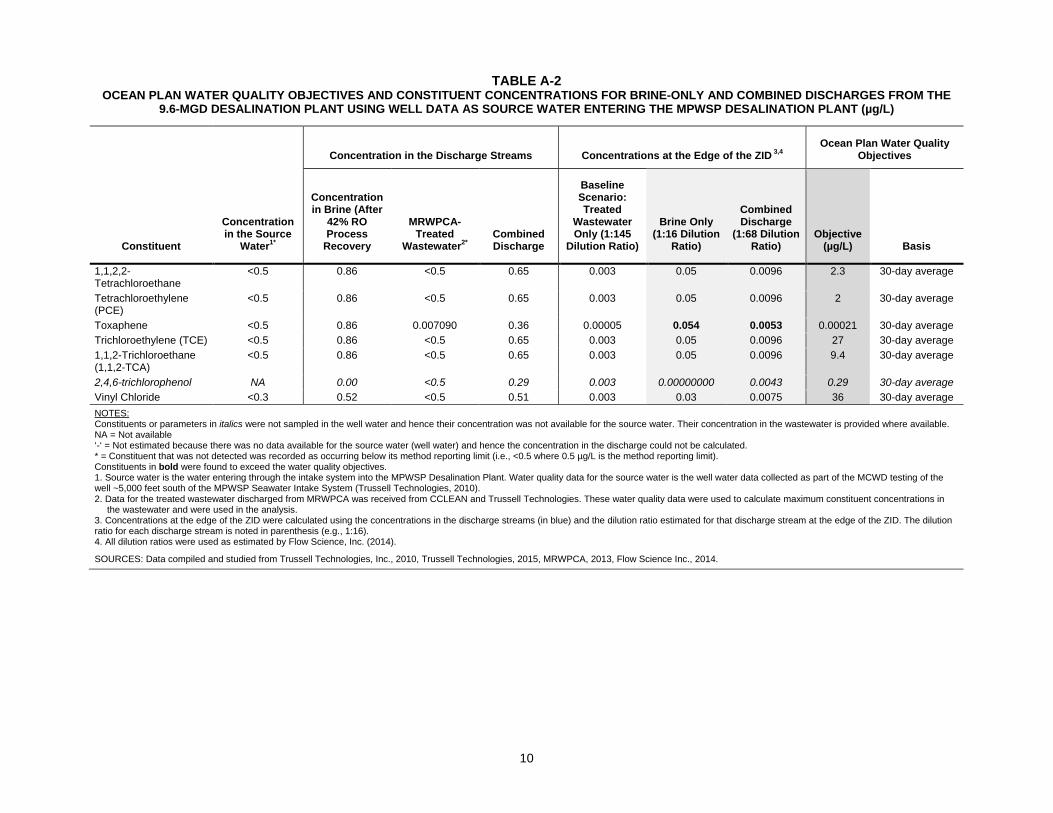
TABLE A-2 OCEAN PLAN WATER QUALITY OBJECTIVES AND CONSTITUENT CONCENTRATIONS FOR BRINE-ONLY AND COMBINED DISCHARGES FROM THE
9.6-MGD DESALINATION PLANT USING WELL DATA AS SOURCE WATER ENTERING THE MPWSP DESALINATION PLANT (µg/L)
Constituent
Concentration in the Source
Water1*
Concentration in the Discharge Streams Concentrations at the Edge of the ZID 3,4 Ocean Plan Water Quality
Objectives
Concentration in Brine (After
42% RO Process
Recovery
MRWPCA- Treated
Wastewater2* Combined Discharge
Baseline Scenario: Treated
Wastewater Only (1:145
Dilution Ratio)
Brine Only (1:16 Dilution
Ratio)
Combined Discharge
(1:68 Dilution Ratio)
Objective (µg/L) Basis
1,1,2,2-Tetrachloroethane
<0.5 0.86 <0.5 0.65 0.003 0.05 0.0096 2.3 30-day average
Tetrachloroethylene (PCE)
<0.5 0.86 <0.5 0.65 0.003 0.05 0.0096 2 30-day average
Toxaphene <0.5 0.86 0.007090 0.36 0.00005 0.054 0.0053 0.00021 30-day average Trichloroethylene (TCE) <0.5 0.86 <0.5 0.65 0.003 0.05 0.0096 27 30-day average 1,1,2-Trichloroethane (1,1,2-TCA)
<0.5 0.86 <0.5 0.65 0.003 0.05 0.0096 9.4 30-day average
2,4,6-trichlorophenol NA 0.00 <0.5 0.29 0.003 0.00000000 0.0043 0.29 30-day average Vinyl Chloride <0.3 0.52 <0.5 0.51 0.003 0.03 0.0075 36 30-day average NOTES: Constituents or parameters in italics were not sampled in the well water and hence their concentration was not available for the source water. Their concentration in the wastewater is provided where available. NA = Not available ‘-‘ = Not estimated because there was no data available for the source water (well water) and hence the concentration in the discharge could not be calculated. * = Constituent that was not detected was recorded as occurring below its method reporting limit (i.e., <0.5 where 0.5 µg/L is the method reporting limit). Constituents in bold were found to exceed the water quality objectives. 1. Source water is the water entering through the intake system into the MPWSP Desalination Plant. Water quality data for the source water is the well water data collected as part of the MCWD testing of the well ~5,000 feet south of the MPWSP Seawater Intake System (Trussell Technologies, 2010). 2. Data for the treated wastewater discharged from MRWPCA was received from CCLEAN and Trussell Technologies. These water quality data were used to calculate maximum constituent concentrations in
the wastewater and were used in the analysis. 3. Concentrations at the edge of the ZID were calculated using the concentrations in the discharge streams (in blue) and the dilution ratio estimated for that discharge stream at the edge of the ZID. The dilution ratio for each discharge stream is noted in parenthesis (e.g., 1:16). 4. All dilution ratios were used as estimated by Flow Science, Inc. (2014).
SOURCES: Data compiled and studied from Trussell Technologies, Inc., 2010, Trussell Technologies, 2015, MRWPCA, 2013, Flow Science Inc., 2014.
10
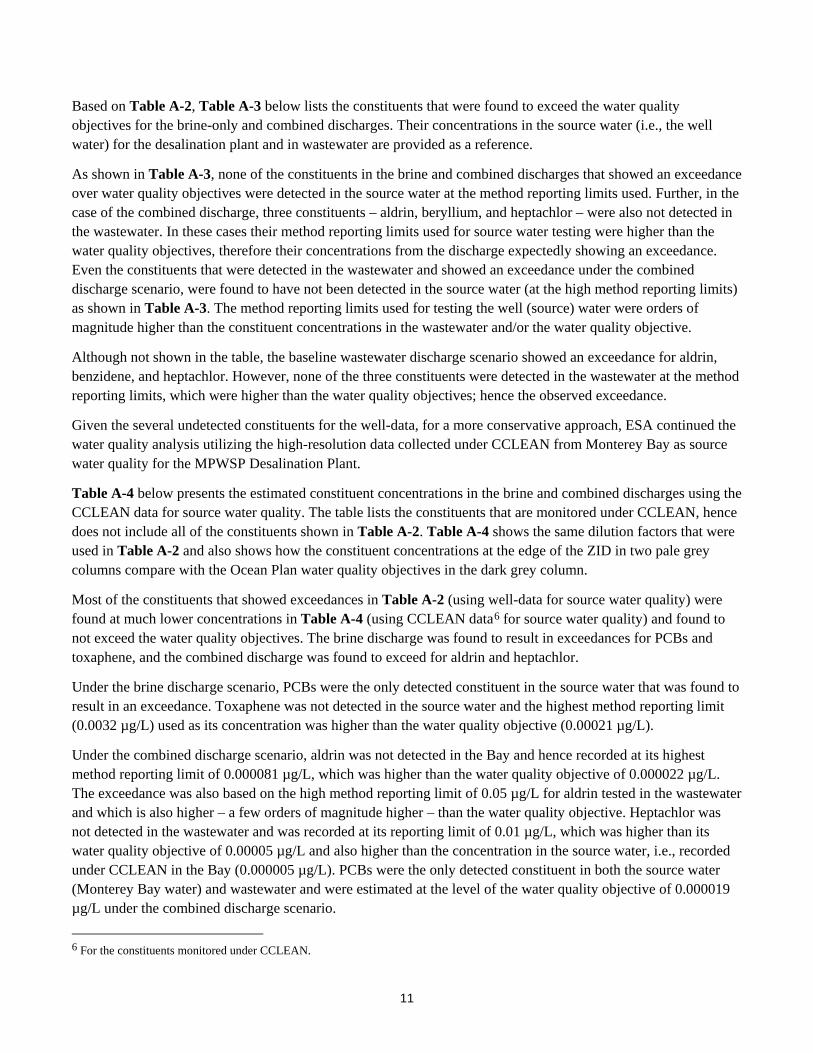
Based on Table A-2, Table A-3 below lists the constituents that were found to exceed the water quality objectives for the brine-only and combined discharges. Their concentrations in the source water (i.e., the well water) for the desalination plant and in wastewater are provided as a reference.
As shown in Table A-3, none of the constituents in the brine and combined discharges that showed an exceedance over water quality objectives were detected in the source water at the method reporting limits used. Further, in the case of the combined discharge, three constituents – aldrin, beryllium, and heptachlor – were also not detected in the wastewater. In these cases their method reporting limits used for source water testing were higher than the water quality objectives, therefore their concentrations from the discharge expectedly showing an exceedance. Even the constituents that were detected in the wastewater and showed an exceedance under the combined discharge scenario, were found to have not been detected in the source water (at the high method reporting limits) as shown in Table A-3. The method reporting limits used for testing the well (source) water were orders of magnitude higher than the constituent concentrations in the wastewater and/or the water quality objective.
Although not shown in the table, the baseline wastewater discharge scenario showed an exceedance for aldrin, benzidene, and heptachlor. However, none of the three constituents were detected in the wastewater at the method reporting limits, which were higher than the water quality objectives; hence the observed exceedance.
Given the several undetected constituents for the well-data, for a more conservative approach, ESA continued the water quality analysis utilizing the high-resolution data collected under CCLEAN from Monterey Bay as source water quality for the MPWSP Desalination Plant.
Table A-4 below presents the estimated constituent concentrations in the brine and combined discharges using the CCLEAN data for source water quality. The table lists the constituents that are monitored under CCLEAN, hence does not include all of the constituents shown in Table A-2. Table A-4 shows the same dilution factors that were used in Table A-2 and also shows how the constituent concentrations at the edge of the ZID in two pale grey columns compare with the Ocean Plan water quality objectives in the dark grey column.
Most of the constituents that showed exceedances in Table A-2 (using well-data for source water quality) were found at much lower concentrations in Table A-4 (using CCLEAN data6 for source water quality) and found to not exceed the water quality objectives. The brine discharge was found to result in exceedances for PCBs and toxaphene, and the combined discharge was found to exceed for aldrin and heptachlor.
Under the brine discharge scenario, PCBs were the only detected constituent in the source water that was found to result in an exceedance. Toxaphene was not detected in the source water and the highest method reporting limit (0.0032 µg/L) used as its concentration was higher than the water quality objective (0.00021 µg/L).
Under the combined discharge scenario, aldrin was not detected in the Bay and hence recorded at its highest method reporting limit of 0.000081 µg/L, which was higher than the water quality objective of 0.000022 µg/L. The exceedance was also based on the high method reporting limit of 0.05 µg/L for aldrin tested in the wastewater and which is also higher – a few orders of magnitude higher – than the water quality objective. Heptachlor was not detected in the wastewater and was recorded at its reporting limit of 0.01 µg/L, which was higher than its water quality objective of 0.00005 µg/L and also higher than the concentration in the source water, i.e., recorded under CCLEAN in the Bay (0.000005 µg/L). PCBs were the only detected constituent in both the source water (Monterey Bay water) and wastewater and were estimated at the level of the water quality objective of 0.000019 µg/L under the combined discharge scenario.
6 For the constituents monitored under CCLEAN.
11
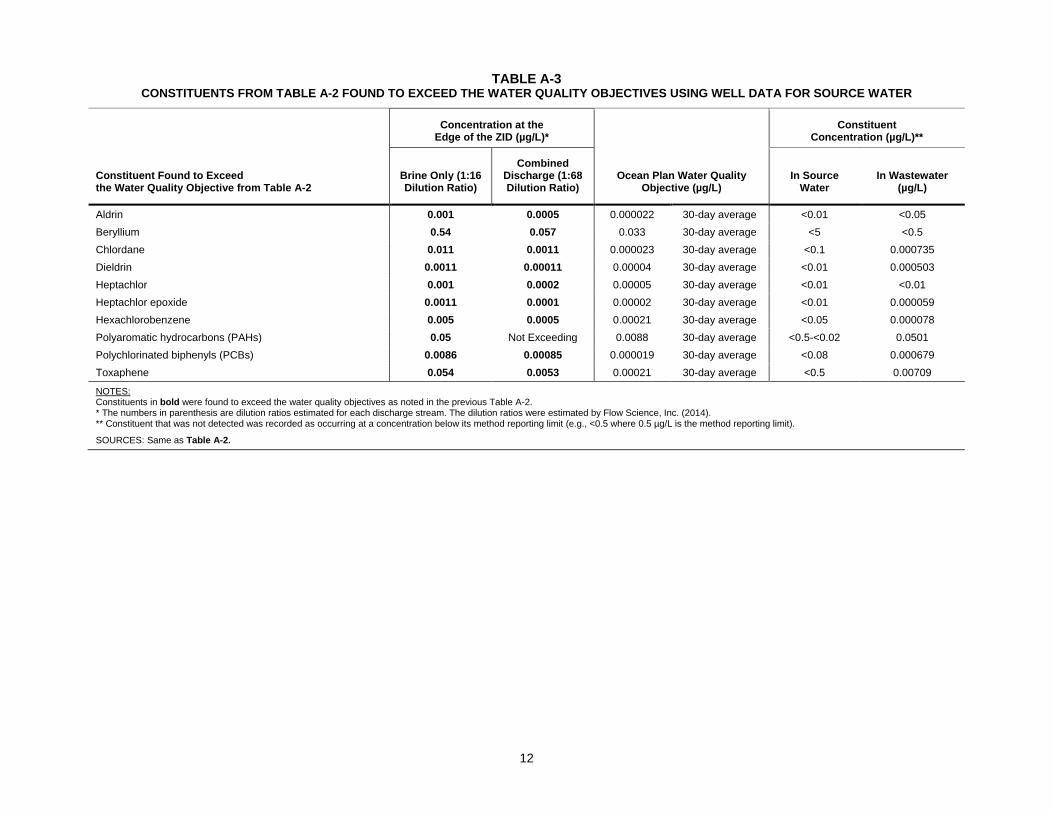
TABLE A-3 CONSTITUENTS FROM TABLE A-2 FOUND TO EXCEED THE WATER QUALITY OBJECTIVES USING WELL DATA FOR SOURCE WATER
Constituent Found to Exceed the Water Quality Objective from Table A-2
Concentration at the Edge of the ZID (µg/L)*
Ocean Plan Water Quality Objective (µg/L)
Constituent Concentration (µg/L)**
Brine Only (1:16 Dilution Ratio)
Combined Discharge (1:68 Dilution Ratio)
In Source Water
In Wastewater (µg/L)
Aldrin 0.001 0.0005 0.000022 30-day average <0.01 <0.05 Beryllium 0.54 0.057 0.033 30-day average <5 <0.5 Chlordane 0.011 0.0011 0.000023 30-day average <0.1 0.000735 Dieldrin 0.0011 0.00011 0.00004 30-day average <0.01 0.000503 Heptachlor 0.001 0.0002 0.00005 30-day average <0.01 <0.01 Heptachlor epoxide 0.0011 0.0001 0.00002 30-day average <0.01 0.000059 Hexachlorobenzene 0.005 0.0005 0.00021 30-day average <0.05 0.000078 Polyaromatic hydrocarbons (PAHs) 0.05 Not Exceeding 0.0088 30-day average <0.5-<0.02 0.0501 Polychlorinated biphenyls (PCBs) 0.0086 0.00085 0.000019 30-day average <0.08 0.000679 Toxaphene 0.054 0.0053 0.00021 30-day average <0.5 0.00709
NOTES: Constituents in bold were found to exceed the water quality objectives as noted in the previous Table A-2. * The numbers in parenthesis are dilution ratios estimated for each discharge stream. The dilution ratios were estimated by Flow Science, Inc. (2014). ** Constituent that was not detected was recorded as occurring at a concentration below its method reporting limit (e.g., <0.5 where 0.5 µg/L is the method reporting limit). SOURCES: Same as Table A-2.
12
TABLE A-4 OCEAN PLAN WATER QUALITY OBJECTIVES AND CONSTITUENT CONCENTRATIONS FOR BRINE-ONLY AND COMBINED DISCHARGES FROM THE 9.6-
MGD DESALINATION PLANT USING CCLEAN DATA FOR SOURCE WATER (µg/L)
Constituent Concentrations in Source Water 1,*
Concentration in the Discharge Streams Concentrations at the Edge of the ZID 3,4 Ocean Plan Water Quality
Objectives
Concentration in Brine (After
42% RO Process
Recovery
MRWPCA- Treated
Wastewater2,* Combined Discharge
Baseline Scenario: Treated
Wastewater Only (1:145 Dilution
Ratio)
Brine Only (1:16 Dilution
Ratio)
Combined Discharge
(1:68 Dilution Ratio) Objective Basis
Water Quality Objectives for Protection of Marine Life Endosulfan 0.000039 0.000067 0.015 0.01 0.0001 0.000004 0.00013 0.009 6-month median Endrin 0.000005 0.000009 0.000079 0.00005 0.0000005 0.000001 0.0000007 0.002 6-month median HCH 0.00039 0.000678 0.034 0.02 0.00023 0.000042 0.00030 0.004 6-month median
Water Quality Objectives for Protection of Human Health-Noncarcinogens Fluoranthene 0.00108 0.001862 <0.5 0.29 0.003 0.000116 0.004 0.015 30-day average
Water Quality Objectives for Protection of Human Health-Carcinogens Aldrin <0.000081 0.0001 <0.05 0.03 0.0003 0.000009 0.00043 0.000022 30-day average Chlordane 0.000114 0.000197 0.000735 0.0005 0.000005 0.000012 0.000008 0.000023 30-day average DDT 0.000319 0.000550 0.00109 0.0009 0.000008 0.000034 0.000013 0.00017 30-day average Dieldrin 0.000051 0.000088 0.000503 0.0003 0.0000035 0.000005 0.000005 0.00004 30-day average Heptachlor 0.000005 0.000009 <0.01 0.01 0.00007 0.000001 0.0001 0.00005 30-day average Polyaromatic hydrocarbons (PAHs)
0.00691 0.011909 0.050100 0.03 0.000346 0.000744 0.001 0.0088 30-day average
PCBs 0.00121 0.002093 0.000679 0.0013 0.0000047 0.000131 0.000019 0.000019 30-day average Toxaphene <0.00074-0.0032 0.0055 0.007090 0.0064 0.00005 0.000345 0.000095 0.00021 30-day average NOTES: * = Constituent that was not detected was recorded as occurring below its method reporting limit (i.e., <0.5 where 0.5 µg/L is the method reporting limit). Constituents in bold were found to exceed the water quality objectives. 1. Source water is the water entering through the intake system into the MPWSP Desalination Plant. Concentrations in the source water are from the ocean water quality data obtained from CCLEAN (2008-2013) from time-integrated ocean samples collected over 30-day periods in both the wet season and dry season from September 2008 through April of 2013. Samples were obtained for two sites: the Southern Monterey Bay site and the Northern Monterey Bay site, located approximately 4 and 12 miles respectively, from the discharge site for the MPWSP. These water quality data were used to calculate maximum constituent concentrations in Monterey Bay. 2. Data for the treated wastewater discharged from MRWPCA was received from CCLEAN and Trussell Technologies These water quality data were used to calculate maximum constituent concentrations in the
wastewater and were used in the analysis. 3. Concentrations at the edge of the ZID were calculated using the concentrations in the discharge streams (in pale grey columns) and the dilution ratio estimated for that discharge stream at the edge of the ZID. The dilution ratio is shown in parenthesis (e.g., 1:16) for each discharge stream. 4. All dilution ratios were used as estimated by Flow Science, Inc. (2014).
SOURCES: Data compiled and studied from CCLEAN (2008-2013) obtained from D. Hardin (2014), MRWPCA, 2013, Trussell Technologies, 2015, and dilution ratios from Flow Science Inc., 2014.
13
The comparison between the constituent concentrations from the discharges at the edge of the ZID and the water quality objectives could be made only based on the constituents that were tested and recorded at a detected value; and that were tested at the method reporting limit comparable with (at, or lower, than) the water quality objective. Based on the available data and its analysis, this memorandum identifies the constituents that are estimated to exceed the Ocean Plan water quality objectives by using 1) high-resolution data collected under CCLEAN for the brine-only discharge and 2) constituents that were detected both in the source water and wastewater for the combined discharge. Thus, the only constituent that was found to have an exceedance was PCBs for the brine discharge. For the combined discharge with 19.78-mgd wastewater flow, PCBs were found at a level exactly as the water quality objective.
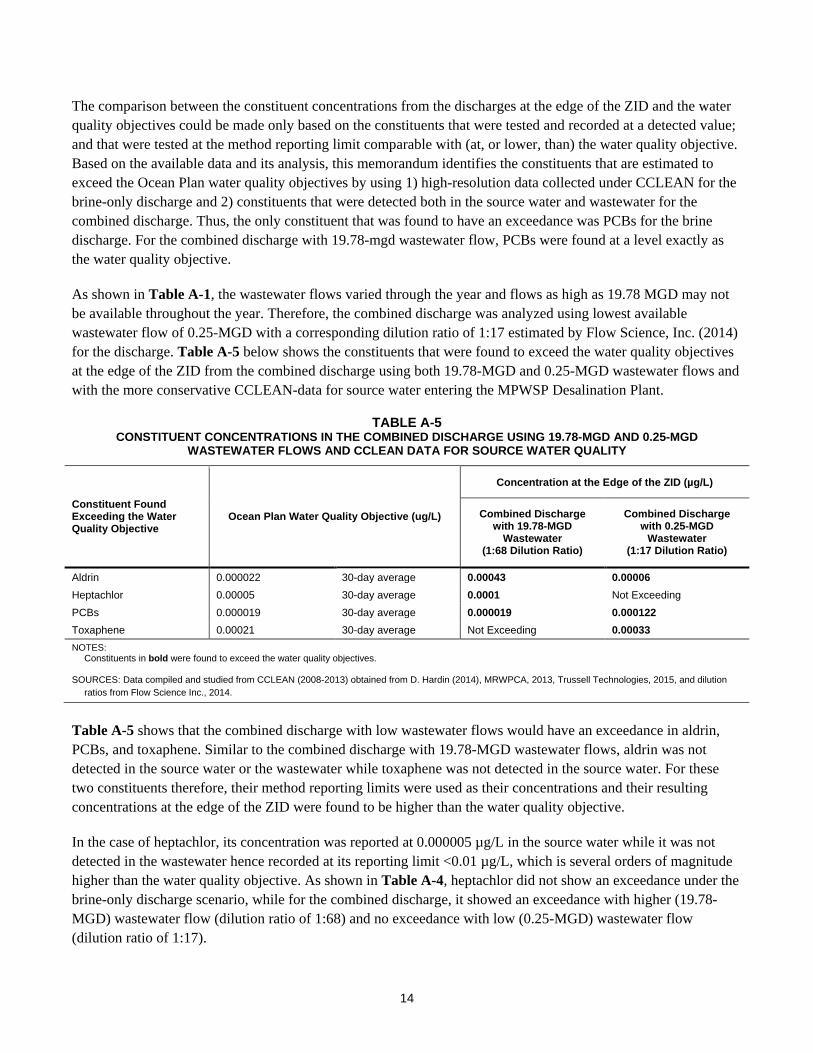
As shown in Table A-1, the wastewater flows varied through the year and flows as high as 19.78 MGD may not be available throughout the year. Therefore, the combined discharge was analyzed using lowest available wastewater flow of 0.25-MGD with a corresponding dilution ratio of 1:17 estimated by Flow Science, Inc. (2014) for the discharge. Table A-5 below shows the constituents that were found to exceed the water quality objectives at the edge of the ZID from the combined discharge using both 19.78-MGD and 0.25-MGD wastewater flows and with the more conservative CCLEAN-data for source water entering the MPWSP Desalination Plant.
TABLE A-5 CONSTITUENT CONCENTRATIONS IN THE COMBINED DISCHARGE USING 19.78-MGD AND 0.25-MGD
WASTEWATER FLOWS AND CCLEAN DATA FOR SOURCE WATER QUALITY
Constituent Found Exceeding the Water Quality Objective
Ocean Plan Water Quality Objective (ug/L)
Concentration at the Edge of the ZID (µg/L)
Combined Discharge with 19.78-MGD
Wastewater (1:68 Dilution Ratio)
Combined Discharge with 0.25-MGD
Wastewater (1:17 Dilution Ratio)
Aldrin 0.000022 30-day average 0.00043 0.00006 Heptachlor 0.00005 30-day average 0.0001 Not Exceeding PCBs 0.000019 30-day average 0.000019 0.000122 Toxaphene 0.00021 30-day average Not Exceeding 0.00033 NOTES:
Constituents in bold were found to exceed the water quality objectives.
SOURCES: Data compiled and studied from CCLEAN (2008-2013) obtained from D. Hardin (2014), MRWPCA, 2013, Trussell Technologies, 2015, and dilution ratios from Flow Science Inc., 2014.
Table A-5 shows that the combined discharge with low wastewater flows would have an exceedance in aldrin, PCBs, and toxaphene. Similar to the combined discharge with 19.78-MGD wastewater flows, aldrin was not detected in the source water or the wastewater while toxaphene was not detected in the source water. For these two constituents therefore, their method reporting limits were used as their concentrations and their resulting concentrations at the edge of the ZID were found to be higher than the water quality objective.
In the case of heptachlor, its concentration was reported at 0.000005 µg/L in the source water while it was not detected in the wastewater hence recorded at its reporting limit <0.01 µg/L, which is several orders of magnitude higher than the water quality objective. As shown in Table A-4, heptachlor did not show an exceedance under the brine-only discharge scenario, while for the combined discharge, it showed an exceedance with higher (19.78-MGD) wastewater flow (dilution ratio of 1:68) and no exceedance with low (0.25-MGD) wastewater flow (dilution ratio of 1:17).
14
PCBs were the only constituent which were detected both in the source water and the wastewater and found to exceed the water quality objectives for the combined discharge scenario with 0.25-MGD wastewater flows. The concentration of PCBs was higher in the source water than in the wastewater (see Table A-4). Also, as can be seen in Table A-5, because of the detected value, PCBs can be compared for the different discharge scenarios. The concentration of PCBs resulting from the combined discharge with 0.25-MGD wastewater flow was lower than that with 19.78-MGD wastewater flow and lower than the brine-only discharge. This indicates a factor of dilution from higher wastewater flows where the constituent was detected at a lower level in the wastewater than in the source water. Further detailed testing of the source water can confirm the specific water quality of the source water and the resulting discharges. There can be no conclusion drawn concerning exceedances under the brine-only and combined discharge scenarios at the edge of the ZID for the constituents that were not detected in the source water and/or wastewater or where constituent concentrations were not available
An additional study was conducted by MRWPCA (see Addendum in Trussell Technologies, Inc., 2015) with select discharge scenarios to sufficiently demonstrate the impact of the updated model input parameters (e.g., number of open ports).7 The study included a new scenario of combined discharge that would have a moderate flow of 9 MGD and assumed the brine and combined discharges would be released through the outfall with 130 open ports at the diffuser (Trussell Technologies, Inc., 2015). The study also incorporated 0.1 mgd of “hauled brine”, which is trucked to the Regional Wastewater Treatment Plant and blended with the secondary effluent prior to being discharged (Trussell Technologies, Inc., 2015).
The study showed that the dilution ratio achieved by the brine-only discharge slightly increased from 1:16 to 1:17 and showed the same exceedances (i.e., PCBs). However, the new combined discharge with 9-mgd wastewater flow showed an exceedance in PCBs and ammonia. For the combined discharge scenario, a lower dilution ratio (1:22) was reported compared to that estimated for the combined discharge with higher (19.78-mgd) wastewater flows (1:68). The combined discharge with high wastewater flow resulted in a rising plume with relatively higher ocean mixing within the ZID (dilution ratio of 1:68). The potential Ocean Plan exceedance for the discharge emerged when the treated wastewater was not present at a sufficiently higher flow to dilute the brine, and thus the combined discharge was denser than seawater, forming a sinking plume with relatively low mixing within the ZID. Similarly, as discussed previously, there was no exceedance in ammonia under the brine-with-low-(0.25-MGD)-wastewater discharge scenario, where despite the relatively low ocean mixing within the ZID, the ammonia concentration in the discharge was less because the wastewater formed a smaller fraction of the overall discharge.8 The ammonia concentration however increased near the point where the brine was discharged with the highest flow of wastewater (i.e., 9 mgd) that still resulted in a sinking plume (Trussell Technologies, 2015). The updated modeling analysis therefore showed that the combined discharge with 9-MGD wastewater would result in an exceedance in ammonia in addition to PCBs (Trussell Technologies, Inc., 2015).
.
7 A number of factors affect the extent of mixing and dilution of a discharge. For example, the physical characteristics of the discharge i.e., how the discharge is released from a fewer or a higher number of open diffuser ports of the outfall, or the density of the discharge itself where denser brine undergoes relatively lesser mixing than a lesser dense discharge when it mixes with say, wastewater.
8 Ammonia was reported at 36,400 µg/L in the wastewater. There was no data available for ammonia under CCLEAN. The well data included ammonia and it was not detected at a method reporting limit of 50 µg/L. As discussed above, due to the undetected value, the method reporting limit was used as the concentration of ammonia in the source water, in turn resulting in a concentration of 86 µg/L in the brine Also, see Trussell Technologies, Inc., (2015) for further details
15
B. Water Quality Analysis For the Project Variant Discharge Scenarios Under Project Variant Under the Project Variant, the MPWSP Desalination Plant would treat 15.5-MGD of source water at a 42 percent recovery rate. Approximately 8.99 MGD of brine would be generated, consisting of concentrates from the pre-treatment and reverse osmosis (RO) processes as well as waste effluent produced during routine backwashing and operation and maintenance of the pretreatment filters. The brine generated in the desalination process would be discharged into Monterey Bay through the MRWPCA’s existing ocean outfall.
The Project Variant would also include operation of the MRWPCA-proposed GWR Project, which would involve RO treatment of a minimum of 3.9 MGD of source water to produce 3.2 MGD of product water and 0.73 MGD of effluent.9 The operation of the Project Variant would result in the following different discharge scenarios that would include brine from the MPWSP Desalination Plant, and/or effluent from the MRWPCA-proposed GWR project, and/or treated wastewater from the existing MRWPCA wastewater treatment plant. Depending on the operational scenario, the following discharges would be released into Monterey Bay through the existing MRWPCA outfall:
• Brine-only: 8.99 MGD of brine would be generated at the Desalination Plant and discharged alone through the MRWPCA outfall. This operating scenario would occur if the GWR Project comes on line after the MPWSP Desalination Plant, or the GWR Project periodically shuts down.
• Brine-with-Wastewater: 8.99 MGD of brine would be discharged with varying volumes of treated wastewater from the MRWPCA Regional Wastewater Treatment Plant. This operating scenario would occur when treated wastewater is available and if the GWR Project comes on line after the MPWSP Desalination Plant, or the GWR Project periodically shuts down.
• GWR-only discharge or GWR Effluent: 0.73 MGD of effluent generated under the MRWPCA-proposed GWR Project would be discharged alone through the MRWPCA outfall. This operating scenario would occur if the GWR Project comes on line before the MPWSP Desalination Plant, or the MPWSP Desalination Plant periodically shuts down.
• Blended discharge: 8.99 MGD of brine generated from the MPWSP Desalination Plant would be blended with 0.73 MGD of GWR-effluent to form 9.72 MGD of blended discharge. This operating scenario would typically occur in the irrigation season.
• Combined discharge: The blended discharge (9.72 MGD) would be combined with varying volumes of treated wastewater from the MRWPCA Regional Wastewater Treatment Plant. This operating scenario would typically occur in the non-irrigation season (explained further below).
• GWR-with-Wastewater: 0.73 MGD of GWR-effluent would be discharged with varying volumes of treated wastewater from the MRWPCA Regional Wastewater Treatment Plant. This operating scenario would occur when treated wastewater is available and if the GWR Project comes on line before the MPWSP Desalination Plant, or the MPWSP Desalination Plant periodically shuts down.
During certain times of the year, the brine-only, the GWR-effluent, and the blended discharges would combine with treated wastewater from the MRWPCA Regional Wastewater Treatment Plant, when available. The
9 A minimum of 4,320 acre-feet per year (AFY) of source water would be treated to produce 3,500 AFY of product water. At the time of this analysis, the available data for the GWR Project, i.e., 0.73 MGD of GWR effluent flow was used for the modeling analysis (also see Flow Science, Inc., 2014).
16
wastewater flow from the MRWPCA Regional Wastewater Treatment Plant varies throughout the year with the highest flows observed during the non-irrigation season (November through March) and the lowest flows during the irrigation season (April through October) when the secondary treated wastewater is processed through the SVRP for tertiary treatment and distributed to irrigators through the CSIP. During the irrigation season, on some days, all of the wastewater flows could be provided to irrigators, and only the brine, the GWR-effluent, and/or the blended discharges would be discharged into Monterey Bay through the outfall.
Table B-1 shows the average monthly projected flows for the various discharge scenarios associated with operation of the Project Variant, including the treated wastewater flows from the existing MRWPCA Regional Wastewater Treatment Plant, which is considered the existing or baseline discharge scenario for the analysis.
This analysis assumes that the brine would be discharged alone, or discharged with the GWR-effluent as blended discharge during the entire irrigation season (dry months), and that the combined discharge (i.e., the blended discharge along with the routine secondary-treated wastewater), brine-and-wastewater discharge, and GWR-and-wastewater discharge would occur during the non-irrigation season (wet months) and/or other times of the year when wastewater is released into the bay through the outfall. The wastewater from the routine operations of the MRWPCA Wastewater Treatment Plant and the GWR-effluent would provide dilution for the brine under the brine-and-wastewater and blended discharge scenarios respectively, which would not occur in the case of the brine-only discharge. Using this conservative assumption, the impact is analyzed for the brine-only, the GWR-effluent, and blended discharges that would occur during the entire irrigation season or when wastewater is not available and the brine-and-wastewater, GWR-and-wastewater, and combined discharges that would occur during non-irrigation season and/or when wastewater is available. The discharges were assumed to be released through the MRWPCA outfall with 120 open ports at the diffuser.
For the brine-and-wastewater discharge scenario applicable directly to the operation of the MPWSP Desalination Plant, the analysis accounts for different wastewater flows ranging from 19.78 MGD in the winter/Davidson season (when higher discharge volumes are anticipated) to a range of lower flows of 0.25, 0.5, 1, and 2 MGD in case the wastewater is not available at higher rates (Table B-1).10
The following sections discuss the approach, methodology, and results for water quality resulting from the brine-only, brine-with-wastewater, GWR effluent-only, GWR effluent-with-wastewater, blended, and combined discharges.
Approach Please see the approach under the water quality analysis for the proposed project (in Section A above). In addition to the water quality and flow of source water and wastewater, the approach to the water quality analysis for the Project Variant also considered the water quality and the flows estimated for the GWR effluent.
A separate water quality analysis was undertaken by MRWPCA as part of the MRWPCA-proposed GWR Project and conducted by Trussell Technologies, Inc., (2015). The analysis included the discharge scenarios described above for the Project Variant. The results from the MRWPCA-study are included in the discussion and conclusions later in this memorandum.
10 The analysis with low wastewater flows is based on the analysis conducted by Flow Science, Inc. (2014) for the proposed project.
17
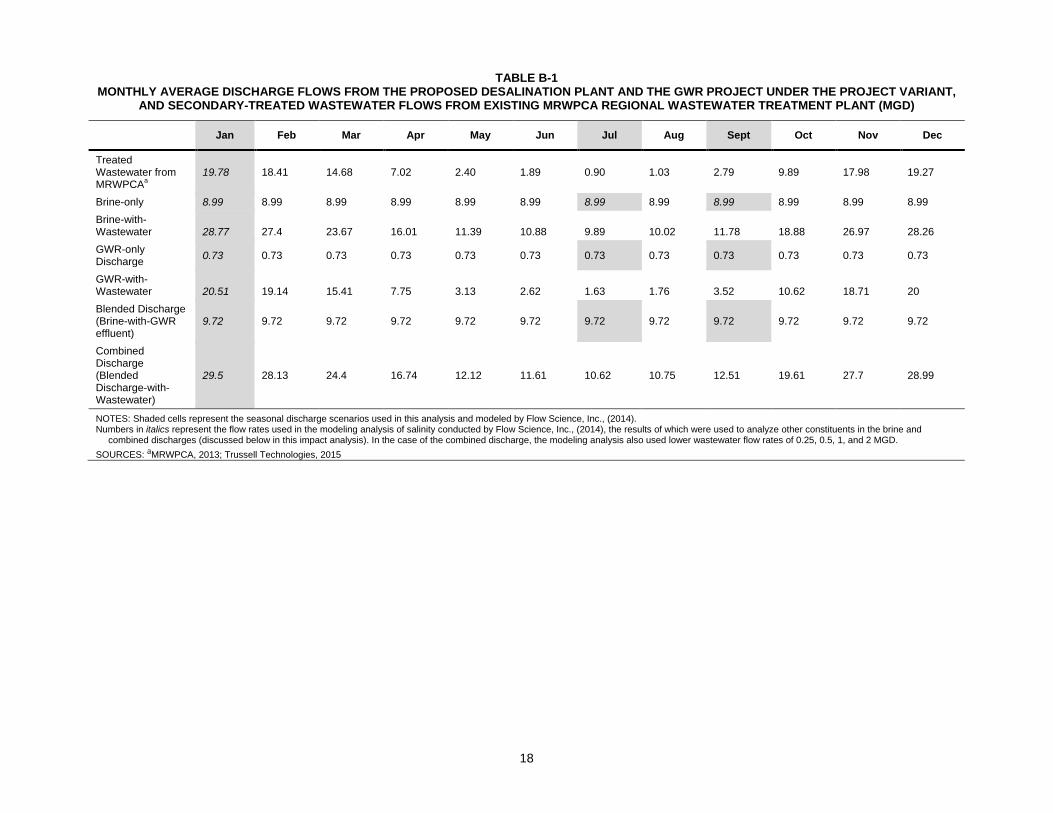
TABLE B-1 MONTHLY AVERAGE DISCHARGE FLOWS FROM THE PROPOSED DESALINATION PLANT AND THE GWR PROJECT UNDER THE PROJECT VARIANT,
AND SECONDARY-TREATED WASTEWATER FLOWS FROM EXISTING MRWPCA REGIONAL WASTEWATER TREATMENT PLANT (MGD)
Jan Feb Mar Apr May Jun Jul Aug Sept Oct Nov Dec
Treated Wastewater from MRWPCAa
19.78 18.41 14.68 7.02 2.40 1.89 0.90 1.03 2.79 9.89 17.98 19.27
Brine-only 8.99 8.99 8.99 8.99 8.99 8.99 8.99 8.99 8.99 8.99 8.99 8.99 Brine-with-Wastewater 28.77 27.4 23.67 16.01 11.39 10.88 9.89 10.02 11.78 18.88 26.97 28.26 GWR-only Discharge 0.73 0.73 0.73 0.73 0.73 0.73 0.73 0.73 0.73 0.73 0.73 0.73
GWR-with-Wastewater 20.51 19.14 15.41 7.75 3.13 2.62 1.63 1.76 3.52 10.62 18.71 20 Blended Discharge (Brine-with-GWR effluent)
9.72 9.72 9.72 9.72 9.72 9.72 9.72 9.72 9.72 9.72 9.72 9.72
Combined Discharge (Blended Discharge-with-Wastewater)
29.5 28.13 24.4 16.74 12.12 11.61 10.62 10.75 12.51 19.61 27.7 28.99
NOTES: Shaded cells represent the seasonal discharge scenarios used in this analysis and modeled by Flow Science, Inc., (2014). Numbers in italics represent the flow rates used in the modeling analysis of salinity conducted by Flow Science, Inc., (2014), the results of which were used to analyze other constituents in the brine and
combined discharges (discussed below in this impact analysis). In the case of the combined discharge, the modeling analysis also used lower wastewater flow rates of 0.25, 0.5, 1, and 2 MGD. SOURCES: aMRWPCA, 2013; Trussell Technologies, 2015
18
Methodology Please see the methodology under the water quality analysis for the proposed project above (in Section A above). Constituent concentrations resulting from the different discharges from the Project Variant at the edge of the ZID were calculated similar to that under the proposed project as follows:
• Brine: Similar to that under the proposed project.
• Brine-with-Wastewater: Similar to the combined discharge under the proposed project except for the dilution factor of 1:84 for discharge with 19.78-mgd wastewater flows.
• GWR-only discharge or GWR Effluent: The constituent concentrations were calculated using the concentrations obtained for the GWR effluent from MRWPCA and multiplying them with the dilution factor of 1:270 estimated for the GWR Project.11 This discharge is discussed in detail in the study conducted for MRWPCA for the GWR Project by Trussell Technologies, Inc., (2015).
• Blended discharge: Here, the brine would blend with GWR-effluent. The constituent concentrations in the blended discharge were calculated based on the respective constituent concentrations in the brine and GWR-effluent and the relative proportions of the brine and the GWR-effluent in the discharge. Then the concentrations were multiplied by the dilution factor (1:17) estimated in the near-field salinity analysis for the discharge by Flow Science Inc., (2014).
• Combined discharge: Here, the brine and GWR-effluent would combine with the wastewater. The constituent concentrations were calculated based on the respective constituent concentrations in the brine, GWR-effluent, and wastewater, and the relative proportions of the three streams in the discharge, then multiplied by the dilution factor (1:82) estimated in the near-field salinity analysis for the discharge by Flow Science Inc., (2014).
• GWR-with-Wastewater: Here, the discharge would consist of GWR-effluent and wastewater. The calculation would use the constituent concentrations and the relative proportions in the GWR-effluent and wastewater along with the estimated dilution ratio (1:180) for the discharge by Flow Science, Inc. (2014). This discharge is also discussed in detail in the study conducted for MRWPCA-proposed GWR Project by Trussell Technologies, Inc., (2015).
Results Table B-2 below presents the estimated constituent levels under the six discharge scenarios using the well data for source water quality. The table also shows how the levels at the edge of the ZID shown in pale grey columns compare with the Ocean Plan water quality objectives (the most conservative value among the 6-month median, 30-day average, and daily and instantaneous maximums are used) shown in the dark grey column.
Table B-2 also includes the constituents with ocean water quality objectives that were tested in the MRWPCA-wastewater and not in the well water. Concentrations for these constituents therefore could not be calculated for the brine discharge and hence also when it combines with wastewater. Therefore concentrations for these constituents under the discharges that contain brine are not provided.
11 This dilution factor was estimated under ESA’s study of the discharge as part of MPWSP and Project Variant (Flow Science, Inc., 2014). It is different than the dilution factor of 1:523, which was estimated under MRWPCA’s study of the discharge as part of their GWR Project (Trussell Technologies, Inc., 2015). The dilution factors were different owing to updates and changes to the flow and water quality data for the GWR Project after ESA completed its study. As stated above, water quality results from Trussell Technologies, Inc., (2015) were used for the GWR effluent and blended discharges and were compared between the two studies.
19
The MCWD well data was collected using higher water concentration limits than the water quality objectives for discharges. At the tested method reporting limits, a substantive number of constituents were not detected. They were therefore recorded using their reporting limits. For example, a constituent not detected at a reporting limit of micrograms per liter (0.01 µg/L) was reported at a concentration less than 0.01 µg/L or <0.01 µg/L, hence the concentration of the constituent would range between 0 and 0.01 µg/L. Here, the analysis used a conservative approach and assumed the highest value in the range, that of 0.01 µg/L as the concentration of the constituent. In the case of reporting limits higher than the Ocean Plan water quality objective, the constituent, upon further concentration as part of the desalination process, was expectedly found to exceed the water quality objective from the brine discharge.
Similar to the results under the proposed project (discussed in Section A above), there were several constituents observed that were found to exceed the water quality objectives under the different discharge scenarios. However due to the higher method reporting limits used to test the well data, a substantive number of constituents tested were not detected and were recorded at their reporting limits. In the case of reporting limits higher than the Ocean Plan water quality objective, a constituent not detected was expectedly found to exceed the water quality objective. Thus, the well data showed exceedances under all the discharge scenarios for the constituents, which were not detected in the source water. All the detected constituents in the source water however were found to be lower than, and in compliance with, the Ocean Plan water quality objectives.
Based on Table B-2, Table B-3 below lists the constituents that were found to exceed the water quality objectives for the discharges occurring under the Project Variant. Their concentrations in the source water (i.e., the well water) for the desalination plant, wastewater, and GWR effluent are provided as a reference.
As shown in Table B-3, none of the constituents in the discharges containing brine (i.e., brine-only, blended, brine-and-wastewater, and combined discharges) that showed an exceedance over water quality objectives at the edge of the ZID were detected in the source water at the method reporting limits used. Also, the method reporting limits were higher than the water quality objectives, therefore their concentrations in the brine and thus the respective listed discharges containing brine expectedly showed an exceedance. In the case of GWR-effluent, of the detected constituents, ammonia and benzidene were found to exceed the water quality objectives at the edge of the ZID.
The baseline wastewater discharge scenario showed an exceedance for aldrin, benzidene, and heptachlor. These constituents were not detected in the wastewater, hence, their method reporting limits were used as their respective concentrations, which were higher than the water quality objectives, hence the exceedance observed.
Similar to the discussion for proposed project in Section A above, given the several undetected constituents for the well-data, for a more conservative approach, ESA continued the water quality analysis utilizing the high-resolution data collected under CCLEAN from Monterey Bay to represent the source water quality for the MPWSP Desalination Plant.
Table B-4 below presents the estimated constituent concentrations in the discharge scenarios under the project variant using the CCLEAN data for source water quality. The table lists the constituents that are monitored under CCLEAN, hence does not include all of the constituents shown in Table A-2. Table B-4 shows the same dilution factors that were used in Table B-2 and also shows how the constituent concentrations at the edge of the ZID in pale grey columns compare with the Ocean Plan water quality objectives in the dark grey column.
20
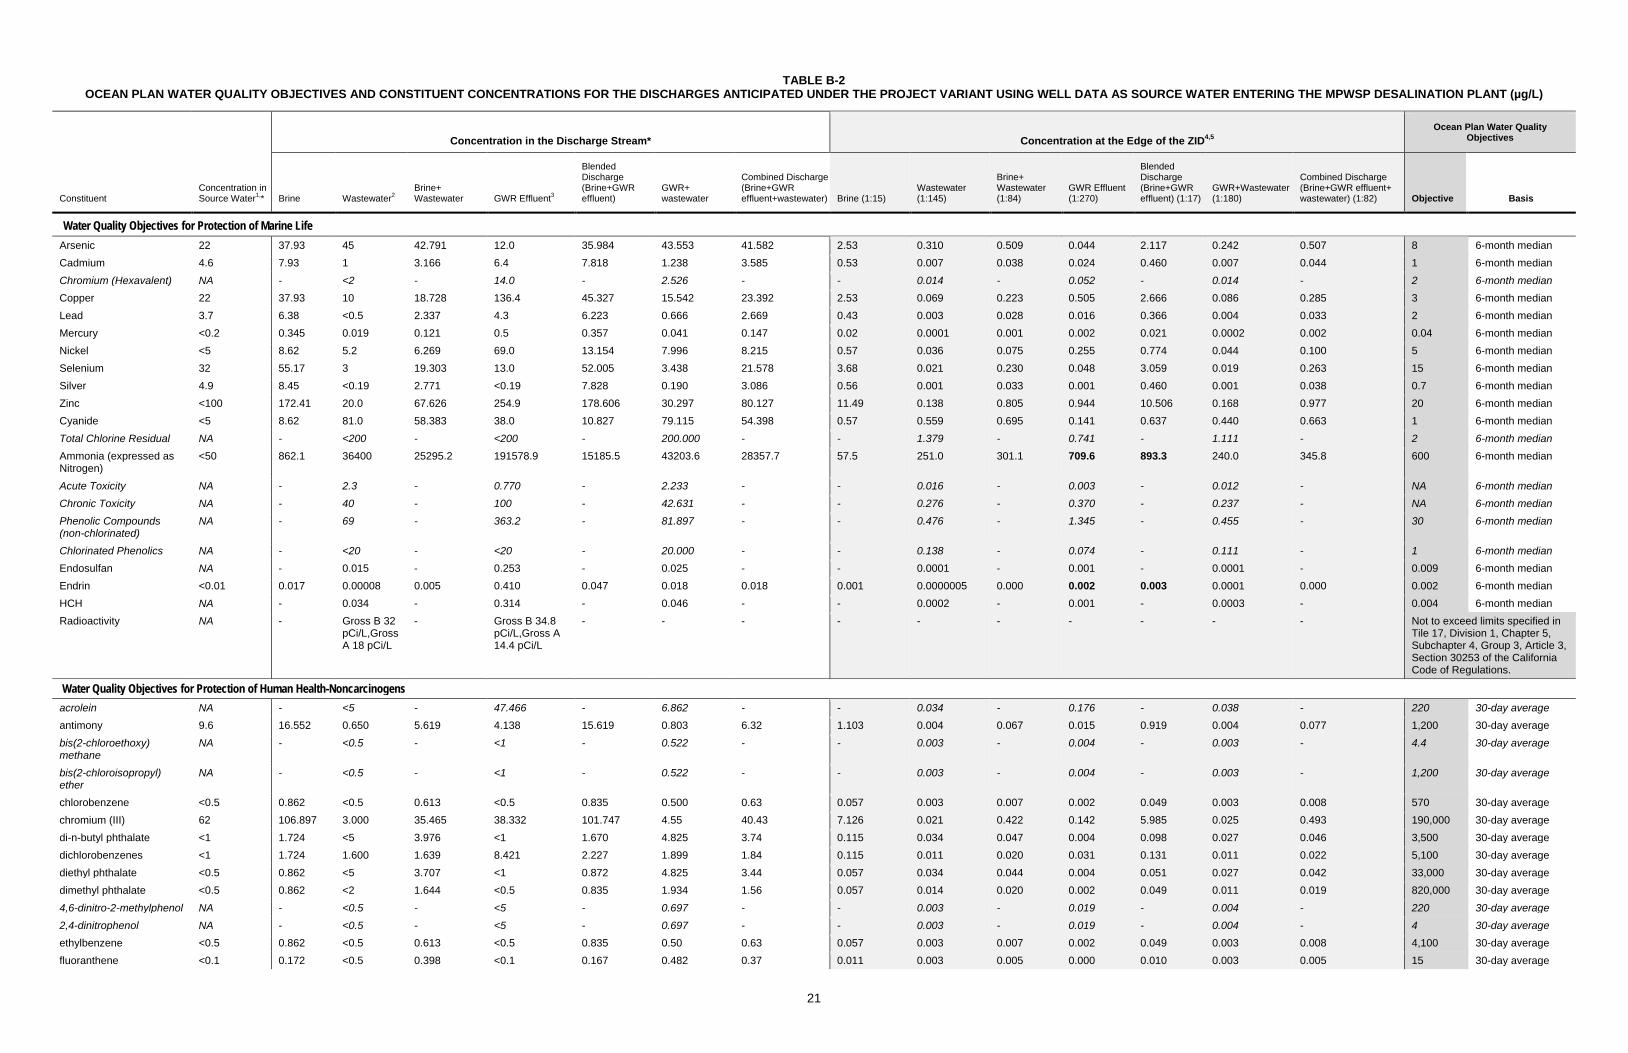
TABLE B-2 OCEAN PLAN WATER QUALITY OBJECTIVES AND CONSTITUENT CONCENTRATIONS FOR THE DISCHARGES ANTICIPATED UNDER THE PROJECT VARIANT USING WELL DATA AS SOURCE WATER ENTERING THE MPWSP DESALINATION PLANT (µg/L)
Concentration in the Discharge Stream* Concentration at the Edge of the ZID4,5 Ocean Plan Water Quality
Objectives
Constituent Concentration in Source Water1,* Brine Wastewater2
Brine+Wastewater GWR Effluent3
Blended Discharge (Brine+GWR effluent)
GWR+wastewater
Combined Discharge (Brine+GWR effluent+wastewater) Brine (1:15)
Wastewater (1:145)
Brine+Wastewater (1:84)
GWR Effluent (1:270)
Blended Discharge (Brine+GWR effluent) (1:17)
GWR+Wastewater (1:180)
Combined Discharge (Brine+GWR effluent+wastewater) (1:82) Objective Basis
Water Quality Objectives for Protection of Marine Life Arsenic 22 37.93 45 42.791 12.0 35.984 43.553 41.582 2.53 0.310 0.509 0.044 2.117 0.242 0.507 8 6-month median Cadmium 4.6 7.93 1 3.166 6.4 7.818 1.238 3.585 0.53 0.007 0.038 0.024 0.460 0.007 0.044 1 6-month median Chromium (Hexavalent) NA - <2 - 14.0 - 2.526 - - 0.014 - 0.052 - 0.014 - 2 6-month median Copper 22 37.93 10 18.728 136.4 45.327 15.542 23.392 2.53 0.069 0.223 0.505 2.666 0.086 0.285 3 6-month median Lead 3.7 6.38 <0.5 2.337 4.3 6.223 0.666 2.669 0.43 0.003 0.028 0.016 0.366 0.004 0.033 2 6-month median Mercury <0.2 0.345 0.019 0.121 0.5 0.357 0.041 0.147 0.02 0.0001 0.001 0.002 0.021 0.0002 0.002 0.04 6-month median Nickel <5 8.62 5.2 6.269 69.0 13.154 7.996 8.215 0.57 0.036 0.075 0.255 0.774 0.044 0.100 5 6-month median Selenium 32 55.17 3 19.303 13.0 52.005 3.438 21.578 3.68 0.021 0.230 0.048 3.059 0.019 0.263 15 6-month median Silver 4.9 8.45 <0.19 2.771 <0.19 7.828 0.190 3.086 0.56 0.001 0.033 0.001 0.460 0.001 0.038 0.7 6-month median Zinc <100 172.41 20.0 67.626 254.9 178.606 30.297 80.127 11.49 0.138 0.805 0.944 10.506 0.168 0.977 20 6-month median Cyanide <5 8.62 81.0 58.383 38.0 10.827 79.115 54.398 0.57 0.559 0.695 0.141 0.637 0.440 0.663 1 6-month median Total Chlorine Residual NA - <200 - <200 - 200.000 - - 1.379 - 0.741 - 1.111 - 2 6-month median Ammonia (expressed as Nitrogen)
<50 862.1 36400 25295.2 191578.9 15185.5 43203.6 28357.7 57.5 251.0 301.1 709.6 893.3 240.0 345.8 600 6-month median
Acute Toxicity NA - 2.3 - 0.770 - 2.233 - - 0.016 - 0.003 - 0.012 - NA 6-month median
Chronic Toxicity NA - 40 - 100 - 42.631 - - 0.276 - 0.370 - 0.237 - NA 6-month median
Phenolic Compounds (non-chlorinated)
NA - 69 - 363.2 - 81.897 - - 0.476 - 1.345 - 0.455 - 30 6-month median
Chlorinated Phenolics NA - <20 - <20 - 20.000 - - 0.138 - 0.074 - 0.111 - 1 6-month median Endosulfan NA - 0.015 - 0.253 - 0.025 - - 0.0001 - 0.001 - 0.0001 - 0.009 6-month median Endrin <0.01 0.017 0.00008 0.005 0.410 0.047 0.018 0.018 0.001 0.0000005 0.000 0.002 0.003 0.0001 0.000 0.002 6-month median HCH NA - 0.034 - 0.314 - 0.046 - - 0.0002 - 0.001 - 0.0003 - 0.004 6-month median Radioactivity NA - Gross B 32
pCi/L,Gross A 18 pCi/L
- Gross B 34.8 pCi/L,Gross A 14.4 pCi/L
- - - - - - - - - - Not to exceed limits specified in Tile 17, Division 1, Chapter 5, Subchapter 4, Group 3, Article 3, Section 30253 of the California Code of Regulations.
Water Quality Objectives for Protection of Human Health-Noncarcinogens acrolein NA - <5 - 47.466 - 6.862 - - 0.034 - 0.176 - 0.038 - 220 30-day average antimony 9.6 16.552 0.650 5.619 4.138 15.619 0.803 6.32 1.103 0.004 0.067 0.015 0.919 0.004 0.077 1,200 30-day average bis(2-chloroethoxy) methane
NA - <0.5 - <1 - 0.522 - - 0.003 - 0.004 - 0.003 - 4.4 30-day average
bis(2-chloroisopropyl) ether
NA - <0.5 - <1 - 0.522 - - 0.003 - 0.004 - 0.003 - 1,200 30-day average
chlorobenzene <0.5 0.862 <0.5 0.613 <0.5 0.835 0.500 0.63 0.057 0.003 0.007 0.002 0.049 0.003 0.008 570 30-day average chromium (III) 62 106.897 3.000 35.465 38.332 101.747 4.55 40.43 7.126 0.021 0.422 0.142 5.985 0.025 0.493 190,000 30-day average di-n-butyl phthalate <1 1.724 <5 3.976 <1 1.670 4.825 3.74 0.115 0.034 0.047 0.004 0.098 0.027 0.046 3,500 30-day average dichlorobenzenes <1 1.724 1.600 1.639 8.421 2.227 1.899 1.84 0.115 0.011 0.020 0.031 0.131 0.011 0.022 5,100 30-day average diethyl phthalate <0.5 0.862 <5 3.707 <1 0.872 4.825 3.44 0.057 0.034 0.044 0.004 0.051 0.027 0.042 33,000 30-day average dimethyl phthalate <0.5 0.862 <2 1.644 <0.5 0.835 1.934 1.56 0.057 0.014 0.020 0.002 0.049 0.011 0.019 820,000 30-day average 4,6-dinitro-2-methylphenol NA - <0.5 - <5 - 0.697 - - 0.003 - 0.019 - 0.004 - 220 30-day average
2,4-dinitrophenol NA - <0.5 - <5 - 0.697 - - 0.003 - 0.019 - 0.004 - 4 30-day average ethylbenzene <0.5 0.862 <0.5 0.613 <0.5 0.835 0.50 0.63 0.057 0.003 0.007 0.002 0.049 0.003 0.008 4,100 30-day average fluoranthene <0.1 0.172 <0.5 0.398 <0.1 0.167 0.482 0.37 0.011 0.003 0.005 0.000 0.010 0.003 0.005 15 30-day average
21
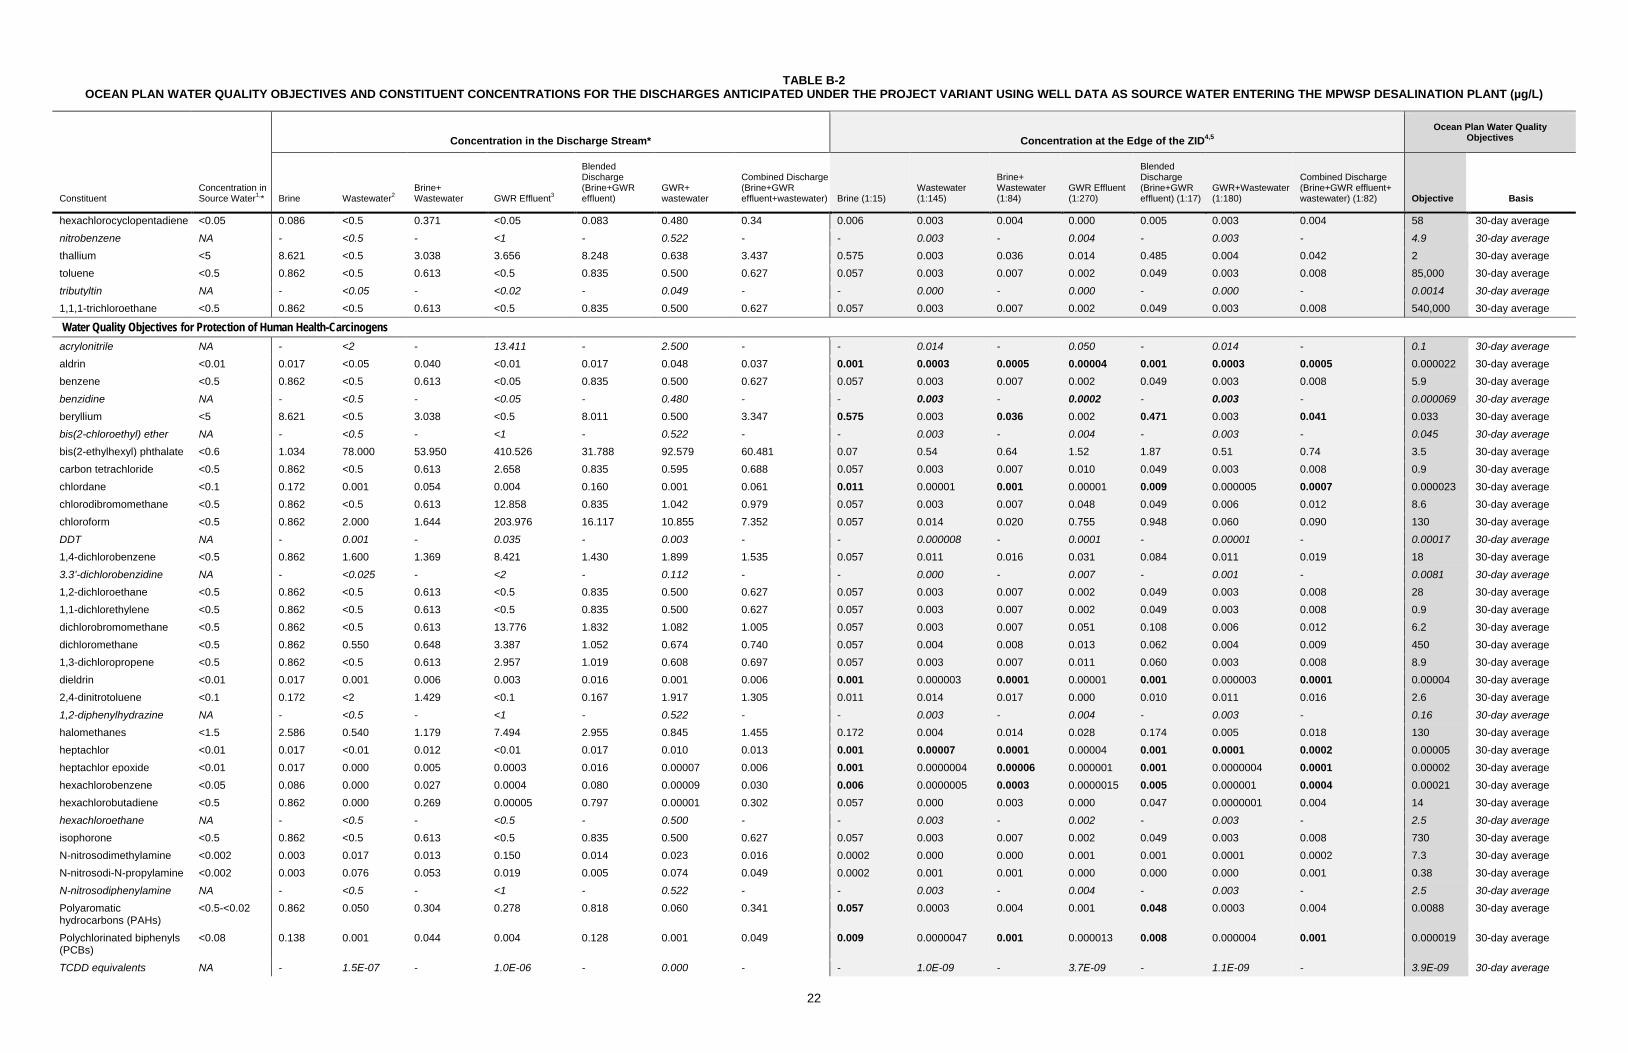
TABLE B-2 OCEAN PLAN WATER QUALITY OBJECTIVES AND CONSTITUENT CONCENTRATIONS FOR THE DISCHARGES ANTICIPATED UNDER THE PROJECT VARIANT USING WELL DATA AS SOURCE WATER ENTERING THE MPWSP DESALINATION PLANT (µg/L)
Concentration in the Discharge Stream* Concentration at the Edge of the ZID4,5 Ocean Plan Water Quality
Objectives
Constituent Concentration in Source Water1,* Brine Wastewater2
Brine+Wastewater GWR Effluent3
Blended Discharge (Brine+GWR effluent)
GWR+wastewater
Combined Discharge (Brine+GWR effluent+wastewater) Brine (1:15)
Wastewater (1:145)
Brine+Wastewater (1:84)
GWR Effluent (1:270)
Blended Discharge (Brine+GWR effluent) (1:17)
GWR+Wastewater (1:180)
Combined Discharge (Brine+GWR effluent+wastewater) (1:82) Objective Basis
hexachlorocyclopentadiene <0.05 0.086 <0.5 0.371 <0.05 0.083 0.480 0.34 0.006 0.003 0.004 0.000 0.005 0.003 0.004 58 30-day average nitrobenzene NA - <0.5 - <1 - 0.522 - - 0.003 - 0.004 - 0.003 - 4.9 30-day average thallium <5 8.621 <0.5 3.038 3.656 8.248 0.638 3.437 0.575 0.003 0.036 0.014 0.485 0.004 0.042 2 30-day average toluene <0.5 0.862 <0.5 0.613 <0.5 0.835 0.500 0.627 0.057 0.003 0.007 0.002 0.049 0.003 0.008 85,000 30-day average tributyltin NA - <0.05 - <0.02 - 0.049 - - 0.000 - 0.000 - 0.000 - 0.0014 30-day average 1,1,1-trichloroethane <0.5 0.862 <0.5 0.613 <0.5 0.835 0.500 0.627 0.057 0.003 0.007 0.002 0.049 0.003 0.008 540,000 30-day average
Water Quality Objectives for Protection of Human Health-Carcinogens acrylonitrile NA - <2 - 13.411 - 2.500 - - 0.014 - 0.050 - 0.014 - 0.1 30-day average aldrin <0.01 0.017 <0.05 0.040 <0.01 0.017 0.048 0.037 0.001 0.0003 0.0005 0.00004 0.001 0.0003 0.0005 0.000022 30-day average benzene <0.5 0.862 <0.5 0.613 <0.05 0.835 0.500 0.627 0.057 0.003 0.007 0.002 0.049 0.003 0.008 5.9 30-day average benzidine NA - <0.5 - <0.05 - 0.480 - - 0.003 - 0.0002 - 0.003 - 0.000069 30-day average beryllium <5 8.621 <0.5 3.038 <0.5 8.011 0.500 3.347 0.575 0.003 0.036 0.002 0.471 0.003 0.041 0.033 30-day average bis(2-chloroethyl) ether NA - <0.5 - <1 - 0.522 - - 0.003 - 0.004 - 0.003 - 0.045 30-day average bis(2-ethylhexyl) phthalate <0.6 1.034 78.000 53.950 410.526 31.788 92.579 60.481 0.07 0.54 0.64 1.52 1.87 0.51 0.74 3.5 30-day average carbon tetrachloride <0.5 0.862 <0.5 0.613 2.658 0.835 0.595 0.688 0.057 0.003 0.007 0.010 0.049 0.003 0.008 0.9 30-day average chlordane <0.1 0.172 0.001 0.054 0.004 0.160 0.001 0.061 0.011 0.00001 0.001 0.00001 0.009 0.000005 0.0007 0.000023 30-day average chlorodibromomethane <0.5 0.862 <0.5 0.613 12.858 0.835 1.042 0.979 0.057 0.003 0.007 0.048 0.049 0.006 0.012 8.6 30-day average chloroform <0.5 0.862 2.000 1.644 203.976 16.117 10.855 7.352 0.057 0.014 0.020 0.755 0.948 0.060 0.090 130 30-day average DDT NA - 0.001 - 0.035 - 0.003 - - 0.000008 - 0.0001 - 0.00001 - 0.00017 30-day average 1,4-dichlorobenzene <0.5 0.862 1.600 1.369 8.421 1.430 1.899 1.535 0.057 0.011 0.016 0.031 0.084 0.011 0.019 18 30-day average 3.3’-dichlorobenzidine NA - <0.025 - <2 - 0.112 - - 0.000 - 0.007 - 0.001 - 0.0081 30-day average 1,2-dichloroethane <0.5 0.862 <0.5 0.613 <0.5 0.835 0.500 0.627 0.057 0.003 0.007 0.002 0.049 0.003 0.008 28 30-day average 1,1-dichlorethylene <0.5 0.862 <0.5 0.613 <0.5 0.835 0.500 0.627 0.057 0.003 0.007 0.002 0.049 0.003 0.008 0.9 30-day average dichlorobromomethane <0.5 0.862 <0.5 0.613 13.776 1.832 1.082 1.005 0.057 0.003 0.007 0.051 0.108 0.006 0.012 6.2 30-day average dichloromethane <0.5 0.862 0.550 0.648 3.387 1.052 0.674 0.740 0.057 0.004 0.008 0.013 0.062 0.004 0.009 450 30-day average 1,3-dichloropropene <0.5 0.862 <0.5 0.613 2.957 1.019 0.608 0.697 0.057 0.003 0.007 0.011 0.060 0.003 0.008 8.9 30-day average dieldrin <0.01 0.017 0.001 0.006 0.003 0.016 0.001 0.006 0.001 0.000003 0.0001 0.00001 0.001 0.000003 0.0001 0.00004 30-day average 2,4-dinitrotoluene <0.1 0.172 <2 1.429 <0.1 0.167 1.917 1.305 0.011 0.014 0.017 0.000 0.010 0.011 0.016 2.6 30-day average 1,2-diphenylhydrazine NA - <0.5 - <1 - 0.522 - - 0.003 - 0.004 - 0.003 - 0.16 30-day average halomethanes <1.5 2.586 0.540 1.179 7.494 2.955 0.845 1.455 0.172 0.004 0.014 0.028 0.174 0.005 0.018 130 30-day average heptachlor <0.01 0.017 <0.01 0.012 <0.01 0.017 0.010 0.013 0.001 0.00007 0.0001 0.00004 0.001 0.0001 0.0002 0.00005 30-day average heptachlor epoxide <0.01 0.017 0.000 0.005 0.0003 0.016 0.00007 0.006 0.001 0.0000004 0.00006 0.000001 0.001 0.0000004 0.0001 0.00002 30-day average hexachlorobenzene <0.05 0.086 0.000 0.027 0.0004 0.080 0.00009 0.030 0.006 0.0000005 0.0003 0.0000015 0.005 0.000001 0.0004 0.00021 30-day average hexachlorobutadiene <0.5 0.862 0.000 0.269 0.00005 0.797 0.00001 0.302 0.057 0.000 0.003 0.000 0.047 0.0000001 0.004 14 30-day average hexachloroethane NA - <0.5 - <0.5 - 0.500 - - 0.003 - 0.002 - 0.003 - 2.5 30-day average isophorone <0.5 0.862 <0.5 0.613 <0.5 0.835 0.500 0.627 0.057 0.003 0.007 0.002 0.049 0.003 0.008 730 30-day average N-nitrosodimethylamine <0.002 0.003 0.017 0.013 0.150 0.014 0.023 0.016 0.0002 0.000 0.000 0.001 0.001 0.0001 0.0002 7.3 30-day average N-nitrosodi-N-propylamine <0.002 0.003 0.076 0.053 0.019 0.005 0.074 0.049 0.0002 0.001 0.001 0.000 0.000 0.000 0.001 0.38 30-day average N-nitrosodiphenylamine NA - <0.5 - <1 - 0.522 - - 0.003 - 0.004 - 0.003 - 2.5 30-day average Polyaromatic hydrocarbons (PAHs)
<0.5-<0.02 0.862 0.050 0.304 0.278 0.818 0.060 0.341 0.057 0.0003 0.004 0.001 0.048 0.0003 0.004 0.0088 30-day average
Polychlorinated biphenyls (PCBs)
<0.08 0.138 0.001 0.044 0.004 0.128 0.001 0.049 0.009 0.0000047 0.001 0.000013 0.008 0.000004 0.001 0.000019 30-day average
TCDD equivalents NA - 1.5E-07 - 1.0E-06 - 0.000 - - 1.0E-09 - 3.7E-09 - 1.1E-09 - 3.9E-09 30-day average
22
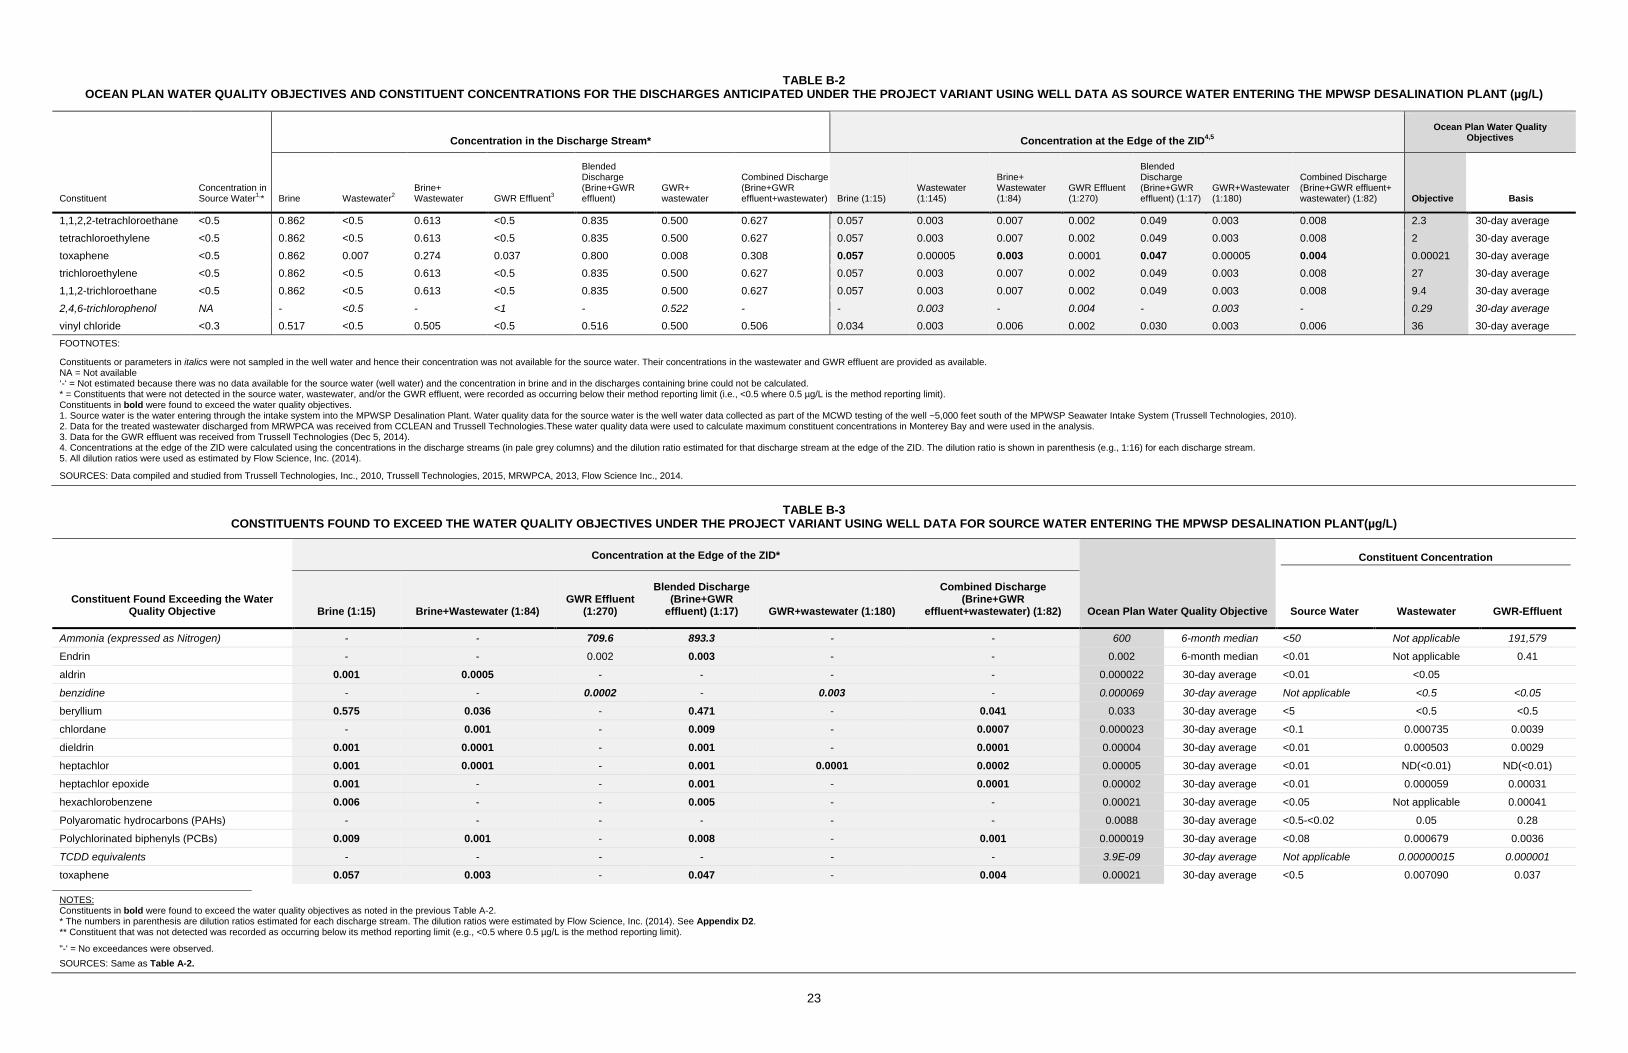
TABLE B-2 OCEAN PLAN WATER QUALITY OBJECTIVES AND CONSTITUENT CONCENTRATIONS FOR THE DISCHARGES ANTICIPATED UNDER THE PROJECT VARIANT USING WELL DATA AS SOURCE WATER ENTERING THE MPWSP DESALINATION PLANT (µg/L)
Concentration in the Discharge Stream* Concentration at the Edge of the ZID4,5 Ocean Plan Water Quality
Objectives
Constituent Concentration in Source Water1,* Brine Wastewater2
Brine+Wastewater GWR Effluent3
Blended Discharge (Brine+GWR effluent)
GWR+wastewater
Combined Discharge (Brine+GWR effluent+wastewater) Brine (1:15)
Wastewater (1:145)
Brine+Wastewater (1:84)
GWR Effluent (1:270)
Blended Discharge (Brine+GWR effluent) (1:17)
GWR+Wastewater (1:180)
Combined Discharge (Brine+GWR effluent+wastewater) (1:82) Objective Basis
1,1,2,2-tetrachloroethane <0.5 0.862 <0.5 0.613 <0.5 0.835 0.500 0.627 0.057 0.003 0.007 0.002 0.049 0.003 0.008 2.3 30-day average tetrachloroethylene <0.5 0.862 <0.5 0.613 <0.5 0.835 0.500 0.627 0.057 0.003 0.007 0.002 0.049 0.003 0.008 2 30-day average toxaphene <0.5 0.862 0.007 0.274 0.037 0.800 0.008 0.308 0.057 0.00005 0.003 0.0001 0.047 0.00005 0.004 0.00021 30-day average trichloroethylene <0.5 0.862 <0.5 0.613 <0.5 0.835 0.500 0.627 0.057 0.003 0.007 0.002 0.049 0.003 0.008 27 30-day average 1,1,2-trichloroethane <0.5 0.862 <0.5 0.613 <0.5 0.835 0.500 0.627 0.057 0.003 0.007 0.002 0.049 0.003 0.008 9.4 30-day average 2,4,6-trichlorophenol NA - <0.5 - <1 - 0.522 - - 0.003 - 0.004 - 0.003 - 0.29 30-day average vinyl chloride <0.3 0.517 <0.5 0.505 <0.5 0.516 0.500 0.506 0.034 0.003 0.006 0.002 0.030 0.003 0.006 36 30-day average FOOTNOTES:
Constituents or parameters in italics were not sampled in the well water and hence their concentration was not available for the source water. Their concentrations in the wastewater and GWR effluent are provided as available. NA = Not available ‘-‘ = Not estimated because there was no data available for the source water (well water) and the concentration in brine and in the discharges containing brine could not be calculated. * = Constituents that were not detected in the source water, wastewater, and/or the GWR effluent, were recorded as occurring below their method reporting limit (i.e., <0.5 where 0.5 µg/L is the method reporting limit). Constituents in bold were found to exceed the water quality objectives. 1. Source water is the water entering through the intake system into the MPWSP Desalination Plant. Water quality data for the source water is the well water data collected as part of the MCWD testing of the well ~5,000 feet south of the MPWSP Seawater Intake System (Trussell Technologies, 2010). 2. Data for the treated wastewater discharged from MRWPCA was received from CCLEAN and Trussell Technologies.These water quality data were used to calculate maximum constituent concentrations in Monterey Bay and were used in the analysis. 3. Data for the GWR effluent was received from Trussell Technologies (Dec 5, 2014). 4. Concentrations at the edge of the ZID were calculated using the concentrations in the discharge streams (in pale grey columns) and the dilution ratio estimated for that discharge stream at the edge of the ZID. The dilution ratio is shown in parenthesis (e.g., 1:16) for each discharge stream. 5. All dilution ratios were used as estimated by Flow Science, Inc. (2014).
SOURCES: Data compiled and studied from Trussell Technologies, Inc., 2010, Trussell Technologies, 2015, MRWPCA, 2013, Flow Science Inc., 2014.
TABLE B-3
CONSTITUENTS FOUND TO EXCEED THE WATER QUALITY OBJECTIVES UNDER THE PROJECT VARIANT USING WELL DATA FOR SOURCE WATER ENTERING THE MPWSP DESALINATION PLANT(µg/L)
Constituent Found Exceeding the Water Quality Objective
Concentration at the Edge of the ZID*
Ocean Plan Water Quality Objective
Constituent Concentration
Brine (1:15) Brine+Wastewater (1:84) GWR Effluent
(1:270)
Blended Discharge (Brine+GWR
effluent) (1:17) GWR+wastewater (1:180)
Combined Discharge (Brine+GWR
effluent+wastewater) (1:82) Source Water Wastewater GWR-Effluent
Ammonia (expressed as Nitrogen) - - 709.6 893.3 - - 600 6-month median <50 Not applicable 191,579
Endrin - - 0.002 0.003 - - 0.002 6-month median <0.01 Not applicable 0.41
aldrin 0.001 0.0005 - - - - 0.000022 30-day average <0.01 <0.05 benzidine - - 0.0002 - 0.003 - 0.000069 30-day average Not applicable <0.5 <0.05
beryllium 0.575 0.036 - 0.471 - 0.041 0.033 30-day average <5 <0.5 <0.5
chlordane - 0.001 - 0.009 - 0.0007 0.000023 30-day average <0.1 0.000735 0.0039
dieldrin 0.001 0.0001 - 0.001 - 0.0001 0.00004 30-day average <0.01 0.000503 0.0029
heptachlor 0.001 0.0001 - 0.001 0.0001 0.0002 0.00005 30-day average <0.01 ND(<0.01) ND(<0.01)
heptachlor epoxide 0.001 - - 0.001 - 0.0001 0.00002 30-day average <0.01 0.000059 0.00031
hexachlorobenzene 0.006 - - 0.005 - - 0.00021 30-day average <0.05 Not applicable 0.00041
Polyaromatic hydrocarbons (PAHs) - - - - - - 0.0088 30-day average <0.5-<0.02 0.05 0.28
Polychlorinated biphenyls (PCBs) 0.009 0.001 - 0.008 - 0.001 0.000019 30-day average <0.08 0.000679 0.0036
TCDD equivalents - - - - - - 3.9E-09 30-day average Not applicable 0.00000015 0.000001
toxaphene 0.057 0.003 - 0.047 - 0.004 0.00021 30-day average <0.5 0.007090 0.037
NOTES: Constituents in bold were found to exceed the water quality objectives as noted in the previous Table A-2. * The numbers in parenthesis are dilution ratios estimated for each discharge stream. The dilution ratios were estimated by Flow Science, Inc. (2014). See Appendix D2. ** Constituent that was not detected was recorded as occurring below its method reporting limit (e.g., <0.5 where 0.5 µg/L is the method reporting limit).
"-' = No exceedances were observed. SOURCES: Same as Table A-2.
23
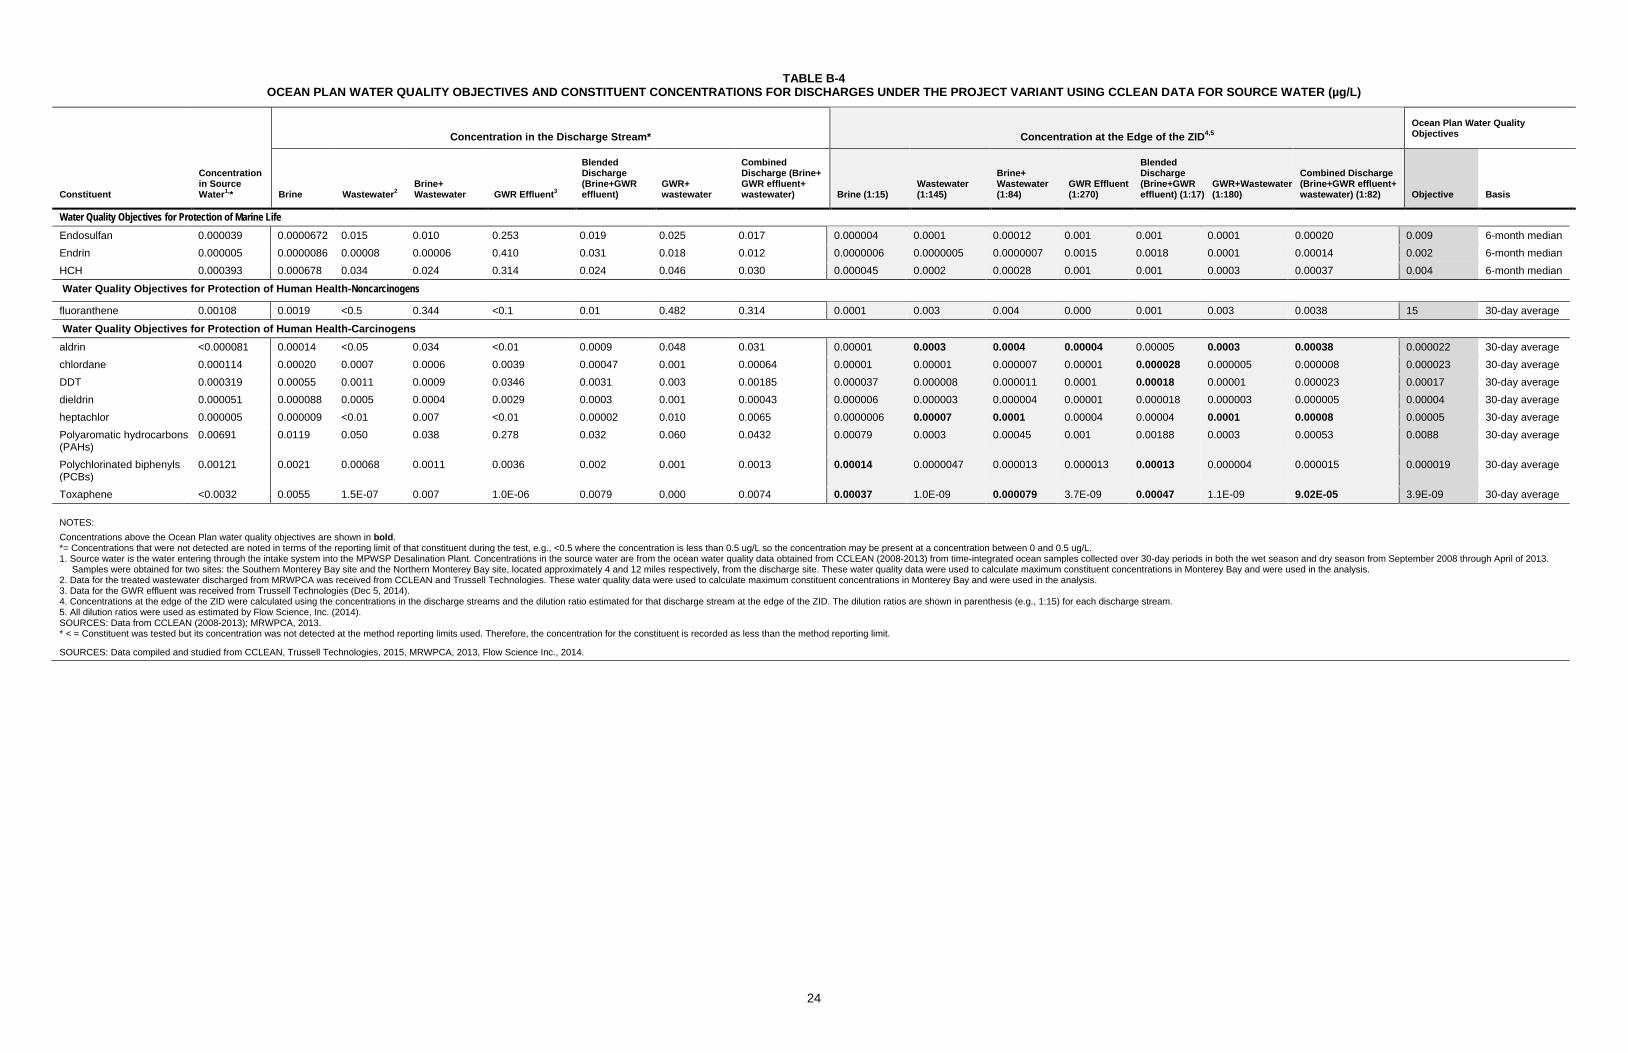
TABLE B-4 OCEAN PLAN WATER QUALITY OBJECTIVES AND CONSTITUENT CONCENTRATIONS FOR DISCHARGES UNDER THE PROJECT VARIANT USING CCLEAN DATA FOR SOURCE WATER (µg/L)
Concentration in the Discharge Stream* Concentration at the Edge of the ZID4,5 Ocean Plan Water Quality Objectives
Constituent
Concentration in Source Water1,* Brine Wastewater2
Brine+Wastewater GWR Effluent3
Blended Discharge (Brine+GWR effluent)
GWR+wastewater
Combined Discharge (Brine+GWR effluent+wastewater) Brine (1:15)
Wastewater (1:145)
Brine+Wastewater (1:84)
GWR Effluent (1:270)
Blended Discharge (Brine+GWR effluent) (1:17)
GWR+Wastewater (1:180)
Combined Discharge (Brine+GWR effluent+wastewater) (1:82) Objective Basis
Water Quality Objectives for Protection of Marine Life Endosulfan 0.000039 0.0000672 0.015 0.010 0.253 0.019 0.025 0.017 0.000004 0.0001 0.00012 0.001 0.001 0.0001 0.00020 0.009 6-month median Endrin 0.000005 0.0000086 0.00008 0.00006 0.410 0.031 0.018 0.012 0.0000006 0.0000005 0.0000007 0.0015 0.0018 0.0001 0.00014 0.002 6-month median HCH 0.000393 0.000678 0.034 0.024 0.314 0.024 0.046 0.030 0.000045 0.0002 0.00028 0.001 0.001 0.0003 0.00037 0.004 6-month median
Water Quality Objectives for Protection of Human Health-Noncarcinogens
fluoranthene 0.00108 0.0019 <0.5 0.344 <0.1 0.01 0.482 0.314 0.0001 0.003 0.004 0.000 0.001 0.003 0.0038 15 30-day average
Water Quality Objectives for Protection of Human Health-Carcinogens aldrin <0.000081 0.00014 <0.05 0.034 <0.01 0.0009 0.048 0.031 0.00001 0.0003 0.0004 0.00004 0.00005 0.0003 0.00038 0.000022 30-day average chlordane 0.000114 0.00020 0.0007 0.0006 0.0039 0.00047 0.001 0.00064 0.00001 0.00001 0.000007 0.00001 0.000028 0.000005 0.000008 0.000023 30-day average DDT 0.000319 0.00055 0.0011 0.0009 0.0346 0.0031 0.003 0.00185 0.000037 0.000008 0.000011 0.0001 0.00018 0.00001 0.000023 0.00017 30-day average dieldrin 0.000051 0.000088 0.0005 0.0004 0.0029 0.0003 0.001 0.00043 0.000006 0.000003 0.000004 0.00001 0.000018 0.000003 0.000005 0.00004 30-day average heptachlor 0.000005 0.000009 <0.01 0.007 <0.01 0.00002 0.010 0.0065 0.0000006 0.00007 0.0001 0.00004 0.00004 0.0001 0.00008 0.00005 30-day average Polyaromatic hydrocarbons (PAHs)
0.00691 0.0119 0.050 0.038 0.278 0.032 0.060 0.0432 0.00079 0.0003 0.00045 0.001 0.00188 0.0003 0.00053 0.0088 30-day average
Polychlorinated biphenyls (PCBs)
0.00121 0.0021 0.00068 0.0011 0.0036 0.002 0.001 0.0013 0.00014 0.0000047 0.000013 0.000013 0.00013 0.000004 0.000015 0.000019 30-day average
Toxaphene <0.0032 0.0055 1.5E-07 0.007 1.0E-06 0.0079 0.000 0.0074 0.00037 1.0E-09 0.000079 3.7E-09 0.00047 1.1E-09 9.02E-05 3.9E-09 30-day average
NOTES: Concentrations above the Ocean Plan water quality objectives are shown in bold. *= Concentrations that were not detected are noted in terms of the reporting limit of that constituent during the test, e.g., <0.5 where the concentration is less than 0.5 ug/L so the concentration may be present at a concentration between 0 and 0.5 ug/L. 1. Source water is the water entering through the intake system into the MPWSP Desalination Plant. Concentrations in the source water are from the ocean water quality data obtained from CCLEAN (2008-2013) from time-integrated ocean samples collected over 30-day periods in both the wet season and dry season from September 2008 through April of 2013.
Samples were obtained for two sites: the Southern Monterey Bay site and the Northern Monterey Bay site, located approximately 4 and 12 miles respectively, from the discharge site. These water quality data were used to calculate maximum constituent concentrations in Monterey Bay and were used in the analysis. 2. Data for the treated wastewater discharged from MRWPCA was received from CCLEAN and Trussell Technologies. These water quality data were used to calculate maximum constituent concentrations in Monterey Bay and were used in the analysis. 3. Data for the GWR effluent was received from Trussell Technologies (Dec 5, 2014). 4. Concentrations at the edge of the ZID were calculated using the concentrations in the discharge streams and the dilution ratio estimated for that discharge stream at the edge of the ZID. The dilution ratios are shown in parenthesis (e.g., 1:15) for each discharge stream. 5. All dilution ratios were used as estimated by Flow Science, Inc. (2014). SOURCES: Data from CCLEAN (2008-2013); MRWPCA, 2013. * < = Constituent was tested but its concentration was not detected at the method reporting limits used. Therefore, the concentration for the constituent is recorded as less than the method reporting limit.
SOURCES: Data compiled and studied from CCLEAN, Trussell Technologies, 2015, MRWPCA, 2013, Flow Science Inc., 2014.
24
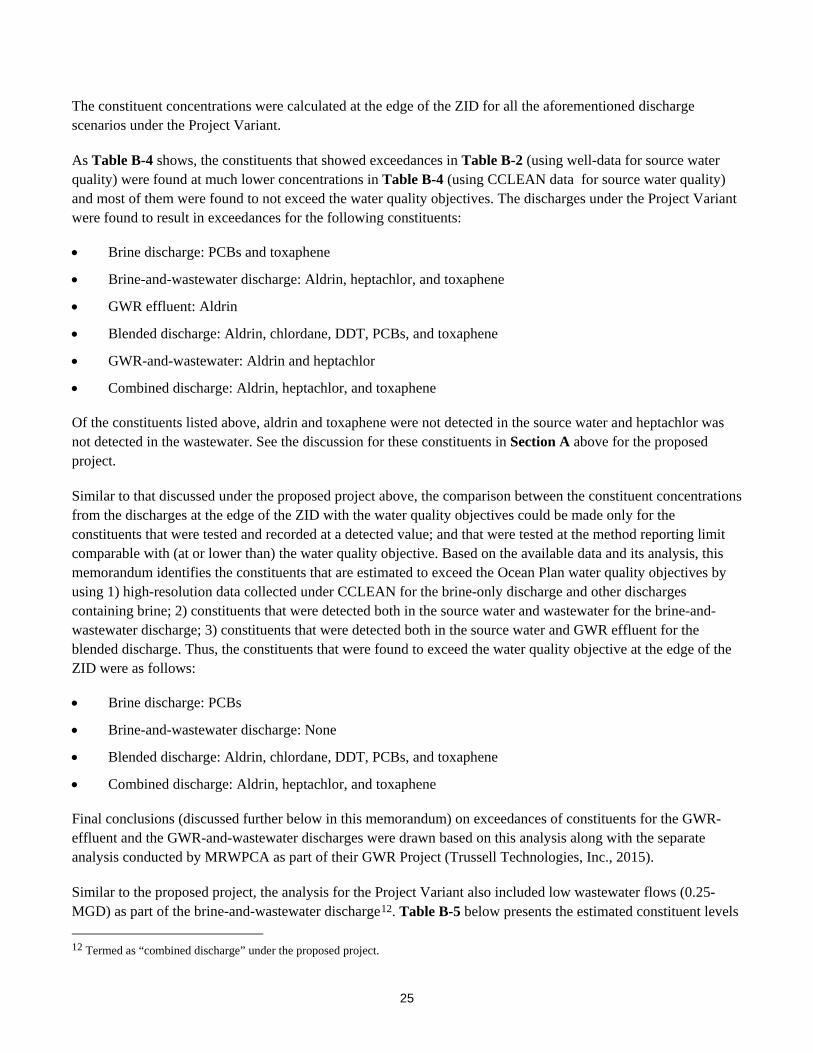
The constituent concentrations were calculated at the edge of the ZID for all the aforementioned discharge scenarios under the Project Variant.
As Table B-4 shows, the constituents that showed exceedances in Table B-2 (using well-data for source water quality) were found at much lower concentrations in Table B-4 (using CCLEAN data for source water quality) and most of them were found to not exceed the water quality objectives. The discharges under the Project Variant were found to result in exceedances for the following constituents:
• Brine discharge: PCBs and toxaphene
• Brine-and-wastewater discharge: Aldrin, heptachlor, and toxaphene
• GWR effluent: Aldrin
• Blended discharge: Aldrin, chlordane, DDT, PCBs, and toxaphene
• GWR-and-wastewater: Aldrin and heptachlor
• Combined discharge: Aldrin, heptachlor, and toxaphene
Of the constituents listed above, aldrin and toxaphene were not detected in the source water and heptachlor was not detected in the wastewater. See the discussion for these constituents in Section A above for the proposed project.
Similar to that discussed under the proposed project above, the comparison between the constituent concentrations from the discharges at the edge of the ZID with the water quality objectives could be made only for the constituents that were tested and recorded at a detected value; and that were tested at the method reporting limit comparable with (at or lower than) the water quality objective. Based on the available data and its analysis, this memorandum identifies the constituents that are estimated to exceed the Ocean Plan water quality objectives by using 1) high-resolution data collected under CCLEAN for the brine-only discharge and other discharges containing brine; 2) constituents that were detected both in the source water and wastewater for the brine-and-wastewater discharge; 3) constituents that were detected both in the source water and GWR effluent for the blended discharge. Thus, the constituents that were found to exceed the water quality objective at the edge of the ZID were as follows:
• Brine discharge: PCBs
• Brine-and-wastewater discharge: None
• Blended discharge: Aldrin, chlordane, DDT, PCBs, and toxaphene
• Combined discharge: Aldrin, heptachlor, and toxaphene
Final conclusions (discussed further below in this memorandum) on exceedances of constituents for the GWR-effluent and the GWR-and-wastewater discharges were drawn based on this analysis along with the separate analysis conducted by MRWPCA as part of their GWR Project (Trussell Technologies, Inc., 2015).
Similar to the proposed project, the analysis for the Project Variant also included low wastewater flows (0.25-MGD) as part of the brine-and-wastewater discharge12. Table B-5 below presents the estimated constituent levels
12 Termed as “combined discharge” under the proposed project.
25
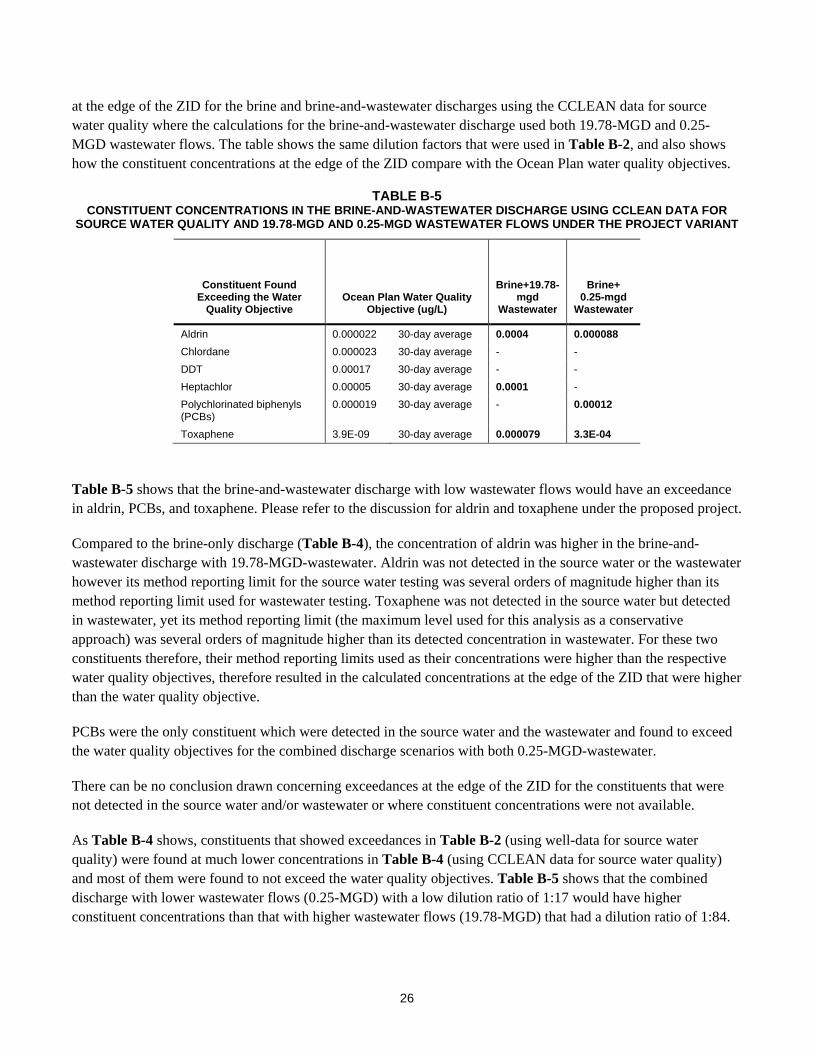
at the edge of the ZID for the brine and brine-and-wastewater discharges using the CCLEAN data for source water quality where the calculations for the brine-and-wastewater discharge used both 19.78-MGD and 0.25-MGD wastewater flows. The table shows the same dilution factors that were used in Table B-2, and also shows how the constituent concentrations at the edge of the ZID compare with the Ocean Plan water quality objectives.
TABLE B-5 CONSTITUENT CONCENTRATIONS IN THE BRINE-AND-WASTEWATER DISCHARGE USING CCLEAN DATA FOR
SOURCE WATER QUALITY AND 19.78-MGD AND 0.25-MGD WASTEWATER FLOWS UNDER THE PROJECT VARIANT
Constituent Found Exceeding the Water
Quality Objective Ocean Plan Water Quality
Objective (ug/L)
Brine+19.78-mgd
Wastewater
Brine+ 0.25-mgd
Wastewater
Aldrin 0.000022 30-day average 0.0004 0.000088 Chlordane 0.000023 30-day average - - DDT 0.00017 30-day average - - Heptachlor 0.00005 30-day average 0.0001 - Polychlorinated biphenyls (PCBs)
0.000019 30-day average - 0.00012
Toxaphene 3.9E-09 30-day average 0.000079 3.3E-04
Table B-5 shows that the brine-and-wastewater discharge with low wastewater flows would have an exceedance in aldrin, PCBs, and toxaphene. Please refer to the discussion for aldrin and toxaphene under the proposed project.
Compared to the brine-only discharge (Table B-4), the concentration of aldrin was higher in the brine-and-wastewater discharge with 19.78-MGD-wastewater. Aldrin was not detected in the source water or the wastewater however its method reporting limit for the source water testing was several orders of magnitude higher than its method reporting limit used for wastewater testing. Toxaphene was not detected in the source water but detected in wastewater, yet its method reporting limit (the maximum level used for this analysis as a conservative approach) was several orders of magnitude higher than its detected concentration in wastewater. For these two constituents therefore, their method reporting limits used as their concentrations were higher than the respective water quality objectives, therefore resulted in the calculated concentrations at the edge of the ZID that were higher than the water quality objective.
PCBs were the only constituent which were detected in the source water and the wastewater and found to exceed the water quality objectives for the combined discharge scenarios with both 0.25-MGD-wastewater.
There can be no conclusion drawn concerning exceedances at the edge of the ZID for the constituents that were not detected in the source water and/or wastewater or where constituent concentrations were not available.
As Table B-4 shows, constituents that showed exceedances in Table B-2 (using well-data for source water quality) were found at much lower concentrations in Table B-4 (using CCLEAN data for source water quality) and most of them were found to not exceed the water quality objectives. Table B-5 shows that the combined discharge with lower wastewater flows (0.25-MGD) with a low dilution ratio of 1:17 would have higher constituent concentrations than that with higher wastewater flows (19.78-MGD) that had a dilution ratio of 1:84.
26
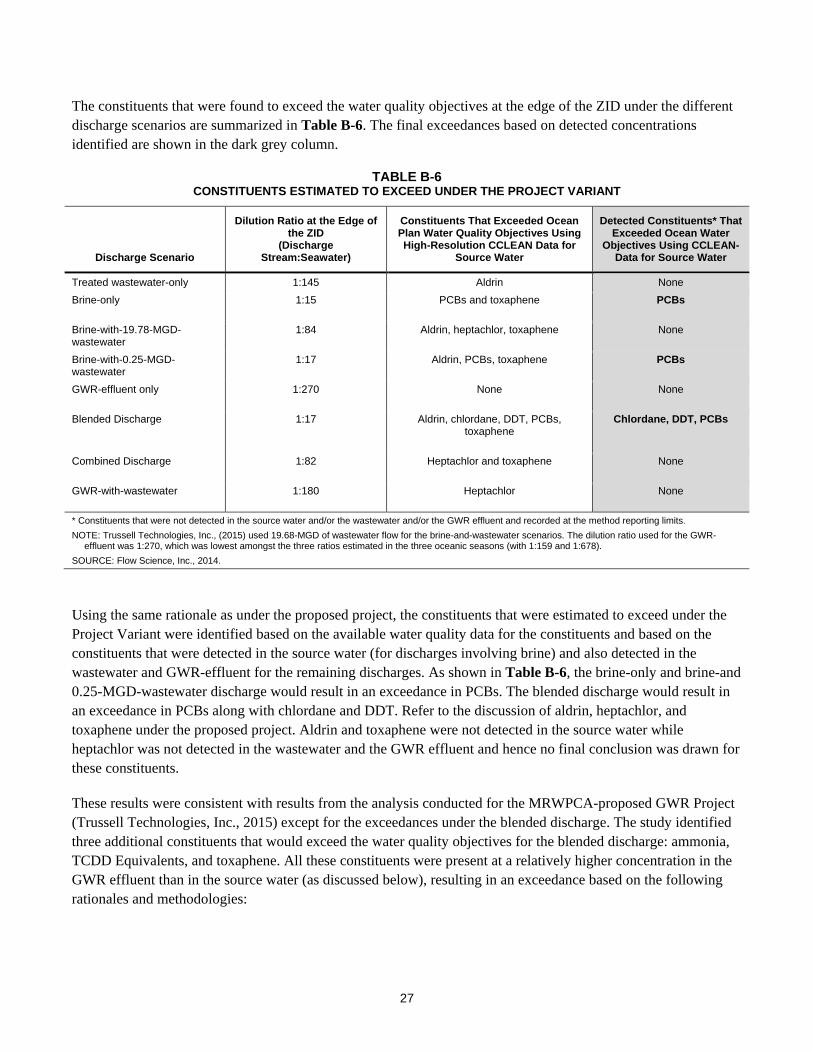
The constituents that were found to exceed the water quality objectives at the edge of the ZID under the different discharge scenarios are summarized in Table B-6. The final exceedances based on detected concentrations identified are shown in the dark grey column.
TABLE B-6 CONSTITUENTS ESTIMATED TO EXCEED UNDER THE PROJECT VARIANT
Discharge Scenario
Dilution Ratio at the Edge of the ZID
(Discharge Stream:Seawater)
Constituents That Exceeded Ocean Plan Water Quality Objectives Using High-Resolution CCLEAN Data for
Source Water
Detected Constituents* That Exceeded Ocean Water
Objectives Using CCLEAN-Data for Source Water
Treated wastewater-only 1:145 Aldrin None Brine-only 1:15 PCBs and toxaphene
PCBs
Brine-with-19.78-MGD-wastewater
1:84 Aldrin, heptachlor, toxaphene
None
Brine-with-0.25-MGD-wastewater
1:17 Aldrin, PCBs, toxaphene
PCBs
GWR-effluent only 1:270 None
None
Blended Discharge 1:17 Aldrin, chlordane, DDT, PCBs, toxaphene
Chlordane, DDT, PCBs
Combined Discharge
1:82 Heptachlor and toxaphene None
GWR-with-wastewater 1:180 Heptachlor
None
* Constituents that were not detected in the source water and/or the wastewater and/or the GWR effluent and recorded at the method reporting limits. NOTE: Trussell Technologies, Inc., (2015) used 19.68-MGD of wastewater flow for the brine-and-wastewater scenarios. The dilution ratio used for the GWR-
effluent was 1:270, which was lowest amongst the three ratios estimated in the three oceanic seasons (with 1:159 and 1:678). SOURCE: Flow Science, Inc., 2014.
Using the same rationale as under the proposed project, the constituents that were estimated to exceed under the Project Variant were identified based on the available water quality data for the constituents and based on the constituents that were detected in the source water (for discharges involving brine) and also detected in the wastewater and GWR-effluent for the remaining discharges. As shown in Table B-6, the brine-only and brine-and 0.25-MGD-wastewater discharge would result in an exceedance in PCBs. The blended discharge would result in an exceedance in PCBs along with chlordane and DDT. Refer to the discussion of aldrin, heptachlor, and toxaphene under the proposed project. Aldrin and toxaphene were not detected in the source water while heptachlor was not detected in the wastewater and the GWR effluent and hence no final conclusion was drawn for these constituents.
These results were consistent with results from the analysis conducted for the MRWPCA-proposed GWR Project (Trussell Technologies, Inc., 2015) except for the exceedances under the blended discharge. The study identified three additional constituents that would exceed the water quality objectives for the blended discharge: ammonia, TCDD Equivalents, and toxaphene. All these constituents were present at a relatively higher concentration in the GWR effluent than in the source water (as discussed below), resulting in an exceedance based on the following rationales and methodologies:
27
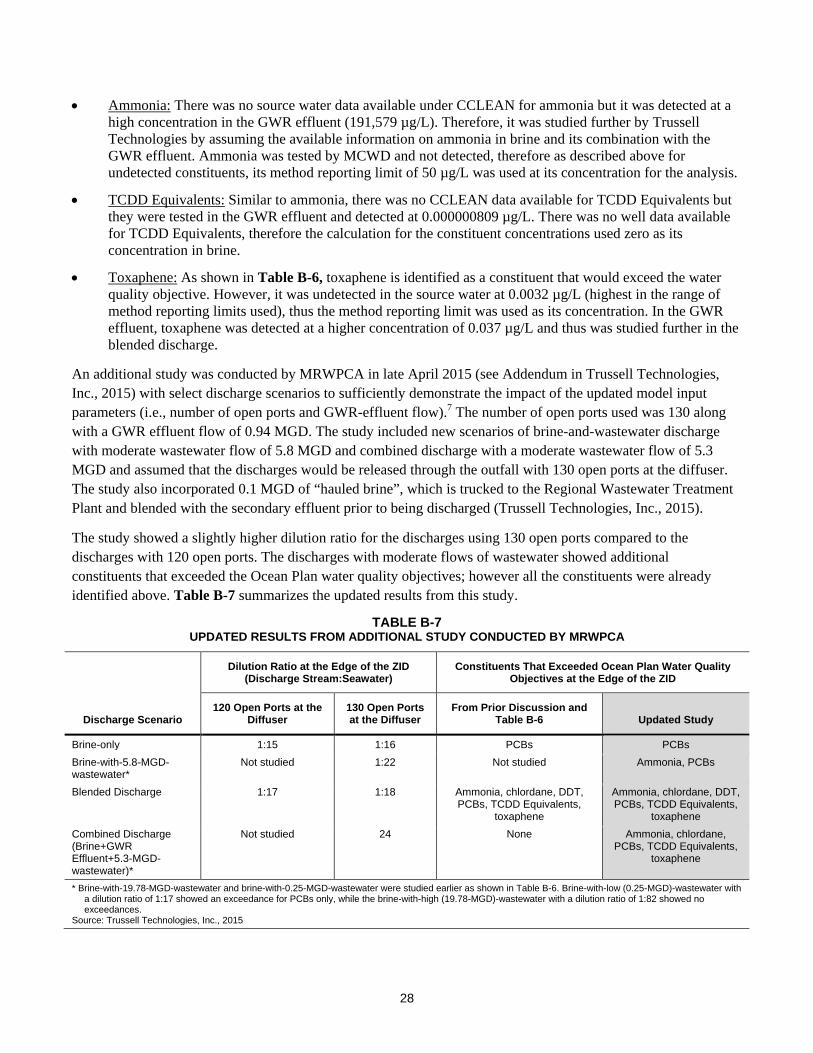
• Ammonia: There was no source water data available under CCLEAN for ammonia but it was detected at a high concentration in the GWR effluent (191,579 µg/L). Therefore, it was studied further by Trussell Technologies by assuming the available information on ammonia in brine and its combination with the GWR effluent. Ammonia was tested by MCWD and not detected, therefore as described above for undetected constituents, its method reporting limit of 50 µg/L was used at its concentration for the analysis.
• TCDD Equivalents: Similar to ammonia, there was no CCLEAN data available for TCDD Equivalents but they were tested in the GWR effluent and detected at 0.000000809 µg/L. There was no well data available for TCDD Equivalents, therefore the calculation for the constituent concentrations used zero as its concentration in brine.
• Toxaphene: As shown in Table B-6, toxaphene is identified as a constituent that would exceed the water quality objective. However, it was undetected in the source water at 0.0032 µg/L (highest in the range of method reporting limits used), thus the method reporting limit was used as its concentration. In the GWR effluent, toxaphene was detected at a higher concentration of 0.037 µg/L and thus was studied further in the blended discharge.
An additional study was conducted by MRWPCA in late April 2015 (see Addendum in Trussell Technologies, Inc., 2015) with select discharge scenarios to sufficiently demonstrate the impact of the updated model input parameters (i.e., number of open ports and GWR-effluent flow).7 The number of open ports used was 130 along with a GWR effluent flow of 0.94 MGD. The study included new scenarios of brine-and-wastewater discharge with moderate wastewater flow of 5.8 MGD and combined discharge with a moderate wastewater flow of 5.3 MGD and assumed that the discharges would be released through the outfall with 130 open ports at the diffuser. The study also incorporated 0.1 MGD of “hauled brine”, which is trucked to the Regional Wastewater Treatment Plant and blended with the secondary effluent prior to being discharged (Trussell Technologies, Inc., 2015).
The study showed a slightly higher dilution ratio for the discharges using 130 open ports compared to the discharges with 120 open ports. The discharges with moderate flows of wastewater showed additional constituents that exceeded the Ocean Plan water quality objectives; however all the constituents were already identified above. Table B-7 summarizes the updated results from this study.
TABLE B-7 UPDATED RESULTS FROM ADDITIONAL STUDY CONDUCTED BY MRWPCA
Discharge Scenario
Dilution Ratio at the Edge of the ZID (Discharge Stream:Seawater)
Constituents That Exceeded Ocean Plan Water Quality Objectives at the Edge of the ZID
120 Open Ports at the Diffuser
130 Open Ports at the Diffuser
From Prior Discussion and Table B-6 Updated Study
Brine-only 1:15 1:16 PCBs PCBs Brine-with-5.8-MGD-wastewater*
Not studied 1:22 Not studied Ammonia, PCBs
Blended Discharge 1:17 1:18 Ammonia, chlordane, DDT, PCBs, TCDD Equivalents,
toxaphene
Ammonia, chlordane, DDT, PCBs, TCDD Equivalents,
toxaphene Combined Discharge (Brine+GWR Effluent+5.3-MGD-wastewater)*
Not studied 24 None Ammonia, chlordane, PCBs, TCDD Equivalents,
toxaphene
* Brine-with-19.78-MGD-wastewater and brine-with-0.25-MGD-wastewater were studied earlier as shown in Table B-6. Brine-with-low (0.25-MGD)-wastewater with a dilution ratio of 1:17 showed an exceedance for PCBs only, while the brine-with-high (19.78-MGD)-wastewater with a dilution ratio of 1:82 showed no exceedances.
Source: Trussell Technologies, Inc., 2015
28
The discharges that showed additional exceedances were the ones that contained moderate wastewater flows. The brine-and-wastewater discharge with 5.8-MGD wastewater flow showed an exceedance in PCBs and ammonia. As previously discussed, the brine-and-low-wastewater (0.25-MGD-wastewater flow) discharge showed an exceedance only in PCBs. This indicates that the additional exceedance in ammonia may be resulting from higher concentration of ammonia in the wastewater (36,400 µg/L) compared to that in the source water entering the Desalination Plant, in addition to its lower dilution ratio and a sinking plume compared to that of the combined discharge with higher-wastewater flow (~20 MGD).
As previously shown, ammonia was not found to exceed its water quality objective under the GWR-effluent-and-wastewater discharge scenario without the brine, or under the brine-with-higher wastewater flows; in both the cases, the discharge resulted in a rising plume with relatively high ocean mixing within the ZID. This potential Ocean Plan exceedance in both the cases emerged when the treated wastewater was not present at a sufficiently higher flow to dilute the brine, and thus the two – brine-with-wastewater and combined – discharges were denser than seawater, forming a sinking plume with relatively low mixing within the ZID. Similarly, as discussed previously, there was no exceedance in ammonia under the brine-with-low-(0.25-MGD)-wastewater discharge scenario, where even though there is relatively low ocean mixing in the ZID, the ammonia concentration in the discharge was less because the wastewater formed a smaller fraction of the overall discharge. The ammonia concentration however increased near the point where the brine was discharged with the highest flow of wastewater that still results in a sinking plume (Trussell Technologies, 2015), in this case 5.8 MGD.
It should be noted that ammonia was already identified as a constituent with potential exceedance (along with several other constituents) under the blended discharge with little or no treated wastewater; and as illustrated by the additional study, the exceedances also apply to brine-and-wastewater discharge with moderate wastewater flow (approximately 5.8 MGD).
The combined discharge (brine-GWR effluent-wastewater) with moderate wastewater flows (5.3 MGD) showed an exceedance in ammonia, chlordane, PCBs, TCDD Equivalents, and toxaphene when as previously discussed the same discharge with high (19.78-MGD) wastewater flows showed no exceedances. All of these constituents were reported at higher concentrations in the wastewater and GWR effluent compared to that in the source water entering the Desalination Plant (see Table B-2). Despite the higher concentrations, the higher wastewater flow in the previously studied combined discharge contributed to the buoyancy and a higher dilution ratio of 1:82 for the discharge and the resulting rising plume, whereas the new combined discharge with lower wastewater flows (5.3 MGD compared to 19.78-MGD) showed a lower dilution ratio (1:24) and higher density of the discharge resulting from the moderate (5.3 MGD) wastewater flows. The discharge thus resulted in higher concentrations of ammonia, chlordane, PCBs, TCDD Equivalents, and toxaphene. The potential Ocean Plan exceedances for the discharge emerged when the treated wastewater (at 5.3 MGD) was not present at a sufficiently higher flow to dilute the brine, and thus the combined discharge was denser than seawater, forming a sinking plume with relatively low mixing within the ZID. Similar to ammonia, it should be noted that chlordane, chlordane, PCBs, TCDD Equivalents, and toxaphene were already identified to exceed the water quality objectives under the blended discharge and as illustrated by the additional study, these exceedances also apply to the combined discharge with moderate wastewater flow (approximately 5.3 MGD).
The comparison between the constituent concentrations at the edge of the ZID from the discharges and the water quality objectives could be made only based on the constituents that were tested and recorded at a detected value. Therefore, based on the available data and the results from its analysis, this memorandum identifies the
29
constituents that are estimated to exceed the Ocean Plan water quality objectives by using 1) the high-resolution data collected under CCLEAN and 2) constituents that were detected in the source water, GWR effluent, and wastewater.
Consistent with the study conducted for the Project Variant as part of the MRWPCA-proposed GWR Project, exceedances were also based on the following: In the case of constituents that were not detected in the source water or not tested under CCLEAN or by MCWD, but were found at a higher concentration in GWR effluent or wastewater compared to the source water, they were studied further and any exceedances were noted.
Conclusion This analysis concludes that the following constituents would potentially exceed the Ocean Plan water quality objectives:
• The proposed project would result in an exceedance in PCBs under the brine-only and brine-and-wastewater discharge (under low – 0.25-MGD – wastewater flows), and exceedances in PCBs and ammonia under brine-and- wastewater discharge (under moderate – 5.8-MGD – wastewater flow).
• The Project Variant would result in an exceedance PCBs under the brine-only discharge and brine-and-low wastewater (0.25-MGD) discharge; PCBs and ammonia under the brine-and-moderate wastewater (5.3-MGD) discharge; and ammonia, chlordane, DDT, PCBs, TCDD Equivalents, and toxaphene under the blended discharge. The combined discharge with 5.3-MGD- wastewater would result in an exceedance in ammonia, chlordane, PCBs, TCDD Equivalents, and toxaphene.
References Chiou C. T and D. E. Kile, 2000. Contaminant Sorption by Soil and Bed Sediment – Is There a Difference? USGS
Fact Sheet 087-00, June 2000.
Flow Science Inc., 2014. MRWPCA Brine Discharge Diffuser Analysis, FSI 134302 Draft Technical Memorandum, August 25, 2014.
Hardin, Dane, 2014. Water quality monitoring data collected Central California Long-term Environmental Assessment Network (CCLEAN). Received over email on June 3, 2014.
Monterey Regional Water Pollution Control Agency (MRWPCA), 2013. Influent SVRP-ocean outfall flows 1998-2012 and Wastewater quality data received from MRWPCA, 2013.
State Water Resources Control Board (SWRCB), 2012. Water Quality Control Plan – Ocean Waters of California. California Ocean Plan, 2012. Effective August 19, 2013.
Trussell Technologies, Inc., 2010. Estimate of Brine Water Quality and Additions to Sampling Plan for the Marina Coast Water District.
Trussell Technologies, Inc. 2015. Ocean Plan Compliance Assessment Report for the Pure Water Monterey Groundwater Replenishment Project and Addendum Report. March and April 2015.
30