Embed Size (px)
Citation preview
419
APPENDIX EIGHT Understanding Technologies and
Education Clusters Chapter three of this report focuses on understanding educational technologies and their educational applications. This could not have been possible, without establishing a clear understanding of the technologies themselves. In this appendix we briefly describe a range of technologies of relevance to this study:
• terrestrial radio and television; • satellite bandwidth; • telecommunications; and • computer technologies.
We then focus on education cluster environments specifically, describing each element of the cluster and its associated costs. Finally we consider the technology infrastructure in key educational networks - schools, Multi-purpose Community Centres and Libraries. This appendix has been used as source information to inform the technology options and to generate the costing models used.
TERRESTRIAL BROADCASTING
Terrestrial, as opposed to satellite broadcasting is a ground-based transmission network operation for radio and television. Analogue signals are transmitted from a central transmission station to a local transmitter, which then sends the signal to the receiving equipment, which can either be a radio or television. Each broadcaster has its own in-house transmitter, whose main func tion is to amplify the studio signal in order to make it accessible for broadcasting. This does not necessarily guarantee that the transmitted signal will reach every user, because terrestrial signal operates like a torch beam. If there is an obstacle between the beam and the object of focus (depending on the size and density of that obstacle), less light or no light at all will go through. Geographical features like hills and mountains are the most prevalent and obvious obstacles for the transmission of terrestrial broadcasting. Apart from natural obstacles, terrestrial reach (area of coverage) can be affected by two factors, the power of the transmitter and the type of antenna used by the transmitter.
• The power of the transmitter. Transmitters have a radius of about 60 to 80 kilometres. The stronger the transmitter, the more its radius of coverage. For example, the weakest transmitter will cover a radius of about 60 kilometres, while the strongest will cover 80 kilometres. This means that for every 120 or 160 kilometres there should be at least a transmitter for total or universal coverage otherwise, as is the case now, broadcasting coverage will be limited to those people within the radius of the transmitter.
• The type of antenna used on the transmitter. This can either be a unidirectional antenna (an antenna that is directed to one area of focus) or multidirectional antenna (an antenna that is directed to more than one area of focus). The type of antenna used, determines the percentage of listeners or viewers that can be reached .For example, in the case of terrestrial radio, stations operating within a limited area of broadcast (e.g.
Appendix Eight: Understanding Technologies and Cluster Environments
420
community radio) use unidirectional antennae while those operating within broader areas (national radio) use multidirectio nal antennae.
WHAT TYPE OF SIGNAL CAN BE TRANSMITTED?
Although currently there is a mix between analogue and digital terrestrial transmission, South Africa's terrestrial broadcasting signal is mainly analogue. Our broadcasting network is still at its testing stages of Digital Terrestrial Television (DTT) and Digital Audio Broadcasting (DAB) through Sentech's latest service. When the necessary infrastructure is in place, set-top-boxes may be used to gain digital broadcasting on radio and television without the broadcasters having to change the main transmitters, the user will have to use digital radios, digital televisions or a set-top-box, to convert analogue signal to digital. Sentech plans to transmit digital signals terrestrially within the next ten years. All SABC channels are part of the DStv suite and therefore are available digitally. They are transmitted as analogue for the terrestrial television network. MNET channels are transmitted both via satellite on DStv and terrestrially. The MNET signal is digital in both cases and encrypted. As mentioned before, terrestrial broadcasting is limited to those people within the radius of the transmitter. For terrestrial broadcasting to have a 100% reach, transmitters must be erected for every 120 or 160 kilometers. This can be a costly and futile exercise for the broadcaster. At the rate that satellite transmission is going and the digital innovations it brings with, there is not much room for developing on terrestrial broadcasting and its analogue signal except to gradually disassociate from it. Compared to satellite, terrestrial broadcasting has limited bandwidth. Therefore only limited amounts of data can be transmitted.
WHO PROVIDES TERRESTRIAL BROADCASTING SERVICES?
Both radio and television signals are broadcast terrestrially. Terrestrial television uses radio and microwave techniques to transmit a composite signal of amplitude modulated (AM) pictures and frequency modulated (FM) audio via an antenna which covers a geographical limited area by line-of-sight. A receiving antenna enables the decoded picture signal to be displayed on a television screen and the audio signal through a loudspeaker. The International Telecommunications Union allocates frequencies for terrestrial broadcasting to individual governments, who then reallocate bandwidths to broadcasting corporations. Sentech describes itself as the backbone of broadcasting in South African, as it owns and operates approximately 180 terrestrial transmitter sites, where short wave, medium wave, FM, television and more than 1200 Multi-channel Multipoint Distribution System (MMDS) transmitters are accommodated to serve the various broadcasters in South Africa. 1 Sentech has a network of transmitting stations scattered through out the country. Some transmit FM radio and television signals while other transmit either one of these or modulated frequency (MF) signals.
1 Sentech (1999) Profile of Sentech Pty. Ltd. p.1.
Appendix Eight: Understanding Technologies and Cluster Environments
421
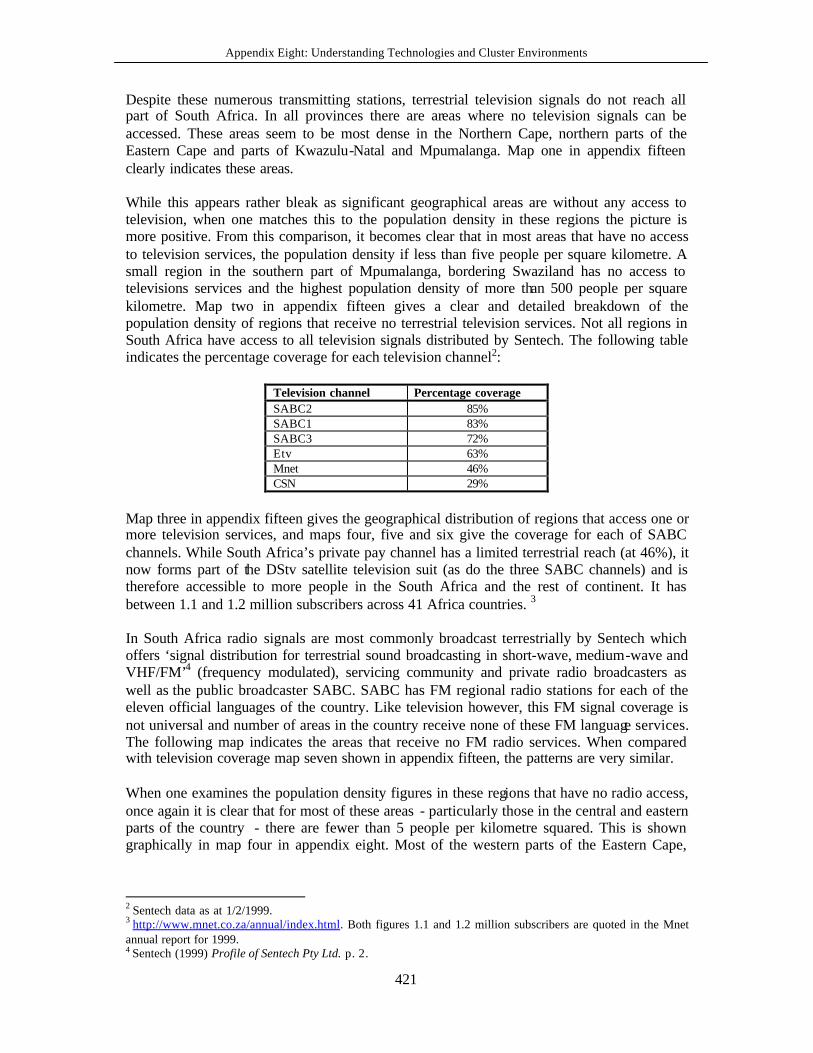
Despite these numerous transmitting stations, terrestrial television signals do not reach all part of South Africa. In all provinces there are areas where no television signals can be accessed. These areas seem to be most dense in the Northern Cape, northern parts of the Eastern Cape and parts of Kwazulu-Natal and Mpumalanga. Map one in appendix fifteen clearly indicates these areas. While this appears rather bleak as significant geographical areas are without any access to television, when one matches this to the population density in these regions the picture is more positive. From this comparison, it becomes clear that in most areas that have no access to television services, the population density if less than five people per square kilometre. A small region in the southern part of Mpumalanga, bordering Swaziland has no access to televisions services and the highest population density of more than 500 people per square kilometre. Map two in appendix fifteen gives a clear and detailed breakdown of the population density of regions that receive no terrestrial television services. Not all regions in South Africa have access to all television signals distributed by Sentech. The following table indicates the percentage coverage for each television channel2:
Television channel Percentage coverage SABC2 85% SABC1 83% SABC3 72% Etv 63% Mnet 46% CSN 29%
Map three in appendix fifteen gives the geographical distribution of regions that access one or more television services, and maps four, five and six give the coverage for each of SABC channels. While South Africa’s private pay channel has a limited terrestrial reach (at 46%), it now forms part of the DStv satellite television suit (as do the three SABC channels) and is therefore accessible to more people in the South Africa and the rest of continent. It has between 1.1 and 1.2 million subscribers across 41 Africa countries. 3 In South Africa radio signals are most commonly broadcast terrestrially by Sentech which offers ‘signal distribution for terrestrial sound broadcasting in short-wave, medium-wave and VHF/FM’4 (frequency modulated), servicing community and private radio broadcasters as well as the public broadcaster SABC. SABC has FM regional radio stations for each of the eleven official languages of the country. Like television however, this FM signal coverage is not universal and number of areas in the country receive none of these FM language services. The following map indicates the areas that receive no FM radio services. When compared with television coverage map seven shown in appendix fifteen, the patterns are very similar. When one examines the population density figures in these regions that have no radio access, once again it is clear that for most of these areas - particularly those in the central and eastern parts of the country - there are fewer than 5 people per kilometre squared. This is shown graphically in map four in appendix eight. Most of the western parts of the Eastern Cape,
2 Sentech data as at 1/2/1999. 3 http://www.mnet.co.za/annual/index.html. Both figures 1.1 and 1.2 million subscribers are quoted in the Mnet annual report for 1999. 4 Sentech (1999) Profile of Sentech Pty Ltd. p. 2.
Appendix Eight: Understanding Technologies and Cluster Environments
422
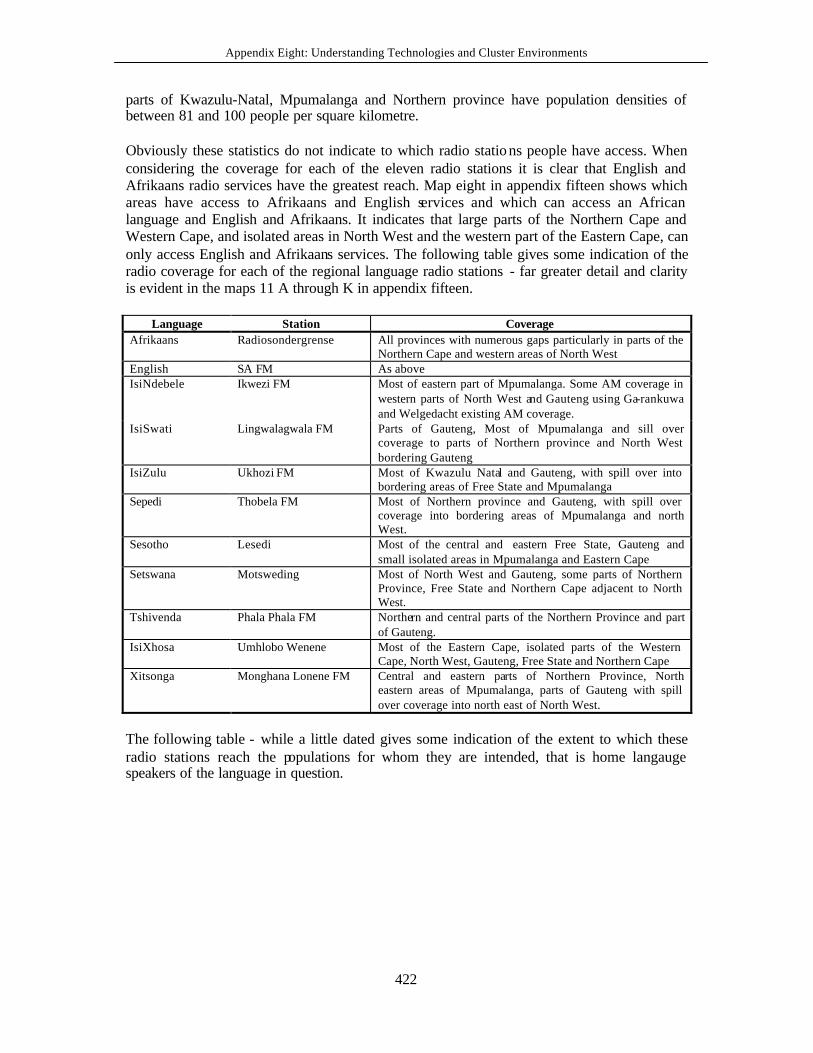
parts of Kwazulu-Natal, Mpumalanga and Northern province have population densities of between 81 and 100 people per square kilometre. Obviously these statistics do not indicate to which radio statio ns people have access. When considering the coverage for each of the eleven radio stations it is clear that English and Afrikaans radio services have the greatest reach. Map eight in appendix fifteen shows which areas have access to Afrikaans and English services and which can access an African language and English and Afrikaans. It indicates that large parts of the Northern Cape and Western Cape, and isolated areas in North West and the western part of the Eastern Cape, can only access English and Afrikaans services. The following table gives some indication of the radio coverage for each of the regional language radio stations - far greater detail and clarity is evident in the maps 11 A through K in appendix fifteen.
Language Station Coverage Afrikaans Radiosondergrense All provinces with numerous gaps particularly in parts of the
Northern Cape and western areas of North West English SA FM As above IsiNdebele Ikwezi FM Most of eastern part of Mpumalanga. Some AM coverage in
western parts of North West and Gauteng using Ga-rankuwa and Welgedacht existing AM coverage.
IsiSwati Lingwalagwala FM Parts of Gauteng, Most of Mpumalanga and sill over coverage to parts of Northern province and North West bordering Gauteng
IsiZulu Ukhozi FM Most of Kwazulu Natal and Gauteng, with spill over into bordering areas of Free State and Mpumalanga
Sepedi Thobela FM Most of Northern province and Gauteng, with spill over coverage into bordering areas of Mpumalanga and north West.
Sesotho Lesedi Most of the central and eastern Free State, Gauteng and small isolated areas in Mpumalanga and Eastern Cape
Setswana Motsweding Most of North West and Gauteng, some parts of Northern Province, Free State and Northern Cape adjacent to North West.
Tshivenda Phala Phala FM Northern and central parts of the Northern Province and part of Gauteng.
IsiXhosa Umhlobo Wenene Most of the Eastern Cape, isolated parts of the Western Cape, North West, Gauteng, Free State and Northern Cape
Xitsonga Monghana Lonene FM Central and eastern parts of Northern Province, North eastern areas of Mpumalanga, parts of Gauteng with spill over coverage into north east of North West.
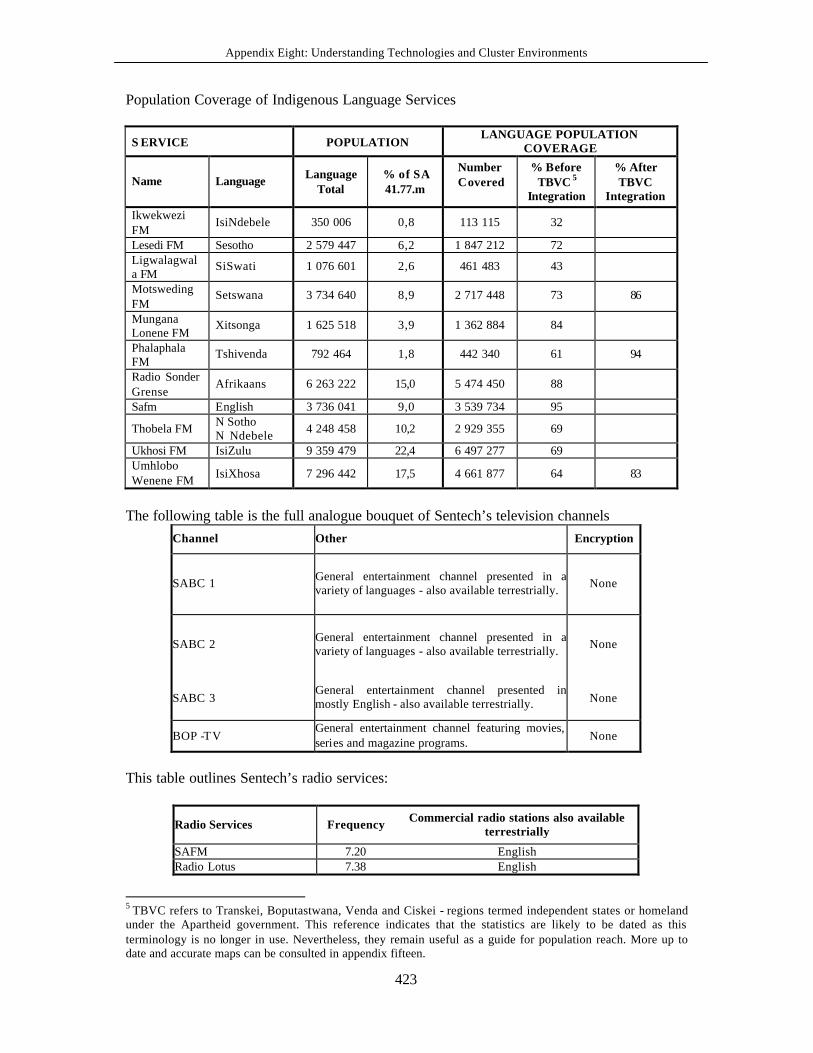
The following table - while a little dated gives some indication of the extent to which these radio stations reach the populations for whom they are intended, that is home langauge speakers of the language in question.
Appendix Eight: Understanding Technologies and Cluster Environments
423
Population Coverage of Indigenous Language Services
S ERVICE POPULATION LANGUAGE POPULATION
COVERAGE
Name Language Language Total
% of SA 41.77.m
Number Covered
% Before TBVC 5
Integration
% After TBVC
Integration
Ikwekwezi FM
IsiNdebele 350 006 0,8 113 115 32
Lesedi FM Sesotho 2 579 447 6,2 1 847 212 72 Ligwalagwala FM
SiSwati 1 076 601 2,6 461 483 43
Motsweding FM
Setswana 3 734 640 8,9 2 717 448 73 86
Mungana Lonene FM
Xitsonga 1 625 518 3,9 1 362 884 84
Phalaphala FM
Tshivenda 792 464 1,8 442 340 61 94
Radio Sonder Grense
Afrikaans 6 263 222 15,0 5 474 450 88
Safm English 3 736 041 9,0 3 539 734 95
Thobela FM N Sotho N Ndebele 4 248 458 10,2 2 929 355 69
Ukhosi FM IsiZulu 9 359 479 22,4 6 497 277 69 Umhlobo Wenene FM IsiXhosa 7 296 442 17,5 4 661 877 64 83
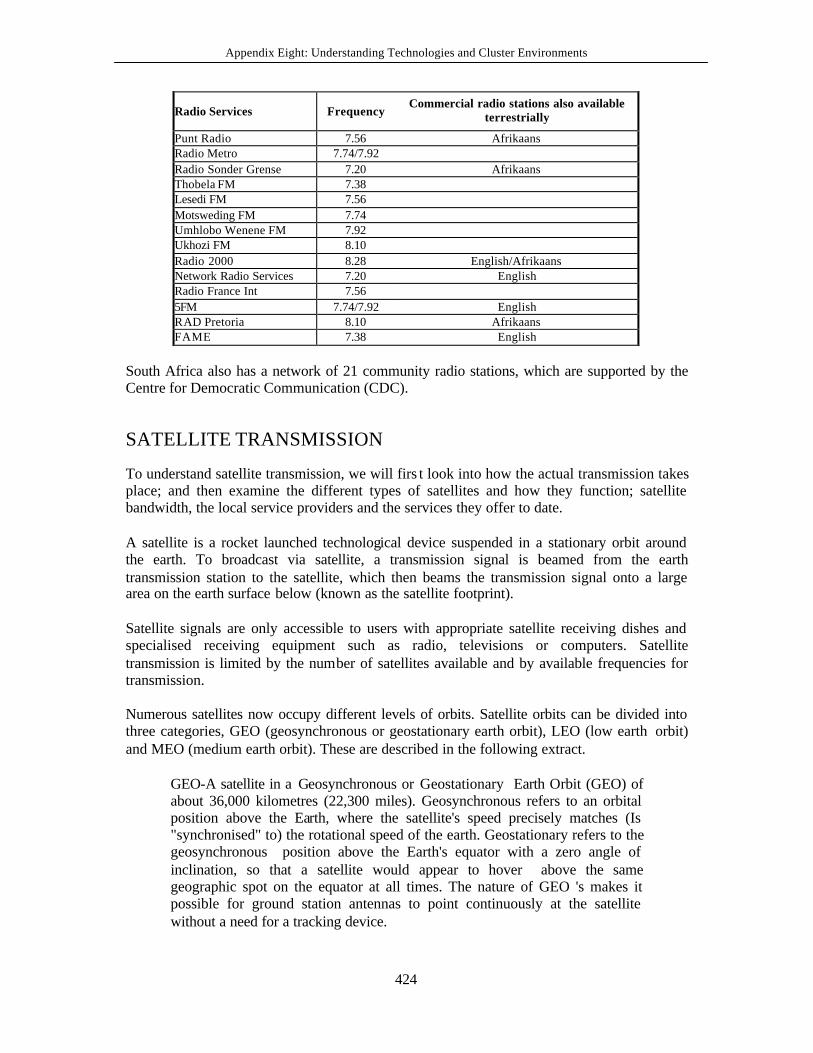
The following table is the full analogue bouquet of Sentech’s television channels
Channel Other Encryption
SABC 1 General entertainment channel presented in a variety of languages - also available terrestrially. None
SABC 2 General entertainment channel presented in a variety of languages - also available terrestrially. None
SABC 3 General entertainment channel presented in mostly English - also available terrestrially. None
BOP -TV General entertainment channel featuring movies, series and magazine programs. None
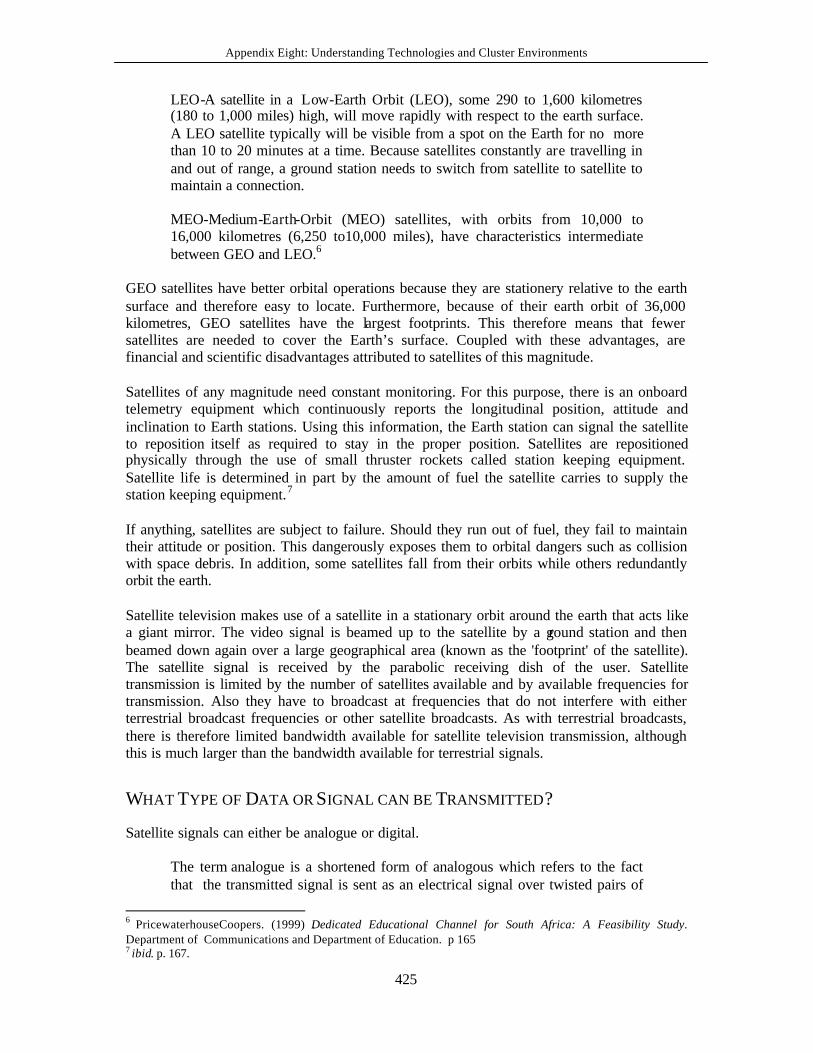
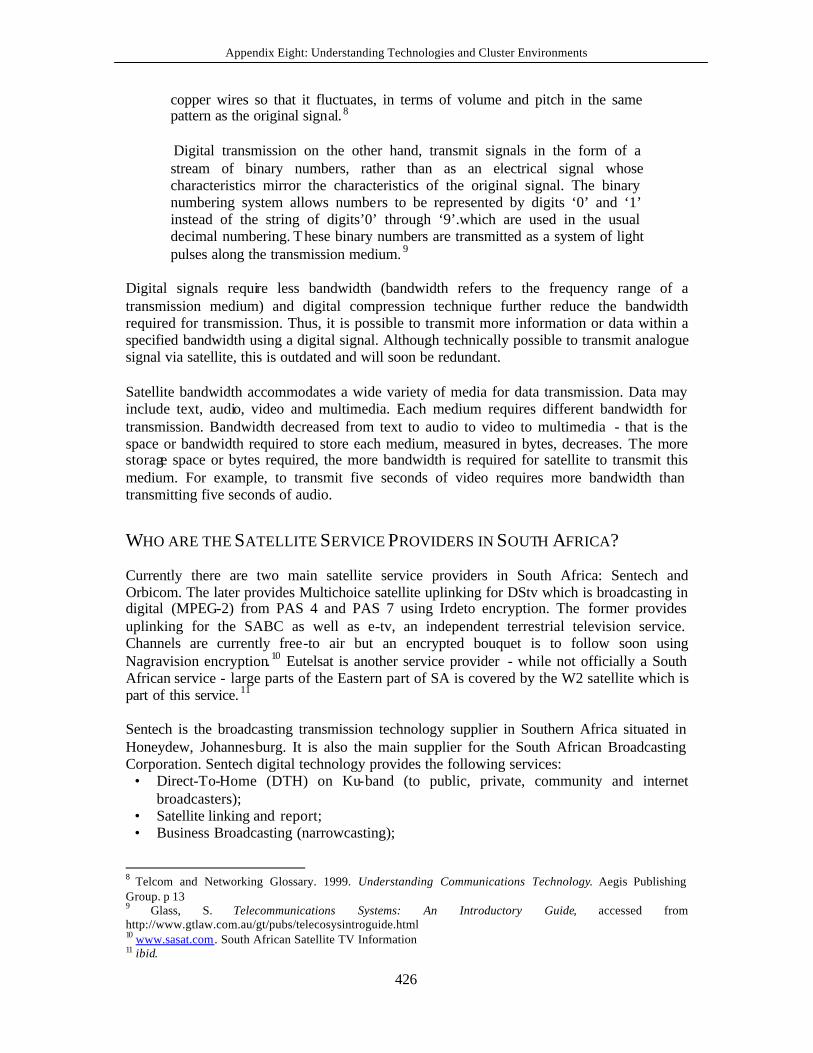
This table outlines Sentech’s radio services:
Radio Services Frequency Commercial radio stations also available terrestrially
SAFM 7.20 English Radio Lotus 7.38 English
5 TBVC refers to Transkei, Boputastwana, Venda and Ciskei - regions termed independent states or homeland under the Apartheid government. This reference indicates that the statistics are likely to be dated as this terminology is no longer in use. Nevertheless, they remain useful as a guide for population reach. More up to date and accurate maps can be consulted in appendix fifteen.
Appendix Eight: Understanding Technologies and Cluster Environments
424
Radio Services Frequency Commercial radio stations also available
terrestrially
Punt Radio 7.56 Afrikaans Radio Metro 7.74/7.92 Radio Sonder Grense 7.20 Afrikaans Thobela FM 7.38 Lesedi FM 7.56 Motsweding FM 7.74 Umhlobo Wenene FM 7.92 Ukhozi FM 8.10 Radio 2000 8.28 English/Afrikaans Network Radio Services 7.20 English Radio France Int 7.56 5FM 7.74/7.92 English RAD Pretoria 8.10 Afrikaans FAME 7.38 English
South Africa also has a network of 21 community radio stations, which are supported by the Centre for Democratic Communication (CDC).
SATELLITE TRANSMISSION
To understand satellite transmission, we will firs t look into how the actual transmission takes place; and then examine the different types of satellites and how they function; satellite bandwidth, the local service providers and the services they offer to date. A satellite is a rocket launched technological device suspended in a stationary orbit around the earth. To broadcast via satellite, a transmission signal is beamed from the earth transmission station to the satellite, which then beams the transmission signal onto a large area on the earth surface below (known as the satellite footprint). Satellite signals are only accessible to users with appropriate satellite receiving dishes and specialised receiving equipment such as radio, televisions or computers. Satellite transmission is limited by the number of satellites available and by available frequencies for transmission. Numerous satellites now occupy different levels of orbits. Satellite orbits can be divided into three categories, GEO (geosynchronous or geostationary earth orbit), LEO (low earth orbit) and MEO (medium earth orbit). These are described in the following extract.
GEO-A satellite in a Geosynchronous or Geostationary Earth Orbit (GEO) of about 36,000 kilometres (22,300 miles). Geosynchronous refers to an orbital position above the Earth, where the satellite's speed precisely matches (Is "synchronised" to) the rotational speed of the earth. Geostationary refers to the geosynchronous position above the Earth's equator with a zero angle of inclination, so that a satellite would appear to hover above the same geographic spot on the equator at all times. The nature of GEO 's makes it possible for ground station antennas to point continuously at the satellite without a need for a tracking device.
Appendix Eight: Understanding Technologies and Cluster Environments
425
LEO-A satellite in a Low-Earth Orbit (LEO), some 290 to 1,600 kilometres (180 to 1,000 miles) high, will move rapidly with respect to the earth surface. A LEO satellite typically will be visible from a spot on the Earth for no more than 10 to 20 minutes at a time. Because satellites constantly are travelling in and out of range, a ground station needs to switch from satellite to satellite to maintain a connection.
MEO-Medium-Earth-Orbit (MEO) satellites, with orbits from 10,000 to 16,000 kilometres (6,250 to10,000 miles), have characteristics intermediate between GEO and LEO.6
GEO satellites have better orbital operations because they are stationery relative to the earth surface and therefore easy to locate. Furthermore, because of their earth orbit of 36,000 kilometres, GEO satellites have the largest footprints. This therefore means that fewer satellites are needed to cover the Earth’s surface. Coupled with these advantages, are financial and scientific disadvantages attributed to satellites of this magnitude. Satellites of any magnitude need constant monitoring. For this purpose, there is an onboard telemetry equipment which continuously reports the longitudinal position, attitude and inclination to Earth stations. Using this information, the Earth station can signal the satellite to reposition itself as required to stay in the proper position. Satellites are repositioned physically through the use of small thruster rockets called station keeping equipment. Satellite life is determined in part by the amount of fuel the satellite carries to supply the station keeping equipment.7 If anything, satellites are subject to failure. Should they run out of fuel, they fail to maintain their attitude or position. This dangerously exposes them to orbital dangers such as collision with space debris. In addition, some satellites fall from their orbits while others redundantly orbit the earth. Satellite television makes use of a satellite in a stationary orbit around the earth that acts like a giant mirror. The video signal is beamed up to the satellite by a ground station and then beamed down again over a large geographical area (known as the 'footprint' of the satellite). The satellite signal is received by the parabolic receiving dish of the user. Satellite transmission is limited by the number of satellites available and by available frequencies for transmission. Also they have to broadcast at frequencies that do not interfere with either terrestrial broadcast frequencies or other satellite broadcasts. As with terrestrial broadcasts, there is therefore limited bandwidth available for satellite television transmission, although this is much larger than the bandwidth available for terrestrial signals.
WHAT TYPE OF DATA OR SIGNAL CAN BE TRANSMITTED?
Satellite signals can either be analogue or digital. The term analogue is a shortened form of analogous which refers to the fact that the transmitted signal is sent as an electrical signal over twisted pairs of
6 PricewaterhouseCoopers. (1999) .Dedicated Educational Channel for South Africa: A Feasibility Study. Department of Communications and Department of Education. p 165 7 ibid. p. 167.
Appendix Eight: Understanding Technologies and Cluster Environments
426
copper wires so that it fluctuates, in terms of volume and pitch in the same pattern as the original signal.8 Digital transmission on the other hand, transmit signals in the form of a stream of binary numbers, rather than as an electrical signal whose characteristics mirror the characteristics of the original signal. The binary numbering system allows numbers to be represented by digits ‘0’ and ‘1’ instead of the string of digits’0’ through ‘9’.which are used in the usual decimal numbering. These binary numbers are transmitted as a system of light pulses along the transmission medium. 9
Digital signals require less bandwidth (bandwidth refers to the frequency range of a transmission medium) and digital compression technique further reduce the bandwidth required for transmission. Thus, it is possible to transmit more information or data within a specified bandwidth using a digital signal. Although technically possible to transmit analogue signal via satellite, this is outdated and will soon be redundant. Satellite bandwidth accommodates a wide variety of media for data transmission. Data may include text, audio, video and multimedia. Each medium requires different bandwidth for transmission. Bandwidth decreased from text to audio to video to multimedia - that is the space or bandwidth required to store each medium, measured in bytes, decreases. The more storage space or bytes required, the more bandwidth is required for satellite to transmit this medium. For example, to transmit five seconds of video requires more bandwidth than transmitting five seconds of audio.
WHO ARE THE SATELLITE SERVICE PROVIDERS IN SOUTH AFRICA?
Currently there are two main satellite service providers in South Africa: Sentech and Orbicom. The later provides Multichoice satellite uplinking for DStv which is broadcasting in digital (MPEG-2) from PAS 4 and PAS 7 using Irdeto encryption. The former provides uplinking for the SABC as well as e-tv, an independent terrestrial television service. Channels are currently free-to air but an encrypted bouquet is to follow soon using Nagravision encryption.10 Eutelsat is another service provider - while not officially a South African service - large parts of the Eastern part of SA is covered by the W2 satellite which is part of this service. 11 Sentech is the broadcasting transmission technology supplier in Southern Africa situated in Honeydew, Johannesburg. It is also the main supplier for the South African Broadcasting Corporation. Sentech digital technology provides the following services:
• Direct-To-Home (DTH) on Ku-band (to public, private, community and internet broadcasters);
• Satellite linking and report; • Business Broadcasting (narrowcasting);
8 Telcom and Networking Glossary. 1999. Understanding Communications Technology. Aegis Publishing Group. p 13 9 Glass, S. Telecommunications Systems: An Introductory Guide, accessed from http://www.gtlaw.com.au/gt/pubs/telecosysintroguide.html 10 www.sasat.com. South African Satellite TV Information 11 ibid.
Appendix Eight: Understanding Technologies and Cluster Environments
427
• Internet Distance Learning; and • Datacasting and internetworking via satellite.
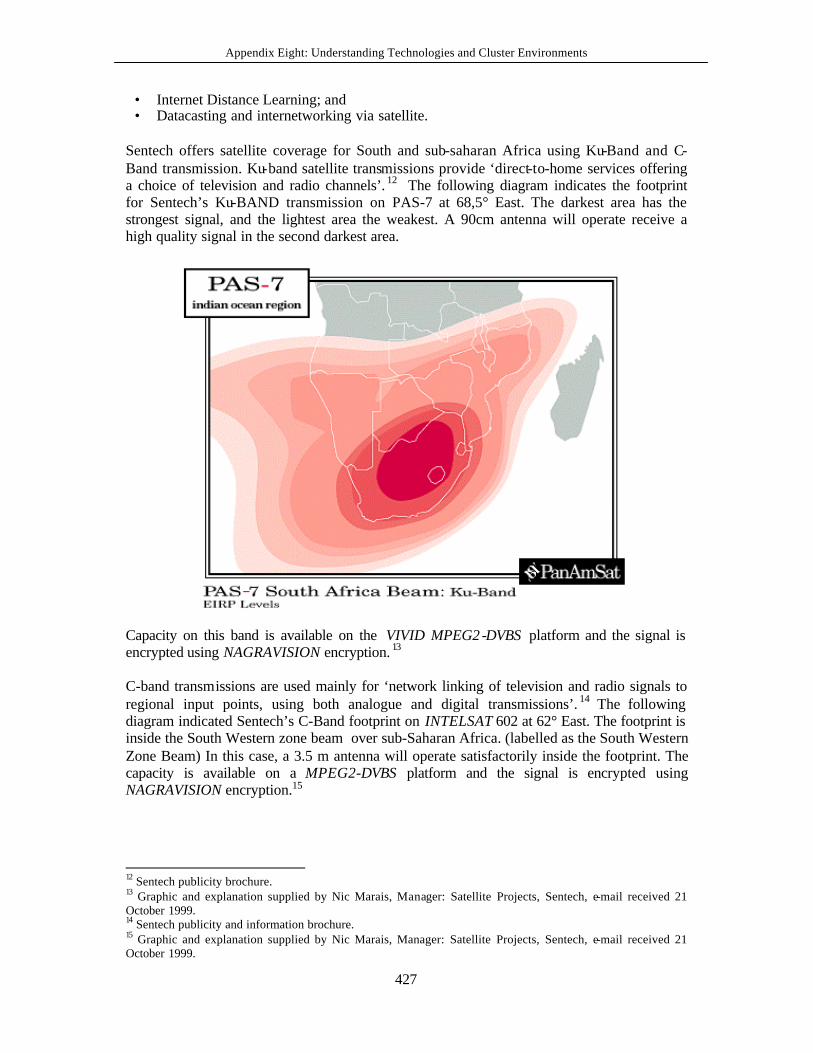
Sentech offers satellite coverage for South and sub-saharan Africa using Ku-Band and C-Band transmission. Ku-band satellite transmissions provide ‘direct-to-home services offering a choice of television and radio channels’. 12 The following diagram indicates the footprint for Sentech’s Ku-BAND transmission on PAS-7 at 68,5° East. The darkest area has the strongest signal, and the lightest area the weakest. A 90cm antenna will operate receive a high quality signal in the second darkest area.
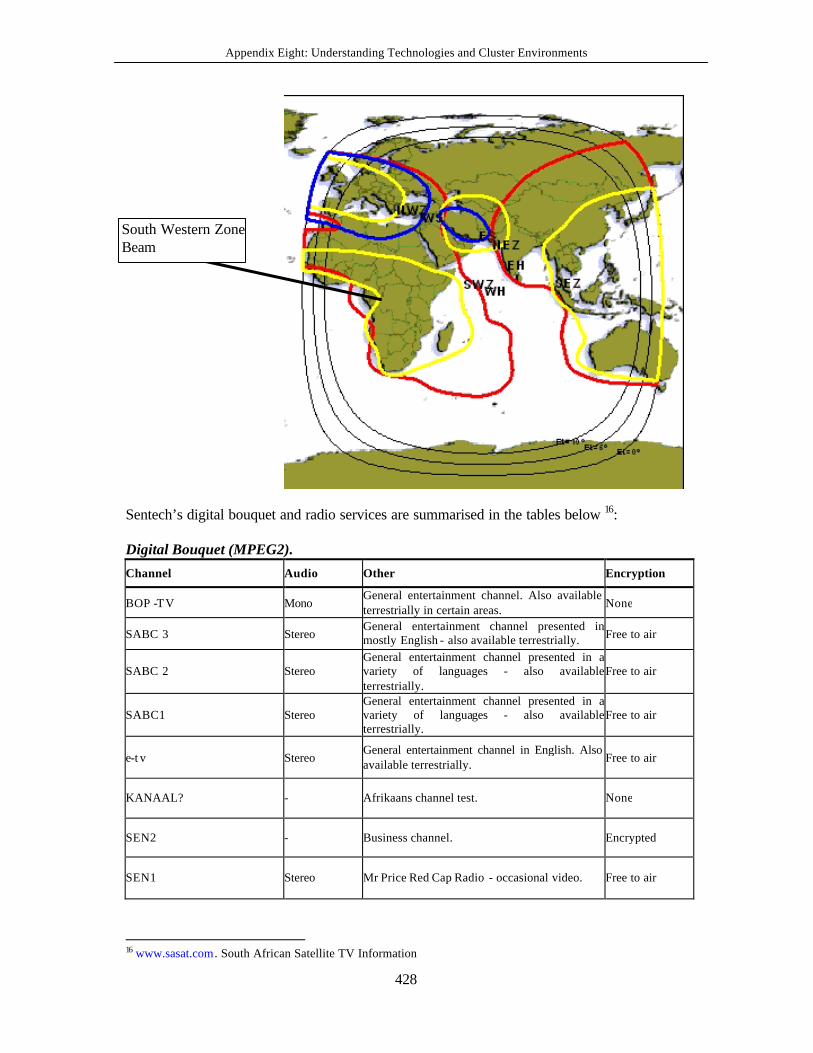
Capacity on this band is available on the VIVID MPEG2 -DVBS platform and the signal is encrypted using NAGRAVISION encryption. 13 C-band transmissions are used mainly for ‘network linking of television and radio signals to regional input points, using both analogue and digital transmissions’. 14 The following diagram indicated Sentech’s C-Band footprint on INTELSAT 602 at 62° East. The footprint is inside the South Western zone beam over sub-Saharan Africa. (labelled as the South Western Zone Beam) In this case, a 3.5 m antenna will operate satisfactorily inside the footprint. The capacity is available on a MPEG2-DVBS platform and the signal is encrypted using NAGRAVISION encryption.15
12 Sentech publicity brochure. 13 Graphic and explanation supplied by Nic Marais, Manager: Satellite Projects, Sentech, e-mail received 21 October 1999. 14 Sentech publicity and information brochure. 15 Graphic and explanation supplied by Nic Marais, Manager: Satellite Projects, Sentech, e-mail received 21 October 1999.
Appendix Eight: Understanding Technologies and Cluster Environments
428
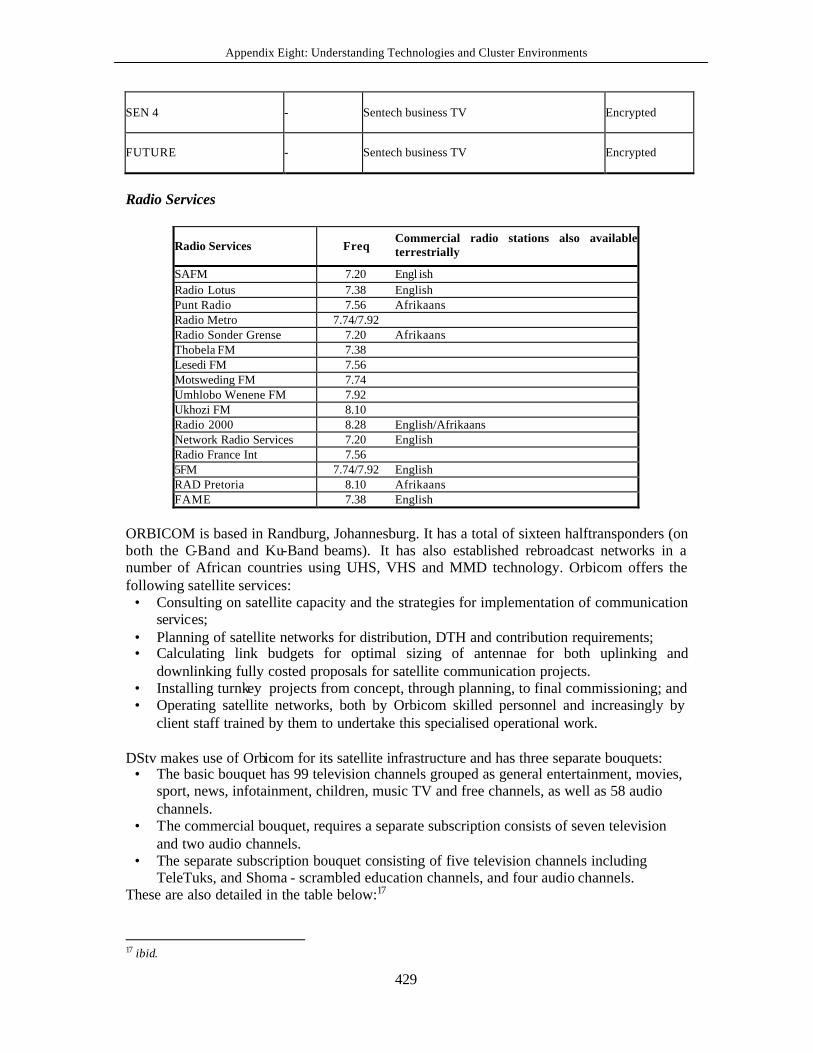
Sentech’s digital bouquet and radio services are summarised in the tables below 16: Digital Bouquet (MPEG2).
Channel Audio Other Encryption
BOP -TV Mono General entertainment channel. Also available terrestrially in certain areas. None
SABC 3 Stereo General entertainment channel presented in mostly English - also available terrestrially. Free to air
SABC 2 Stereo General entertainment channel presented in a variety of languages - also available terrestrially.
Free to air
SABC1 Stereo General entertainment channel presented in a variety of languages - also available terrestrially.
Free to air
e-t v Stereo General entertainment channel in English. Also available terrestrially. Free to air
KANAAL? - Afrikaans channel test. None
SEN2 - Business channel. Encrypted
SEN1 Stereo Mr Price Red Cap Radio - occasional video. Free to air
16 www.sasat.com. South African Satellite TV Information
South Western Zone Beam
Appendix Eight: Understanding Technologies and Cluster Environments
429
SEN 4 - Sentech business TV Encrypted
FUTURE - Sentech business TV Encrypted
Radio Services
Radio Services Freq Commercial radio stations also available terrestrially
SAFM 7.20 Engl ish Radio Lotus 7.38 English Punt Radio 7.56 Afrikaans Radio Metro 7.74/7.92 Radio Sonder Grense 7.20 Afrikaans Thobela FM 7.38 Lesedi FM 7.56 Motsweding FM 7.74 Umhlobo Wenene FM 7.92 Ukhozi FM 8.10 Radio 2000 8.28 English/Afrikaans Network Radio Services 7.20 English Radio France Int 7.56 5FM 7.74/7.92 English RAD Pretoria 8.10 Afrikaans FAME 7.38 English
ORBICOM is based in Randburg, Johannesburg. It has a total of sixteen halftransponders (on both the C-Band and Ku-Band beams). It has also established rebroadcast networks in a number of African countries using UHS, VHS and MMD technology. Orbicom offers the following satellite services:
• Consulting on satellite capacity and the strategies for implementation of communication services;
• Planning of satellite networks for distribution, DTH and contribution requirements; • Calculating link budgets for optimal sizing of antennae for both uplinking and
downlinking fully costed proposals for satellite communication projects. • Installing turnkey projects from concept, through planning, to final commissioning; and • Operating satellite networks, both by Orbicom skilled personnel and increasingly by
client staff trained by them to undertake this specialised operational work. DStv makes use of Orbicom for its satellite infrastructure and has three separate bouquets:
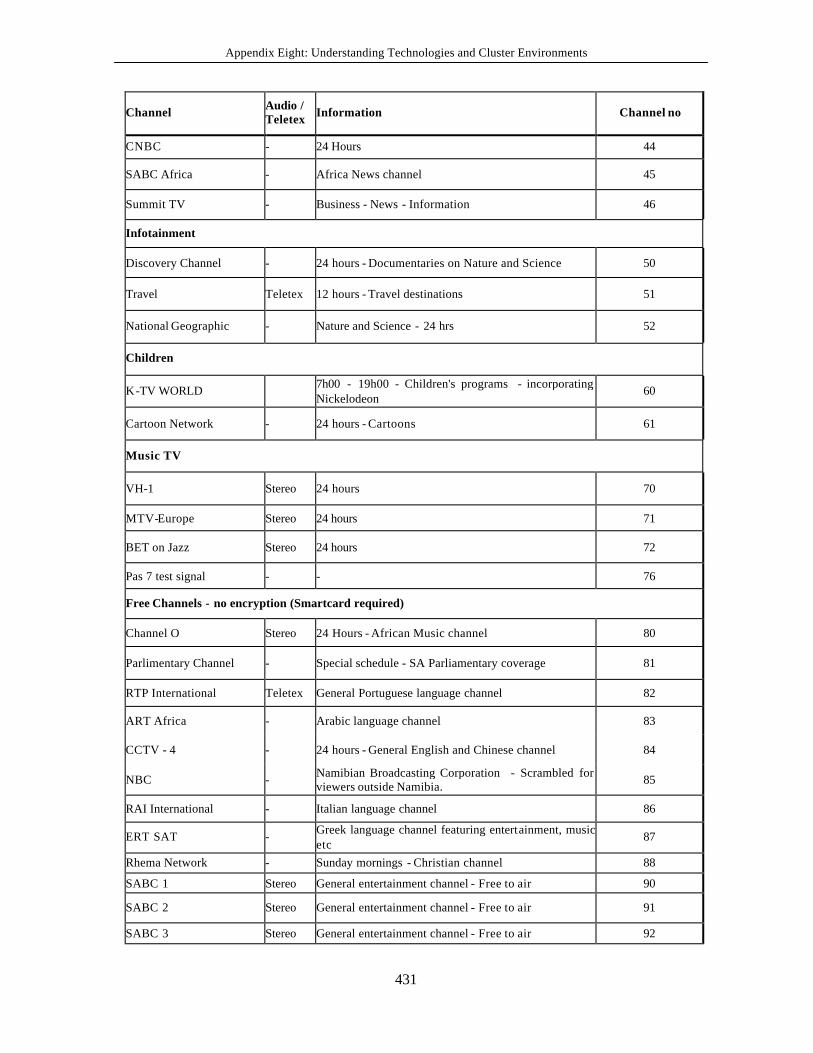
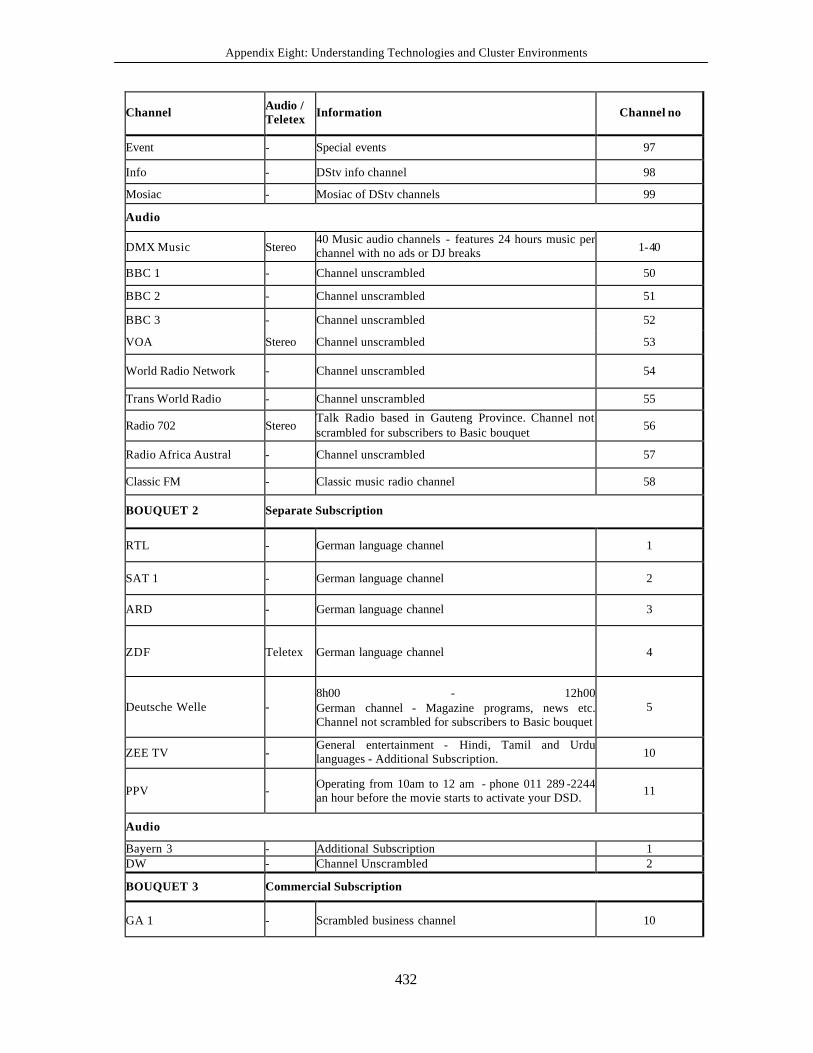
• The basic bouquet has 99 television channels grouped as general entertainment, movies, sport, news, infotainment, children, music TV and free channels, as well as 58 audio channels.
• The commercial bouquet, requires a separate subscription consists of seven television and two audio channels.
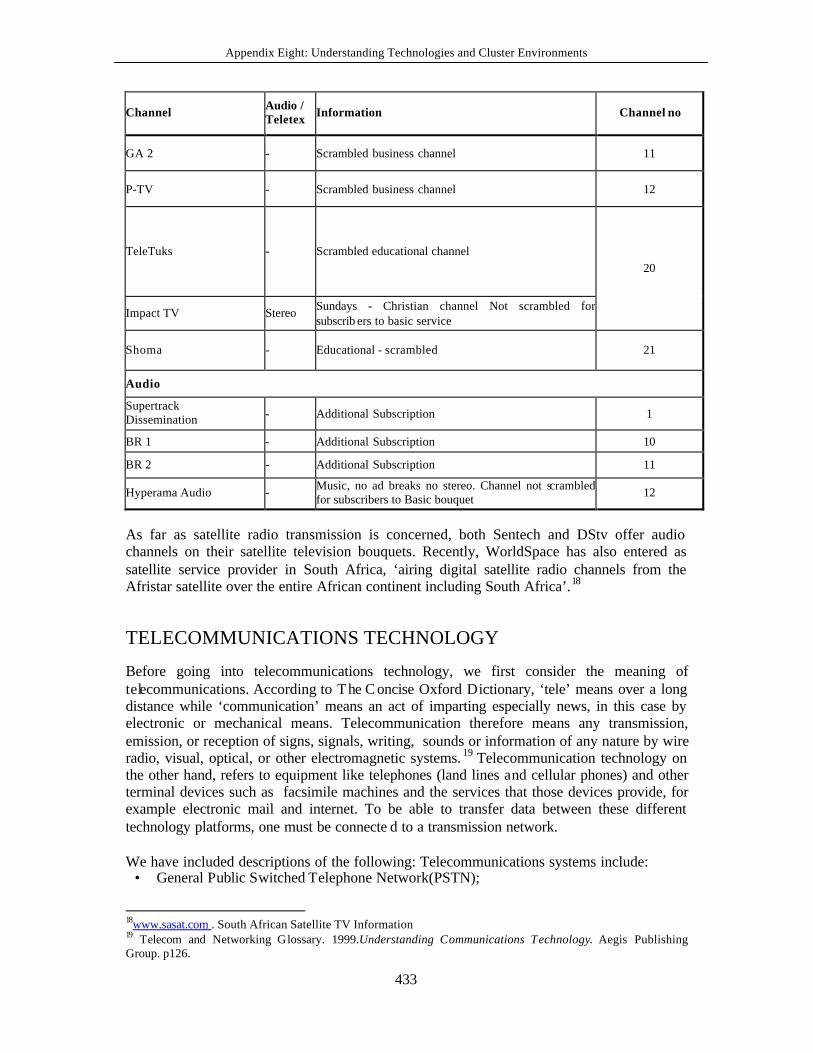
• The separate subscription bouquet consisting of five television channels including TeleTuks, and Shoma - scrambled education channels, and four audio channels.
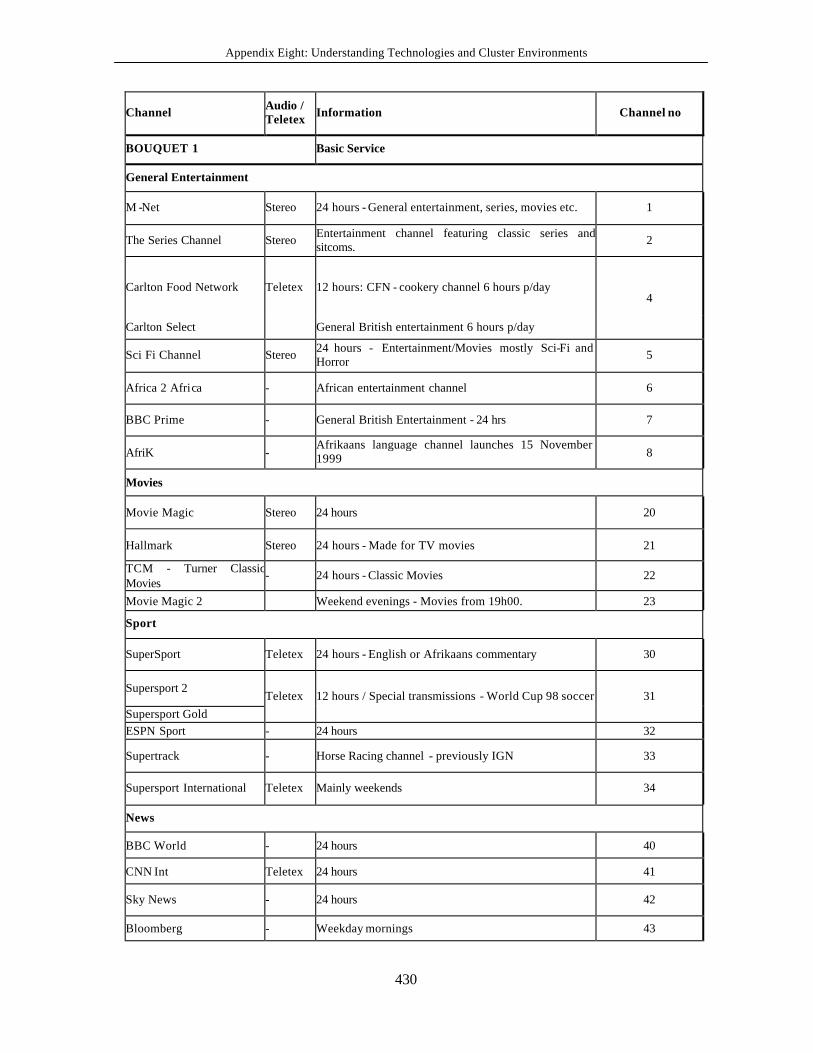
These are also detailed in the table below:17
17 ibid.
Appendix Eight: Understanding Technologies and Cluster Environments
430
Channel Audio / Teletex Information Channel no
BOUQUET 1 Basic Service
General Entertainment
M -Net Stereo 24 hours - General entertainment, series, movies etc. 1
The Series Channel Stereo Entertainment channel featuring classic series and sitcoms. 2
Carlton Food Network Teletex 12 hours: CFN - cookery channel 6 hours p/day
Carlton Select General British entertainment 6 hours p/day
4
Sci Fi Channel Stereo 24 hours - Entertainment/Movies mostly Sci-Fi and Horror 5
Africa 2 Africa - African entertainment channel 6
BBC Prime - General British Entertainment - 24 hrs 7
AfriK - Afrikaans language channel launches 15 November 1999 8
Movies
Movie Magic Stereo 24 hours 20
Hallmark Stereo 24 hours - Made for TV movies 21
TCM - Turner Classic Movies
- 24 hours - Classic Movies 22
Movie Magic 2 Weekend evenings - Movies from 19h00. 23
Sport
SuperSport Teletex 24 hours - English or Afrikaans commentary 30
Supersport 2
Supersport Gold Teletex 12 hours / Special transmissions - World Cup 98 soccer 31
ESPN Sport - 24 hours 32
Supertrack - Horse Racing channel - previously IGN 33
Supersport International Teletex Mainly weekends 34
News
BBC World - 24 hours 40
CNN Int Teletex 24 hours 41
Sky News - 24 hours 42
Bloomberg - Weekday mornings 43
Appendix Eight: Understanding Technologies and Cluster Environments
431
Channel Audio / Teletex Information Channel no
CNBC - 24 Hours 44
SABC Africa - Africa News channel 45
Summit TV - Business - News - Information 46
Infotainment
Discovery Channel - 24 hours - Documentaries on Nature and Science 50
Travel Teletex 12 hours - Travel destinations 51
National Geographic - Nature and Science - 24 hrs 52
Children
K-TV WORLD 7h00 - 19h00 - Children's programs - incorporating Nickelodeon
60
Cartoon Network - 24 hours - Cartoons 61
Music TV
VH-1 Stereo 24 hours 70
MTV-Europe Stereo 24 hours 71
BET on Jazz Stereo 24 hours 72
Pas 7 test signal - - 76
Free Channels - no encryption (Smartcard required)
Channel O Stereo 24 Hours - African Music channel 80
Parlimentary Channel - Special schedule - SA Parliamentary coverage 81
RTP International Teletex General Portuguese language channel 82
ART Africa - Arabic language channel 83
CCTV - 4 - 24 hours - General English and Chinese channel 84
NBC - Namibian Broadcasting Corporation - Scrambled for viewers outside Namibia. 85
RAI International - Italian language channel 86
ERT SAT - Greek language channel featuring entertainment, music etc
87
Rhema Network - Sunday mornings - Christian channel 88
SABC 1 Stereo General entertainment channel - Free to air 90
SABC 2 Stereo General entertainment channel - Free to air 91
SABC 3 Stereo General entertainment channel - Free to air 92
Appendix Eight: Understanding Technologies and Cluster Environments
432
Channel Audio / Teletex Information Channel no
Event - Special events 97
Info - DStv info channel 98
Mosiac - Mosiac of DStv channels 99
Audio
DMX Music Stereo 40 Music audio channels - features 24 hours music per channel with no ads or DJ breaks 1-40
BBC 1 - Channel unscrambled 50
BBC 2 - Channel unscrambled 51
BBC 3 - Channel unscrambled 52
VOA Stereo Channel unscrambled 53
World Radio Network - Channel unscrambled 54
Trans World Radio - Channel unscrambled 55
Radio 702 Stereo Talk Radio based in Gauteng Province. Channel not scrambled for subscribers to Basic bouquet 56
Radio Africa Austral - Channel unscrambled 57
Classic FM - Classic music radio channel 58
BOUQUET 2 Separate Subscription
RTL - German language channel 1
SAT 1 - German language channel 2
ARD - German language channel 3
ZDF Teletex German language channel 4
Deutsche Welle - 8h00 - 12h00German channel - Magazine programs, news etc. Channel not scrambled for subscribers to Basic bouquet
5
ZEE TV - General entertainment - Hindi, Tamil and Urdu languages - Additional Subscription. 10
PPV - Operating from 10am to 12 am - phone 011 289 -2244 an hour before the movie starts to activate your DSD. 11
Audio
Bayern 3 - Additional Subscription 1 DW - Channel Unscrambled 2
BOUQUET 3 Commercial Subscription
GA 1 - Scrambled business channel 10
Appendix Eight: Understanding Technologies and Cluster Environments
433
Channel Audio / Teletex Information Channel no
GA 2 - Scrambled business channel 11
P-TV - Scrambled business channel 12
TeleTuks - Scrambled educational channel
Impact TV Stereo Sundays - Christian channel Not scrambled for subscrib ers to basic service
20
Shoma - Educational - scrambled 21
Audio
Supertrack Dissemination - Additional Subscription 1
BR 1 - Additional Subscription 10
BR 2 - Additional Subscription 11
Hyperama Audio - Music, no ad breaks no stereo. Channel not scrambled for subscribers to Basic bouquet 12
As far as satellite radio transmission is concerned, both Sentech and DStv offer audio channels on their satellite television bouquets. Recently, WorldSpace has also entered as satellite service provider in South Africa, ‘airing digital satellite radio channels from the Afristar satellite over the entire African continent including South Africa’.18
TELECOMMUNICATIONS TECHNOLOGY
Before going into telecommunications technology, we first consider the meaning of telecommunications. According to The C oncise Oxford Dictionary, ‘tele’ means over a long distance while ‘communication’ means an act of imparting especially news, in this case by electronic or mechanical means. Telecommunication therefore means any transmission, emission, or reception of signs, signals, writing, sounds or information of any nature by wire radio, visual, optical, or other electromagnetic systems. 19 Telecommunication technology on the other hand, refers to equipment like telephones (land lines and cellular phones) and other terminal devices such as facsimile machines and the services that those devices provide, for example electronic mail and internet. To be able to transfer data between these different technology platforms, one must be connecte d to a transmission network. We have included descriptions of the following: Telecommunications systems include:
• General Public Switched Telephone Network(PSTN);
18www.sasat.com . South African Satellite TV Information 19 Telecom and Networking Glossary. 1999.Understanding Communications Technology. Aegis Publishing Group. p126.
Appendix Eight: Understanding Technologies and Cluster Environments
434
• Cellular telephones; • Telephone switchboards; and • Call centres.
GENERAL PUBLIC SWITCHED TELEPHONE NETWORK (PSTN)
What is General Public Switched Telephone Network (PSTN)? The most commonly used telecommunications network is known as the Public Switched Telephone Network (PSTN). A PSTN is a network to which public customers are connected. It operates by switching calls rather than permanent connection, and it is designed to carry telephone or voice traffic. Most non-mobile telephones are connected to a PSTN. The network operates as follows:
When a telephone user dials a number, this causes the telephone to send a signal to the local exchange that that number has been dialled. On older styled telephones, the signal is passed to the exchange by transmitting a series of electrical pulses along the copper wire from the telephone to the exchange. The number of pulses transmitted represents the digit dialled. On newer telephones the signal is passed to the exchange by a series of audio tones. Each digit dialled causes a tone of a particular pitch to be transmitted to the exchange. By either counting the number of pulses received, or by detecting the pitch of the tones received, the exchange determines the telephone number of the telephone to which the calling party wishes to be connected. The exchange can then determine an appropriate connection which will ultimately achieve a connection to that telephone.
PSTN service is the most basic of telecommunications technologies. When accessible, it is the most convinient form of communication, especially in rural areas where other telecommunication technologies are not available. Connection to this network opens the lines of communication to job opportunities, jobs, education, health care and general communication. This makes basic telephony a necessary tool that everyone must have access to. It is in this regard that the government has initiated a number of policies regarding Universal Service (all households having a telephone so that all individuals can make a telephone call from home) and Universal Access (all individuals having access to a telephone that they can use). Apart from the obvious one-to-one single line communication feature, modern telephone s can accommodate communication between more than two people on a conference line. In addition to its regular service Telkom offers additional useful services like call forwarding, call waiting and voice mail retrieval. These services are offered to people who are already connected to the network.
Who Provides PSTN Services? Telkom SA is South Africa's only terrestrial telecommunications carrier. Telecommunications policy - released in 1996 - granted Telkom SA a period of exclusivity in certain areas. Telkom is licensed to operate the PSTN [public switched telephone network] and the public switched data network (PSDN) for a period of exclusivity with clear-cut contractual obligations and performance criteria, as determined by the Regulator.
Appendix Eight: Understanding Technologies and Cluster Environments
435
South Africa now has official policy and legislation governing telecommunications. Perhaps the most immediately obvious aspect to this policy, which was released in 1996, is that it granted a period of exclusivity to the existing terrestrial telecommunications carrier – Telkom SA – in certain areas:
Telkom will be licensed to operate the PSTN [public switched telephone network] and the public switched data network (PSDN) for a period of exclusivity with clear-cut contractual obligations and performance criteria, as determined by the Regulator. The rough aim is to install 20 telephones per 100 population by the year 2000, recognising that this in part depends on demand, which itself depends in part on affordability. Telkom’s stated plan to double the existing network and fully modernise it is seen as a viable means to accomplish the universal access/service goals. 20
The policy does, however, map out clearly how this period of exclusivity is expected to pan out. In addition to this, however, the policy, and legislation which flowed from it, has also established two important new mechanisms. The first is the South African Telecommunications Regulatory Authority, which takes responsibility for regulating telecommunications activities in South Africa, both in areas where monopoly has already been eroded and in those areas reflected in figure two where it will be removed gradually. The second is the Universal Service Agency, which has been tasked with the responsibility of extending telecommunications access in South Africa’s historically disadvantaged communities. In terms of the exclusivity licence granted by the (then) Ministry of Posts, Telecommunications and Broadcasting in 1997, Telkom has the exclusive right to provide public switched telecommunications services for a period of no less than five years.21 Part of this licence agreement was the specification of numerous targets that Telkom has to meet in extending its public services and reach. In the first two years of its license, ‘Telkom had installed more than 900 000 new telephone lines, including 59 600 payphones’ 22.
The company also provided first-time service to 1 381 villages, installed 7 955 lines for priority customers 9schools, hospitals, local authorities and libraries) and replaces more than 740 000 outdated lines.23
These statistics are not particularly meaningful until compared to the targets set in its licensing agreement. The following quote indicates Telkom’s rollout of new and modernisation of existing telephone lines in the 1998-1999 financial year and compares this to its targets:
As far as the modernisation of existing lines…the target for 1998/99 was 13 000. Telkom modernised a total of 518 105 lines during this period. In terms of new lines installed, Telkom added another 502 750 to its network during the period under review, as compared to its licence target of 460 000. This means it connected over 1 370 new customers every day, bringing the total customer base at the end of March 1999 to 5 075 417. We also tool
20 http://www.doc.gov.za/docs/policy/telewp.html. 21 Telkom, (1999) A leaner more effective Telkom hits its licence targets yet again, Telkom News Desk, 28 May 1999, http://www.telkom.co.za//news/article_160.htm. 22 Telkom (1999) Telkom reports to parliament on the first two years of its mandate, Telkom News Desk, 8 September 1999, http://www.telkom.co.za/news/article_184.htm. 23 ibid.
Appendix Eight: Understanding Technologies and Cluster Environments
436
telecommunications services to communities in 920 villages exceeding our license target of 610 by 50 percent.24
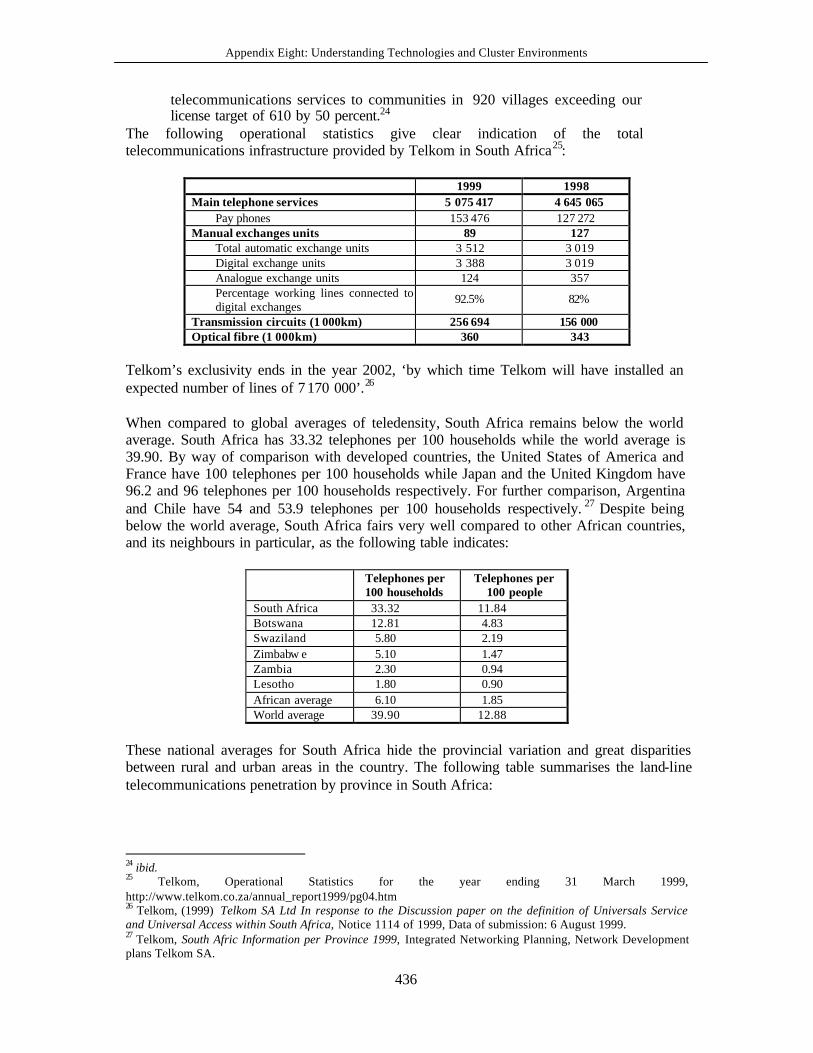
The following operational statistics give clear indication of the total telecommunications infrastructure provided by Telkom in South Africa25:
1999 1998 Main telephone services 5 075 417 4 645 065
Pay phones 153 476 127 272 Manual exchanges units 89 127
Total automatic exchange units 3 512 3 019 Digital exchange units 3 388 3 019 Analogue exchange units 124 357 Percentage working lines connected to digital exchanges
92.5% 82%
Transmission circuits (1 000km) 256 694 156 000 Optical fibre (1 000km) 360 343
Telkom’s exclusivity ends in the year 2002, ‘by which time Telkom will have installed an expected number of lines of 7 170 000’.26 When compared to global averages of teledensity, South Africa remains below the world average. South Africa has 33.32 telephones per 100 households while the world average is 39.90. By way of comparison with developed countries, the United States of America and France have 100 telephones per 100 households while Japan and the United Kingdom have 96.2 and 96 telephones per 100 households respectively. For further comparison, Argentina and Chile have 54 and 53.9 telephones per 100 households respectively. 27 Despite being below the world average, South Africa fairs very well compared to other African countries, and its neighbours in particular, as the following table indicates:
Telephones per 100 households
Telephones per 100 people
South Africa 33.32 11.84 Botswana 12.81 4.83 Swaziland 5.80 2.19 Zimbabw e 5.10 1.47 Zambia 2.30 0.94 Lesotho 1.80 0.90 African average 6.10 1.85 World average 39.90 12.88
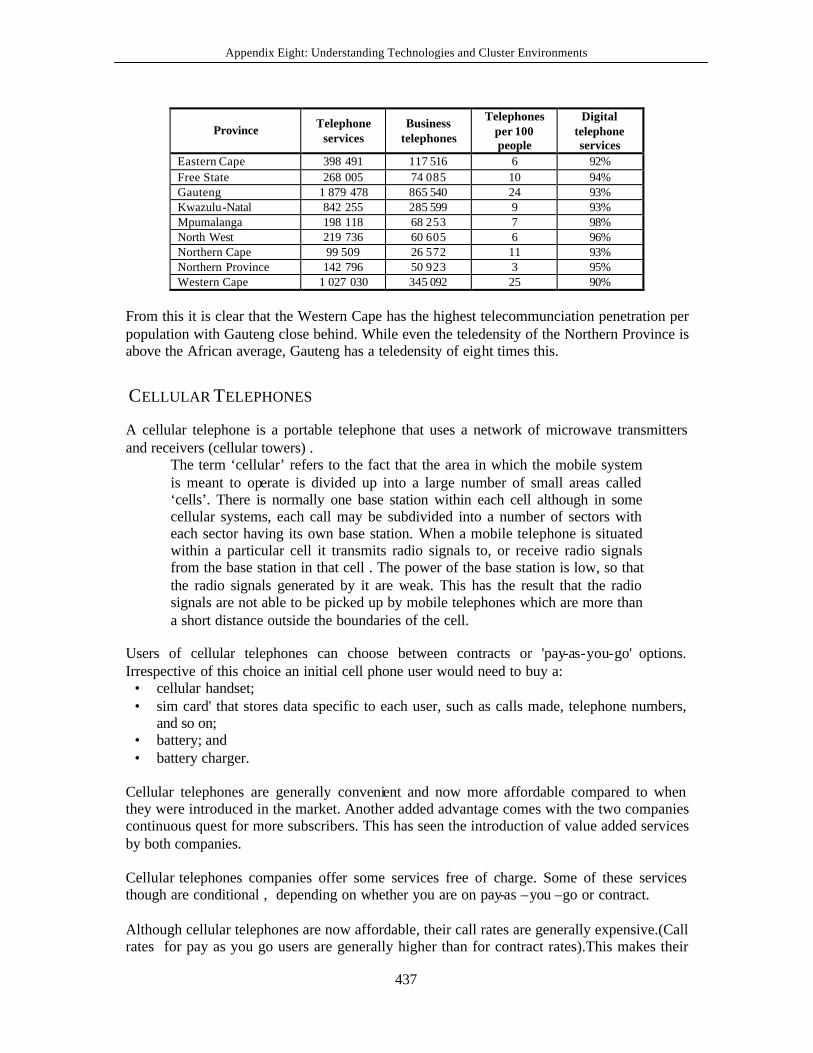
These national averages for South Africa hide the provincial variation and great disparities between rural and urban areas in the country. The following table summarises the land-line telecommunications penetration by province in South Africa:
24 ibid. 25 Telkom, Operational Statistics for the year ending 31 March 1999, http://www.telkom.co.za/annual_report1999/pg04.htm 26 Telkom, (1999) Telkom SA Ltd In response to the Discussion paper on the definition of Universals Service and Universal Access within South Africa, Notice 1114 of 1999, Data of submission: 6 August 1999. 27 Telkom, South Afric Information per Province 1999, Integrated Networking Planning, Network Development plans Telkom SA.
Appendix Eight: Understanding Technologies and Cluster Environments
437
Province Telephone services
Business telephones
Telephones per 100 people
Digital telephone services
Eastern Cape 398 491 117 516 6 92% Free State 268 005 74 085 10 94% Gauteng 1 879 478 865 540 24 93% Kwazulu-Natal 842 255 285 599 9 93% Mpumalanga 198 118 68 253 7 98% North West 219 736 60 605 6 96% Northern Cape 99 509 26 572 11 93% Northern Province 142 796 50 923 3 95% Western Cape 1 027 030 345 092 25 90%
From this it is clear that the Western Cape has the highest telecommunciation penetration per population with Gauteng close behind. While even the teledensity of the Northern Province is above the African average, Gauteng has a teledensity of eight times this.
CELLULAR TELEPHONES
A cellular telephone is a portable telephone that uses a network of microwave transmitters and receivers (cellular towers) .
The term ‘cellular’ refers to the fact that the area in which the mobile system is meant to operate is divided up into a large number of small areas called ‘cells’. There is normally one base station within each cell although in some cellular systems, each call may be subdivided into a number of sectors with each sector having its own base station. When a mobile telephone is situated within a particular cell it transmits radio signals to, or receive radio signals from the base station in that cell . The power of the base station is low, so that the radio signals generated by it are weak. This has the result that the radio signals are not able to be picked up by mobile telephones which are more than a short distance outside the boundaries of the cell.
Users of cellular telephones can choose between contracts or 'pay-as-you-go' options. Irrespective of this choice an initial cell phone user would need to buy a:
• cellular handset; • sim card' that stores data specific to each user, such as calls made, telephone numbers,
and so on; • battery; and • battery charger.
Cellular telephones are generally convenient and now more affordable compared to when they were introduced in the market. Another added advantage comes with the two companies continuous quest for more subscribers. This has seen the introduction of value added services by both companies. Cellular telephones companies offer some services free of charge. Some of these services though are conditional , depending on whether you are on pay-as –you –go or contract. Although cellular telephones are now affordable, their call rates are generally expensive.(Call rates for pay as you go users are generally higher than for contract rates).This makes their
Appendix Eight: Understanding Technologies and Cluster Environments
438
use prohibitive. Furthermore, cellular use is presently limited to certain areas where there are cellular towers, and the user’s choice of who to subscribe to is mainly determined by which company is accessible to their geographical location of which most rural areas are excluded. This is an inconvenience to users, especially those to whom rural areas are their base. In overall, the operations of cellular telephone systems are complicated, for example, you may lose access to your network within a minute’s distance. Cellular telephones require maintenance. The battery can wear off and many technical problems can arise .The battery also has a short life, ranging from one day to about five days of standby times.
What can be transmitted? The functionality of the modern cellular telephone and, especially the microwave signal has been enhanced to such an extent that its signal may also be used to carry data and other information with confidence. Data can be transmitted and received on a user’s handset (depending on the sophistication of the handset). Some cellular telephones now include a modem for connecting to an Internet Service Provider. For others, a special cellular modem must be installed to achieve this functionality. E-mail can also be sent to a cell phone and the message displayed on the handset's screen.
Who Provides Cellular Telephone Services? South Africa also has two GSM cellular network operators - Vodacom and MTN. A third cellular license has also been granted recently. It has taken these operators ‘less than five years to put more than 2.3 million cellphones in the hands of South Africans’. 28 MTN’s ‘national coverage currently stands at 600 000 km2, which constitutes 49% of geographical South Africa and allows 76% of the total population to be within cellular coverage’.29 The national map of MTN coverage indicates that most of its coverage is on national roads and urban areas.30 By comparison, Vodacom’s network covers 52% of South Africa’s land surface and can reach about 80% of the population.31 Vodacom ‘currently switches 30% of telephone volumes in South Africa and 10% of Africa’s (sic). It covers almost 13 000km of national roads’32 and ‘presently has some 2.4 million customers (1.9million active). ’33 This is in stark contrast to the original projections of 500 000 Vodacom customers with in the first five years of commencing operations.34
28 Knott, A Chief Executive Vodacom Group (March 1999) Case Study of the South African Market, e-mail received from Ivan Booth, 25/10/1999. 29 http://www.mtn.co.za/news/pr/pr1198-2.html 30 http://www.mtn.co.za/coverage/nationalmap.ht ml 31 E-mail received from, Ivan Booth, 25/10/1999. Vodacom Fact Sheet - October 1999, http://www.itweb.co.za/office/vodacom. 32 ibid. 33 ibid. 34 ibid.
Appendix Eight: Understanding Technologies and Cluster Environments
439
TELEPHONE SWITCHBOARDS
Where an organization or company receives many calls per day, an electronic switchboard can be used to filter, direct and monitor calls. An institution or company is usually connected via its electronic switchboard to a Telkom telephone exchange by one or more telephone lines. In the case of large organizations, these lines are ISDN (Intergrated Services Digital Network) lines, each of which can handle many telephone calls simultaneously. In the case of very large organizations, these lines may even be optical cables that can handle an extremely large number of incoming and outgoing calls. The internal users of a PBAX switchboard are able to make calls to one another without going through the public telephone network, thus saving costs. Users can also place calls to pubic lines without going through a switchboard operator.These switchboards can open voice mail postboxes for each number, which are automatically activated when users are not at their places of work. The switchboard also has the ability to activate an individually programmable answering mechanism, that is, an internal or external incoming call is put through to a number in a department that is always answered. The switchboard has a programmable ability that enables each user to activate call-following, allowing incoming calls to follow the user to any new number (permanent or temporary) where the user will be. Certain numbers, such as all trunk calls, however, may be blocked out for specific extensions. Such calls must then be placed through a switchboard operator. Many people now have access to telephones for the first time- and use them frequently and without hesitation, thus large organisations’ incoming lines can become clogged, and, if internal telephone numbers are not available to clients, can clog switchboard operator numbers. This can create very dissatisfied clients.
What can be Transmitted? Apart from verbal communication, modern PBAX (Private Branch Automatic Exchange) systems are built around computing systems that manage all calls and facsimiles. Call information, including date, time, duration, and number called, can easily be logged. PBAX systems can also produce accounts that specify the number called, date and time of call, and its duration.
CALL CENTRES
Modern computer, database, network, and communication technologies can be integrated to make use of a central database that holds most of the information required by callers. Using this combination of technologies, an institution can thus centralize most of the information about itself in a database accessible to staff and clients. All this is made possible by enormous advances in telephone exchange and switchboard technology over the last few years, where exchanges and switchboards are operated by computers. Each computer in the Call Centre would be able to handle Internet, Intranet, facsimile, e-mail, voice and data PBAX communication smoothly through one integrated web-based (browser) operating system. Each computer could be connected to:
• an internal local area network (LAN) operated by a dedicated server containing all the necessary hardware and software to allow the Call centre to function;
Appendix Eight: Understanding Technologies and Cluster Environments
440
• the Internet and the WWW for external communication; • an Intranet within the organization; • a PBAX system, through a telephone line for incoming/outgoing voice and information
calls and faxes; and • a central database on one or more database servers (which could be located anywhere in
the world for that matter) mirroring all the operations of the organization it serves, its rules and regulations, privileges and duties, and the services it offers to its staff and clients.
COMPUTER TECHNOLOGIE S
In this section we distinguish between various types of computers, and explain some computer terminology. As computers can either be used as stand-alone equipment or linked together to form a network, we discuss each of the following possibilities separately:
• personal computers; • local area networks (LANs); • wide area networks; and • the Internet.
As each of these technologies is described in detail as part of the main report (chapters six, seven and eight) - this section has not aimed to be comprehensive, but rather intraductory to understanding computer technologies
Stand-alone Computers While stand-alone computers are isolated units, their functionality can be enhanced by adding a range of peripherals. Some peripheral equipment can be added internally in the form of PC cards and/or equipment, while others can be attached by cable to ports (or interfaces) at the back of the computer. The following is a cursory shopping list of the more popular and useful attachments that can be added to a PC:
• One or more additional hard drives, enhancing its ability to handle and store programs and data.
• Audio and video cards, giving it the ability to handle sound and video. • One or more CD-ROM drives, which expand its ability to, for example, handle big or
interactive CD-ROM databases (for example electronic dictionaries which can even pronounce the words and phrases and interactive teaching and learning programmes), to play music CDs, or to play CDs c ontaining audio books, videos of plays or film clips in interactive teaching and training programmes.
• One or more black-and-white and/or colour printers, enhancing its ability to communicate with a wider audience via the traditional print medium.
• A modem, allowing it to be connected to a single PC/computer at another location through a telephone line, or via an Internet Service Provider (ISP) to the Internet, using a 'dial-up' connection.
• An electronic projector, allowing whatever is displayed on the monitor screen to be projected on to a large wall screen for class lecturing or presentation purposes.
• A CD-ROM writer, allowing it to store massive amounts of data permanently and compactly (such as school records of all students in a school in a given year ).
• A television card, enabling it to be connected to a television antenna and to function as a multi-channel television set (which is almost ideal for school television, since it can potentially reach into every class where there are PCs connected to a ne twork), or can be attached to a video recorder.
Appendix Eight: Understanding Technologies and Cluster Environments
441
• A radio card, allowing it to be used as a radio
Linking Computers and PCs into Networks The functionality and usefulness of stand-alone PCs and computers can be enhanced by adding network cards to their systems and linking them to other PCs/computers by means of special cabling to form networks. This enables PCs to communicate with all other PCs and other computing equipment attached to the network. This can be done in several ways, for instance:
• linking it to a local-area network (LAN), in which cables interconnect all local PCs or link thin clients to a central server;
• linking individual LANs in a certain geographical area (or, for that matter, belonging to a specific organization or to group of organizations) by special cabling or telephone lines to form a wide-area network (WAN), for instance on a university campus;
• linking individual WANs in a specific geographic or organizational entity to form a network covering a part of a country, the whole country, or even around the world. In this way, the nebulous entity called the Internet, with its valuable sub-units, the World Wide Web (WWW) and e-mail, was formed.
There has been much exaggeration and optimism about the potential educational strengths of computers, that has only more recently been tempered by skepticism in the use of stand alone machines with the growth in popularity and functionality of networking. Bates identifies the following three significant developments as emerging from this initial euphoria:
The move to multimedia, enabling a wider range of educational applications of computers; the use of computer networks for communication purposes; and a change in philosophy, from computers as teaching machines, to computers as tools to empower learners and teachers. (Bates, 1995. p 181.)
The second trend obviously applies only to networked computers, while the first and last are relevant to strengths of stand-alone machines as well. As explained in the section on integrated multimedia, computer technology allows text, audio, and video material to be accessed via a single platform. Furthermore, because all three media can be stored as digital files, they can increasingly be accessed in a number of ways. They may, for example, be stored and extracted directly from electronic databases, accessed via the World Wide Web, distributed on CD-ROM, or broadcast and accessed using television and set-top boxes. The use of a variety of media in computer software packages, makes them more attractive and interesting to use. The distinction between 'computer as tutor' and 'computer as tool', is a useful one for examining both strengths and weaknesses of computers. 'Computer as tutor' or 'teaching machine' refers primarily to pre -programmed computer-based learning. This type of computer use can be put to good use for drill and practice tasks. Where repetition and mastery are important, this can be an effective an interesting way of achieving these goals. In addition, such use can be learner-paced and allow for immediate feedback. The strengths of computers used as tools for both learners and educators are implied in the section on applications. Computers can be used to effectively store and manage large amounts of information. Various applications like word processors, databases, spreadsheets, personal organizers and authorware can improve the administration and management of the learning site, as well as improve the day-to-day functioning of both learners and educators.
Appendix Eight: Understanding Technologies and Cluster Environments
442
One of the fundamental weaknesses of using computers to enhance learning is their accessibility. They are neither widely available in sites of learning, nor are they standardized. A number of South African initiatives have been launched to try and address the issues of equitable access to computer technology. Nevertheless infrastructure remains a primary weakness of adopting to use this technology - particularly when the cost of, or responsibility for, gaining access to computers is vested with the individual learner. Many educational institutions and role-players have therefore started to prioritize extending access to computer technology to their staff and learner base. The problem of standardization is not peculiar to computer technology, nor is it easy to overcome. Some national initiatives have been started to generate standards and protocols guidelines for the education community. (The National Department of Education established such a task team in 1998). Nevertheless these guidelines cannot be enforced, without running the risk of brand preference for specific hardware and software. Thus, problems of lack of standardized equipment within, and between, educational institutions remains a problem. A fundamental educational weakness of stand-alone computers is the lack of communication possibilities. The user is isolated, making communication with either other learners or educators dependent on other means. Where feedback is built into the pre-designed programme - it can only be in a restricted form. Feed back can only be given to responses that can be appropriately coded (for example true or false, multiple-choice, or number solutions). Another weaknesses is that many pre-programmed computer-based learning packages have been poorly designed (Bates, 1995. p201). This is not easily overcome, as high levels of instructional design skills coupled with educational and computer competence are required. Not many people have these skills. The cost of developing good quality educational computer programmes are also high. Besides the high level skills demanded of developers, learners and educators also require good computer competence to be able to make good use of computer -based materials. Computer training for both educaters and learners becomes a important factor to consider when introducing computers into a teaching and learning environment. There are many educational and administrative applications of stand-alone PCs and computers that can be listed and discussed here.
Local Area Networks (LANs) The term local area network (LAN) refers to the cables, network cards, and other equipment needed to connect a number of computers/PCs, and printers in a limited geographical space, such as a building. Usually, a network has a central computer (usually, a Pentium II PC or an IBM RISC type computer) designated as a server, on which the software needed to operate and manage the network resides. Centrally stored software, like virus protection, word-processing, spreadsheet, and mail programmes, can be shared by all users, . Another networking option is a thin client network. This is a computer network where the hardware of individual work stations is minimized to reduce costs. Users access information directly from the server, with the local work station simply providing a keyboard, mouse, and monitor to allow the user to work. Unlike fat client networks, software programmes and data are not permanently stored on local work stations, but are accessed directly from the server as
Appendix Eight: Understanding Technologies and Cluster Environments
443
required. As Whatis.Com, points out, ‘The term “thin client” seems to be used as a synonym for both the Net PC and the network computer (NC), which are somewhat different concepts. The Net PC is based on Intel microprocessors and Windows software (Intel was a leader in defining the Net PC specification). The network computer (NC) is a concept backed by Oracle and Sun Microsystems that may or may not use Intel microprocessors and would use a Java -based operating system.’35 The LAN makes it possible to share data between computers. For instance, a single copy of a software programme can be installed on one computer/PC and used by all other computers/PCs linked to the network. It is also possible to share equipment, such as printers and scanners. For instance, all the computers/PCs on the network can print their data/results on the same printer without moving any equipment or working on a different PC. Different kinds of networks are available commercially, the most popular of which are Novell and Microsoft NT. Each network has a Network Protocol that is chosen to provide file handling and saving, messaging, and various application services. Each network should have a network administrator to oversee it. The presence of a LAN in any organization can improve communication within the organization. With a LAN, computers/PCs are linked and teaching and learning sites or institutions can enhance their information management systems and communication between administrators, educators, learners, and other members of the education community. Communication can be handled by special software programmes, known as office programmes, which can:
• send messages to individuals or groups; • store of information, such as regulations, conditions of employment, notices, and
internal advertisements of vacant posts, in electronic form on a central server which can be accessed by individuals;
• record meeting schedules and class timetables; • enable the use of databases, such as the teaching and learning site records of students,
which lightens the load of producing teaching and learning site reports. Standard software, for instance, word processors, spreadsheets, authoring programmes, database programmes, dictionaries, and Encyclopaedias, used by the organization can be placed on central servers, saving installation time. This mode of operation makes the management of site licenses of software easier and reduces the software piracy. With a local area network, an educator is able to design lessons in electronic form, and to project them from a master computer on to the screen in front one or more learners. Similarly, educators can monitor the work of a single student from their own PCs and interact with the work of the student when needed. Any or all of the PCs can be connected to a teaching and learning site library server, where CD-ROM Encyclopaedias, electronic dictionarie s, or other data bases are available, thus increasing the information accessible to learners. In addition, the information technology climate that such a LAN creates, with its peer and student pressure, may encourage people who are resistant to computer use to seek assistance and start to use this technology. A LAN enables educators and learners to share assignments, messages, reports assessment, and digital resources.
35 Whatis.com, Thin Client Definition, http://www.whatis. com/ Page created on 19/10/1999.
Appendix Eight: Understanding Technologies and Cluster Environments
444
There are some inherent weaknesses of a LAN. For example to run smoothly, a LAN needs a network manager and technicians who thoroughly understand the way in which a network operates and how it is managed. LAN installation is costly, depending on the number and location of the computers to be linked. The cost may, however, be offset by generating savings through having central software on the server (as opposed to installing it on every PC and maintaining many copies of the same software). This saving does, however, need to be measures against the danger that, when the server goes down, nobody is able to continue working on their local workstations. In addition, central servers can be rather costly and their databanks must be continuously updated. Special steps need to be undertaken to ensure the security of the LAN and the confidential data it may be handling. A firewall (a software programme that controls access) has to be installed, and regularly updates since hacking and viruses always cause problems.
Wide Area Networks A Wide Area Network (WAN) is an interconnected network of LANs, PCs or thin clients over a larger geographical area. If it is external to an organization, it may be set up and administered by a provider company, such as Telkom. It links institutions through a fast network operating in a certain geographical area. In addition, the WAN may be coupled to other networks through a gateway and further communication links. WANS consisting of cluster hubs and network servers have a number of advantages when considering networking teaching and learning sites: • Storage capacity investments can be focused on wide area network servers, allowing for
widespread dissemination of educational resources and software applications that are accessed by individual teaching and learning sites via caches on network servers. This assumes, of course, that all resources and software applications developed for storage on these servers are based on Internet protocols, thus enabling cross -platform, web browser-based access by individual teaching and learning sites to.
• Upgrades in both storage capacity and processing power can focus on investments in cluster hubs.
• Investments in the physical security of equipment can be made in a more targeted way, as the key equipment (the cluster hub and network server) will be located at fewer sites. Loss of equipment at individual teaching and learning sites will be correspondingly less problematic, as expensive equipment and data will predominantly be stored centrally.
• Backup of critical data can focus on the information on network servers, and even, using a distribution network architecture, managed remotely.
• Investments in contingency plans for hardware failure (for example, mirrored hard drives) can be limited to cluster hubs and network servers.
• Technical maintenance skill requirements at local levels can be minimized, as the system will assume a lowest common denominator of access to facilities via web browsers.
The Internet The Internet is a global web of interconnected computers, computer networks and gateways, or a 'network of computer networks'. This huge net uses the Transmission Control Protocol/Internet Protocol (TCP/IP), originally developed by the United States Department of Defence for communication between computers. This protocol is built into the UNIX system, and has become the standard communication protoc ol in the world.
Appendix Eight: Understanding Technologies and Cluster Environments
445
This network of networks has a series of backbones that carry traffic from point to point. These are built and installed by the main telecommunications companies of the world. For the Internet, these backbones are connected to the Interne t's Network Access Points (NAPs). Originally, there were four official NAPs that defined the Internet's access. However, this number has grown to eleven in the USA, the newest being Digital's Internet Exchange in California and Compaq's Houston Network Access Point. Internet backbones are usually able to carry a massive flux of information through 'pipes' of optical cabling or microwave transmission channels. The Internet thus links stand-alone computers and LANs (found in teaching and learning sites, colleges, universities, government bureaux, libraries, businesses, research laboratories, and churches) into a global network. It enables linked computers or PCs to communicate with one another through a series of communication protocols. The Internet is dynamic, and continues to grow rapidly. It is commonly referred to as an information highway, and even sometimes as an information super highway.(Although, strictly speaking, the latter term is erroneous as original visions of an information super highway have envisaged telecommunications strategies where the limitations of bandwidth currently plaguing most Internet users fall away). This highway metaphor has, however, been contested because it emphasizes the means of transmission. Burge, for example, perceives the Internet as a loom, thus emphasizing its inter -connectivity. Whatever metaphor is applied, in simple terms the Internet allows for shared information and communication between computer users. Although it was originally text -based, it now supports transfer of multimedia data, including graphics, sound, video clippings, and text. For the purposes of this discussion, Internet technologies are used to refer to two basic groups of technologies and applications:
• Technologies and applications that facilitate resource provision and; • Technologies and applications that facilitate communication
Most importantly, in terms of the above, the Internet provides opportunities for integrating the functions of resource provision and communication, so that resources - if well designed - can allow for increasingly diverse types of interaction. This trend is set to gain momentum as convergence of information, telecommunications, and broadcasting technologies develops further. In our final section on the Internet, we examine some of the strengths and weaknesses of using Internet technologies to enhance learning. Below we outline the following ways in which Internet technologies can potentially contribute to education:
• Resource provision; • Facilitating communication; • Facilitating interaction in resources; • Flexibility; and • Possibilities for achieving cost-efficiencies.
Some refer to the functionality of the technology itself, but none are relevant in the absence of effective processes of course design and development that focus explicitly on harnessing these potential strengths.
Appendix Eight: Understanding Technologies and Cluster Environments
446
Resource Provision Beginning with the functionality to provide resources, one of the most immediately obvious strengths of Internet technologies is the capacity to provide immediately up-to-date resources to large numbers of learners easily and relatively cheaply (whether one is using the Web or e-mail technologies). Changes made to resources can become immediately available to students without incurring major additional distribution costs. Likewise, communication resources, such as tutorial letters, can be distributed more often, thus reducing costs of ongoing communication by the educational provider. These trends are already becoming increasingly important in a world where curricula no longer cha nge in cycles of five or ten years (or even longer), but need to be adapted and updated continuously. It should be noted here, however, that the capacity to facilitate quick distribution of resources should not be taken to imply an argument in favour of turning online environments into massive ‘electronic textbooks’ (although regrettably this appears to be how most web course designers tend to use the technology). There is no evidence to suggest that today’s – or tomorrow’s – students are going to be interested in simply reading textbooks on a computer screen. Thus, one needs to plan very carefully how to take advantage of this functionality without simply creating electronic textbooks (which most students are simply likely to print out and read in paper form anyway). As an extension of this, Internet technologies also support use of resources that combine more than one medium. While technical limitations still hamper the use of video resources (unless one is working within a reasonably advanced local or wide area network environment), the ability to create multimedia resources – combining audio, graphics and images, and text - is a tremendous potential strength. An additional benefit that Internet technologies can brings to designers of online learning resources is the huge resource base that resides on the World Wide Web. In itself, this is of negligible educational value, but, if harnessed effectively by educators, it can become a very useful resource. This might happen, for example, through judicious use of links to resources on the Web or by setting learning activities that demand learners to make their own selective use of this resource base. As an extension, it is worth noting that this benefit can extend to the course design process itself. This resource base can be harnessed to support course design and development itself, regardless of the nature of resources being developed. Facilitating Communication The second set of strengths of the Internet is its capacity to support a range of communication strategies, especially easy asynchronous communication between educator and learner and amongst learners. Of course, as people who are familiar with the full range of applications of the Internet will know, technologies such as Chat Rooms or Video Conferencing do allow for live, real-time communication as well (subject to limitations of bandwidth). However, the major new strength of e-mail particularly is the capacity to facilitate ongoing communication at times that are suitable to the individuals continuing the conversation. Thus, students can post queries or ideas to educators, who can then respond at later times. Where appropriate, this communication can be extended to include groups of people rather than just individuals. People who have used e-mail and discussion groups for business or research purposes will know the benefits that this brings – as well as the time it can save by focusing discussion - and these benefits apply equally in education. Of course, this is not intended to suggest that such communication can replace face -to-face contact; however, it can be harnessed very effectively for a range of educational purposes.
Appendix Eight: Understanding Technologies and Cluster Environments
447
Facilitating Interaction in Resources Combining the above, it becomes apparent that Internet technologies can provide educators with a range of very interesting opportunities for creating resources that allow learners different levels of interactivity. Of course, this can quite easily be used poorly by educators – as will be demonstrated in the discussion on pitfalls – but it can also lead to the creation of interesting and exciting interaction for learners with educational resources. Again, this is not intended to suggest that such interaction can replace all forms of direct human interaction; however, it can be used to engage learners effectively, creating richer teaching and learning environments. This can be facilitated by creative use of, for example, feedback forms, java applets, pop-up boxes, ‘yes-no’ and multiple-choice responses, and imaginative use of hyperlinks to guide learners through diverse learning pathways. For example, in a printed resource, activities integrated into texts are usually immediately followed by some discussion of the activity, often discouraging learners from completing the activity. In a web environment, however, one could require some form of response from learners by developing this discussion about an activity as a response to a feedback form (thus requiring learners to submit some thoughts on the activity before seeing the discussion). To dis courage thoughtless answers – and to encourage peer interaction – responses could be automatically collated and generated as an HTML page of student responses. Likewise, ‘yes-no’ responses could be used judiciously to guide learners down different, but equally relevant, learning pathways. In this instance, the response is used not to provide right or wrong answers, but rather to solicit information from learners on their particular preferences or concerns. Flexibility A concept gaining importance in education generally, is the notion of flexibility in educational provision. Of course, this raises a range of complex questions and problems, which fall beyond the scope of this posting. Nevertheless, Internet technologies and online learning do create new possibilities for introducing flexibility to learners in terms of time, place, and pacing of independent study. Although the merits of this may be debatable in certain educational environments, it is equally clearly a tremendous potential benefit. Possibilities for achieving cost-efficiencies We have placed this point last because it is possibly the most tenuous – although one of the most strongly touted – potential benefits of using Internet technologies. Many technology-based educational initiatives have fa iled precisely because of their expense. This problem can quite easily occur in efforts to use Internet technologies for educational purposes. Nevertheless, if planned carefully and costed thoroughly, the use of these technologies can, under certain circumstances, create possibilities for achieving cost-efficiencies in educational provision. Of course, as well as potential strengths, Internet technologies contain many potential weaknesses. Almost inevitably – as with most technologies – most of these are linked to the way in which the technologies might be used (or misused) rather than anything intrinsic in the technologies themselves. The following list outlines some of these pitfalls or weaknesses:
• Potential for poor use; • Resource design is complicated and time consuming; • Confusing rote response with interaction; • Effective use requires information literacy skills;
Appendix Eight: Understanding Technologies and Cluster Environments
448
• User unfamiliarity; • Technical constraints; • Uncertainty around copyright issues.
Potential for poor use Although this is a really obvious sounding observation, it is nevertheless worth reinforcing that there is as much potential for poor use of Internet technologies as any other educational technology. As has been the case with many technological innovations (such as radio and television), there has been a proliferation of rhetoric about the potential of Internet technologies to provide simple solutions to very complicated educational problems, much of which is generated by the marketing strategies of technology vendors. Of course, as use of these technologies develops, a more sophisticated, critical understanding and rhetoric will emerge. Nevertheless, in the absence of this, it is currently necessary to remember that Internet technologies offer no magical panacea to educational problems, and can thus be used just as poorly as any other technology. As has been suggested above, they can also either function as a catalyst for educational transformation or entrench existing educational practices. Resource design is complicated and time-consuming A second potential weakness of Internet technologies is that complexities of resource design and development demand time and high-level skills. This problem becomes particularly acute in environments where human and financial resources are limited, and can be further intensified when poor financial planning leads to heavy expenditure in technological infrastructure that, in turn, absorbs budgets for curriculum and resource design and development. This problem is – almost paradoxically - masked by grow ing ease of use of different technological applications. For example, it is now very easy to generate HTML pages without learning coding, making it much simpler for people to generate their own web sites. This ease of use can easily mask the complexities of the educational or instructional design that is necessary to create effective web resources. This is reflected in the proliferation of online ‘educational’ material that is little more than reams of text on a screen. Of course, this problem can be used to advantage if harnessed effectively. This is because these technologies and software applications have lowered financial and skill entry levels for people interested in exploring their educational use, thus enabling well-managed budgets and design processes to invest a greater percentage of expenditure in course design and development. The key to turning this pitfall into a possibility is effective management of resources. It is, however, worth noting that design of online learning resources can be very time-consuming. Discussion with people who have developed better quality resources, as well as consultation of international research, suggests that ratios of at least 150 to 200 hours of design time to each hour of learning time are not unusual. Confusing rote response with interaction A key benefit that ICTs have brought to the business world is the ability to automate certain rote tasks (such as management and retrieval of data or delivery of communication). Many of these benefits can be harnessed both in the administration and provision of education. However, they carry with them the potential danger of confusing rote response with interaction. Some educational theorists differentiate between different levels of interaction, with rote response as a ve ry low level of interaction moving up to more sophisticated levels of interaction. While this is perfectly valid, we would argue that rote response and interaction
Appendix Eight: Understanding Technologies and Cluster Environments
449
are actually different processes, the former being designed in ways that can actually impede interaction on the part of learners. In the use of ICTs and online learning, multiple -choice questions and automated responses are probably the most obvious educational activities that tend to encourage rote response. At a more sophisticated level, design of automated learning pathways that ‘guide’ learners down a single ‘right’ path often also encourage rote response to and simplistic memorization of learning resources. Of course, this is not intended to suggest that there is no place for these educational strategies. In certain working environments, memorization of key information may be essential to successful operations. When, however, this approach becomes pervasive within an entire educational intervention, it starts to become highly problematic, and is likely to place serious limits on the effectiveness of that intervention. Effective use requires information literacy skills One of the features of increasing use of e-mail and the growth of the World Wide Web has been that there is a proliferation of useless information. This raises interesting challenges, and points clearly to the importance of developing effective information literacy skills. Of course, the term ‘information literacy’ is itself the subject of some debate. Darch, Carelse, and Underwood argue that information literacy has two components. The one is a set of skills which enables users to identify their information problems and needs, find information irrespective of source or medium, and critically evaluate and use the information. The other is understanding a domain of knowledge, so that an information user is able to evaluate the significance of information in relation to a problem in that domain. In a later article (19 May), Darch states that information literacy is not just a new name for something which we have always done. It is more than just a set of skills like being able to access a library catalogue or to understand the limitations of the television news. Darch argues that it implies a self-conscious awareness of the way in which information systems work (including modern electronic systems), of the dynamic link between a particular information need and the sources and channels required to satisfy that need. Developing these types of skills in learners who are going to use online learning environments will be essential to their successful implementation. User unfamiliarity Linked to the above point is the difficulty – particularly in South Africa – that most potential users, both educators and learners, are likely to be unfamiliar with Internet technologies. Of course, this depends on the nature and level of the educational intervention, but it is a potential pitfall that needs to be factored into conceptualizing the use of such technologies. If one peruses existing online learning, it quickly becomes apparent how many assumptions have been made about proficiency of use of the technologies that learners are expected to bring with them. Likewise, strategic decisions to develop online learning strategies are usually taken with little or no reference to the capacity of the educators who will be expected to drive these strategies. Consequently, in designing educational interventions using Internet technologies, it is always necessary to take account of the levels of expertise o educators and learners, and to ensure that appropriate levels of capacity are developed as part of the intervention. This, of course, has the spin-off benefit of developing important new skills. Technical constraints Technical constraints still pose very serious concerns in the use of Internet technologies in South Africa. At a first level, it is necessary to consider carefully whether or not potential
Appendix Eight: Understanding Technologies and Cluster Environments
450
learners are likely to have access to the necessary technological infrastructure to be able to participate in online learning activities. These would include access to both the necessary computer systems and to appropriate telecommunications infrastructure. If they do not, investing extensively in online learning could be very wasteful. At a second level, it is essential to design online learning resources that take cognisance of likely levels of computer and telecommunications infrastructure. For example, designing graphics-intensive resources or using video clips when learners are accessing these resources us ing slower dial-up modems across copper cable is likely only to create frustration and disillusionment. Likewise, using advanced Java applets, Dynamic HTML, or HTML-coded e-mail messages is pointless if most learners will have access to computer systems that cannot support fourth-generation web browsers and communication packages. Uncertainty around copyright issues A minor, but important, point to note is that online learning often raises uncertainty around copyright issues. Although it is debatable as to how long copyright will remain a relevant concept as more and more information is digitized, it is certainly still a reality. Thus, one still needs to be careful about not breaching copyright when developing online learning experiences, particularly if one starts making extensive use of resources that exist on other web sites or that have been gathered through e-mail discussion groups.
COMMUNICATION TECHNOLOGY OPTIONS FOR EDUCATION CLUSTER ENVIRONMENTS36
This section of the appendix details technologies that could be used in an education cluster environment. Its purpose is to capture the costs involved in the various communication mechanisms and also note the conditions, limitations and regulations applicable to each. It provides the context in which the communication technology options have been presented and then gives an architectural overview of the clusters arranged in a two level network hierarchy. Pertinent issues related to the choice of technologies are highlighted and then the technologies for the various points in the hierarchy are presented. It then emphasises technology selection criteria from an intended application perspective.
CONTEXT
The cluster configuration groups teaching and learning sites (be they for example schools, community centres or learner support centres) into clusters based on configuration possibilities of (or combinations of):
• Geographical proximity (e.g. x km between learning site A and B) • Infrastructure availability (e.g. can network infrastructure be shared between clusters) • Learning and teaching resource availability (e.g. educator skills distribution) • Educational/training system requirements and core processes (e.g. administration
systems; supply chain management) By virtue of more centralised administration, resource allocation and decision support using the distributed information contained in the individual nodes of the cluster can be improved. The cluster concept can also aid in the improved administration and management of 36 This section has been contributed by the CSIR. SAIDE requested the CSIR to present details on the technology options for education clusters, taking into account the current and future technology trends and regulations. CSIR also provide costs for all the technology elements in the proposed cluster configuration.
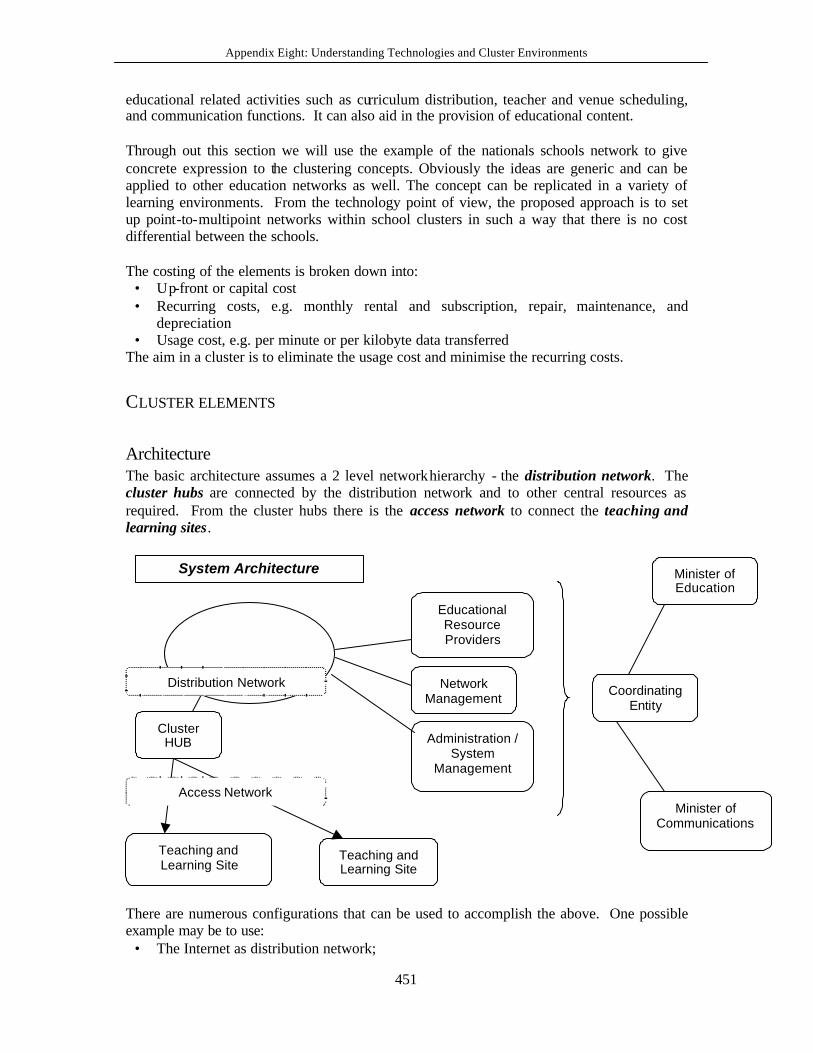
Appendix Eight: Understanding Technologies and Cluster Environments
451
educational related activities such as curriculum distribution, teacher and venue scheduling, and communication functions. It can also aid in the provision of educational content. Through out this section we will use the example of the nationals schools network to give concrete expression to the clustering concepts. Obviously the ideas are generic and can be applied to other education networks as well. The concept can be replicated in a variety of learning environments. From the technology point of view, the proposed approach is to set up point-to-multipoint networks within school clusters in such a way that there is no cost differential between the schools. The costing of the elements is broken down into:
• Up-front or capital cost • Recurring costs, e.g. monthly rental and subscription, repair, maintenance, and
depreciation • Usage cost, e.g. per minute or per kilobyte data transferred
The aim in a cluster is to eliminate the usage cost and minimise the recurring costs.
CLUSTER ELEMENTS
Architecture The basic architecture assumes a 2 level network hierarchy - the distribution network. The cluster hubs are connected by the distribution network and to other central resources as required. From the cluster hubs there is the access network to connect the teaching and learning sites.
Cluster HUB
Teaching and Learning Site
Teaching and Learning Site
Access Network
Distribution Network
System Architecture
Educational Resource Providers
Network Management
Administration / System
Management
Coordinating Entity
Minister of Communications
Minister of Education
There are numerous configurations that can be used to accomplish the above. One possible example may be to use:
• The Internet as distribution network;
Appendix Eight: Understanding Technologies and Cluster Environments
452
• A central location in the cluster with a powerful server, backup and satellite broadcasting of the internet as hub;
• Leased lines from the schools to the hub as access network; and • Workstations (PC, terminal, thin client) with web browsers at the training centres.
Under certain circumstances there will be no separation between the distribution and access networks. A current example is the broadcasting of lectures on television. The television network is the distribution mechanism and TV sets at training centres present the delivery. Another example could be where the cellphone network is used as access mechanism, in which case there is no cost differential between local and long distance calls, which could result in one superhub instead of individual cluster hubs. Other issues that should be addressed in selecting the technologies could include: Ø Network/system support, administration and maintenance. How difficult is it to ensure
that the network is up and running. Are there problematic set-ups and can the physical infrastructure be stolen or damaged (by weather or by humans)?
Ø Scalability of the technology. Are there any limits to the number of nodes in the cluster? Is the capacity utilisation of the technology at such a level that a further increase is very difficult (such as if video is needed to be sent over the network)?
Ø Lifetime of the system. Is this a stopgap measure while we wait for something better? There may be better future options that we know about, but in the mean time a cheap non-ideal solution can be implemented. Also, sometimes an implemented technology has a foreseeable lifetime that should also be considered when making decisions. Another aspect to consider is that sometimes contracts are entered into that lock a customer into a particular technology or service so that even if something better comes along, change will become very expensive until the expiry of the contract period.
Ø Information Security (e.g. to protect confidential data). Anything that is interconnected with a public network becomes a target for attack.
Ø Access control (e.g. to limit access to indecent content). A lot of inappropriate material is available in the public domain. University students are known to download huge quantities of pornographic material that really taxes available bandwidth. For younger students, protection measures have to be implemented (even if it means that they are to be protected from themselves.)
Distribution Network The purpose of the distribution network is to interconnect clusters, to connect to central resources (such as the district offices, or provincial or national Departments of Education) and to possibly connect to the rest of the world (Internet). Within the current regulatory framework, only Telkom is allowed to provide the basic infrastructure for telecommunications (i.e. interactive) and the broadcasters to distribute broa dcasting content. Value added network operators (VANS) can manage and resell infrastructure of Telkom and as such also provide a distribution network.
The following table lists the various options for a distribution network:
Technology / service Uplink Downlink Notes
Private Network / Dedicated WAN infrastructure
Own Infrastructure Cost will depend on technology chosen
Same as uplink A private network license from The South African Telecommunications Regulatory Authority (SATRA) will be
Appendix Eight: Understanding Technologies and Cluster Environments
453
Technology / service Uplink Downlink Notes required. Must have the competencies to install and manage the network. The quality of the network is dependent on the technology used in the network.
Virtual Private Network (VPN) Two distinct segments: Quality of Service VPNs (Based on the service providers private shared network) Offered by Omnilink, Satellite Data Networks, IBM Global Services, EDS, FirstNet
Public Internet-based VPNs
Offered by Internet Service Providers
VPN providers have different offerings depending on client requirements. Pricing depends on specific offering. Quotations only available after inspection and assessment of customer site
Same as uplink Network management outsourced. The maintenance of the physical infrastructure and service quality offered are the responsibility of the VPN operator. High levels of reliability offered.
Leased Lines (Will typically use same line for uplink and downlink. Fixed monthly cost based on distance and bandwidth)
Different rates according to data rates and distance.
R1830/month for 64k max non expandable.
R3410/month for 64k expandable to 2M (at increasing charges of course)
Same as uplink May be used over large distances. A variety of data rates up to 2 Mbps is supported.
Bi-directional; mainly for online data applications good quality service. Scalable in terms of bandwidth, distance, number of sites. Needs a dedicated modem per line at the hub. Leased lines may not be available in some areas.
Very Small Aperture Terminal (VSAT)
Example of a VPN. This option generally becomes more cost effective as the number of sites in the VSAT network increases. Capital costs for the VSAT dish come to about R70000 for each dish and associated equipment (But this can vary according to factors such as the size of the dish and bandwidth. Usage costs are usually none, but it depends on the service providers pricing schemes.
Appendix Eight: Understanding Technologies and Cluster Environments
454
Technology / service Uplink Downlink Notes
There is a range of recurring costs depending on the number of nodes that are to be connected together and the data rates that are needed between them and the type of configuration they are connected in. These costs are made up of the satellite segment reservation monthly costs and network management monthly costs
Internet Internet Service Provider (ISP) & Telkom subscription Ø IAfrica Dialup:
R49 – R99 / month
Ø IAfrica ISDN: R199 / month
Ø IAfrica Leased Line Access (64K): R7350 / month
Same as for uplink Own network management. Security risks. Not good for applications that require real-time service guarantees.
Equipment for dial-up services: modem (+/- R500), telephone line (standard Telkom rates)
Equipment for leased line access: Router (R6500) and leased line (cost dependent on distance and bandwidth).
Radio License to operate a radio station and other running costs; or buying time on an existing radio station – R300 to R800 per minute37
No cluster hub and access network required.
Distribution facilities are normally owned by licensed signal distributors, typically Sentech.
WorldSpace – Satellite Radio
Uplink facility at Craighall in Johannesburg. Receivers are priced at about R1000.
Example of a radio network that provides a digital service across the African continent. Proprietary transmission scheme and hence proprietary equipment. Management of the distribution facility is by WorldSpace. Quality of the service is high but the reliability of the service is entirely dependant on the proper functioning of one satellite.
Television (TV) License to operate a TV station and other running costs; or buying time on an existing TV station for educational
No cluster hub and access network required Distribution facilities are normally owned by licensed signal distributors, typically Sentech or Orbicom.
37 SAIDE (1998) A School-based Education Broadcasting in South Africa: Strategic Plan for SABC, SAIDE: Johannesburg
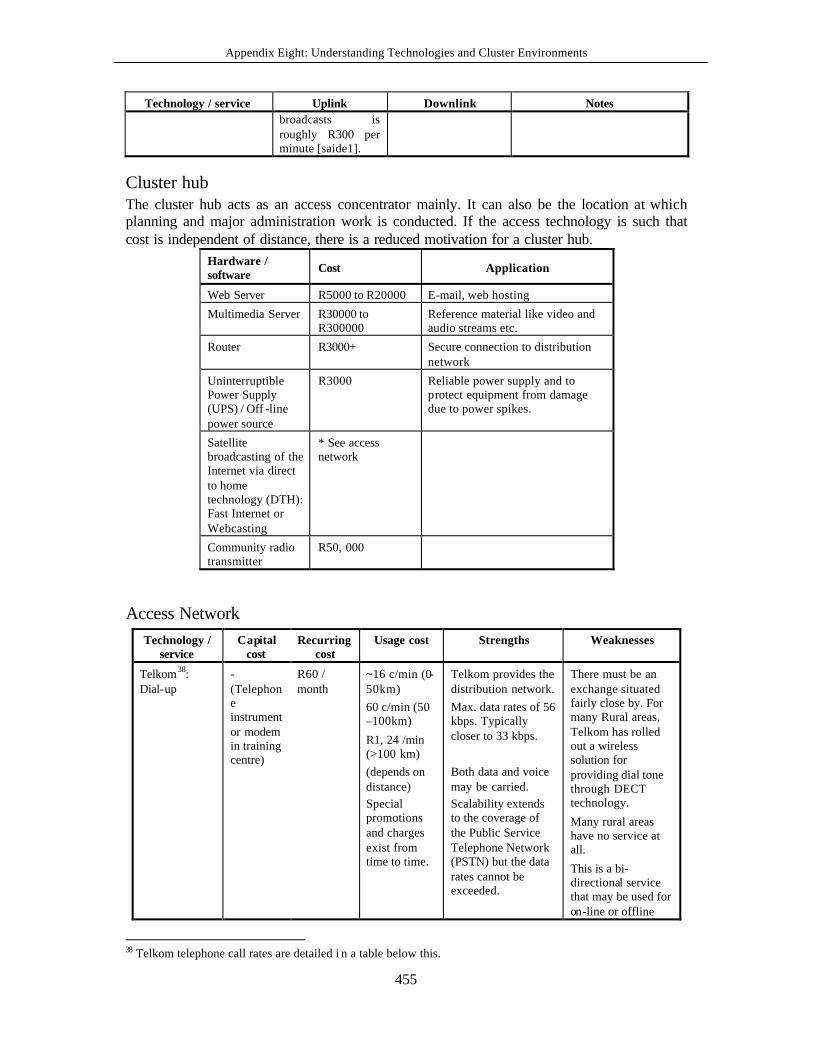
Appendix Eight: Understanding Technologies and Cluster Environments
455
Technology / service Uplink Downlink Notes broadcasts is roughly R300 per minute [saide1].
Cluster hub The cluster hub acts as an access concentrator mainly. It can also be the location at which planning and major administration work is conducted. If the access technology is such that cost is independent of distance, there is a reduced motivation for a cluster hub.
Hardware / software Cost Application
Web Server R5000 to R20000 E-mail, web hosting
Multimedia Server R30000 to R300000
Reference material like video and audio streams etc.
Router R3000+ Secure connection to distribution network
Uninterruptible Power Supply (UPS) / Off -line power source
R3000 Reliable power supply and to protect equipment from damage due to power spikes.
Satellite broadcasting of the Internet via direct to home technology (DTH): Fast Internet or Webcasting
* See access network
Community radio transmitter
R50, 000
Access Network Technology /
service Capital
cost Recurring
cost Usage cost Strengths Weaknesses
Telkom38: Dial-up
- (Telephone instrument or modem in training centre)
R60 / month
~16 c/min (0-50km) 60 c/min (50 –100km)
R1, 24 /min (>100 km) (depends on distance) Special promotions and charges exist from time to time.
Telkom provides the distribution network. Max. data rates of 56 kbps. Typically closer to 33 kbps. Both data and voice may be carried. Scalability extends to the coverage of the Public Service Telephone Network (PSTN) but the data rates cannot be exceeded.
There must be an exchange situated fairly close by. For many Rural areas, Telkom has rolled out a wireless solution for providing dial tone through DECT technology.
Many rural areas have no service at all.
This is a bi-directional service that may be used for on-line or offline
38 Telkom telephone call rates are detailed i n a table below this.
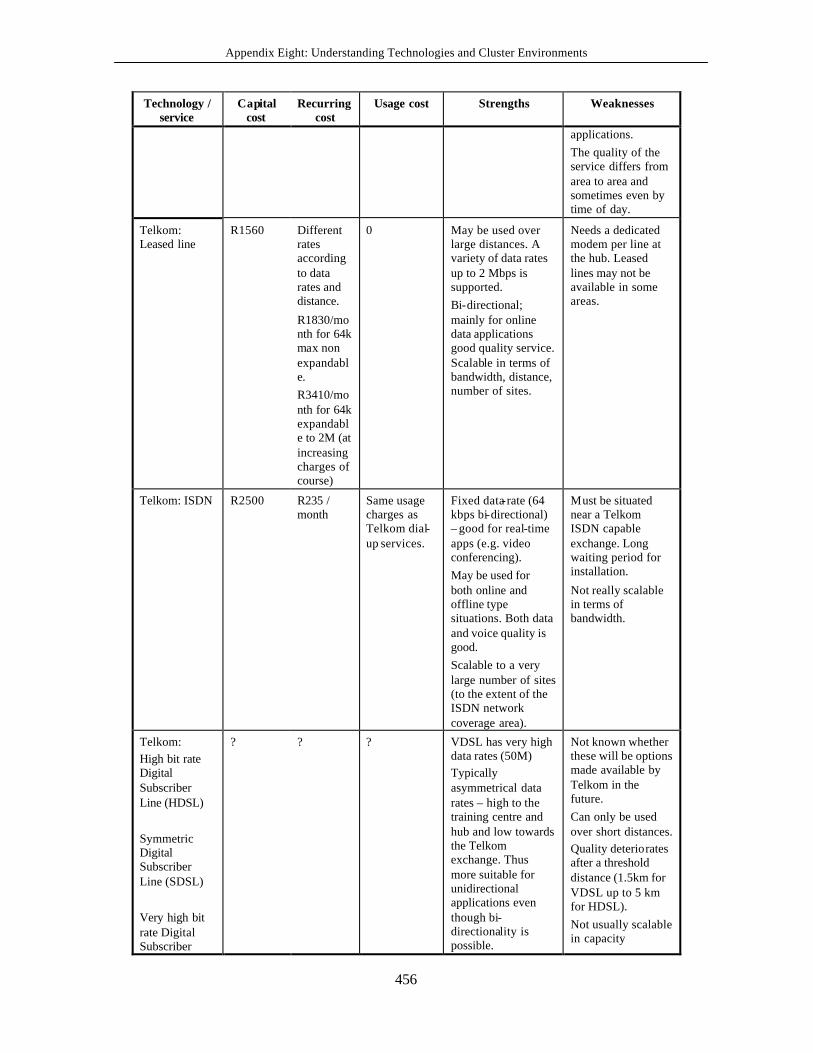
Appendix Eight: Understanding Technologies and Cluster Environments
456
Technology / service
Capital cost
Recurring cost
Usage cost Strengths Weaknesses
applications. The quality of the service differs from area to area and sometimes even by time of day.
Telkom: Leased line
R1560 Different rates according to data rates and distance.
R1830/month for 64k max non expandable. R3410/month for 64k expandable to 2M (at increasing charges of course)
0 May be used over large distances. A variety of data rates up to 2 Mbps is supported. Bi-directional; mainly for online data applications good quality service. Scalable in terms of bandwidth, distance, number of sites.
Needs a dedicated modem per line at the hub. Leased lines may not be available in some areas.
Telkom: ISDN R2500 R235 / month
Same usage charges as Telkom dial-up services.
Fixed data-rate (64 kbps bi-directional) – good for real-time apps (e.g. video conferencing). May be used for both online and offline type situations. Both data and voice quality is good. Scalable to a very large number of sites (to the extent of the ISDN network coverage area).
Must be situated near a Telkom ISDN capable exchange. Long waiting period for installation.
Not really scalable in terms of bandwidth.
Telkom: High bit rate Digital Subscriber Line (HDSL)
Symmetric Digital Subscriber Line (SDSL) Very high bit rate Digital Subscriber Line (VDSL)
? ? ? VDSL has very high data rates (50M) Typically asymmetrical data rates – high to the training centre and hub and low towards the Telkom exchange. Thus more suitable for unidirectional applications even though bi-directionality is possible.
Not known whether these will be options made available by Telkom in the future. Can only be used over short distances. Quality deteriorates after a threshold distance (1.5km for VDSL up to 5 km for HDSL). Not usually scalable in capacity
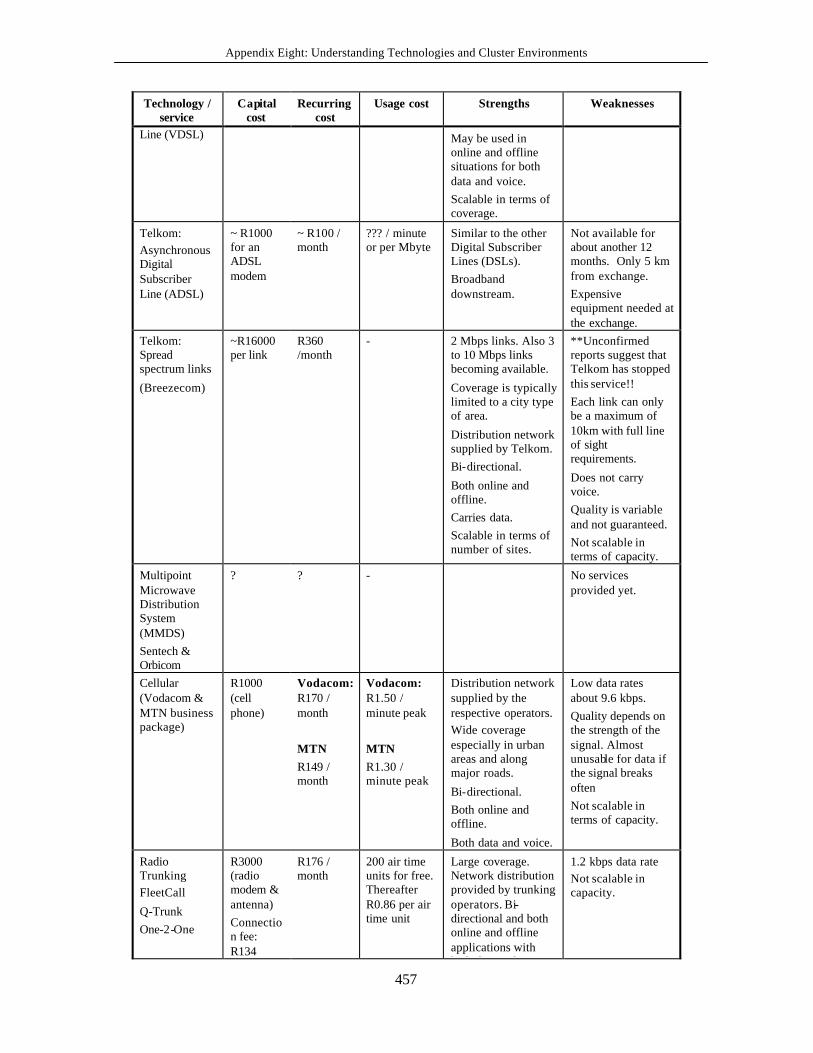
Appendix Eight: Understanding Technologies and Cluster Environments
457
Technology / service
Capital cost
Recurring cost
Usage cost Strengths Weaknesses
Line (VDSL)
May be used in online and offline situations for both data and voice. Scalable in terms of coverage.
Telkom: Asynchronous Digital Subscriber Line (ADSL)
~ R1000 for an ADSL modem
~ R100 / month
??? / minute or per Mbyte
Similar to the other Digital Subscriber Lines (DSLs). Broadband downstream.
Not available for about another 12 months. Only 5 km from exchange. Expensive equipment needed at the exchange.
Telkom: Spread spectrum links
(Breezecom)
~R16000 per link
R360 /month
- 2 Mbps links. Also 3 to 10 Mbps links becoming available.
Coverage is typically limited to a city type of area.
Distribution network supplied by Telkom. Bi-directional.
Both online and offline. Carries data. Scalable in terms of number of sites.
**Unconfirmed reports suggest that Telkom has stopped this service!! Each link can only be a maximum of 10km with full line of sight requirements.
Does not carry voice. Quality is variable and not guaranteed. Not scalable in terms of capacity.
Multipoint Microwave Distribution System (MMDS) Sentech & Orbicom
? ? - No services provided yet.
Cellular (Vodacom & MTN business package)
R1000 (cell phone)
Vodacom: R170 / month
MTN R149 / month
Vodacom: R1.50 / minute peak
MTN R1.30 / minute peak
Distribution network supplied by the respective operators. Wide coverage especially in urban areas and along major roads.
Bi-directional. Both online and offline.
Both data and voice.
Low data rates about 9.6 kbps. Quality depends on the strength of the signal. Almost unusable for data if the signal breaks often Not scalable in terms of capacity.
Radio Trunking FleetCall
Q-Trunk One-2-One
R3000 (radio modem & antenna) Connection fee: R134
R176 / month
200 air time units for free. Thereafter R0.86 per air time unit
Large coverage. Network distribution provided by trunking operators. Bi-directional and both online and offline applications with both data and voice.
1.2 kbps data rate Not scalable in capacity.
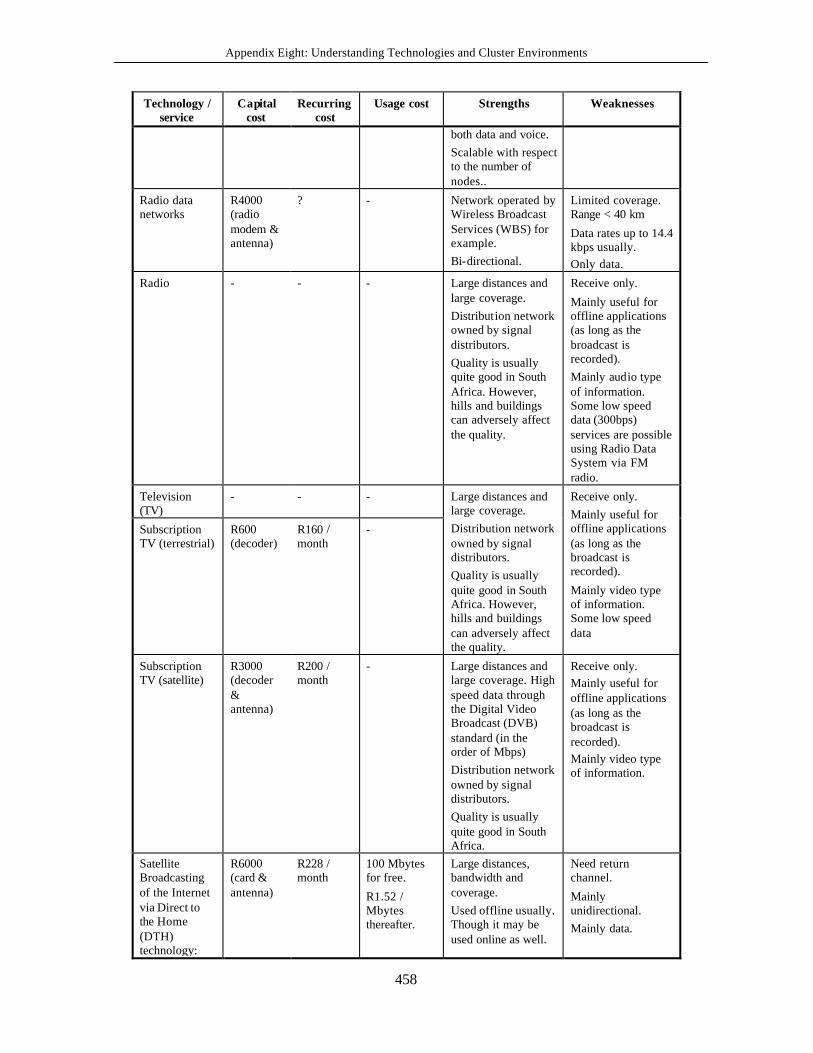
Appendix Eight: Understanding Technologies and Cluster Environments
458
Technology / service
Capital cost
Recurring cost
Usage cost Strengths Weaknesses
both data and voice. Scalable with respect to the number of nodes..
Radio data networks
R4000 (radio modem & antenna)
? - Network operated by Wireless Broadcast Services (WBS) for example. Bi-directional.
Limited coverage. Range < 40 km
Data rates up to 14.4 kbps usually. Only data.
Radio - - - Large distances and large coverage. Distribution network owned by signal distributors. Quality is usually quite good in South Africa. However, hills and buildings can adversely affect the quality.
Receive only.
Mainly useful for offline applications (as long as the broadcast is recorded). Mainly audio type of information. Some low speed data (300bps) services are possible using Radio Data System via FM radio.
Television (TV)
- - -
Subscription TV (terrestrial)
R600 (decoder)
R160 / month
-
Large distances and large coverage. Distribution network owned by signal distributors. Quality is usually quite good in South Africa. However, hills and buildings can adversely affect the quality.
Receive only. Mainly useful for offline applications (as long as the broadcast is recorded).
Mainly video type of information. Some low speed data
Subscription TV (satellite)
R3000 (decoder & antenna)
R200 / month
- Large distances and large coverage. High speed data through the Digital Video Broadcast (DVB) standard (in the order of Mbps) Distribution network owned by signal distributors. Quality is usually quite good in South Africa.
Receive only. Mainly useful for offline applications (as long as the broadcast is recorded). Mainly video type of information.
Satellite Broadcasting of the Internet via Direct to the Home (DTH) technology:
R6000 (card & antenna)
R228 / month
100 Mbytes for free.
R1.52 / Mbytes thereafter.
Large distances, bandwidth and coverage. Used offline usually. Though it may be used online as well.
Need return channel.
Mainly unidirectional. Mainly data.
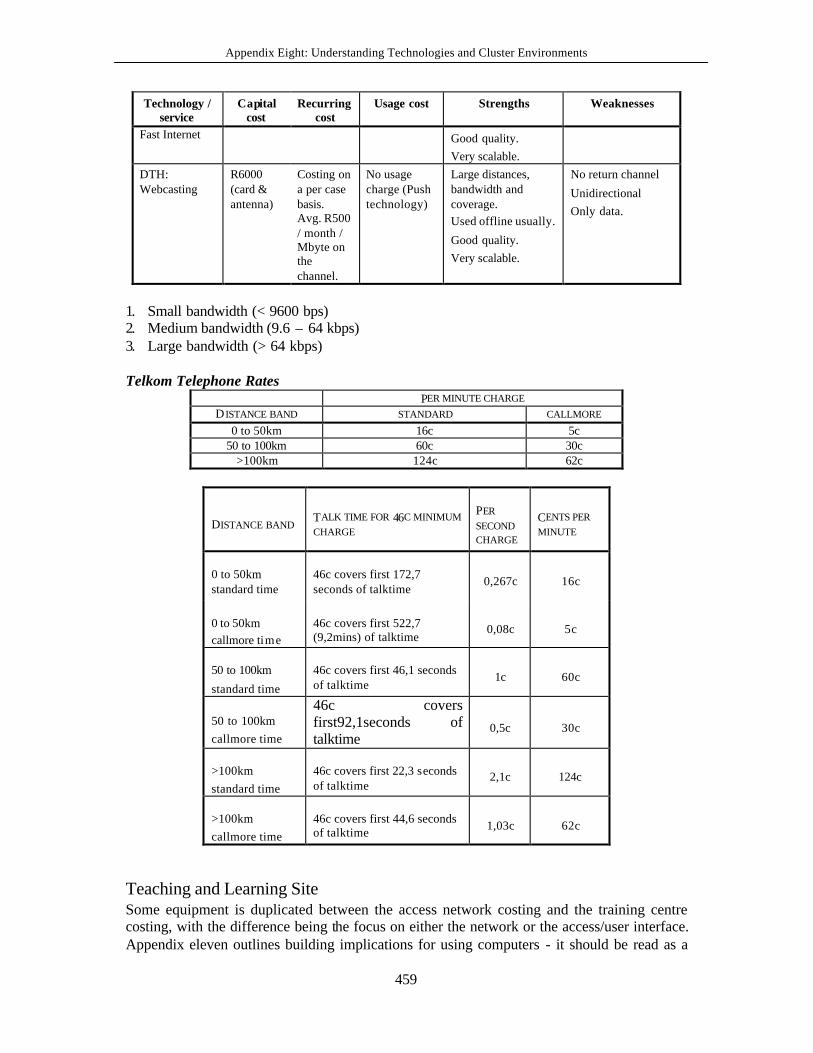
Appendix Eight: Understanding Technologies and Cluster Environments
459
Technology / service
Capital cost
Recurring cost
Usage cost Strengths Weaknesses
Fast Internet Good quality. Very scalable.
DTH: Webcasting
R6000 (card & antenna)
Costing on a per case basis. Avg. R500 / month / Mbyte on the channel.
No usage charge (Push technology)
Large distances, bandwidth and coverage. Used offline usually.
Good quality. Very scalable.
No return channel
Unidirectional Only data.
1. Small bandwidth (< 9600 bps) 2. Medium bandwidth (9.6 – 64 kbps) 3. Large bandwidth (> 64 kbps) Telkom Telephone Rates
PER MINUTE CHARGE D ISTANCE BAND STANDARD CALLMORE
0 to 50km 16c 5c 50 to 100km 60c 30c
>100km 124c 62c
DISTANCE BAND TALK TIME FOR 46C MINIMUM CHARGE
PER SECOND CHARGE
CENTS PER MINUTE
0 to 50km standard time
46c covers first 172,7 seconds of talktime
0,267c 16c
0 to 50km callmore time
46c covers first 522,7 (9,2mins) of talktime
0,08c 5c
50 to 100km
standard time
46c covers first 46,1 seconds of talktime
1c 60c
50 to 100km callmore time
46c covers first92,1seconds of talktime
0,5c 30c
>100km standard time
46c covers first 22,3 seconds of talktime
2,1c 124c
>100km callmore time
46c covers first 44,6 seconds of talktime 1,03c 62c
Teaching and Learning Site Some equipment is duplicated between the access network costing and the training centre costing, with the difference being the focus on either the network or the access/user interface. Appendix eleven outlines building implications for using computers - it should be read as a
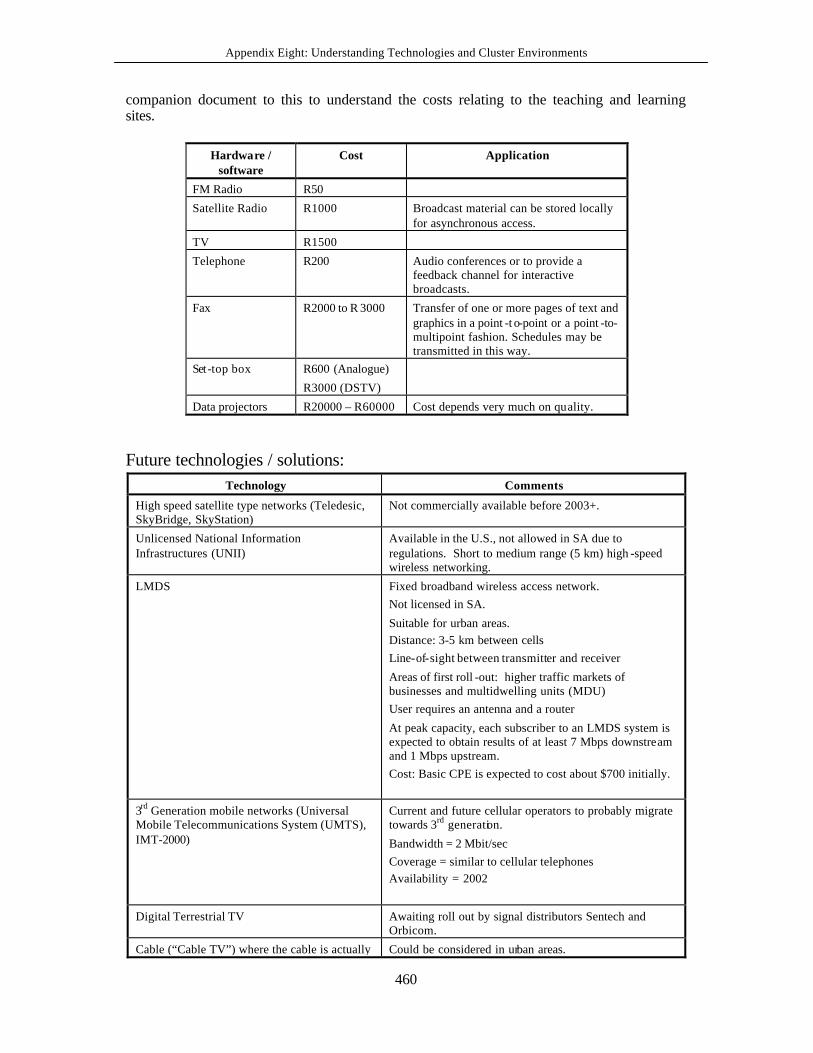
Appendix Eight: Understanding Technologies and Cluster Environments
460
companion document to this to understand the costs relating to the teaching and learning sites.
Hardware / software
Cost Application
FM Radio R50
Satellite Radio R1000 Broadcast material can be stored locally for asynchronous access.
TV R1500
Telephone R200 Audio conferences or to provide a feedback channel for interactive broadcasts.
Fax R2000 to R 3000 Transfer of one or more pages of text and graphics in a point -t o-point or a point -to-multipoint fashion. Schedules may be transmitted in this way.
Set-top box R600 (Analogue)
R3000 (DSTV)
Data projectors R20000 – R60000 Cost depends very much on quality.
Future technologies / solutions: Technology Comments
High speed satellite type networks (Teledesic, SkyBridge, SkyStation)
Not commercially available before 2003+.
Unlicensed National Information Infrastructures (UNII)
Available in the U.S., not allowed in SA due to regulations. Short to medium range (5 km) high -speed wireless networking.
LMDS Fixed broadband wireless access network. Not licensed in SA.
Suitable for urban areas. Distance: 3-5 km between cells Line-of-sight between transmitter and receiver
Areas of first roll -out: higher traffic markets of businesses and multidwelling units (MDU) User requires an antenna and a router
At peak capacity, each subscriber to an LMDS system is expected to obtain results of at least 7 Mbps downstream and 1 Mbps upstream. Cost: Basic CPE is expected to cost about $700 initially.
3rd Generation mobile networks (Universal Mobile Telecommunications System (UMTS), IMT-2000)
Current and future cellular operators to probably migrate towards 3rd generation.
Bandwidth = 2 Mbit/sec Coverage = similar to cellular telephones Availability = 2002
Digital Terrestrial TV Awaiting roll out by signal distributors Sentech and Orbicom.
Cable (“Cable TV”) where the cable is actually Could be considered in urban areas.
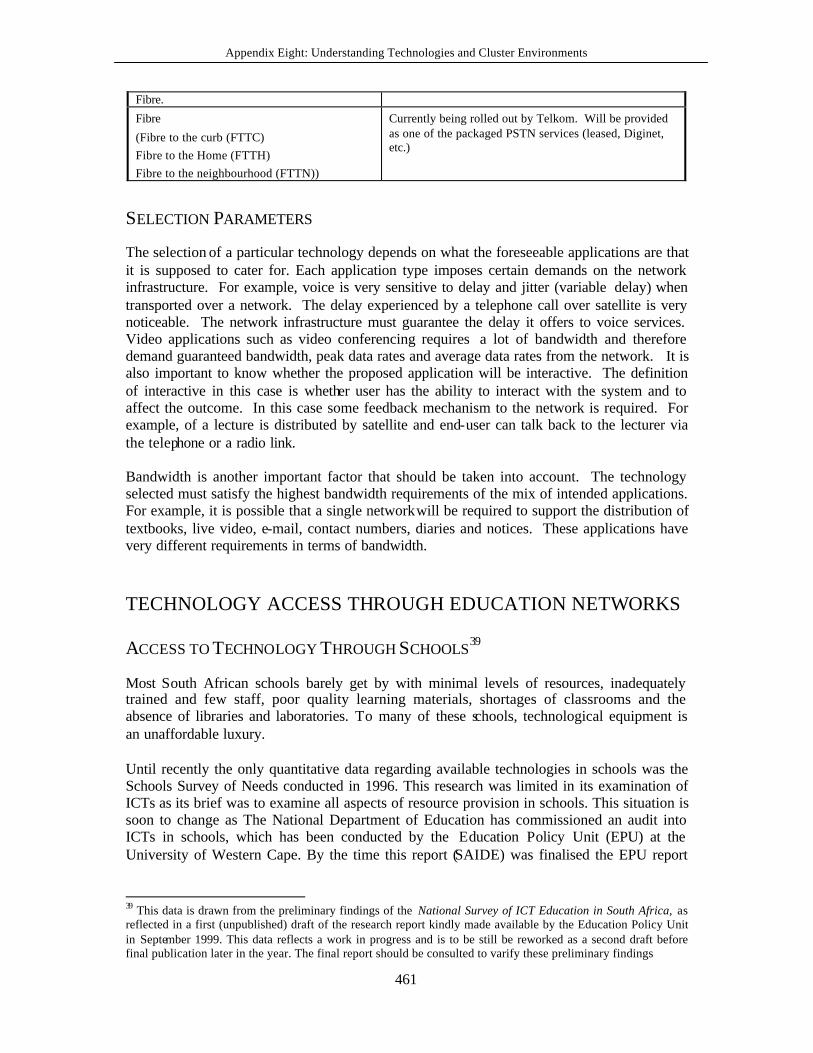
Appendix Eight: Understanding Technologies and Cluster Environments
461
Fibre.
Fibre
(Fibre to the curb (FTTC) Fibre to the Home (FTTH) Fibre to the neighbourhood (FTTN))
Currently being rolled out by Telkom. Will be provided as one of the packaged PSTN services (leased, Diginet, etc.)
SELECTION PARAMETERS
The selection of a particular technology depends on what the foreseeable applications are that it is supposed to cater for. Each application type imposes certain demands on the network infrastructure. For example, voice is very sensitive to delay and jitter (variable delay) when transported over a network. The delay experienced by a telephone call over satellite is very noticeable. The network infrastructure must guarantee the delay it offers to voice services. Video applications such as video conferencing requires a lot of bandwidth and therefore demand guaranteed bandwidth, peak data rates and average data rates from the network. It is also important to know whether the proposed application will be interactive. The definition of interactive in this case is whether user has the ability to interact with the system and to affect the outcome. In this case some feedback mechanism to the network is required. For example, of a lecture is distributed by satellite and end-user can talk back to the lecturer via the telephone or a radio link. Bandwidth is another important factor that should be taken into account. The technology selected must satisfy the highest bandwidth requirements of the mix of intended applications. For example, it is possible that a single network will be required to support the distribution of textbooks, live video, e-mail, contact numbers, diaries and notices. These applications have very different requirements in terms of bandwidth.
TECHNOLOGY ACCESS THROUGH EDUCATION NETWORKS
ACCESS TO TECHNOLOGY THROUGH SCHOOLS39
Most South African schools barely get by with minimal levels of resources, inadequately trained and few staff, poor quality learning materials, shortages of classrooms and the absence of libraries and laboratories. To many of these schools, technological equipment is an unaffordable luxury. Until recently the only quantitative data regarding available technologies in schools was the Schools Survey of Needs conducted in 1996. This research was limited in its examination of ICTs as its brief was to examine all aspects of resource provision in schools. This situation is soon to change as The National Department of Education has commissioned an audit into ICTs in schools, which has been conducted by the Education Policy Unit (EPU) at the University of Western Cape. By the time this report (SAIDE) was finalised the EPU report
39 This data is drawn from the preliminary findings of the National Survey of ICT Education in South Africa, as reflected in a first (unpublished) draft of the research report kindly made available by the Education Policy Unit in September 1999. This data reflects a work in progress and is to be still be reworked as a second draft before final publication later in the year. The final report should be consulted to varify these preliminary findings
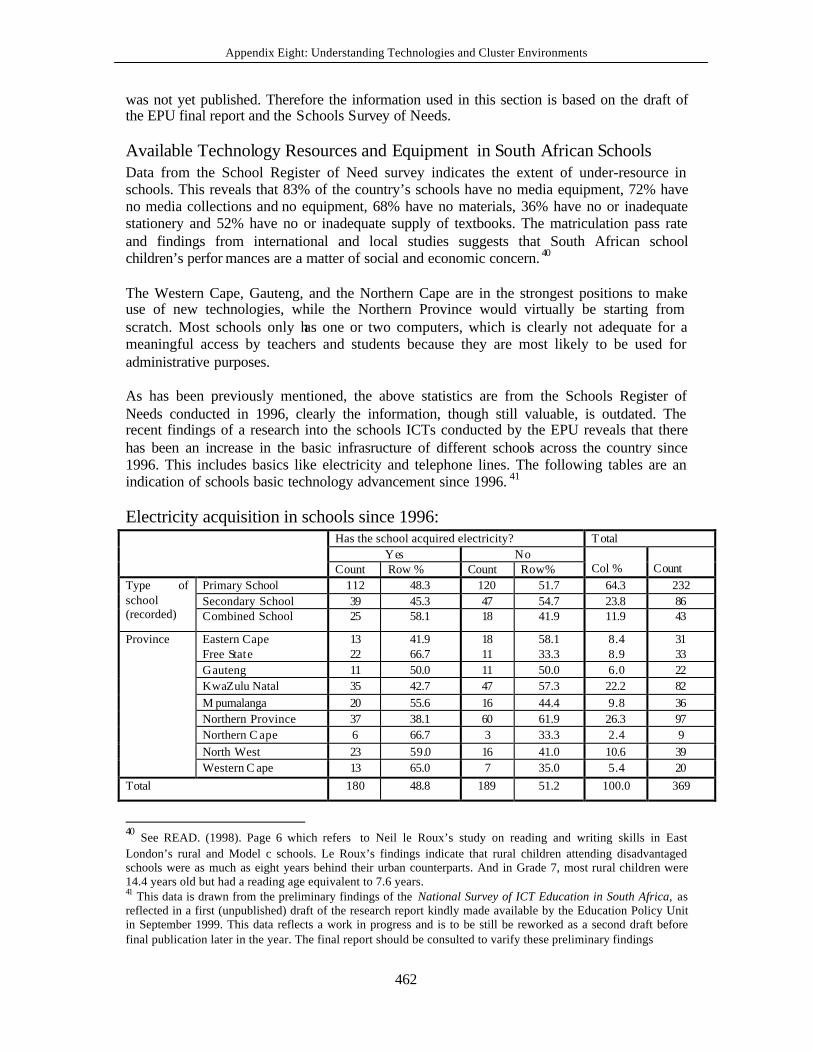
Appendix Eight: Understanding Technologies and Cluster Environments
462
was not yet published. Therefore the information used in this section is based on the draft of the EPU final report and the Schools Survey of Needs.
Available Technology Resources and Equipment in South African Schools Data from the School Register of Need survey indicates the extent of under-resource in schools. This reveals that 83% of the country’s schools have no media equipment, 72% have no media collections and no equipment, 68% have no materials, 36% have no or inadequate stationery and 52% have no or inadequate supply of textbooks. The matriculation pass rate and findings from international and local studies suggests that South African school children’s perfor mances are a matter of social and economic concern. 40 The Western Cape, Gauteng, and the Northern Cape are in the strongest positions to make use of new technologies, while the Northern Province would virtually be starting from scratch. Most schools only has one or two computers, which is clearly not adequate for a meaningful access by teachers and students because they are most likely to be used for administrative purposes. As has been previously mentioned, the above statistics are from the Schools Register of Needs conducted in 1996, clearly the information, though still valuable, is outdated. The recent findings of a research into the schools ICTs conducted by the EPU reveals that there has been an increase in the basic infrasructure of different schools across the country since 1996. This includes basics like electricity and telephone lines. The following tables are an indication of schools basic technology advancement since 1996. 41
Electricity acquisition in schools since 1996: Has the school acquired electricity? T otal
Yes No
Count Row % Count Row% Col %
Count
Primary School 112 48.3 120 51.7 64.3 232 Secondary School 39 45.3 47 54.7 23.8 86
Type of school (recorded) Combined School 25 58.1 18 41.9 11.9 43
Eastern Cape Free State
13 22
41.9 66.7
18 11
58.1 33.3
8.4 8.9
31 33
Gauteng 11 50.0 11 50.0 6.0 22 KwaZulu Natal 35 42.7 47 57.3 22.2 82 M pumalanga 20 55.6 16 44.4 9.8 36 Northern Province 37 38.1 60 61.9 26.3 97 Northern C ape 6 66.7 3 33.3 2.4 9 North West 23 59.0 16 41.0 10.6 39
Province
Western C ape 13 65.0 7 35.0 5.4 20 Total 180 48.8 189 51.2 100.0 369
40 See READ. (1998). Page 6 which refers to Neil le Roux’s study on reading and writing skills in East London’s rural and Model c schools. Le Roux’s findings indicate that rural children attending disadvantaged schools were as much as eight years behind their urban counterparts. And in Grade 7, most rural children were 14.4 years old but had a reading age equivalent to 7.6 years. 41 This data is drawn from the preliminary findings of the National Survey of ICT Education in South Africa, as reflected in a first (unpublished) draft of the research report kindly made available by the Education Policy Unit in September 1999. This data reflects a work in progress and is to be still be reworked as a second draft before final publication later in the year. The final report should be consulted to varify these preliminary findings
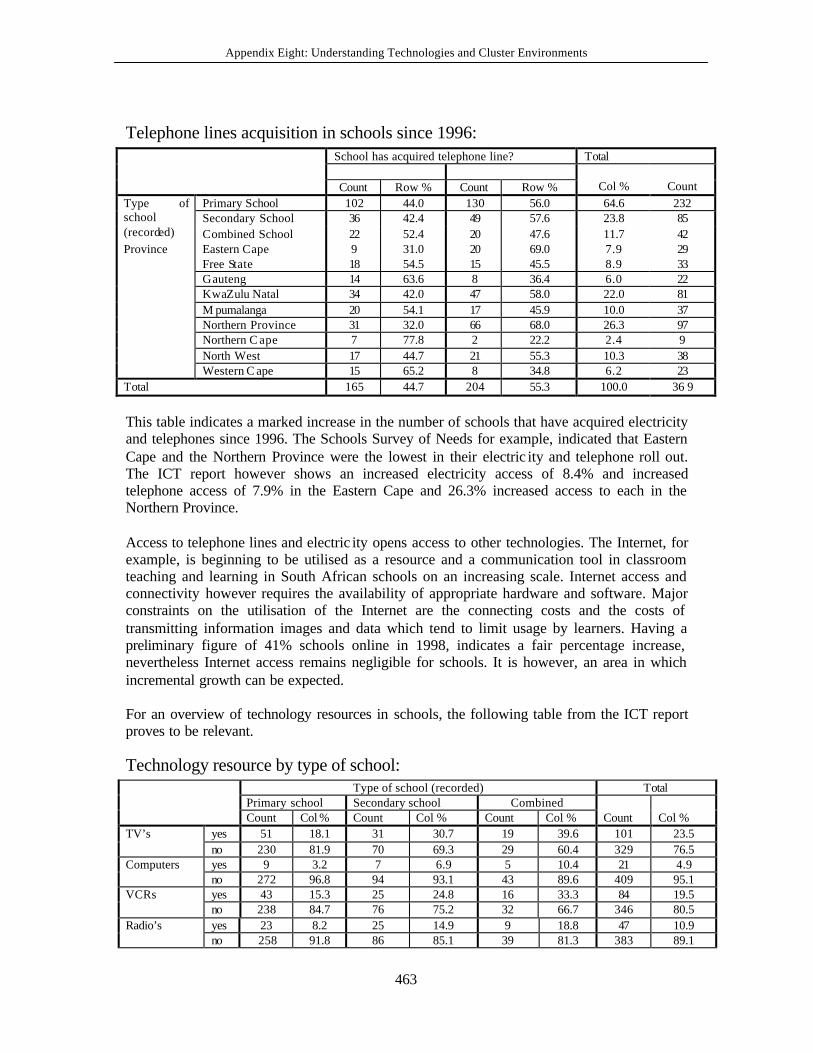
Appendix Eight: Understanding Technologies and Cluster Environments
463
Telephone lines acquisition in schools since 1996: School has acquired telephone line? Total
Count Row % Count Row %
Col %
Count Primary School 102 44.0 130 56.0 64.6 232 Secondary School 36 42.4 49 57.6 23.8 85
Type of school (recorded) Combined School 22 52.4 20 47.6 11.7 42
Eastern Cape 9 31.0 20 69.0 7.9 29 Free State 18 54.5 15 45.5 8.9 33 Gauteng 14 63.6 8 36.4 6.0 22 KwaZulu Natal 34 42.0 47 58.0 22.0 81 M pumalanga 20 54.1 17 45.9 10.0 37 Northern Province 31 32.0 66 68.0 26.3 97 Northern C ape 7 77.8 2 22.2 2.4 9 North West 17 44.7 21 55.3 10.3 38
Province
Western C ape 15 65.2 8 34.8 6.2 23 Total 165 44.7 204 55.3 100.0 36 9
This table indicates a marked increase in the number of schools that have acquired electricity and telephones since 1996. The Schools Survey of Needs for example, indicated that Eastern Cape and the Northern Province were the lowest in their electric ity and telephone roll out. The ICT report however shows an increased electricity access of 8.4% and increased telephone access of 7.9% in the Eastern Cape and 26.3% increased access to each in the Northern Province. Access to telephone lines and electric ity opens access to other technologies. The Internet, for example, is beginning to be utilised as a resource and a communication tool in classroom teaching and learning in South African schools on an increasing scale. Internet access and connectivity however requires the availability of appropriate hardware and software. Major constraints on the utilisation of the Internet are the connecting costs and the costs of transmitting information images and data which tend to limit usage by learners. Having a preliminary figure of 41% schools online in 1998, indicates a fair percentage increase, nevertheless Internet access remains negligible for schools. It is however, an area in which incremental growth can be expected. For an overview of technology resources in schools, the following table from the ICT report proves to be relevant.
Technology resource by type of school: Type of school (recorded) Total
Primary school Secondary school Combined
Count Col % Count Col % Count Col % Count
Col %
yes 51 18.1 31 30.7 19 39.6 101 23.5 TV’s no 230 81.9 70 69.3 29 60.4 329 76.5 yes 9 3.2 7 6.9 5 10.4 21 4.9 Computers no 272 96.8 94 93.1 43 89.6 409 95.1 yes 43 15.3 25 24.8 16 33.3 84 19.5 VCRs no 238 84.7 76 75.2 32 66.7 346 80.5 yes 23 8.2 25 14.9 9 18.8 47 10.9 Radio’s
no 258 91.8 86 85.1 39 81.3 383 89.1
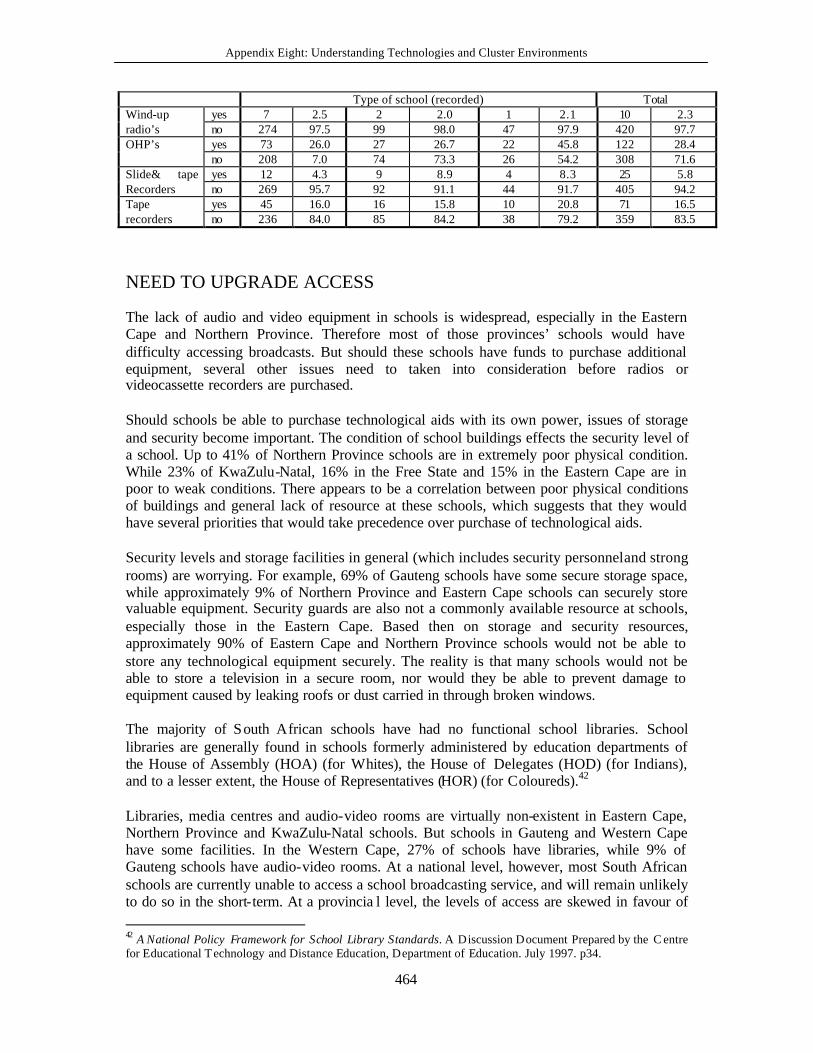
Appendix Eight: Understanding Technologies and Cluster Environments
464
Type of school (recorded) Total yes 7 2.5 2 2.0 1 2.1 10 2.3 Wind-up
radio’s no 274 97.5 99 98.0 47 97.9 420 97.7 yes 73 26.0 27 26.7 22 45.8 122 28.4 OHP’s no 208 7.0 74 73.3 26 54.2 308 71.6 yes 12 4.3 9 8.9 4 8.3 25 5.8 Slide& tape
Recorders no 269 95.7 92 91.1 44 91.7 405 94.2 yes 45 16.0 16 15.8 10 20.8 71 16.5 Tape
recorders no 236 84.0 85 84.2 38 79.2 359 83.5
NEED TO UPGRADE ACCESS
The lack of audio and video equipment in schools is widespread, especially in the Eastern Cape and Northern Province. Therefore most of those provinces’ schools would have difficulty accessing broadcasts. But should these schools have funds to purchase additional equipment, several other issues need to taken into consideration before radios or videocassette recorders are purchased. Should schools be able to purchase technological aids with its own power, issues of storage and security become important. The condition of school buildings effects the security level of a school. Up to 41% of Northern Province schools are in extremely poor physical condition. While 23% of KwaZulu-Natal, 16% in the Free State and 15% in the Eastern Cape are in poor to weak conditions. There appears to be a correlation between poor physical conditions of buildings and general lack of resource at these schools, which suggests that they would have several priorities that would take precedence over purchase of technological aids. Security levels and storage facilities in general (which includes security personnel and strong rooms) are worrying. For example, 69% of Gauteng schools have some secure storage space, while approximately 9% of Northern Province and Eastern Cape schools can securely store valuable equipment. Security guards are also not a commonly available resource at schools, especially those in the Eastern Cape. Based then on storage and security resources, approximately 90% of Eastern Cape and Northern Province schools would not be able to store any technological equipment securely. The reality is that many schools would not be able to store a television in a secure room, nor would they be able to prevent damage to equipment caused by leaking roofs or dust carried in through broken windows. The majority of South African schools have had no functional school libraries. School libraries are generally found in schools formerly administered by education departments of the House of Assembly (HOA) (for Whites), the House of Delegates (HOD) (for Indians), and to a lesser extent, the House of Representatives (HOR) (for Coloureds).42 Libraries, media centres and audio-video rooms are virtually non-existent in Eastern Cape, Northern Province and KwaZulu-Natal schools. But schools in Gauteng and Western Cape have some facilities. In the Western Cape, 27% of schools have libraries, while 9% of Gauteng schools have audio-video rooms. At a national level, however, most South African schools are currently unable to access a school broadcasting service, and will remain unlikely to do so in the short-term. At a provincia l level, the levels of access are skewed in favour of 42 A National Policy Framework for School Library Standards. A Discussion Document Prepared by the C entre for Educational T echnology and Distance Education, Department of Education. July 1997. p34.
Appendix Eight: Understanding Technologies and Cluster Environments
465
the Western Cape, Gauteng, and to a lesser extent, the Northern Cape. Eastern Cape, Northern Province, and KwaZulu-Natal schools appear least likely to benefit from this service until other resources are extended. The descriptions presented here and trends identified suggest that, if a school has a library or a media centre (most do not), then there is a likelihood that the school has the necessary storage and security facilities to support the purchasing of a radio or tape recorder. The presence of these facilities would place those schools at a slightly better advantage, but would still not guarantee that the service would be educationally beneficial. A ‘one school-one television’ approach is also not viable, because most schools have 500 students, and one television would not substantially improve access in terms of technology-student ratio. Most South African schools have access to some form of postal service. According to the School Register of Needs research data, 117 schools do not have postal addresses. Of these, 39 are located in the Eastern Cape and 27 in KwaZulu -Natal, while a significant percentage is primary schools. Given that only 117 schools are without postal addresses, the challenge is not so much to provide schools with postal services but to improve the quality of that service. This is especially important given that schools’ postal addresses are often used by rural communities as their contact postal address. The School Register of Needs continues to show in stark terms inequalities within the schooling system. While reasonably well-resourced schools exist, the vast majority of children in South Africa continue to be educated in conditions of extreme neglect. Current estimates suggest that redressing problems outlined in the survey would require an additional R3 billion per year over the next ten years. There is however a need to contextualize this within the debates currently taking place in educational circles. These debates can be summarized as follows: What has emerged from some studies is that in contexts where schooling has collapsed, the condition of school buildings and facilities makes an incalculable difference to the climate of learning and teaching in a school. The morale and confidence of school goers and teachers alike is deeply influenced by the physical environment. Structural improvements and the provision of facilities and equipment to schools remain an important element in the establishment of a culture of learning and teaching in schools. While these will not automatically translate into successful schools and non-material interventions remain necessary, adequate and decent facilities do create a positive environment, affect the working conditions of staff and influence the learning environment.
ACCESS THROUGH MULTI-PURPOSE COMMUNITY CENTRES AND COMMUNITY LEARNING CENTRES
There is a slight but very important distinguishing factor between Multi-Purpose Community Centres (MPCC) and Multi-Purpose Community Learning Centres (MPCLC) normally referred to as community Learning Centres (CLC). Multi-purpose Community Centres (MPCCs) are generally envisaged as structures that can enable communities to manage their own development through having access to appropriate facilities, resources, training and services. Multi-Purpose refers to the various sectors that can
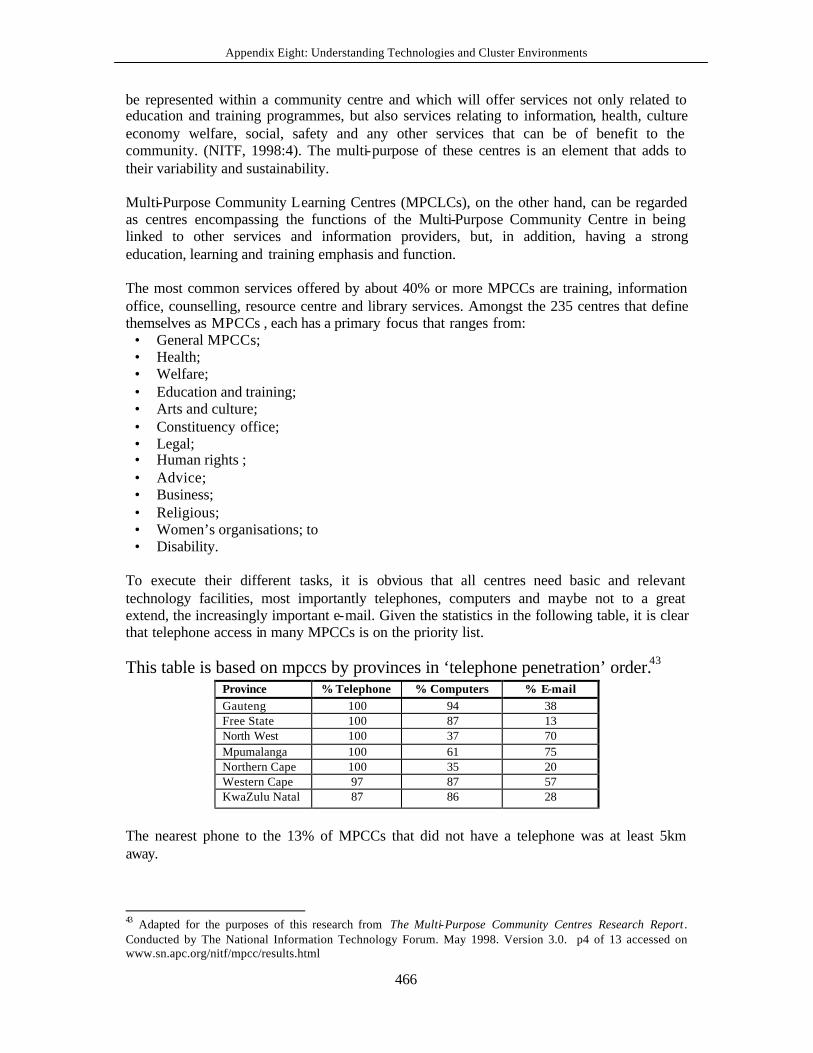
Appendix Eight: Understanding Technologies and Cluster Environments
466
be represented within a community centre and which will offer services not only related to education and training programmes, but also services relating to information, health, culture economy welfare, social, safety and any other services that can be of benefit to the community. (NITF, 1998:4). The multi-purpose of these centres is an element that adds to their variability and sustainability. Multi-Purpose Community Learning Centres (MPCLCs), on the other hand, can be regarded as centres encompassing the functions of the Multi-Purpose Community Centre in being linked to other services and information providers, but, in addition, having a strong education, learning and training emphasis and function. The most common services offered by about 40% or more MPCCs are training, information office, counselling, resource centre and library services. Amongst the 235 centres that define themselves as MPCCs , each has a primary focus that ranges from:
• General MPCCs; • Health; • Welfare; • Education and training; • Arts and culture; • Constituency office; • Legal; • Human rights ; • Advice; • Business; • Religious; • Women’s organisations; to • Disability.
To execute their different tasks, it is obvious that all centres need basic and relevant technology facilities, most importantly telephones, computers and maybe not to a great extend, the increasingly important e-mail. Given the statistics in the following table, it is clear that telephone access in many MPCCs is on the priority list.
This table is based on mpccs by provinces in ‘telephone penetration’ order.43 Province % Telephone % Computers % E-mail Gauteng 100 94 38 Free State 100 87 13 North West 100 37 70 Mpumalanga 100 61 75 Northern Cape 100 35 20 Western Cape 97 87 57 KwaZulu Natal 87 86 28
The nearest phone to the 13% of MPCCs that did not have a telephone was at least 5km away.
43 Adapted for the purposes of this research from The Multi-Purpose Community Centres Research Report . Conducted by The National Information Technology Forum. May 1998. Version 3.0. p4 of 13 accessed on www.sn.apc.org/nitf/mpcc/results.html
Appendix Eight: Understanding Technologies and Cluster Environments
467
It is therefore clear that while other educational environments are adequately equipped to deal with technology enhanced learning, some are still left behind and therefore they put themselves on top of the technology upgrading list. It is only when the majority of the population has access to technology that the marginal use of technology will be minimised. This depends partly in the changing educational models, especially within the CLCs that is realising the need for enhancing education through technology. CLCs are increasingly exploring the possible ICT use like narrow - telecasting and broad- telecasting. Narrow -telecasting is increasingly being targeted at CLCs. It is essentially a communication network of satellite transmissions of televised learning materials to multiple, closed audiences. The general approach consists of feeding a number of centres with a telecast of a specific material. The Shoma foundation, a communication organisation is field testing this approach and telecasting material for in-service educator development.44Much of what applies to narrow –telecasting of programme material applies to the broadcasting of material. One of the attributes of televised learning material is that it arouses interest in the subject. To capitalise on its impact, follow-up strategies and materials are required to get learners to engage with the learning programme45
ACCESS THROUGH POST OFFICE NETWORKS
One of the highlights on the 1998 white paper on postal policy is the commitment that the postal sector undertook when they committed themselves to providing access to technology to developing communities through their Multi-Purpose Centres which are intended to give public access to e-mail, facsimile and Internet services. The latest in meeting their commitment is the introduction of the new system called PiT (Public Information Terminal) which provides the following services:
• Internet, the terminal is able to explore the World Wide Web, bringing the user a world of information on request.
• E-mail, PiT empowers everyone to communicate via e-mail by following the standard procedures. The pit card gives the user the ir own e-mail address. This means that the user can receive e-mail and get replies to the message they send.
• E-commerce, this provides information about goods and services, plus local and national business directories. It allows the user to shop from the business that has advertised. PiT allows for many services of e-commerce, including financial transactions.
PiT uses the smart card technology and gives the cardholder access to electronic communication.
ACCESS THROUGH LIBRARIES
The initial aim of this section was to look into technology infrastructure and access through libraries throughout the nine provinces. Despite numerous attempts to find such data through secondary sources and contacting relevant government departments, we were unable get any
44 The Role of Technology in Supporting the Development and Provision of Education and Training through Multi-Purpose Community Learning Centres Research Report. Centre for Technology and Distance Education. 2 August 1999. p15 45 ibid p16
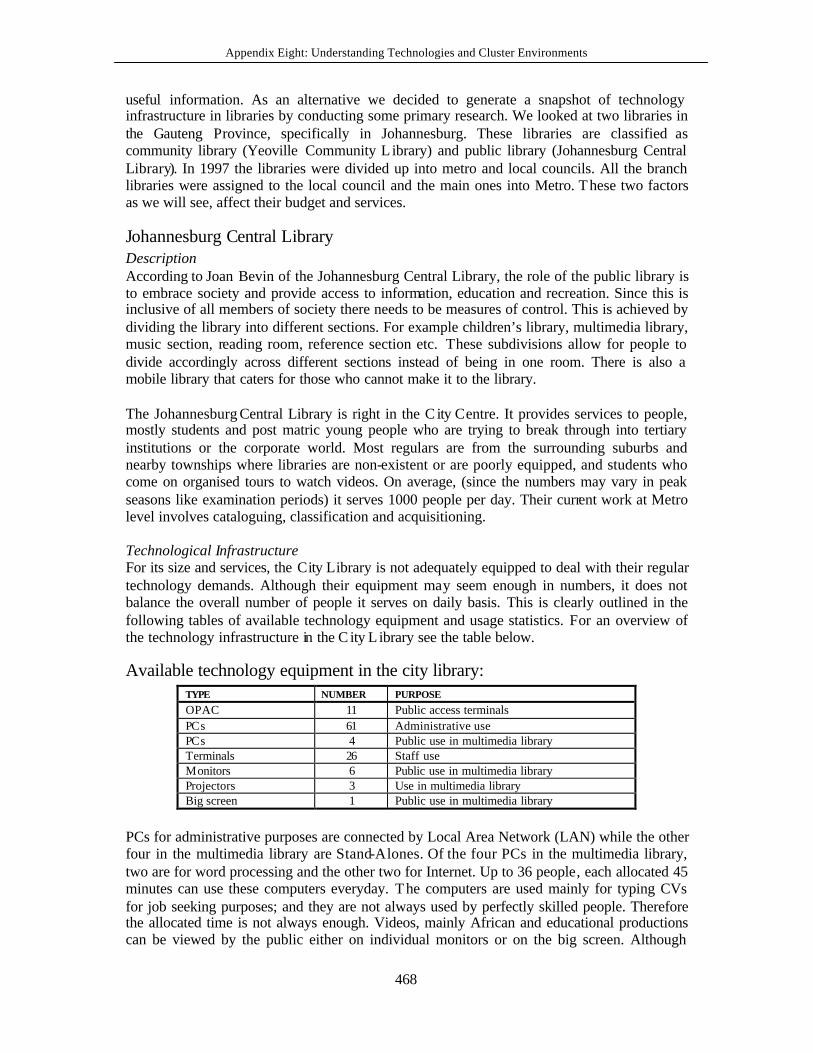
Appendix Eight: Understanding Technologies and Cluster Environments
468
useful information. As an alternative we decided to generate a snapshot of technology infrastructure in libraries by conducting some primary research. We looked at two libraries in the Gauteng Province, specifically in Johannesburg. These libraries are classified as community library (Yeoville Community L ibrary) and public library (Johannesburg Central Library). In 1997 the libraries were divided up into metro and local councils. All the branch libraries were assigned to the local council and the main ones into Metro. These two factors as we will see, affect their budget and services.
Johannesburg Central Library Description According to Joan Bevin of the Johannesburg Central Library, the role of the public library is to embrace society and provide access to information, education and recreation. Since this is inclusive of all members of society there needs to be measures of control. This is achieved by dividing the library into different sections. For example children’s library, multimedia library, music section, reading room, reference section etc. These subdivisions allow for people to divide accordingly across different sections instead of being in one room. There is also a mobile library that caters for those who cannot make it to the library. The Johannesburg Central Library is right in the C ity Centre. It provides services to people, mostly students and post matric young people who are trying to break through into tertiary institutions or the corporate world. Most regulars are from the surrounding suburbs and nearby townships where libraries are non-existent or are poorly equipped, and students who come on organised tours to watch videos. On average, (since the numbers may vary in peak seasons like examination periods) it serves 1000 people per day. Their current work at Metro level involves cataloguing, classification and acquisitioning. Technological Infrastructure For its size and services, the City Library is not adequately equipped to deal with their regular technology demands. Although their equipment may seem enough in numbers, it does not balance the overall number of people it serves on daily basis. This is clearly outlined in the following tables of available technology equipment and usage statistics. For an overview of the technology infrastructure in the C ity L ibrary see the table below.
Available technology equipment in the city library: TYPE NUMBER PURPOSE OPAC 11 Public access terminals PCs 61 Administrative use PCs 4 Public use in multimedia library Terminals 26 Staff use Monitors 6 Public use in multimedia library Projectors 3 Use in multimedia library Big screen 1 Public use in multimedia library
PCs for administrative purposes are connected by Local Area Network (LAN) while the other four in the multimedia library are Stand-Alones. Of the four PCs in the multimedia library, two are for word processing and the other two for Internet. Up to 36 people, each allocated 45 minutes can use these computers everyday. The computers are used mainly for typing CVs for job seeking purposes; and they are not always used by perfectly skilled people. Therefore the allocated time is not always enough. Videos, mainly African and educational productions can be viewed by the public either on individual monitors or on the big screen. Although
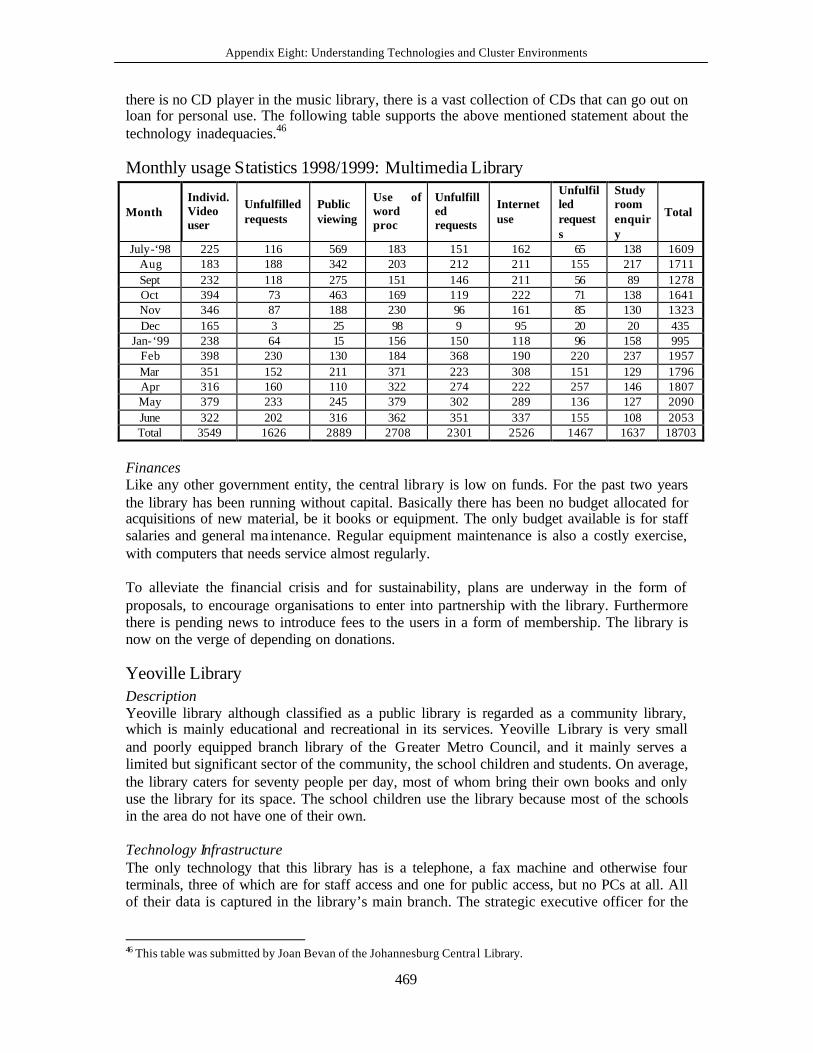
Appendix Eight: Understanding Technologies and Cluster Environments
469
there is no CD player in the music library, there is a vast collection of CDs that can go out on loan for personal use. The following table supports the above mentioned statement about the technology inadequacies.46
Monthly usage Statistics 1998/1999: Multimedia Library
Month Individ. Video user
Unfulfilled requests
Public viewing
Use of word proc
Unfulfilled requests
Internet use
Unfulfilled requests
Study room enquiry
Total
July-‘98 225 116 569 183 151 162 65 138 1609 Aug 183 188 342 203 212 211 155 217 1711 Sept 232 118 275 151 146 211 56 89 1278 Oct 394 73 463 169 119 222 71 138 1641 Nov 346 87 188 230 96 161 85 130 1323 Dec 165 3 25 98 9 95 20 20 435
Jan-‘99 238 64 15 156 150 118 96 158 995 Feb 398 230 130 184 368 190 220 237 1957 Mar 351 152 211 371 223 308 151 129 1796 Apr 316 160 110 322 274 222 257 146 1807 May 379 233 245 379 302 289 136 127 2090 June 322 202 316 362 351 337 155 108 2053 Total 3549 1626 2889 2708 2301 2526 1467 1637 18703
Finances Like any other government entity, the central library is low on funds. For the past two years the library has been running without capital. Basically there has been no budget allocated for acquisitions of new material, be it books or equipment. The only budget available is for staff salaries and general ma intenance. Regular equipment maintenance is also a costly exercise, with computers that needs service almost regularly. To alleviate the financial crisis and for sustainability, plans are underway in the form of proposals, to encourage organisations to enter into partnership with the library. Furthermore there is pending news to introduce fees to the users in a form of membership. The library is now on the verge of depending on donations.
Yeoville Library Description Yeoville library although classified as a public library is regarded as a community library, which is mainly educational and recreational in its services. Yeoville Library is very small and poorly equipped branch library of the Greater Metro Council, and it mainly serves a limited but significant sector of the community, the school children and students. On average, the library caters for seventy people per day, most of whom bring their own books and only use the library for its space. The school children use the library because most of the schools in the area do not have one of their own. Technology Infrastructure The only technology that this library has is a telephone, a fax machine and otherwise four terminals, three of which are for staff access and one for public access, but no PCs at all. All of their data is captured in the library’s main branch. The strategic executive officer for the
46 This table was submitted by Joan Bevan of the Johannesburg Central Library.
Appendix Eight: Understanding Technologies and Cluster Environments
470
metropolitan sub-structure were plans to supply the library with computers for staff and public access, but the finical state at present does not allow for that Finances Like the Johannesburg Central Library and all the other libraries in Greater Metro, the Yeoville Library funds were drastically cut down to staff salaries and general maintenance. Since the sub- structures took over in 1996 the Yeoville lib rary budget was cut from R28, 000 to nothing. This means that for two years now the library has been operating without capital and therefore could not make any new acquisitions of books or any other learning materials. This bad state of affairs is blamed on the deficit of 2,8 billion rands that the council ran into two years ago. As a result of that the council had to exercise drastic budget cuts measures. The libraries are expected to raise their own money, but that is mainly dependent on the area within which the library is operating. For example Sandton L ibrary stands a better chance of succeeding with its fund-raising project than the Yeoville Library. Pat Blittonthall of the Yeoville Library echoed this.