Embed Size (px)
Citation preview
Prof. Paola Gramatica - QSAR Research Unit - DBSF - University of Insubria - Varese (Italy)
Prof. Paola GramaticaProf. Paola GramaticaProf. Paola Gramatica
QSAR and Environmental Chemistry Research UnitQSAR and Environmental Chemistry Research UnitQSAR and Environmental Chemistry Research Unit
DBSF - University of Insubria - Varese
http://www.qsar.it
DBSF DBSF -- University of University of InsubriaInsubria -- VareseVarese
http://http://www.qsar.itwww.qsar.it
Applicazione dellemetodologie QSAR a
problematicheambientali di inquinanti
organici
ApplicazioneApplicazione delledellemetodologiemetodologie QSAR a QSAR a
problematicheproblematicheambientaliambientali didi inquinantiinquinanti
organiciorganici
Università Università deglidegli StudiStudi didi Bologna Bologna -- DottoratoDottorato in in ChimicaChimica IndInd..–– 17/2/ 200417/2/ 2004
Prof. Paola Gramatica - QSAR Research Unit - DBSF - University of Insubria - Varese (Italy)
QuantitativeQuantitativeQuantitative
Structure - ActivityStructure Structure -- ActivityActivity
RelationshipsRelationshipsRelationships
QSARQSARQSAR
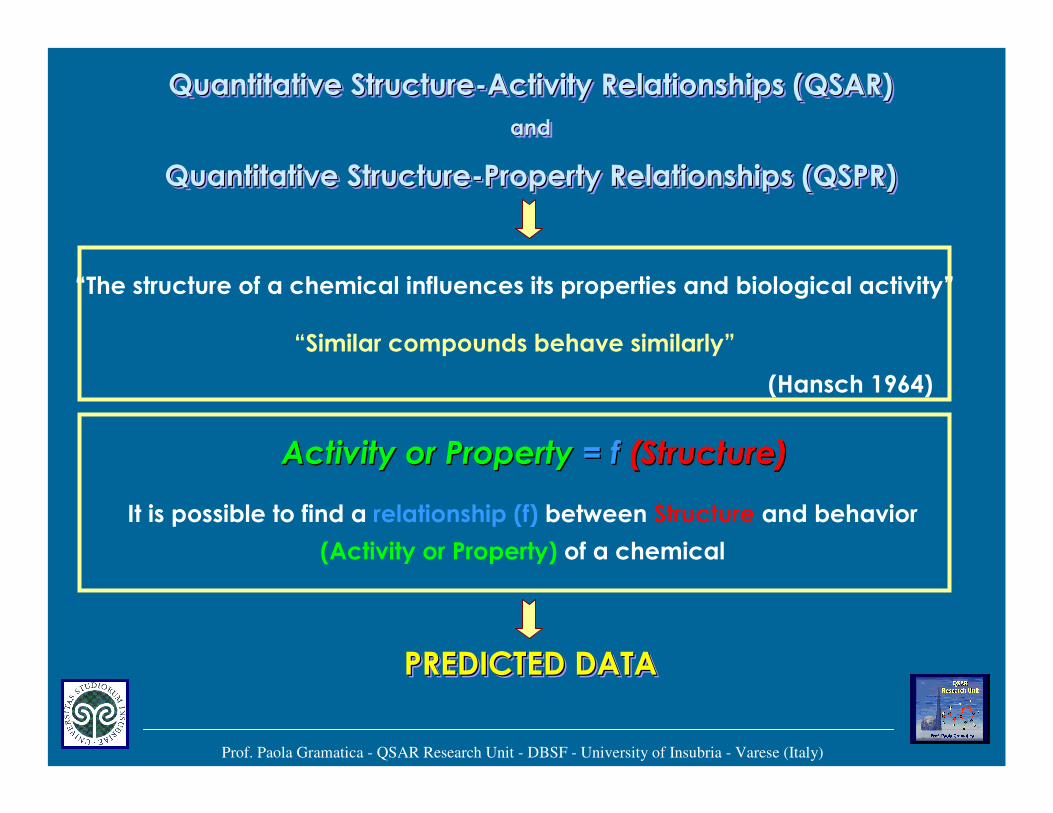
Quantitative Structure-Activity Relationships (QSAR)
and
Quantitative Structure-Property Relationships (QSPR)
Quantitative StructureQuantitative Structure--Activity Relationships (QSAR)Activity Relationships (QSAR)
andand
Quantitative StructureQuantitative Structure--Property Relationships (QSPR)Property Relationships (QSPR)
“The structure of a chemical influences its properties and biological activity”
“Similar compounds behave similarly”
(Hansch 1964)
Activity or PropertyActivity or Property = f= f (Structure)(Structure)
Prof. Paola Gramatica - QSAR Research Unit - DBSF - University of Insubria - Varese (Italy)
PREDICTED DATAPREDICTED DATAPREDICTED DATA
It is possible to find a relationship (f) between Structure and behavior
(Activity or Property) of a chemical
Prof. Paola Gramatica - QSAR Research Unit - DBSF - University of Insubria - Varese (Italy)
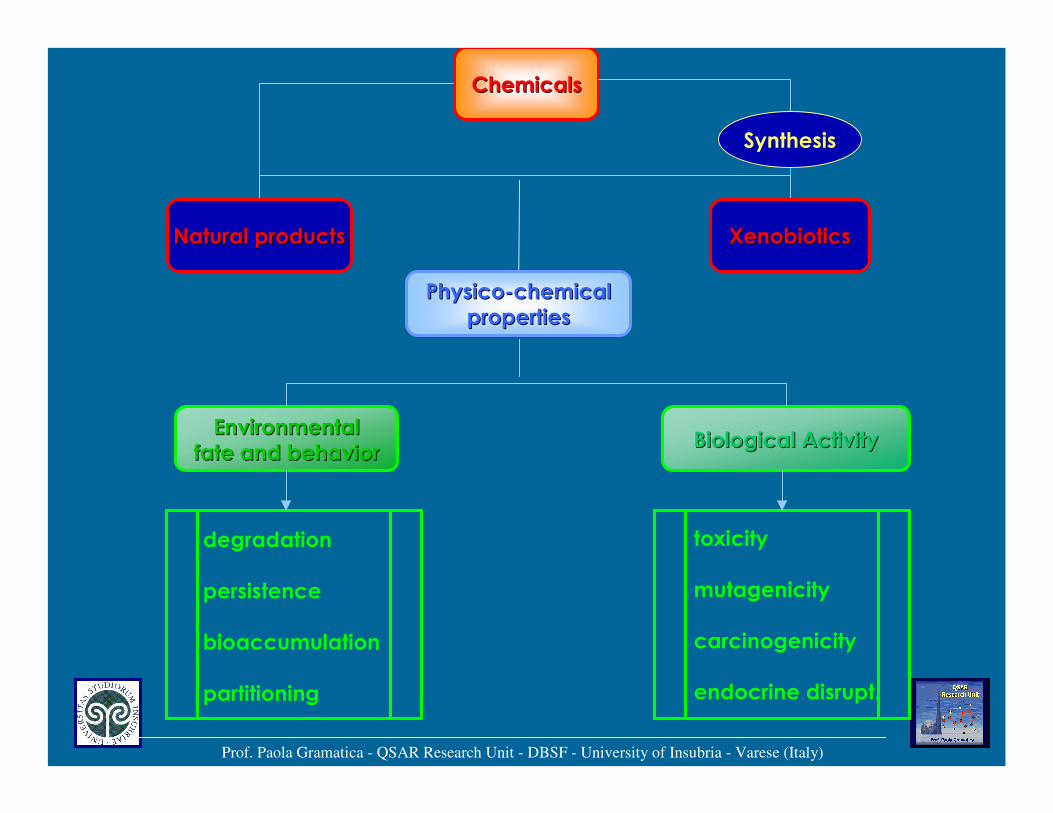
ChemicalsChemicals
EnvironmentalEnvironmentalfate and fate and behaviorbehavior
Biological ActivityBiological Activity
toxicity
mutagenicity
carcinogenicity
endocrine disrupt.
degradation
persistence
bioaccumulation
partitioning
PhysicoPhysico--chemicalchemicalpropertiesproperties
Natural productsNatural products XenobioticsXenobiotics
Synthesis
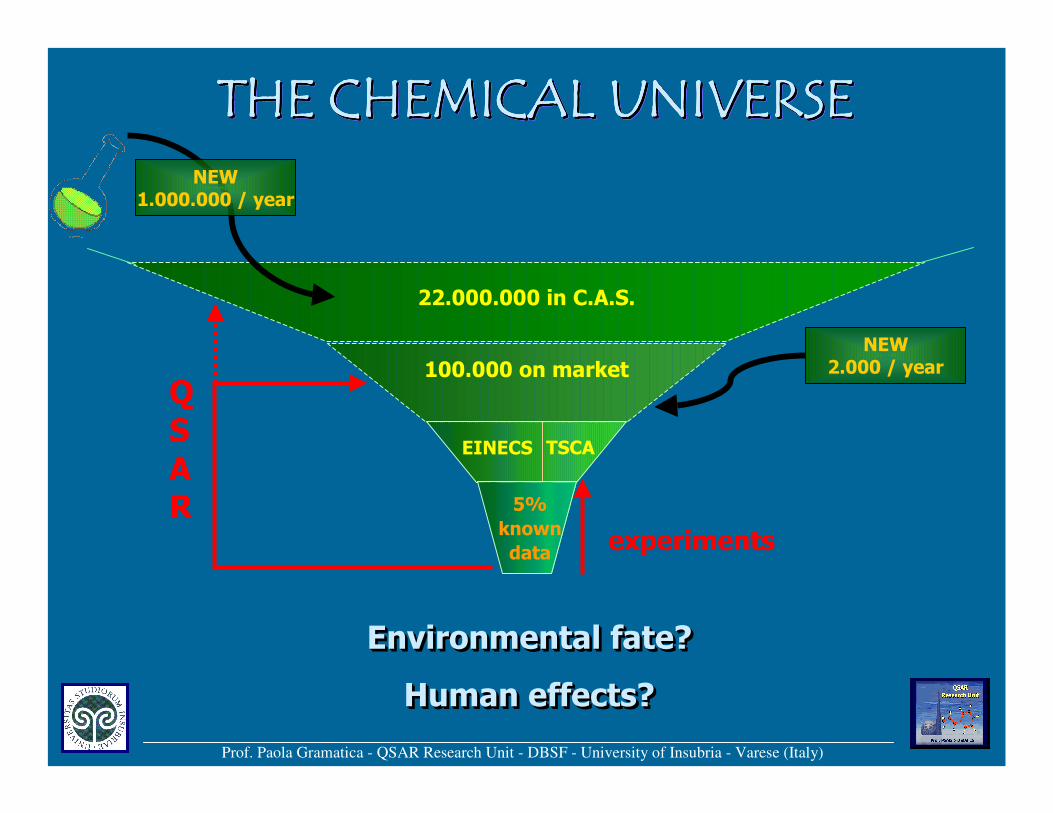
THE CHEMICAL UNIVERSETHE CHEMICAL UNIVERSETHE CHEMICAL UNIVERSETHE CHEMICAL UNIVERSETHE CHEMICAL UNIVERSETHE CHEMICAL UNIVERSETHE CHEMICAL UNIVERSETHE CHEMICAL UNIVERSETHE CHEMICAL UNIVERSETHE CHEMICAL UNIVERSETHE CHEMICAL UNIVERSETHE CHEMICAL UNIVERSE
QSAR
22.000.000 in C.A.S.
100.000 on market
EINECS TSCA
5%
known
data
Environmental fate?Environmental fate?Environmental fate?
Human effects?Human effects?Human effects?
NEW1.000.000 / year
NEW2.000 / year
Prof. Paola Gramatica - QSAR Research Unit - DBSF - University of Insubria - Varese (Italy)
experiments
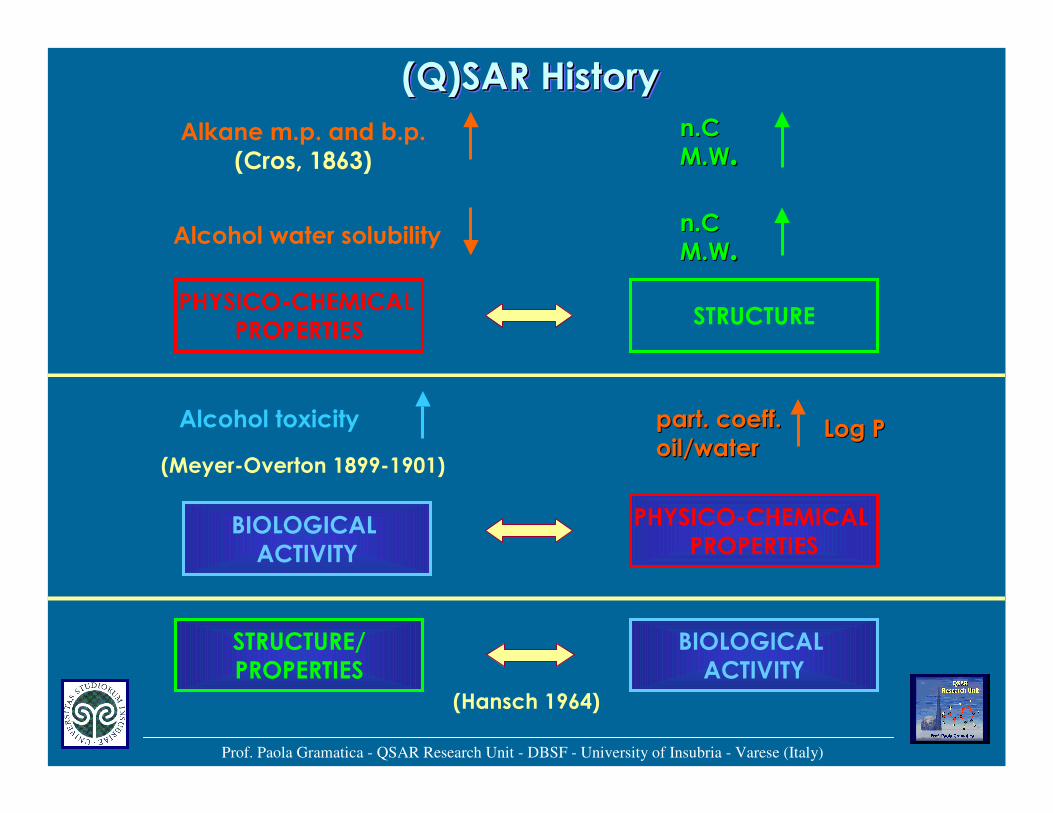
(Q)SAR History(Q)SAR History(Q)SAR History
Alkane m.p. and b.p.(Cros, 1863)
Alcohol water solubility
n.Cn.CM.WM.W..
n.Cn.CM.WM.W..
PHYSICO-CHEMICAL PROPERTIES
STRUCTURE
BIOLOGICAL ACTIVITY
STRUCTURE/PROPERTIES
(Hansch 1964)
Prof. Paola Gramatica - QSAR Research Unit - DBSF - University of Insubria - Varese (Italy)
Alcohol toxicity part. part. coeffcoeff..oil/wateroil/water
PHYSICO-CHEMICAL PROPERTIES
BIOLOGICAL ACTIVITY
(Meyer-Overton 1899-1901)
Log PLog P
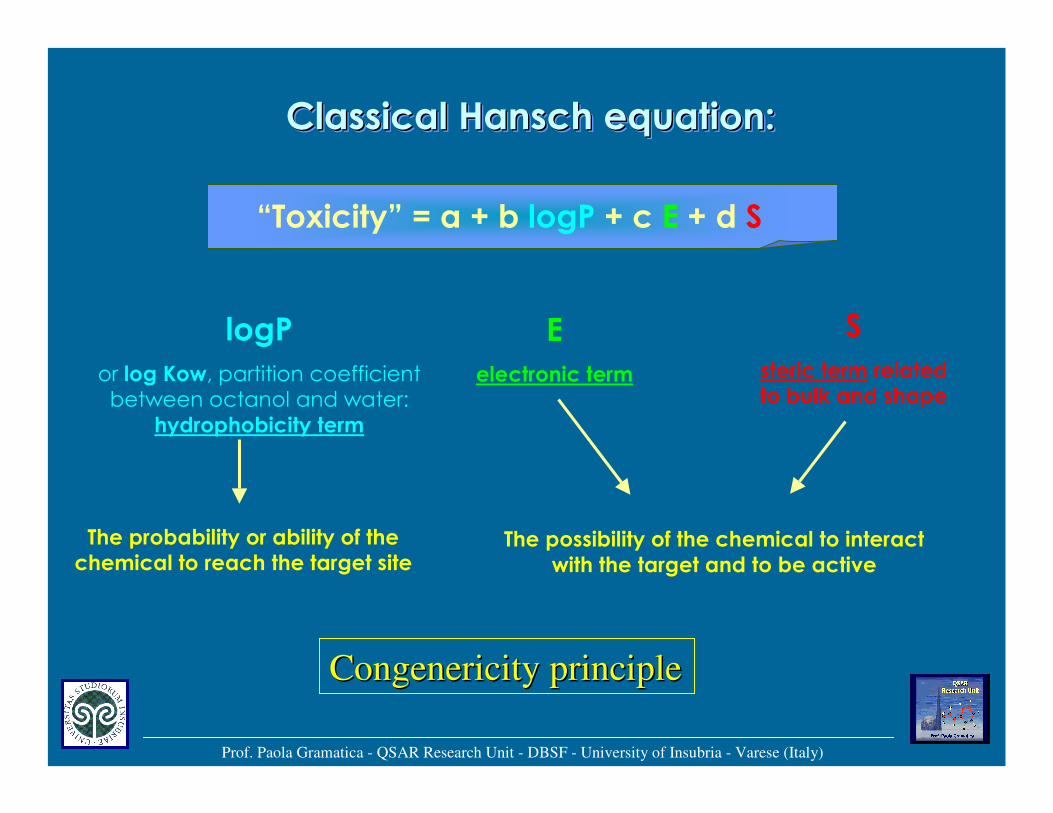
Classical Hansch equation:Classical Classical HanschHansch equation:equation:
“Toxicity” = a + b logP + c E + d S
Prof. Paola Gramatica - QSAR Research Unit - DBSF - University of Insubria - Varese (Italy)
logPor log Kow, partition coefficient between octanol and water:
hydrophobicity term
Eelectronic term
Ssteric term related to bulk and shape
The possibility of the chemical to interact with the target and to be active
The probability or ability of the chemical to reach the target site
CongenericityCongenericity principleprinciple

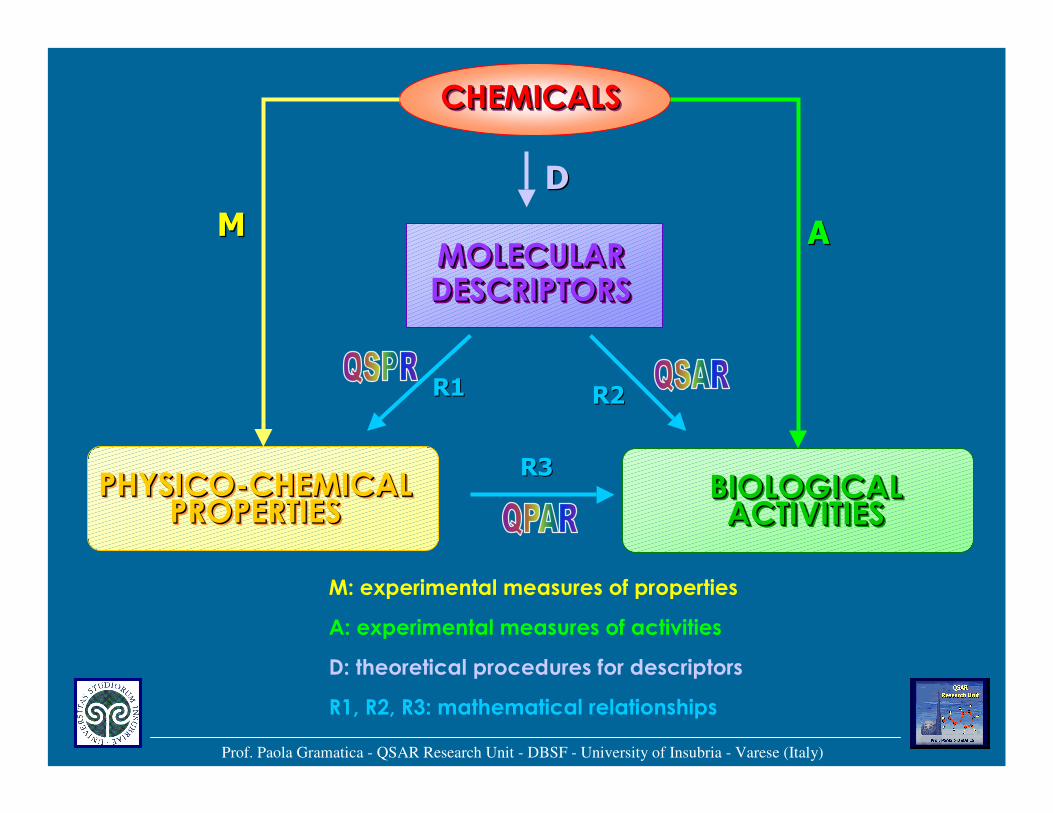
CHEMICALSCHEMICALSCHEMICALS
M: experimental measures of properties
A: experimental measures of activities
D: theoretical procedures for descriptors
R1, R2, R3: mathematical relationships
PHYSICO-CHEMICALPROPERTIES
PHYSICOPHYSICO--CHEMICALCHEMICALPROPERTIESPROPERTIES
MM
BIOLOGICAL ACTIVITIES
BIOLOGICAL BIOLOGICAL ACTIVITIESACTIVITIES
AAMOLECULAR DESCRIPTORSMOLECULAR MOLECULAR DESCRIPTORSDESCRIPTORS
DD
Prof. Paola Gramatica - QSAR Research Unit - DBSF - University of Insubria - Varese (Italy)
R1R1 R2R2
R3R3
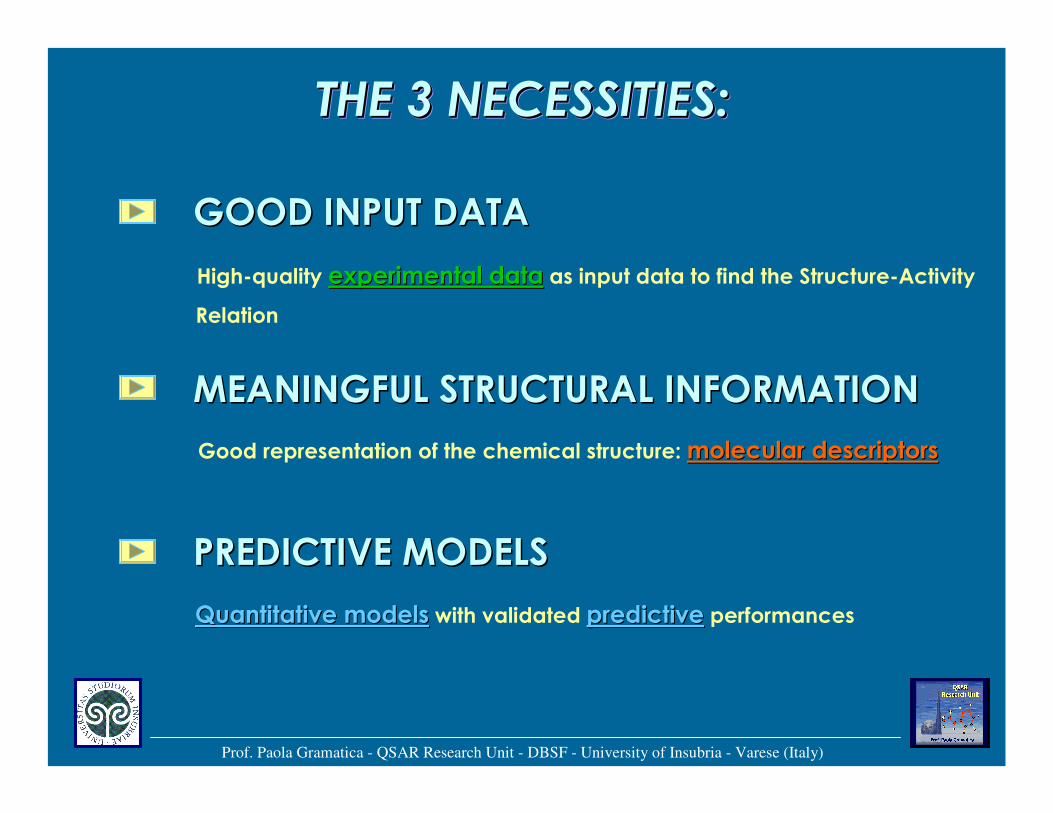
THE 3 NECESSITIES:THE 3 NECESSITIES:THE 3 NECESSITIES:
GOOD INPUT DATAGOOD INPUT DATA
MEANINGFUL STRUCTURAL INFORMATIONMEANINGFUL STRUCTURAL INFORMATION
PREDICTIVE MODELSPREDICTIVE MODELS
Prof. Paola Gramatica - QSAR Research Unit - DBSF - University of Insubria - Varese (Italy)
High-quality experimental dataexperimental data as input data to find the Structure-Activity
Relation
Good representation of the chemical structure: molecular descriptorsmolecular descriptors
Quantitative modelsQuantitative models with validated predictivepredictive performances
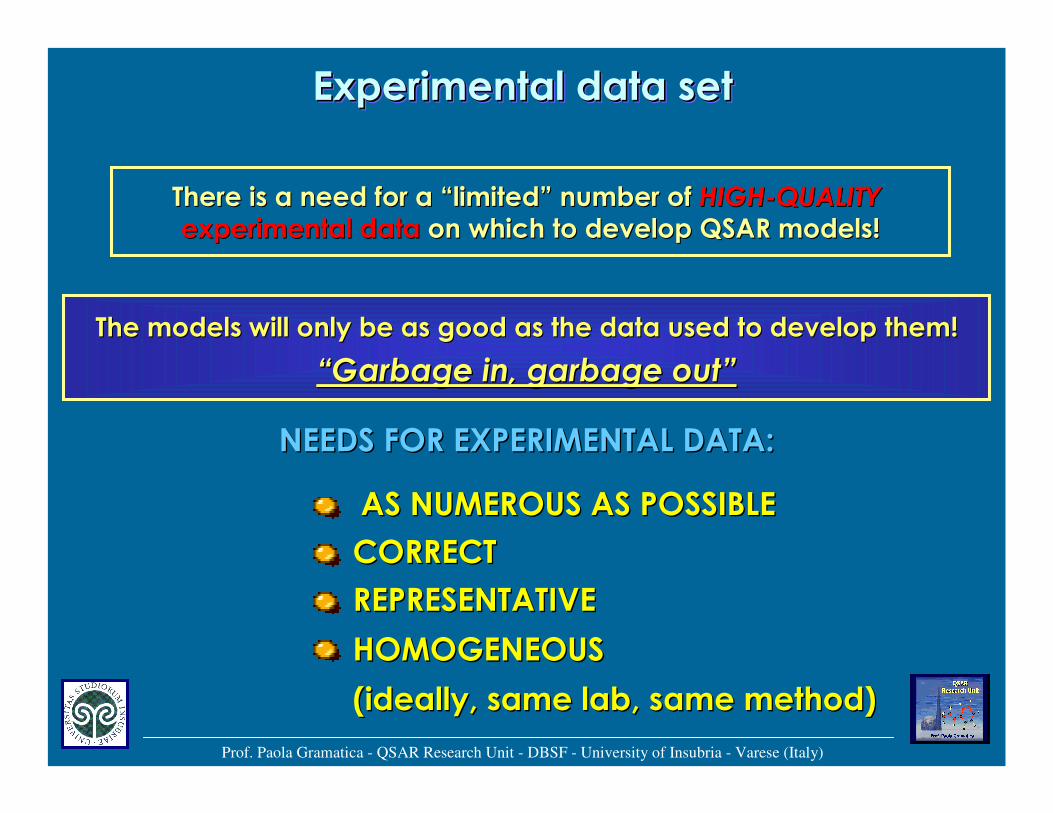
Experimental data setExperimental data setExperimental data set
The models will only be as good as the data used to develop themThe models will only be as good as the data used to develop them!!
“Garbage in, garbage out”“Garbage in, garbage out”
There is a need for a “limited” number of There is a need for a “limited” number of HIGHHIGH--QUALITYQUALITY
experimental dataexperimental data on which to develop QSAR models!on which to develop QSAR models!
Prof. Paola Gramatica - QSAR Research Unit - DBSF - University of Insubria - Varese (Italy)
NEEDS FOR EXPERIMENTAL DATA:NEEDS FOR EXPERIMENTAL DATA:
AS NUMEROUS AS POSSIBLEAS NUMEROUS AS POSSIBLE
CORRECTCORRECT
REPRESENTATIVEREPRESENTATIVE
HOMOGENEOUS HOMOGENEOUS
(ideally, same lab, same method)(ideally, same lab, same method)

CHEMICALSCHEMICALSCHEMICALS
M: experimental measures of properties
A: experimental measures of activities
D: theoretical procedures for descriptors
R1, R2, R3: mathematical relationships
PHYSICO-CHEMICALPROPERTIES
PHYSICOPHYSICO--CHEMICALCHEMICALPROPERTIESPROPERTIES
MM
BIOLOGICAL ACTIVITIES
BIOLOGICAL BIOLOGICAL ACTIVITIESACTIVITIES
AAMOLECULAR DESCRIPTORSMOLECULAR MOLECULAR DESCRIPTORSDESCRIPTORS
DD
Prof. Paola Gramatica - QSAR Research Unit - DBSF - University of Insubria - Varese (Italy)
R1R1 R2R2
R3R3
Prof. Paola Gramatica - QSAR Research Unit - DBSF - University of Insubria - Varese (Italy)
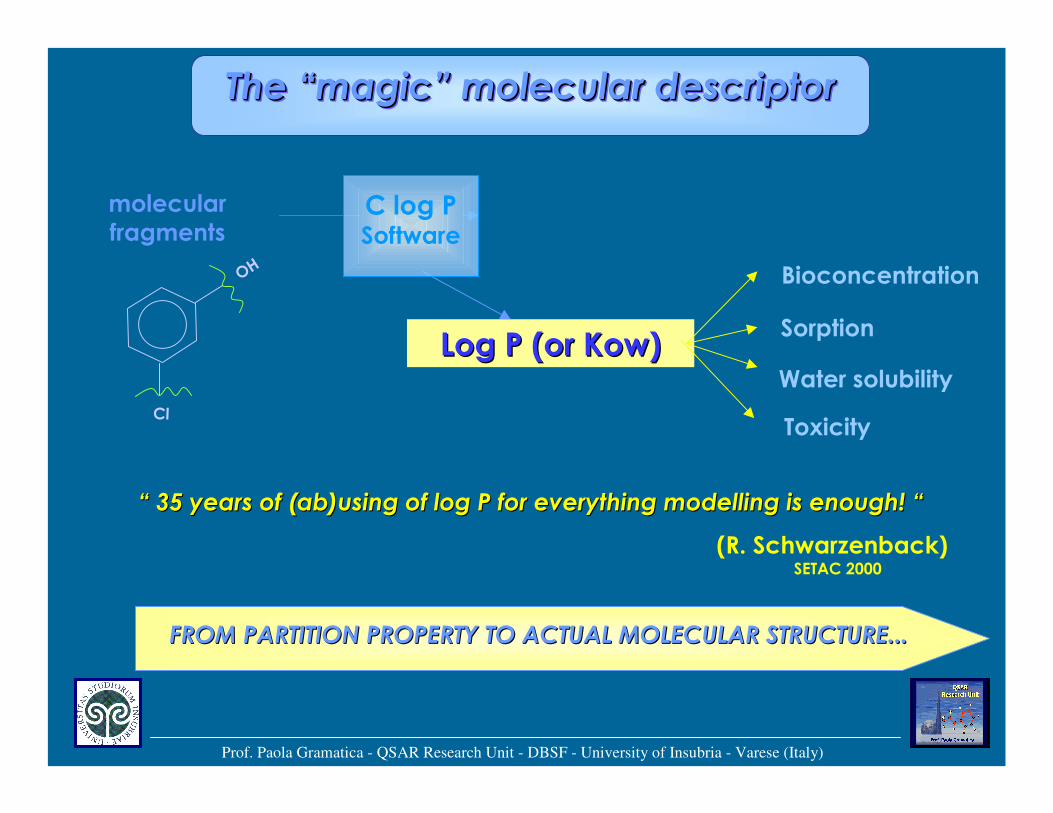
The “magic” molecular descriptorThe “magic” molecular descriptorThe “magic” molecular descriptor
Log P (or Log P (or KowKow))
“ 35 years of (“ 35 years of (ab)usingab)using of log P for everything modelling is enough! “of log P for everything modelling is enough! “
(R. Schwarzenback)SETAC 2000
FROM PARTITION PROPERTY TO ACTUAL MOLECULAR STRUCTURE...FROM PARTITION PROPERTY TO ACTUAL MOLECULAR STRUCTURE...
molecularfragments
C log PSoftware
OH
Cl
Bioconcentration
Sorption
Water solubility
Toxicity
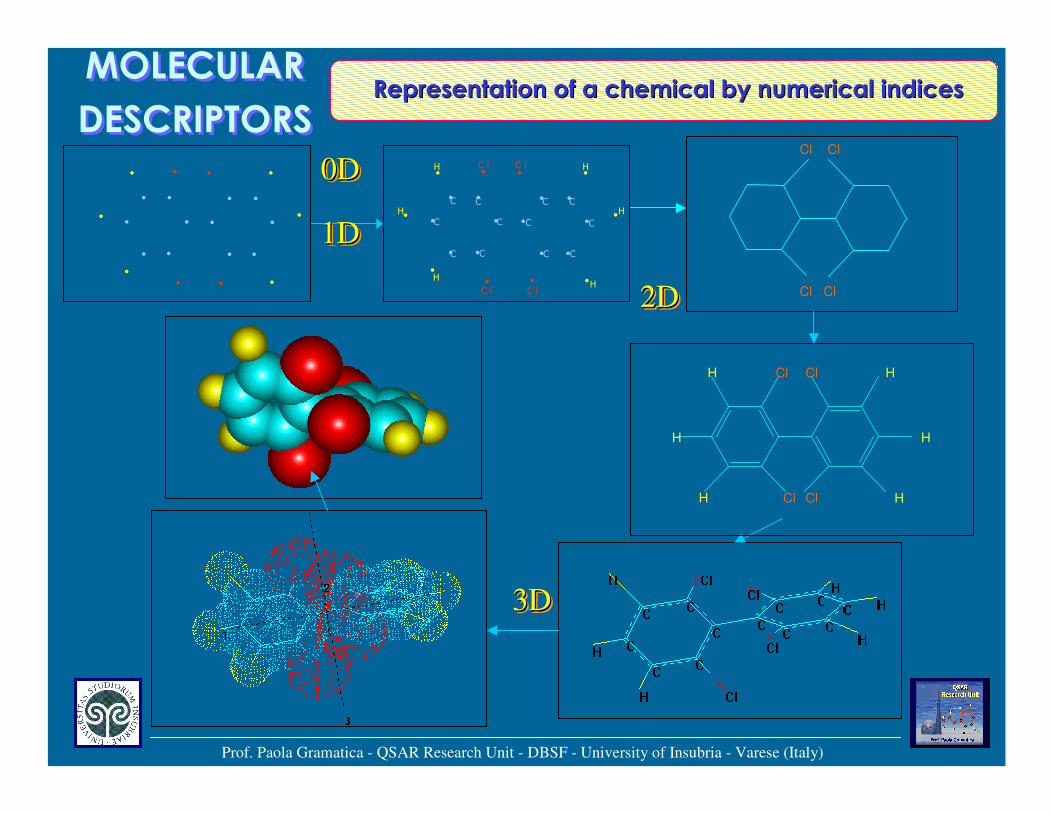
MOLECULAR
DESCRIPTORS
MOLECULAR
DESCRIPTORS. .· ·
··· ·
· ···
· ·
.
.
.
...
. .C
C
C
C
C C
C C
CC
CC
C l C l
C l C l
H
H
H
H
H
H
. .· ·
··· ·
· ···
· ·
.
.
.
...
. .
1D1D1D
3D3D3D
2D2D2D
ClCl
Cl Cl
Cl Cl
ClCl
H
H
H
H
H
H
Prof. Paola Gramatica - QSAR Research Unit - DBSF - University of Insubria - Varese (Italy)
0D0D0D
Representation of a chemical by numerical indicesRepresentation of a chemical by numerical indices
CHEMICALSCHEMICALSCHEMICALS
M: experimental measures of properties
A: experimental measures of activities
D: theoretical procedures for descriptors
R1, R2, R3: mathematical relationships
PHYSICO-CHEMICALPROPERTIES
PHYSICOPHYSICO--CHEMICALCHEMICALPROPERTIESPROPERTIES
MM
BIOLOGICAL ACTIVITIES
BIOLOGICAL BIOLOGICAL ACTIVITIESACTIVITIES
AAMOLECULAR DESCRIPTORSMOLECULAR MOLECULAR DESCRIPTORSDESCRIPTORS
DD
Prof. Paola Gramatica - QSAR Research Unit - DBSF - University of Insubria - Varese (Italy)
R1R1 R2R2
R3R3
Prof. Paola Gramatica - QSAR Research Unit - DBSF - University of Insubria - Varese (Italy)
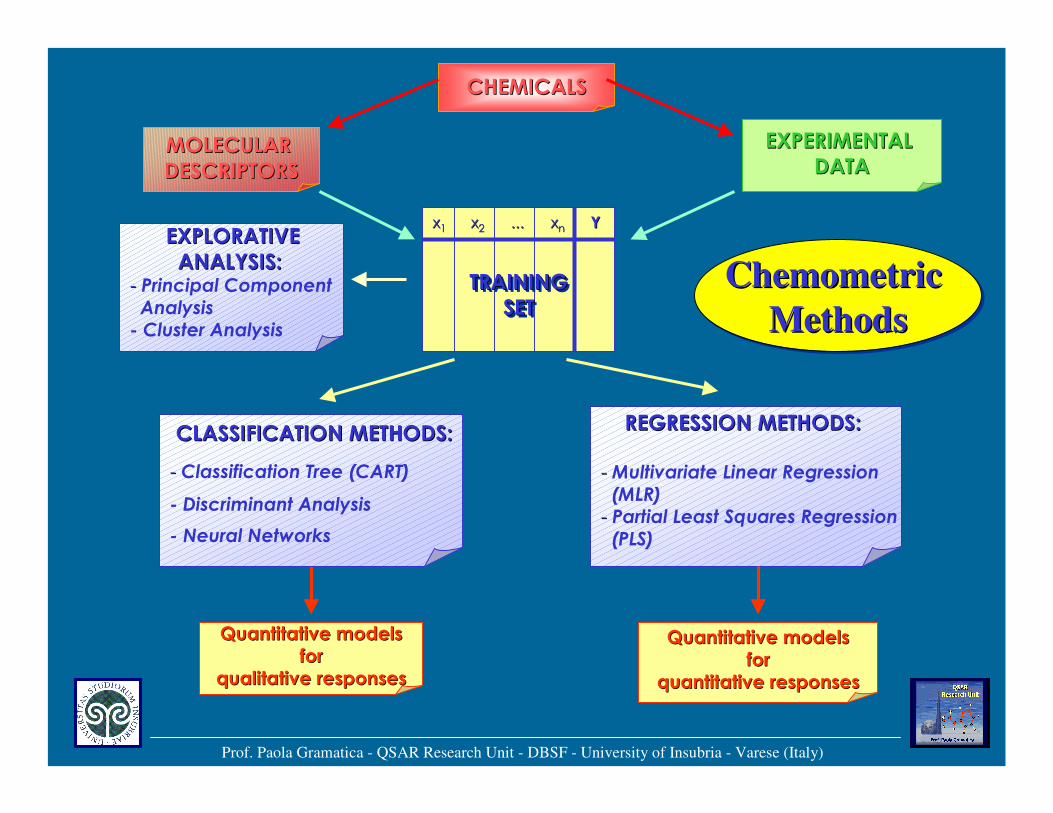
CHEMICALSCHEMICALS
EXPERIMENTAL EXPERIMENTAL DATADATA
xx11 xx22 xxnn...... YY
TRAINING SET
TRAINING TRAINING SETSET
EXPLORATIVE EXPLORATIVE ANALYSIS:ANALYSIS:
-- Principal Component Analysis- Cluster Analysis
Quantitative modelsQuantitative modelsforfor
qualitative responsesqualitative responses
CLASSIFICATION METHODS:CLASSIFICATION METHODS:
-- Classification Tree (CART)
- Discriminant Analysis
- Neural Networks
REGRESSION METHODS:REGRESSION METHODS:
-- Multivariate Linear Regression(MLR)
-- Partial Least Squares Regression(PLS)
Quantitative modelsQuantitative modelsforfor
quantitative responsesquantitative responses
MOLECULAR MOLECULAR DESCRIPTORSDESCRIPTORS
Chemometric
Methods
Chemometric Chemometric
MethodsMethods
Prof. Paola Gramatica - QSAR Research Unit - DBSF - University of Insubria - Varese (Italy)
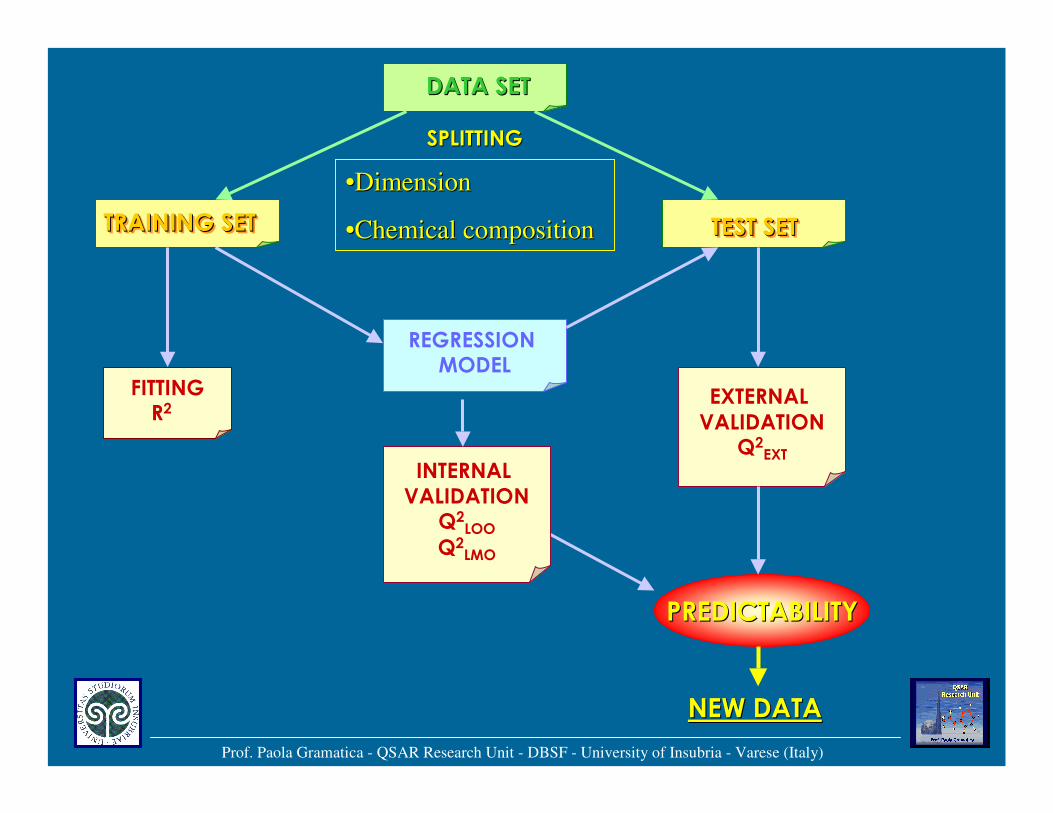
DATA SETDATA SET
TRAINING SETTRAINING SETTRAINING SET TEST SETTEST SETTEST SET
REGRESSION MODEL
EXTERNAL VALIDATION
Q2EXT
PREDICTABILITYPREDICTABILITY
NEW DATANEW DATA
FITTINGR2
INTERNAL VALIDATION
Q2LOO
Q2LMO
SPLITTINGSPLITTING
••DimensionDimension
••Chemical Chemical compositioncomposition
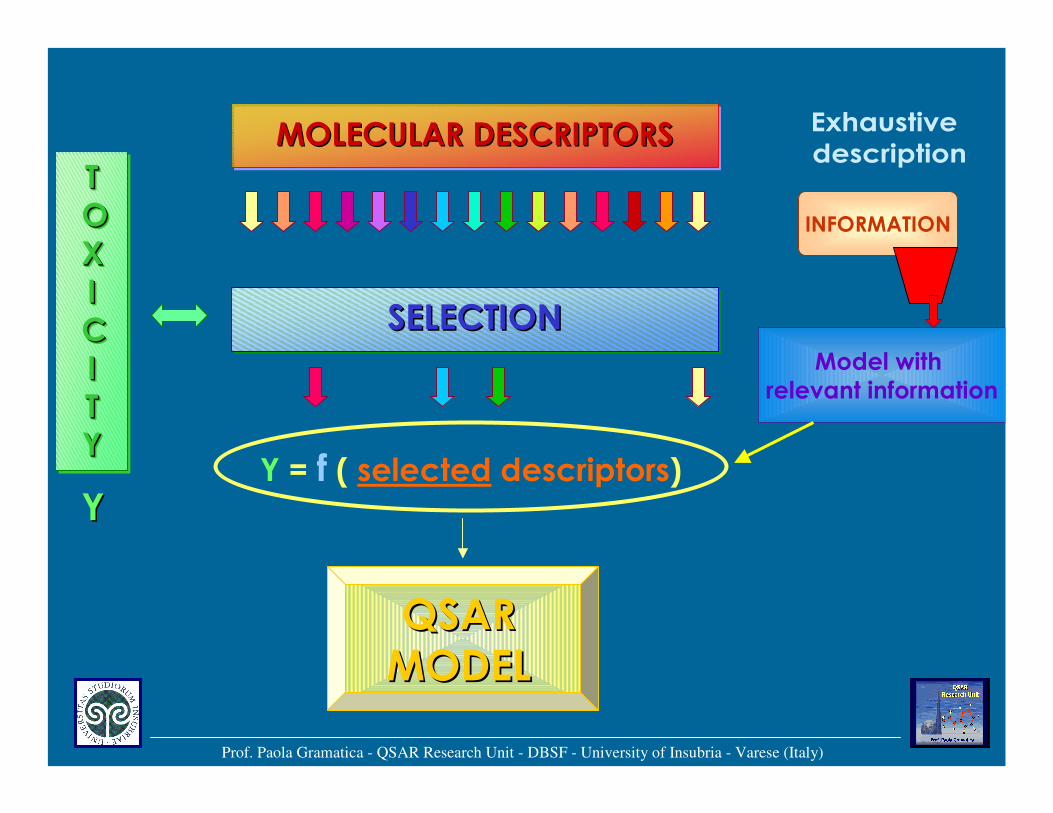
MOLECULAR DESCRIPTORSMOLECULAR DESCRIPTORSMOLECULAR DESCRIPTORS
Prof. Paola Gramatica - QSAR Research Unit - DBSF - University of Insubria - Varese (Italy)
TOXICITY
TTOOXXIICCIITTYY
YY
QSAR QSAR MODELMODEL
INFORMATION
SELECTIONSELECTIONSELECTIONModel with
relevant information
Y = f ( selected descriptors)
Prof. Paola Gramatica - QSAR Research Unit - DBSF - University of Insubria - Varese (Italy)
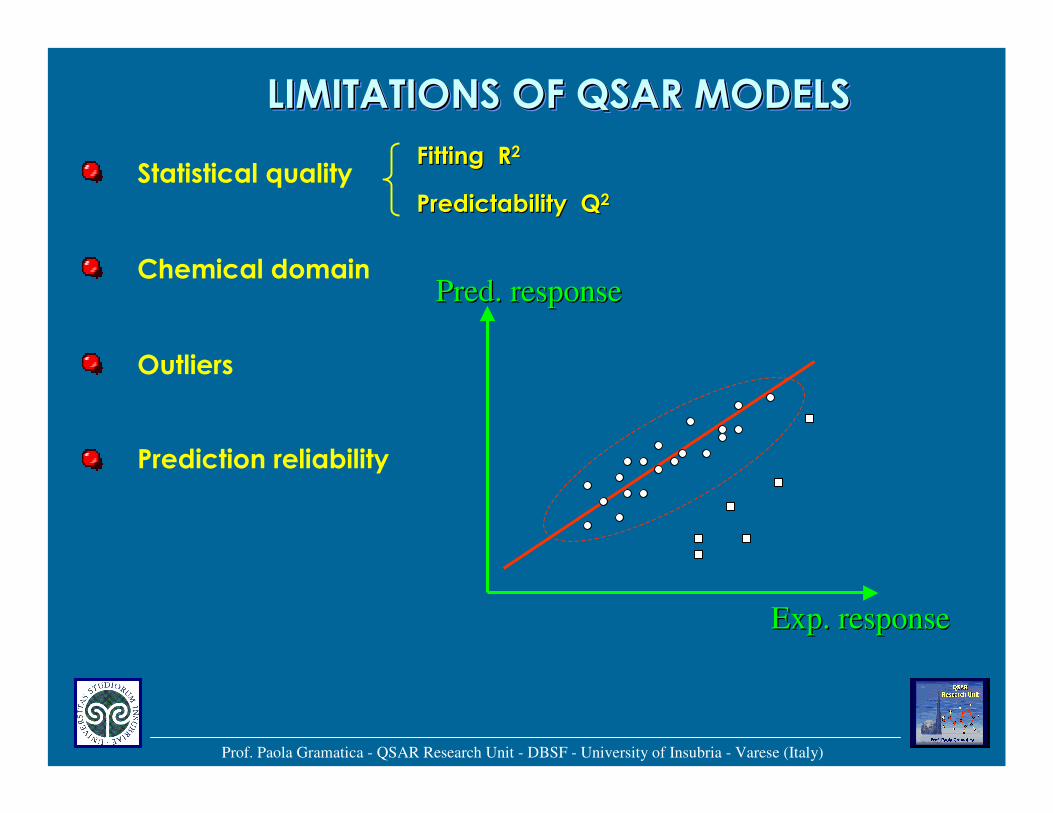
LIMITATIONS OF QSAR MODELSLIMITATIONS OF QSAR MODELSLIMITATIONS OF QSAR MODELS
Statistical qualityFitting RFitting R22
Predictability QPredictability Q22
Outliers
Chemical domain
Exp. responseExp. response
PredPred. response. response
Prediction reliability
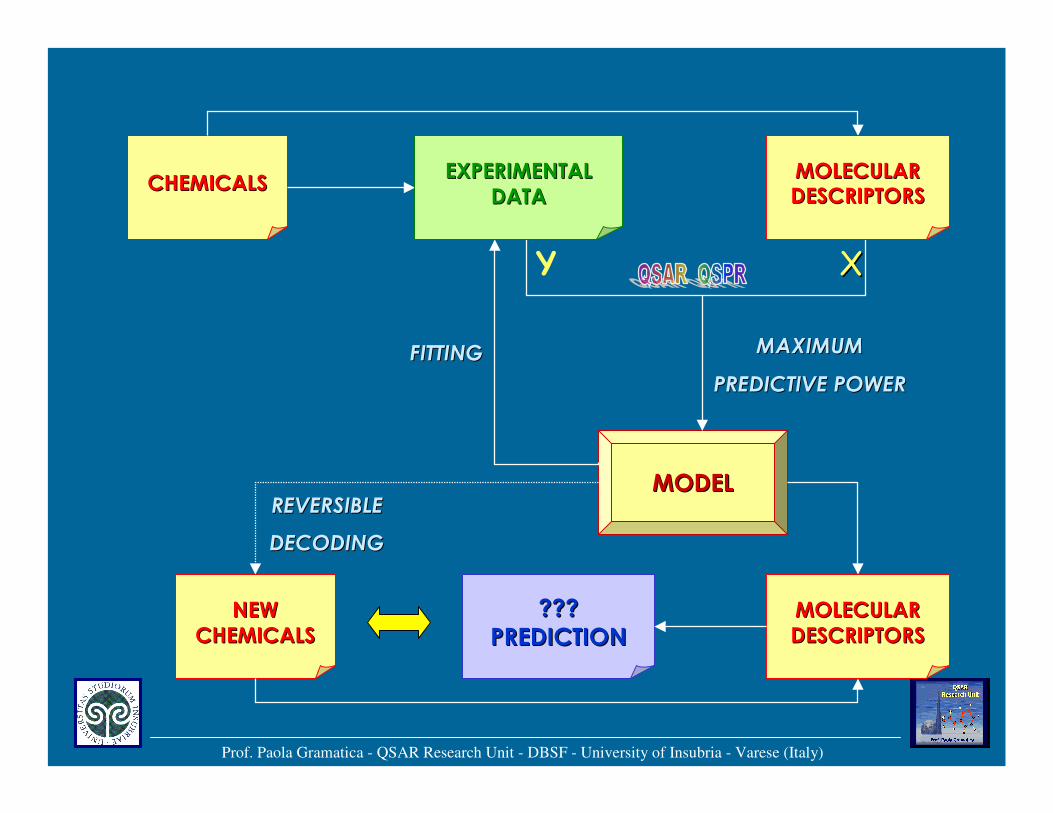
CHEMICALSCHEMICALS
MODELMODEL
Y XX
FITTINGFITTING
REVERSIBLE REVERSIBLE
DECODINGDECODING
MAXIMUMMAXIMUM
PREDICTIVE POWERPREDICTIVE POWER
Prof. Paola Gramatica - QSAR Research Unit - DBSF - University of Insubria - Varese (Italy)
EXPERIMENTALEXPERIMENTALDATADATA
MOLECULARMOLECULARDESCRIPTORSDESCRIPTORS
NEWNEWCHEMICALSCHEMICALS
MOLECULARMOLECULARDESCRIPTORSDESCRIPTORS
??????PREDICTIONPREDICTION
Prof. Paola Gramatica - QSAR Research Unit - DBSF - University of Insubria - Varese (Italy)
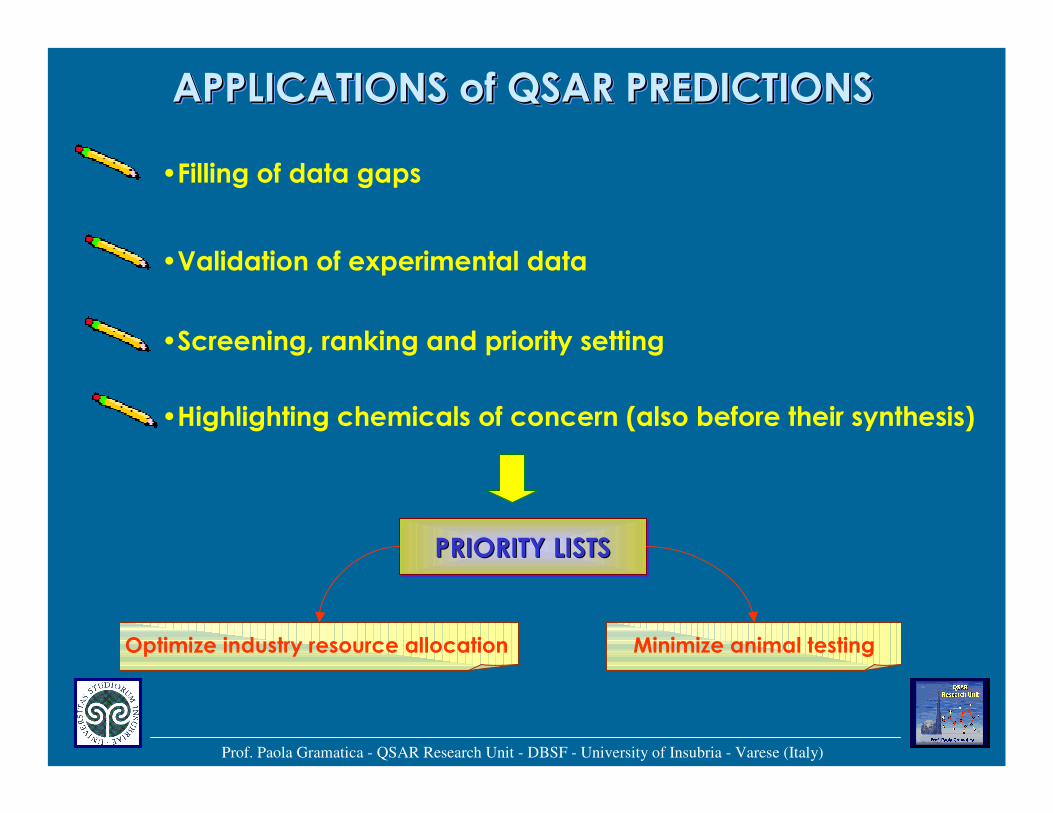
APPLICATIONS of QSAR PREDICTIONSAPPLICATIONS of QSAR PREDICTIONSAPPLICATIONS of QSAR PREDICTIONS
•Filling of data gaps
•Validation of experimental data
•Screening, ranking and priority setting
•Highlighting chemicals of concern (also before their synthesis)
PRIORITY LISTSPRIORITY LISTSPRIORITY LISTS
Optimize industry resource allocation Minimize animal testing
Prof. Paola Gramatica - QSAR Research Unit - DBSF - University of Insubria - Varese (Italy)
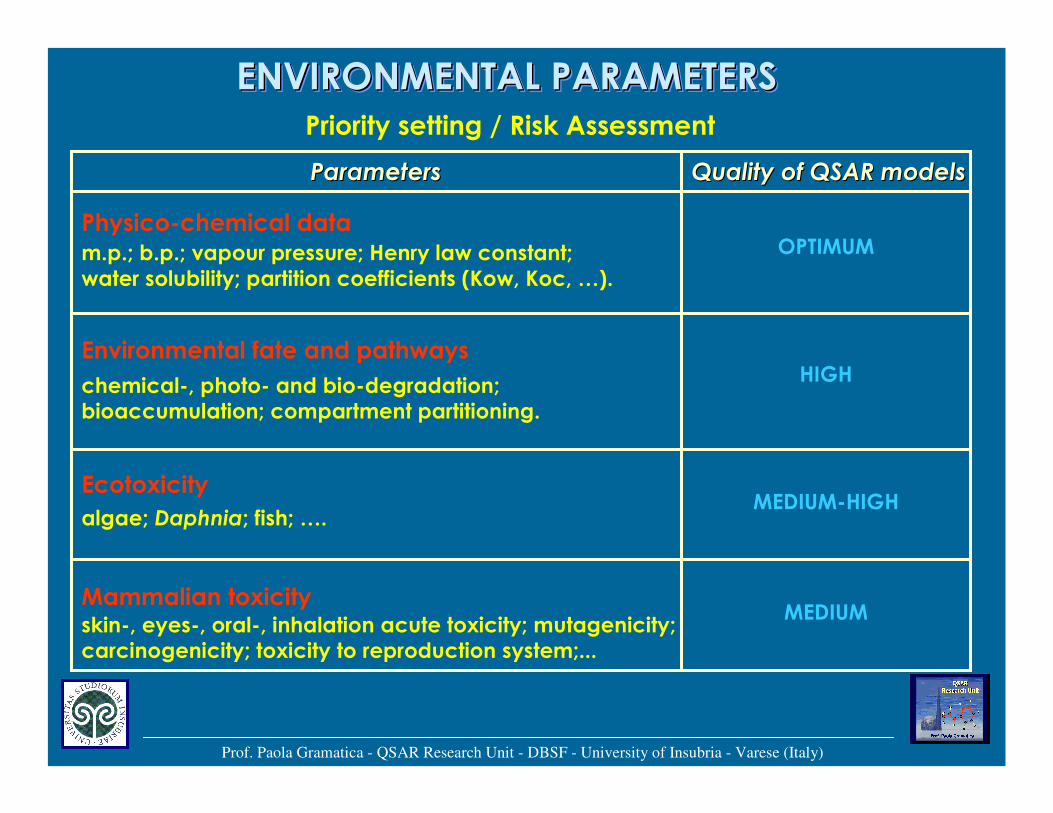
ENVIRONMENTAL PARAMETERSENVIRONMENTAL PARAMETERSENVIRONMENTAL PARAMETERSPriority setting / Risk Assessment
ParametersParameters Quality of QSAR modelsQuality of QSAR models
Physico-chemical data
Environmental fate and pathways
Ecotoxicity
Mammalian toxicity
OPTIMUM
MEDIUM
MEDIUM-HIGH
HIGH
m.p.; b.p.; vapour pressure; Henry law constant; water solubility; partition coefficients (Kow, Koc, …).
chemical-, photo- and bio-degradation; bioaccumulation; compartment partitioning.
algae; Daphnia; fish; ….
skin-, eyes-, oral-, inhalation acute toxicity; mutagenicity; carcinogenicity; toxicity to reproduction system;...
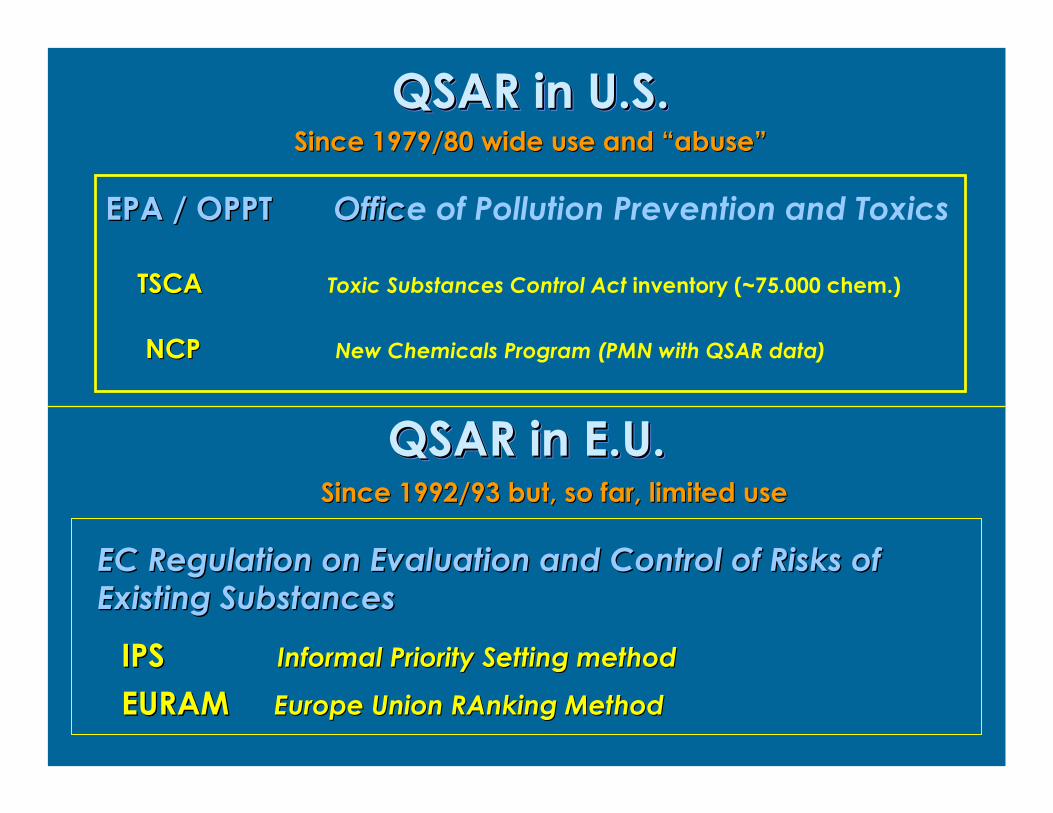
QSAR in U.S.QSAR in U.S.QSAR in U.S.Since 1979/80 wide use and “abuse”Since 1979/80 wide use and “abuse”
EPA / OPPTEPA / OPPT OfficOffice of Pollution Prevention and Toxics
TSCA TSCA Toxic Substances Control Act inventory (~75.000 chem.)
NCP NCP New Chemicals Program (PMN with QSAR data)
QSAR in E.U.QSAR in E.U.QSAR in E.U.
IPS IPS Informal Priority Setting methodInformal Priority Setting method
EURAM EURAM Europe Union Europe Union RAnkingRAnking MethodMethod
EC Regulation on Evaluation and Control of Risks of EC Regulation on Evaluation and Control of Risks of
Existing SubstancesExisting Substances
Since 1992/93 but, so far, limited useSince 1992/93 but, so far, limited use
Prof. Paola Gramatica - QSAR Research Unit - DBSF - University of Insubria - Varese (Italy)
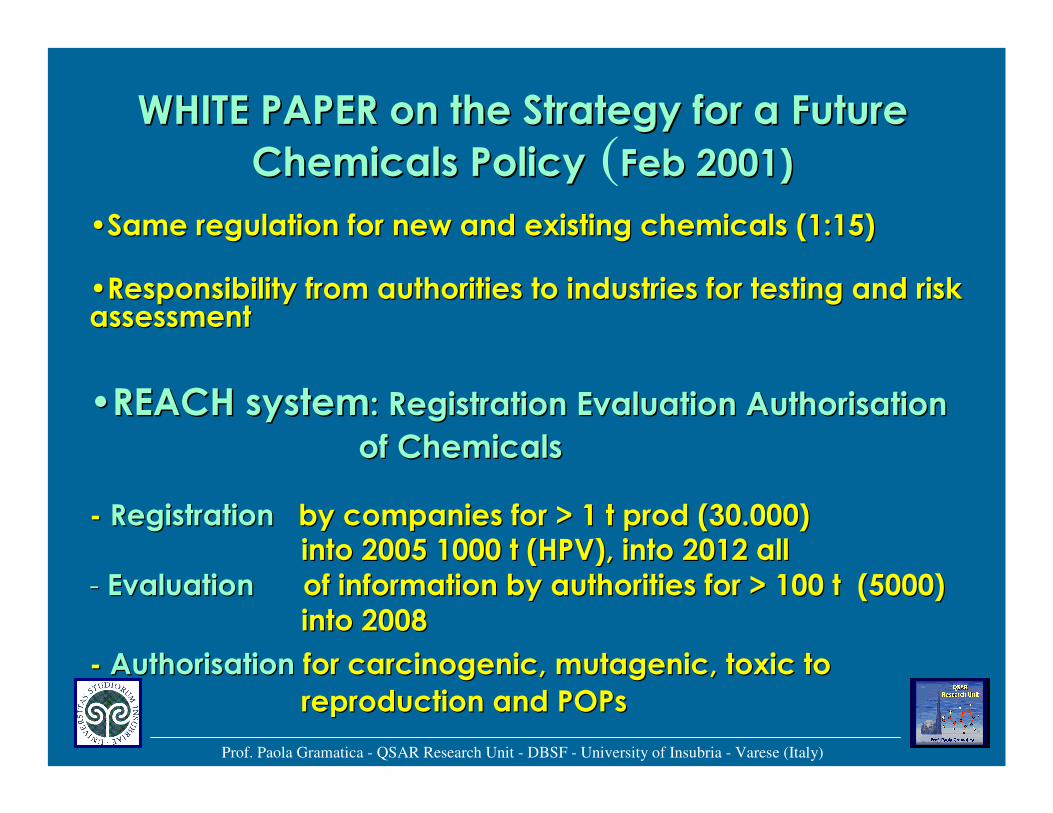
WHITE PAPER on the WHITE PAPER on the StrategyStrategy forfor a Future a Future
ChemicalsChemicals PolicyPolicy (FebFeb 2001)2001)
••Same regulation for new and existing chemicals (1:15)Same regulation for new and existing chemicals (1:15)
••Responsibility from authorities to industries for testing and riResponsibility from authorities to industries for testing and risk sk assessmentassessment
••REACH systemREACH system: Registration Evaluation Authorisation : Registration Evaluation Authorisation
of Chemicalsof Chemicals
-- RegistrationRegistration by companies for > 1 t prod (30.000) by companies for > 1 t prod (30.000) into 2005 1000 t (HPV), into 2012 allinto 2005 1000 t (HPV), into 2012 all
-- EvaluationEvaluation of information by authorities for > 100 t (5000)of information by authorities for > 100 t (5000)into 2008into 2008
-- AuthorisationAuthorisation for carcinogenic, mutagenic, toxic to for carcinogenic, mutagenic, toxic to
reproduction and POPsreproduction and POPs
Prof. Paola Gramatica - QSAR Research Unit - DBSF - University of Insubria - Varese (Italy)
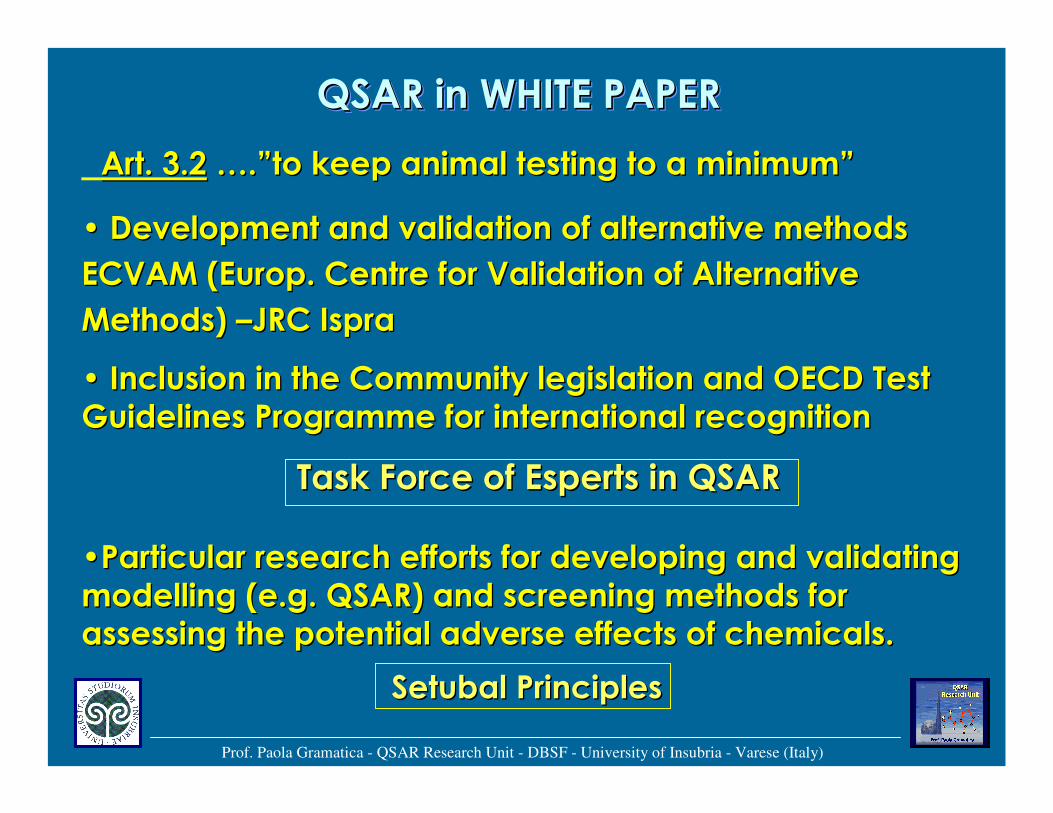
QSAR in WHITE PAPERQSAR in WHITE PAPERQSAR in WHITE PAPER
Art. 3.2Art. 3.2 ….”to keep animal testing to a minimum”….”to keep animal testing to a minimum”
•• Development and validation of alternative methods Development and validation of alternative methods
ECVAM (ECVAM (EuropEurop. Centre for Validation of Alternative . Centre for Validation of Alternative
Methods) Methods) ––JRC JRC IspraIspra
•• Inclusion in the Community legislation and OECD Test Inclusion in the Community legislation and OECD Test Guidelines Programme for international recognitionGuidelines Programme for international recognition
Task Force of Task Force of EspertsEsperts in QSAR in QSAR
••Particular research efforts for developing and validating Particular research efforts for developing and validating modelling (e.g. QSAR) and screening methods for modelling (e.g. QSAR) and screening methods for assessing the potential adverse effects of chemicals.assessing the potential adverse effects of chemicals.
SetubalSetubal PrinciplesPrinciples
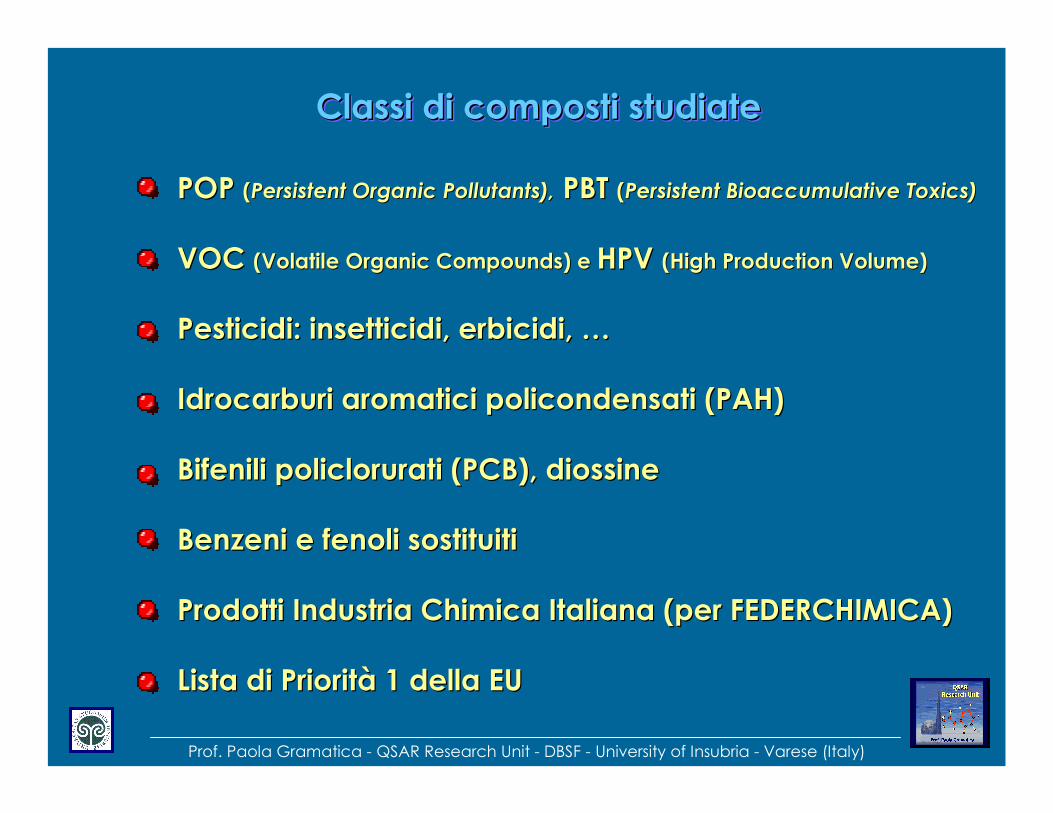
Classi di composti studiateClassiClassi didi composticomposti studiatestudiate
POP POP ((Persistent Organic Pollutants),Persistent Organic Pollutants), PBT PBT ((Persistent Persistent BioaccumulativeBioaccumulative Toxics)Toxics)
VOC VOC (Volatile Organic Compounds) e (Volatile Organic Compounds) e HPV HPV (High Production Volume)(High Production Volume)
PesticidiPesticidi: : insetticidiinsetticidi, , erbicidierbicidi, …, …
IdrocarburiIdrocarburi aromaticiaromatici policondensatipolicondensati (PAH)(PAH)
BifeniliBifenili policloruratipoliclorurati (PCB), (PCB), diossinediossine
BenzeniBenzeni e e fenolifenoli sostituitisostituiti
ProdottiProdotti IndustriaIndustria ChimicaChimica ItalianaItaliana (per FEDERCHIMICA)(per FEDERCHIMICA)
ListaLista didi PrioritàPriorità 1 1 delladella EUEU
Prof. Paola Gramatica - QSAR Research Unit - DBSF - University of Insubria - Varese (Italy)
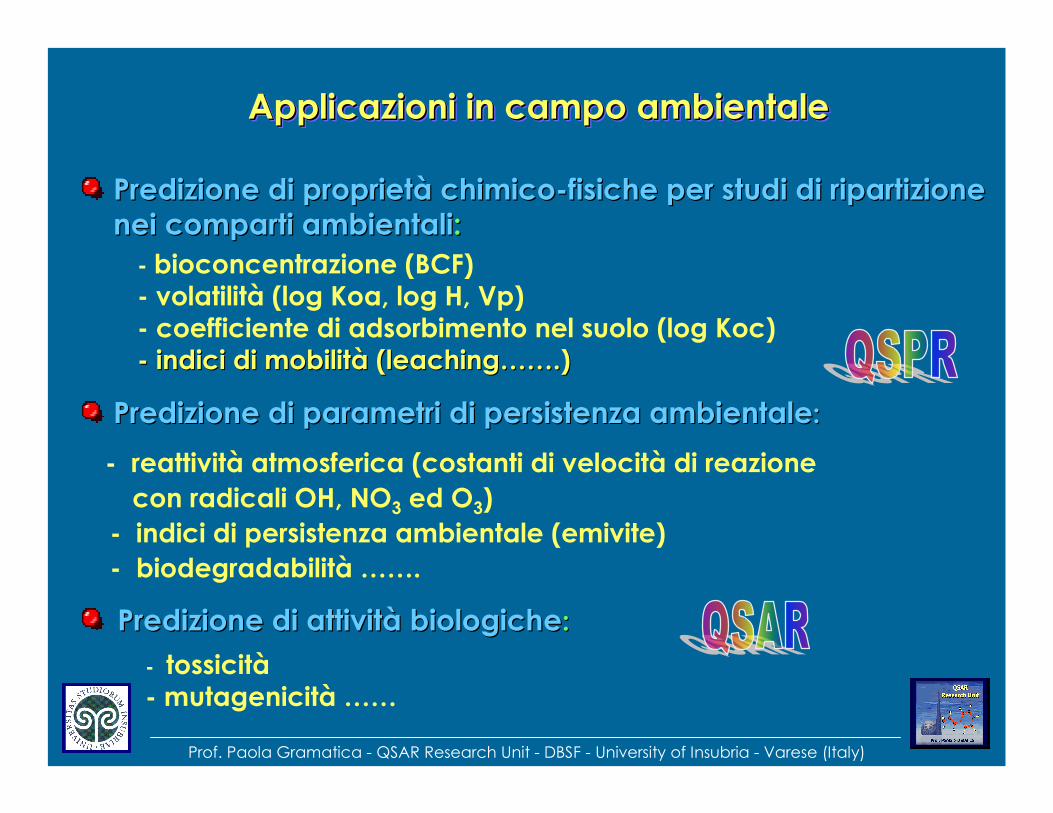
Applicazioni in campo ambientaleApplicazioniApplicazioni in campo in campo ambientaleambientale
PredizionePredizione didi proprietàproprietà chimicochimico--fisichefisiche per per studistudi didi ripartizioneripartizioneneinei comparticomparti ambientaliambientali::
PredizionePredizione didi parametriparametri didi persistenzapersistenza ambientaleambientale::
PredizionePredizione didi attivitàattività biologichebiologiche::
- bioconcentrazione (BCF)- volatilità (log Koa, log H, Vp)- coefficiente di adsorbimento nel suolo (log Koc)-- indiciindici didi mobilitàmobilità (leaching…….)(leaching…….)
- reattività atmosferica (costanti di velocità di reazione
con radicali OH, NO3 ed O3)
- indici di persistenza ambientale (emivite)
- biodegradabilità …….
- tossicità- mutagenicità ……
Prof. Paola Gramatica - QSAR Research Unit - DBSF - University of Insubria - Varese (Italy)
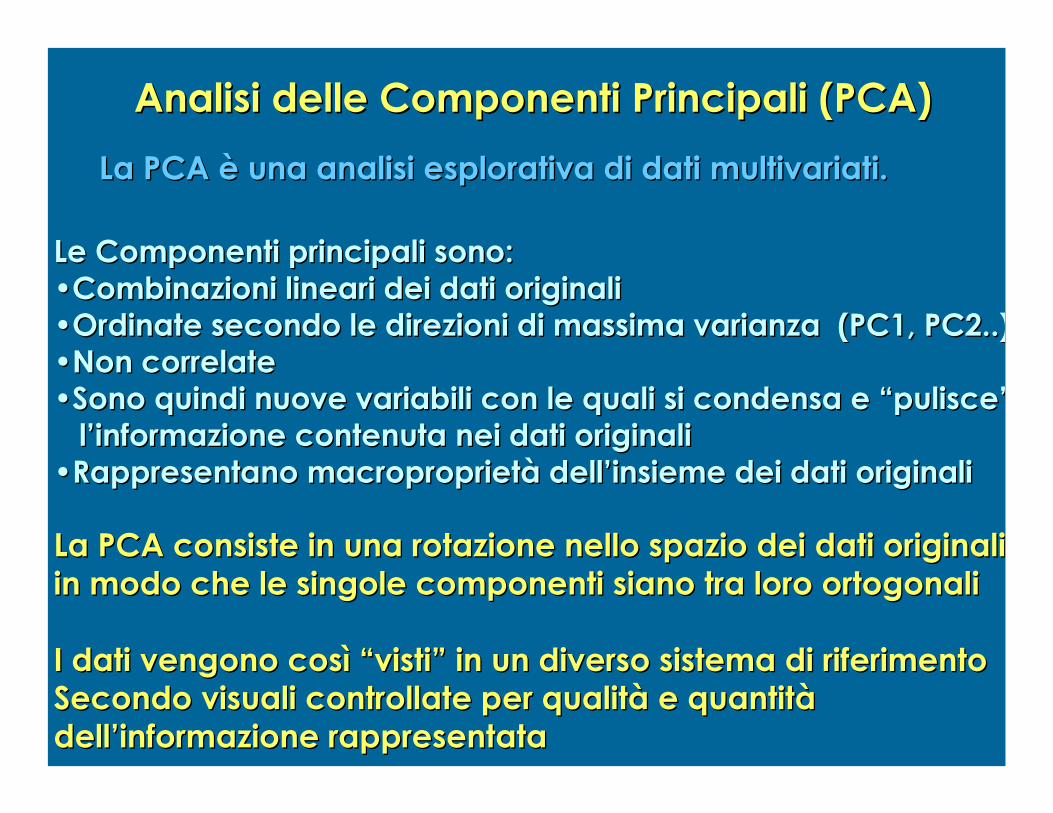
AnalisiAnalisi delledelle ComponentiComponenti PrincipaliPrincipali (PCA)(PCA)
La PCA è La PCA è unauna analisianalisi esplorativaesplorativa didi datidati multivariatimultivariati..
Le Le ComponentiComponenti principaliprincipali sonosono::••CombinazioniCombinazioni linearilineari deidei datidati originalioriginali••Ordinate Ordinate secondosecondo le le direzionidirezioni didi massimamassima varianzavarianza (PC1, PC2..)(PC1, PC2..)••Non correlateNon correlate••SonoSono quindiquindi nuovenuove variabilivariabili con le con le qualiquali sisi condensacondensa e “e “puliscepulisce” ”
l’informazionel’informazione contenutacontenuta neinei datidati originalioriginali••RappresentanoRappresentano macroproprietàmacroproprietà dell’insiemedell’insieme deidei datidati originalioriginali
La PCA La PCA consisteconsiste in in unauna rotazionerotazione nellonello spaziospazio deidei datidati originalioriginaliin in modomodo cheche le le singolesingole componenticomponenti sianosiano tratra loroloro ortogonaliortogonali
I I datidati vengonovengono cosìcosì ““vistivisti” in un ” in un diversodiverso sistemasistema didi riferimentoriferimentoSecondoSecondo visualivisuali controllatecontrollate per per qualitàqualità e e quantitàquantitàdell’informazionedell’informazione rappresentatarappresentata
PERSISTENCE
ATMOSPHERIC
DEGRADATION REACTIONS
Reaction rate constants for the degradation by
Tropospheric Oxidants:
OHOH••,, NONO33•• radicals and Ozoneradicals and Ozone
Paola Gramatica - QSAR and Environmental Chemistry Research UnitDBSF - INSUBRIA University - (Varese - ITALY)
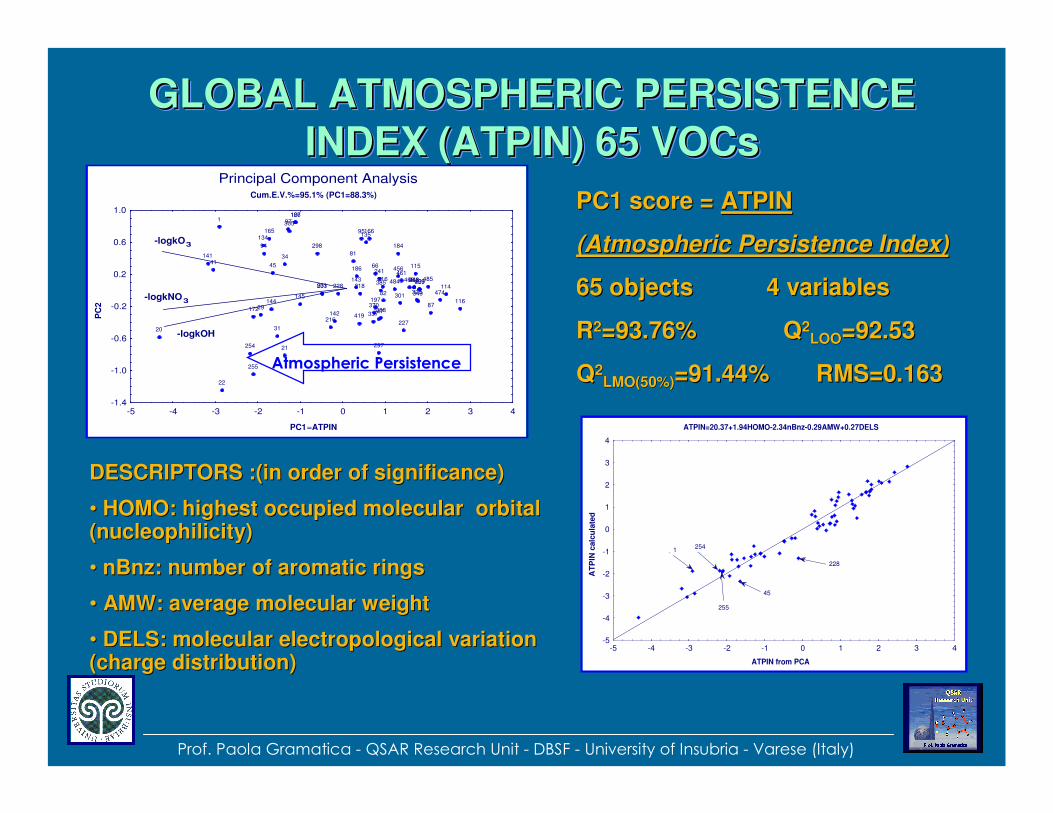
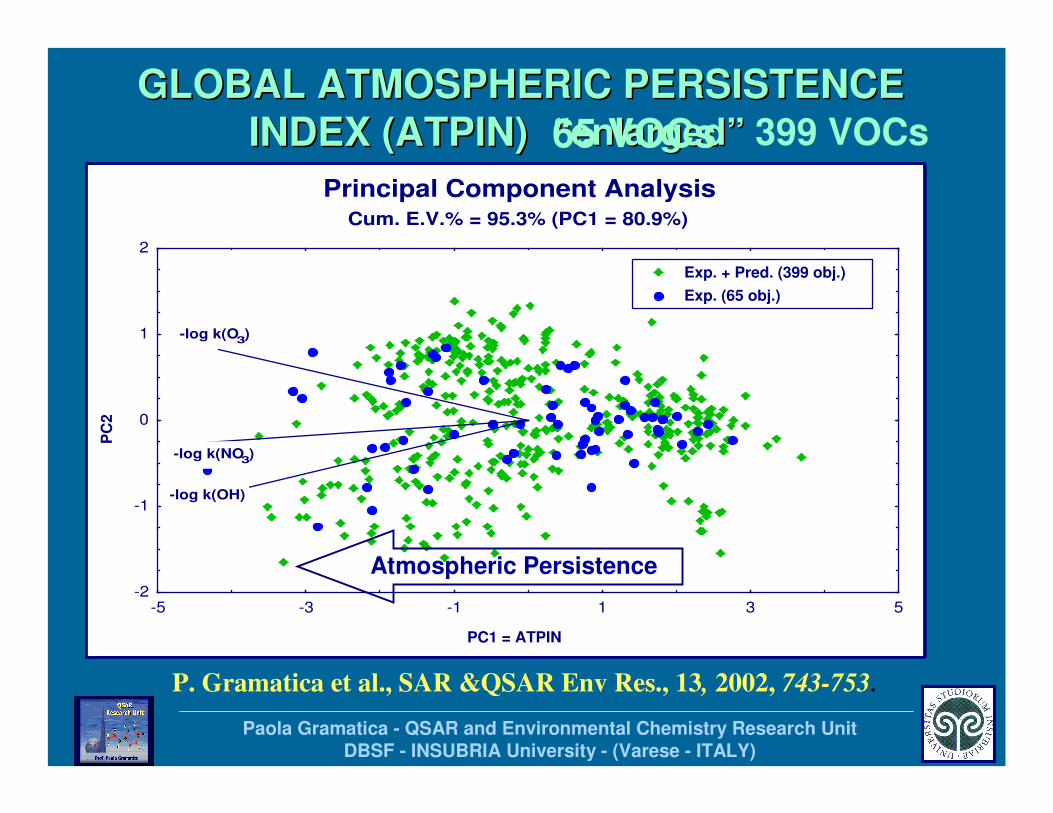
GLOBAL ATMOSPHERIC PERSISTENCEINDEX (ATPIN) 65 VOCs
GLOBAL ATMOSPHERIC PERSISTENCEGLOBAL ATMOSPHERIC PERSISTENCE
INDEX (ATPIN) 65 INDEX (ATPIN) 65 VOCsVOCs
ATPIN=20.37+1.94HOMO-2.34nBnz-0.29AMW+0.27DELS
ATPIN from PCA
AT
PIN
calc
ula
ted
-5
-4
-3
-2
-1
0
1
2
3
4
-5 -4 -3 -2 -1 0 1 2 3 4
1254
255
45
228
PC1 score = PC1 score = ATPINATPIN
(Atmospheric Persistence Index)(Atmospheric Persistence Index)
65 objects 4 variables65 objects 4 variables
RR22=93.76% Q=93.76% Q22LOOLOO=92.53=92.53
QQ22LMO(50%)LMO(50%)=91.44% RMS=0.163=91.44% RMS=0.163
DESCRIPTORS :(in order of significance)DESCRIPTORS :(in order of significance)
•• HOMO: highest occupied molecular orbital HOMO: highest occupied molecular orbital ((nucleophilicitynucleophilicity))
•• nBnznBnz: number of aromatic rings: number of aromatic rings
•• AMW: average molecular weight AMW: average molecular weight
•• DELS: molecular DELS: molecular electropologicalelectropological variation variation (charge distribution)(charge distribution)
Principal Component AnalysisCum.E.V.%=95.1% (PC1=88.3%)
PC1=ATPIN
PC
2
1
20
21
22
29
31
3441
45 66
81
82
87
94
95
97
114
115
116
126
134135
141
142
143
144145
165 166
167
172
184
186
197
216
218
227
228229
233
241
243
247
254
255
297
298
301
305
316
325
337
349
370
385
388419
456
459
461466468
474
484 485501
-1.4
-1.0
-0.6
-0.2
0.2
0.6
1.0
-5 -4 -3 -2 -1 0 1 2 3 4
-logkOH
-logkNO3
-logkO3
Atmospheric Persistence
Prof. Paola Gramatica - QSAR Research Unit - DBSF - University of Insubria - Varese (Italy)
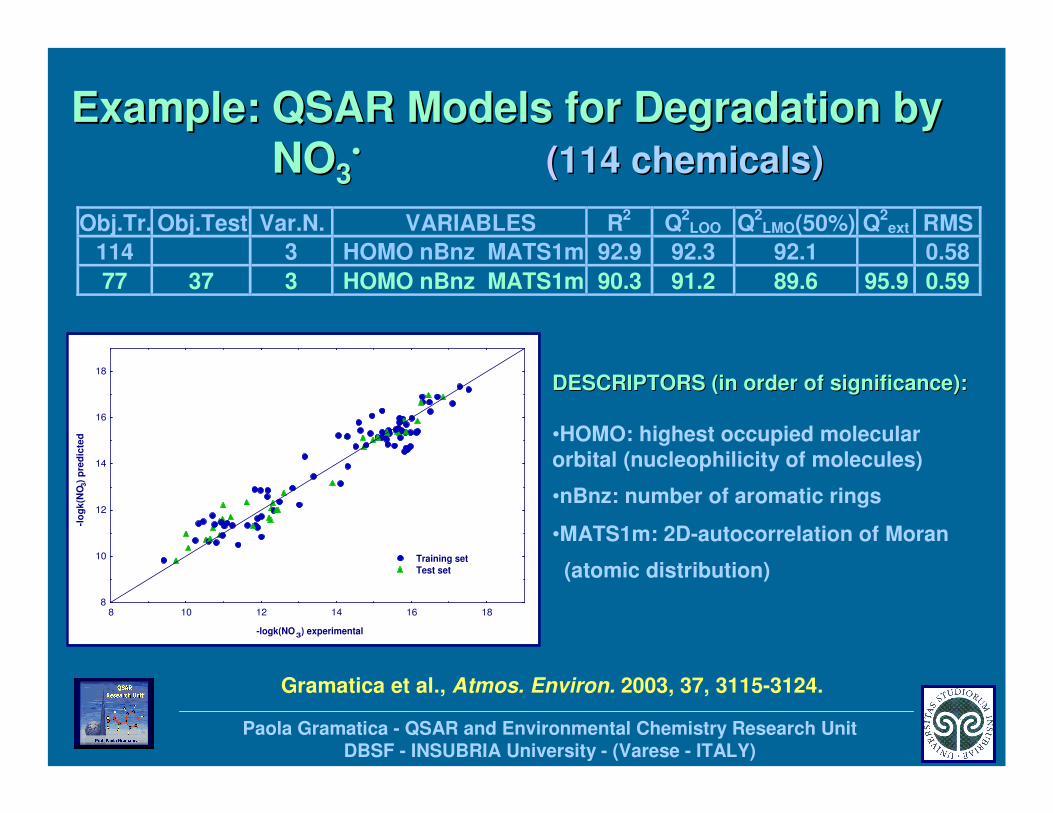
Example: QSAR Models for Degradation byExample: QSAR Models for Degradation by
NONO33•• ((114 chemicals)114 chemicals)
DESCRIPTORS (in order of significance):DESCRIPTORS (in order of significance):
•HOMO: highest occupied molecular
orbital (nucleophilicity of molecules)
•nBnz: number of aromatic rings
•MATS1m: 2D-autocorrelation of Moran
(atomic distribution)
-logk(NO3) experimental
-lo
gk
(NO
3)
pre
dic
ted
8
10
12
14
16
18
8 10 12 14 16 18
Training set
Test set
Gramatica et al., Atmos. Environ. 2003, 37, 3115-3124.
Obj.Tr. Obj.Test Var.N. VARIABLES R2
Q2LOO Q
2LMO(50%) Q
2ext RMS
114 3 HOMO nBnz MATS1m 92.9 92.3 92.1 0.58
77 37 3 HOMO nBnz MATS1m 90.3 91.2 89.6 95.9 0.59
Paola Gramatica - QSAR and Environmental Chemistry Research UnitDBSF - INSUBRIA University - (Varese - ITALY)
Principal Component AnalysisCum.E.V.%=95.1% (PC1=88.3%)
PC1=ATPIN
PC
2
-1.4
-1.0
-0.6
-0.2
0.2
0.6
1.0
-5 -4 -3 -2 -1 0 1 2 3 4
-logk(OH)
-logk(NO3)
-logk(O3)
Atmospheric Persistence
GLOBAL ATMOSPHERIC PERSISTENCEGLOBAL ATMOSPHERIC PERSISTENCE
INDEX (ATPIN)INDEX (ATPIN)
Principal Component AnalysisCum. E.V.% = 95.3% (PC1 = 80.9%)
PC1 = ATPIN
PC
2
-2
-1
0
1
2
-5 -3 -1 1 3 5
Exp. + Pred. (399 obj.)
Exp. (65 obj.)
-log k(OH)
-log k(NO3)
-log k(O3)
Atmospheric Persistence
““enlargedenlarged” ” 399 VOCs65 VOCs
Paola Gramatica - QSAR and Environmental Chemistry Research UnitDBSF - INSUBRIA University - (Varese - ITALY)
P. Gramatica et al., SAR &QSAR Env Res., 13, 2002, 743-753.
ATPIN da PCA
AT
PIN
calc
ola
to
-4.5
-3.5
-2.5
-1.5
-0.5
0.5
1.5
2.5
3.5
4.5
-4.5 -3.5 -2.5 -1.5 -0.5 0.5 1.5 2.5 3.5 4.5
Training set
Test set
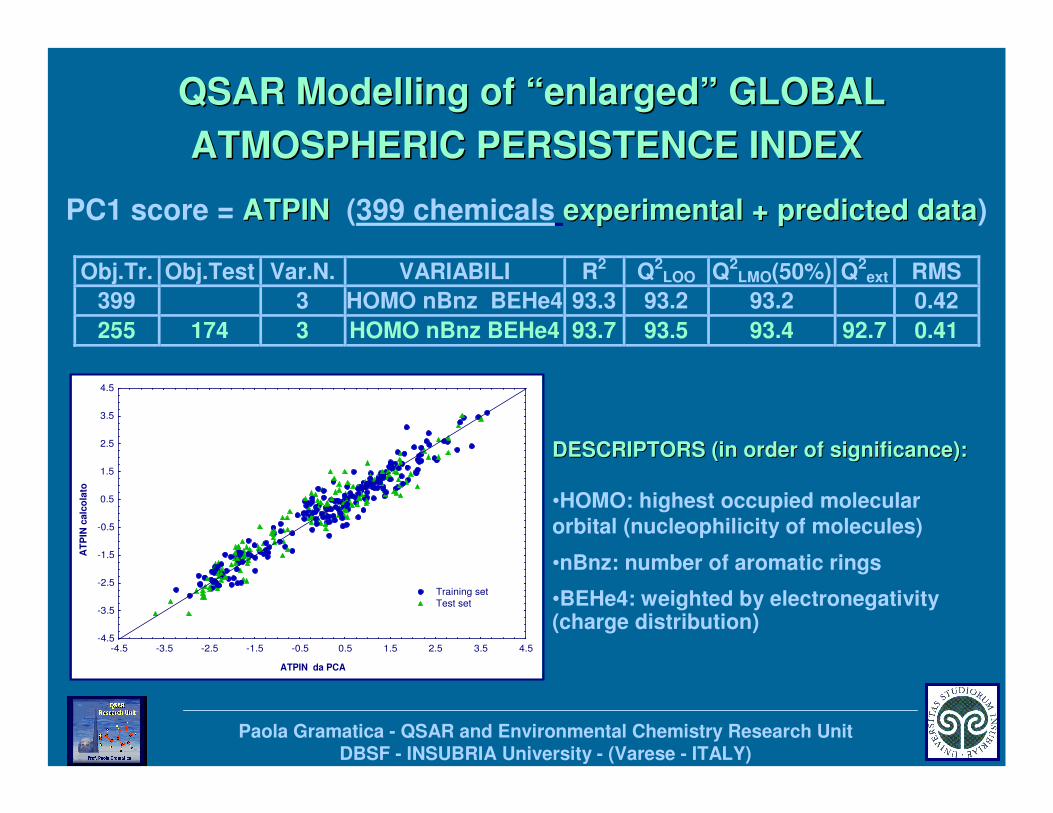
Obj.Tr. Obj.Test Var.N. VARIABILI R2 Q2LOO Q2
LMO(50%) Q2ext RMS
399 3 HOMO nBnz BEHe4 93.3 93.2 93.2 0.42
255 174 3 HOMO nBnz BEHe4 93.7 93.5 93.4 92.7 0.41
QSAR Modelling of “enlarged” GLOBAL QSAR Modelling of “enlarged” GLOBAL
ATMOSPHERIC PERSISTENCE INDEXATMOSPHERIC PERSISTENCE INDEX
PC1 score = ATPINATPIN (399 chemicals experimental + predicted dataexperimental + predicted data)
DESCRIPTORS (in order of significance):DESCRIPTORS (in order of significance):
•HOMO: highest occupied molecular
orbital (nucleophilicity of molecules)
•nBnz: number of aromatic rings
•BEHe4: weighted by electronegativity(charge distribution)
Paola Gramatica - QSAR and Environmental Chemistry Research UnitDBSF - INSUBRIA University - (Varese - ITALY)
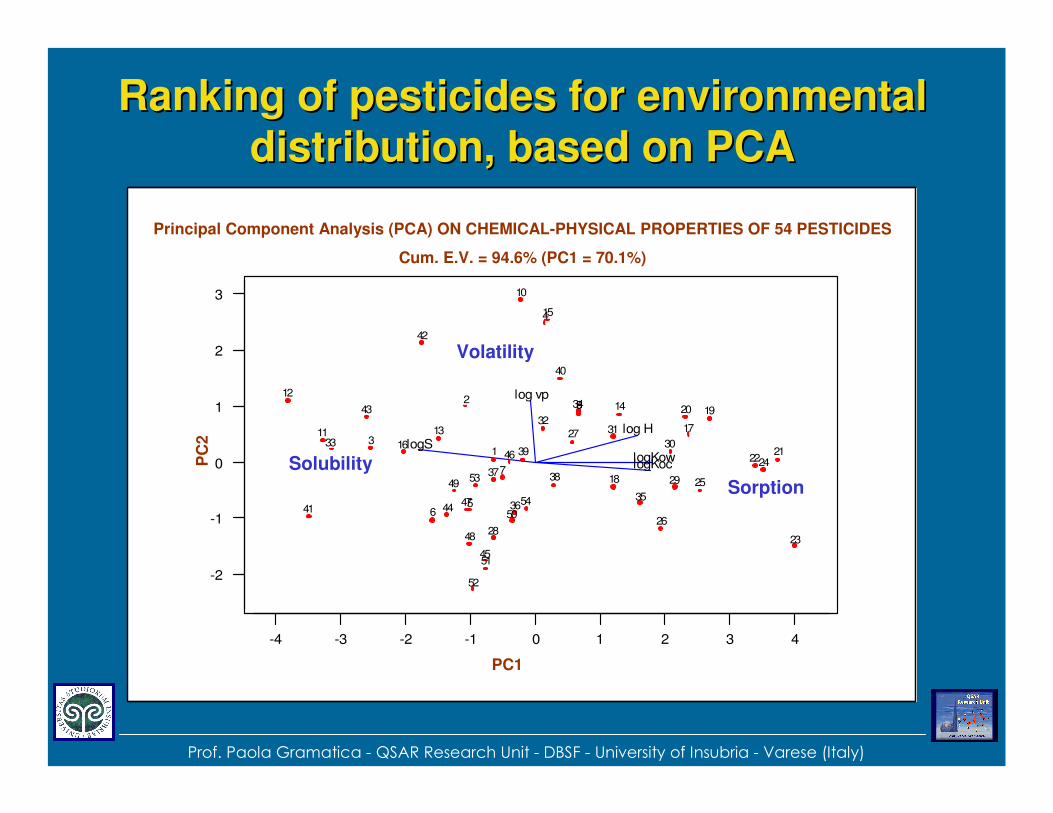
Ranking of pesticides for environmental Ranking of pesticides for environmental
distribution, based on PCAdistribution, based on PCA
Prof. Paola Gramatica - QSAR Research Unit - DBSF - University of Insubria - Varese (Italy)
CLA 1 = MEDIUM COMP.CLA 2 = VOLATILE COMP.
CLA 3 = SOLUBLE COMP.CLA 4 = SORBED COMP.
43210-1-2-3-4
3
2
1
0
-1
-2
log H
log vp
logKow logS
logKoc
54
53
52
51
50
49
48
47
46
45
44
43
42
41
40
39
3837
3635
34
33
3231
30
29
28
27
26
25
24
23
2221
20 19
18
17
16
15
14
13
12
11
10
98
7
65
4
3
2
1
PC1
PC
2
Principal Component Analysis (PCA) ON CHEMICAL-PHYSICAL PROPERTIES OF 54 PESTICIDES
Cum. E.V. = 94.6% (PC1 = 70.1%)
Sorption
Solubility
Volatility
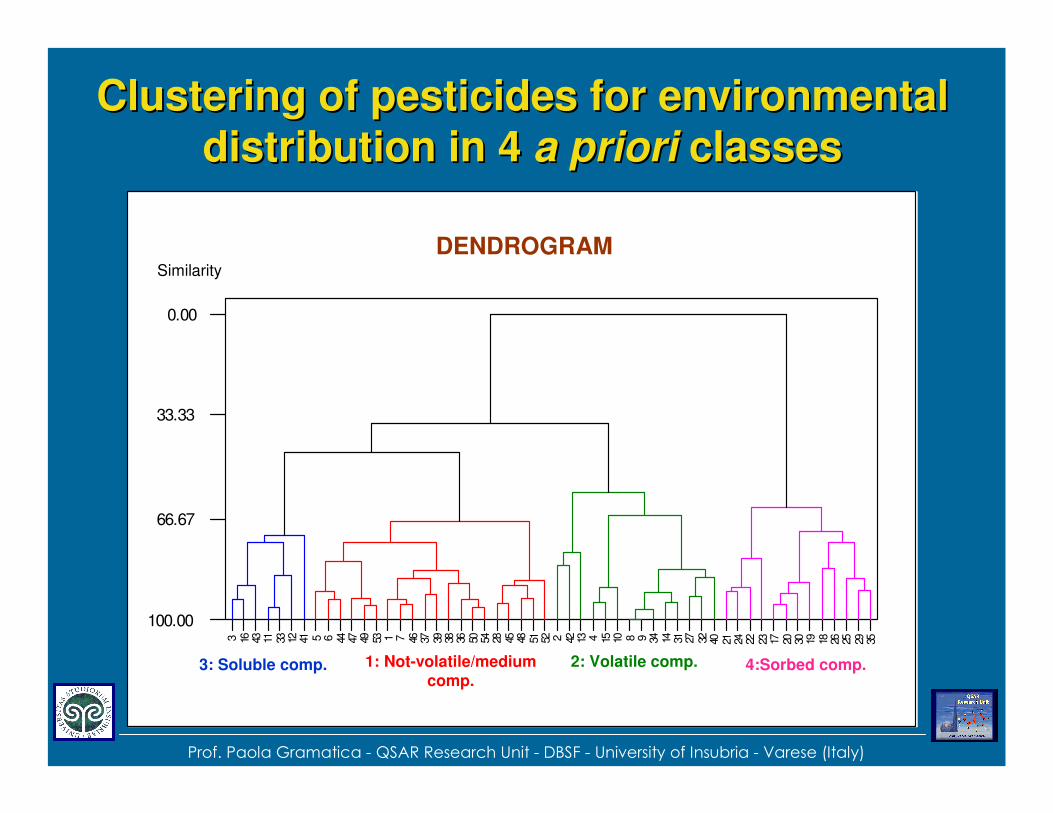
Clustering of pesticides for environmental Clustering of pesticides for environmental
distribution in 4 distribution in 4 a prioria priori classesclasses
Prof. Paola Gramatica - QSAR Research Unit - DBSF - University of Insubria - Varese (Italy)
4112331143163 525148452854503638393746715349474465 403227311434981015413422 35292526181930201723222421
0.00
33.33
66.67
100.00
1 23 43: Soluble comp. 1: Not-volatile/medium comp.
2: Volatile comp. 4:Sorbed comp.
DENDROGRAMSimilarity
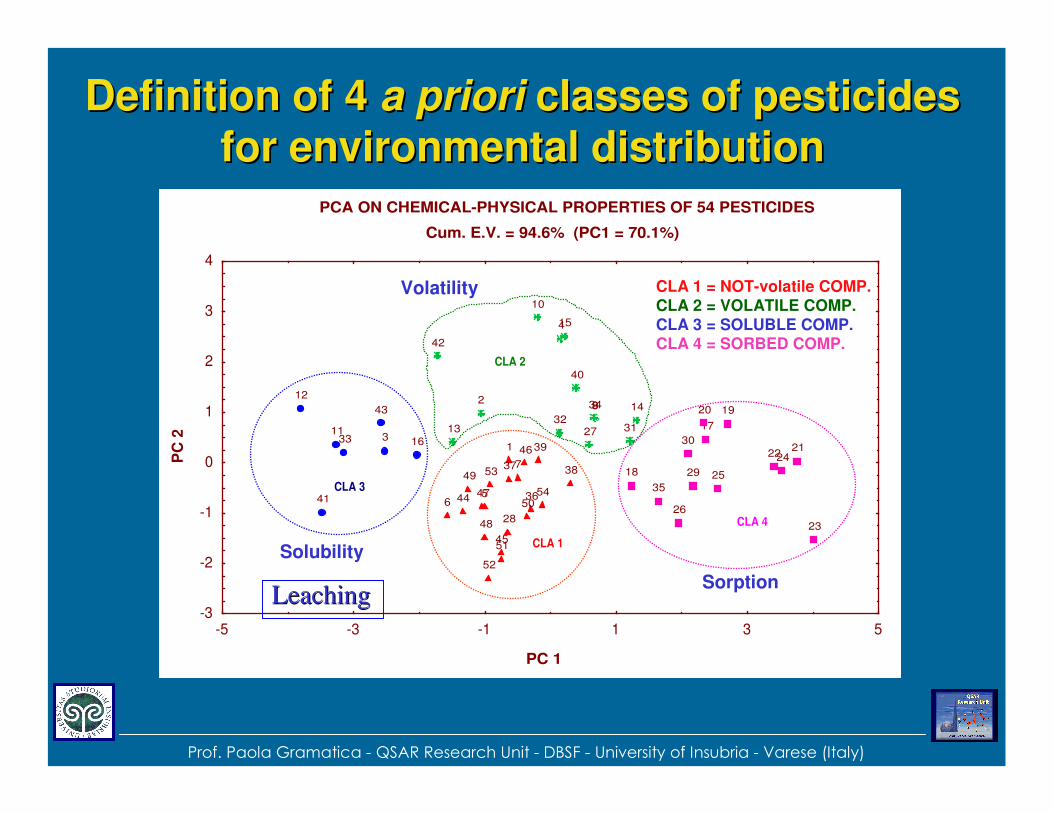
Definition of 4 Definition of 4 a prioria priori classes of pesticides classes of pesticides
for environmental distributionfor environmental distribution
Prof. Paola Gramatica - QSAR Research Unit - DBSF - University of Insubria - Varese (Italy)
PCA ON CHEMICAL-PHYSICAL PROPERTIES OF 54 PESTICIDES
Cum. E.V. = 94.6% (PC1 = 70.1%)
PC 1
PC
2
1
2
3
4
56
7
89
10
11
12
13
14
15
16
17
18
1920
2122
23
24
25
26
27
28
29
3031
32
33
34
3536
37 38
39
40
41
42
43
44
45
46
47
48
49
50
51
52
53
54
-3
-2
-1
0
1
2
3
4
-5 -3 -1 1 3 5
CLA 3
CLA 2
CLA 1
CLA 4
CLA 1 = NOT-volatile COMP.CLA 2 = VOLATILE COMP.
CLA 3 = SOLUBLE COMP.CLA 4 = SORBED COMP.
LeachingLeachingSorption
Solubility
Volatility
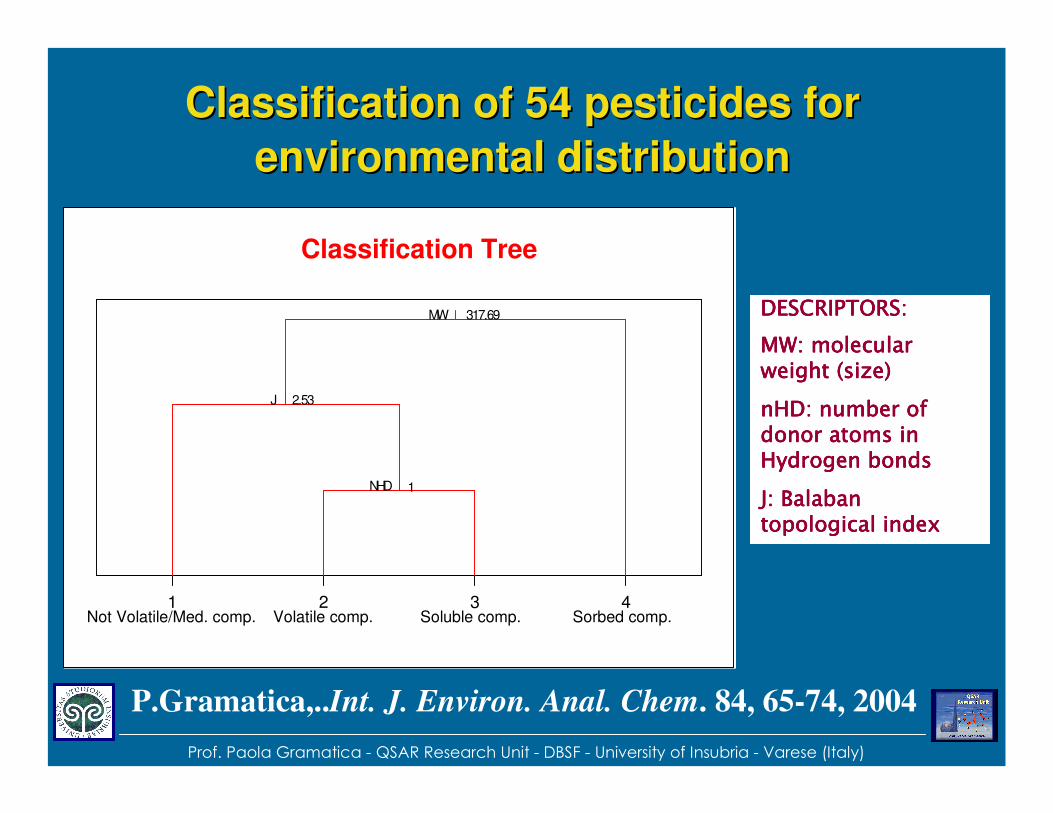
Classification of 54 pesticides for Classification of 54 pesticides for
environmental distributionenvironmental distribution
Prof. Paola Gramatica - QSAR Research Unit - DBSF - University of Insubria - Varese (Italy)
1 2 3 4
1NHD
2.53J
317.69MW
Classification Tree
DESCRIPTORS:DESCRIPTORS:DESCRIPTORS:DESCRIPTORS:
MW: molecular MW: molecular MW: molecular MW: molecular weight (size) weight (size) weight (size) weight (size)
nHDnHDnHDnHD: number of : number of : number of : number of donor atoms in donor atoms in donor atoms in donor atoms in Hydrogen bonds Hydrogen bonds Hydrogen bonds Hydrogen bonds
J: J: J: J: BalabanBalabanBalabanBalabantopological indextopological indextopological indextopological index
Not Volatile/Med. comp. Sorbed comp.Soluble comp.Volatile comp.
P.Gramatica,..Int. J. Environ. Anal. Chem. 84, 65-74, 2004
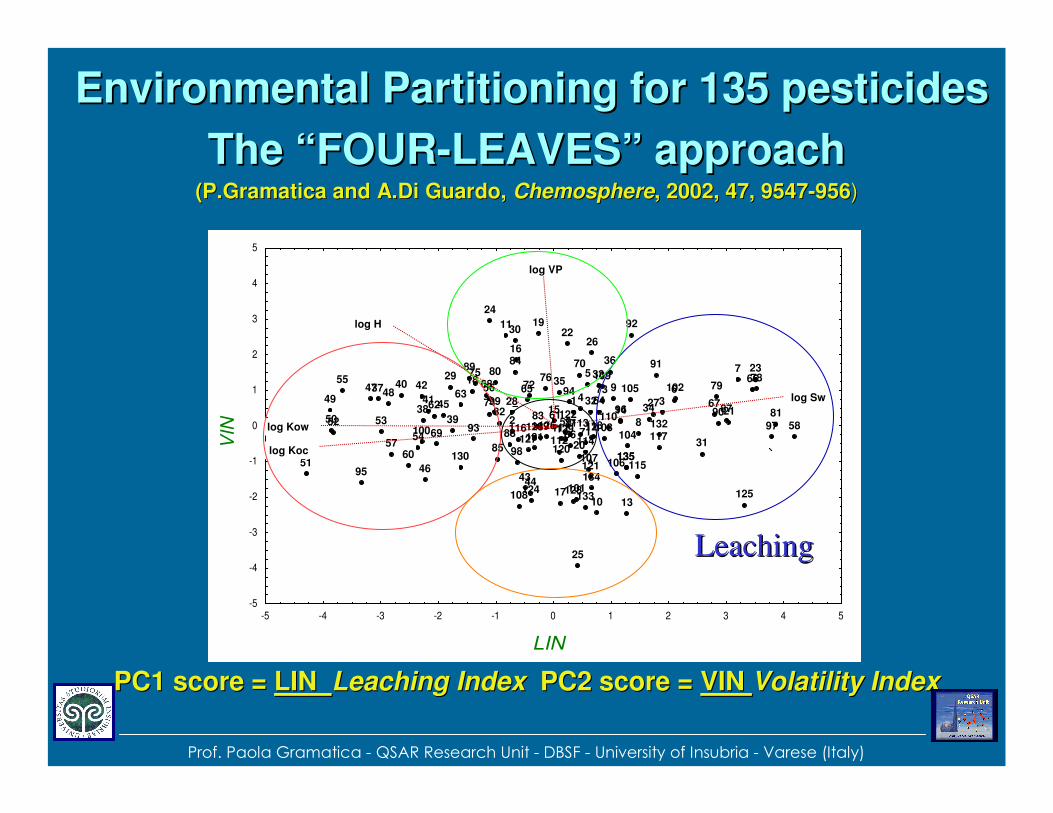
Environmental Partitioning for 135 pesticidesEnvironmental Partitioning for 135 pesticides
The “FOURThe “FOUR--LEAVES” approachLEAVES” approach((P.GramaticaP.Gramatica and and A.DiA.Di GuardoGuardo, , ChemosphereChemosphere, 2002, 47, 9547, 2002, 47, 9547--956956))
PC1 score = PC1 score = LIN LIN Leaching IndexLeaching Index PC2 score = PC2 score = VIN VIN Volatility IndexVolatility Index
Prof. Paola Gramatica - QSAR Research Unit - DBSF - University of Insubria - Varese (Italy)
LIN
VIN
1
2
34
5
6
7
8
9
10
11
12
13
1415
16
17
18
19
20
21
22
23
24
25
26
2728
29
30
31
32
33
34
35
36
37
3839
40
41
42
4344
45
46
47 4849
50
51
52 53
54
5556
57
5859
60
6162
6364
6566
67
68
69
70
71
72 73
74
75 76
77
7879
80
8182 83
84
85
86
87
88
89
90
91
92
93
94
95
96
97
98
99
100
101
102
103104
105
106107
108
109
110111112
113
114
115
116117
118119
120
121
122123
124 125
126
127
128
129
130
131
132
133
134
135135
-5
-4
-3
-2
-1
0
1
2
3
4
5
-5 -4 -3 -2 -1 0 1 2 3 4 5
log VP
log Sw
log H
log Kow
log Koc
LeachingLeaching
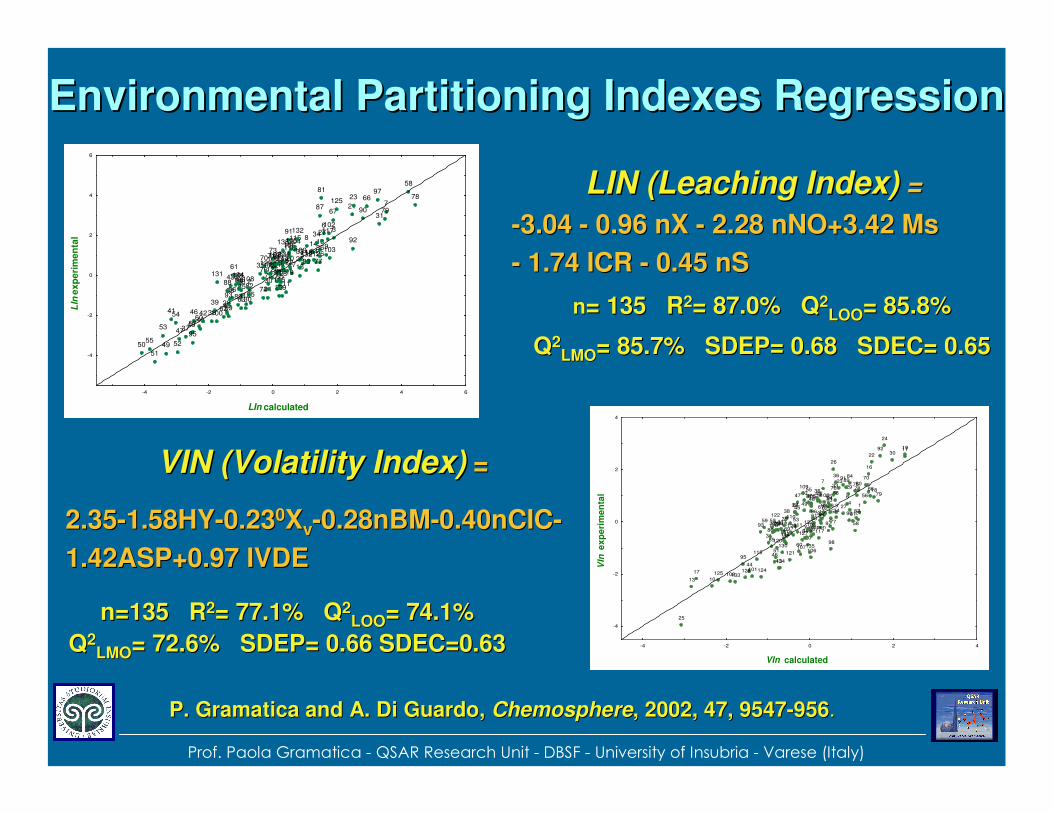
Environmental Partitioning Indexes RegressionEnvironmental Partitioning Indexes Regression
P. P. GramaticaGramatica and A. and A. DiDi GuardoGuardo, , ChemosphereChemosphere, 2002, 47, 9547, 2002, 47, 9547--956956..
LIN (Leaching Index)LIN (Leaching Index) ==
--3.04 3.04 -- 0.96 0.96 nXnX -- 2.28 nNO+3.42 Ms 2.28 nNO+3.42 Ms
-- 1.74 ICR 1.74 ICR -- 0.45 0.45 nSnS
Prof. Paola Gramatica - QSAR Research Unit - DBSF - University of Insubria - Varese (Italy)
LIn calculated
LIn
ex
pe
rim
en
tal
1
2
3
4 5
6
7
8
910
11
12
1314
15
16
17
18
19
20
21
22
23
24
2526
27
28
29
30
31
3233
34
35
36
37
38
39
40
41 42
43 44
4546
4748
4950
51
52
53
54
55
56
57
58
59
60
61
62
63
64
65
66
67
68
69
7071
72
73
7475
76
77
78
79
80
81
82
838485
86
87
88
89
90
91
92
93
94
95
96
97
9899
100
101
102
103
104105106
107
108
109110
111112113114
115
116
117
118
119120
121122
123124
125
126127
128129
130
131
132
133134
135
-4
-2
0
2
4
6
-4 -2 0 2 4 6
VIn calculated
VIn
e
xp
eri
me
nta
l
1
2
34
5
6
7
8
9
10
11
12
13
14 15
16
17
18
19
20
21
22
23
24
25
26
2728
29
30
31
32
33
34
35
36
37
38
39
40
41
42
4344
45
46
4748
49
50
51
52 53
54
55
56
57
5859
60
61
62
6364
65
66
67
68
69
70
71
7273
74
7576
77
7879
80
818283
84
85
86
87
88
89
90
91
92
93
94
95
96
97
98
99
Y respon
101
102
103104
105
106107
108
109
110
111
112
113
114
115
116
117
118119
120
121
122
123
124125
126
127
128
129
130
131
132
133
134
135
-4
-2
0
2
4
-4 -2 0 2 4
nn= 135 R= 135 R22= 87.0% Q= 87.0% Q22LOOLOO= 85.8% = 85.8%
QQ22LMOLMO= 85.7% SDEP= 0.68 SDEC= 0.65= 85.7% SDEP= 0.68 SDEC= 0.65
VIN (Volatility Index)VIN (Volatility Index) = =
2.352.35--1.58HY1.58HY--0.230.2300XXvv--0.28nBM0.28nBM--0.40nCIC0.40nCIC--
1.42ASP+0.97 IVDE1.42ASP+0.97 IVDE
n=135 Rn=135 R22= 77.1% Q= 77.1% Q22LOOLOO= 74.1% = 74.1%
QQ22LMOLMO= 72.6% SDEP= 0.66 SDEC=0.63= 72.6% SDEP= 0.66 SDEC=0.63
WQO - Water Quality ObjectivesWQO WQO -- Water Quality ObjectivesWater Quality ObjectivesEEC Priority List 1 toxicity test on algae, Daphnia, fishEEC Priority List 1 toxicity test on algae, EEC Priority List 1 toxicity test on algae, DaphniaDaphnia, fish, fish
ZM1 72
CHI0 5.13
Assigned classI II III
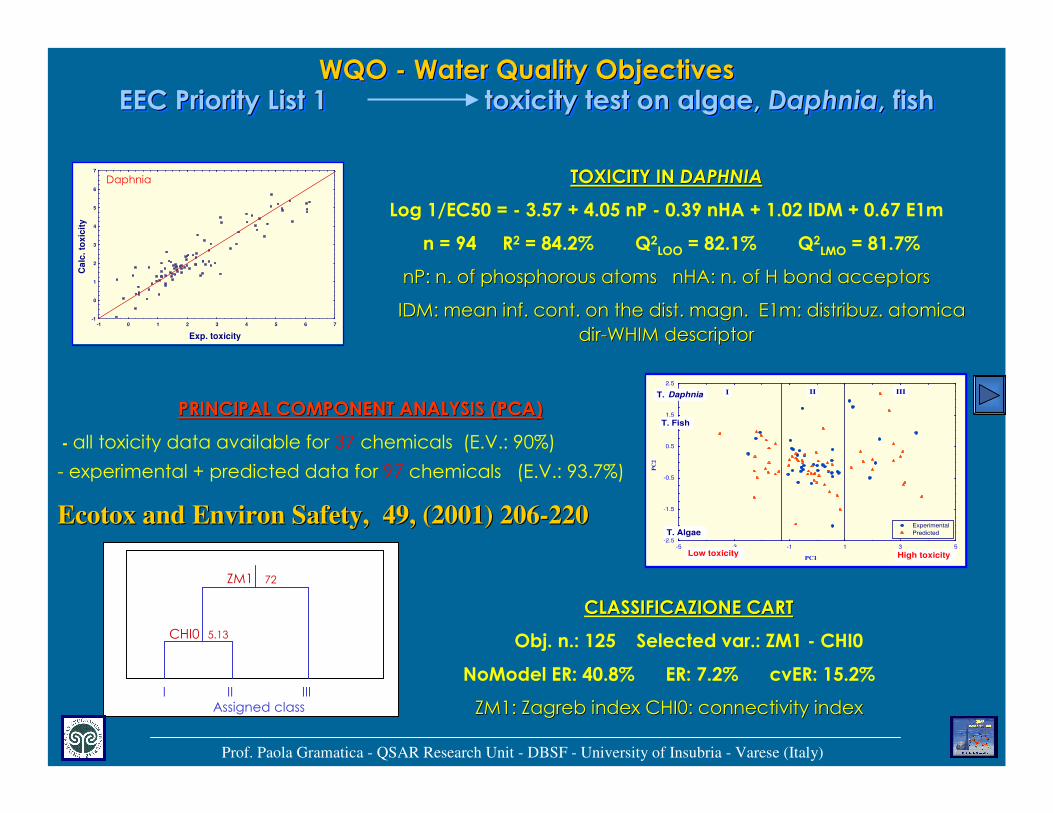
CLASSIFICAZIONE CART CLASSIFICAZIONE CART
Obj. n.: 125 Selected var.: ZM1 - CHI0
NoModel ER: 40.8% ER: 7.2% cvER: 15.2%
ZM1: Zagreb index CHI0: connectivity indexZM1: Zagreb index CHI0: connectivity index
Prof. Paola Gramatica - QSAR Research Unit - DBSF - University of Insubria - Varese (Italy)
TOXICITY IN TOXICITY IN DAPHNIADAPHNIA
Log 1/EC50 = - 3.57 + 4.05 nP - 0.39 nHA + 1.02 IDM + 0.67 E1m
n = 94 R2 = 84.2% Q2LOO = 82.1% Q2
LMO = 81.7%
nPnP: n. of phosphorous atoms : n. of phosphorous atoms nHAnHA: n. of H bond acceptors : n. of H bond acceptors
IDM: mean inf. cont. on the dist. IDM: mean inf. cont. on the dist. magnmagn. E1m: . E1m: distribuzdistribuz. . atomicaatomica
dirdir--WHIM descriptorWHIM descriptorExp. toxicity
Ca
lc. to
xic
ity
-1
0
1
2
3
4
5
6
7
-1 0 1 2 3 4 5 6 7
Daphnia
PC1
PC
2
-2.5
-1.5
-0.5
0.5
1.5
2.5
-5 -3 -1 1 3 5
Low toxicity High toxicity
T. Daphnia
T. Fish
T. Algae
Experimental
PC1
PC
2
-2.5
-1.5
-0.5
0.5
1.5
2.5
-5 -3 -1 1 3 5
Low toxicity High toxicity
T. Daphnia
T. Fish
T. AlgaeExperimental
Predicted
I II III
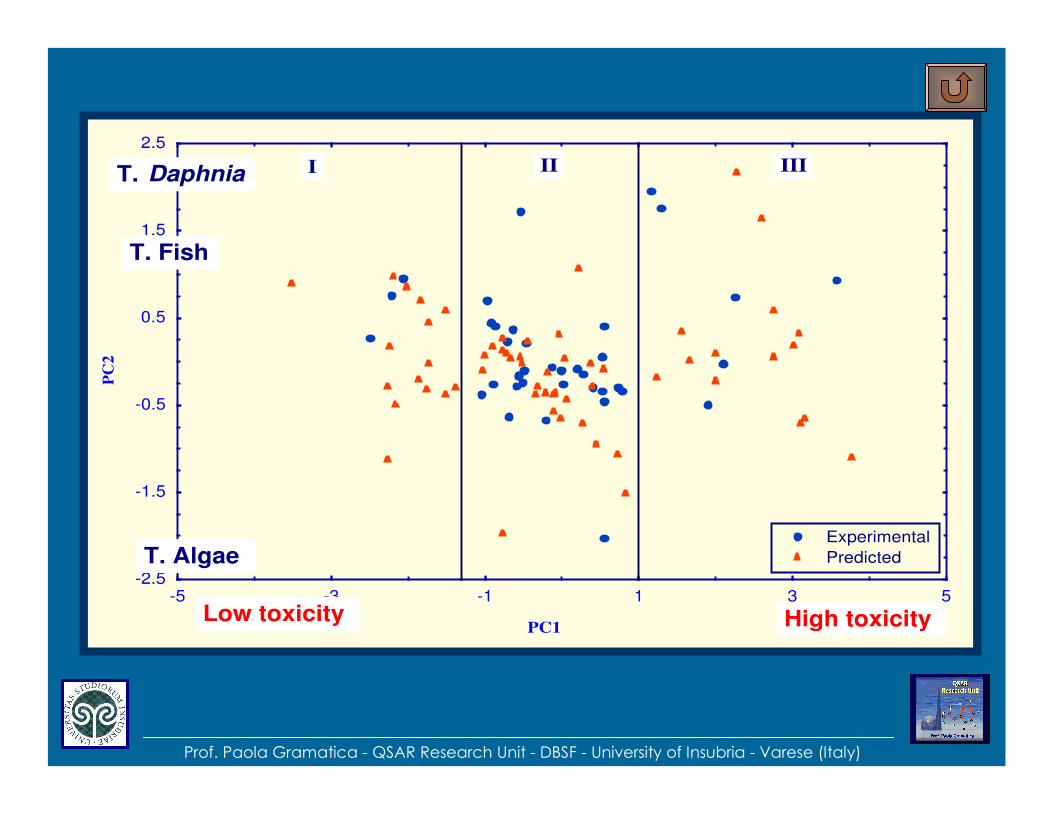
PRINCIPAL COMPONENT ANALYSIS (PCA) PRINCIPAL COMPONENT ANALYSIS (PCA)
- all toxicity data available for 37 chemicals (E.V.: 90%)
- experimental + predicted data for 97 chemicals (E.V.: 93.7%)
EcotoxEcotox and Environ Safety, 49, (2001) 206and Environ Safety, 49, (2001) 206--220 220
Prof. Paola Gramatica - QSAR Research Unit - DBSF - University of Insubria - Varese (Italy)
PC1
PC
2
-2.5
-1.5
-0.5
0.5
1.5
2.5
-5 -3 -1 1 3 5
Low toxicity High toxicity
T. Daphnia
T. Fish
T. AlgaeExperimental
Predicted
I II III
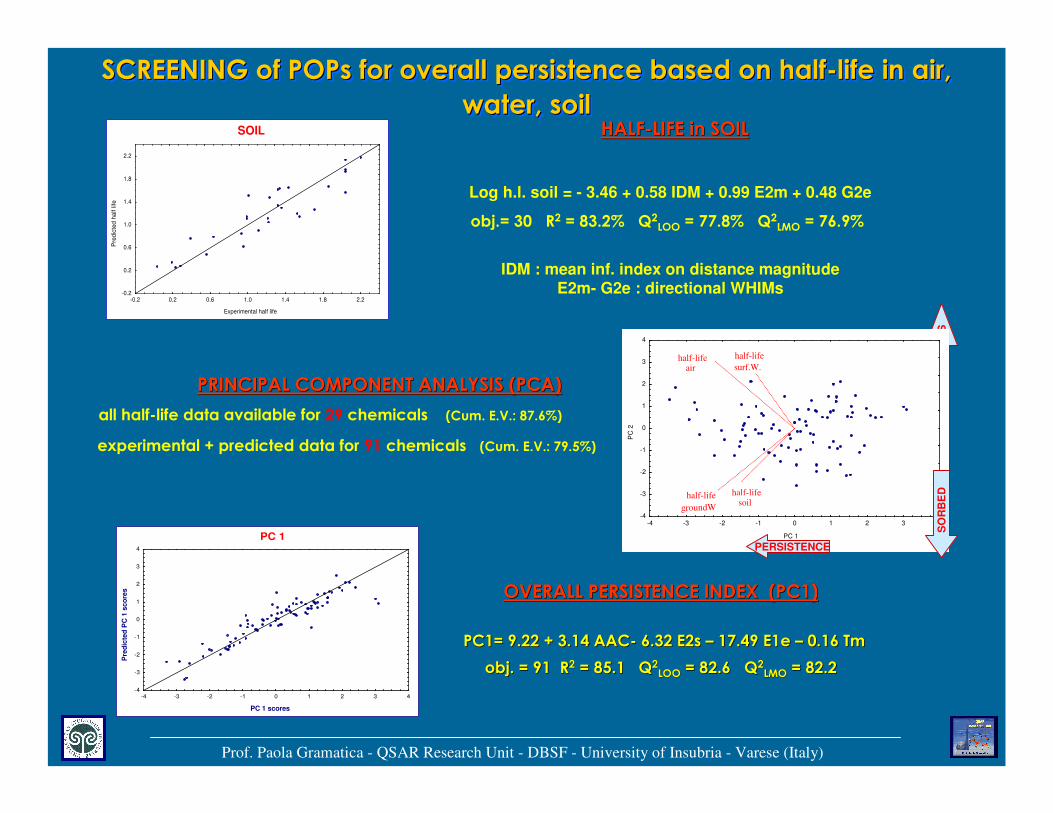
SCREENING of POPs for overall persistence based on half-life in air,
water, soil
SCREENING of SCREENING of POPsPOPs for overall persistence based on halffor overall persistence based on half--life in air, life in air,
water, soilwater, soil
Prof. Paola Gramatica - QSAR Research Unit - DBSF - University of Insubria - Varese (Italy)
SOIL
Experimental half life
Pre
dic
ted h
alf life
-0.2
0.2
0.6
1.0
1.4
1.8
2.2
-0.2 0.2 0.6 1.0 1.4 1.8 2.2
HALFHALF--LIFE in SOILLIFE in SOIL
Log h.l. soil = - 3.46 + 0.58 IDM + 0.99 E2m + 0.48 G2e
obj.= 30 R2 = 83.2% Q2LOO = 77.8% Q2
LMO = 76.9%
IDM : mean inf. index on distance magnitudeE2m- G2e : directional WHIMs
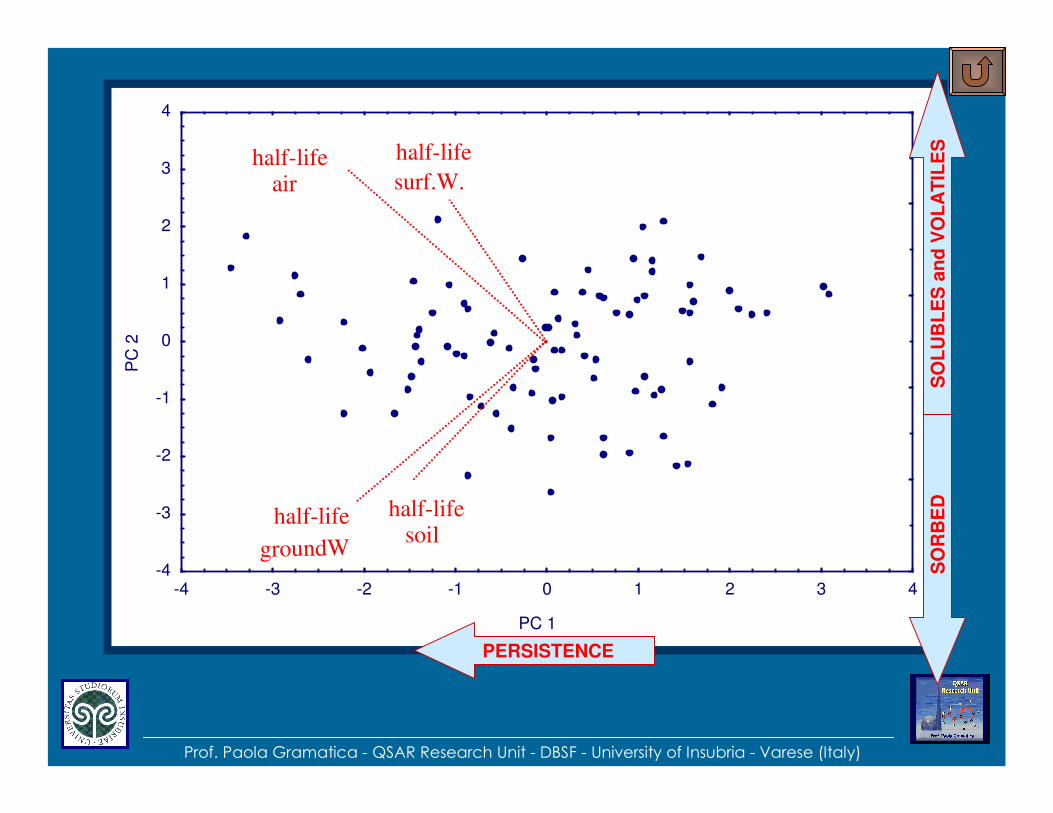
PRINCIPAL COMPONENT ANALYSIS (PCA) PRINCIPAL COMPONENT ANALYSIS (PCA)
all half-life data available for 29 chemicals (Cum. E.V.: 87.6%)
SO
LU
BL
ES
an
d V
OL
AT
ILE
S
PC 1
PC
2
-2.5
-1.5
-0.5
0.5
1.5
2.5
3.5
-4 -3 -2 -1 0 1 2 3 4PC 1
PC
2
-4
-3
-2
-1
0
1
2
3
4
-4 -3 -2 -1 0 1 2 3 4
groundW
air
half-lifehalf-life
half-lifehalf-lifesoil
surf.W.
experimental + predicted data for 91 chemicals (Cum. E.V.: 79.5%)
SO
RB
ED
PERSISTENCE
OVERALL PERSISTENCE INDEX (PC1) OVERALL PERSISTENCE INDEX (PC1)
PC1= 9.22 + 3.14 AACPC1= 9.22 + 3.14 AAC-- 6.32 6.32 EE2s2s –– 17.49 E1e 17.49 E1e –– 0.16 Tm0.16 Tm
objobj. = 91 R. = 91 R22 = 85.1 Q= 85.1 Q22LOOLOO = 82.6 Q= 82.6 Q22
LMOLMO = 82.2 = 82.2
PC 1
PC 1 scores
Pre
dic
ted
PC
1 s
co
res
-4
-3
-2
-1
0
1
2
3
4
-4 -3 -2 -1 0 1 2 3 4
Prof. Paola Gramatica - QSAR Research Unit - DBSF - University of Insubria - Varese (Italy)
PC 1
PC
2
-4
-3
-2
-1
0
1
2
3
4
-4 -3 -2 -1 0 1 2 3 4
groundW
air
half-lifehalf-life
half-lifehalf-lifesoil
surf.W.
PERSISTENCE
SO
LU
BL
ES
an
d V
OL
AT
ILE
SS
OR
BE
D
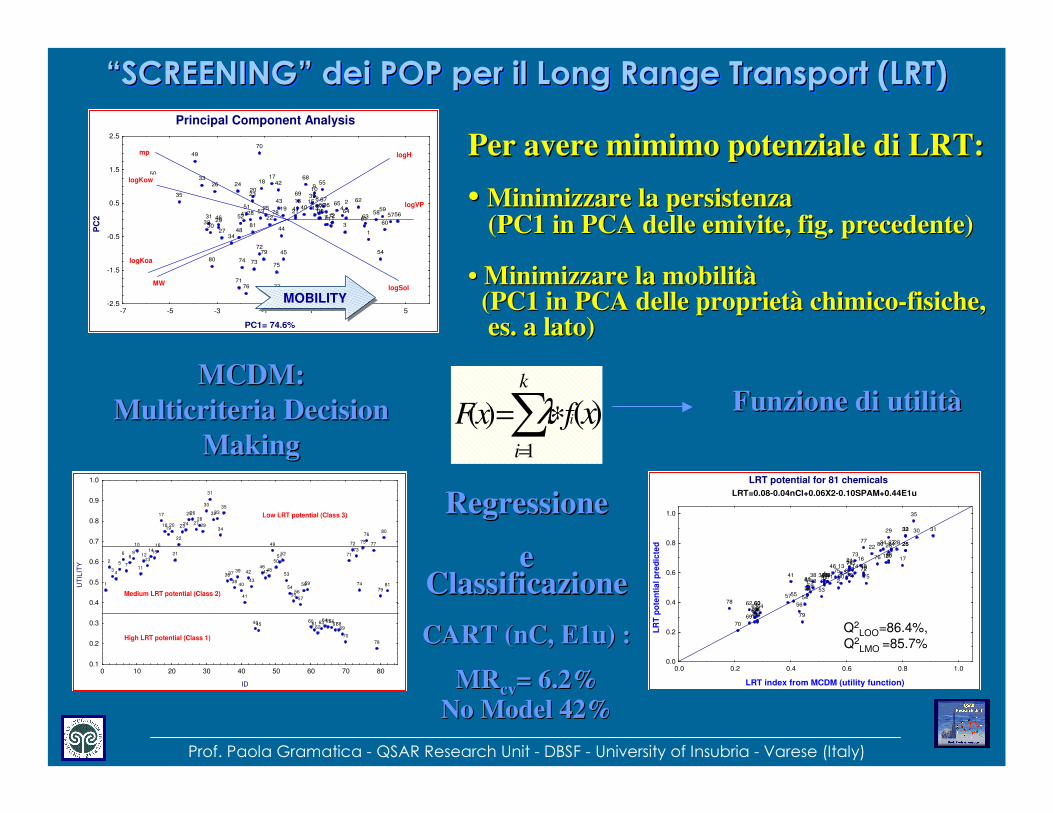
“SCREENING” dei POP per il Long Range Transport (LRT)“SCREENING” “SCREENING” deidei POP per POP per ilil Long Range Transport (LRT)Long Range Transport (LRT)
Prof. Paola Gramatica - QSAR Research Unit - DBSF - University of Insubria - Varese (Italy)
Principal Component Analysis
PC1= 74.6%
PC
2
1
2
3
4
567
8
910
1112
1314
1516
1718
19
20
2122
23
24
25
26
27
28
2930
3132
33
34
35
363738
39
4041
42
43
44
45
4647
48
49
50
51
5253
54
55
56575859
6061
62
6364
656667
68
69
70
71
72
737475
76 77
78
79
80
81
-2.5
-1.5
-0.5
0.5
1.5
2.5
-7 -5 -3 -1 1 3 5
mp
logKow
logKoa
logVP
logH
logSolMW
MOBILITYMOBILITY
LRT potential for 81 chemicals
LRT=0.08-0.04nCl+0.06X2-0.10SPAM+0.44E1u
LRT index from MCDM (utility function)
LR
T p
ote
nti
al p
red
icte
d
1 234
56
7 8 9 10
11 12
13 1415
16 17181920
21
22 2324 25262728
29 30 313233
34
35
3637
38 3940
41 4243
4445
46
4748
49
5051
52
53
5455
56
57
5859
6061
62 6364
6566
676869
70
7172
73
74
75
76
77
78
79
80
81
0.0
0.2
0.4
0.6
0.8
1.0
0.0 0.2 0.4 0.6 0.8 1.0
ID
UT
ILIT
Y
1
2
34
5
6
7
89
10
11
1213
1415
16
17
1819
20
21
22
2324
2526
2728
29
30
31
3233
34
35
3637
38
39
40
41
42
43
4445
464748
49
5051
52
53
54
5556
57
5859
6061
6263
6465666768
69
70
71
72
73
74
75
76
77
78
79
80
81
0.1
0.2
0.3
0.4
0.5
0.6
0.7
0.8
0.9
1.0
0 10 20 30 40 50 60 70 80
High LRT potential (Class 1)
Medium LRT potential (Class 2)
Low LRT potential (Class 3)
Fx fi i
i
k
x( ) ( )= ∗
=
∑λ1
MCDM: MCDM:
MulticriteriaMulticriteria DecisionDecision
MakingMaking
Per avere Per avere mimimomimimo potenziale di LRT:potenziale di LRT:
•• Minimizzare la persistenza Minimizzare la persistenza (PC1 in PCA delle (PC1 in PCA delle emiviteemivite, fig. precedente), fig. precedente)
•• Minimizzare la mobilità Minimizzare la mobilità (PC1 in PCA delle proprietà chimico(PC1 in PCA delle proprietà chimico--fisiche,fisiche,es. a lato)es. a lato)
Q2LOO=86.4%,
Q2LMO =85.7%
Funzione di utilitàFunzione di utilità
Regressione Regressione
eeClassificazioneClassificazione
CART (CART (nCnC, E1u) :, E1u) :
MRMRcvcv== 6.2%6.2%
No Model 42%No Model 42%
Prof. Paola Gramatica - QSAR Research Unit - DBSF - University of Insubria - Varese (Italy)
AcknowledgementsAcknowledgementsAcknowledgements
Dr. Ester Papa
Dr. Pamela Pilutti
Dr. Francesca Battaini
Dr. Fulvio Villa
Dr.Dr. Ester Papa Ester Papa
Dr. Pamela Dr. Pamela PiluttiPilutti
Dr. Francesca Dr. Francesca BattainiBattaini
Dr. Dr. FulvioFulvio VillaVilla
http://http://dipbsf.uninsubria.it/qsardipbsf.uninsubria.it/qsar
http://http://www.qsar.itwww.qsar.it