Embed Size (px)
Citation preview
VTT SY
MP
OSIU
M 244
Applied M
aterial Research at V
TT
ESPOO 2006ESPOO 2006ESPOO 2006ESPOO 2006ESPOO 2006 VTT SYMPOSIUM 244
Applied Material Research at VTT
ISBN 951–38–6311–5 (soft back ed.) ISBN 951–38–6312–3 (URL: http://www.vtt.fi/inf/pdf/)ISSN 0357–9387 (soft back ed.) ISSN 1455–0873 (URL: http://www.vtt.fi/inf/pdf/)
Tätä julkaisua myy Denna publikation säljs av This publication is available from
VTT VTT VTTPL 1000 PB 1000 P.O. Box 1000
02044 VTT 02044 VTT FI-02044 VTT, FinlandPuh. 020 722 4404 Tel. 020 722 4404 Phone internat. +358 20 722 4404Faksi 020 722 4374 Fax 020 722 4374 Fax +358 20 722 4374
VTT SYMPOSIUM
232 The Food, GI-tract Functionality and Human Health Cluster, PROEUHEALTH. 3rdWorkshop. 3rd Workshop. Sitges, Spain 15–17 March 2004. Toim. AnnemariKuokka, Maria Saarela & Tiina Mattila-Sandholm. Espoo 2003. 106 p.
233 BALTICA VI. International Conference on Life Management and Maintenance forPower Plants. Vol. 1. Helsinki - Stockholm - Helsinki 8–10 June, 2004. Ed. by JuhaVeivo & Pertti Auerkari. Espoo 2004. 354 p.
234 BALTICA VI. International Conference on Life Management and Maintenance forPower Plants. Vol. 2. Helsinki - Stockholm - Helsinki 8–10 June, 2004. Ed. by JuhaVeivo & Pertti Auerkari. Espoo 2004. 354 p.
235 URSI/IEEE XXIX Convention on Radio Science. Espoo, Finland, November 1–2,2004. Ed. by Manu Lahdes. Espoo 2004. 154 p. + CD-rom
236 Teollisuuden käynnissäpidon prognostiikka. Espoo, 1.12.2004. Toim. Aino Helle.2005. 117 p. + CD-rom
237 Competent Design by Castings. Improvements in a Nordic project. GJUTDESIGN-2005 final seminar. Espoo, 13.–14.6.2005. Ed. by Jack Samuelsson, Gary Marquis& Jussi Solin. 391 p. + app. 4 p.
238 COST ACTION E36. Modelling and simulation in pulp and paper industry. Proceed-ings of Model Validation Workshop. Espoo, Finland, 6 October, 2005. Ed. byJohannes Kappen, Jussi Manninen & Risto Ritala. 2005. 87 p.
239 Kunnossapito ja prognostiikka. Prognos-vuosiseminaari 2005. Tampere, 3.11.2005.Toim. Aino Helle. 2005. 79 s. + liitt. 7 s.
240 37TH R3-NORDIC. CONTAMINATION CONTROL SYMPOSIUM. Tampere, Finland,May 29–31, 2006. Ed. by Gun Wirtanen & Satu Salo. 2006. 449 p. + app. 3 p.
241 The 7th International Conference on eXtreme Programming and Agile Processes inSoftware Engineering. Tutorials, Workshops, Activities, and Keynote Speeches.Oulu, Finland, June 17–22, 2006. Ed. by Outi Salo, Pekka Abrahamsson & PäiviJäring. 2006. 92 p. + app. 3 p.
242 International Specialised Symposium on Yeasts ISSY25. Systems Biology of Yeasts– from Models to Applications. Hanasaari, Espoo, Finland, June 18–21, 2006. Ed.by Annemari Kuokka & Merja Penttilä. 2006. 177 p.
243 Prognostics for industrial machinery availability. Final seminar. Espoo 12.12.2006.Ed. by Aino Helle. 2006. 168 p. + app. 19 p.
244 Applied Material Research at VTT. Ed. by Anne-Christine Ritschkoff, Jari Koskinen& Mika Paajanen. 2006. 334 p.

VTT SYMPOSIUM 244 Keywords: materials research, elastomers, isolators, nanostructured materials, catalysts, dielectric elastomers, shape-memory alloys, nanorods, ferroelectric materials, thin films, biomaterials, properties
Applied Material Research at VTT
Edited by
Anne-Christine Ritschkoff, Jari Koskinen & Mika Paajanen
Organized by
VTT Technical Research Centre of Finland
ISBN 9513863115 (soft back ed.) ISSN 03579387 (soft back ed.)
ISBN 9513863123 (URL: http://www.vtt.fi/publications/index.jsp) ISSN 14550873 (URL: http://www.vtt.fi/publications/index.jsp)
Copyright © VTT Technical Research Centre of Finland 2006
JULKAISIJA UTGIVARE PUBLISHER
VTT, Vuorimiehentie 3, PL 1000, 02044 VTT puh. vaihde 020 722 111, faksi 020 722 4374
VTT, Bergsmansvägen 3, PB 1000, 02044 VTT tel. växel 020 722 111, fax 020 722 4374
VTT Technical Research Centre of Finland Vuorimiehentie 3, P.O. Box 1000, FI-02044 VTT, Finland phone internat. +358 20 722 111, fax +358 20 722 4374
Technical editing Anni Kääriäinen Edita Prima Oy, Helsinki 2006
3
Preface Material research is one of VTTs core fields of activity with about 300 person years per year of research work. The main approach to the research is applied, i.e. we approach the development of materials or understanding of the material performance from the needs of existing or new applications.
Since the beginning of 2006 the public material research at VTT has been coordinated by the Strategic Research Steering Group Applied Materials. In order to increase common knowledge and understanding of all the material research carried out at VTT, the Steering Group together with the management of the R&D function decided to organize an internal Symposium on Applied Materials in Espoo, Finland on 8 June 2006. The Symposium attracted more than 30 contributions, about half of which were included in the oral presentations at the Symposium.
The papers included in the proceedings are only sample of the material research. The article by Jari Koskinen included in these proceedings gives a total picture of the ongoing topics of research. The drivers of current research are, e.g., quest for more carefree, safer and more economical products in various industrial and consumer applications, demand for sustainable growth with lower environmental impact, i.e. lighter materials, more durable materials, recyclable materials. In the near future, special emphasis will be put on modification of materials by nanotechnology, surface functionalisation, adaptive and active materials, polymer nanocomposites for printable electronics, and for and beneficiation of natural fibre-based raw materials.
We would like to thank all those who contributed to the success of the Symposium. Particularly, Dr Anne-Christine Ritschkoff, Dr Mika Paajanen and Dr Jari Koskinen deserve credit for compiling the program and reviewing or making other experts to review the numerous contributions. We would also like to thank Ms. Leena Tuiro for practical arrangements in the Symposium and Ms. Monica Fernandez, who together with the recently appointed coordinator of applied materials research, Dr Anne-Christine Ritschkoff, compiled the proceedings.
Espoo, December 2006

4
Matti Kokkala
Vice President, Strategic Research, Technology in the Community
Eva Häkkä-Rönnholm
Vice President, R&D, Materials and Building
5
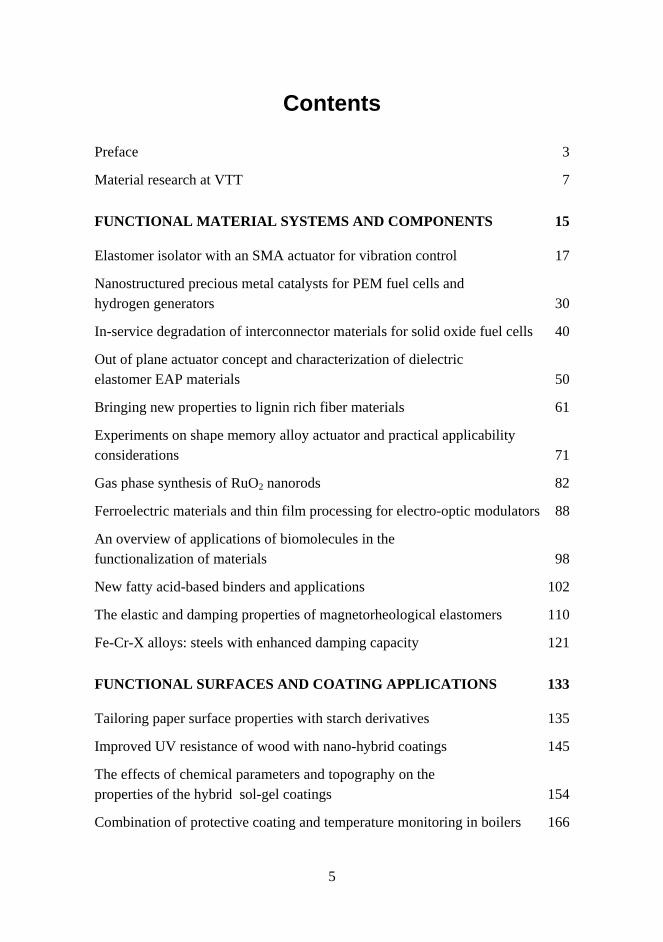
Contents
Preface 3
Material research at VTT 7
FUNCTIONAL MATERIAL SYSTEMS AND COMPONENTS 15
Elastomer isolator with an SMA actuator for vibration control 17
Nanostructured precious metal catalysts for PEM fuel cells and hydrogen generators 30
In-service degradation of interconnector materials for solid oxide fuel cells 40
Out of plane actuator concept and characterization of dielectric elastomer EAP materials 50
Bringing new properties to lignin rich fiber materials 61
Experiments on shape memory alloy actuator and practical applicability considerations 71
Gas phase synthesis of RuO2 nanorods 82
Ferroelectric materials and thin film processing for electro-optic modulators 88
An overview of applications of biomolecules in the functionalization of materials 98
New fatty acid-based binders and applications 102
The elastic and damping properties of magnetorheological elastomers 110
Fe-Cr-X alloys: steels with enhanced damping capacity 121
FUNCTIONAL SURFACES AND COATING APPLICATIONS 133
Tailoring paper surface properties with starch derivatives 135
Improved UV resistance of wood with nano-hybrid coatings 145
The effects of chemical parameters and topography on the properties of the hybrid sol-gel coatings 154
Combination of protective coating and temperature monitoring in boilers 166
6
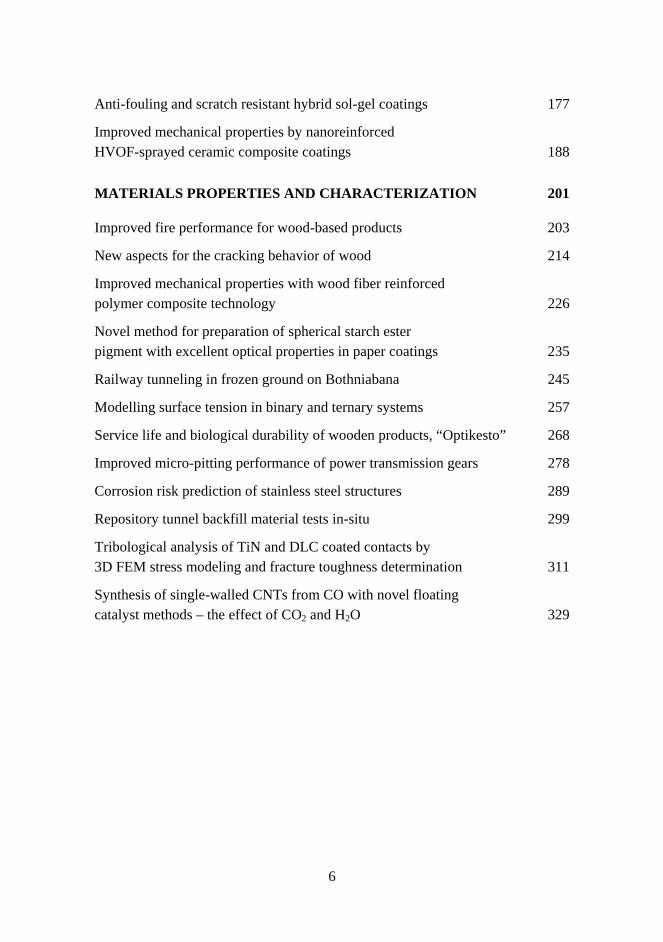
Anti-fouling and scratch resistant hybrid sol-gel coatings 177
Improved mechanical properties by nanoreinforced HVOF-sprayed ceramic composite coatings 188
MATERIALS PROPERTIES AND CHARACTERIZATION 201
Improved fire performance for wood-based products 203
New aspects for the cracking behavior of wood 214
Improved mechanical properties with wood fiber reinforced polymer composite technology 226
Novel method for preparation of spherical starch ester pigment with excellent optical properties in paper coatings 235
Railway tunneling in frozen ground on Bothniabana 245
Modelling surface tension in binary and ternary systems 257
Service life and biological durability of wooden products, “Optikesto” 268
Improved micro-pitting performance of power transmission gears 278
Corrosion risk prediction of stainless steel structures 289
Repository tunnel backfill material tests in-situ 299
Tribological analysis of TiN and DLC coated contacts by 3D FEM stress modeling and fracture toughness determination 311
Synthesis of single-walled CNTs from CO with novel floating catalyst methods – the effect of CO2 and H2O 329
7
Material research at VTT
Jari Koskinen
VTT Technical Research Centre of Finland Metallimiehenkuja 8, Espoo, P.O. Box 1000, FI-02044 VTT
Abstract
Material research has a very strong role in the technical research at VTT. The volume is estimated to be about 300 man years per annum, which is over 10% of the total research activities at VTT. These research activities are mainly applied research carried out in projects involving the major industrial companies in the field, and by networking with the leading research organizations both nationally and internationally.
Introduction
Materials research has been seen as a strategic effort in all industrial countries. It has an enormous role in aiding a countrys economic and technological competitiveness. Material technology is generic and cross sectional in nature and the main innovations are expected when different fields of natural and technical sciences are combined with material expertise. The visions and foresight of material research in Finland has been introduced in two recent publications [1, 2]. This survey is combined with the national survey on Materials Technology in Finland conducted by Tekes the Finnish Funding Agency for Technology and Innovation.
General overview
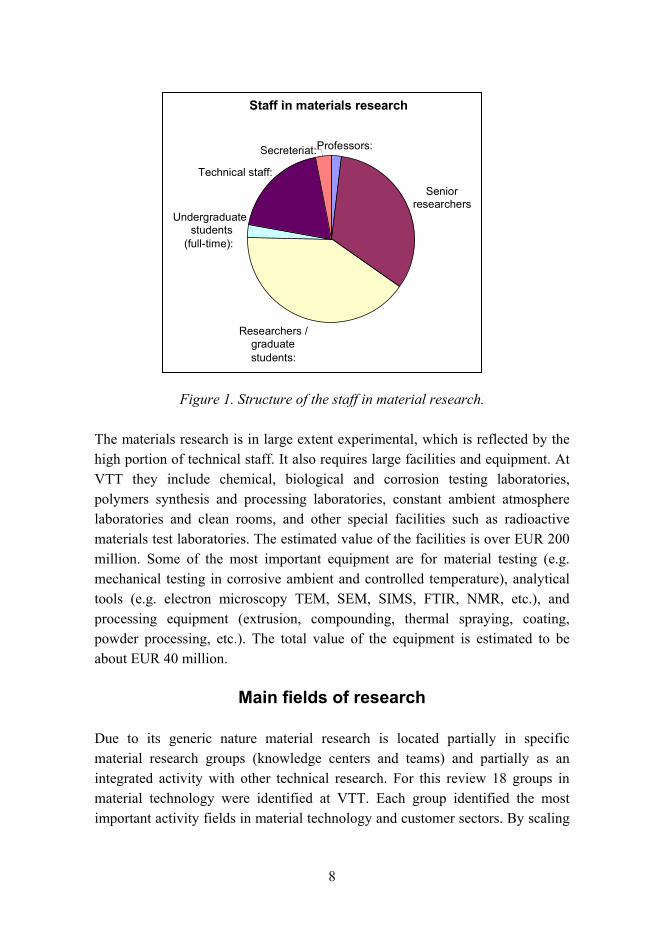
The volume of materials research at VTT totals about 300 man years per annum. Although it is not possible to separate material research from other research activities with absolute certainty, it can be concluded that material research makes up more than 10% of the entire research effort of VTT. The volume of the research in 2005 was about EUR 32 million. The different occupations of the staff are shown in Figure 1.
8
Figure 1. Structure of the staff in material research.
The materials research is in large extent experimental, which is reflected by the high portion of technical staff. It also requires large facilities and equipment. At VTT they include chemical, biological and corrosion testing laboratories, polymers synthesis and processing laboratories, constant ambient atmosphere laboratories and clean rooms, and other special facilities such as radioactive materials test laboratories. The estimated value of the facilities is over EUR 200 million. Some of the most important equipment are for material testing (e.g. mechanical testing in corrosive ambient and controlled temperature), analytical tools (e.g. electron microscopy TEM, SEM, SIMS, FTIR, NMR, etc.), and processing equipment (extrusion, compounding, thermal spraying, coating, powder processing, etc.). The total value of the equipment is estimated to be about EUR 40 million.
Main fields of research
Due to its generic nature material research is located partially in specific material research groups (knowledge centers and teams) and partially as an integrated activity with other technical research. For this review 18 groups in material technology were identified at VTT. Each group identified the most important activity fields in material technology and customer sectors. By scaling
Staff in materials research
Professors:
Senior researchers
Researchers / graduatestudents:
Undergraduate students
(full-time):
Technical staff:
Secreteriat:
9
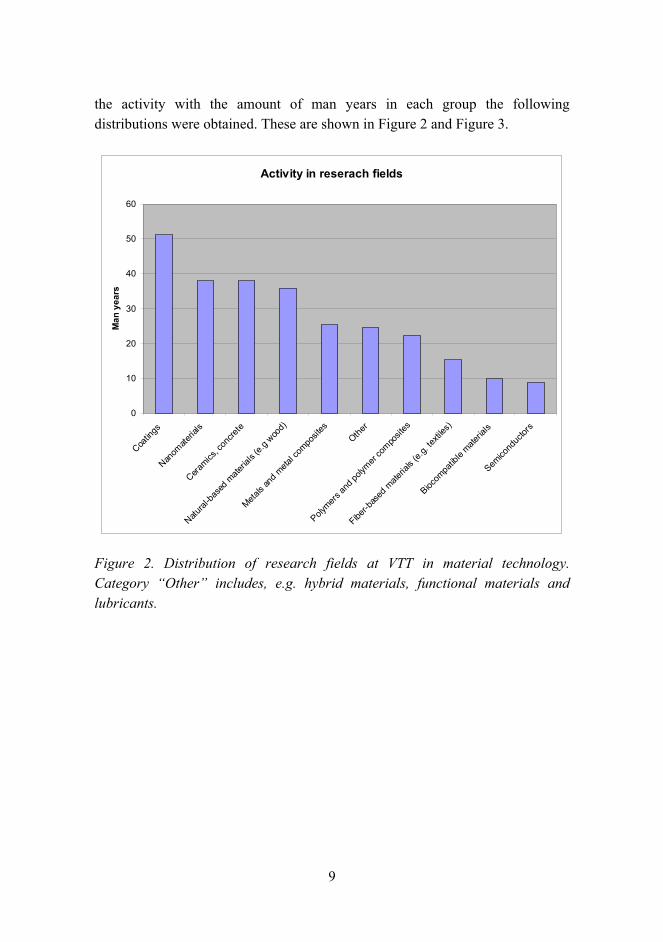
the activity with the amount of man years in each group the following distributions were obtained. These are shown in Figure 2 and Figure 3.
Activity in reserach fields
0
10
20
30
40
50
60
Coatin
gs
Nanom
ateria
ls
Ceramics
, con
crete
Natural
-base
d mate
rials
(e.g w
ood)
Metals
and m
etal c
ompo
sites
Other
Polymers
and p
olymer
compo
sites
Fiber-b
ased
mate
rials
(e.g.
textile
s)
Biocom
patib
le mate
rials
Semico
nduc
tors
Man
yea
rs
Figure 2. Distribution of research fields at VTT in material technology. Category Other includes, e.g. hybrid materials, functional materials and lubricants.
10
Activity in customer sectors
0
10
20
30
40
50
60
70
Forest
and p
aper
Constru
ction
Energy
Enviro
nmen
t
Machin
ery
Metal
Biotech
nology
Electro
nics /
ICT
Healthc
are / w
ell-be
ingOthe
r
Medica
l / ph
armace
utica
l
Am
ount
of m
an y
ears
/a
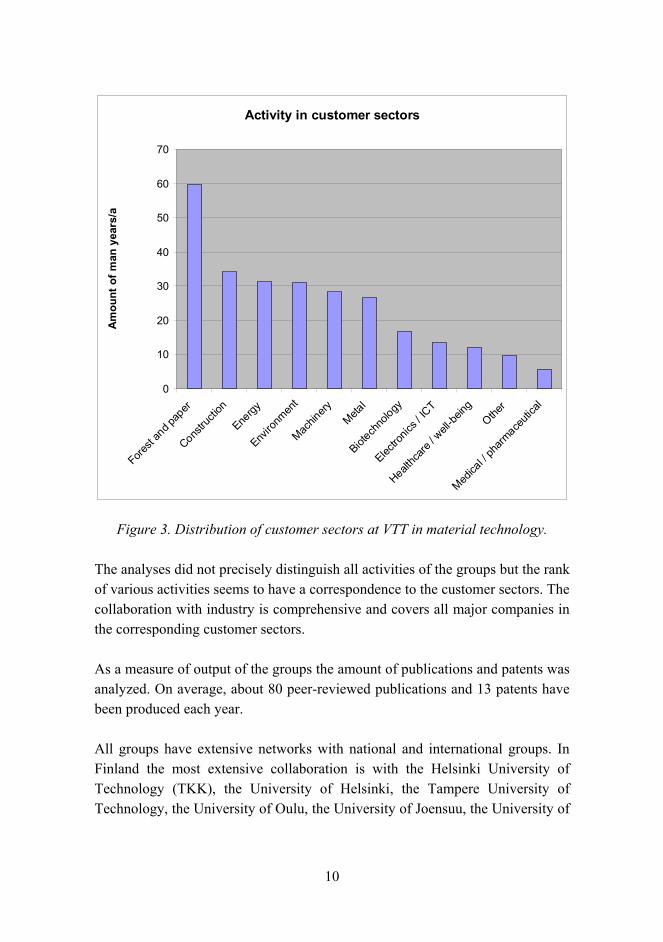
Figure 3. Distribution of customer sectors at VTT in material technology.
The analyses did not precisely distinguish all activities of the groups but the rank of various activities seems to have a correspondence to the customer sectors. The collaboration with industry is comprehensive and covers all major companies in the corresponding customer sectors.
As a measure of output of the groups the amount of publications and patents was analyzed. On average, about 80 peer-reviewed publications and 13 patents have been produced each year.
All groups have extensive networks with national and international groups. In Finland the most extensive collaboration is with the Helsinki University of Technology (TKK), the University of Helsinki, the Tampere University of Technology, the University of Oulu, the University of Joensuu, the University of
11
Jyväskylä, the Lappeenranta University of Technology, Åbo Academi University and KCL. The international networks include almost all established material research groups in Europe and several in the United States, Asia and Australia.
Research topics for the present and in the future
The various research areas and topics extensively cover material technology. In the following section some main topics active at present are listed.
Materials for the energy and process industries:
• materials degradation mechanisms and modeling • fracture mechanics, including hot cell testing • life cycle management of materials and components • materials and components for new generation nuclear technologies.
Building and construction:
• wood-based materials and products for building • concrete and stone materials and products for building • coatings, paints, adhesives • hybrid nanocomposites • advanced composites.
Materials for the electronics industry:
• electrically functional plastic materials • new materials for high voltage applications • conductive polymers • batteries and fuel cells • energy storage.
Metal-ceramic materials:
• thermal spraying • ceramic-metallic and ceramic-ceramic (powders for bulk and coatings) • ceramic-metallic composites

12
• thermal coatings • surface treatments and welding by laser technology.
Functional materials and coatings:
• functional materials in printing • binders for coatings, adhesives and composites • adjustment of paper or board surface properties with functional materials • effects of functional materials in paper structure and properties • functional nano-structured coatings and materials • modification of natural polymers and wood based materials • stimuli responsive polymers concepts.
The following list presents some visions and future topics for material research:
• higher and more demanding service requirements in novel energy production concepts
• development of new material solutions for energy technology (especially for zero emission technologies)
• development of materials with improved lifetime for harsh conditions by applying nano-structured materials
• weldability of special steel, such as ultra high tensile strength steels
• dissimilar material joints
• functional materials for new applications in construction
• integration of bioactive components in paper and board products
• controlled release-based solutions in coatings (active agents against decay etc.)
• composites from fiber and waste-based materials (novel bio-based products)
• environmentally friendly surface treatment processes
• self-repair and healing of coatings and materials
13
• materials for human-machine interface (implants, electrodes for sensors etc.)
• natural fiber reinforced materials and structures
• new applications for renewable (natural based polymers and composites) • heterogeneous integration on silicon (stacking of dissimilar materials
and layers, 3D microelectronic integration, dense arrays of vias and bumps)
• nanoelectronic coatings in MEMS
• nanoelectronics, nanophotonics, nanolithography, graphene electronics, spintronics, magnetophotonics
• quantum computation and quantum information
• bioinspired materials
• combinations of biomolecules and nanostructured materials.
Conclusions
Material technology has a pronounced role in research at VTT. Overall a clear correspondence of the material research to the applications and industrial needs is obvious. The research groups are networking extensively with the leading groups and customers nationally and internationally. These activities and the future trends closely parallel the visions documented in various roadmap papers [1, 2].
Acknowledgements
The contribution to this survey of the following VTT key persons in material technology is warmly acknowledged: Liisa Heikinheimo, Marke Kallio, Mika Paajanen, Erja Turunen, Heikki Kukko, Aino Helle, Markus Linder, Soili Peltonen, Tuulamari Helaja, Janne Poranen, Pia Qvintus-Leino, Markku Ylilammi, Hannu Kattelus, Arto Maaninen, Janne Aikio, Markku Jenu, Ari Auvinen, Salme Koskimies, Pekka Pohjanne, Simo-Pekka Hannula, Esko Kauppinen, Alpo Ranta-Maunus, Anne-Christine Ritschkoff. The organizing of the data collection by Laura Juvonen Spinverse Consulting is acknowledged.

14
References
[1] Naumanen, M. Materiaalitekniikoiden kehityskohteita. Teknologiateollisuus ry:n julkaisuja. Tampere 2005. (In Finnish).
[2] FinnSight 2015. Academy of Finland and Tekes publication, 2006. http://www.tekes.fi/julkaisut/FinnSight_2015_laaja.pdf.

15
Functional material systems and components

16
17
Elastomer isolator with an SMA actuator for vibration control
Jaakko Heinonen, Tuomo Kärnä, Ismo Vessonen, Paul Klinge & Tomi Lindroos
VTT Technical Research Centre of Finland Kemistintie 3, Espoo, P.O. Box 1000, FI-02044 VTT
Abstract
A semi-active device was developed to mitigate structural vibrations. The idea was to change the boundary condition of the device to adjust its stiffness. The selected construction was an axial spring made of elastomer material. When a cylindrical block of elastomer is compressed, it expands in the direction perpendicular to the load. Restricting the expansion, the axial stiffness in the loading direction becomes higher. The controllable stiffness region when the device is acting in stiff and soft modes was determined by numerical analysis. The stiffness ratio depends on the geometric shape of the spring and the ratio between the confined area in the stiff mode and the area where the material can expand freely in the soft mode. With a suitable design of the spring, the stiffness ratio can be over 10. A circular support ring made of shape memory alloy (SMA) was used as an actuator, which was attached to the outside of the cylindrical elastomer spring. The change of boundary condition was controlled by the gap between the elastomer spring and the constraint. The stiffness control was applied by controlling the temperature of SMA actuator. Experimental tests were carried out to verify the feasibility of the device. Dynamic loading tests indicated promising results.
Introduction
A semi-active device supporting a structure or machine at its base or as a part in a structural joint can be utilized to isolate vibrations. In a semi-active isolator, the stiffness and/or damping can be controlled during operation. Changing the stiffness of the support device can be exploited by moving the eigenfrequency of the system to bypass the resonance. Reliable control of the support device requires monitoring of a critical point of the structure and knowledge about the
18
frequency response of the system. This kind of adaptive isolator can change operation conditions according to dominant loading thus resulting in improved vibration isolation capability compared to passive systems. Undesired vibrations can be reduced in different loading conditions, i.e. a large frequency range is covered.
Previously Heinonen et al. [1] presented a semi-active vibration isolator based on a change of the boundary condition. The device was a circular metal frame (ring) with a horizontal SMA spring behaving as an actuator. While the frame was pushed vertically against the base it behaved as a spring. During the compression, the ring expanded horizontally. By restricting the deformation in the horizontal direction the frame was made stiffer. The controllable stiffness ratio of the device from soft to stiff mode was determined analytically to go up to 6.4 with a completely stiff constraint. This influence was caused purely by changing the boundary condition. In experimental studies the maximum stiffness ratio was 5.0.
The scope of this work was to develop further the idea of changing the boundary condition. To cover a larger field of application, an elastomer-based device was developed. Many different innovations were simulated and some of them were tested experimentally. Owing to the complicated behavior of SMA, a straightforward solution was based on a cylindrical shape of elastomer material. The change of boundary condition was based on restricting the horizontal expansion while the elastomer spring was loaded in the axial direction. A circular SMA support ring was used as an actuator.
This work was carried out as part of VTTs technology theme, Intelligent Products and Systems, under the topic Embedded Structural Intelligence.
Behavior of shape memory alloy
The mechanical behavior of SMA material is complicated. Coupling of the stress, strain and temperature depends on the phase transformation between the martensitic and austenitic phase. The phase transformation depends mainly on the temperature but also on the stress, and the transformation is hysteretic [2, 3].
19
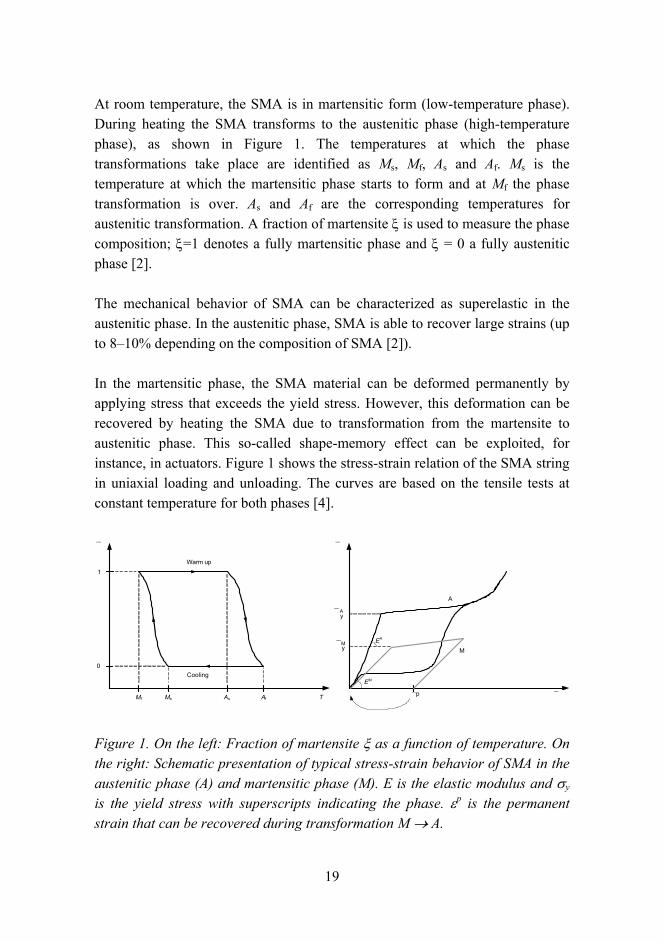
At room temperature, the SMA is in martensitic form (low-temperature phase). During heating the SMA transforms to the austenitic phase (high-temperature phase), as shown in Figure 1. The temperatures at which the phase transformations take place are identified as Ms, Mf, As and Af. Ms is the temperature at which the martensitic phase starts to form and at Mf the phase transformation is over. As and Af are the corresponding temperatures for austenitic transformation. A fraction of martensite ξ is used to measure the phase composition; ξ=1 denotes a fully martensitic phase and ξ = 0 a fully austenitic phase [2].
The mechanical behavior of SMA can be characterized as superelastic in the austenitic phase. In the austenitic phase, SMA is able to recover large strains (up to 810% depending on the composition of SMA [2]).
In the martensitic phase, the SMA material can be deformed permanently by applying stress that exceeds the yield stress. However, this deformation can be recovered by heating the SMA due to transformation from the martensite to austenitic phase. This so-called shape-memory effect can be exploited, for instance, in actuators. Figure 1 shows the stress-strain relation of the SMA string in uniaxial loading and unloading. The curves are based on the tensile tests at constant temperature for both phases [4].
⎯p
⎯
⎯
A
M
⎯ yA
⎯yM EA
EM
Mf Ms As Af
⎯
1
0
Warm up
Cooling
T
Figure 1. On the left: Fraction of martensite ξ as a function of temperature. On the right: Schematic presentation of typical stress-strain behavior of SMA in the austenitic phase (A) and martensitic phase (M). E is the elastic modulus and σy
is the yield stress with superscripts indicating the phase. εp is the permanent strain that can be recovered during transformation M → A.
20
Several constitutive models have been published for SMA [4, 5, 6]. Although SMA is a material that needs a complicated model to be implemented in the structural analysis framework, a simplified model can be applied with some limitations to design devices. The stress-strain relation for both phases can be divided into linear and non-linear regions by using an elastic-plastic framework. The main parameters, shown in Figure 1, in such a model are the elastic modulus and yield stress σy with superscripts indicating the phase. In addition, a hardening parameter is needed to describe the stress-strain relation after the yield stress is achieved. Typical behavior of NiTi-based SMA is that both the elastic modulus and yield stress are significantly higher in the austenitic phase than in the martensitic phase.
Influence of boundary condition
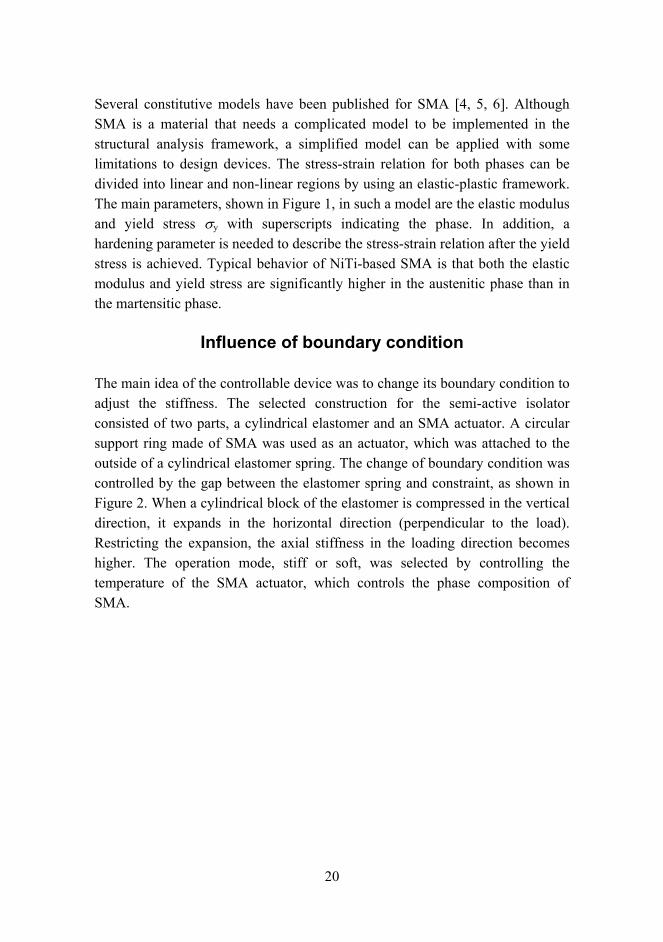
The main idea of the controllable device was to change its boundary condition to adjust the stiffness. The selected construction for the semi-active isolator consisted of two parts, a cylindrical elastomer and an SMA actuator. A circular support ring made of SMA was used as an actuator, which was attached to the outside of a cylindrical elastomer spring. The change of boundary condition was controlled by the gap between the elastomer spring and constraint, as shown in Figure 2. When a cylindrical block of the elastomer is compressed in the vertical direction, it expands in the horizontal direction (perpendicular to the load). Restricting the expansion, the axial stiffness in the loading direction becomes higher. The operation mode, stiff or soft, was selected by controlling the temperature of the SMA actuator, which controls the phase composition of SMA.
21
Initial state Preload to extend SMA
Operation in soft mode
Operation in stiff modeHeating of
SMA
F·sin( t) F·sin( t)Gap
Elastomer
SMASteel platen
D t
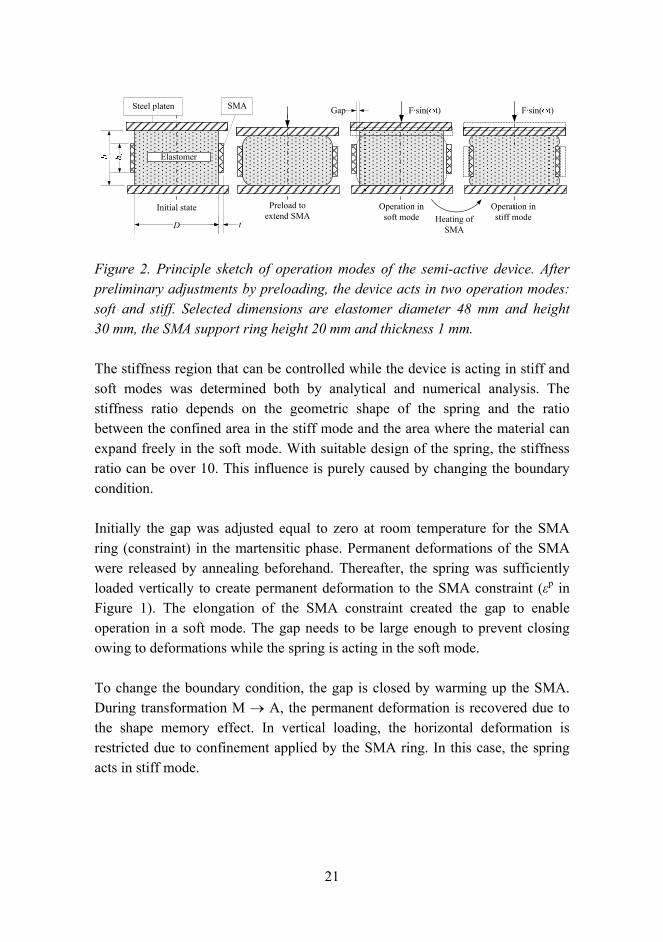
Figure 2. Principle sketch of operation modes of the semi-active device. After preliminary adjustments by preloading, the device acts in two operation modes: soft and stiff. Selected dimensions are elastomer diameter 48 mm and height 30 mm, the SMA support ring height 20 mm and thickness 1 mm.
The stiffness region that can be controlled while the device is acting in stiff and soft modes was determined both by analytical and numerical analysis. The stiffness ratio depends on the geometric shape of the spring and the ratio between the confined area in the stiff mode and the area where the material can expand freely in the soft mode. With suitable design of the spring, the stiffness ratio can be over 10. This influence is purely caused by changing the boundary condition.
Initially the gap was adjusted equal to zero at room temperature for the SMA ring (constraint) in the martensitic phase. Permanent deformations of the SMA were released by annealing beforehand. Thereafter, the spring was sufficiently loaded vertically to create permanent deformation to the SMA constraint (εp in Figure 1). The elongation of the SMA constraint created the gap to enable operation in a soft mode. The gap needs to be large enough to prevent closing owing to deformations while the spring is acting in the soft mode.
To change the boundary condition, the gap is closed by warming up the SMA. During transformation M → A, the permanent deformation is recovered due to the shape memory effect. In vertical loading, the horizontal deformation is restricted due to confinement applied by the SMA ring. In this case, the spring acts in stiff mode.
22
Transformation A → M is activated by cooling the SMA below Mf temperature. To activate the operation in the soft mode again, external work is needed to load the SMA enough to exceed the yield stress, which results in permanent deformation to create the gap.
Analysis
A deformation of an elastomer block bonded on the rigid plates during compression can be divided into two parts: uniaxial compression resulting in cylindrical expansion and shearing due to bonding on the rigid plates. Because both ends are bonded, a shear stress is created to keep the elastomer end in a fixed position. Combination of these deformation modes results in bulging. Two important quantities for the elastomer spring are the shape factor and the stiffness ratio. The shape factor S defining the ratio between one loaded area AL and a free area to bulge AB is defined as [7]
hD
DhD
AAS
B
L
44/2
===ππ
(1)
in which D is the diameter and h is the height of the elastomer spring, as shown in Figure 3. The maximum controllable stiffness region while the device is acting in soft (1) and stiff (2) operation modes is defined by a stiffness ratio κ as
(2)
(1)
kk
κ =
(2)
in which the superscript in parenthesis describes the mode.
Numerical studies were made by Finite Element Method (FEM) using ABAQUS/Standard software. An axisymmetric model with symmetric boundary conditions was used to decrease the number of DOFs, as shown in Figure 4. The elastomer and steel plate regions were completely connected together due to vulcanization. The interaction between elastomer and SMA constraint was modeled by a frictionless surface-to-surface contact algorithm. Initially, these surfaces are in contact but for the soft mode operation the contact algorithm
23
must allow the surfaces to separate. A hyperelastic material model was utilized for the elastomer and an elastic-plastic material model with strain-hardening was applied to the shape memory alloy. The yield stress and elastic modulus dependency on the fraction of martensite was described by a user-defined field variable, which was implemented by a UFIELD subroutine in ABAQUS/Standard. The shape memory effect, i.e. actuator mode, was modeled by applying negative thermal expansion. Even though the model is a rough approximation of experimentally observed behavior of SMA, it was accurate enough for predictions of different operation modes in the semi-active isolator. The analysis methods are described in more detail in Heinonen et al. [8].
To verify the feasibility of the stiffness control, dynamic effects were not taken into account and the simulations were based on quasi-static analysis. The numerical simulation was divided into several steps:
1. Compressive loading from the initial state in the martensitic phase (M) to activate the soft mode by extending the constraint to create a gap.
2. Displacement-controlled loading loop in the soft mode (M).
3. Heating the SMA to activate the stiff mode due to phase change from (M) to (A). The temperature T exceeds Af.
4. Displacement-controlled loading loop in the stiff mode (A).
5. Cooling the SMA to activate phase change from (A) to (M). The temperature T drops below Mf.
6. Compressive loading again in the martensitic phase (M) to activate the soft mode by extending the constraint to create a gap.
The main objective of the numerical simulations was to design the final construction for a demonstration test. While the target is a sufficiently high stiffness ratio, the shape factor (D/4h) of the elastomer should be large (in the soft mode, i.e. without SMA constraint). In addition, the ratio between the SMA constraint height hs and elastomer height h should be large.
Owing to one-way shape memory, external work is needed to return from stiff to soft mode. The amount of work depends on the stiffness of the SMA constraint.
24
To avoid large compression, the elastic modulus of the elastomer part needs to be in correct relation to the SMA constraint.
Step-1 mid
Step-3 end Step-4 mid
Step-1 end
Steel platen
ElastomerSMA
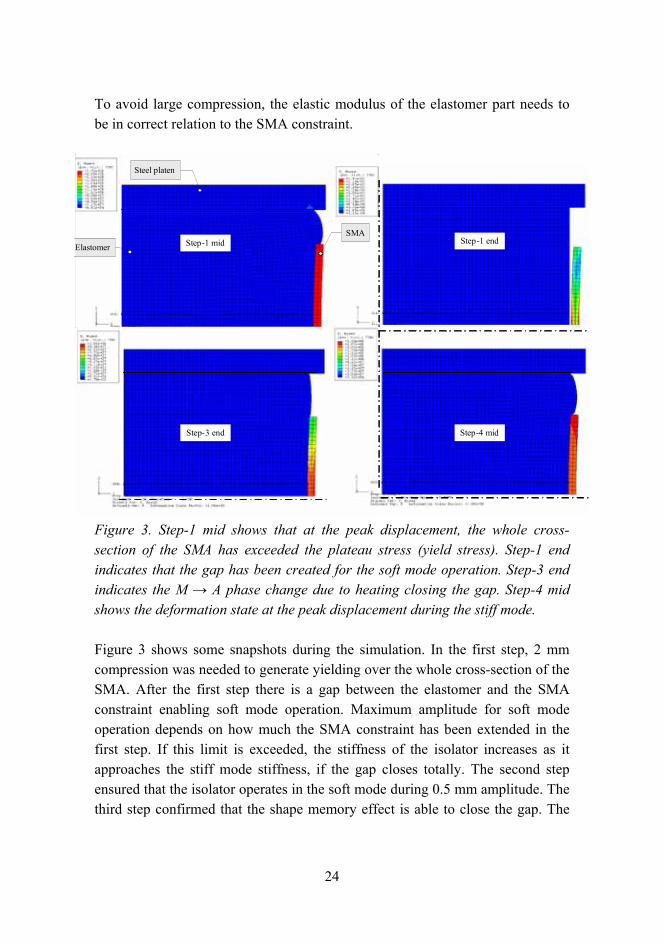
Figure 3. Step-1 mid shows that at the peak displacement, the whole cross-section of the SMA has exceeded the plateau stress (yield stress). Step-1 end indicates that the gap has been created for the soft mode operation. Step-3 end indicates the M → A phase change due to heating closing the gap. Step-4 mid shows the deformation state at the peak displacement during the stiff mode.
Figure 3 shows some snapshots during the simulation. In the first step, 2 mm compression was needed to generate yielding over the whole cross-section of the SMA. After the first step there is a gap between the elastomer and the SMA constraint enabling soft mode operation. Maximum amplitude for soft mode operation depends on how much the SMA constraint has been extended in the first step. If this limit is exceeded, the stiffness of the isolator increases as it approaches the stiff mode stiffness, if the gap closes totally. The second step ensured that the isolator operates in the soft mode during 0.5 mm amplitude. The third step confirmed that the shape memory effect is able to close the gap. The
25
fourth step indicated that the stress level is sufficiently low in the SMA to ensure constraint effect during moderate amplitudes. The fifth and sixth steps were analyzed to ensure that the device is able to return from the stiff to soft mode. It is noticeable that the shape of the SMA support ring after the activation to soft mode is curvilinear, not straight as it was initially. In addition, the external work corresponding to 2 mm displacement was needed to activate the soft mode.
By determining the stiffness from the analysis steps, the stiffness ratio of 8.8 is found, which is equal to the analytical solution.
Experiments
Test set-up
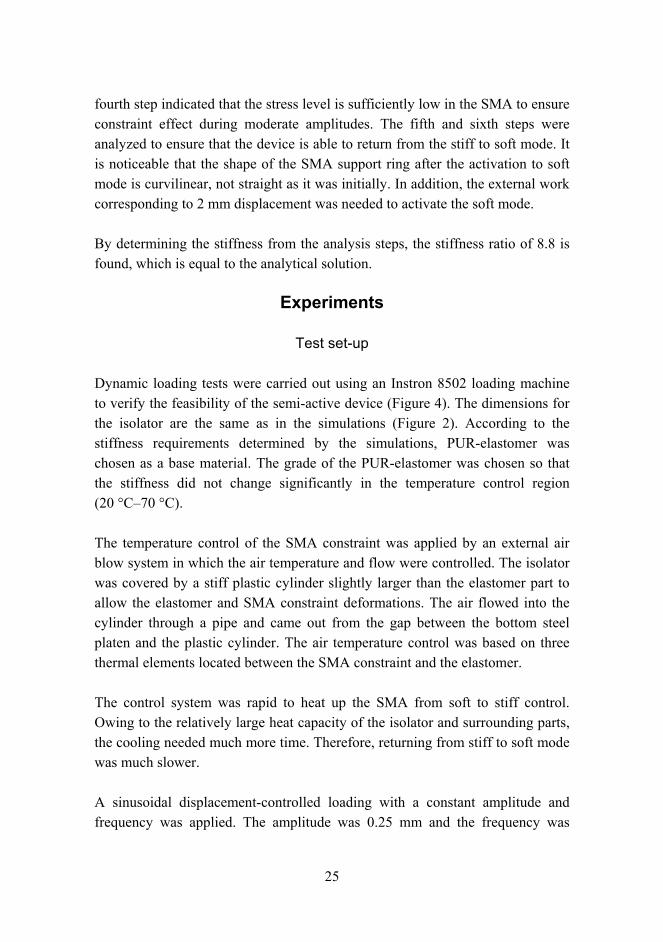
Dynamic loading tests were carried out using an Instron 8502 loading machine to verify the feasibility of the semi-active device (Figure 4). The dimensions for the isolator are the same as in the simulations (Figure 2). According to the stiffness requirements determined by the simulations, PUR-elastomer was chosen as a base material. The grade of the PUR-elastomer was chosen so that the stiffness did not change significantly in the temperature control region (20 °C70 °C).
The temperature control of the SMA constraint was applied by an external air blow system in which the air temperature and flow were controlled. The isolator was covered by a stiff plastic cylinder slightly larger than the elastomer part to allow the elastomer and SMA constraint deformations. The air flowed into the cylinder through a pipe and came out from the gap between the bottom steel platen and the plastic cylinder. The air temperature control was based on three thermal elements located between the SMA constraint and the elastomer.
The control system was rapid to heat up the SMA from soft to stiff control. Owing to the relatively large heat capacity of the isolator and surrounding parts, the cooling needed much more time. Therefore, returning from stiff to soft mode was much slower.
A sinusoidal displacement-controlled loading with a constant amplitude and frequency was applied. The amplitude was 0.25 mm and the frequency was
26
0.5 or 5 Hz in each test. At first, the gap was created by a preload with large amplitude (2 mm) to activate the soft mode. Then in every test, a preload corresponding to 1 mm displacement was applied to ensure that the isolator was under compressive loading in each loading cycle. The temperature of the SMA constraint was controlled to activate first the soft mode and then the stiff mode.
Figure 4. Test set-up for loading tests.
Results
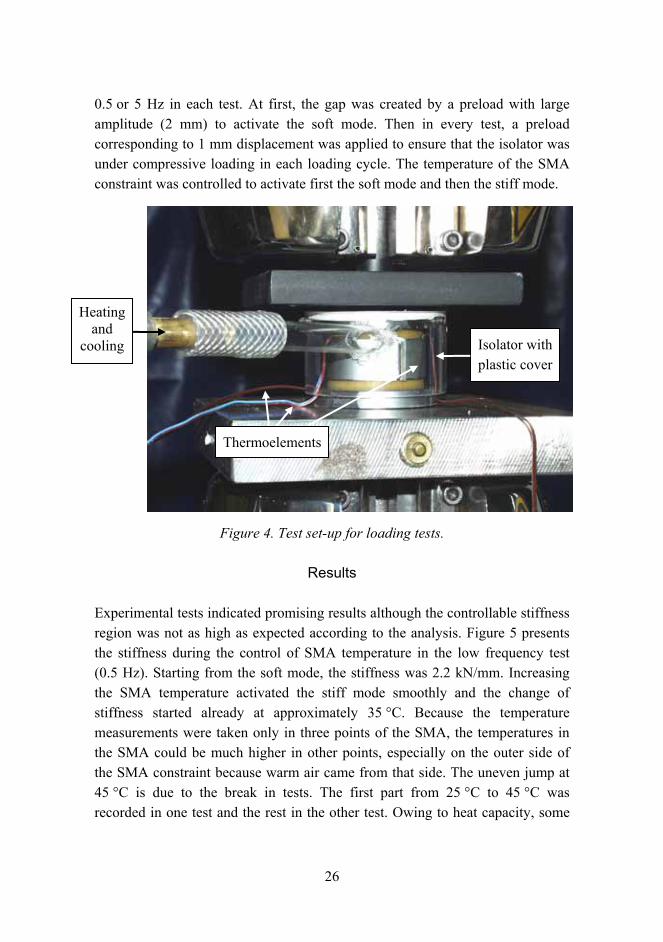
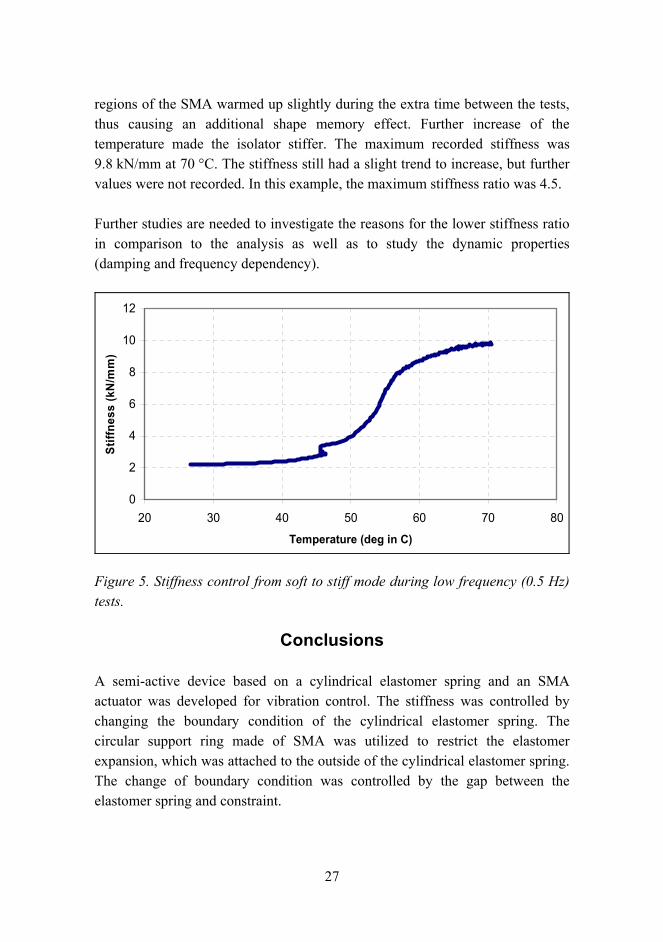
Experimental tests indicated promising results although the controllable stiffness region was not as high as expected according to the analysis. Figure 5 presents the stiffness during the control of SMA temperature in the low frequency test (0.5 Hz). Starting from the soft mode, the stiffness was 2.2 kN/mm. Increasing the SMA temperature activated the stiff mode smoothly and the change of stiffness started already at approximately 35 °C. Because the temperature measurements were taken only in three points of the SMA, the temperatures in the SMA could be much higher in other points, especially on the outer side of the SMA constraint because warm air came from that side. The uneven jump at 45 °C is due to the break in tests. The first part from 25 °C to 45 °C was recorded in one test and the rest in the other test. Owing to heat capacity, some
Heating and
cooling Isolator with plastic cover
Thermoelements
27
regions of the SMA warmed up slightly during the extra time between the tests, thus causing an additional shape memory effect. Further increase of the temperature made the isolator stiffer. The maximum recorded stiffness was 9.8 kN/mm at 70 °C. The stiffness still had a slight trend to increase, but further values were not recorded. In this example, the maximum stiffness ratio was 4.5.
Further studies are needed to investigate the reasons for the lower stiffness ratio in comparison to the analysis as well as to study the dynamic properties (damping and frequency dependency).
0
2
4
6
8
10
12
20 30 40 50 60 70 80
Temperature (deg in C)
Stiff
ness
(kN
/mm
)
Figure 5. Stiffness control from soft to stiff mode during low frequency (0.5 Hz) tests.
Conclusions
A semi-active device based on a cylindrical elastomer spring and an SMA actuator was developed for vibration control. The stiffness was controlled by changing the boundary condition of the cylindrical elastomer spring. The circular support ring made of SMA was utilized to restrict the elastomer expansion, which was attached to the outside of the cylindrical elastomer spring. The change of boundary condition was controlled by the gap between the elastomer spring and constraint.
28
The stiffness region that can be controlled while the device is acting in stiff and soft modes was determined analytically. For the cylindrical shape of the elastomer, with a diameter of 48 mm and a height of 30 mm, and the SMA support ring, with a height of 20 mm and a thickness of 1 mm, a stiffness ratio of 8.8 can be achieved. Both the shape factor (D/4h) for the elastomer part and the ratio between the SMA constraint height and elastomer height should be large enough to result in a high stiffness ratio.
Numerical FEM analysis was used to verify the stiffness ratio and to validate the geometric design and the stiffness requirements for the elastomer and SMA constraint. PUR-elastomer was chosen for the experimental studies.
Experimental tests to verify the feasibility of the device indicated promising results of the controllable stiffness region. The control of boundary condition can be utilized to change the stiffness, although the stiffness ratio was not as high as expected according to the analysis. The operation mode, stiff or soft, was selected by controlling the temperature of the SMA actuator, which controls the phase composition of the SMA. Further studies are planned to improve the controllable stiffness region in the experiments.
Acknowledgements
Mr. Erkki Järvinen and Mr. Juha Juntunen are acknowledged for all their help in the tests and data analysis.
Reference list
1. Heinonen, J., Vessonen, I., Klinge, P. & Järvinen, E. Controlling Stiffness of a Frame Spring by Changing the Boundary Condition. II Eccomas Thematic Conference on Smart Structures and Materials, C.A. Mota Soares et al. (Eds.), Lisbon, Portugal, July 1821, 2005.
2. Srinisavan, A. V. & McFarland D. M. Smart Structures, Analysis and Design. 2001, Cambridge University Press. 228 p. ISBN 0-521-65026-7.
29
3. Waram, T. Actuator Design Using Shape Memory Alloys, 2nd ed. 1993, 106 p. ISBN 0-9699428-0-X.
4. Auricchio, F. Shape Memory Alloys: Applications, Micromechanics, Macromodelling and Numerical Simulations. Doctoral thesis, 1995, University of California at Berkeley. 163 p.
5. Sittner, P., Stalmans, R. & Tokuda, M. An algorithm for prediction of the hysteretic responses of shape memory alloys. Smart Materials and Structures, 9 (2000), pp. 452465.
6. Kosel, F. & Videnic, T. Generalized Plasticity and Uniaxial Constrained Recovery in Shape Meory Alloys. II Eccomas Thematic Conference on Smart Structures and Materials, C.A. Mota Soares et al. (Eds.), Lisbon, Portugal, July 1821, 2005.
7. Engineering With Rubber: How to Design Rubber Components. Alan N. Gent, Alan N. Gent (Eds.). Hanser Gardner Publications, 2nd edition, 2001. ISBN 1569902992.
8. Heinonen, J., Kärnä, T., Vessonen, I., Klinge, P. & Lindroos T. Semi-active Vibration Isolator Based on Elastomer Material Controlled by an SMA actuator, Submitted to The Eighth International Conference on Computational Structures Technology (CST 2006). Las Palmas de Gran Canaria, Spain, 1215 September 2006.
30
Nanostructured precious metal catalysts for PEM fuel cells and hydrogen generators
Pertti Kauranen1, Eini Puhakka2, Mikael Bergelin3, Jari Keskinen1, Unto Tapper2, Jan-Erik Eriksson3, Matti Valkiainen2, Terttu Peltonen2, Rolf
Rosenberg2, Matti Reinikainen2 & Robert Roozeman2
1VTT Technical Research Centre of Finland Sinitaival 6, Tampere, P.O. Box 1300, FI-33101 Tampere
2VTT Technical Reserach Centre of Finland Espoo, P.O. Box 1000, FI-02044 VTT
3Åbo Akademi University, Process Chemistry Centre Piispankatu 8, FI-20500 Turku
Abstract
Fuel cells and hydrogen generators are important electrochemical energy conversion devices for future energy technology. Fuel cells convert pure hydrogen or other hydrogen rich fuel into DC electricity. In a hydrogen generator, the reaction is reversed and water is electrochemically split into hydrogen and oxygen. During the last decade, polymer electrolyte membrane (PEM) based components have played a key role in both fuel cell and hydrogen generator development. The major conversion loss in a PEM fuel cell takes place on the oxygen reduction cathode and in a PEM hydrogen generator on the oxygen evolution anode. Molecular modeling has been combined with experimental work in order to optimize nanostructured catalysts for both types of electrodes.
Introduction
Hydrogen energy economy is being considered as the ultimate clean CO2 free energy system for the future because the combustion product of hydrogen is pure water [1]. However, hydrogen fuel is not available in nature and it has to be produced from hydrogen rich raw materials, e.g. natural gas or water. This means that hydrogen is only an energy carrier which can be transported and stored like electricity.
31
Electrochemical energy conversion will play a key role in the hydrogen economy for the efficiency of the devices is not limited by the Carnot efficiency limiting thermal devices. Polymer electrolyte membrane (PEM) based fuel cells and hydrogen generators are considered the most promising candidates for hydrogen production from water and conversion back to electricity. PEM fuel cells are being developed for portable power sources, distibuted power generation and automotive power. The main R&D issues are to increase the operational life and to reduce the cost of the components and systems.
Platinum or platinum alloy catalysts are used for PEM fuel cells [2, 3]. A major development goal for cost reduction is to reduce the Pt loading, especially on the oxygen reduction cathode where the major energy conversion loss takes place. This is achieved by using carbon supported Pt nanoparticles, by Pt alloying and by optimizing the composition and structure of the catalyst layer. In order to improve the durability of the so called membrane electrode assemblies (MEA) consisting of the electrolyte membrane and catalyst layers on both surfaces, it is essential to prevent the growth of the Pt nanoparticles and to minimize the concentration of corrosive reaction intermediates of the oxygen reduction reaction (ORR).
In PEM hydrogen generators, the major conversion loss takes place at the oxygen evolution anode. As the reaction potential for oxygen evolution is much higher than for oxygen reduction, different catalyst materials and electrode structures have to be used. Noble metal oxides like IrO2, RuO2 or mixed oxides are typically used for the oxygen evolution reaction (OER) in PEM hydrogen generators [4, 5].
In order to optimize catalyst compositions and structures for PEM fuel cells and hydrogen generators, molecular modeling has been combined with a synthesis of Pt-alloy and noble metal oxide catalysts as well as electrochemical and surface analytical characterization methods.
In our modeling approach, crystal structures, charge densities and the ORR mechanism was calculated for pure Pt as well as binary and tertiary Pt alloys using the CASTEP code [6]. Pt and Pt alloy catalysts were synthesized by the reduction of precursor salts on a carbon support followed by heat treatment at different temperatures. IrO2 and mixed oxides were prepared by the heat
32
treatment of hydroxides and chemical methods. The catalysts were characterized by XRD, TEM, EDS, cyclic voltammetry and rotating disc electrodes (RDE).
Finally, a spray coating technique for MEA preparation has been developed and the catalysts are being tested in a laboratory scale fuel cell single cell.
Modeling
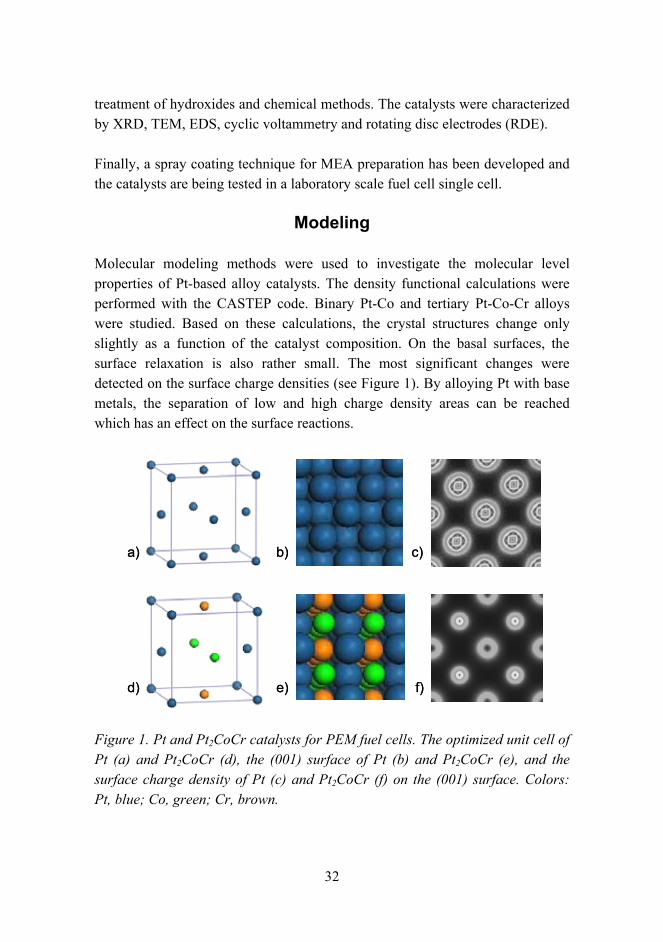
Molecular modeling methods were used to investigate the molecular level properties of Pt-based alloy catalysts. The density functional calculations were performed with the CASTEP code. Binary Pt-Co and tertiary Pt-Co-Cr alloys were studied. Based on these calculations, the crystal structures change only slightly as a function of the catalyst composition. On the basal surfaces, the surface relaxation is also rather small. The most significant changes were detected on the surface charge densities (see Figure 1). By alloying Pt with base metals, the separation of low and high charge density areas can be reached which has an effect on the surface reactions.
a) b) c)
d) e) f)
a) b) c)
d) e) f)
Figure 1. Pt and Pt2CoCr catalysts for PEM fuel cells. The optimized unit cell of Pt (a) and Pt2CoCr (d), the (001) surface of Pt (b) and Pt2CoCr (e), and the surface charge density of Pt (c) and Pt2CoCr (f) on the (001) surface. Colors: Pt, blue; Co, green; Cr, brown.
33
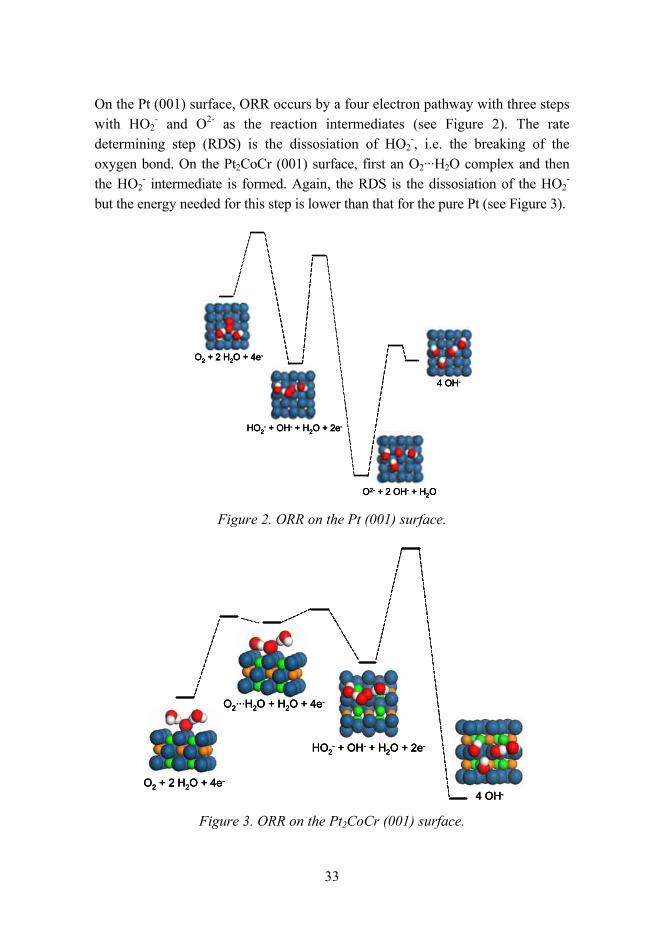
On the Pt (001) surface, ORR occurs by a four electron pathway with three steps with HO2
- and O2- as the reaction intermediates (see Figure 2). The rate determining step (RDS) is the dissosiation of HO2
-, i.e. the breaking of the oxygen bond. On the Pt2CoCr (001) surface, first an O2···H2O complex and then the HO2
- intermediate is formed. Again, the RDS is the dissosiation of the HO2-
but the energy needed for this step is lower than that for the pure Pt (see Figure 3).
O2 + 2 H2O + 4e-
HO2- + OH- + H2O + 2e-
O2- + 2 OH- + H2O
4 OH-
O2 + 2 H2O + 4e-O2 + 2 H2O + 4e-
HO2- + OH- + H2O + 2e-HO2- + OH- + H2O + 2e-
O2- + 2 OH- + H2OO2- + 2 OH- + H2O
4 OH-4 OH-
Figure 2. ORR on the Pt (001) surface.
O2 + 2 H2O + 4e-
4 OH-
O2···H2O + H2O + 4e-
HO2- + OH- + H2O + 2e-
O2 + 2 H2O + 4e-O2 + 2 H2O + 4e-
4 OH-4 OH-
O2···H2O + H2O + 4e-O2···H2O + H2O + 4e-
HO2- + OH- + H2O + 2e-HO2- + OH- + H2O + 2e-
Figure 3. ORR on the Pt2CoCr (001) surface.
34
Based on these calculations the Pt2CoCr catalyst should be more active towards ORR than pure Pt. Moreover, the faster dissociation of the corrosive HO2
- and lack of the O2- intermediate on the alloy catalyst could improve the durability of the Pt2CoCr based MEAs.
In a similar way, the crystal structures and the OER mechanism is being calculated for IrO2, RuO2 and Ir-Ru-mixed oxides.
Preparation and heat treatment of the catalysts
The Pt and Pt alloy catalysts were prepared by reduction of PtCl2, CoCl2 and Cr(NO3)3·9H2O salts. The salts were dissolved in tetrahydrofurane (THF) into which Vulcan XC72 carbon support was added. The metal content in the catalyst materials was 20 wt.-%.
The catalysts were heat treated under Ar atmosphere containing 4% H2 between room temperature and 1100 °C. Heat treatment should improve the metal alloying of the catalysts. On the other hand, the heat treatment can induce particle growth and thus decrease the catalyst activity.
IrO2 and mixed oxide OER catalysts were prepared by heat treatment of iridium hydroxide and by chemical methods using H2IrCl6·4H2O and H2RuCl6·4H2O. These catalysts were heat treated at various temperatures as well.
Characterization of the catalysts
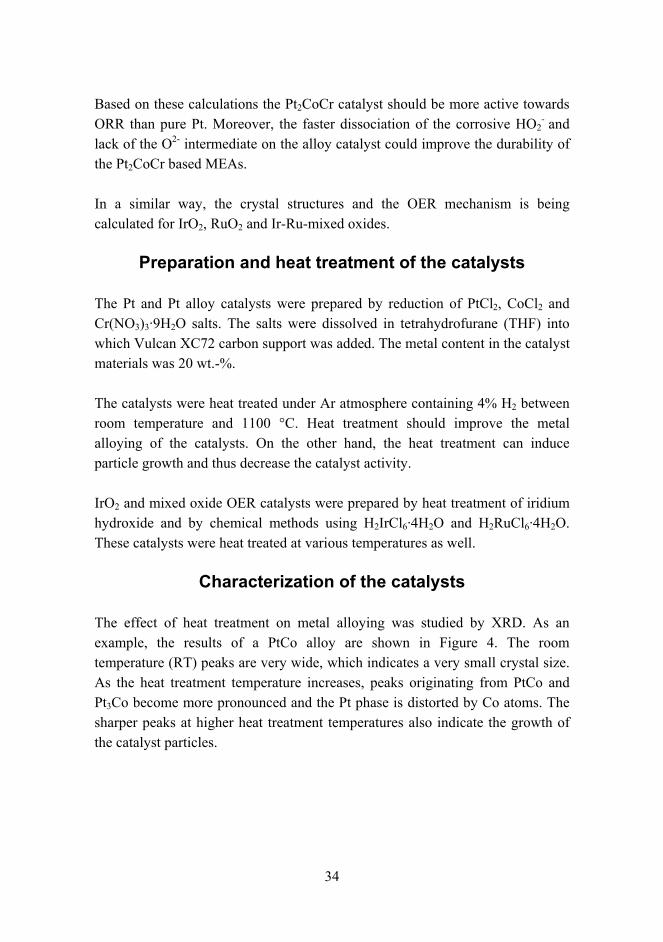
The effect of heat treatment on metal alloying was studied by XRD. As an example, the results of a PtCo alloy are shown in Figure 4. The room temperature (RT) peaks are very wide, which indicates a very small crystal size. As the heat treatment temperature increases, peaks originating from PtCo and Pt3Co become more pronounced and the Pt phase is distorted by Co atoms. The sharper peaks at higher heat treatment temperatures also indicate the growth of the catalyst particles.
35
Figure 4. XRD spectra of heat-treated PtCo catalysts.
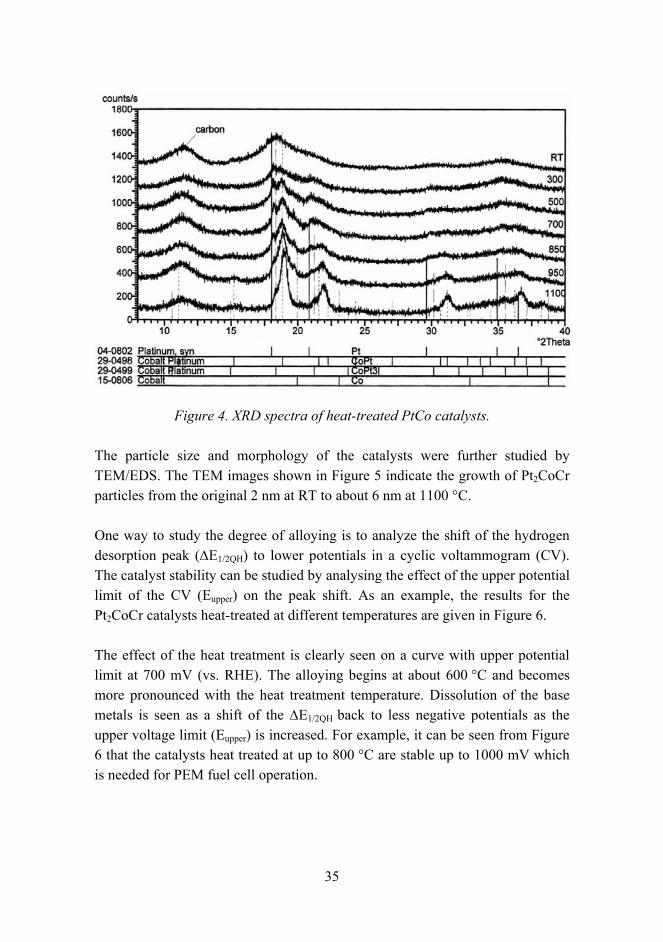
The particle size and morphology of the catalysts were further studied by TEM/EDS. The TEM images shown in Figure 5 indicate the growth of Pt2CoCr particles from the original 2 nm at RT to about 6 nm at 1100 °C.
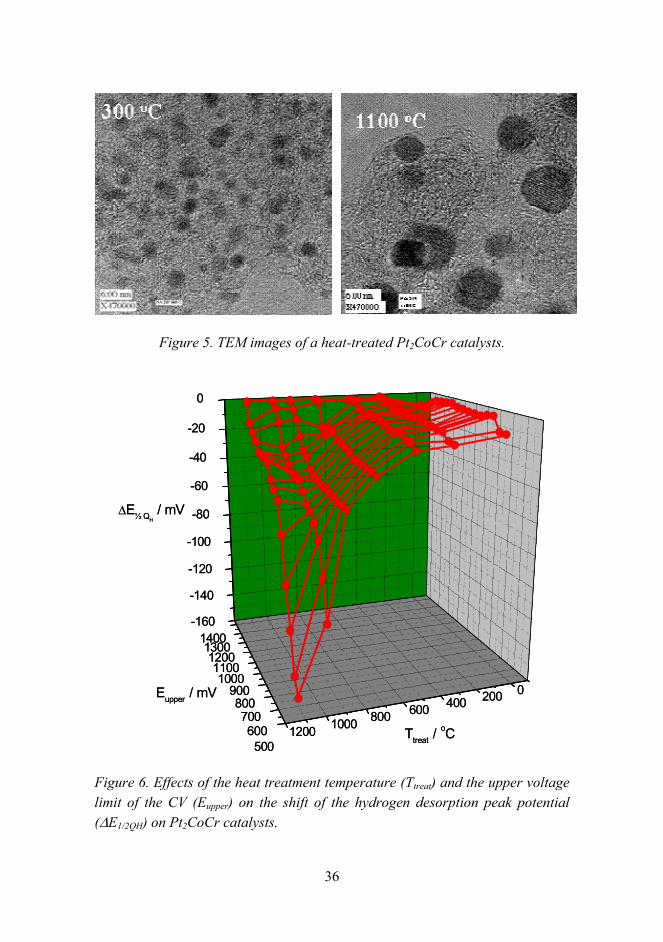
One way to study the degree of alloying is to analyze the shift of the hydrogen desorption peak (∆E1/2QH) to lower potentials in a cyclic voltammogram (CV). The catalyst stability can be studied by analysing the effect of the upper potential limit of the CV (Eupper) on the peak shift. As an example, the results for the Pt2CoCr catalysts heat-treated at different temperatures are given in Figure 6.
The effect of the heat treatment is clearly seen on a curve with upper potential limit at 700 mV (vs. RHE). The alloying begins at about 600 °C and becomes more pronounced with the heat treatment temperature. Dissolution of the base metals is seen as a shift of the ∆E1/2QH back to less negative potentials as the upper voltage limit (Eupper) is increased. For example, it can be seen from Figure 6 that the catalysts heat treated at up to 800 °C are stable up to 1000 mV which is needed for PEM fuel cell operation.
36
Figure 5. TEM images of a heat-treated Pt2CoCr catalysts.
020040060080010001200500
600700
800900
10001100
12001300
1400-160
-140
-120
-100
-80
-60
-40
-20
0
∆E½ QH / mV
Eupper / mV
Ttreat / oC
020040060080010001200500
600700
800900
10001100
12001300
1400-160
-140
-120
-100
-80
-60
-40
-20
0
∆E½ QH / mV
Eupper / mV
Ttreat / oC
Figure 6. Effects of the heat treatment temperature (Ttreat) and the upper voltage limit of the CV (Eupper) on the shift of the hydrogen desorption peak potential (∆E1/2QH) on Pt2CoCr catalysts.
37
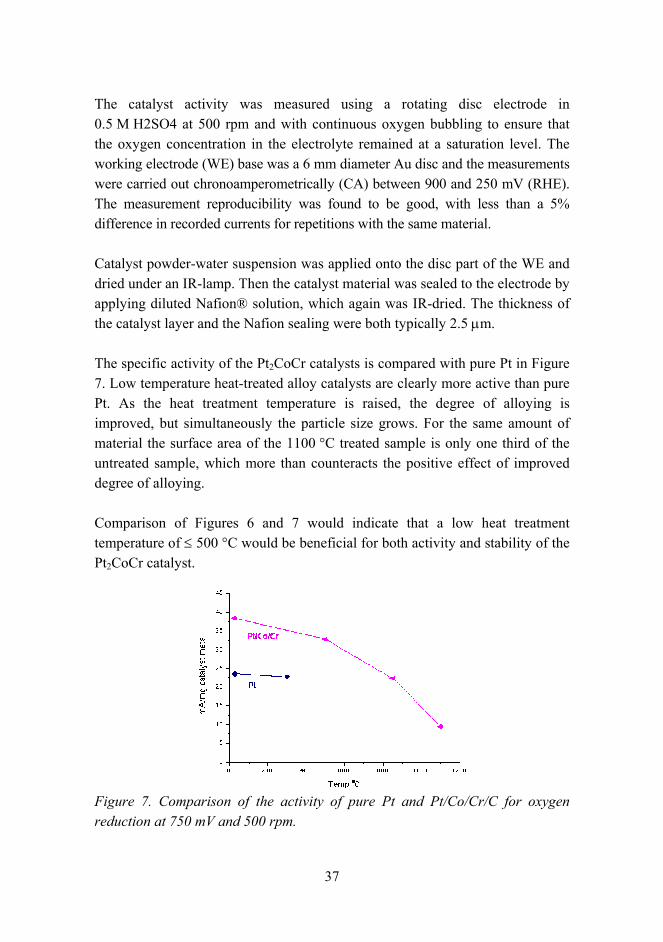
The catalyst activity was measured using a rotating disc electrode in 0.5 M H2SO4 at 500 rpm and with continuous oxygen bubbling to ensure that the oxygen concentration in the electrolyte remained at a saturation level. The working electrode (WE) base was a 6 mm diameter Au disc and the measurements were carried out chronoamperometrically (CA) between 900 and 250 mV (RHE). The measurement reproducibility was found to be good, with less than a 5% difference in recorded currents for repetitions with the same material.
Catalyst powder-water suspension was applied onto the disc part of the WE and dried under an IR-lamp. Then the catalyst material was sealed to the electrode by applying diluted Nafion® solution, which again was IR-dried. The thickness of the catalyst layer and the Nafion sealing were both typically 2.5 µm.
The specific activity of the Pt2CoCr catalysts is compared with pure Pt in Figure 7. Low temperature heat-treated alloy catalysts are clearly more active than pure Pt. As the heat treatment temperature is raised, the degree of alloying is improved, but simultaneously the particle size grows. For the same amount of material the surface area of the 1100 °C treated sample is only one third of the untreated sample, which more than counteracts the positive effect of improved degree of alloying.
Comparison of Figures 6 and 7 would indicate that a low heat treatment temperature of ≤ 500 °C would be beneficial for both activity and stability of the Pt2CoCr catalyst.
Figure 7. Comparison of the activity of pure Pt and Pt/Co/Cr/C for oxygen reduction at 750 mV and 500 rpm.
38
The IrO2 and mixed oxide catalyst have been characterized by surface analyses only. The electrochemical testing was carried out by Labgas Instruments Ltd.
MEA preparation
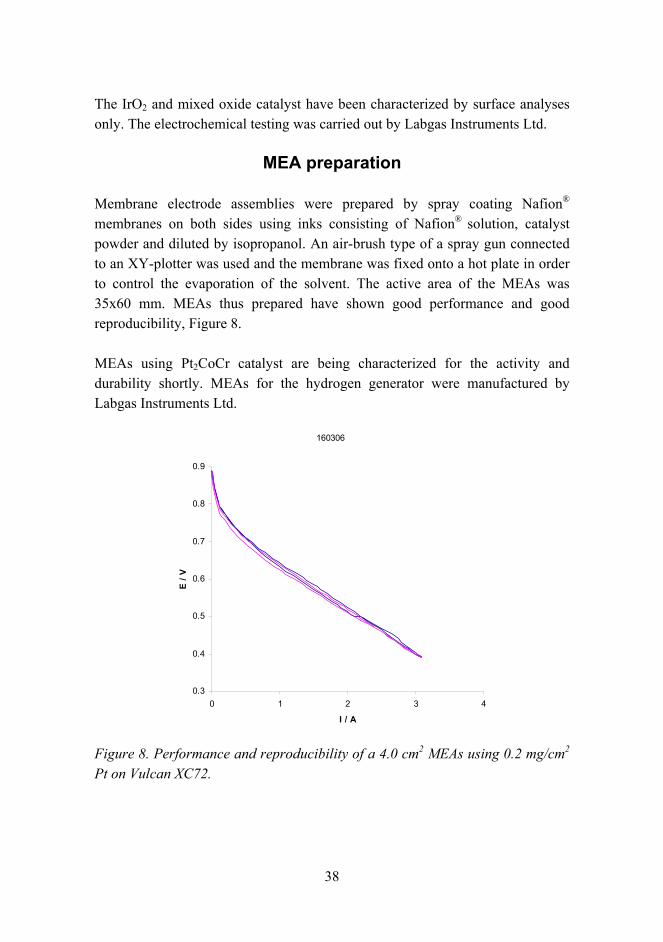
Membrane electrode assemblies were prepared by spray coating Nafion®
membranes on both sides using inks consisting of Nafion® solution, catalyst powder and diluted by isopropanol. An air-brush type of a spray gun connected to an XY-plotter was used and the membrane was fixed onto a hot plate in order to control the evaporation of the solvent. The active area of the MEAs was 35x60 mm. MEAs thus prepared have shown good performance and good reproducibility, Figure 8.
MEAs using Pt2CoCr catalyst are being characterized for the activity and durability shortly. MEAs for the hydrogen generator were manufactured by Labgas Instruments Ltd.
160306
0.3
0.4
0.5
0.6
0.7
0.8
0.9
0 1 2 3 4
I / A
E /
V
Figure 8. Performance and reproducibility of a 4.0 cm2 MEAs using 0.2 mg/cm2 Pt on Vulcan XC72.
39
Acknowledgements
Funding by Tekes the Finnish Funding Agency for Technology and Innovation, Labgas Instruments Ltd, Oy Hydrocell Ltd and DIARC-Technology Inc. through contract 40468/04 is gratefully acknowledged.
Reference list
1. Winter, C. J. & Nitsch, J. Wasserstoff als Energieträger. Springer-Verlag Berlin 1986. ISBN 3-540-15865-0.
2. Xiong, L., Kannan, A. M. & Manthiram, A. Electrochem. Communications 4 (2000), pp. 898903.
3. Seo, A., Lee, J., Han, K. & Kim, H. Electrochimica Acta (2006). (In press).
4. Marshall, A., Børresen, B., Hagen, G., Tsypkin, M. & Tunold, R. Electrochimica Acta 51 (2006), pp. 31613167.
5. Grigoriev, S. A., Porembsky, V. I. & Fateev, V. N. Pure hydrogen production by PEM electrolysis for hydrogen energy. Int. J. Hydrogen Energy 31 (2006), pp. 171175.
6. Accelrys. MS Modelling, Release 3.1.5, 2005, San Diego: Accelrys Software Inc.
40
In-service degradation of interconnector materials for solid oxide fuel cells
Sanni Mustala, Juha Veivo, Pertti Auerkari, Jari Kiviaho & Matti Noponen
VTT Technical Research Centre of Finland Kemistintie 3, Espoo, P.O. Box 1000, FI-02044 VTT
Abstract
The oxide growth and thermal degradation characteristics of three SOFC interconnector alloys have been investigated particularly for the cathode side conditions. The tested materials were ferritic stainless alloys including one common standard grade (alloy 430) and two alloys (Crofer 22 APU, ZMG 232) specifically designed for interconnector service. All three alloys appear to follow parabolic oxidation within the range of testing conditions (up to 500 h at 740 °C in air). A somewhat more pronounced oxidation was found in alloys ZMG 232 and Crofer 22 APU than in alloy 430. During oxidation, a consistent decrease inof iron and increase inof chromium and manganese were observed in the surface oxide. Some chromium transport was detected on the cathode side surface of the cell after 500 h at 740 °C. The results emphasise the importance of an appropriate coating for of the interconnectors, to prevent chromium poisoning on the cathode. A natural coating material would be similar or compatible with the ceramic cathode. Such a coating also has the additional advantage that simpler and cheaper steel grades could be used as the interconnector material.
Introduction
Solid oxide fuel cells (SOFC) are considered to be among the most promising devices for distributed power generation inof the hydrogen economy. Interconnectors using SOFC serve to facilitate sufficient charge transport and separate fuel from oxidant in the device. At sufficiently low service temperatures (below 800 °C), these interconnectors are potentially constructed of metallic materials like ferritic stainless steels. Nevertheless, the service conditions can result in gradual thermal and chemical degradation within the interconnector and the ceramic cell. Additionally also, the interconnector material must be
41
compatible with the ceramic cell materials in terms of thermal expansion, to prevent mechanical fuel cell failures during start-up and/or shut-down [15].
The VTT SOFC testing facility is being used for characterising the performance of solid oxide fuel cells and SOFC systems, including studies on cell and system components, and materials performance under service conditions. In this paper, the main focus is on in the characteristics and performance of the proposed metallic interconnection materials.
Materials and methods
The selected SOFC interconnector alloys are shown in Table 1. All these alloys are ferritic stainless steels; one standard grade (alloy 430), and also two alloys (Crofer 22 APU, ZMG 232) specifically designed for interconnector service. All materials were obtained from the suppliers as 2.53.0 mm plates.
Table 1. Test alloys with nominal compositions.
Alloy Supplier Nominal composition
Alloy 430 Outokumpu Cr 16-18, C max 0.12, Mn max. 1.0, Si max. 1.0, Fe bal.
Crofer 22 APU ThyssenGroup Cr 22, C 0.013, Mn 0.8, Si 0.5, Ti 0.2, La 0.2, Fe bal.
ZMG 232 Hitachi Metals Cr 22, C 0.02, Mn 0.5, Ni 0.26, Al 0.21, Zr 0.22, La 0.04, Fe bal.
Test coupons with a size of 15 x 15 mm were machined from the supplied plates. All the sides of the test coupons were ground to grit 1200 and first washed first in acetone, rinsed in distilled water and rewashed in ethanol prior to drying and testing. Each coupon was also measured for dimensions (with a slide calliper, uncertainty ± 0.015 mm) and mass (Mettler balance AT261, uncertainty ± 0.015 mg) before testing. The test coupons and the test arrangement are shown in Figures 1 and 2.
42
a) b)
Figure 1. Test coupon: a) nominal dimensions; b) coupon before testing.
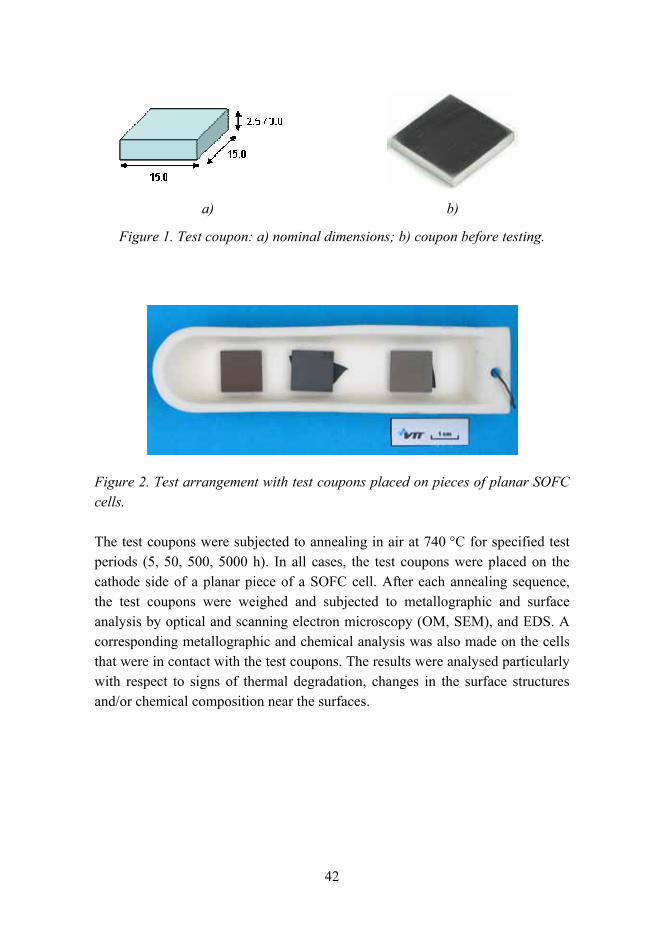
Figure 2. Test arrangement with test coupons placed on pieces of planar SOFC cells.
The test coupons were subjected to annealing in air at 740 °C for specified test periods (5, 50, 500, 5000 h). In all cases, the test coupons were placed on the cathode side of a planar piece of a SOFC cell. After each annealing sequence, the test coupons were weighed and subjected to metallographic and surface analysis by optical and scanning electron microscopy (OM, SEM), and EDS. A corresponding metallographic and chemical analysis was also made on the cells that were in contact with the test coupons. The results were analysed particularly with respect to signs of thermal degradation, changes in the surface structures and/or chemical composition near the surfaces.
43
Results
Mass change by oxidation
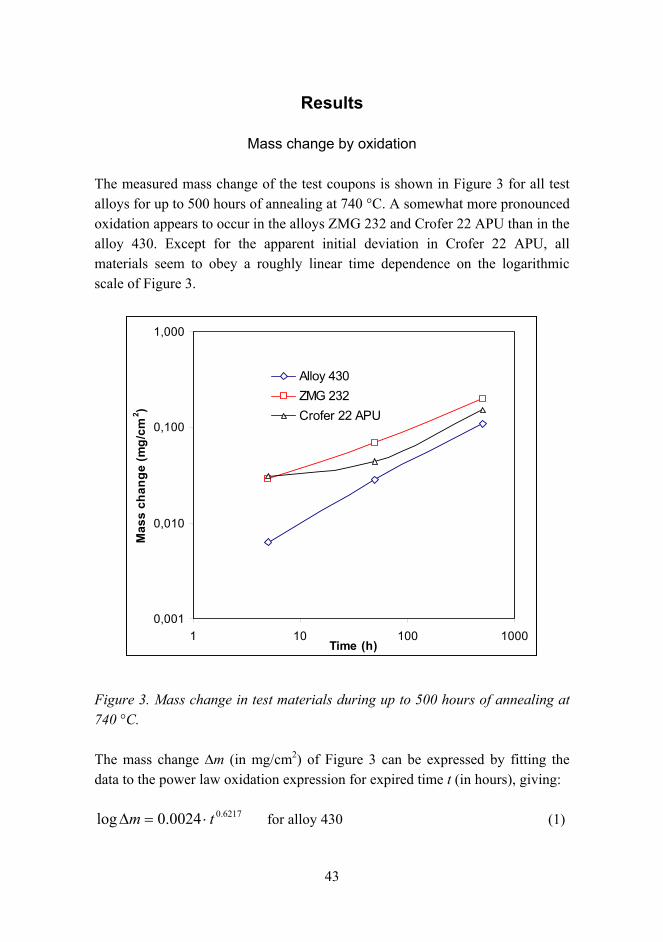
The measured mass change of the test coupons is shown in Figure 3 for all test alloys for up to 500 hours of annealing at 740 °C. A somewhat more pronounced oxidation appears to occur in the alloys ZMG 232 and Crofer 22 APU than in the alloy 430. Except for the apparent initial deviation in Crofer 22 APU, all materials seem to obey a roughly linear time dependence on the logarithmic scale of Figure 3.
0,001
0,010
0,100
1,000
1 10 100 1000Time (h)
Mas
s ch
ange
(mg/
cm2 )
Alloy 430ZMG 232Crofer 22 APU
Figure 3. Mass change in test materials during up to 500 hours of annealing at 740 °C.
The mass change ∆m (in mg/cm2) of Figure 3 can be expressed by fitting the data to the power law oxidation expression for expired time t (in hours), giving:
6217.00024.0log tm ⋅=∆ for alloy 430 (1)
44
4205.00142.0log tm ⋅=∆ for ZMG 232 (2)
The corresponding expression for Crofer 22 APU is not shown because of the apparent anomaly in the data as shown in Figure 3.
Oxide scale characteristics
The observed changes in the chemical composition of the surface oxide during the annealing of the alloys in contact with the cell cathode are shown in Figure 4. A clear increase in chromium, manganese and oxygen content is evident as well as a corresponding decrease in iron content on the surface. Up to 500 h this change appears to accelerate somewhat, even on a logarithmic time scale. After 500 h the surface chromium content of alloys AISI 430 and Crofer 22 APU have reached about 40%, while the iron content has decreased to below 20%. In ZMG 232 the iron content has also dropped to below 20%, but the chromium content has increased only to about 35%. No significant differences were observed between the two different sides of the interconnector alloy samples.
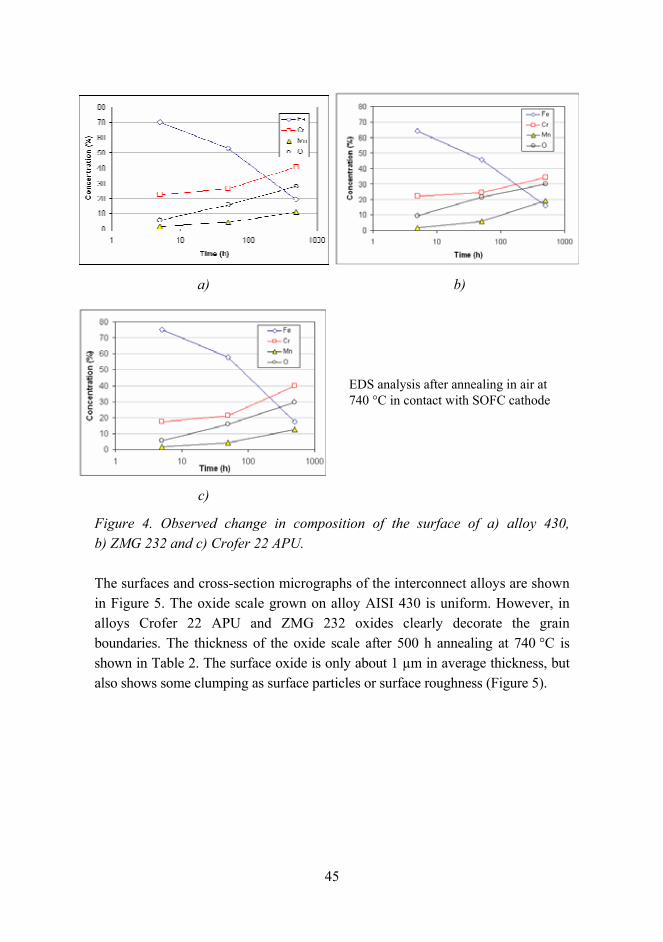
45
a) b)
EDS analysis after annealing in air at 740 °C in contact with SOFC cathode
c)
Figure 4. Observed change in composition of the surface of a) alloy 430, b) ZMG 232 and c) Crofer 22 APU.
The surfaces and cross-section micrographs of the interconnect alloys are shown in Figure 5. The oxide scale grown on alloy AISI 430 is uniform. However, in alloys Crofer 22 APU and ZMG 232 oxides clearly decorate the grain boundaries. The thickness of the oxide scale after 500 h annealing at 740 °C is shown in Table 2. The surface oxide is only about 1 µm in average thickness, but also shows some clumping as surface particles or surface roughness (Figure 5).
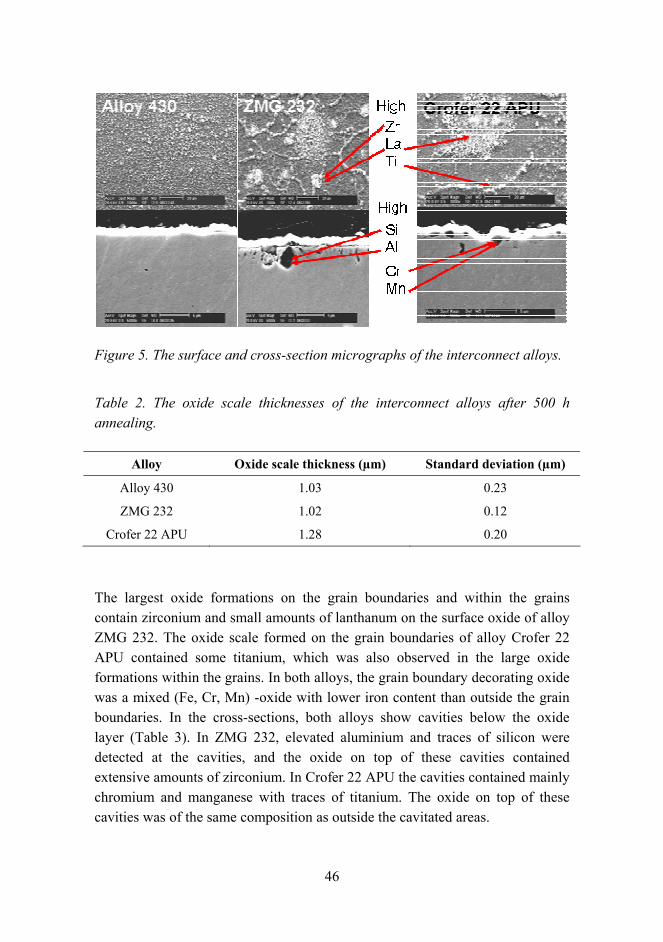
46
Figure 5. The surface and cross-section micrographs of the interconnect alloys.
Table 2. The oxide scale thicknesses of the interconnect alloys after 500 h annealing.
Alloy Oxide scale thickness (µm) Standard deviation (µm)
Alloy 430 1.03 0.23
ZMG 232 1.02 0.12
Crofer 22 APU 1.28 0.20
The largest oxide formations on the grain boundaries and within the grains contain zirconium and small amounts of lanthanum on the surface oxide of alloy ZMG 232. The oxide scale formed on the grain boundaries of alloy Crofer 22 APU contained some titanium, which was also observed in the large oxide formations within the grains. In both alloys, the grain boundary decorating oxide was a mixed (Fe, Cr, Mn) -oxide with lower iron content than outside the grain boundaries. In the cross-sections, both alloys show cavities below the oxide layer (Table 3). In ZMG 232, elevated aluminium and traces of silicon were detected at the cavities, and the oxide on top of these cavities contained extensive amounts of zirconium. In Crofer 22 APU the cavities contained mainly chromium and manganese with traces of titanium. The oxide on top of these cavities was of the same composition as outside the cavitated areas.
47
Table 3. Details on the cavities below the oxides of alloys ZMG 232 and Crofer 22 APU.
Alloy Cavity density (1/50 µm) Cavity size (µm) Aspect ratio
ZMG 232 30 2 6.7
Crofer 22 APU 9 1-2 1-2
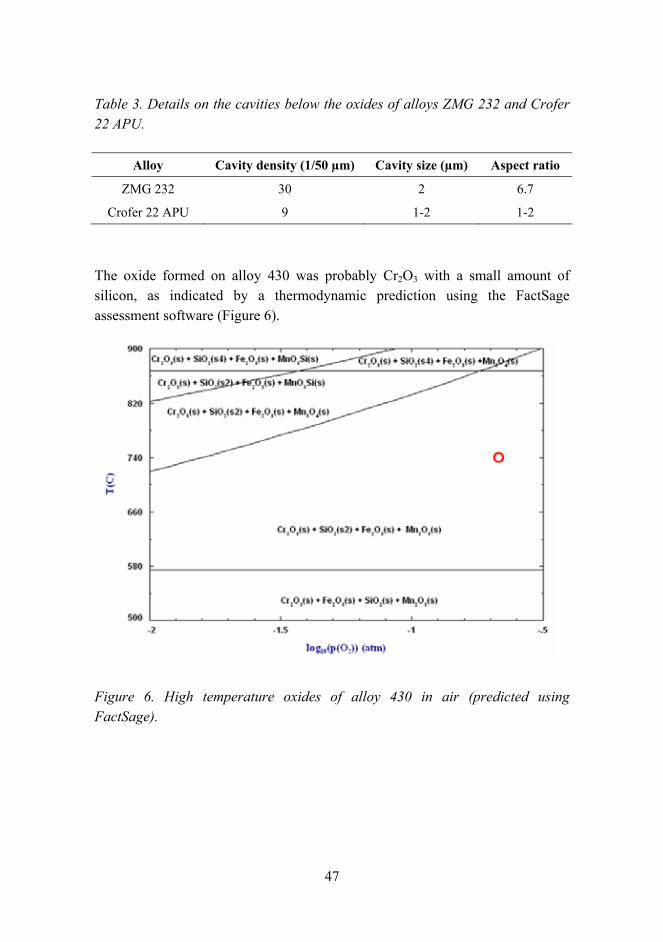
The oxide formed on alloy 430 was probably Cr2O3 with a small amount of silicon, as indicated by a thermodynamic prediction using the FactSage assessment software (Figure 6).
Figure 6. High temperature oxides of alloy 430 in air (predicted using FactSage).
48
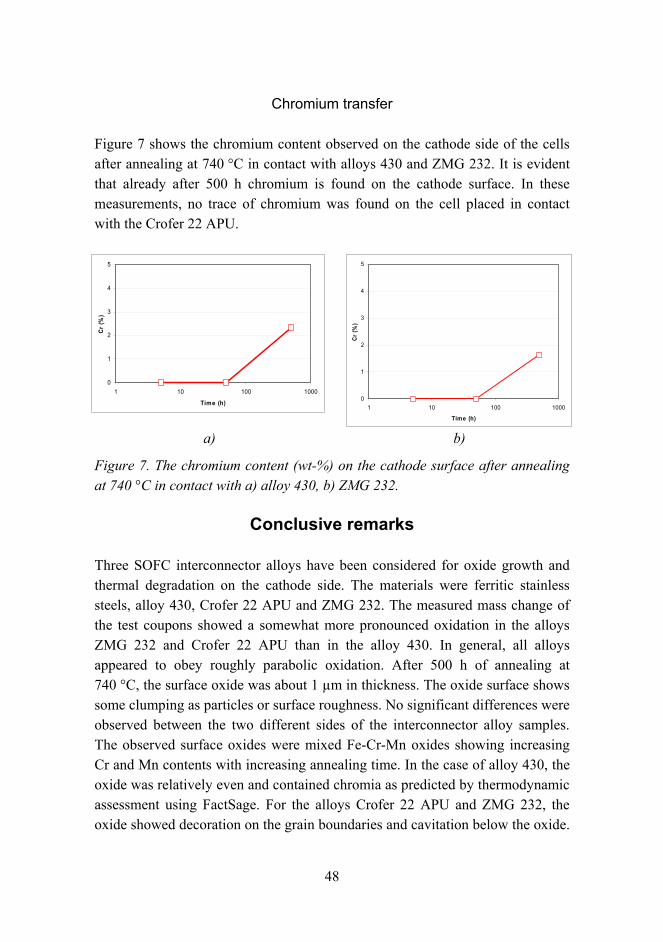
Chromium transfer
Figure 7 shows the chromium content observed on the cathode side of the cells after annealing at 740 °C in contact with alloys 430 and ZMG 232. It is evident that already after 500 h chromium is found on the cathode surface. In these measurements, no trace of chromium was found on the cell placed in contact with the Crofer 22 APU.
0
1
2
3
4
5
1 10 100 1000
Time (h)
Cr
(%)
0
1
2
3
4
5
1 10 100 1000
Time (h)
Cr (%
)
a) b)
Figure 7. The chromium content (wt-%) on the cathode surface after annealing at 740 °C in contact with a) alloy 430, b) ZMG 232.
Conclusive remarks
Three SOFC interconnector alloys have been considered for oxide growth and thermal degradation on the cathode side. The materials were ferritic stainless steels, alloy 430, Crofer 22 APU and ZMG 232. The measured mass change of the test coupons showed a somewhat more pronounced oxidation in the alloys ZMG 232 and Crofer 22 APU than in the alloy 430. In general, all alloys appeared to obey roughly parabolic oxidation. After 500 h of annealing at 740 °C, the surface oxide was about 1 µm in thickness. The oxide surface shows some clumping as particles or surface roughness. No significant differences were observed between the two different sides of the interconnector alloy samples. The observed surface oxides were mixed Fe-Cr-Mn oxides showing increasing Cr and Mn contents with increasing annealing time. In the case of alloy 430, the oxide was relatively even and contained chromia as predicted by thermodynamic assessment using FactSage. For the alloys Crofer 22 APU and ZMG 232, the oxide showed decoration on the grain boundaries and cavitation below the oxide.
49
The oxide on these alloys is expected to include spinel structure. In ZMG 232, elevated Al and traces of Si were detected at the cavities, and the oxide on top of these cavities contained extensive amounts of Zr. In Crofer 22 APU the cavities contained mainly Cr and Mn with traces of Ti, and the oxide on top of these cavities was of the same composition as outside the cavitated areas. After 500 h of annealing in contact with alloys 430 and ZMG 232, chromium was found on the cathode surface. This indicates potential for chromium poisoning, which that is known as a significant life-limiting mechanism for SOFC [3]. In principle, it would be possible to mitigate the chromium transfer by coating the interconnector using a conducting oxide coating compatible with the cathode.
Acknowledgement
The authors wish to acknowledge the financial and technical support from the FINSOFC project consortium supported by Tekes the Finnish Funding Agency for Technology and Innovation, and from the Clean World Theme of VTT.
Reference list
1. Fergus, J. W. Metallic interconnects for solid oxide fuel cells. Materials Science and Engineering A, 397, 2005, pp. 271283.
2. Yolokawa, H., Sakai, N., Horihita, T. & Yamaji, K. Recent Developments in Solid Oxide Fuel Cell Materials. Fuel Cells, Vol. 1, Issue 2, 2001, pp. 117131.
3. Gindorf, C., Singheiser, L. & Hipert, K. Vaporisation of chromia in humid air. Journal of Physics and Chemistry of Solids, Vol. 66, 2005, pp. 384387.
4. Mustala, S. Application of ferritic stainless steel as bipolar plates for solid oxide fuel cells. Masters Thesis, Espoo, 2005. 100 p. + app. 25 p.
5. Khanna, A. S. Introduction to high temperature oxidation and corrosion. ASM International, USA, 2005. 324 p.
50
Out of plane actuator concept and characterization of dielectric elastomer
EAP materials
Mika Paajanen1, Ville Jouppila2, Asko Ellman2, Siegfried Bauer3, Guggi Kofod4, Mikko Karesoja5 & Heikki Tenhu5
1VTT Technical Research Centre of Finland Sinitaival 6, P.O. Box 1300, FI-33101 Tampere, Finland
2Tampere University of Technology, Institute of Machine Design P.O. Box 589, FI-33101 Tampere, Finland
3Johannes Kepler University Linz, Soft Matter Physics Altenbergerstr. 69, A-4040 Linz, Austria
4University of Potsdam, Applied Condensed Matter Physics Am Neuen Palais 10, D-14469 Potsdam, Germany
5University of Helsinki, Laboratory of Polymer Chemistry P.O. Box 55, FI-00014 HY, Finland
Abstract
A biaxial pre-stretching of an elastomer film providing a negative load is an effective method in enhancing the actuating properties in electromechanical applications. The pre-stretching can be implemented by rolling an elastomer sheet around a compressed spring or by framing a stretched film using a rigid or a soft frame. One of the best known commercial dielectric elastomer materials is based on acrylic elastomers, e.g. 3M VHB 4910 or 4905 adhesive tape. In this work the VHB 4910 tape was used for the out of plane actuators. The 3M tape was framed using a soft frame, which enabled an out of plane actuator movement of 180° and a force of at least 30 mN. The used voltages were between 4 and 8 kV and the film thickness around 100 µm. The actuator was also used to make two simple application tests: a walker and a lifter. Current-voltage characterization was used to study the energy efficiency, frequency dependent behavior, and to develop a model for hyper elastic material properties.
51
Introduction
The Dielectric Elastomer Actuators (DEA) are a group of Electro Active Polymers (EAP) [1] that has become interesting since the discovery of the acrylic and silicone based commercial elastomers which perform well. Especially the acrylic pressure sensitive adhesive tape from 3M, VHB 4910, has been widely studied since Pelrine et al. [2] demonstrated its good electroactive properties. The VHB 4910 tape is especially easy to use as it is available in 1-mm thick film on a roll with various widths. The excellent actuation properties are a result of good electrical strength and a fairly high dielectric constant [3] combined with a potentially high elastic stretch ratio. An essential part of a DEA is a pre-strain that provides a negative load that greatly increases the actuation strain. For a biaxially pre-strained VHB 4910 based actuator, voltage-controlled on-plane strains of more than 200% were readily reported [4]. The pre-strain can also be obtained by utilizing, for example, tensioned springs [5] around which the elastomer film can be rolled. A new way to provide out-of-plane actuation movements has very recently been suggested [6]. It introduces a soft and elastic, initially planar, frame that both provides the pre-stretch as well as controls the out-of-plane bend by providing a counter spring to the stretched elastomer. The first out-of-plane actuators have been manufactured using the VHB 4910 tape, but since, just by chance, the acrylic tape material happens to be a great material for the dielectric actuator purposes, it creates a challenge for materials scientists to develop more advanced materials tailored especially for EAP actuators. The development of the new DEA-suitable high-performance materials requires mechanical as well as electrical characterization methods in order to understand the performance of the new material. This paper demonstrates some basic performance results related to the elastomer materials and actuators by utilizing the voltage-current. This paper also describes the operation of the out-of-plane actuator and its preliminary performance results.
Experimental
3M VHB 4910 acrylic elastomer tape of 1-mm thickness was used to build both the stiff frame and soft frame actuators. The stiff frame was a 120 x 120 mm2 piece of 3-mm thick acrylic plastic with a 40 x 40 mm2 hole in the center. A 19 x 19 mm2 piece of a VHB tape was stretched to dimensions of 47.5 x 47.5 mm2, or 2.5 x 2.5 times the original size over the hole in the frame.
52
The stretched tape was attached to the acrylic frame by the tapes own adhesive properties without any gluing. Compliant electrodes were made on the stretched film on a circular area of 13.5 mm diameter at the center of the stretched elastomer. The electrode material was silicon oil based carbon conductive grease. The same grease was also used to lead the current to aluminum tapes (on the acrylic frame) that were then connected to a high voltage amplifier. The current voltage characteristics were recorded using a data acquisition card and a digital video camera was used to study the deformation.
The bending soft frame was a 90 x 62 mm2 piece of PET transparency film of 100 µm thickness. There was a 40 x 40 mm2 hole in the middle so that the VHB tape was again stretched about 2.5 x 2.5 times from its original size over the hole and attached using its own adhesive properties to the PET frame. The whole elastomer area over the hole in the frame was treated with either a carbon conductive grease or with a silver conductive grease. The PET frame was attached to a table from the sides while the VHB tape was framed. The PET frame was also fitted with two rigid bars on two opposite sides so that the frame would only bend along one axis. When the framing was finalized the frame was detached from its constraints, which caused the tensioned tape to bend the frame to a 180 °C angle U-shape.
Results and dicussion
Mechanical properties of the elastomers
Applying a voltage difference between the two electrodes causes compression in thickness and expansion in the area of the elastomer film. On the electrodes the stretching due to the applied voltage separates like charges and hence reduces electrical energy, but the film thickness also decreases. The reduction in electrical energy is balanced by an increase in elastic mechanical energy and/or mechanical work output. Since the thickness of the film is decreased, electrodes come closer to each other and in the process electrical energy is converted to mechanical energy. A single active effective actuation pressure p is considered by Pelrine et al. [8] and is defined as
2
02
0 ⎟⎠⎞
⎜⎝⎛==
zVEp rr εεεε (1)
53
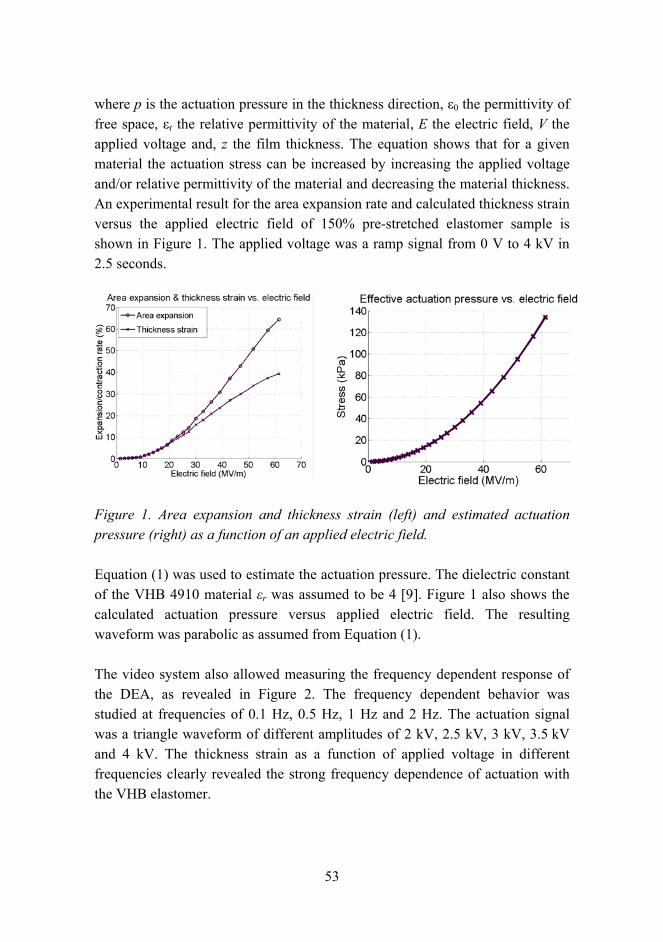
where p is the actuation pressure in the thickness direction, ε0 the permittivity of free space, εr the relative permittivity of the material, E the electric field, V the applied voltage and, z the film thickness. The equation shows that for a given material the actuation stress can be increased by increasing the applied voltage and/or relative permittivity of the material and decreasing the material thickness. An experimental result for the area expansion rate and calculated thickness strain versus the applied electric field of 150% pre-stretched elastomer sample is shown in Figure 1. The applied voltage was a ramp signal from 0 V to 4 kV in 2.5 seconds.
Figure 1. Area expansion and thickness strain (left) and estimated actuation pressure (right) as a function of an applied electric field.
Equation (1) was used to estimate the actuation pressure. The dielectric constant of the VHB 4910 material εr was assumed to be 4 [9]. Figure 1 also shows the calculated actuation pressure versus applied electric field. The resulting waveform was parabolic as assumed from Equation (1).
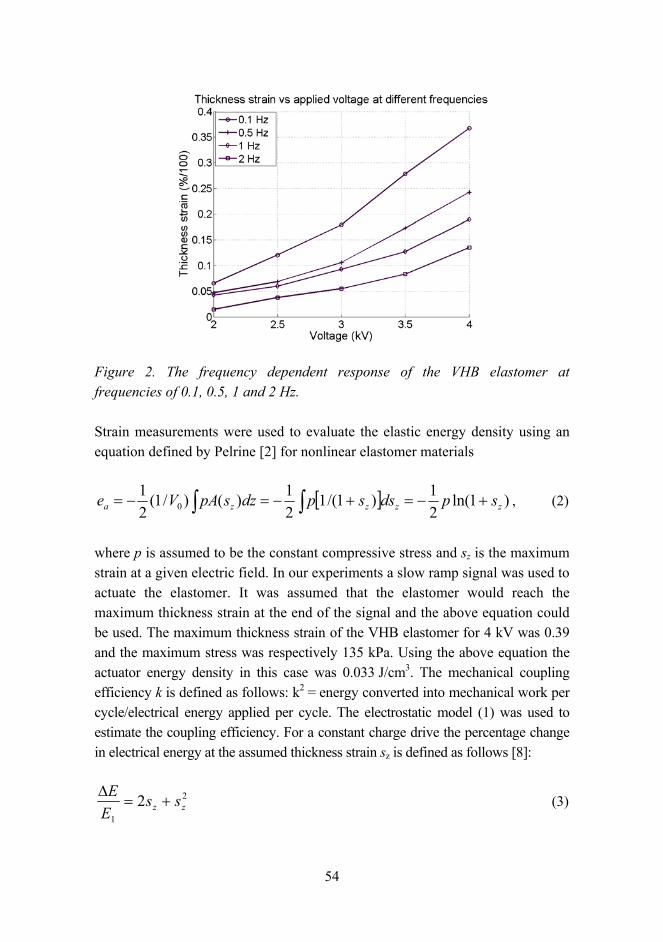
The video system also allowed measuring the frequency dependent response of the DEA, as revealed in Figure 2. The frequency dependent behavior was studied at frequencies of 0.1 Hz, 0.5 Hz, 1 Hz and 2 Hz. The actuation signal was a triangle waveform of different amplitudes of 2 kV, 2.5 kV, 3 kV, 3.5 kV and 4 kV. The thickness strain as a function of applied voltage in different frequencies clearly revealed the strong frequency dependence of actuation with the VHB elastomer.
54
Figure 2. The frequency dependent response of the VHB elastomer at frequencies of 0.1, 0.5, 1 and 2 Hz.
Strain measurements were used to evaluate the elastic energy density using an equation defined by Pelrine [2] for nonlinear elastomer materials
[ ]∫ ∫ +−=+−=−= )1ln(21)1/(1
21)()/1(
21
0 zzzza spdsspdzspAVe , (2)
where p is assumed to be the constant compressive stress and sz is the maximum strain at a given electric field. In our experiments a slow ramp signal was used to actuate the elastomer. It was assumed that the elastomer would reach the maximum thickness strain at the end of the signal and the above equation could be used. The maximum thickness strain of the VHB elastomer for 4 kV was 0.39 and the maximum stress was respectively 135 kPa. Using the above equation the actuator energy density in this case was 0.033 J/cm3. The mechanical coupling efficiency k is defined as follows: k2 = energy converted into mechanical work per cycle/electrical energy applied per cycle. The electrostatic model (1) was used to estimate the coupling efficiency. For a constant charge drive the percentage change in electrical energy at the assumed thickness strain sz is defined as follows [8]:
2
1
2 zz ssEE
+=∆
(3)
55
The best dielectric elastomers typically have low viscoelastic losses, so that the change in the electrical energy is approximately equal to the work output (sz < 0)
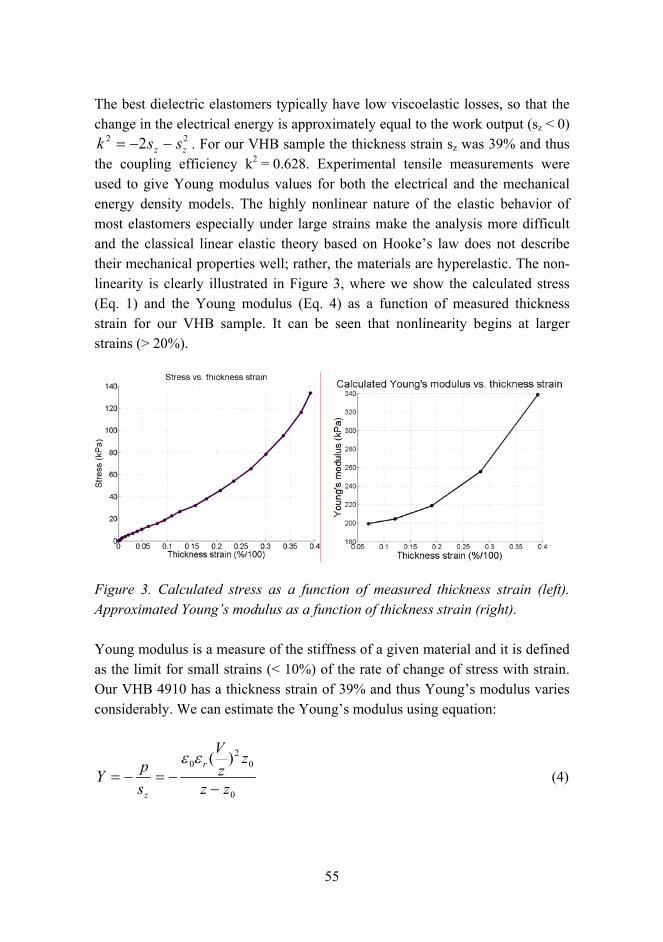
22 2 zz ssk −−= . For our VHB sample the thickness strain sz was 39% and thus the coupling efficiency k2 = 0.628. Experimental tensile measurements were used to give Young modulus values for both the electrical and the mechanical energy density models. The highly nonlinear nature of the elastic behavior of most elastomers especially under large strains make the analysis more difficult and the classical linear elastic theory based on Hookes law does not describe their mechanical properties well; rather, the materials are hyperelastic. The non-linearity is clearly illustrated in Figure 3, where we show the calculated stress (Eq. 1) and the Young modulus (Eq. 4) as a function of measured thickness strain for our VHB sample. It can be seen that nonlinearity begins at larger strains (> 20%).
Figure 3. Calculated stress as a function of measured thickness strain (left). Approximated Youngs modulus as a function of thickness strain (right).
Young modulus is a measure of the stiffness of a given material and it is defined as the limit for small strains (< 10%) of the rate of change of stress with strain. Our VHB 4910 has a thickness strain of 39% and thus Youngs modulus varies considerably. We can estimate the Youngs modulus using equation:
0
02
0 )(
zz
zzV
spY
r
z −−=−=
εε (4)
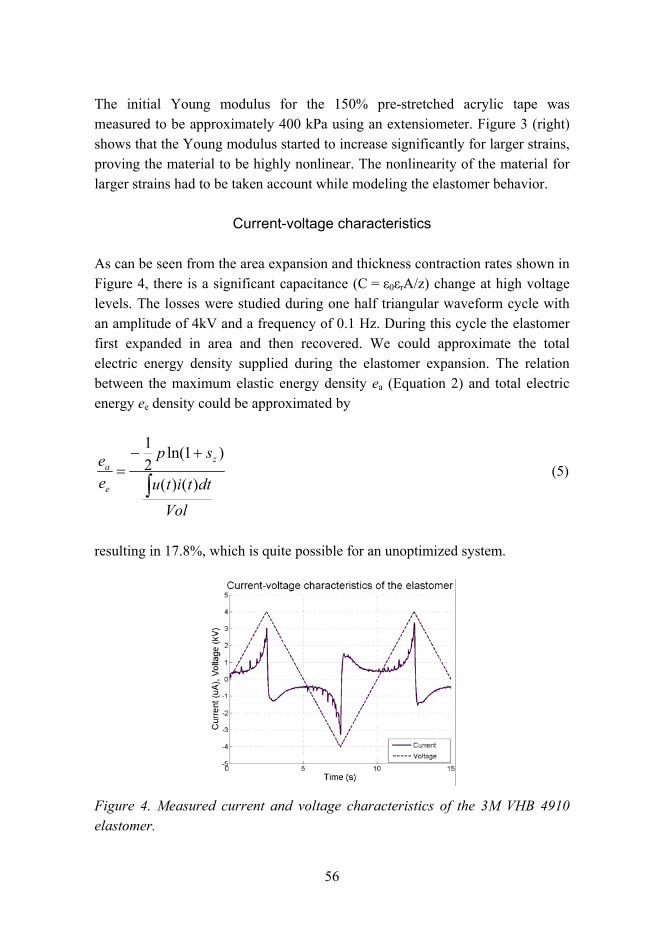
56
The initial Young modulus for the 150% pre-stretched acrylic tape was measured to be approximately 400 kPa using an extensiometer. Figure 3 (right) shows that the Young modulus started to increase significantly for larger strains, proving the material to be highly nonlinear. The nonlinearity of the material for larger strains had to be taken account while modeling the elastomer behavior.
Current-voltage characteristics
As can be seen from the area expansion and thickness contraction rates shown in Figure 4, there is a significant capacitance (C = ε0εrA/z) change at high voltage levels. The losses were studied during one half triangular waveform cycle with an amplitude of 4kV and a frequency of 0.1 Hz. During this cycle the elastomer first expanded in area and then recovered. We could approximate the total electric energy density supplied during the elastomer expansion. The relation between the maximum elastic energy density ea (Equation 2) and total electric energy ee density could be approximated by
Voldttitu
sp
ee z
e
a
∫
+−=
)()(
)1ln(21
(5)
resulting in 17.8%, which is quite possible for an unoptimized system.
Figure 4. Measured current and voltage characteristics of the 3M VHB 4910 elastomer.
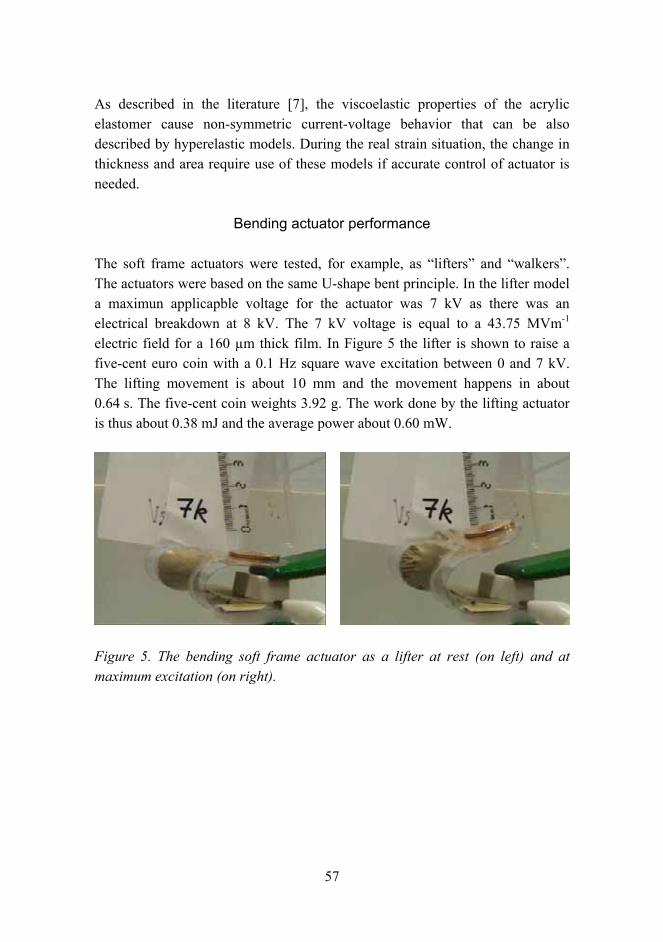
57
As described in the literature [7], the viscoelastic properties of the acrylic elastomer cause non-symmetric current-voltage behavior that can be also described by hyperelastic models. During the real strain situation, the change in thickness and area require use of these models if accurate control of actuator is needed.
Bending actuator performance
The soft frame actuators were tested, for example, as lifters and walkers. The actuators were based on the same U-shape bent principle. In the lifter model a maximun applicapble voltage for the actuator was 7 kV as there was an electrical breakdown at 8 kV. The 7 kV voltage is equal to a 43.75 MVm-1 electric field for a 160 µm thick film. In Figure 5 the lifter is shown to raise a five-cent euro coin with a 0.1 Hz square wave excitation between 0 and 7 kV. The lifting movement is about 10 mm and the movement happens in about 0.64 s. The five-cent coin weights 3.92 g. The work done by the lifting actuator is thus about 0.38 mJ and the average power about 0.60 mW.
Figure 5. The bending soft frame actuator as a lifter at rest (on left) and at maximum excitation (on right).
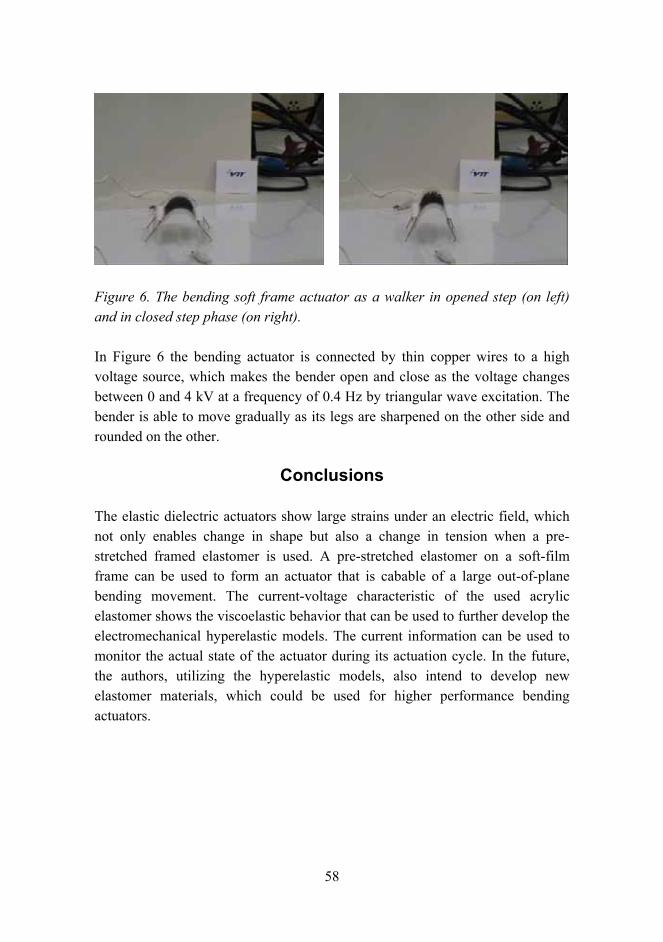
58
Figure 6. The bending soft frame actuator as a walker in opened step (on left) and in closed step phase (on right).
In Figure 6 the bending actuator is connected by thin copper wires to a high voltage source, which makes the bender open and close as the voltage changes between 0 and 4 kV at a frequency of 0.4 Hz by triangular wave excitation. The bender is able to move gradually as its legs are sharpened on the other side and rounded on the other.
Conclusions
The elastic dielectric actuators show large strains under an electric field, which not only enables change in shape but also a change in tension when a pre-stretched framed elastomer is used. A pre-stretched elastomer on a soft-film frame can be used to form an actuator that is cabable of a large out-of-plane bending movement. The current-voltage characteristic of the used acrylic elastomer shows the viscoelastic behavior that can be used to further develop the electromechanical hyperelastic models. The current information can be used to monitor the actual state of the actuator during its actuation cycle. In the future, the authors, utilizing the hyperelastic models, also intend to develop new elastomer materials, which could be used for higher performance bending actuators.
59
Acknowledgement
The authors would like to recognize financial support from Tekes FinNano program and also thank Professor Pekka Ruuskanen (TUT) for fruitful cooperation related to the measurement setup.
Reference list
1. Bar-Cohen, Y. (Ed.). Electroactive Polymer (EAP) Actuators as Artificial Muscles Reality. Potential and Challenges 2nd ed., SPIE Press PM136, 2004.
2. Pelrine, R., Kornbluh, R., Pei, Q. & Joseph, J. High-speed electrically actuated elastomers with strain greater than 100%, Science 287. 2000, pp. 836839.
3. Kofod, G., Sommer-Larsen, P., Kornbluh, R. & Pelrine, R. Actuation Response of Polyacrylate Dielectric Elastomers. Journal of Intelligent Material Systems and Structures 14 (12), 2003, pp. 787793.
4. Pelrine, R., Kornbluh, R. & Kofod, G. High-strain actuator materials based on dielectric elastomers. Advanced Materials, Vol. 12 (16), 2000, pp. 12231225.
5. Pei, Q., Pelrine, R., Stanford, S., Kornbluh, R., Rosenthal, M., Meijer, K. & Full, R. Multifunctional electroelastomer rolls and their application for biomimetic walking robots. Proc. Smart Structures and Materials: Electroactive Polymer Actuators and Devices (EAPAD), 2002, pp. 246253.
6. Kofod, G., Paajanen, M. & Bauer, S. New design concept for dielectric elastomer actuators. SPIE Smart Structures/NDE conference, To be published in EAPAD proceedings, 26.2.2.3.2006, San Diego, USA.
7. Bauer, S. & Paajanen, M. Electromechanical characterization and measurement protocol for dielectric elastomer actuators, SPIE Smart Structures/NDE conference. To be published in EAPAD proceedings, 26.2.2.3.2006, San Diego, USA.

60
8. Pelrine, R. et al. High field deformation of elastomeric dielectrics for actuators. Materials Science&Engineering C 11, 2000, pp. 89100.
9. Kofod, G. Dielectric elastomer actuators. The Technical University of Denmark, Ph.D. thesis, Risø report number: Risø-R-1286(EN). September 2001. ISBN 87-550-2924-8; 87-550-2925-6 (Internet), ISSN 0106-2840.
61
Bringing new properties to lignin rich fiber materials
Anna Suurnäkki, Johanna Buchert, Stina Grönqvist, Hannu Mikkonen, Soili Peltonen & Liisa Viikari
VTT Technical Research Centre of Finland Tietotie 2, Espoo, P.O. Box 1000, FI-02044 VTT
Abstract
A new method to enhance the native surface properties of lignin rich fibers or even to bring completely novel properties to these fiber materials has been developed at VTT. The method is based on enzymatic fiber activation combined with either enzymatic or chemo-enzymatic functionalization, or bonding of selected chemical component, to lignin rich fiber materials. Study of the activation of wood pulp fibers showed that various factors including pulp type, enzyme dosage and treatment conditions affect the radical formation in pulp material. Bonding of the chemical functionalities to activated pulps was successful both by enzymatic and chemical means. Various properties such as charge, hydrophobicity, and conductivity of lignin rich fiber materials could be modified by the chemo-enzymatic functionalisation method. For effective exploitation of the potential of the enzyme-based method, both understanding of the activation and bonding mechanisms and optimisation of the targeted fiber modification for the customers needs is essential.
Introduction
Upgrading the properties of wood fiber products is a constant challenge for the pulp and paper industry. The value of the traditional paper and board properties is currently modified by the selection of fiber raw material and processing techniques as well as by process chemical additions. Recently, a new method for targeted modification of lignin rich fiber materials has been developed at VTT. By this chemo-enzymatic method, functionalization of fibers can be carried out by enforcing the native surface properties of fibers or even by adding totally new chemical structures to fiber material.
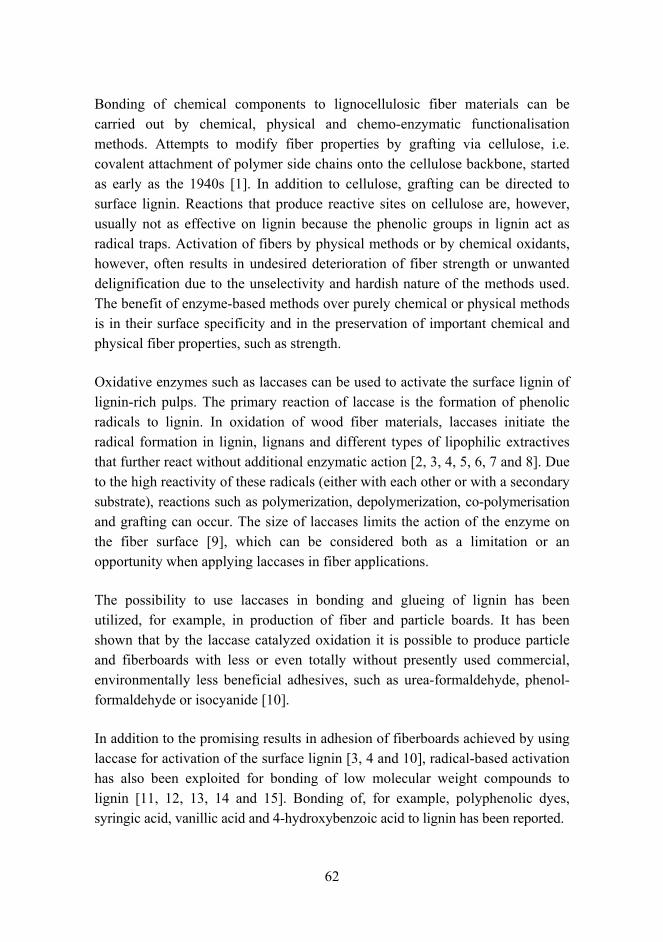
62
Bonding of chemical components to lignocellulosic fiber materials can be carried out by chemical, physical and chemo-enzymatic functionalisation methods. Attempts to modify fiber properties by grafting via cellulose, i.e. covalent attachment of polymer side chains onto the cellulose backbone, started as early as the 1940s [1]. In addition to cellulose, grafting can be directed to surface lignin. Reactions that produce reactive sites on cellulose are, however, usually not as effective on lignin because the phenolic groups in lignin act as radical traps. Activation of fibers by physical methods or by chemical oxidants, however, often results in undesired deterioration of fiber strength or unwanted delignification due to the unselectivity and hardish nature of the methods used. The benefit of enzyme-based methods over purely chemical or physical methods is in their surface specificity and in the preservation of important chemical and physical fiber properties, such as strength.
Oxidative enzymes such as laccases can be used to activate the surface lignin of lignin-rich pulps. The primary reaction of laccase is the formation of phenolic radicals to lignin. In oxidation of wood fiber materials, laccases initiate the radical formation in lignin, lignans and different types of lipophilic extractives that further react without additional enzymatic action [2, 3, 4, 5, 6, 7 and 8]. Due to the high reactivity of these radicals (either with each other or with a secondary substrate), reactions such as polymerization, depolymerization, co-polymerisation and grafting can occur. The size of laccases limits the action of the enzyme on the fiber surface [9], which can be considered both as a limitation or an opportunity when applying laccases in fiber applications.
The possibility to use laccases in bonding and glueing of lignin has been utilized, for example, in production of fiber and particle boards. It has been shown that by the laccase catalyzed oxidation it is possible to produce particle and fiberboards with less or even totally without presently used commercial, environmentally less beneficial adhesives, such as urea-formaldehyde, phenol-formaldehyde or isocyanide [10].
In addition to the promising results in adhesion of fiberboards achieved by using laccase for activation of the surface lignin [3, 4 and 10], radical-based activation has also been exploited for bonding of low molecular weight compounds to lignin [11, 12, 13, 14 and 15]. Bonding of, for example, polyphenolic dyes, syringic acid, vanillic acid and 4-hydroxybenzoic acid to lignin has been reported.
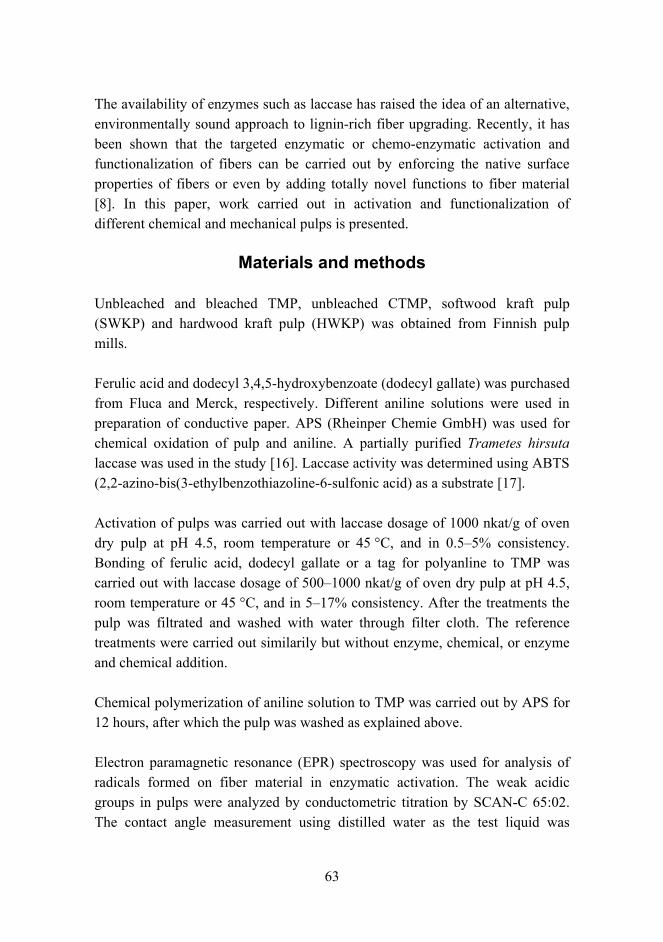
63
The availability of enzymes such as laccase has raised the idea of an alternative, environmentally sound approach to lignin-rich fiber upgrading. Recently, it has been shown that the targeted enzymatic or chemo-enzymatic activation and functionalization of fibers can be carried out by enforcing the native surface properties of fibers or even by adding totally novel functions to fiber material [8]. In this paper, work carried out in activation and functionalization of different chemical and mechanical pulps is presented.
Materials and methods
Unbleached and bleached TMP, unbleached CTMP, softwood kraft pulp (SWKP) and hardwood kraft pulp (HWKP) was obtained from Finnish pulp mills.
Ferulic acid and dodecyl 3,4,5-hydroxybenzoate (dodecyl gallate) was purchased from Fluca and Merck, respectively. Different aniline solutions were used in preparation of conductive paper. APS (Rheinper Chemie GmbH) was used for chemical oxidation of pulp and aniline. A partially purified Trametes hirsuta laccase was used in the study [16]. Laccase activity was determined using ABTS (2,2-azino-bis(3-ethylbenzothiazoline-6-sulfonic acid) as a substrate [17].
Activation of pulps was carried out with laccase dosage of 1000 nkat/g of oven dry pulp at pH 4.5, room temperature or 45 °C, and in 0.55% consistency. Bonding of ferulic acid, dodecyl gallate or a tag for polyanline to TMP was carried out with laccase dosage of 5001000 nkat/g of oven dry pulp at pH 4.5, room temperature or 45 °C, and in 517% consistency. After the treatments the pulp was filtrated and washed with water through filter cloth. The reference treatments were carried out similarily but without enzyme, chemical, or enzyme and chemical addition.
Chemical polymerization of aniline solution to TMP was carried out by APS for 12 hours, after which the pulp was washed as explained above.
Electron paramagnetic resonance (EPR) spectroscopy was used for analysis of radicals formed on fiber material in enzymatic activation. The weak acidic groups in pulps were analyzed by conductometric titration by SCAN-C 65:02. The contact angle measurement using distilled water as the test liquid was
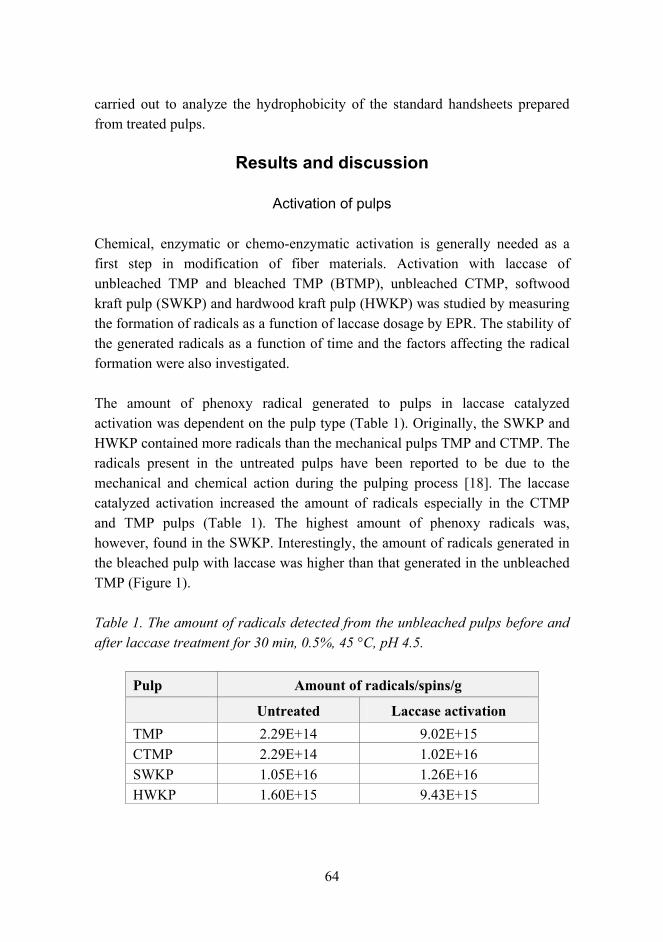
64
carried out to analyze the hydrophobicity of the standard handsheets prepared from treated pulps.
Results and discussion
Activation of pulps
Chemical, enzymatic or chemo-enzymatic activation is generally needed as a first step in modification of fiber materials. Activation with laccase of unbleached TMP and bleached TMP (BTMP), unbleached CTMP, softwood kraft pulp (SWKP) and hardwood kraft pulp (HWKP) was studied by measuring the formation of radicals as a function of laccase dosage by EPR. The stability of the generated radicals as a function of time and the factors affecting the radical formation were also investigated.
The amount of phenoxy radical generated to pulps in laccase catalyzed activation was dependent on the pulp type (Table 1). Originally, the SWKP and HWKP contained more radicals than the mechanical pulps TMP and CTMP. The radicals present in the untreated pulps have been reported to be due to the mechanical and chemical action during the pulping process [18]. The laccase catalyzed activation increased the amount of radicals especially in the CTMP and TMP pulps (Table 1). The highest amount of phenoxy radicals was, however, found in the SWKP. Interestingly, the amount of radicals generated in the bleached pulp with laccase was higher than that generated in the unbleached TMP (Figure 1).
Table 1. The amount of radicals detected from the unbleached pulps before and after laccase treatment for 30 min, 0.5%, 45 °C, pH 4.5.
Pulp Amount of radicals/spins/g
Untreated Laccase activation TMP 2.29E+14 9.02E+15 CTMP 2.29E+14 1.02E+16 SWKP 1.05E+16 1.26E+16 HWKP 1.60E+15 9.43E+15
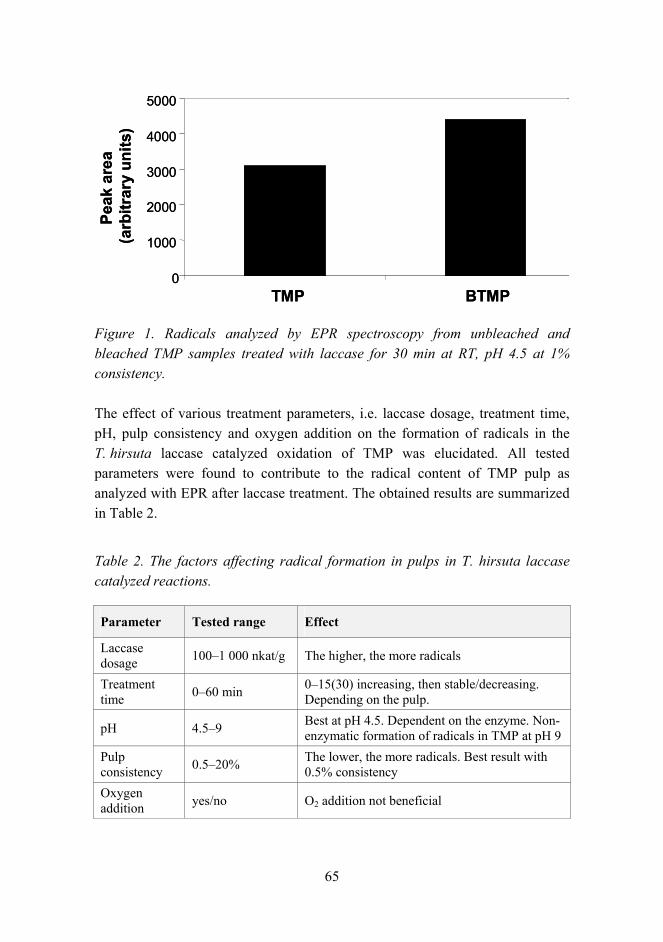
65
0
1000
2000
3000
4000
5000
TMP BTMP
Peak
are
a (a
rbitr
ary
units
)
0
1000
2000
3000
4000
5000
TMP BTMP
Peak
are
a (a
rbitr
ary
units
)
Figure 1. Radicals analyzed by EPR spectroscopy from unbleached and bleached TMP samples treated with laccase for 30 min at RT, pH 4.5 at 1% consistency.
The effect of various treatment parameters, i.e. laccase dosage, treatment time, pH, pulp consistency and oxygen addition on the formation of radicals in the T. hirsuta laccase catalyzed oxidation of TMP was elucidated. All tested parameters were found to contribute to the radical content of TMP pulp as analyzed with EPR after laccase treatment. The obtained results are summarized in Table 2.
Table 2. The factors affecting radical formation in pulps in T. hirsuta laccase catalyzed reactions.
Parameter Tested range Effect
Laccase dosage 1001 000 nkat/g The higher, the more radicals
Treatment time 060 min 015(30) increasing, then stable/decreasing.
Depending on the pulp.
pH 4.59 Best at pH 4.5. Dependent on the enzyme. Non-enzymatic formation of radicals in TMP at pH 9
Pulp consistency 0.520% The lower, the more radicals. Best result with
0.5% consistency Oxygen addition yes/no O2 addition not beneficial
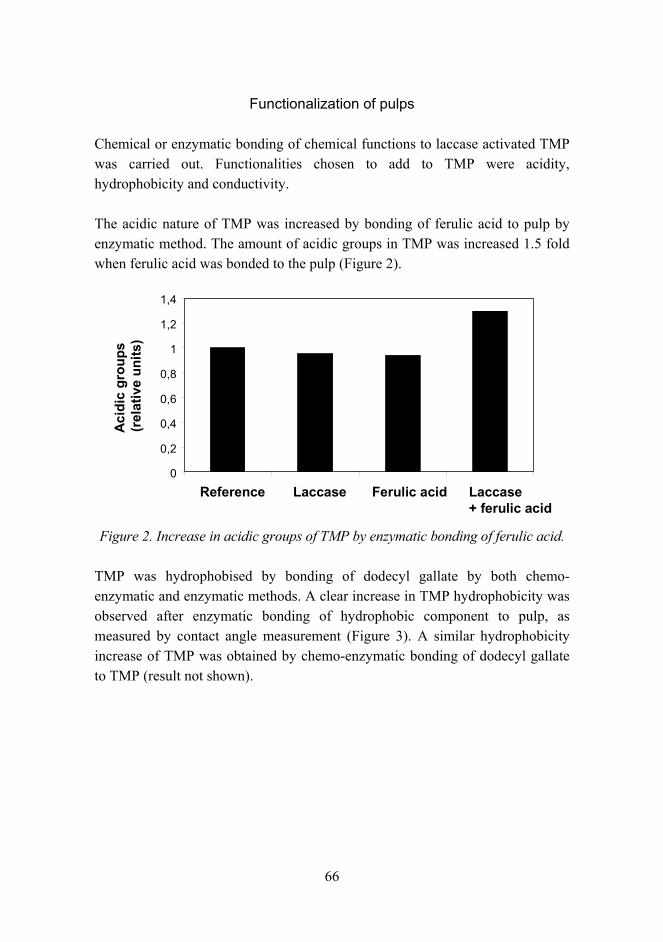
66
Functionalization of pulps
Chemical or enzymatic bonding of chemical functions to laccase activated TMP was carried out. Functionalities chosen to add to TMP were acidity, hydrophobicity and conductivity.
The acidic nature of TMP was increased by bonding of ferulic acid to pulp by enzymatic method. The amount of acidic groups in TMP was increased 1.5 fold when ferulic acid was bonded to the pulp (Figure 2).
0
0,2
0,4
0,6
0,8
1
1,2
1,4
Reference Laccase Ferulic acid Laccase+ ferulic acid
Aci
dic
grou
ps
(rel
ativ
e un
its)
Figure 2. Increase in acidic groups of TMP by enzymatic bonding of ferulic acid.
TMP was hydrophobised by bonding of dodecyl gallate by both chemo-enzymatic and enzymatic methods. A clear increase in TMP hydrophobicity was observed after enzymatic bonding of hydrophobic component to pulp, as measured by contact angle measurement (Figure 3). A similar hydrophobicity increase of TMP was obtained by chemo-enzymatic bonding of dodecyl gallate to TMP (result not shown).
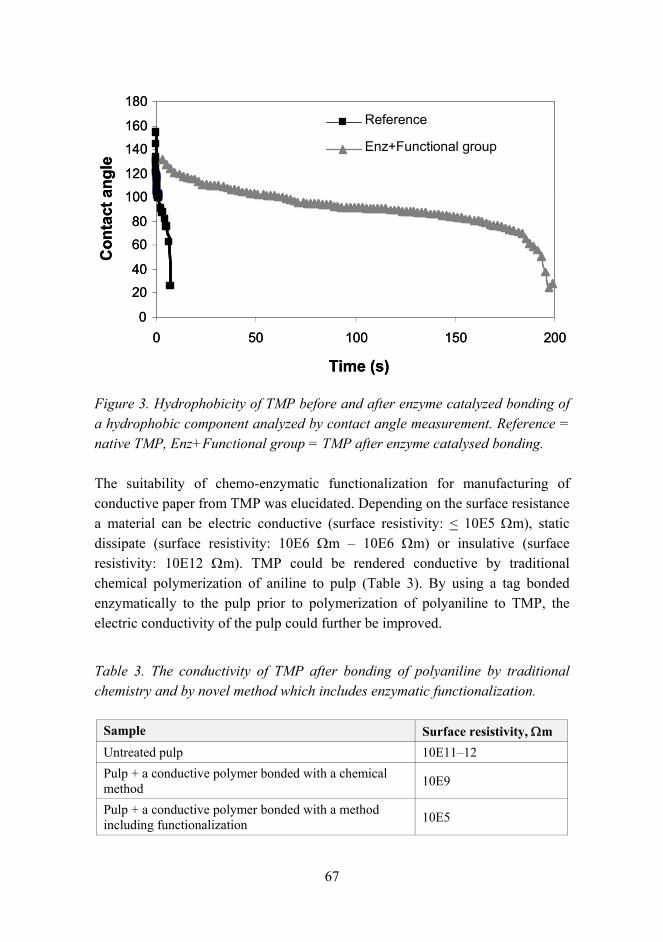
67
0
20
40
60
80
100
120
140
160
180
0 50 100 150 200
Time (s)
Con
tact
ang
leReference
Enz+Functional group
0
20
40
60
80
100
120
140
160
180
0 50 100 150 200
Time (s)
Con
tact
ang
leReference
Enz+Functional group
Figure 3. Hydrophobicity of TMP before and after enzyme catalyzed bonding of a hydrophobic component analyzed by contact angle measurement. Reference = native TMP, Enz+Functional group = TMP after enzyme catalysed bonding.
The suitability of chemo-enzymatic functionalization for manufacturing of conductive paper from TMP was elucidated. Depending on the surface resistance a material can be electric conductive (surface resistivity: < 10E5 Ωm), static dissipate (surface resistivity: 10E6 Ωm 10E6 Ωm) or insulative (surface resistivity: 10E12 Ωm). TMP could be rendered conductive by traditional chemical polymerization of aniline to pulp (Table 3). By using a tag bonded enzymatically to the pulp prior to polymerization of polyaniline to TMP, the electric conductivity of the pulp could further be improved.
Table 3. The conductivity of TMP after bonding of polyaniline by traditional chemistry and by novel method which includes enzymatic functionalization.
Sample Surface resistivity, Ωm Untreated pulp 10E1112 Pulp + a conductive polymer bonded with a chemical method 10E9
Pulp + a conductive polymer bonded with a method including functionalization 10E5
68
Conclusions
The chemo-enzymatic functionalization method now available at VTT is based on the use of lignin as a bonding matrix for designed attachment of novel functional groups to pulp. This new method includes enzymatic activation and enzymatic or chemo-enzymatic bonding steps resulting in enhanced fiber properties or completely novel properties in pulps. Study of the activation of wood pulp fibers showed that various factors including pulp type, enzyme dosage and treatment conditions affect radical formation in pulp material. Bonding of the chemical functionalities to activated pulps was successful both by enzymatic and chemical means. The enzyme-based functionalization method can be exploited in paper and board industry by modifying the surface properties of fiber materials, such as charge, to be suitable for the processing chemistry and technology. Additionally, the possibility to add desired functions to fiber materials enables tailoring of final product properties. More knowledge on the mechanisms involved in the enzymatic activation and chemo-enzymatic bonding of chemical components to pulps is needed for further development of the functionalization method. It is, however, expected that in the future the properties of fibers can be engineered based on targeted industrial needs.
Acknowledgement
This work has been part of the VTT technology theme Clean world. The work has partially been financed by Tekes the Finnish Funding Agency for Technology and Innovation and EU. Leena-Sisko Johansson is thanked for the ESCA analysis and Prof. Marco Orlandi and Kari Rantanen are acknowledged for the EPR analysis. The excellent technical assistance of Teija Jokila and Pirkko Saarelainen is gratefully acknowledged.
Reference list
1. Cushing, M. L. Fruit of the future in interfiber bonding. Tappi, 1971, Vol. 54, No. 3, pp. 349354.
69
2. Hassingboe, J. M., Lawther, J. M. & Felby, C. Influence of extractives on enzymatic catalysed bonding of Norway spruce TMP fibres. Proc. 7th Int. Conf. Biotechnology in the Pulp and Paper Industry, Vancouver, Canada, 1998. Vol. A. Pp. A125A128.
3. Felby, C., Nielsen B. R., Olesen, P. O. & Skibsted, L. H. Identification and quantification of radical reaction intermediates by electron spin resonance spectrometry of laccase-catalyzed oxidation of wood fibers from beech (Fagus sylvatica). Appl. Microbiol Biotechnol, 1997a. Vol. 48, No. 4, pp. 459464.
4. Felby, C., Pedersen, L. S. & Nielsen, B. R. Enhanced auto adhesion of wood fibers using phenol oxidases. Holzforschung, 1997b, Vol. 51, No. 3, pp. 281286.
5. Barsberg, S. & Thygesen, L. Spectroscopic properties of oxidation species generated in the lignin of wood by a laccase catalysed treatment: electronic hole state migration and stabilization in the lignin matrix. Biochemica et Biophysica Acta, 1999, Vol. 1472, No. 3, pp. 625642.
6. Aust, S., Barr, D., Grover, T., Shah, M. & Namhyun, C. Compounds and methods for generating free radicals used in general oxidation and reduction reactions. US patent 5 389 356. 1995.
7. Grönqvist, S., Buchert, J., Rantanen, K., Viikari, L. & Suurnäkki, A. Activity of laccase on unbleached and bleached thermomechanical pulp. Enzyme and Microbial Technol., 2003, Vol. 32, No. 34, pp. 439445.
8. Grönqvist, S., Rantanen, K., Alén, R., Mattinen, M.-L., Viikari, L. & Buchert, J. Activation of TMP with laccase a first step in fibre functionalisation. (Manuscript in preparation).
9. Paice, M. G., Bourbonnais, R., Reid, I. D., Archibald, F. S. & Jurasek, L. Oxidative bleaching enzymes: a review. J. Pulp and paper sci., 1995, Vol. 21, No. 8, pp. 280284.
70
10. Hüttermann, A., Mai, C. & Kharazipour, A. Modification of lignin for the production of new compounded materials. Appl. Microbiol. Biotechnol., 2001, Vol. 55, No. 4, pp. 387394.
11. Chandra, R. & Ragauskas, A. Sculpting the molecular weight of lignin via laccase. Proc. 11th Int. Symp. on Wood and Pulp Chem., Nice, France, 2001, part II. Pp. 3942.
12. Chandra, R. & Ragauskas, A. Evaluating laccase-catalysed coupling of phenolic acids to high-yield kraft pulps. Enzyme and microbial technology, 2002, Vol. 30, No. 4, pp. 855861.
13. Chandra, R., Lehtonen, L. & Ragauskas, A. Modification of High Lignin Content Kraft Pulps with Laccase to Improve Paper Strength Properties. 1. Laccase Treatment in the Presence of Gallic Acid. Biotechnol. Prog., 2004. Vol. 20, No. 1, pp. 255261.
14. Lund, M., Felby, C. & Bjerrum, M. Modification of kraft pulp and lignin by co-polymerisation of phenolic compounds iniated by laccase. Proc. 7th Int. Conf. Biotechnology in the Pulp and Paper Industry, Vancouver, Canada, 1998, Vol. C. Pp. C139C142.
15. Lund, M. & Ragauskas, A. Enzymatic modification of kraft lignin through oxidative coupling with water-soluble phenols. Appl. Microbiol Biotechnol., 2001, Vol. 55, No. 6, pp. 699703.
16. Poppius-Levlin, K., Whang, W., Tamminen, T., Hortling, B., Viikari, L. & Niku-Paavola, M.-L. Effects of laccase/HBT Treatment on pulp and Lignin Structures. J Pulp Pap Sci., 1999, Vol. 25, No. 3, pp. 9094.
17. Niku-Paavola, M.-L., Karhunen, E., Salola, P. & Raunio, V. Lignolytic enzymes of the white-rot fungus Phlebia radiata. Biochem. J., 1988, Vol. 254, No. 3, pp. 877884.
18. Hon, D. N.-S. & Glasser, W. G. The effect of mechanical action on wood and fibre components. Tappi J., 1979, Vol. 62, No. 10, pp. 107110.
71
Experiments on shape memory alloy actuator and practical applicability considerations
Kari Tammi
VTT Technical Research Centre of Finland Otakaari 7, Espoo, P.O. Box 1000, FI-02044 VTT
Abstract
This paper describes the design and the experimental work on a force-generating Shape Memory Alloy (SMA) actuator concept. The objective of the work was to test the applicability of the actuator concept for semi-active vibration control. The actuator was designed for bolt-force adjustment in structural joints. The SMA material applied was standard commercial NiTinol alloy. Two different actuator designs were constructed and tested: a smaller air-heated design, and a larger water-heated design. The actuators ability to generate a force as a function of the bolt pre-tension was studied in the experiments. The magnitude of the forces generated was from 1 kN to 70 kN. In terms of design and control, non-linear behavior of the actuator was considered a challenge. From the industrial application point of view, the long-term behavior and the price of the material were considered the greatest challenges. Ability to generate large forces relatively quickly was seen as a promising opportunity. Furthermore, both actuator constructions were relatively simple and consisted of a small number of components.
Introduction
The objective of the presented work was to examine the applicability of standard commercial Shape memory alloy (SMA) for semi-active vibration control. The aim was to design an SMA actuator capable of adjusting a bolt force in a range up to several thousand Newtons.
SMA material restores its shape when heated over a transition temperature. This behavior is based on the phase change in the material. The original shape is taught during a thermal treatment. When heated, this shape is restored due to a
72
change to the austenitic phase. In the lower-temperature martensitic phase, the same material is more flexible, even super-elastic. Thus the actuator that is deformed in a lower temperature aims to restore its shape when heated above the transition temperature. [1.]
In semi-active vibration control, the characteristics of a structure are adjusted in such a way that vibration response is minimized (or maximized, if wanted). Compared to the purely active vibration control methods, the energy driven into the system is relatively low in semi-active vibration control solutions. For example, a component with controllable stiffness may be used to adjust the natural frequency of a structure. This provides an opportunity for resonance-avoidance control. For further interest in active vibration control, see [2, 3]. Controllable friction joints have been utilized as the actuators in semi-active vibration control [4, 5]. In some applications, controllable friction joints have been used similarly to the viscous damping elements (shock absorbers). The controllable friction joints have some advantages over viscous dampers: 1) ability to generate a considerable damping force for small relative velocity between the joint members, and 2) ability to generate low damping force for high velocities. These features are advantageous for certain semi-active systems [6, 7].
The actuator concept examined in this paper is intended for normal force control between the structural members as shown in figure 1. Normal force control makes it possible to control the stiffness between the structural members by means of friction in the joint. The normal force is controlled by adjustable pre-tension in a joining bolt using the designed SMA actuator concept. This work concentrates the examination of the bolt force as a function of the bolt pre-tension force and the heat conducted in SMA material. The remaining components of the presented principle are not considered in the work.
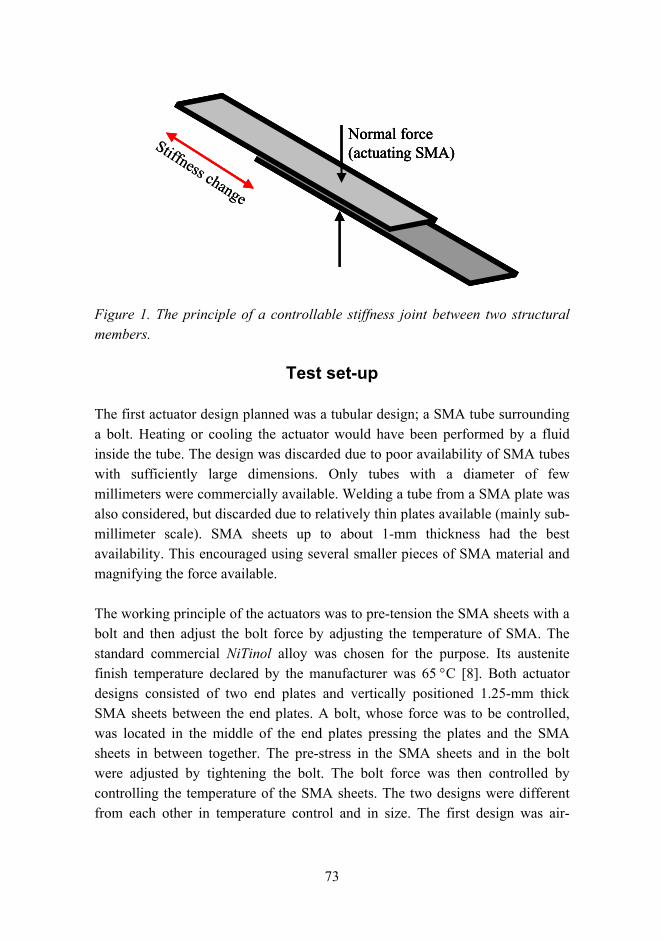
73
Normal force (actuating SMA)Stiffness change
Normal force (actuating SMA)Normal force (actuating SMA)Stiffness change
Figure 1. The principle of a controllable stiffness joint between two structural members.
Test set-up
The first actuator design planned was a tubular design; a SMA tube surrounding a bolt. Heating or cooling the actuator would have been performed by a fluid inside the tube. The design was discarded due to poor availability of SMA tubes with sufficiently large dimensions. Only tubes with a diameter of few millimeters were commercially available. Welding a tube from a SMA plate was also considered, but discarded due to relatively thin plates available (mainly sub-millimeter scale). SMA sheets up to about 1-mm thickness had the best availability. This encouraged using several smaller pieces of SMA material and magnifying the force available.
The working principle of the actuators was to pre-tension the SMA sheets with a bolt and then adjust the bolt force by adjusting the temperature of SMA. The standard commercial NiTinol alloy was chosen for the purpose. Its austenite finish temperature declared by the manufacturer was 65 °C [8]. Both actuator designs consisted of two end plates and vertically positioned 1.25-mm thick SMA sheets between the end plates. A bolt, whose force was to be controlled, was located in the middle of the end plates pressing the plates and the SMA sheets in between together. The pre-stress in the SMA sheets and in the bolt were adjusted by tightening the bolt. The bolt force was then controlled by controlling the temperature of the SMA sheets. The two designs were different from each other in temperature control and in size. The first design was air-
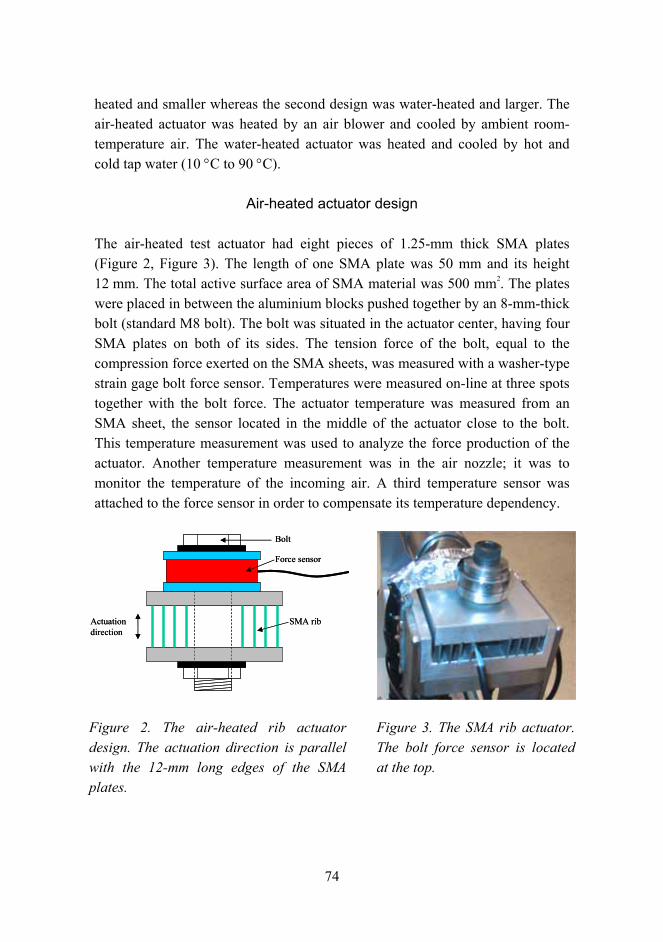
74
heated and smaller whereas the second design was water-heated and larger. The air-heated actuator was heated by an air blower and cooled by ambient room-temperature air. The water-heated actuator was heated and cooled by hot and cold tap water (10 °C to 90 °C).
Air-heated actuator design
The air-heated test actuator had eight pieces of 1.25-mm thick SMA plates (Figure 2, Figure 3). The length of one SMA plate was 50 mm and its height 12 mm. The total active surface area of SMA material was 500 mm2. The plates were placed in between the aluminium blocks pushed together by an 8-mm-thick bolt (standard M8 bolt). The bolt was situated in the actuator center, having four SMA plates on both of its sides. The tension force of the bolt, equal to the compression force exerted on the SMA sheets, was measured with a washer-type strain gage bolt force sensor. Temperatures were measured on-line at three spots together with the bolt force. The actuator temperature was measured from an SMA sheet, the sensor located in the middle of the actuator close to the bolt. This temperature measurement was used to analyze the force production of the actuator. Another temperature measurement was in the air nozzle; it was to monitor the temperature of the incoming air. A third temperature sensor was attached to the force sensor in order to compensate its temperature dependency.
SMA rib
Bolt
Actuation direction
Force sensor
SMA rib
Bolt
Actuation direction
Force sensor
Figure 2. The air-heated rib actuator design. The actuation direction is parallel with the 12-mm long edges of the SMA plates.
Figure 3. The SMA rib actuator. The bolt force sensor is located at the top.
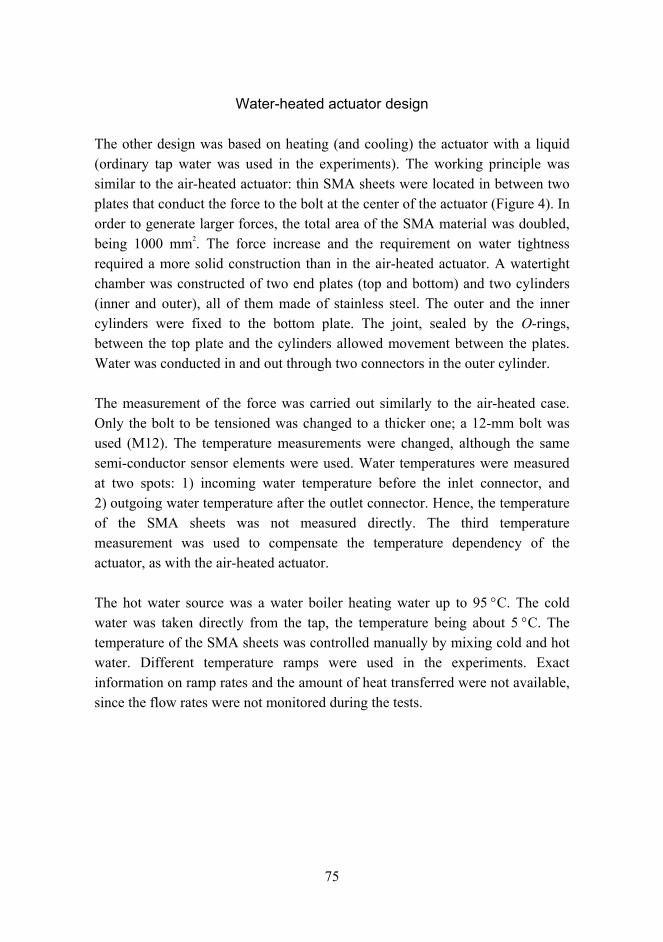
75
Water-heated actuator design
The other design was based on heating (and cooling) the actuator with a liquid (ordinary tap water was used in the experiments). The working principle was similar to the air-heated actuator: thin SMA sheets were located in between two plates that conduct the force to the bolt at the center of the actuator (Figure 4). In order to generate larger forces, the total area of the SMA material was doubled, being 1000 mm2. The force increase and the requirement on water tightness required a more solid construction than in the air-heated actuator. A watertight chamber was constructed of two end plates (top and bottom) and two cylinders (inner and outer), all of them made of stainless steel. The outer and the inner cylinders were fixed to the bottom plate. The joint, sealed by the O-rings, between the top plate and the cylinders allowed movement between the plates. Water was conducted in and out through two connectors in the outer cylinder.
The measurement of the force was carried out similarly to the air-heated case. Only the bolt to be tensioned was changed to a thicker one; a 12-mm bolt was used (M12). The temperature measurements were changed, although the same semi-conductor sensor elements were used. Water temperatures were measured at two spots: 1) incoming water temperature before the inlet connector, and 2) outgoing water temperature after the outlet connector. Hence, the temperature of the SMA sheets was not measured directly. The third temperature measurement was used to compensate the temperature dependency of the actuator, as with the air-heated actuator.
The hot water source was a water boiler heating water up to 95 °C. The cold water was taken directly from the tap, the temperature being about 5 °C. The temperature of the SMA sheets was controlled manually by mixing cold and hot water. Different temperature ramps were used in the experiments. Exact information on ramp rates and the amount of heat transferred were not available, since the flow rates were not monitored during the tests.
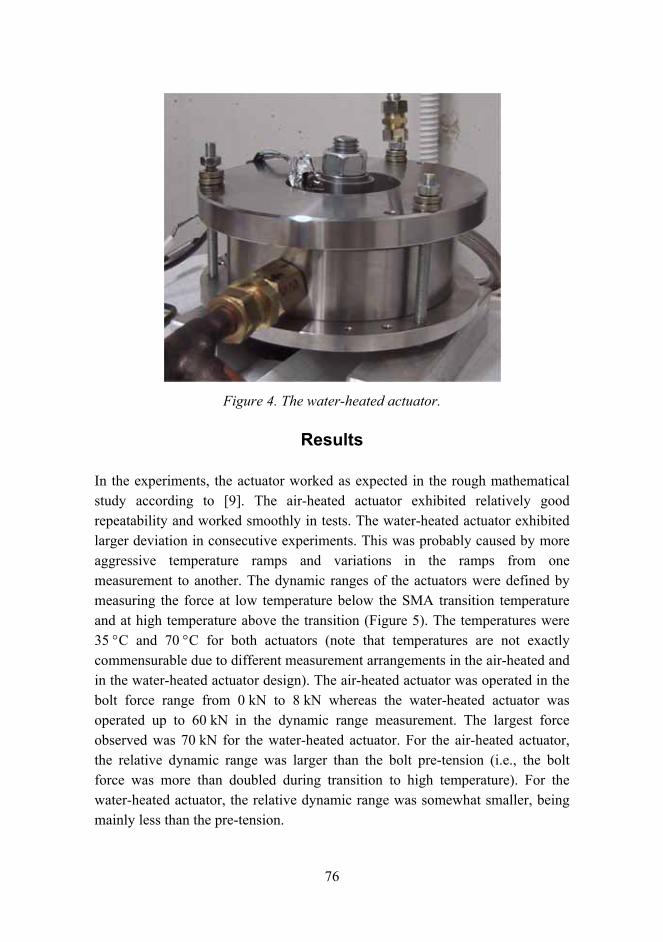
76
Figure 4. The water-heated actuator.
Results
In the experiments, the actuator worked as expected in the rough mathematical study according to [9]. The air-heated actuator exhibited relatively good repeatability and worked smoothly in tests. The water-heated actuator exhibited larger deviation in consecutive experiments. This was probably caused by more aggressive temperature ramps and variations in the ramps from one measurement to another. The dynamic ranges of the actuators were defined by measuring the force at low temperature below the SMA transition temperature and at high temperature above the transition (Figure 5). The temperatures were 35 °C and 70 °C for both actuators (note that temperatures are not exactly commensurable due to different measurement arrangements in the air-heated and in the water-heated actuator design). The air-heated actuator was operated in the bolt force range from 0 kN to 8 kN whereas the water-heated actuator was operated up to 60 kN in the dynamic range measurement. The largest force observed was 70 kN for the water-heated actuator. For the air-heated actuator, the relative dynamic range was larger than the bolt pre-tension (i.e., the bolt force was more than doubled during transition to high temperature). For the water-heated actuator, the relative dynamic range was somewhat smaller, being mainly less than the pre-tension.
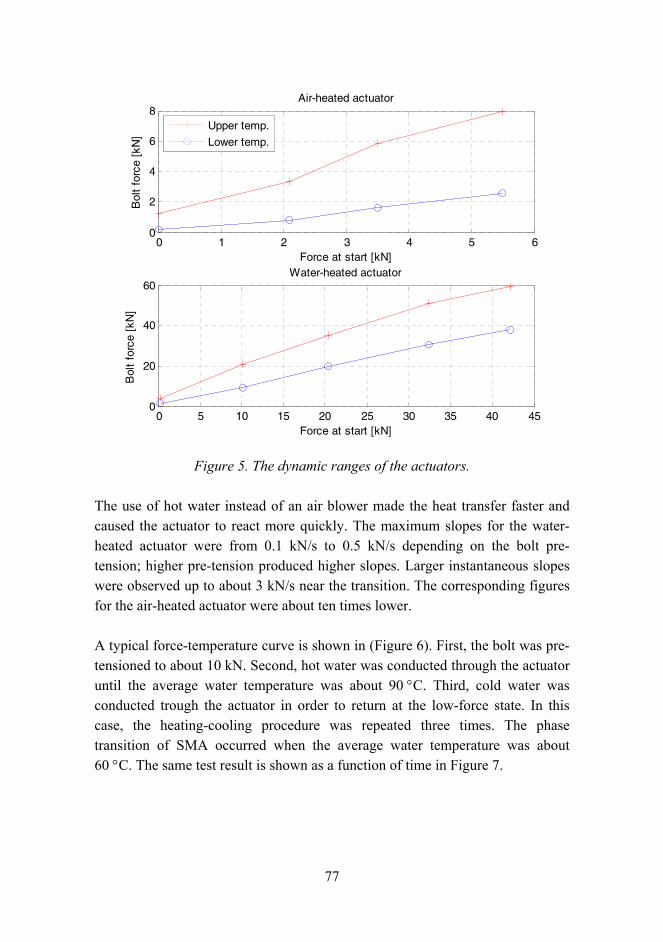
77
0 1 2 3 4 5 60
2
4
6
8Air-heated actuator
Force at start [kN]
Bol
t fo
rce
[kN
]
0 5 10 15 20 25 30 35 40 450
20
40
60Water-heated actuator
Force at start [kN]
Bol
t fo
rce
[kN
]Upper temp.
Lower temp.
Figure 5. The dynamic ranges of the actuators.
The use of hot water instead of an air blower made the heat transfer faster and caused the actuator to react more quickly. The maximum slopes for the water-heated actuator were from 0.1 kN/s to 0.5 kN/s depending on the bolt pre-tension; higher pre-tension produced higher slopes. Larger instantaneous slopes were observed up to about 3 kN/s near the transition. The corresponding figures for the air-heated actuator were about ten times lower.
A typical force-temperature curve is shown in (Figure 6). First, the bolt was pre-tensioned to about 10 kN. Second, hot water was conducted through the actuator until the average water temperature was about 90 °C. Third, cold water was conducted trough the actuator in order to return at the low-force state. In this case, the heating-cooling procedure was repeated three times. The phase transition of SMA occurred when the average water temperature was about 60 °C. The same test result is shown as a function of time in Figure 7.
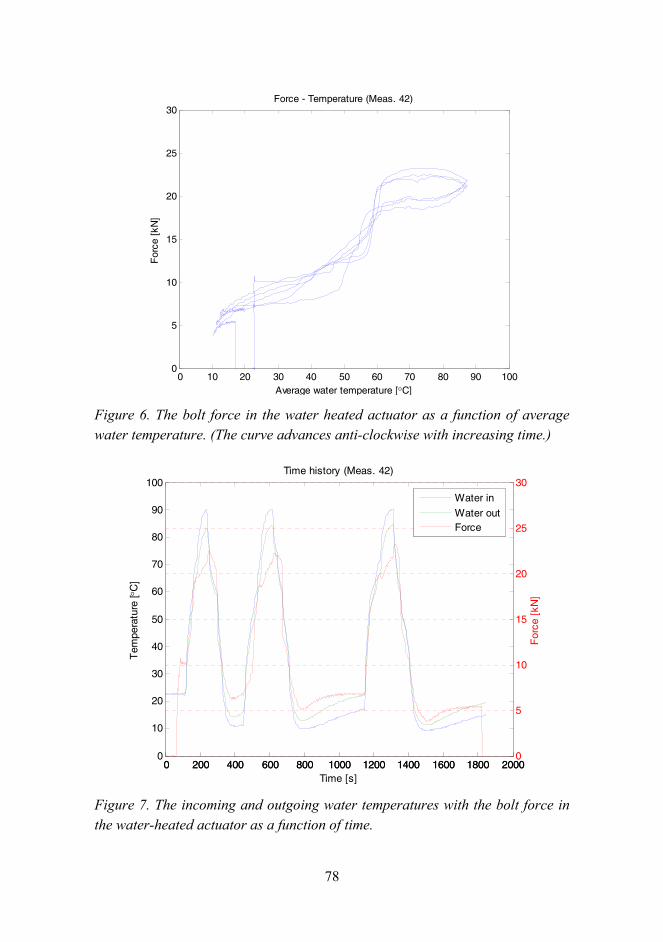
78
0 10 20 30 40 50 60 70 80 90 1000
5
10
15
20
25
30
Average water temperature [°C]
For
ce [
kN]
Force - Temperature (Meas. 42)
Figure 6. The bolt force in the water heated actuator as a function of average water temperature. (The curve advances anti-clockwise with increasing time.)
0 200 400 600 800 1000 1200 1400 1600 1800 20000
10
20
30
40
50
60
70
80
90
100
Tem
pera
ture
[ °C
]
0 200 400 600 800 1000 1200 1400 1600 1800 20000
5
10
15
20
25
30
For
ce [
kN]
Time [s]
Time history (Meas. 42)
Water in
Water outForce
Figure 7. The incoming and outgoing water temperatures with the bolt force in the water-heated actuator as a function of time.
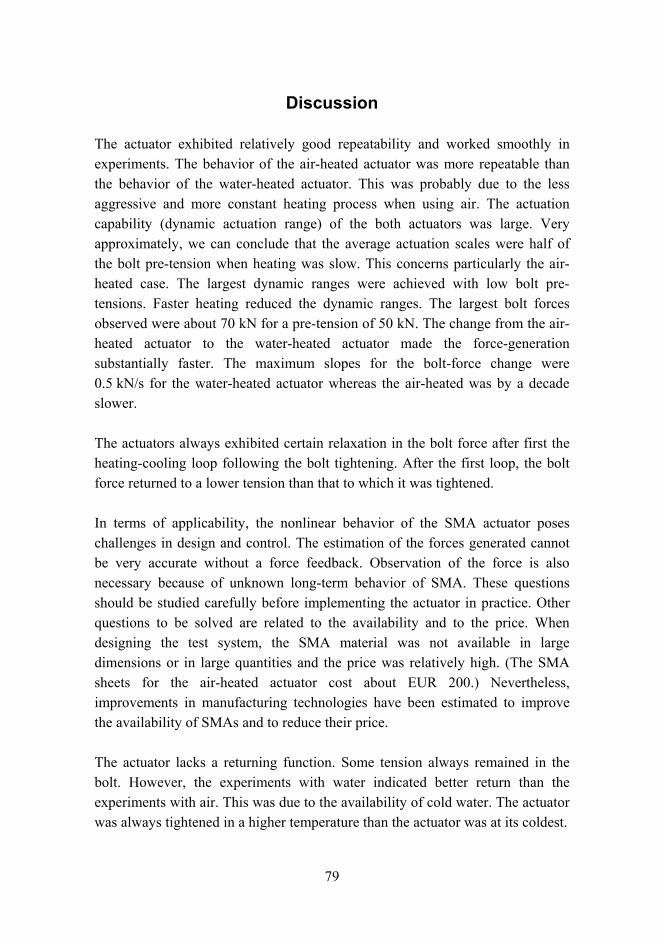
79
Discussion
The actuator exhibited relatively good repeatability and worked smoothly in experiments. The behavior of the air-heated actuator was more repeatable than the behavior of the water-heated actuator. This was probably due to the less aggressive and more constant heating process when using air. The actuation capability (dynamic actuation range) of the both actuators was large. Very approximately, we can conclude that the average actuation scales were half of the bolt pre-tension when heating was slow. This concerns particularly the air-heated case. The largest dynamic ranges were achieved with low bolt pre-tensions. Faster heating reduced the dynamic ranges. The largest bolt forces observed were about 70 kN for a pre-tension of 50 kN. The change from the air-heated actuator to the water-heated actuator made the force-generation substantially faster. The maximum slopes for the bolt-force change were 0.5 kN/s for the water-heated actuator whereas the air-heated was by a decade slower.
The actuators always exhibited certain relaxation in the bolt force after first the heating-cooling loop following the bolt tightening. After the first loop, the bolt force returned to a lower tension than that to which it was tightened.
In terms of applicability, the nonlinear behavior of the SMA actuator poses challenges in design and control. The estimation of the forces generated cannot be very accurate without a force feedback. Observation of the force is also necessary because of unknown long-term behavior of SMA. These questions should be studied carefully before implementing the actuator in practice. Other questions to be solved are related to the availability and to the price. When designing the test system, the SMA material was not available in large dimensions or in large quantities and the price was relatively high. (The SMA sheets for the air-heated actuator cost about EUR 200.) Nevertheless, improvements in manufacturing technologies have been estimated to improve the availability of SMAs and to reduce their price.
The actuator lacks a returning function. Some tension always remained in the bolt. However, the experiments with water indicated better return than the experiments with air. This was due to the availability of cold water. The actuator was always tightened in a higher temperature than the actuator was at its coldest.
80
Provided that the mentioned challenges can be controlled, the SMA material is a potential solution for quasi-static control with relatively high force.
Acknowledgement
The work was carried out within I.P. Hercules TIP3-CT-2003-506676 funded by the European Union. The author wants to thank Mr. Kari Wichmann and Mr. Petri Kaarmila for their contribution during the experimental work.
References
1. Srinivasan, A. V. & McFarfland, D. M. Smart structures. Cambridge University Press. U.K. 2001. Pp. 2670. ISBN 0-521-65977-9.
2. Fuller, C. R., Elliot, S. J. & Nelson, P. A. Active control of vibration. Academic Press. London. 1996. 332 p. ISBN 0-12-269440-6.
3. Preumont, A. Vibration control of active structures. Kluwer Academic Publishers. Netherlands. 2002. 364 p. ISBN 1-4020-0925-9.
4. Gaul, L. & Nitsche, R. Friction control for vibration suppression. Mechanical Systems and Signal Processing. Academic Press. Vol. 14, 2000, pp. 139150.
5. Semi-active joints. Institute A of Mechanics, University of Stuttgart. http://www.mecha.uni-stuttgart.de/Forschung/forschung_adapstruk/ research_semia_joints.htm. Accessed on April 28, 2006.
6. Karnopp, D., Crosby, M. J. & Harwood, R. A. Vibration control using semi-active force generators. Journal of Engineering for Industry, Transactions of the ASME. Vol. 96, 1974, pp. 619626.
7. Vessonen, I. MR fluid-based damping force control for vehicle cabin vibration suppression. In: Vessonen, I. (ed.). VTT Symposium 225. Espoo. 2003. Pp. 6780. ISBN 951-38-6278-X; 951-38-6279-8. http://virtual.vtt.fi/inf/pdf/symposiums/2003/S225.pdf.

81
8. Memory-Metalle. http://www.memory-metalle.de/. Accessed on April 28, 2006.
9. Waram, T. Actuator design using Shape Memory Alloys. Canada. 1993. ISBN 0-9699428-0-X.
82
Gas phase synthesis of RuO2 nanorods
Unto Tapper1, Ulrika Backman1, Ari Auvinen1, Teemu Kärkelä1 & Jorma Jokiniemi1, 2
1VTT Technical Research Centre of Finland Biologinkuja 7, Espoo, P.O. Box 1000, FI-02044 VTT
2University of Kuopio, Department of Environmental Sciences, Fine Particle and Aerosol Technology Laboratory, P.O. Box 1627, 70211 Kuopio
Abstract
A simple chemical particle production route to produce RuO2 nanorods is introduced. In this method, RuO2 powder is used as a precursor and air as a carried gas. In high temperature oxidizing conditions, volatile Ru oxides are decomposed to monomers which grow into nanorods. The RuO2 particles typically consisted of high aspect ratio, high surface area RuO2 nanorods having well-defined 110 facets along the needle axis. The produced particles are expected to have good catalytic activity (e.g., in oxidation reactions).
Introduction
Since the discovery of the carbon nanotubes [1], production and synthesis of inorganic nanotubes, nanowires and nanorods with well-defined structural and electrical properties have attracted great scientific interest. Materials as semiconductors, metals, rare earths either as pure elements or as mixed compounds have been utilized to produce nanotubes or nanowires using different methods such as chemical vapor deposition or sol-gel reactions. Recently, successful synthesis of metal oxide nanotubes composed of TiO2, MoO3 and V2O5 have been reported. Here we report a simple aerosol method to produce nanosized RuO2 nanorods with a high aspect ratio and large surface area.
Transition metal oxides exhibit outstanding activity in a variety of applications of technological interest. Ruthenium dioxide (RuO2), with a tetragonal rutile structure, is one of the most studied and promising materials due to its ideal features: thermal stability, low temperature resistivity and excellent diffusion
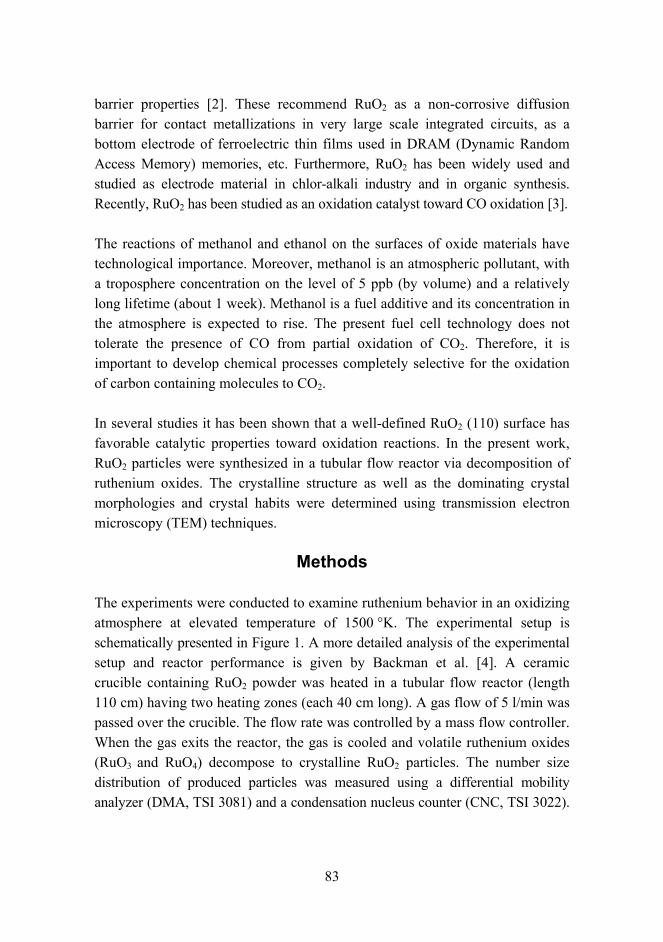
83
barrier properties [2]. These recommend RuO2 as a non-corrosive diffusion barrier for contact metallizations in very large scale integrated circuits, as a bottom electrode of ferroelectric thin films used in DRAM (Dynamic Random Access Memory) memories, etc. Furthermore, RuO2 has been widely used and studied as electrode material in chlor-alkali industry and in organic synthesis. Recently, RuO2 has been studied as an oxidation catalyst toward CO oxidation [3].
The reactions of methanol and ethanol on the surfaces of oxide materials have technological importance. Moreover, methanol is an atmospheric pollutant, with a troposphere concentration on the level of 5 ppb (by volume) and a relatively long lifetime (about 1 week). Methanol is a fuel additive and its concentration in the atmosphere is expected to rise. The present fuel cell technology does not tolerate the presence of CO from partial oxidation of CO2. Therefore, it is important to develop chemical processes completely selective for the oxidation of carbon containing molecules to CO2.
In several studies it has been shown that a well-defined RuO2 (110) surface has favorable catalytic properties toward oxidation reactions. In the present work, RuO2 particles were synthesized in a tubular flow reactor via decomposition of ruthenium oxides. The crystalline structure as well as the dominating crystal morphologies and crystal habits were determined using transmission electron microscopy (TEM) techniques.
Methods
The experiments were conducted to examine ruthenium behavior in an oxidizing atmosphere at elevated temperature of 1500 °K. The experimental setup is schematically presented in Figure 1. A more detailed analysis of the experimental setup and reactor performance is given by Backman et al. [4]. A ceramic crucible containing RuO2 powder was heated in a tubular flow reactor (length 110 cm) having two heating zones (each 40 cm long). A gas flow of 5 l/min was passed over the crucible. The flow rate was controlled by a mass flow controller. When the gas exits the reactor, the gas is cooled and volatile ruthenium oxides (RuO3 and RuO4) decompose to crystalline RuO2 particles. The number size distribution of produced particles was measured using a differential mobility analyzer (DMA, TSI 3081) and a condensation nucleus counter (CNC, TSI 3022).
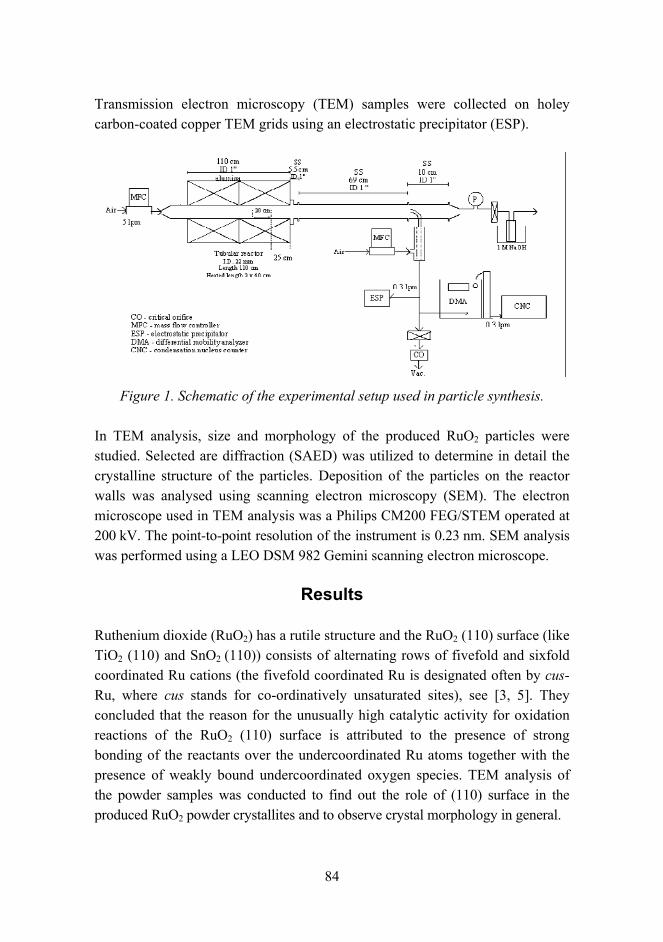
84
Transmission electron microscopy (TEM) samples were collected on holey carbon-coated copper TEM grids using an electrostatic precipitator (ESP).
Figure 1. Schematic of the experimental setup used in particle synthesis.
In TEM analysis, size and morphology of the produced RuO2 particles were studied. Selected are diffraction (SAED) was utilized to determine in detail the crystalline structure of the particles. Deposition of the particles on the reactor walls was analysed using scanning electron microscopy (SEM). The electron microscope used in TEM analysis was a Philips CM200 FEG/STEM operated at 200 kV. The point-to-point resolution of the instrument is 0.23 nm. SEM analysis was performed using a LEO DSM 982 Gemini scanning electron microscope.
Results
Ruthenium dioxide (RuO2) has a rutile structure and the RuO2 (110) surface (like TiO2 (110) and SnO2 (110)) consists of alternating rows of fivefold and sixfold coordinated Ru cations (the fivefold coordinated Ru is designated often by cus-Ru, where cus stands for co-ordinatively unsaturated sites), see [3, 5]. They concluded that the reason for the unusually high catalytic activity for oxidation reactions of the RuO2 (110) surface is attributed to the presence of strong bonding of the reactants over the undercoordinated Ru atoms together with the presence of weakly bound undercoordinated oxygen species. TEM analysis of the powder samples was conducted to find out the role of (110) surface in the produced RuO2 powder crystallites and to observe crystal morphology in general.
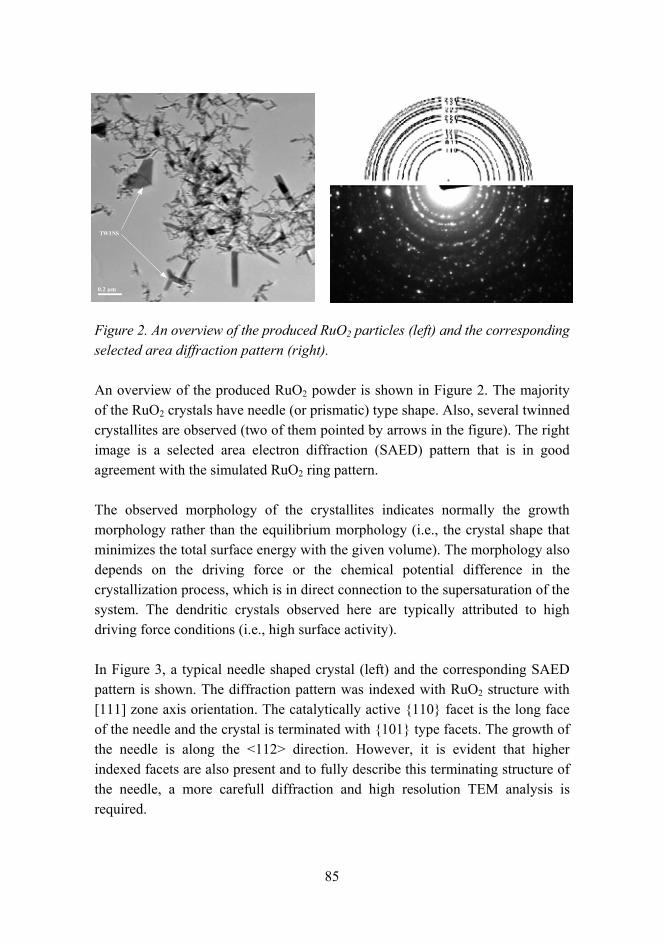
85
0.2 µm
TWINS
Figure 2. An overview of the produced RuO2 particles (left) and the corresponding selected area diffraction pattern (right).
An overview of the produced RuO2 powder is shown in Figure 2. The majority of the RuO2 crystals have needle (or prismatic) type shape. Also, several twinned crystallites are observed (two of them pointed by arrows in the figure). The right image is a selected area electron diffraction (SAED) pattern that is in good agreement with the simulated RuO2 ring pattern.
The observed morphology of the crystallites indicates normally the growth morphology rather than the equilibrium morphology (i.e., the crystal shape that minimizes the total surface energy with the given volume). The morphology also depends on the driving force or the chemical potential difference in the crystallization process, which is in direct connection to the supersaturation of the system. The dendritic crystals observed here are typically attributed to high driving force conditions (i.e., high surface activity).
In Figure 3, a typical needle shaped crystal (left) and the corresponding SAED pattern is shown. The diffraction pattern was indexed with RuO2 structure with [111] zone axis orientation. The catalytically active 110 facet is the long face of the needle and the crystal is terminated with 101 type facets. The growth of the needle is along the <112> direction. However, it is evident that higher indexed facets are also present and to fully describe this terminating structure of the needle, a more carefull diffraction and high resolution TEM analysis is required.
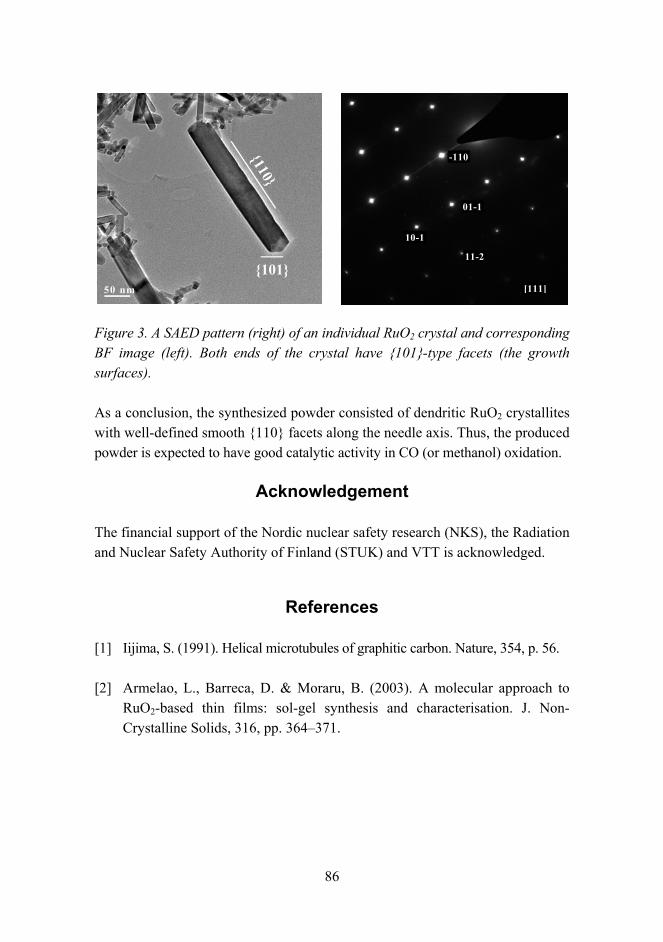
86
50 nm
101
110
01-1
10-1
-110
11-2
[111]
Figure 3. A SAED pattern (right) of an individual RuO2 crystal and corresponding BF image (left). Both ends of the crystal have 101-type facets (the growth surfaces).
As a conclusion, the synthesized powder consisted of dendritic RuO2 crystallites with well-defined smooth 110 facets along the needle axis. Thus, the produced powder is expected to have good catalytic activity in CO (or methanol) oxidation.
Acknowledgement
The financial support of the Nordic nuclear safety research (NKS), the Radiation and Nuclear Safety Authority of Finland (STUK) and VTT is acknowledged.
References
[1] Iijima, S. (1991). Helical microtubules of graphitic carbon. Nature, 354, p. 56.
[2] Armelao, L., Barreca, D. & Moraru, B. (2003). A molecular approach to RuO2-based thin films: sol-gel synthesis and characterisation. J. Non-Crystalline Solids, 316, pp. 364371.
87
[3] Madhavaram, H., Idriss, H., Wendt, S., Kim, Y. D., Knapp, M., Over, H., Assmann, J., Löffler, E. & Muhler, M. (2001). Oxidation reactions over RuO2: A comparative study of the reactivity of the (110) single crystal and polycrystalline surfaces. J. Catal., 202, pp. 296307.
[4] Backman, U., Lipponen, M., Auvinen, A., Tapper, U., Zilliacus, R. & Jokiniemi, J. K. (2005). On the transport and speciation of ruthenium in high oxidising conditions. Radiochim. Acta, Vol. 93, pp. 297304.
[5] Wang, J., Fan, C.Y., Jacobi, K. & Ertl, G. (2002). The kinetics of CO oxidation on RuO2(110): Bridging the pressure gap. J. Phys. Chem. B, 106, pp. 34223427.
88
Ferroelectric materials and thin film processing for electro-optic modulators
Jussi Hiltunen & Jarkko Tuominen
VTT Technical Research Centre of Finland Kaitoväylä 1, Oulu, P.O. Box 1100, FI-90571 Oulu
Abstract
Highly oriented BaTiO3 based thin films have been grown with pulsed laser deposition technique on single crystal MgO (001) substrates. The structural, dielectric and optical properties have been characterized with x-ray diffraction, an atomic-force-microscope, prism coupling and impedance studies. Thin film deposition parameters have been optimized to grow optical quality ferroelectric thin films with controllable crystal orientation and birefringence. The crystal lattice tetragonal distortion was found to be controllable by adjusting the deposition conditions. The waveguide manufacturing process was developed to fabricate active optical waveguides based on BaTiO3 and an effective electro-optic coefficient of 25 pm/V was determined.
Introduction
Ferroelectric materials have been studied intensively due to their excellent functional properties, such as electro-optic effect, piezoelectricity and acousto-optic effect. Their properties offer a wide variety of applications in microelectronics, micromechanics and microoptics. The current active optical guided wave structures are mainly implemented in inorganic LiNbO3 crystals. These devices require complex and expensive manufacturing processes, which causes limitations in applicability. The current demands of increased integration degree with cost efficient device fabrication can be achieved using thin film based technologies. [1, 2] In bulk ceramic form, these materials possess many superior optical properties, but application in thin-film structures necessitates intense research of material properties and processing technologies. We report the thin-film processing development of ferroelectric BaTiO3. In bulk form its properties are well studied, but in thin-film form the properties can be quite
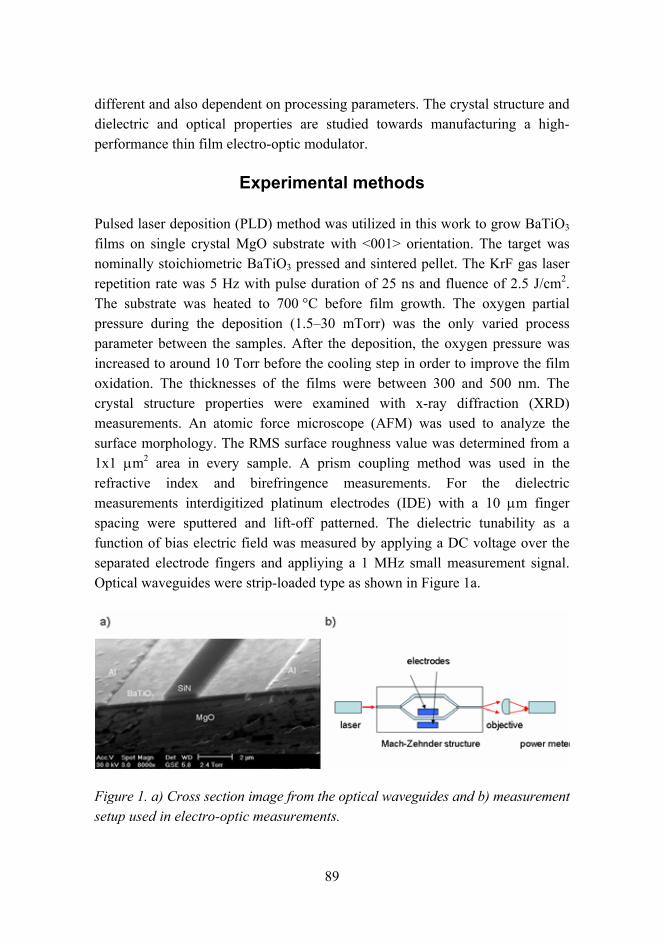
89
different and also dependent on processing parameters. The crystal structure and dielectric and optical properties are studied towards manufacturing a high-performance thin film electro-optic modulator.
Experimental methods
Pulsed laser deposition (PLD) method was utilized in this work to grow BaTiO3 films on single crystal MgO substrate with <001> orientation. The target was nominally stoichiometric BaTiO3 pressed and sintered pellet. The KrF gas laser repetition rate was 5 Hz with pulse duration of 25 ns and fluence of 2.5 J/cm2. The substrate was heated to 700 °C before film growth. The oxygen partial pressure during the deposition (1.530 mTorr) was the only varied process parameter between the samples. After the deposition, the oxygen pressure was increased to around 10 Torr before the cooling step in order to improve the film oxidation. The thicknesses of the films were between 300 and 500 nm. The crystal structure properties were examined with x-ray diffraction (XRD) measurements. An atomic force microscope (AFM) was used to analyze the surface morphology. The RMS surface roughness value was determined from a 1x1 µm2 area in every sample. A prism coupling method was used in the refractive index and birefringence measurements. For the dielectric measurements interdigitized platinum electrodes (IDE) with a 10 µm finger spacing were sputtered and lift-off patterned. The dielectric tunability as a function of bias electric field was measured by applying a DC voltage over the separated electrode fingers and appliying a 1 MHz small measurement signal. Optical waveguides were strip-loaded type as shown in Figure 1a.
Figure 1. a) Cross section image from the optical waveguides and b) measurement setup used in electro-optic measurements.
90
SiN guiding structure was plasma-enhanced chemical vapor deposited (PECVD) and patterned with lithographic and reactive ion etching (RIE) methods. The operation of the waveguides was confirmed by launching laser source TE polarized 1550 nm light from the input fiber into the device and examining the localization of the guided wave intensity at the output facet with an infrared camera. The electro-optic properties were studied with a waveguide Mach-Zehnder interferometer test structure shown in Figure 1b. The Al electrodes adjacent to the active arm were e-beam evaporated and patterned with lithographic and wet ethcing methods. The length and the separation of the electrodes were 3 mm and 1015 µm, respectively. During the electro-optic measurements, a voltage sweep was applied over the electrodes and the light intensity was monitored with a light power meter.
Results and discussion
Crystal, optical and dielectric properties
According to the XRD measurements, the crystal structure of the BaTiO3 (BT) films was showed to depend strongly on the oxygen partial pressure during the deposition. With a low pressure (< 10 mTorr), BT films grew strongly c-axis oriented. This was also noticed in birefringence value, which is defined as a refractive index difference between the horizontal and vertical direction. When in-plane lattice parameter is smaller than out-of-plane value, the reduced ion distance in the horizontal direction compared to the vertical direction causes the birefringence to be positive. The birefringence value and the tetragonal crystal distortion from a cubic lattice defined as (in-plane out-of-plane)/in-plane is shown in Figure 2. When the oxygen pressure increases, the distortion decreases along with the birefringence. When the pressure is increased to 20 mTorr the sign of the distortion changes indicating the 90-degree reorientation of the tetragonal unit cell. The change in the sign of the birefringence also correlates well with the XRD measurements.
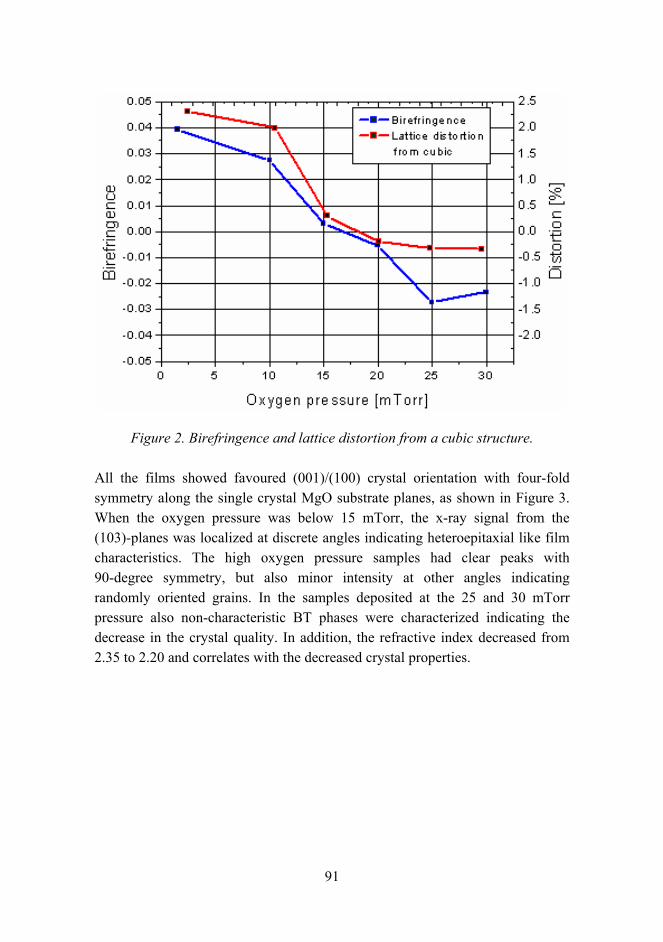
91
Figure 2. Birefringence and lattice distortion from a cubic structure.
All the films showed favoured (001)/(100) crystal orientation with four-fold symmetry along the single crystal MgO substrate planes, as shown in Figure 3. When the oxygen pressure was below 15 mTorr, the x-ray signal from the (103)-planes was localized at discrete angles indicating heteroepitaxial like film characteristics. The high oxygen pressure samples had clear peaks with 90-degree symmetry, but also minor intensity at other angles indicating randomly oriented grains. In the samples deposited at the 25 and 30 mTorr pressure also non-characteristic BT phases were characterized indicating the decrease in the crystal quality. In addition, the refractive index decreased from 2.35 to 2.20 and correlates with the decreased crystal properties.
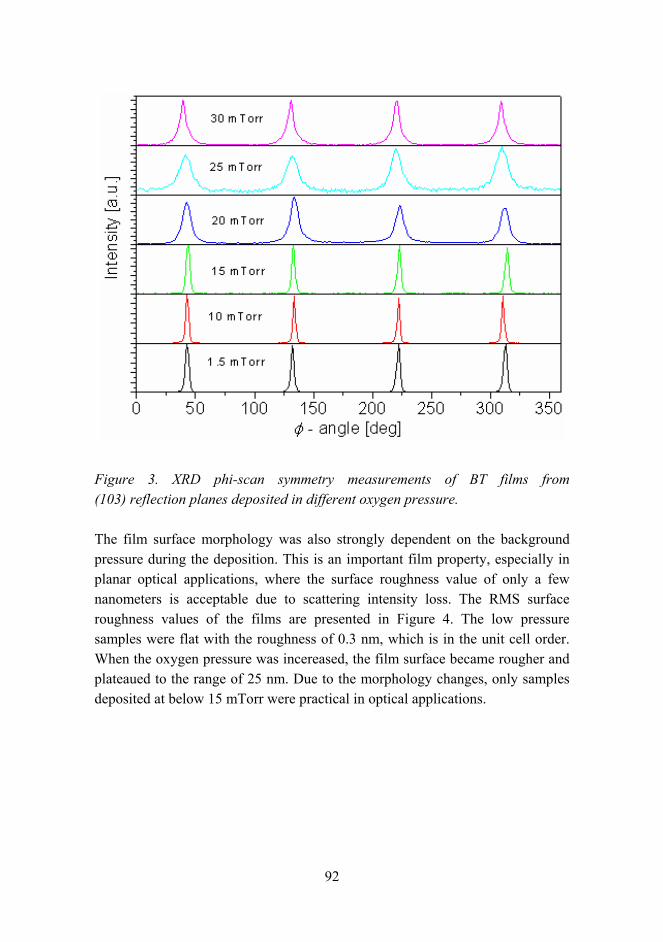
92
Figure 3. XRD phi-scan symmetry measurements of BT films from (103) reflection planes deposited in different oxygen pressure.
The film surface morphology was also strongly dependent on the background pressure during the deposition. This is an important film property, especially in planar optical applications, where the surface roughness value of only a few nanometers is acceptable due to scattering intensity loss. The RMS surface roughness values of the films are presented in Figure 4. The low pressure samples were flat with the roughness of 0.3 nm, which is in the unit cell order. When the oxygen pressure was incereased, the film surface became rougher and plateaued to the range of 25 nm. Due to the morphology changes, only samples deposited at below 15 mTorr were practical in optical applications.
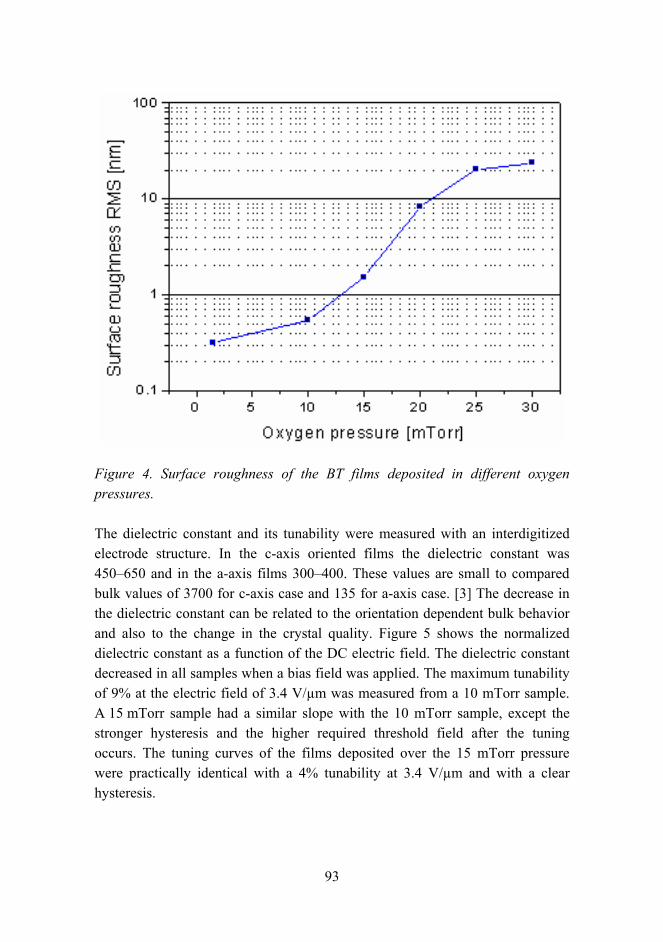
93
Figure 4. Surface roughness of the BT films deposited in different oxygen pressures.
The dielectric constant and its tunability were measured with an interdigitized electrode structure. In the c-axis oriented films the dielectric constant was 450650 and in the a-axis films 300400. These values are small to compared bulk values of 3700 for c-axis case and 135 for a-axis case. [3] The decrease in the dielectric constant can be related to the orientation dependent bulk behavior and also to the change in the crystal quality. Figure 5 shows the normalized dielectric constant as a function of the DC electric field. The dielectric constant decreased in all samples when a bias field was applied. The maximum tunability of 9% at the electric field of 3.4 V/µm was measured from a 10 mTorr sample. A 15 mTorr sample had a similar slope with the 10 mTorr sample, except the stronger hysteresis and the higher required threshold field after the tuning occurs. The tuning curves of the films deposited over the 15 mTorr pressure were practically identical with a 4% tunability at 3.4 V/µm and with a clear hysteresis.
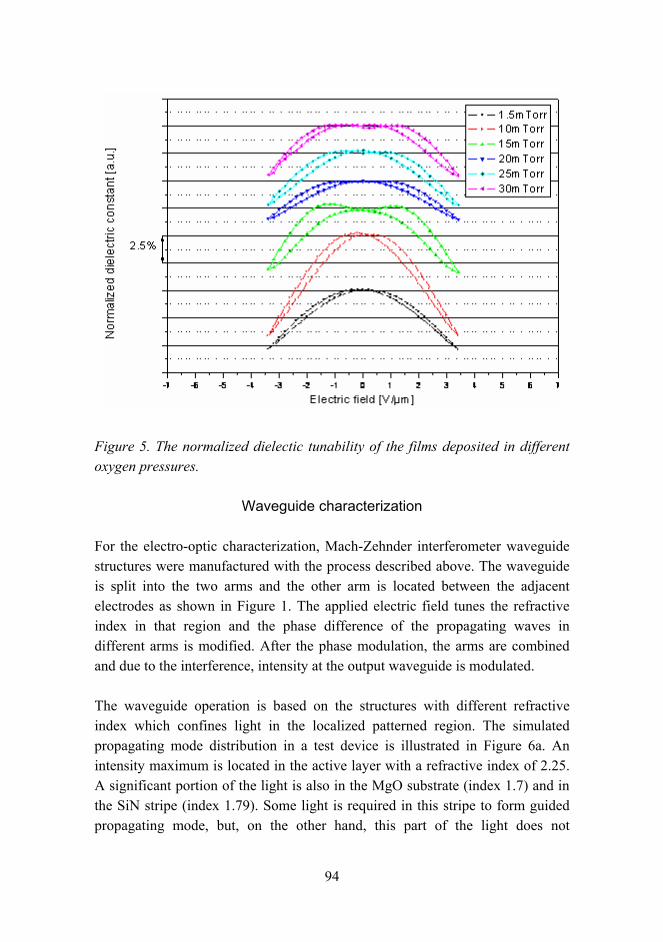
94
Figure 5. The normalized dielectic tunability of the films deposited in different oxygen pressures.
Waveguide characterization
For the electro-optic characterization, Mach-Zehnder interferometer waveguide structures were manufactured with the process described above. The waveguide is split into the two arms and the other arm is located between the adjacent electrodes as shown in Figure 1. The applied electric field tunes the refractive index in that region and the phase difference of the propagating waves in different arms is modified. After the phase modulation, the arms are combined and due to the interference, intensity at the output waveguide is modulated.
The waveguide operation is based on the structures with different refractive index which confines light in the localized patterned region. The simulated propagating mode distribution in a test device is illustrated in Figure 6a. An intensity maximum is located in the active layer with a refractive index of 2.25. A significant portion of the light is also in the MgO substrate (index 1.7) and in the SiN stripe (index 1.79). Some light is required in this stripe to form guided propagating mode, but, on the other hand, this part of the light does not
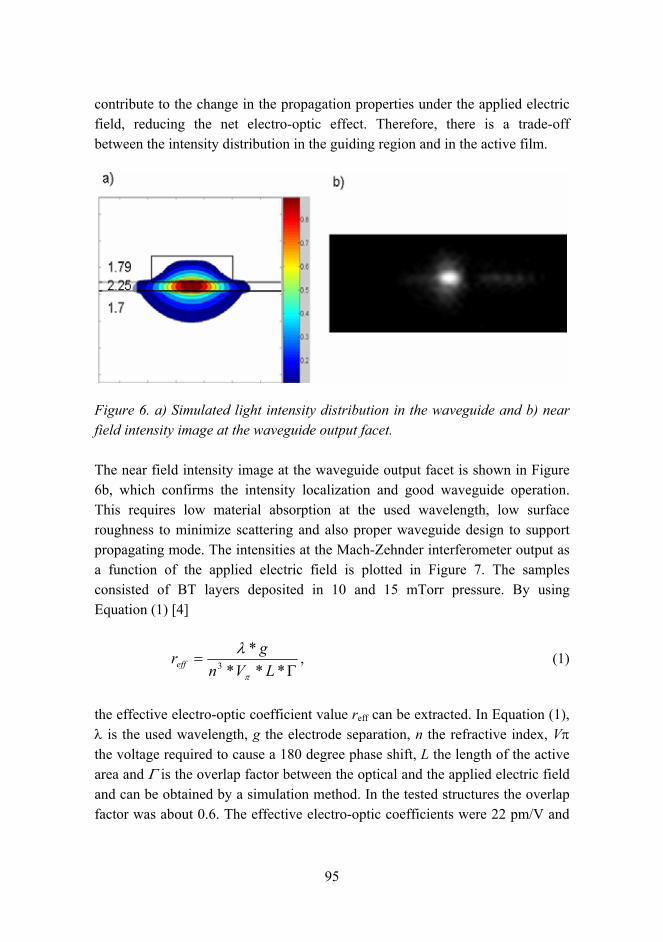
95
contribute to the change in the propagation properties under the applied electric field, reducing the net electro-optic effect. Therefore, there is a trade-off between the intensity distribution in the guiding region and in the active film.
Figure 6. a) Simulated light intensity distribution in the waveguide and b) near field intensity image at the waveguide output facet.
The near field intensity image at the waveguide output facet is shown in Figure 6b, which confirms the intensity localization and good waveguide operation. This requires low material absorption at the used wavelength, low surface roughness to minimize scattering and also proper waveguide design to support propagating mode. The intensities at the Mach-Zehnder interferometer output as a function of the applied electric field is plotted in Figure 7. The samples consisted of BT layers deposited in 10 and 15 mTorr pressure. By using Equation (1) [4]
Γ=
****
3 LVngreff
π
λ, (1)
the effective electro-optic coefficient value reff can be extracted. In Equation (1), λ is the used wavelength, g the electrode separation, n the refractive index, Vπ the voltage required to cause a 180 degree phase shift, L the length of the active area and Γ is the overlap factor between the optical and the applied electric field and can be obtained by a simulation method. In the tested structures the overlap factor was about 0.6. The effective electro-optic coefficients were 22 pm/V and
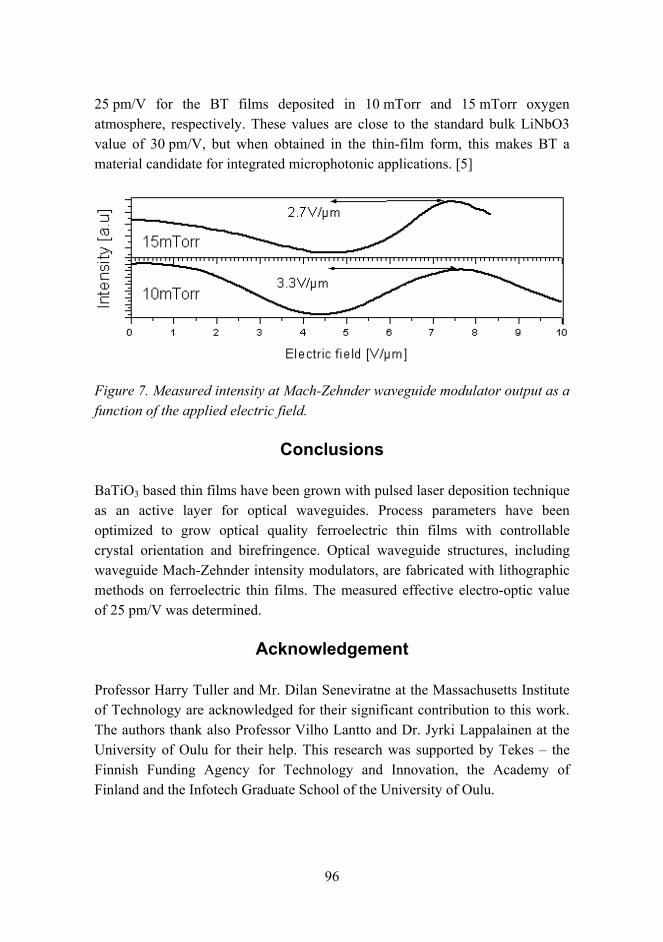
96
25 pm/V for the BT films deposited in 10 mTorr and 15 mTorr oxygen atmosphere, respectively. These values are close to the standard bulk LiNbO3 value of 30 pm/V, but when obtained in the thin-film form, this makes BT a material candidate for integrated microphotonic applications. [5]
Figure 7. Measured intensity at Mach-Zehnder waveguide modulator output as a function of the applied electric field.
Conclusions
BaTiO3 based thin films have been grown with pulsed laser deposition technique as an active layer for optical waveguides. Process parameters have been optimized to grow optical quality ferroelectric thin films with controllable crystal orientation and birefringence. Optical waveguide structures, including waveguide Mach-Zehnder intensity modulators, are fabricated with lithographic methods on ferroelectric thin films. The measured effective electro-optic value of 25 pm/V was determined.
Acknowledgement
Professor Harry Tuller and Mr. Dilan Seneviratne at the Massachusetts Institute of Technology are acknowledged for their significant contribution to this work. The authors thank also Professor Vilho Lantto and Dr. Jyrki Lappalainen at the University of Oulu for their help. This research was supported by Tekes the Finnish Funding Agency for Technology and Innovation, the Academy of Finland and the Infotech Graduate School of the University of Oulu.
97
Reference list
1. Lines, M. E. & Glass, A. M. Principles and Applications of Ferroelectric and Related Materials. Oxford University Press, 1977. ISBN 0-19-850778.
2. Petraru, A., Schubert, J., Schmid, M. & Buchal, C. Ferroelectric BaTiO3 thin-film waveguide modulators. Applied Physics Letters, 2002, Vol. 81, No. 8, pp. 13751377.
3. MTI Corporation, BaTiO3 datasheet.
4. Tang, P., Towner, D. J., Meier, A. L. & Wessels, B. W. Low-Loss Electrooptic BaTiO3 Thin Film Waveguide Modulator. Photonics Technology Letters, Vol. 16, No. 8, 2004, pp. 18371839.
5. Yariv, A. & Yeh, P. Optical Waves in Crystals. Wiley-Interscience, 2003. ISBN 0-471-43081-1.
98
An overview of applications of biomolecules in the functionalization of materials
Markus Linder & Tarja Nevanen
VTT Technical Research Centre of Finland Tietotie 2, P.O. Box 1000, FI-02044 VTT
Introduction
By using properties of biomolecules such as self-assembly and molecular recognition, a biological approach to materials design can be taken. Usually biomolecules (e.g., proteins and lipids) are not associated with the properties desired in materials such as durability, strength, and stability. However, nature provides us with a magnitude of materials which have excellent properties, bone, wood or mussel shells being just a few examples. So far, the problem has been how to mimic these properties. In recent years the advance of biotechnology has given much more detail on how biological structures are built as well as the tools to produce and modify biological molecules. In our work we show how properties such as molecular recognition, adhesion behavior or self assembly can be used in combination with conjugation to other structures such as inorganic supports or polymers in making materials or components of materials. These materials gain properties such as specific permeability or interactions with specific compounds. In other cases biomolecules can be used in combination with non-biological nanostructures as templates or carriers to achieve control of the materials structure at the molecular level. The properties of biomolecules are determined by their structure. In protein a set of only 20 amino acids are needed to obtain an incredibly large variation of functionality. A property that is very important to make this function is that biomolecules typically have highly defined sizes and co-formational shapes that correspond to their functions.
These are properties that are only starting to become possible in man-made materials. To learn about how man-made materials can be designed in the future, a useful line of research is to try to use biomolecules as components in materials. In this overview we illustrate this by two examples: one is the making of hybrid materials in which molecules are made where one part is formed by a synthetic
99
molecule and the other part by a biological molecule. In the second example, biomolecules are inserted into a nanostructured material to give it new properties.
Dendron hydrophobin conjugates
In this work dendritic macromolecules that bind DNA were fused to hydrophobin-proteins that bind to surfaces [1]. The dendrimers that were used were based polyamines with surface spermine surface groups. The core of the dendrimer was linked to a single maleimide group that offered a route towards bioconjugation to biomolecules. Due to the high amine multivalency of the dendrimer, it has a high affinity to DNA as an anionic polymer. The binding affinity of the component spermine is in comparison only a fraction. For the purpose of this work, it was also significant that the dendron part of the molecule has a defined size, due to the building block strategy. For the protein used in conjugation, a member of the hydrophobin type of protein was selected. The biological property that was interesting for this particular example was the self assembly of hydrophobins onto various surfaces. A single sulfhydryl containing cysteinyl residue was added to the N-terminus of the HFBI hydrophobin. The recombinant protein was expressed and purified. It was shown that it was possible to purify a homogenous sample of protein that contained the single added cysteinyl group in its free SH form. The reaction between the maleimide conjugated dendron and the SH-conjugated hydrophobin was performed and the conjugate was purified by chromatography. The subsequent characterization showed that a hybrid molecule has been formed where dendrimer and protein was conjugated in exactly a 1:1 ratio. The mass spectra and analytical chromatography both showed single peaks, indicating a pure homogenous sample. Furthermore both parts of the new hybrid molecule retained their properties. The hydrophobin part bound to surfaces in a way similar to the wild-type. The dendron part of the hybrid molecule showed undiminished binding to DNA. The functionality of the hybrid molecule was demonstrated using a quartz microbalance with a polystyrene surface. As expected the hybrid molecule assembled at the polystyrene surface forming a protein monolayer. When DNA was flushed over this surface a clear binding was noted. Thus it had been demonstrated that structurally highly defined molecules can be produced. This demonstrates a route for materials where functionality is partly obtained form specific molecular interactions of biomolecules and partly from interactions of
100
synthetic components. A layer-by-layer approach to building highly defied structures on the materials surface was possible using the combination of molecular recognition and precise molecular engineering.
Membranes for facilitated diffusion
Membranes with uniform nanopores have interesting properties for biochemical catalysis, separations and sensors, for example. We have shown in collaboration with Prof. Martins group (University of Florida) that enantiomers of a chiral compound can be separated using a membrane with immobilised enantiomer specific antibodies in the nanopores [2]. The separation depends on a nanoscale phenomenon called facilitated diffusion that occurs when the pores are modified by, for example, antibodies having affinity with the target molecule.
Recombinant antibody fragments that have specificity to one enantiomeric form (RS) of a chiral drug were prepared. Using conventional affinity chromatography it was shown that the antibody selectively purified the RS enantiomer. In the partition chromatography setup the RS enantiomer was retarded. In membrane study the antibody fragments were immobilized in 2035 nanometre sized pores in alumina membranes that had been coated using a sol-gel method. The pores were uniform and extended through the membranes. In diffusion experiments, a racemic mixture of drug (RS and SR) was added to one side of the membrane, while the diffusion over to the other side of the membrane was followed. Remarkably, the RS enantiomer recognized by the antibody was transported preferentially over the membrane. The phenomenon is attributed to facilitated diffusion and occurs apparently because of a concentration increase of the recognized molecule in the immediate vicinity of the membrane. What is noteworthy is that the nanoscale environment in the membrane reversed the behavior of the RS molecule from being retained to being transported.
Conclusions
Especially engineering of materials properties at interfaces and in materials with features of nanometre range are attractive for studying the combination of biological and man-made materials. The combination of function, structure and overall architecture can lead to interfaces with properties that are not attainable otherwise. It is likely that such interface engineering will be the first application
101
area where combinations of synthetic and biologically based materials will find practical use. By using several levels of hierarchical organization more complexity can be added. This can result in stimuli responsive structures. Applications are expected in, for example, drug delivery, bioseparation, food technology, and biosensors.
References
1. Kostiainen, M. A. & Szilvay, G. R. et al. (2006). Multivalent dendrons for high-affinity adhesion of proteins to DNA. Angewandte Chemie International Edition 45, pp. 35383542.
2. Lee, S. B. & Mitchell, D. T. et al. (2002). Antibody-Based Bio-Nanotube Membranes for Enantiomeric Drug Separations. Science 296(5576), pp. 21982200.
102
New fatty acid-based binders and applications
Salme Koskimies, Nina Heiskanen, Janne Hulkko & Pia Willberg
VTT Technical Research Centre of Finland Biologinkuja 7, Espoo, P.O. Box 1000, FI-02044 VTT
Abstract
Development of environmentally benign products and technologies has become increasingly interesting during recent years because of health and environmental aspects as well as recent environmental legislation. Many valuable intermediates and products can be produced via modification of natural fatty acids and oils. These renewable raw materials are highly attractive for ecological reasons.
In this paper, new feasible options to produce environmentally friendly products and polymers from renewable fatty acids are discussed. Different methods of production, properties and applications of intermediates and binders under development are described. Especially work toward self-emulsifying, air-drying alkyd binders for coating applications is presented. In addition, possibilities to utilize fatty acid-based polymers in new applications, such as composites, are briefly introduced.
Introduction
Alkyd emulsions are group of binders which are gaining growing research interest because it combines the technical advantages of alkyd resins with the environmental and health advantages of solvent free coatings [1][5]. In this paper, we present our recent studies to develop environmentally friendly waterborne alkyd binders for coating applications. Our primary raw material for the modified alkyd binders has been refined tall oil fatty acids, known as TOFA. It is a valuable raw material for the paint and coating industry since it has good drying properties. An additional advantage of TOFA is that it is a by-product from the pulp industry derived from Northern trees.
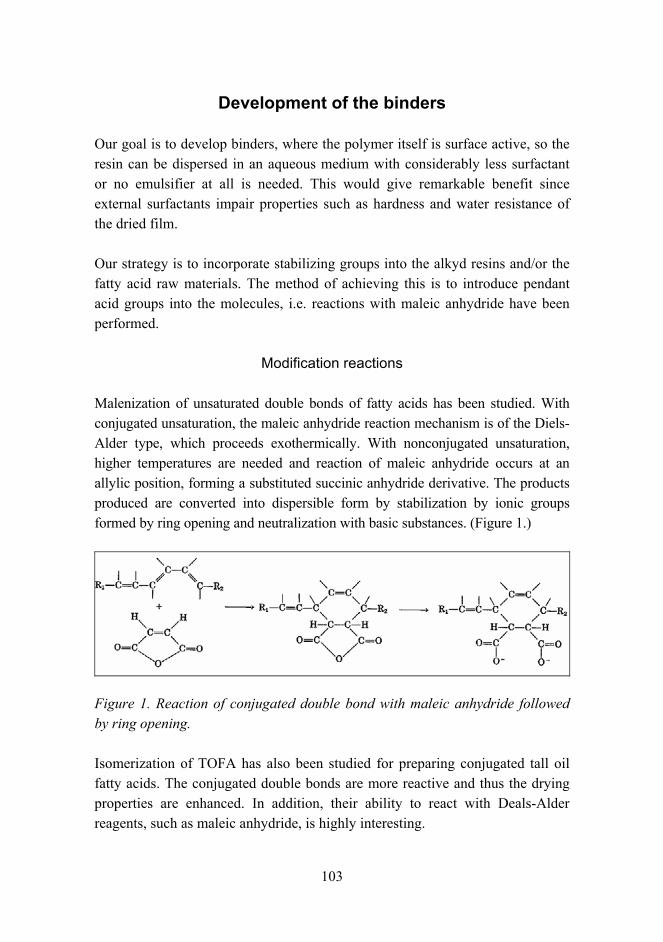
103
Development of the binders
Our goal is to develop binders, where the polymer itself is surface active, so the resin can be dispersed in an aqueous medium with considerably less surfactant or no emulsifier at all is needed. This would give remarkable benefit since external surfactants impair properties such as hardness and water resistance of the dried film.
Our strategy is to incorporate stabilizing groups into the alkyd resins and/or the fatty acid raw materials. The method of achieving this is to introduce pendant acid groups into the molecules, i.e. reactions with maleic anhydride have been performed.
Modification reactions
Malenization of unsaturated double bonds of fatty acids has been studied. With conjugated unsaturation, the maleic anhydride reaction mechanism is of the Diels-Alder type, which proceeds exothermically. With nonconjugated unsaturation, higher temperatures are needed and reaction of maleic anhydride occurs at an allylic position, forming a substituted succinic anhydride derivative. The products produced are converted into dispersible form by stabilization by ionic groups formed by ring opening and neutralization with basic substances. (Figure 1.)
Figure 1. Reaction of conjugated double bond with maleic anhydride followed by ring opening.
Isomerization of TOFA has also been studied for preparing conjugated tall oil fatty acids. The conjugated double bonds are more reactive and thus the drying properties are enhanced. In addition, their ability to react with Deals-Alder reagents, such as maleic anhydride, is highly interesting.
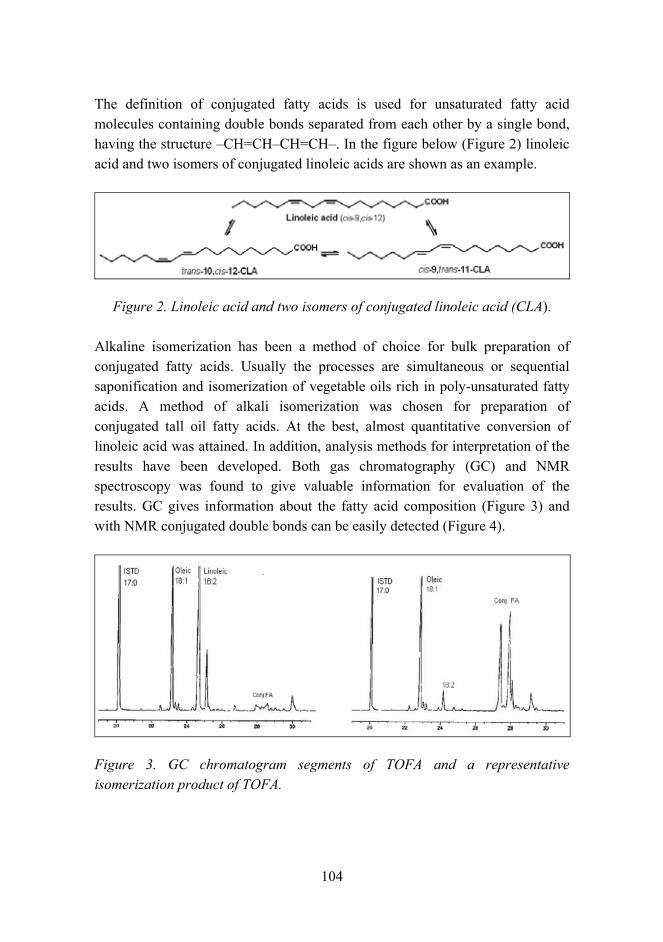
104
The definition of conjugated fatty acids is used for unsaturated fatty acid molecules containing double bonds separated from each other by a single bond, having the structure CH=CHCH=CH. In the figure below (Figure 2) linoleic acid and two isomers of conjugated linoleic acids are shown as an example.
Figure 2. Linoleic acid and two isomers of conjugated linoleic acid (CLA).
Alkaline isomerization has been a method of choice for bulk preparation of conjugated fatty acids. Usually the processes are simultaneous or sequential saponification and isomerization of vegetable oils rich in poly-unsaturated fatty acids. A method of alkali isomerization was chosen for preparation of conjugated tall oil fatty acids. At the best, almost quantitative conversion of linoleic acid was attained. In addition, analysis methods for interpretation of the results have been developed. Both gas chromatography (GC) and NMR spectroscopy was found to give valuable information for evaluation of the results. GC gives information about the fatty acid composition (Figure 3) and with NMR conjugated double bonds can be easily detected (Figure 4).
Figure 3. GC chromatogram segments of TOFA and a representative isomerization product of TOFA.
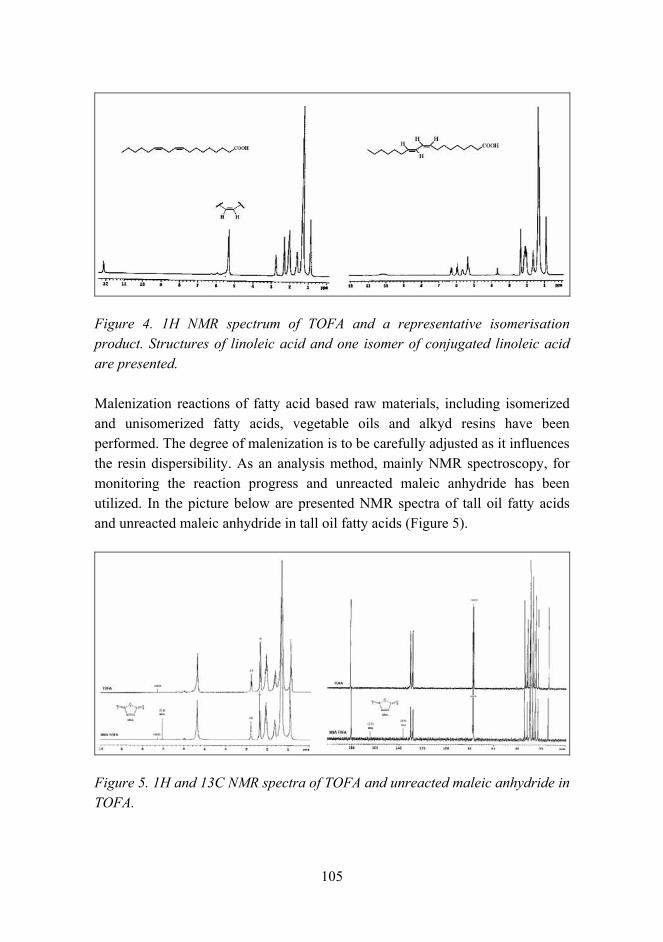
105
Figure 4. 1H NMR spectrum of TOFA and a representative isomerisation product. Structures of linoleic acid and one isomer of conjugated linoleic acid are presented.
Malenization reactions of fatty acid based raw materials, including isomerized and unisomerized fatty acids, vegetable oils and alkyd resins have been performed. The degree of malenization is to be carefully adjusted as it influences the resin dispersibility. As an analysis method, mainly NMR spectroscopy, for monitoring the reaction progress and unreacted maleic anhydride has been utilized. In the picture below are presented NMR spectra of tall oil fatty acids and unreacted maleic anhydride in tall oil fatty acids (Figure 5).
Figure 5. 1H and 13C NMR spectra of TOFA and unreacted maleic anhydride in TOFA.
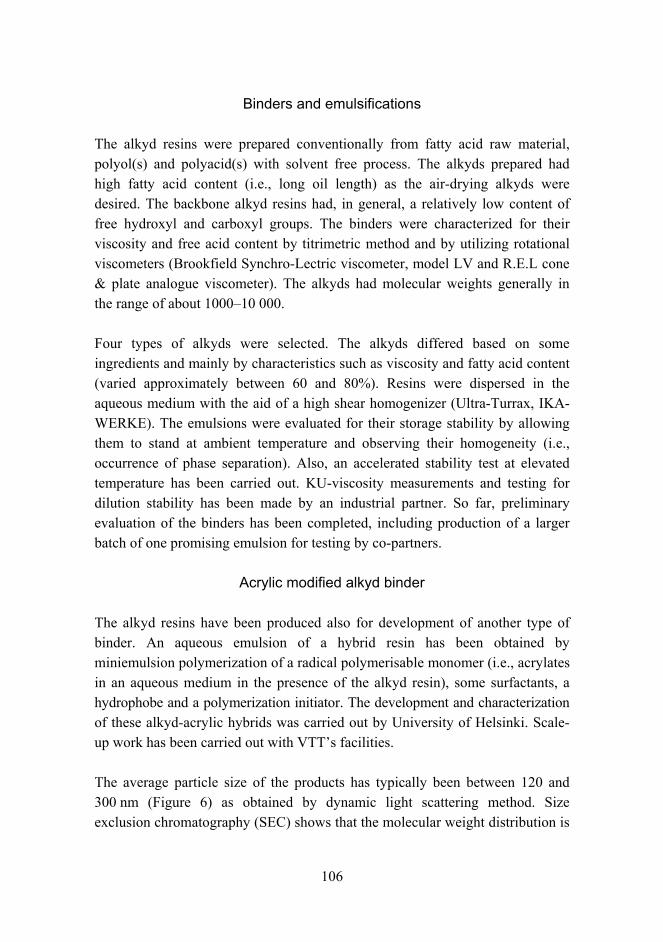
106
Binders and emulsifications
The alkyd resins were prepared conventionally from fatty acid raw material, polyol(s) and polyacid(s) with solvent free process. The alkyds prepared had high fatty acid content (i.e., long oil length) as the air-drying alkyds were desired. The backbone alkyd resins had, in general, a relatively low content of free hydroxyl and carboxyl groups. The binders were characterized for their viscosity and free acid content by titrimetric method and by utilizing rotational viscometers (Brookfield Synchro-Lectric viscometer, model LV and R.E.L cone & plate analogue viscometer). The alkyds had molecular weights generally in the range of about 100010 000.
Four types of alkyds were selected. The alkyds differed based on some ingredients and mainly by characteristics such as viscosity and fatty acid content (varied approximately between 60 and 80%). Resins were dispersed in the aqueous medium with the aid of a high shear homogenizer (Ultra-Turrax, IKA-WERKE). The emulsions were evaluated for their storage stability by allowing them to stand at ambient temperature and observing their homogeneity (i.e., occurrence of phase separation). Also, an accelerated stability test at elevated temperature has been carried out. KU-viscosity measurements and testing for dilution stability has been made by an industrial partner. So far, preliminary evaluation of the binders has been completed, including production of a larger batch of one promising emulsion for testing by co-partners.
Acrylic modified alkyd binder
The alkyd resins have been produced also for development of another type of binder. An aqueous emulsion of a hybrid resin has been obtained by miniemulsion polymerization of a radical polymerisable monomer (i.e., acrylates in an aqueous medium in the presence of the alkyd resin), some surfactants, a hydrophobe and a polymerization initiator. The development and characterization of these alkyd-acrylic hybrids was carried out by University of Helsinki. Scale-up work has been carried out with VTTs facilities.
The average particle size of the products has typically been between 120 and 300 nm (Figure 6) as obtained by dynamic light scattering method. Size exclusion chromatography (SEC) shows that the molecular weight distribution is
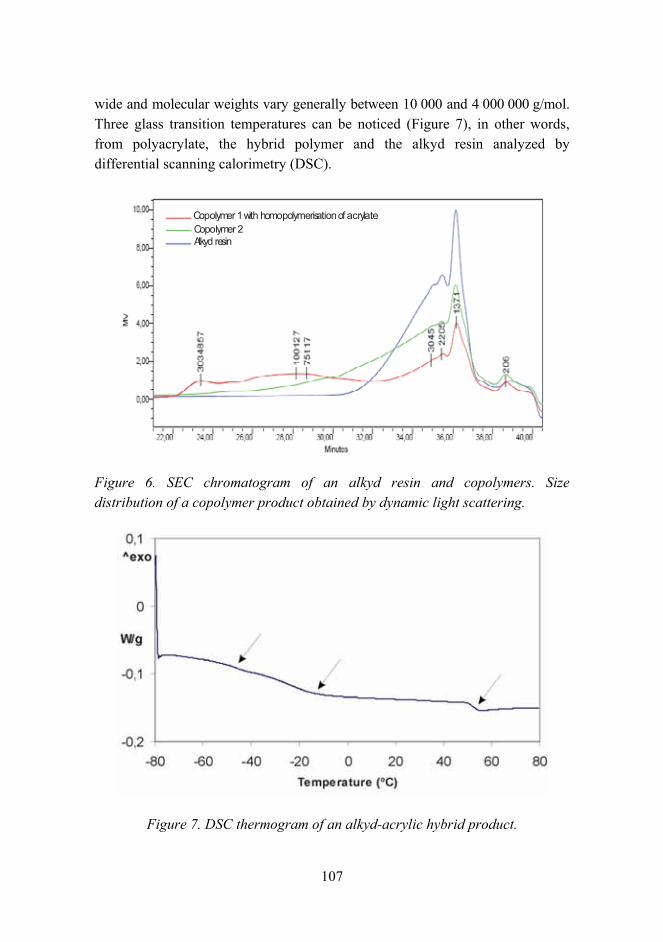
107
wide and molecular weights vary generally between 10 000 and 4 000 000 g/mol. Three glass transition temperatures can be noticed (Figure 7), in other words, from polyacrylate, the hybrid polymer and the alkyd resin analyzed by differential scanning calorimetry (DSC).
Alkyd resinCopolymer 2Copolymer 1 with homopolymerisation of acrylate
Figure 6. SEC chromatogram of an alkyd resin and copolymers. Size distribution of a copolymer product obtained by dynamic light scattering.
Figure 7. DSC thermogram of an alkyd-acrylic hybrid product.
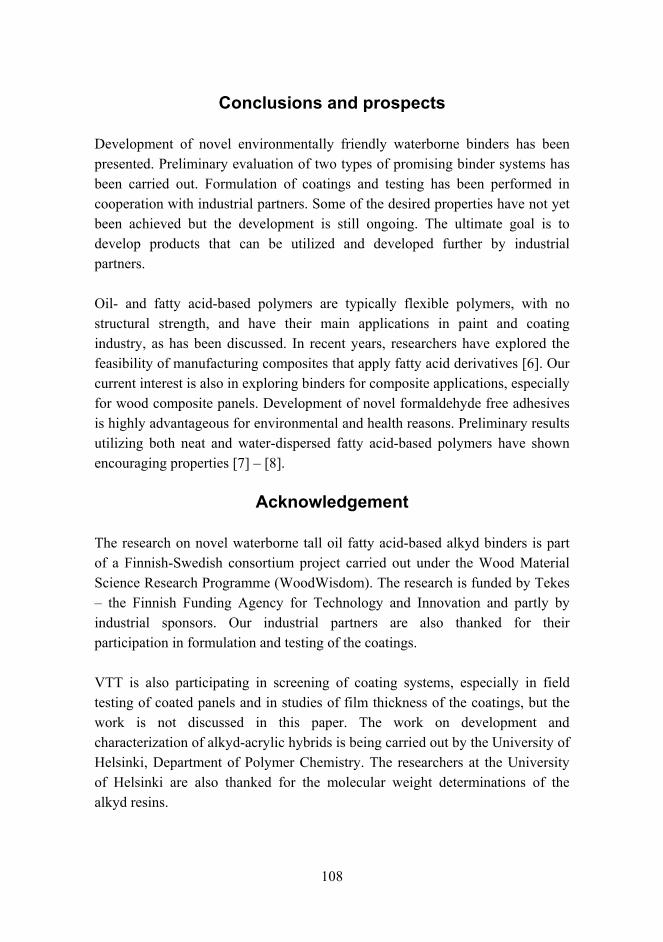
108
Conclusions and prospects
Development of novel environmentally friendly waterborne binders has been presented. Preliminary evaluation of two types of promising binder systems has been carried out. Formulation of coatings and testing has been performed in cooperation with industrial partners. Some of the desired properties have not yet been achieved but the development is still ongoing. The ultimate goal is to develop products that can be utilized and developed further by industrial partners.
Oil- and fatty acid-based polymers are typically flexible polymers, with no structural strength, and have their main applications in paint and coating industry, as has been discussed. In recent years, researchers have explored the feasibility of manufacturing composites that apply fatty acid derivatives [6]. Our current interest is also in exploring binders for composite applications, especially for wood composite panels. Development of novel formaldehyde free adhesives is highly advantageous for environmental and health reasons. Preliminary results utilizing both neat and water-dispersed fatty acid-based polymers have shown encouraging properties [7] [8].
Acknowledgement
The research on novel waterborne tall oil fatty acid-based alkyd binders is part of a Finnish-Swedish consortium project carried out under the Wood Material Science Research Programme (WoodWisdom). The research is funded by Tekes the Finnish Funding Agency for Technology and Innovation and partly by industrial sponsors. Our industrial partners are also thanked for their participation in formulation and testing of the coatings.
VTT is also participating in screening of coating systems, especially in field testing of coated panels and in studies of film thickness of the coatings, but the work is not discussed in this paper. The work on development and characterization of alkyd-acrylic hybrids is being carried out by the University of Helsinki, Department of Polymer Chemistry. The researchers at the University of Helsinki are also thanked for the molecular weight determinations of the alkyd resins.
109
Reference list
1. Bakker, P., Klijn, T., Baltussen, J. J. M. & Bolin, M. Alkyd Emulsions, application and emulsification strategy. Färg ock Lack Scandinavia, 2004. No. 5, pp. 49.
2. Weissenborn, P. K. & Motiejauskaite, A. Emulsification, drying and film formation of alkyd emulsions. Progress in Organic Coatings, 2000. Vol. 40, No. 14, pp. 253266.
3. Nakayama, Y. Polymer blend systems for water-borne paints. Progress in Organic Coatings, 1998. Vol. 33, No. 2, pp. 108116.
4. Beetsma, J. Alkyd emulsion paints: properties, challenges and solutions. Pigment Resin Technology, 1998. Vol. 27, No. 1, pp. 1219.
5. Östberg, G., Bergenståhl, B. & Huldén, M. Influence of emulsifier on the formation of alkyd emulsions. Colloids and Surfaces A: Physiochemical and Engineering Aspects, 1995. Vol. 94, pp. 161171.
6. Lu, J., Khot, S. & Wool, R. P. New sheet molding compound resins from soybean oil. I. Synthesis and characterization. Polymer, 2005. Vol. 46, pp. 7180.
7. Pat. appl. FI.20065150, 06.03.2006, VTT. (Koskimies, S., Heiskanen, N., Wikstedt, M., Ahola, P., Jämsä, S., Paajanen, L. & Laamanen, S.)
8. Pat. appl. FI.20065151, 06.03.2006, VTT. (Koskimies, S., Heiskanen, N., Willberg, P., Hulkko, J., Uschanov, P. & Maunu, S. L.)
110
The elastic and damping properties of magnetorheological elastomers
Marke Kallio, Tomi Lindroos & Samu Aalto
VTT Technical Research Centre of Finland Sinitaival 6, Tampere, P.O. Box 1300, FI-33101 Tampere
Abstract
The aim of this study was to increase knowledge of the mechanical and viscoelastic properties of isotropic and aligned MREs. The focus was to clarify the changes in the elastic and vibration damping properties of the MREs when they are subjected to a magnetic field and to study the influence of the alignment of the magnetic particles on the composite properties with and without an applied magnetic field. The stiffness and damping properties of MREs can be modified by applying an external magnetic field. In isotropic MREs the stiffness and damping increase in the magnetic field when the filler volume fraction exceeds 15 vol.-% and maximal damping is obtained with 27 vol.-% of filler. The damping and stiffness properties of aligned MREs depend on the mutual directions of load, magnetic field and the particle alignment in the composite. If the dynamic loading is applied in the direction of the particle chains, the damping is initially high and the applied magnetic field has only a small influence on damping but it increases dynamic stiffness. If the deformation is concentrated in the areas between the particle chains, the damping is initially lower and is increased in the magnetic field. In this case, the dynamic stiffness is quite low and the applied magnetic field does not increase it significantly.
Introduction
During the past two decades, the interest in intelligent material-based solutions has shown huge growth. Especially, materials which can respond to the changes in their environment in a very short time are currently being developed. Presentable examples of this development are the so-called magnetorheological (MR) materials, which exhibit variable mechanical characteristics when an external magnetic field is applied. The group of magnetorheological materials
111
includes materials in various states such as MR fluids, foams and elastomers. The most well-known examples of MR materials are MR fluids, in which the viscosity changes under the magnetic field. MR fluids have already found applications in magnetically controllable brakes, clutches, dampers and mounts for semi-active or adaptive vibration controlling [1, 2, 3, 4].
Traditionally, elastomers have represented an important class of engineering materials that are used for passive vibration and noise control of structures. Actively controllable composite materials based on magnetically or electrically conductive particles, shape memory and piezo materials promise to have more functionality than the conventional elastomers, and therefore could be a link that brings the applications of modern control technologies and smart materials together [2]. However, in spite of the recent interest many of these composite materials are still in the development phase and not yet commercially available. MR elastomers (MRE) are interesting candidates for active vibration control of structural systems. The MREs basically consist of micron-sized magnetically permeable particles in a solid or gel-like non-magnetic matrix material. The functionality of these materials is based on the magnetic interaction of filler particles when subjected to an external magnetic field. The MREs are often classified into two different types: homogenous and aligned composites. If the particles are distributed homogeneously in the matrix during the processing, the composite properties are isotropic and do not depend on the direction of applied load. However, if an external magnetic field is applied to the composite during the crosslinking of the elastomer, the particles are aligned along the magnetic field lines and become locked in place during the curing. These aligned composites are strongly anisotropic in their mechanical, electrical, magnetical and thermal properties [1, 2].
It is suggested that the aligned MREs have more functionality than isotropic MREs. When an external magnetic field is applied, the filler particles magnetize and dipoles are formed. While the elastomer still has a low viscosity before the final curing of the composite, the formed dipoles can turn and slightly move along the magnetic field lines forming chain-like structures inside the composite. During this orientation, the particles can line up in separate chains or in network structures where the particles can have multiple interaction points. In this kind of an aligned structure, the dipoles are magnetically at their lowest energy state. Although differently than in MR fluids, in elastomer composites the aligned
112
structures are firmly locked in place after the curing of the composite and additional work has to be provided in order to move the particles to another position [1, 3, 4].
The magnetorheological effect is defined as the reversible change in viscoelastic properties of the MR material when subjected to a magnetic field. In the case of the MREs, the MR effect is a magnetically induced reversible change in the composite modulus. In some studies the magnetically induced change in damping properties is also included in the MR effect, but other studies exist stating that the external magnetic field does not have any remarkable effect on the damping of the MREs. There has been a lot of debate about this inconsistency. The physical properties of MR elastomers are a combination of the matrix properties and the properties of the magnetic particles embedded in the matrix. It is recommended to use particles with a high saturation magnetization, because the maximum field induced MR effect occurs when the particles become magnetically saturated. Pure iron has a high saturation magnetization (Js = 2.1 T) but it also has high permeability and low remanent magnetization, providing high short-term interparticle attraction [3]. The matrix material instead should have a low magnetic permeability; for example, natural and synthetic rubbers, silicone elastomers and polyvinyl alcohol (PVA) have been used for this purpose [1, 2, 3, 4, 5]. In developing an active composite, it is important to select an optimal matrix material when considering the possible applications and long-term stability of MR composites.
The MREs are intended to be used in dynamic applications. In several studies, the shear storage modulus of aligned MR elastomers have been determined. For instance, Jolly et al. [2] have measured the complex shear modulus of aligned MREs at various frequency and strain levels and applied magnetic field strengths. The MR effect on the modulus was found to increase with increasing vol.-% of iron and with increasing magnetic field strength. The MREs have been studied mostly at relatively low frequencies (1 to 50 Hz) [1, 4, 5]. Ginder et al. [6] have measured the dynamic shear modulus of MREs with 27 vol.-% of Fe in the frequency range over 1 kHz. They found that the MR effect is substantial also at higher frequencies. Zhou et al. [4] have studied a free vibration system consisting of an aligned MRE with 27 vol.-% of Fe. Their results show that the extent of the MR effect is influenced by the applied testing frequency.
113
In addition to the testing frequency, the MR effect depends on the strain amplitude. This is due to the dependence of the magnetic forces on the distance between the dipoles. The maximum MR effect on shear modulus can be obtained at relatively small strain amplitudes of 12%. At this strain level the distance between the particles in a chain is minimized and the magnetic interaction is at its strongest. If the external stress exceeds the magnetic stress holding the particle chain together, the particle chain starts to yield and the MR effect will diminish. Jolly et al. [2] have noticed that the MR effect on stiffness diminishes and energy dissipation increases at strain levels above 12%. The shear modulus of aligned MREs is generally decreased with increasing strain, which is observed in other studies as well. The strain-dependent behavior of the shear modulus is related to the opening of the network structure of aggregates when the strain increases. This effect, which is common to particle-reinforced vulcanized rubbers, is known as the Payne effect. The Payne effect increases exponentially with increasing filler content [1, 6].
In this study, isotropic and aligned MREs were prepared of silicone elastomer with varying carbonyl iron content. The MREs were studied in bending and compression modes with sinusoidal dynamic loading. The 3-point bending experiments were carried out using a dynamic mechanical analyzer (DMA) in resonance for both isotropic and aligned MREs. For characterizing the materials in compression with applied magnetic field, a special coil device was designed. The dynamic compression was carried out with varying frequencies and strain amplitudes. The stiffness and damping values with and without applied magnetic field were calculated on the basis of the measured data. Results that are more detailed can be found from reference [5].
Experimental
Material preparation
Isotropic and aligned magnetorheological elastomers were prepared from the RTV silicones Elastosil M4644 and M4601 (Wacker Silicones). As a filler material, spherical carbonyl iron (ISP S-3700 Micropowder) with an average particle size of 35 µm was used. The filler content used in this study ranged from 0 to 30 vol.-% of Fe. The MRE composites were prepared at room temperature by combining the resin/hardener mixture with iron particles and
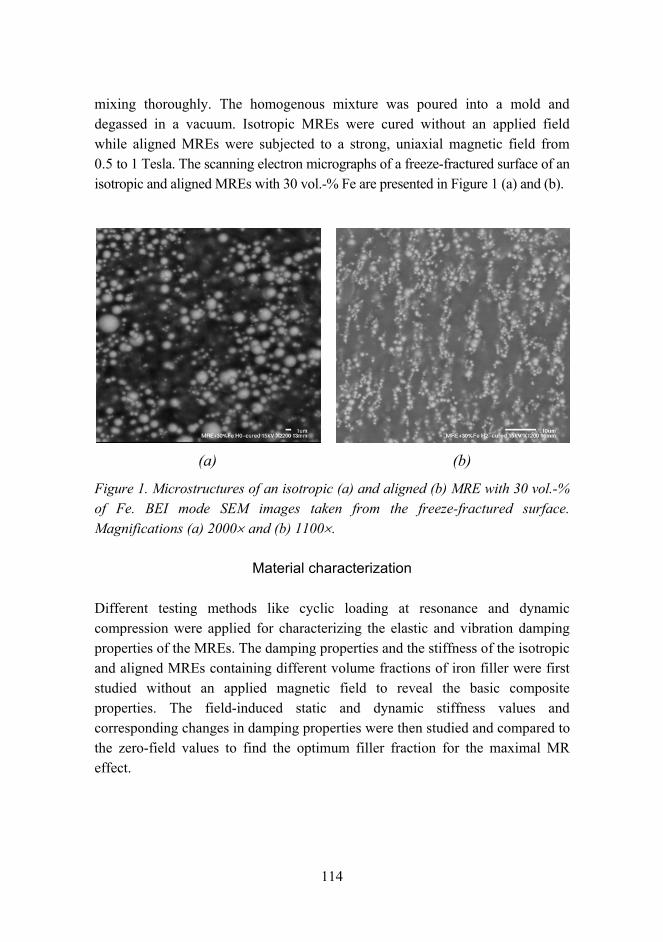
114
mixing thoroughly. The homogenous mixture was poured into a mold and degassed in a vacuum. Isotropic MREs were cured without an applied field while aligned MREs were subjected to a strong, uniaxial magnetic field from 0.5 to 1 Tesla. The scanning electron micrographs of a freeze-fractured surface of an isotropic and aligned MREs with 30 vol.-% Fe are presented in Figure 1 (a) and (b).
(a) (b)
Figure 1. Microstructures of an isotropic (a) and aligned (b) MRE with 30 vol.-% of Fe. BEI mode SEM images taken from the freeze-fractured surface. Magnifications (a) 2000× and (b) 1100×.
Material characterization
Different testing methods like cyclic loading at resonance and dynamic compression were applied for characterizing the elastic and vibration damping properties of the MREs. The damping properties and the stiffness of the isotropic and aligned MREs containing different volume fractions of iron filler were first studied without an applied magnetic field to reveal the basic composite properties. The field-induced static and dynamic stiffness values and corresponding changes in damping properties were then studied and compared to the zero-field values to find the optimum filler fraction for the maximal MR effect.
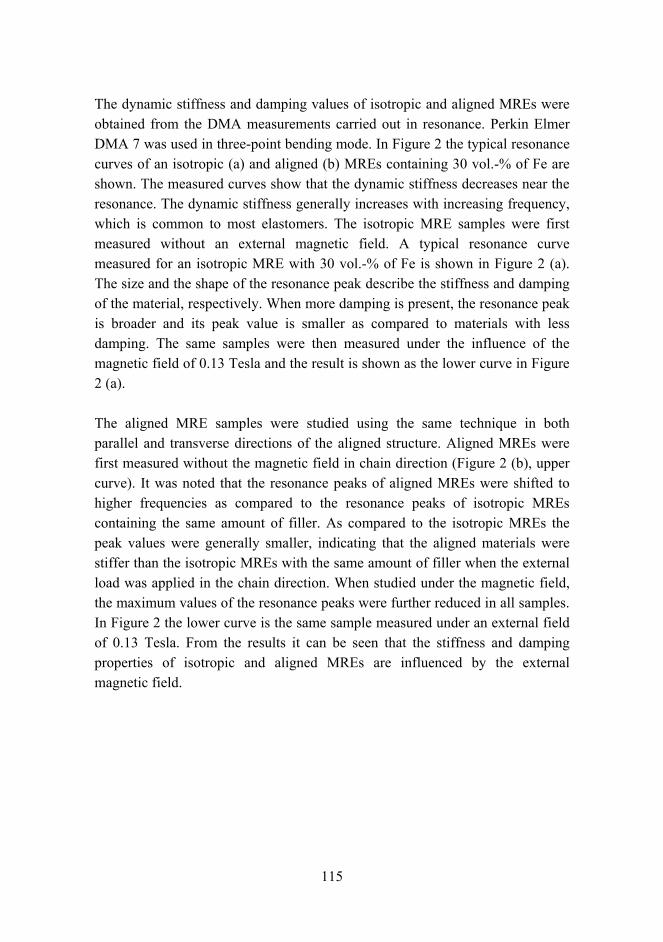
115
The dynamic stiffness and damping values of isotropic and aligned MREs were obtained from the DMA measurements carried out in resonance. Perkin Elmer DMA 7 was used in three-point bending mode. In Figure 2 the typical resonance curves of an isotropic (a) and aligned (b) MREs containing 30 vol.-% of Fe are shown. The measured curves show that the dynamic stiffness decreases near the resonance. The dynamic stiffness generally increases with increasing frequency, which is common to most elastomers. The isotropic MRE samples were first measured without an external magnetic field. A typical resonance curve measured for an isotropic MRE with 30 vol.-% of Fe is shown in Figure 2 (a). The size and the shape of the resonance peak describe the stiffness and damping of the material, respectively. When more damping is present, the resonance peak is broader and its peak value is smaller as compared to materials with less damping. The same samples were then measured under the influence of the magnetic field of 0.13 Tesla and the result is shown as the lower curve in Figure 2 (a).
The aligned MRE samples were studied using the same technique in both parallel and transverse directions of the aligned structure. Aligned MREs were first measured without the magnetic field in chain direction (Figure 2 (b), upper curve). It was noted that the resonance peaks of aligned MREs were shifted to higher frequencies as compared to the resonance peaks of isotropic MREs containing the same amount of filler. As compared to the isotropic MREs the peak values were generally smaller, indicating that the aligned materials were stiffer than the isotropic MREs with the same amount of filler when the external load was applied in the chain direction. When studied under the magnetic field, the maximum values of the resonance peaks were further reduced in all samples. In Figure 2 the lower curve is the same sample measured under an external field of 0.13 Tesla. From the results it can be seen that the stiffness and damping properties of isotropic and aligned MREs are influenced by the external magnetic field.
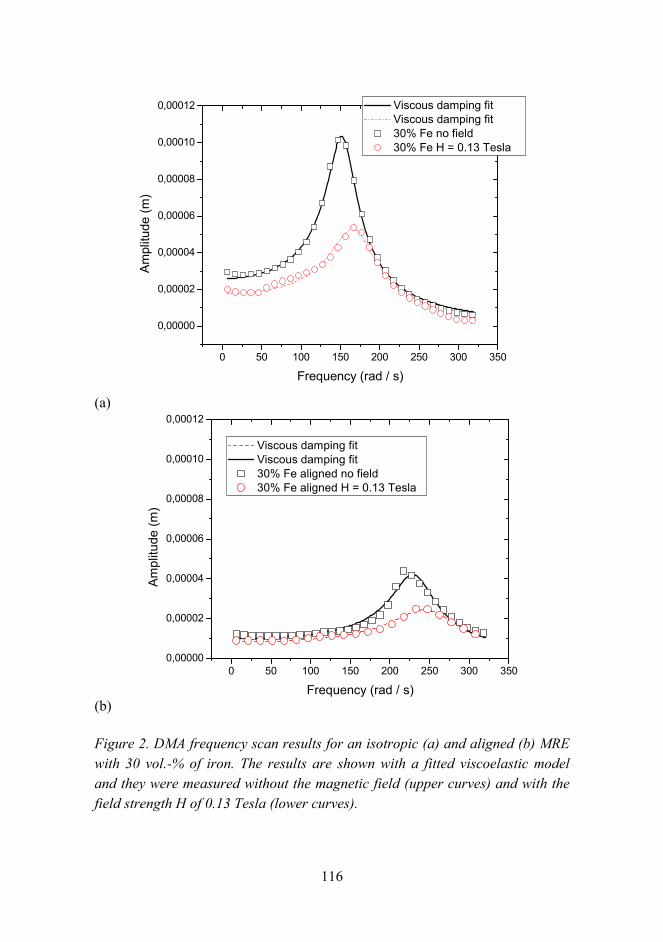
116
0 50 100 150 200 250 300 350
0,00000
0,00002
0,00004
0,00006
0,00008
0,00010
0,00012
Am
plitu
de (m
)
Frequency (rad / s)
Viscous damping fit Viscous damping fit 30% Fe no field 30% Fe H = 0.13 Tesla
(a)
0 50 100 150 200 250 300 3500,00000
0,00002
0,00004
0,00006
0,00008
0,00010
0,00012
Am
plitu
de (m
)
Frequency (rad / s)
Viscous damping fit Viscous damping fit 30% Fe aligned no field 30% Fe aligned H = 0.13 Tesla
(b) Figure 2. DMA frequency scan results for an isotropic (a) and aligned (b) MRE with 30 vol.-% of iron. The results are shown with a fitted viscoelastic model and they were measured without the magnetic field (upper curves) and with the field strength H of 0.13 Tesla (lower curves).
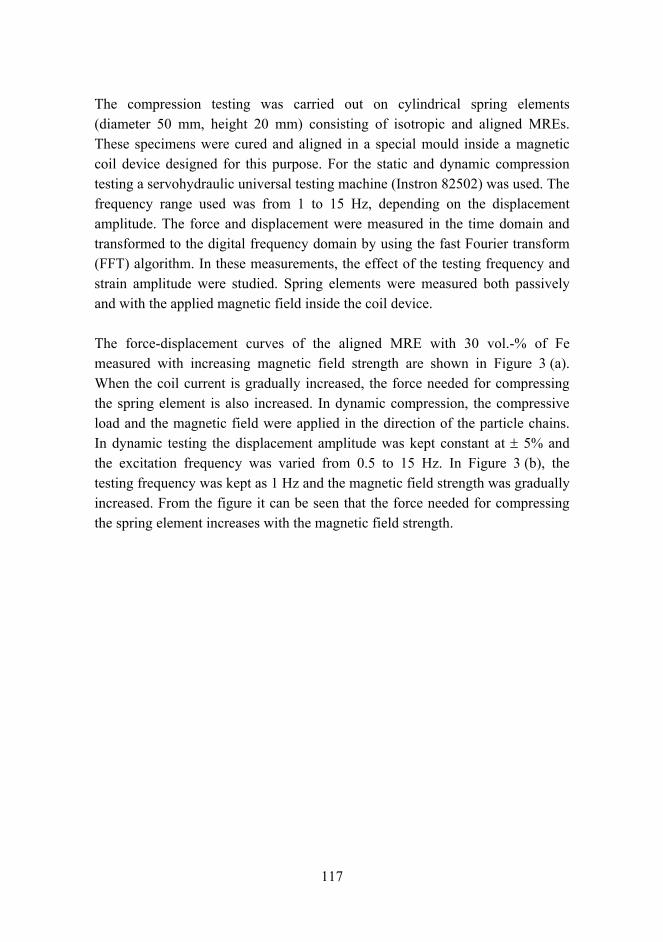
117
The compression testing was carried out on cylindrical spring elements (diameter 50 mm, height 20 mm) consisting of isotropic and aligned MREs. These specimens were cured and aligned in a special mould inside a magnetic coil device designed for this purpose. For the static and dynamic compression testing a servohydraulic universal testing machine (Instron 82502) was used. The frequency range used was from 1 to 15 Hz, depending on the displacement amplitude. The force and displacement were measured in the time domain and transformed to the digital frequency domain by using the fast Fourier transform (FFT) algorithm. In these measurements, the effect of the testing frequency and strain amplitude were studied. Spring elements were measured both passively and with the applied magnetic field inside the coil device.
The force-displacement curves of the aligned MRE with 30 vol.-% of Fe measured with increasing magnetic field strength are shown in Figure 3 (a). When the coil current is gradually increased, the force needed for compressing the spring element is also increased. In dynamic compression, the compressive load and the magnetic field were applied in the direction of the particle chains. In dynamic testing the displacement amplitude was kept constant at ± 5% and the excitation frequency was varied from 0.5 to 15 Hz. In Figure 3 (b), the testing frequency was kept as 1 Hz and the magnetic field strength was gradually increased. From the figure it can be seen that the force needed for compressing the spring element increases with the magnetic field strength.
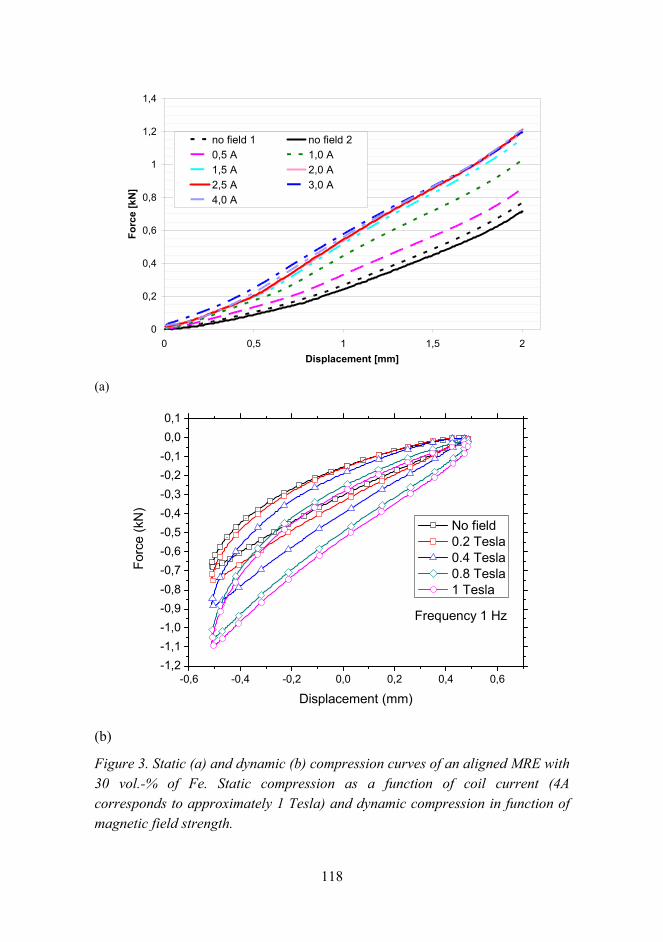
118
0
0,2
0,4
0,6
0,8
1
1,2
1,4
0 0,5 1 1,5 2Displacement [mm]
Forc
e [k
N]
no field 1 no field 20,5 A 1,0 A1,5 A 2,0 A2,5 A 3,0 A4,0 A
(a)
-0,6 -0,4 -0,2 0,0 0,2 0,4 0,6-1,2-1,1-1,0-0,9-0,8-0,7-0,6-0,5-0,4-0,3-0,2-0,10,00,1
Forc
e (k
N)
Displacement (mm)
No field 0.2 Tesla 0.4 Tesla 0.8 Tesla 1 Tesla
Frequency 1 Hz
(b)
Figure 3. Static (a) and dynamic (b) compression curves of an aligned MRE with 30 vol.-% of Fe. Static compression as a function of coil current (4A corresponds to approximately 1 Tesla) and dynamic compression in function of magnetic field strength.
119
Discussion
The damping properties and dynamic stiffness of magnetorheological elastomers (MREs) can be changed by applying an external magnetic field in both isotropic and aligned MREs. The dynamic stiffness of isotropic MREs measured passively (without the magnetic field) increases linearly with the volume fraction of the filler. In isotropic MREs both the stiffness and damping increase due to the application of the magnetic field if the filler volume fraction exceeds 15 vol.-% and they are tuneable with the magnetic field strength when the filler volume fraction is between 27 and 30 vol.-%.
In aligned MREs the damping and stiffness depend on the mutual directions between the applied load, the magnetic field and the particle chains in the composite. This observation may explain the contradictory results presented in the literature on the influence of magnetic fields on the damping properties of MREs. If the dynamic load in bending or compression is applied so that the deformation occurs along the chains, the damping is initially high and the magnetic field has only a small influence on damping. If the load is applied so that the deformation occurs mostly between the chains, the damping is initially comparable to that of the isotropic MRE and can be increased significantly by the application of the magnetic field. In the chain direction, the dynamic stiffness of aligned MREs is tuneable in the magnetic field. The maximal stiffness increase of 60% in dynamic loading and over 200% in static loading can be obtained when the applied magnetic field and the compressive load are applied in the chain direction. By optimizing the particle density and alignment, either the stiffness or the damping of the MRE can be increased by the application of a magnetic field.
Acknowledgement
The following scientists have greatly contributed to this study: Dr. Ricardo Schwartz from Los Alamos National Laboratory, Professor Pekka Ruuskanen from TUT, chief research scientist Tuomo Kärnä, research scientist Erkki Järvinen, senior research scientist Juha Juntunen, senior research scientist Tor Meinander, research scientist Jarkko Keinänen and senior research scientist Ismo Vessonen from VTT. The financial support provided by VTT, Los Alamos,
120
Tekes the Finnish Funding Agency for Technology and Innovation and Tekniikan Edistämissäätiö (TES) is gratefully acknowledged.
Reference list
1. Carlson, D. & Jolly, M. MR fluid, foam and elastomer devices. Mechatronics, 2000. No. 10, pp. 555569.
2. Jolly, M., Carlson, D., Munoz, B. & Bullions, T. The magnetoviscoelastic response of elastomer composites consisting of ferrous particles embedded in a polymer matrix. J. Int. Mater. Syst. Struc., 1996. No. 7, pp. 613622.
3. Davis, L. C. Model of magnetorheological elastomers. J. Appl. Phys., 1999. Vol. 85, No. 6, pp. 33483351.
4. Zhou, G. Y. Shear properties of magnetorheological elastomers. Smart Mater. Struct., 2003. No. 12, pp. 139146.
5. Kallio, M. The elastic and damping properties of magnetorheological elastomers. VTT Publications 565, Espoo 2005. 146 p. ISBN 951-38-6447-2; 951-38-6639-4. http://virtual.vtt.fi/inf/pdf/publications/2005/P565.pdf.
6. Ginder, J. M., Clark, S. M., Schlotter, W. F. & Nichols, M. E. Magnetostrictive phenomena in magnetorheological elastomers. Int. J Modern. Phys. B, 2002. Vol. 16, Nos. 17&18, pp. 24122418.
121
Fe-Cr-X alloys: steels with enhanced damping capacity
Tomi Lindroos1, Marjaana Peltonen1, Marke Kallio1 & Jukka Janhunen2 1VTT Technical Research Centre of Finland
Sinitaival 6, Tampere, P.O. Box 1300, FI-33101 Tampere 2Helsinki University of Technology
Vuorimiehentie 2, Espoo, P.O. Box 6200, FI-02015 HUT
Abstract
Mechanical vibration causes problems in many applications. For this reason control of vibration energy has been an active research topic for many years. Vibration controlling efforts can be focused on different fields: excitation, transfer paths, joints, damping and sound radiation. One attractive way to solve vibration problems is to increase the damping capacity of structural materials. This paper deals with the enhanced damping capacity of Fe-Cr-X based alloys. In the present work, the effects of alloying elements and heat treatment condition on mechanical properties and internal friction were studied. Five different compositions of industrial purity raw materials were manufactured by vacuum induction melting. Hot and cold rolling of the billets were done prior to heat treatments at different temperatures (1000 °C, 1050 °C, 1100 °C, 1150 °C) and time (3 h and 6 h). Dependence of the damping capacity of the specimens on heat treatment state and excitation level were evaluated by calculating the logarithmic decrement from free decay of a cantilever beam.
Introduction
Vibration damping of mechanical structures is of interest in relation to noise, vibration and strength of structures. For all these purposes knowledge about damping mechanisms, information about the methods to increase damping and modeling tools for the estimation of dynamic behavior of structures are needed.
Vibration damping is usually considered to occur by five different damping mechanisms. They include internal material damping, interface damping
122
(friction damping), radiation damping, energy losses occurring as a result of reflection at discontinuities of structures, and viscous damping caused by visco-elastic material or by surrounding fluid [1]. Internal friction of metals is due to the internal mismatch in the material microstructure. In most of the cases mechanisms related to internal friction have a negligibly small effect on the total damping capacity of the structure. However, some metal alloys exhibit exceptionally high inherent damping capacity, which can be exploited in the designing and manufacturing of advanced structures.
Damping mechanisms in metals
Internal material damping (the transformation of mechanical energy into heat) is often described using a quantity called the loss factor, which indicates the fraction of the vibratory energy lost in one cycle of the vibration. This damping mechanism, as are all the other damping mechanisms, is dependent on various factors like frequency, temperature and material composition. Internal damping mechanism of metallic materials can be categorized into linear and non-linear mechanisms [2].
Linear damping mechanisms of materials are associated to anelastic behavior. Linear mechanisms are independent of stress or strain amplitude, but mechanisms are usually dependent on frequency and temperature. In various temperature and frequency ranges sharply increased values of loss factor are observed. These peak values are connected to different dissipating mechanisms: relaxation of the point defects, viscosity of grain boundaries, thermo-elasticity, eddy-currents, snoek-effect and the movement of the dislocations.
Micromechanics which are responsible for one type of non-linear strain-rate independent damping are identified in terms of plastic slip, localized plastic deformation, crystal plasticity, cyclic plastic flow and dislocation motion. The mechanisms influencing the non-linear damping properties of metals can be categorized into four types of basic mechanisms: multiphase structure, ferromagnetism, dislocation damping and the damping due to movable twin boundaries. All these mechanisms cause hysteretic damping.
123
Magnetomechanical damping
Mechanical loading of a partially magnetized material changes the magnetization of the specimen. As a result of this, eddy-currents are produced at the surface of the specimen. The eddy-current effect represents the linear part of magnetomechanical damping. The effect can also be observed on a micro scale when the term micro-eddy current is used. This effect can be shown to provide a mechanism for dissipating mechanical energy to heat. The damping produced with this method is usually small and generally negligibly small compared to other damping mechanisms.
Magnetoelastic damping is the non-linear part of the magnetomechanical damping. Magnetoelastic mechanism provides effective damping at intermediate stress levels. This effect is observed in ferromagnetic materials and it is associated with the magnetization changes of material.
Ferromagnetic material consists of small magnetic regions, the so-called domains. Each of these domains is individually magnetized to the saturation level. In demagnetized state the magnetization vectors of domains are randomly oriented and the net magnetization of material is nearly zero. In the presence of a magnetic field the magnetic domains orientate parallel to the field. Orientation occurs with rotation of the domains and movement of domain walls. Mechanical loading of material causes changes in magnetization similar to the ones caused by an applied magnetic field. The term magnetostriction means that the material elongates in the direction of the applied magnetic field (positive magnetostriction). A strain field can therefore produce rotation of domains and wall movements similar to that produced by a magnetic field. Strain in ferromagnetic material consists of an elastic component as described by Hookes law and of a magneto-elastic component. Magnetoelasticity is an irreversible process and therefore the term magneto-elastic is partly misleading [3].
When the high damping steel specimen is magnetized to saturation level, the magnetoelastic strain component becomes negligibly small in applied external stress. As a consequence of this, damping of the specimen decreases to the level of the normal structural steels. This observation ensures that the damping capacity is due to changes of magnetization and the effect caused by the other mechanisms is negligibly small [3].
124
The extent of the damping capacity based on magnetoelastic mechanism depends on various parameters. Despite the various affecting parameters, it can be stated that the energy dissipation is connected to the motion of the domain walls and depends on the domain wall mobility. The domain wall mobility is basically controlled by the following three factors according to Chudacov [4] 1) the structure and size of the magnetic domains and domain boundaries, 2) the structure of the crystal lattice in which domain walls move and 3) the interaction of domain walls and imperfections in the crystal lattice. A detailed analysis of the origin of damping capacity can not be accomplished if the above mentioned factors are not considered.
The effect of the stress amplitude is considerable. The energy dissipated by the magneto-elastic hysteresis increases as the third power of stress amplitude up to the stress level governed by the magnetomechanical coercive force (e.g., magnetic field needed to reduce the magnetization to zero). After the coercive force is achieved the damping capacity remains constant due to magnetoelasticity, which means that after the critical stress level the magnetic domain structures are oriented similarly as in a magnetic field. It has been shown that the maximum value of damping of the material is moved to higher stress levels due to cold working of the specimen. An increase in the impurity content in the material has the same kind of effect. These effects are related to increased immobility of the domain walls [5].
The effect of temperature is pronounced at elevated temperatures. Magnetic materials loose their magnetic properties at a certain temperature, namely, the Curie temperature. Most materials show a decrease of magnetoelastic damping with increasing temperature. Usually the rate of decrease is first slow and the rate increases near the Curie temperature, and eventually only the damping associated with the other mechanisms remains [3].
The basic principle is that magnetoelastic damping is independent of frequency. Motion of the domain walls is able to follow rapid changes in the stress level up to very high frequencies (100 kHz). At very high frequencies, beyond normal structural mechanics the reorientation of domain walls cannot occur rapidly enough and under these conditions the magnetoelastic damping decreases.
125
Generally, damping properties of material are measured under sinusoidal loading. However, in practice mean or static load is imposed on structural parts in addition to an alternating load. The effect of mean stress on damping depends on the dominant micro-mechanisms that produce damping. Static mean stress can cause large changes in the damping of magnetoelastic material. In some cases static stress can suppress the motion of domain walls. The magnitude of this effect depends on the magnetomechanical coercive force of materials.
High damping capacity steels
Some special steels with relatively high damping such as Fe-Cr or Fe-Mn steels have been developed and are commercially available. The damping effect in these steels is mainly based on two mechanisms: 1) magnetoelasticity (Fe-Cr steels) and 2) reorientation and movement of twins and twin boundaries (Fe-Mn steels). In ferritic steels the damping caused by dislocations is very limited, because even small contents of interstitial atoms can restrict the movement of dislocations. The dislocation damping is more pronounced with higher vibration amplitudes.
Steels based on magnetomechanical damping
High damping alloys based on the Fe-Cr system have been applied in components that require low levels of sound emission and vibration, high corrosion resistance and high strength. The most traditional composition of the high damping steel is Fe-12%Cr and various modifications of this alloy have been studied in order to improve the damping capacity. The effect of different alloying elements and heat treatments on the damping capacity has been studied by many authors [6].
The reported values of damping capacity differ markedely. One reason is that there is no standard way to measure the damping capacity of a material and therefore the measuring techniques, test setups and size of the specimens vary between authors. Another very remarkable reason for the differences in reported values is that even very small variations in composition and heat treatments have a drastic effect on the damping properties.
126
The highest damping values are obtained for ferritic Fe-Cr alloys containing 1520 wt-% of Cr. Additions of Al and Mo have been found to be beneficial for high damping capacity due to the smaller domain size or lower coercive force provided by these elements [7], [8].
Measurement of the damping capacity
Material damping is often presented as a single value in handbooks. These values can be used for a rough comparison of the different materials. In scientific papers the damping values of materials are typically measured using various methods that are often not properly documented. The effect of the specimen mounting, type of excitation and used sensors are not studied.
Several measures are introduced to describe the amount of damping. Interrelations of these measures are presented in Eq. (1) [9]. The most typical measures are the loss factor (η) and the damping ratio (ζ). In literature concerning material science the terms logarithmic decrement (δ) and quality factor (Q) are often used also.
(1)
Experiments
The aim of the study was to find out the optimal composition and processing route for the Fe-Cr-X based alloys exhibiting high damping capacity and good mechanical properties. These unique properties can be exploited in the designing and manufacturing of advanced components for industrial applications.
Preparation of the test materials
Numerous different compositions of the Fe-Cr-based high damping capacity alloys have been presented by different authors. Based on the literature and earlier experience of the authors the five most interesting Fe-Cr-X based alloys were chosen for this study.
,1.0tan when ,2
2'''tan
21 <=
∆=======− φ
πλα
πζφ
πδη
πψ
WW
EEQ
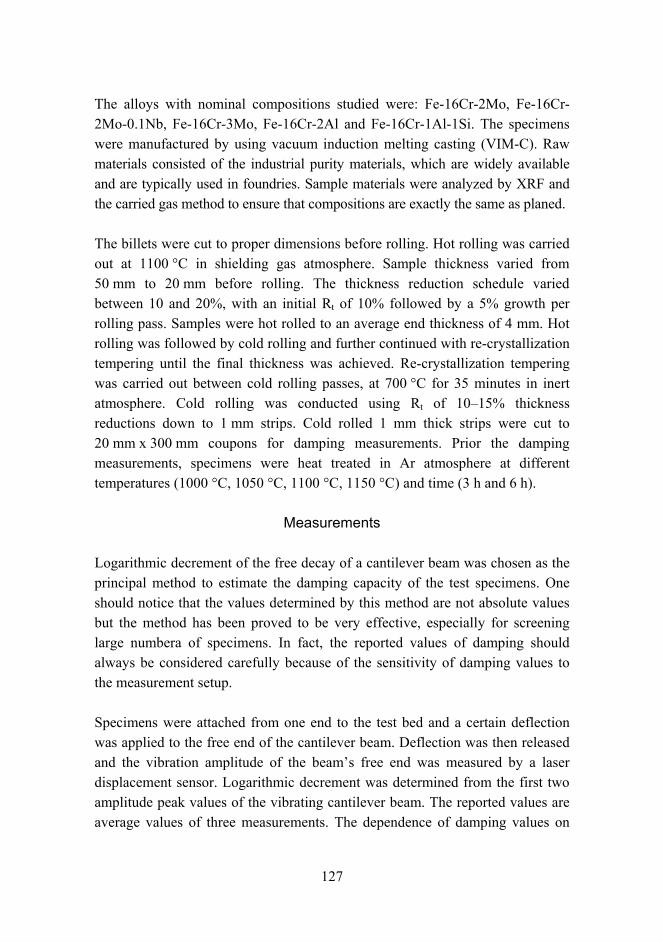
127
The alloys with nominal compositions studied were: Fe-16Cr-2Mo, Fe-16Cr-2Mo-0.1Nb, Fe-16Cr-3Mo, Fe-16Cr-2Al and Fe-16Cr-1Al-1Si. The specimens were manufactured by using vacuum induction melting casting (VIM-C). Raw materials consisted of the industrial purity materials, which are widely available and are typically used in foundries. Sample materials were analyzed by XRF and the carried gas method to ensure that compositions are exactly the same as planed.
The billets were cut to proper dimensions before rolling. Hot rolling was carried out at 1100 °C in shielding gas atmosphere. Sample thickness varied from 50 mm to 20 mm before rolling. The thickness reduction schedule varied between 10 and 20%, with an initial Rt of 10% followed by a 5% growth per rolling pass. Samples were hot rolled to an average end thickness of 4 mm. Hot rolling was followed by cold rolling and further continued with re-crystallization tempering until the final thickness was achieved. Re-crystallization tempering was carried out between cold rolling passes, at 700 °C for 35 minutes in inert atmosphere. Cold rolling was conducted using Rt of 1015% thickness reductions down to 1 mm strips. Cold rolled 1 mm thick strips were cut to 20 mm x 300 mm coupons for damping measurements. Prior the damping measurements, specimens were heat treated in Ar atmosphere at different temperatures (1000 °C, 1050 °C, 1100 °C, 1150 °C) and time (3 h and 6 h).
Measurements
Logarithmic decrement of the free decay of a cantilever beam was chosen as the principal method to estimate the damping capacity of the test specimens. One should notice that the values determined by this method are not absolute values but the method has been proved to be very effective, especially for screening large numbera of specimens. In fact, the reported values of damping should always be considered carefully because of the sensitivity of damping values to the measurement setup.
Specimens were attached from one end to the test bed and a certain deflection was applied to the free end of the cantilever beam. Deflection was then released and the vibration amplitude of the beams free end was measured by a laser displacement sensor. Logarithmic decrement was determined from the first two amplitude peak values of the vibrating cantilever beam. The reported values are average values of three measurements. The dependence of damping values on
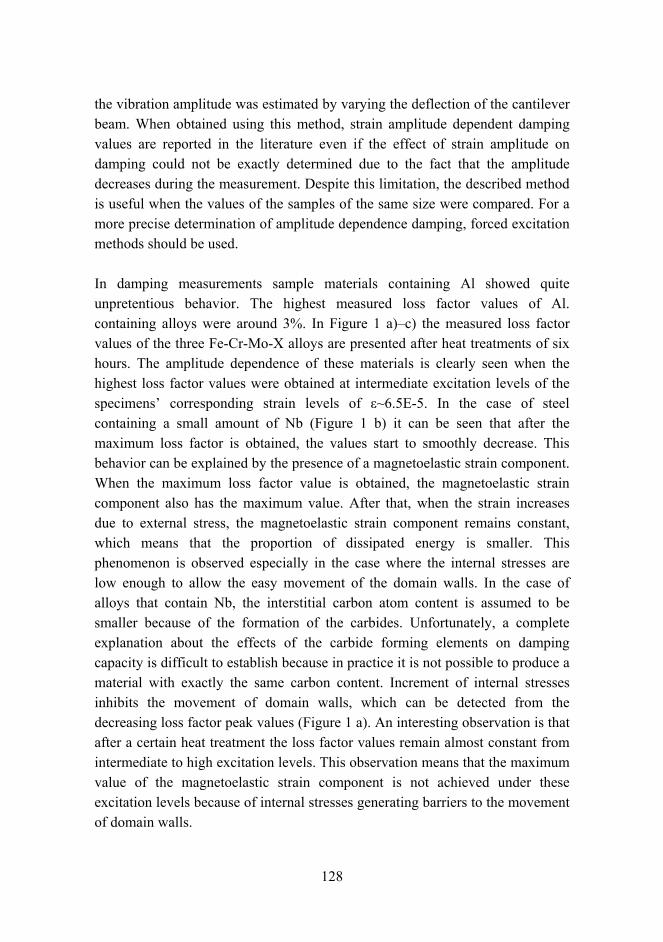
128
the vibration amplitude was estimated by varying the deflection of the cantilever beam. When obtained using this method, strain amplitude dependent damping values are reported in the literature even if the effect of strain amplitude on damping could not be exactly determined due to the fact that the amplitude decreases during the measurement. Despite this limitation, the described method is useful when the values of the samples of the same size were compared. For a more precise determination of amplitude dependence damping, forced excitation methods should be used.
In damping measurements sample materials containing Al showed quite unpretentious behavior. The highest measured loss factor values of Al. containing alloys were around 3%. In Figure 1 a)c) the measured loss factor values of the three Fe-Cr-Mo-X alloys are presented after heat treatments of six hours. The amplitude dependence of these materials is clearly seen when the highest loss factor values were obtained at intermediate excitation levels of the specimens corresponding strain levels of ε~6.5E-5. In the case of steel containing a small amount of Nb (Figure 1 b) it can be seen that after the maximum loss factor is obtained, the values start to smoothly decrease. This behavior can be explained by the presence of a magnetoelastic strain component. When the maximum loss factor value is obtained, the magnetoelastic strain component also has the maximum value. After that, when the strain increases due to external stress, the magnetoelastic strain component remains constant, which means that the proportion of dissipated energy is smaller. This phenomenon is observed especially in the case where the internal stresses are low enough to allow the easy movement of the domain walls. In the case of alloys that contain Nb, the interstitial carbon atom content is assumed to be smaller because of the formation of the carbides. Unfortunately, a complete explanation about the effects of the carbide forming elements on damping capacity is difficult to establish because in practice it is not possible to produce a material with exactly the same carbon content. Increment of internal stresses inhibits the movement of domain walls, which can be detected from the decreasing loss factor peak values (Figure 1 a). An interesting observation is that after a certain heat treatment the loss factor values remain almost constant from intermediate to high excitation levels. This observation means that the maximum value of the magnetoelastic strain component is not achieved under these excitation levels because of internal stresses generating barriers to the movement of domain walls.
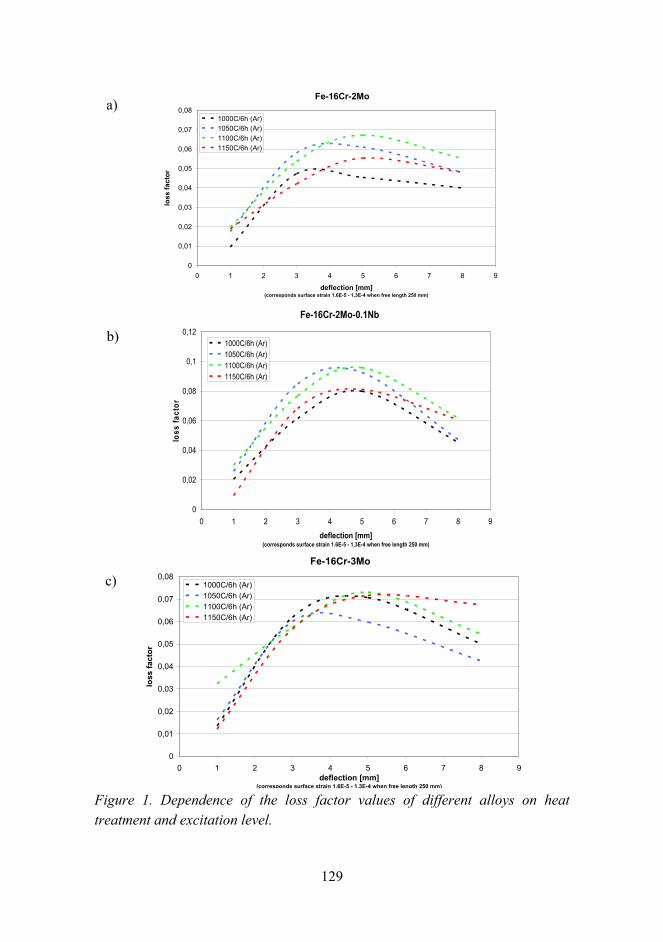
129
Fe-16Cr-2Mo
0
0,01
0,02
0,03
0,04
0,05
0,06
0,07
0,08
0 1 2 3 4 5 6 7 8 9
deflection [mm] (corresponds surface strain 1.6E-5 - 1,3E-4 when free length 250 mm)
loss
fact
or
1000C/6h (Ar)1050C/6h (Ar)1100C/6h (Ar)1150C/6h (Ar)
Fe-16Cr-2Mo-0.1Nb
0
0,02
0,04
0,06
0,08
0,1
0,12
0 1 2 3 4 5 6 7 8 9
deflection [mm] (corresponds surface strain 1.6E-5 - 1,3E-4 when free length 250 mm)
loss
fact
or
1000C/6h (Ar)1050C/6h (Ar)1100C/6h (Ar)1150C/6h (Ar)
Fe-16Cr-3Mo
0
0,01
0,02
0,03
0,04
0,05
0,06
0,07
0,08
0 1 2 3 4 5 6 7 8 9deflection [mm]
(corresponds surface strain 1.6E-5 - 1,3E-4 when free length 250 mm)
loss
fact
or
1000C/6h (Ar)1050C/6h (Ar)1100C/6h (Ar)1150C/6h (Ar)
Figure 1. Dependence of the loss factor values of different alloys on heat treatment and excitation level.
a)
b)
c)
130
Conclusions
In the present work Fe-Cr-X based alloys alloyed with Mo, Al, Si and Nb were studied. Exceptionally high values of internal friction for these steels are based on the magnetomechanical effect, which is the most important damping mechanism in ferromagnetic metals. It was shown that with properly treated specimens loss factor values of nearly 0.1 (a typical value for structural steel is 0.001) can be achieved at an intermediate level of excitation stress. From the design point of view, these kinds of advanced steels give new possibilities to design structures subjected to vibration. Despite the fascinating properties of high damping steels, there are limitations that should be considered in designing practical applications. For exploiting these kinds of new materials it is necessary to work in close co-operation with designers and material manufacturers. Steels with high damping capacity have potential applications in harsh environments and massive structures where polymer based damping treatments are not applicable. More research work is still needed to understand and optimally exploit the strain-dependent behavior of high damping steels.
Acknowledgement
The research work described above on the high damping steels was conducted in the research project Advanced materials and structures for vibration control, which is financed by Tekes, VTT, ABB Oy, Kone Corporation, Wärtsilä Finland Oy, Patria Advanced Solutions Oy and FY-Composites Oy.
Reference list
[1] Cremer, L., Heckl, M. & Ungar, E. E. Structure-Borne Sound. Springer-Verlag, Berlin, 1988.
[2] Lazan, B. J. Damping of Materials and Members In Structural Mechanics, Pergammon Press, 1968.
[3] Cullity, B. D. Introduction to Magnetic Materials, 1972.
131
[4] Chadakcov, I. B. & Golovin, I. S. Mechanics and Mechanisms of Material Damping, ASTM, 1997.
[5] Le May, A. & Van Neste, A. Scripta Metallurgica, 1971, Vol. 5.
[6] Golovin, I. S. Journal of Alloys and Compounds, 1994, Vol. 211212.
[7] Karimi, A., Giauque, P. H. & Martin, J. L. Mechanics and Mechanisms of Material Damping, ASTM, 1997.
[8] Pulino-Sagradi, D., Sagradi, M., Karimi, A. & Martin, J. L. Scripta Materialia, 1998, Vol. 39, No. 2.
[9] Wolfenden, A. & Kinra, V. K. Mechanics and Mechanisms of Material Damping, ASTM, 1997.

132

133
Functional surfaces and coating applications

134
135
Tailoring paper surface properties with starch derivatives
Sari Hyvärinen1, Kirsi Kataja2, Henna Lampinen3 Soili Peltonen1, Pia Qvintus-Leino2 & Pertti Moilanen4
1Valta-akseli, Rajamäki, P.O. Box 21, FI-05200 Rajamäki
VTT Technical Research Centre of Finland 2Biologinkuja 7, Espoo, P.O. Box 1000, FI-02044 VTT
3Koivurannantie 1, Jyväskylä, P.O. Box 1603, FI-40101 Jyväskylä
4Vuorimiehentie 3, Espoo, P.O. Box 1000, FI-02044 VTT
Abstract
Chemical characteristics, in addition to the physical properties of paper, are significant in the printing process, but their effects are not known well enough. The aim of this study has been to change the hydrophilicity/hydrophobicity ratio of the starch polymer and the paper surface, and thereby to adjust oil, solvent and water absorption. The results show that by changing the hydrophobicity/ hydrophilicity ratio of certain polymers the absorption properties and surface energy of polymer-treated papers can be tailored. It is possible to reduce significantly penetration and print through of many kinds of printing inks by spreading less than 0,5 g/m2 of polymer on uncoated paper surface.
Introduction
Chemical processing of paper surface offers alternatives for controlling the unequal sidedness of paper surfaces, for increasing barrier properties, and for adjusting absorption characteristics to different printing methods. Criteria of paper for gravure printing include smoothness and absorption characteristics, while surface strength and porosity are required for offset paper. Surface energy characteristics are of particular significance in digital printing. The properties of paper surface can be controlled, within certain limits, in the production process of base paper, while the composition and amount of chemicals used for possible surface treatment have a significant effect on the final result.
136
In this project the first task was to prove that the surface properties of paper can be tailored by adding a very small amount of a chemical on the surface. This task has already been accomplished. After that, the aim has been to understand the interaction of the chemical and paper surface as well as the interaction of the added chemical and printing ink to be able to control and adjust the absorption and smoothness of coated base papers. If it is possible to adjust surface properties with chemical treatment, the significance of base paper properties for the paper diminish and the structure and production process of paper can be simplified and cheaper raw materials used.
The research work for polymer materials in this project is partly focusing on starch derivatives. It is possible to tailor polymer characteristics, such as hydrophobicity, hydrophilicity, adsorption, adhesion and penetration characteristics within wide limits by combining different ways of modification.
In this paper, results from two different modified starches, non-ionic starch (N1) and cationic starch (C1, C2), will be presented. Starches were applied onto two different base papers by a spray technique. Air permeability, water absorption, oil absorption and surface energies will be presented. Also results from printing tests will be published here.
Experimental
Straches
Two different modified starches, non-ionic potato starch (N1) and cationic potato starch (C1, C2), were prepared. C1 and C2 are the same cationic potato starch, but they are from different batches. These starches were applied onto two different base papers by a spray technique. Coating amounts were less than 0,5 g/m2.
Base papers
Wood-free base paper (Fine base paper, 58 g/m2) and wood-containing base paper (LWC base paper, 45 g/m2) were chosen for the studies that examine controlling the absorption characteristics of paper. The commercial mineral pigment coated end products (here marked FP end and LWC end) have been used as references in the project.
137
The fine paper was from Stora Ensos Oulu Mill, PM 7, which produces offset paper grades. LWC paper was from UPM Kymmene Kaukas paper mill, which produces gravure-printing grades.
Spray technique
The spray equipment that was used consists of a moving sample sledge, a spraying unit (nozzle 163-411 and a high pressure pump Falcon II 1:20), and a drying unit (impingement dryer). The distance between the spraying unit and drying unit was 0.1 m. The drying temperature was about 170 °C and the flow rate of air was 50 m/s. The A4-size paper sample was attached to the surface of the sledge by a vacuum. The velocity of the sledge under the nozzle and drying unit was 0.9 m/s. The amount of chemical applied on the paper surface was approximated from the volume and concentration of the sprayed solution.
Chemical analysis and tests of treated base papers
Air permeability was measured using Bendtsen tester according to the standard SCAN P-26:78.
Absorption of solvents in both the in-plane (spreading) direction and in the thickness (penetration) direction was measured using FotoComp Print instrument. In the absorption measurement, a paper sample was laid on a horizontal glass plate. An 8-bit digital camera was mounted above and perpendicular to the glass plate. Images at specified moments of time were acquired in order to record the spreading and penetration of the droplet. Parameters of absorption were calculated from the digital image series. In this study parameter AWR was used to characterize wetting of the paper surface in the z-direction. To ensure reliability of results, a minimum of five measurements per sample were done. Solvents used in this study were de-ionized water and high viscosity mineral oil. The droplet size was about 10 µl.
The contact angle and surface energies were measured with five model liquids water, ethylene glycol, tricresyl phosphate, formamide and diiodomethane using CAM 200 equipment. Values are calculated on the basis of Fowkes theory.
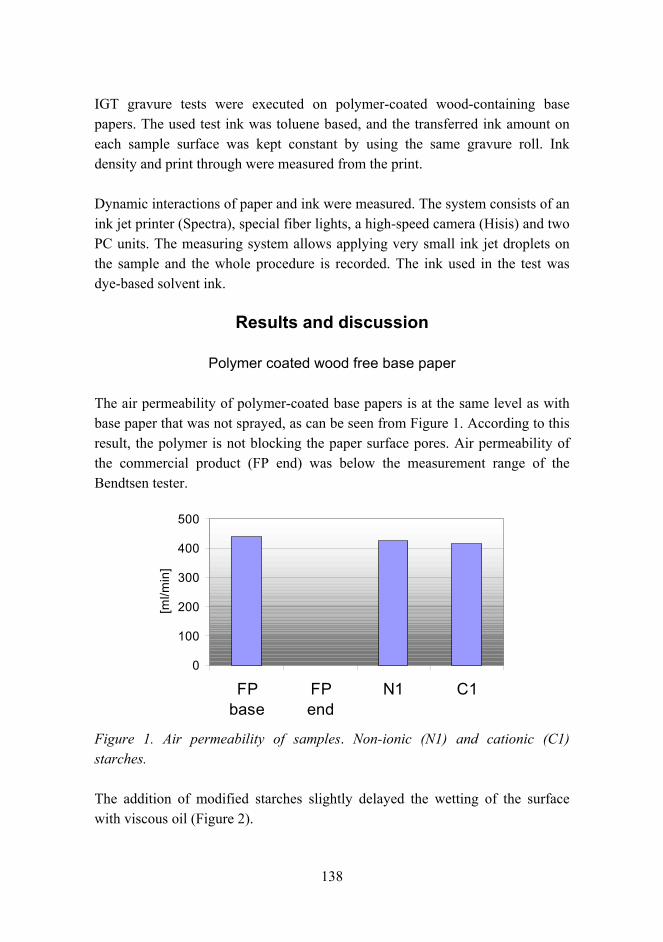
138
IGT gravure tests were executed on polymer-coated wood-containing base papers. The used test ink was toluene based, and the transferred ink amount on each sample surface was kept constant by using the same gravure roll. Ink density and print through were measured from the print.
Dynamic interactions of paper and ink were measured. The system consists of an ink jet printer (Spectra), special fiber lights, a high-speed camera (Hisis) and two PC units. The measuring system allows applying very small ink jet droplets on the sample and the whole procedure is recorded. The ink used in the test was dye-based solvent ink.
Results and discussion
Polymer coated wood free base paper
The air permeability of polymer-coated base papers is at the same level as with base paper that was not sprayed, as can be seen from Figure 1. According to this result, the polymer is not blocking the paper surface pores. Air permeability of the commercial product (FP end) was below the measurement range of the Bendtsen tester.
0
100
200
300
400
500
FPbase
FPend
N1 C1
[ml/m
in]
Figure 1. Air permeability of samples. Non-ionic (N1) and cationic (C1) starches.
The addition of modified starches slightly delayed the wetting of the surface with viscous oil (Figure 2).
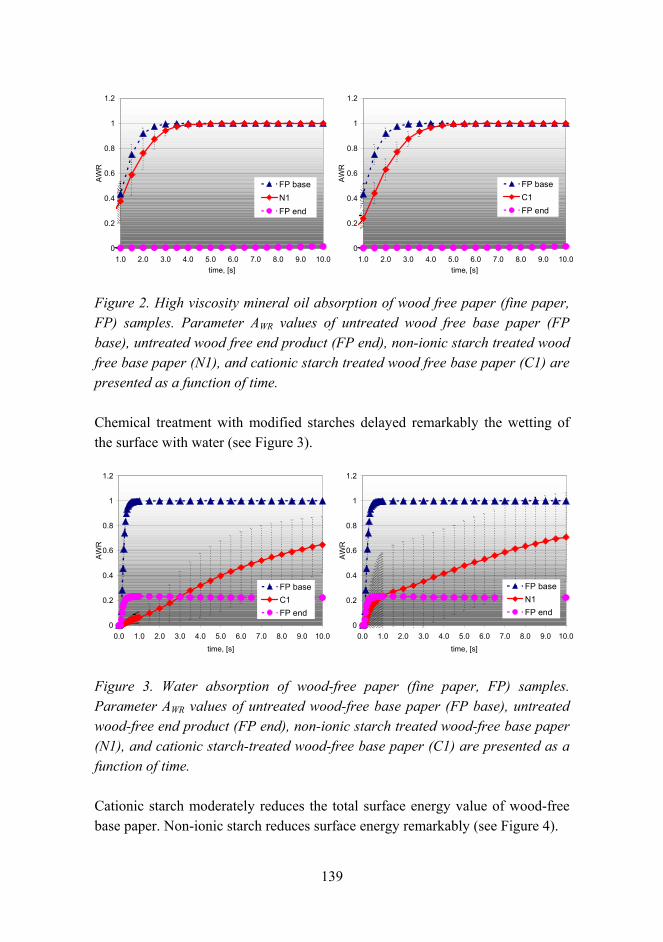
139
0
0.2
0.4
0.6
0.8
1
1.2
1.0 2.0 3.0 4.0 5.0 6.0 7.0 8.0 9.0 10.0time, [s]
AW
R
FP baseN1FP end
0
0.2
0.4
0.6
0.8
1
1.2
1.0 2.0 3.0 4.0 5.0 6.0 7.0 8.0 9.0 10.0time, [s]
AW
R
FP baseC1FP end
Figure 2. High viscosity mineral oil absorption of wood free paper (fine paper, FP) samples. Parameter AWR values of untreated wood free base paper (FP base), untreated wood free end product (FP end), non-ionic starch treated wood free base paper (N1), and cationic starch treated wood free base paper (C1) are presented as a function of time.
Chemical treatment with modified starches delayed remarkably the wetting of the surface with water (see Figure 3).
0
0.2
0.4
0.6
0.8
1
1.2
0.0 1.0 2.0 3.0 4.0 5.0 6.0 7.0 8.0 9.0 10.0time, [s]
AW
R
FP baseN1FP end
0
0.2
0.4
0.6
0.8
1
1.2
0.0 1.0 2.0 3.0 4.0 5.0 6.0 7.0 8.0 9.0 10.0time, [s]
AW
R
FP baseC1FP end
Figure 3. Water absorption of wood-free paper (fine paper, FP) samples. Parameter AWR values of untreated wood-free base paper (FP base), untreated wood-free end product (FP end), non-ionic starch treated wood-free base paper (N1), and cationic starch-treated wood-free base paper (C1) are presented as a function of time.
Cationic starch moderately reduces the total surface energy value of wood-free base paper. Non-ionic starch reduces surface energy remarkably (see Figure 4).
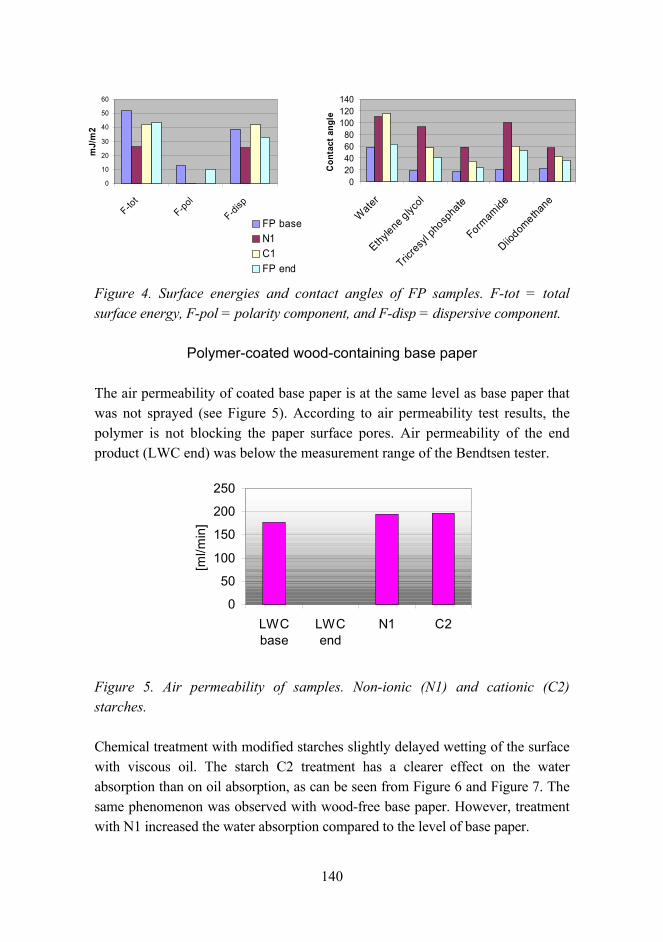
140
0
10
20
30
40
50
60
F-tot
F-pol
F-disp
mJ/
m2
FP baseN1C1FP end
020406080
100120140
Wate
r
Ethylene g
lycol
Tricresy
l pho
spha
te
Formam
ide
Diiodom
ethane
Con
tact
ang
le
Figure 4. Surface energies and contact angles of FP samples. F-tot = total surface energy, F-pol = polarity component, and F-disp = dispersive component.
Polymer-coated wood-containing base paper
The air permeability of coated base paper is at the same level as base paper that was not sprayed (see Figure 5). According to air permeability test results, the polymer is not blocking the paper surface pores. Air permeability of the end product (LWC end) was below the measurement range of the Bendtsen tester.
0
50
100
150
200
250
LWCbase
LWCend
N1 C2
[ml/m
in]
Figure 5. Air permeability of samples. Non-ionic (N1) and cationic (C2) starches.
Chemical treatment with modified starches slightly delayed wetting of the surface with viscous oil. The starch C2 treatment has a clearer effect on the water absorption than on oil absorption, as can be seen from Figure 6 and Figure 7. The same phenomenon was observed with wood-free base paper. However, treatment with N1 increased the water absorption compared to the level of base paper.
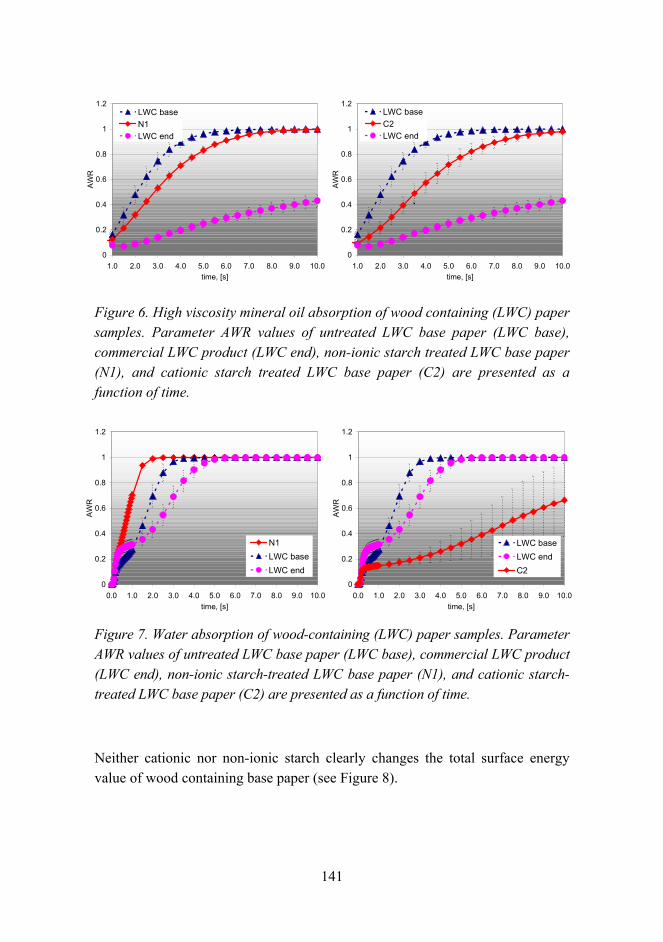
141
0
0.2
0.4
0.6
0.8
1
1.2
1.0 2.0 3.0 4.0 5.0 6.0 7.0 8.0 9.0 10.0time, [s]
AW
R
LWC baseN1LWC end
0
0.2
0.4
0.6
0.8
1
1.2
1.0 2.0 3.0 4.0 5.0 6.0 7.0 8.0 9.0 10.0time, [s]
AW
R
LWC baseC2LWC end
Figure 6. High viscosity mineral oil absorption of wood containing (LWC) paper samples. Parameter AWR values of untreated LWC base paper (LWC base), commercial LWC product (LWC end), non-ionic starch treated LWC base paper (N1), and cationic starch treated LWC base paper (C2) are presented as a function of time.
0
0.2
0.4
0.6
0.8
1
1.2
0.0 1.0 2.0 3.0 4.0 5.0 6.0 7.0 8.0 9.0 10.0time, [s]
AW
R
LWC baseLWC endC2
0
0.2
0.4
0.6
0.8
1
1.2
0.0 1.0 2.0 3.0 4.0 5.0 6.0 7.0 8.0 9.0 10.0time, [s]
AW
R
N1LWC baseLWC end
Figure 7. Water absorption of wood-containing (LWC) paper samples. Parameter AWR values of untreated LWC base paper (LWC base), commercial LWC product (LWC end), non-ionic starch-treated LWC base paper (N1), and cationic starch-treated LWC base paper (C2) are presented as a function of time.
Neither cationic nor non-ionic starch clearly changes the total surface energy value of wood containing base paper (see Figure 8).
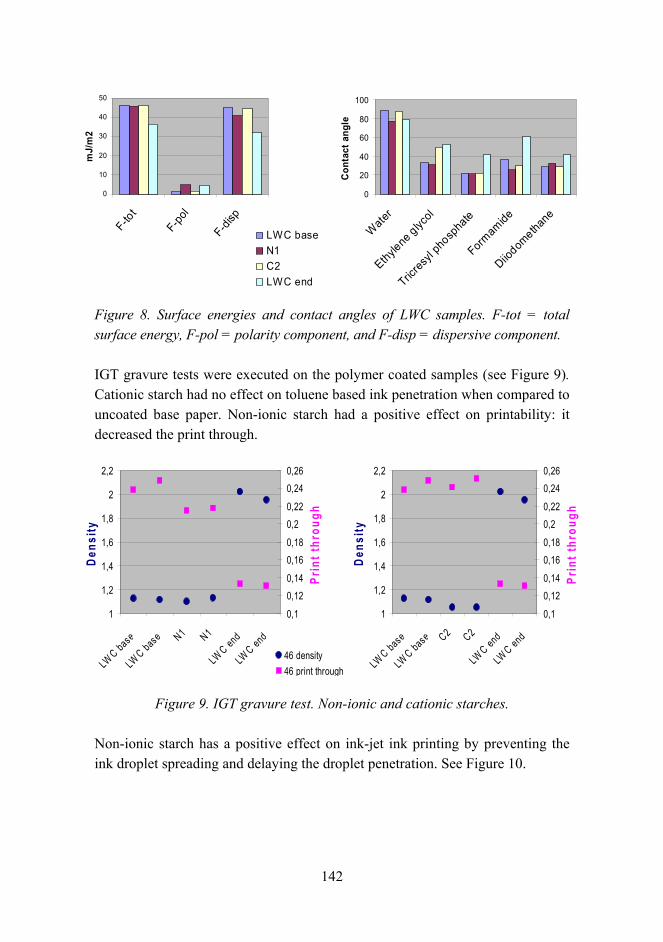
142
0
10
20
30
40
50
F-tot
F-pol
F-disp
mJ/
m2
LWC baseN1C2LWC end
0
20
40
60
80
100
Wate
r
Ethylene
glycol
Tricres
yl ph
ospha
te
Formamide
Diiodom
ethane
Con
tact
ang
le
Figure 8. Surface energies and contact angles of LWC samples. F-tot = total surface energy, F-pol = polarity component, and F-disp = dispersive component.
IGT gravure tests were executed on the polymer coated samples (see Figure 9). Cationic starch had no effect on toluene based ink penetration when compared to uncoated base paper. Non-ionic starch had a positive effect on printability: it decreased the print through.
1
1,2
1,4
1,6
1,8
2
2,2
LW C base
LW C base C2 C2
LW C end
LW C end
Den
sity
0,1
0,120,14
0,160,18
0,20,22
0,240,26
Prin
t thr
ough
1
1,2
1,4
1,6
1,8
2
2,2
LW C base
LW C base N1 N1
LW C end
LW C end
Den
sity
0,1
0,120,14
0,160,18
0,20,22
0,240,26
Prin
t thr
ough
46 density46 print through
Figure 9. IGT gravure test. Non-ionic and cationic starches.
Non-ionic starch has a positive effect on ink-jet ink printing by preventing the ink droplet spreading and delaying the droplet penetration. See Figure 10.
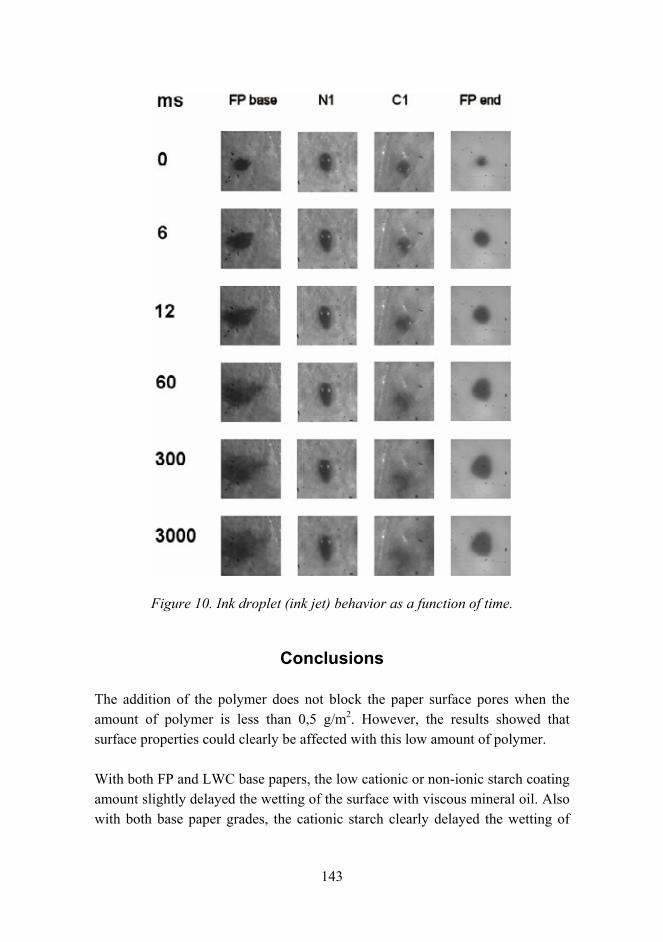
143
Figure 10. Ink droplet (ink jet) behavior as a function of time.
Conclusions
The addition of the polymer does not block the paper surface pores when the amount of polymer is less than 0,5 g/m2. However, the results showed that surface properties could clearly be affected with this low amount of polymer.
With both FP and LWC base papers, the low cationic or non-ionic starch coating amount slightly delayed the wetting of the surface with viscous mineral oil. Also with both base paper grades, the cationic starch clearly delayed the wetting of
144
the surface with water. Non-ionic starch acted differently; it delayed wetting with water in the case of FP base paper, but accelerated the wetting in the case of LWC base paper.
These oil and water wetting results indicate that both the starches that were tested can be used to adjust offset print quality.
Non-ionic starch had a positive effect on printability in IGT gravure printing: it decreased the print through of toluene based ink.
Non-ionic starch also had a positive effect on ink-jet ink printing by preventing the ink droplet spreading and delaying the droplet penetration.
Both starches changed the surface energy and contact angle values of wood-free base paper, but did not clearly change the values of wood-containing base paper.
As a conclusion, it can be said that with these starches it is possible to adjust the surface properties of base papers.
Acknowledgement
These results are included in the project Tailor-made and interactive paper, in which VTT, together with the Helsinki University of Technology and Jyväskylä University, is developing polymers to control paper surface characteristics by surface treatment with small amount of chemicals. Financial support was provided by Tekes the Finnish Funding Agency for Technology and Innovation, VTT Technical Research Centre of Finland, Metso Paper Oy, UPM-Kymmene Oyj, M-Real Oyj, Stora Enso Oyj, Ciba Specialty Chemicals Inc., Kemira Oyj, and Myllykoski Paper.
145
Improved UV resistance of wood with nano-hybrid coatings
Riitta Mahlberg1, Saila Jämsä1, Mia Löija1, Soili Takala1, Juha Mannila2, Anne Pahkala2, Marke Kallio2 & Anne-Christine Ritschkoff1
VTT Technical Research Centre of Finland 1Betonimiehenkuja 5, Espoo, P.O. Box 1000, FI-02044 VTT
2Sinitaival 6, Tampere, P.O. Box 1300, FI-33101 Tampere
Abstract
Wood and wood-based composites are widely used as construction, furnishing and decorating materials for ecological and aesthetic reasons. However, wood surfaces are easily damaged when exposed outdoors to UV radiation. Wood products with improved UV resistance properties can be achieved by using coating systems based on the sol-gel technique. By optimizing the composition of the sol-gel, the properties of the thin coatings can be directed to the desired direction. The objective of this study was to investigate the effect of sol-gel hybrid coatings on the UV-resistance of wood. The sol-gel coatings used were based on alkoxysilanes. Scots pine sapwood (Pinus sylvestris) samples were treated with two different sol-gel coatings and with a coating containing inorganic pigments. Treatments of pine wood with these thin coatings did not change the natural appearance of the substrate (gloss and color quite equal to that of untreated wood). The samples were exposed to UV light and the efficacy of the treatments was evaluated by means of surface characteristic measurements (e.g., gloss, contact angle, color measurements) before and after the exposure. The results obtained show that the hybrid nanocomposite sol-gel treatments restrain color changes of wood surfaces.
Introduction
The aesthetic appearance and decorative effect of wood are based on the distinctive color and texture of the wood surface. However, wood undergoes rapid color and chemical changes due to exposure to ultraviolet (UV) light and
146
water. Of the different components of wood, lignin is mainly responsible for absorption of UV light and for the degradation reactions leading to discoloration of the wood surface. The degradation reactions of the lignin network cause formation of quinone structures, which appear in dark colors. UV radiation affects only the very superficial layers of wood. However, secondary reactions also induce chemical changes in other components of wood and deeper down from the surface. Ultimately, this, especially in combination with moisture, leads to more severe damage of the wood, such as checking.
Different surface treatments have been used to stabilize wood surfaces against photo-degradation. These methods include impeding UV absorbers, free radical scavengers and so on in clear paint or lacquer matrices. In addition, surface modification of wood with chemicals forming covalent bonds with the wood components has been reported to improve the UV resistance of wood [1]. Recently, sol-gel coatings have gained increasing interest as surface treatment agents for wood [2, 3]. Sol-gel deposition of alkoxysilanes on wooden surfaces is also suggested to result in a polysiloxane network that is covalently bonded to the substrate [4].
Sol-gel hybrid coatings are promising new materials consisting of organic-inorganic components with a nanoscale structure. Sol-gel coatings with thickness from nanoscale to several microns consist of different parent substances that will build a nanoscale network through hydrolysis and condensation reactions. Alkoxides are common precursors in sol-gel concepts. Organic epoxides are also widely used as modifiers in sol-gel materials. By using different precursors and manufacturing routes, the coatings have various combinations of properties depending on the structure and chemical composition of the coating [5]. Ceramic components provide hardness and scratch/abrasion resistance, whereas polymer components provide flexibility and repelling properties for the tough and durable coatings. By tailoring and optimizing the composition, the properties of sol-gel thin coating can be directed in a certain direction. In addition, integration of active nanoparticles such as photocatalytic TiO2 or anti-microbial particles within the sol-gel network offers many possibilities to create extra functionality in the coatings.
One of the major advantages in using these coatings is their transparency to visible light and therefore they do not remarkably change the appearance of the
147
substrate. Sol-gel thin coatings can be tailored to have a good adhesion to many substrate materials, such as metals, ceramics, glass, polymers, concrete, wood and paper. In view of lignocellulosic surfaces such as wood and wood composites, adhesion of sol-gel coatings to these substrates is not considered to be a problem since, as mentioned above, sol-gel networks have been reported to bond covalently with the functional groups of lignin and cellulose. Application of sol-gel coating on different substrates can be carried out by spin, spray, dip, roll or drain coating. For wood surfaces, spray or roll coating could be the most optimal treatment types.
In this work, the effect of sol-gel coatings on the UV resistance of wood was investigated. Moreover, the performance of sol-gel hybrid coatings containing titanium dioxide pigments was studied.
Experimental
Materials
Pine sapwood (Pinus sylvestris) samples in dimensions of 5 x 50 x 100 mm (radial x tangential x longitudinal) were used as the substrate material in the study. The specimens orginated from the same tree and specimen surfaces were free of knots and planed. Prior to the surface treatments, the specimens were conditioned at 50% relative humidity (RH) and 20 °C.
The wood specimens were coated with two sol-gel coatings referred to as SG I and SG II. The coatings differed from each other in terms of the chemical composition as shown in Table 1. In addition, the performance of sol-gel coatings as matrices for UV stabilizers/additives was evaluated by integrating titanium dioxide additives in the latter coating (SG II). The pigments used are referred to as P Ia, P Ib and P II and they differed from each other, for example, in terms of the particle size or surface chemistry (P Ia and Ib).
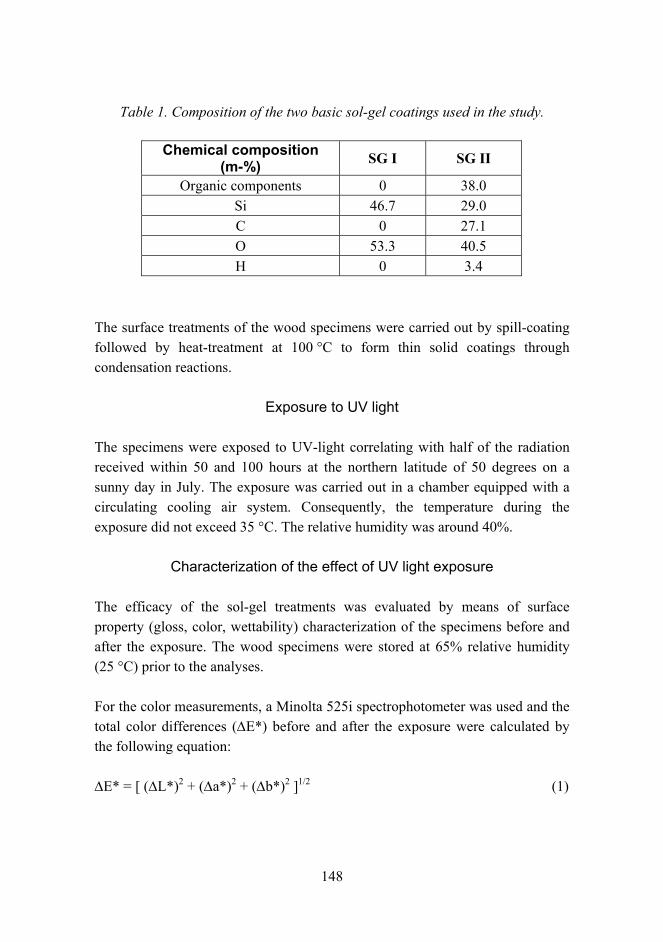
148
Table 1. Composition of the two basic sol-gel coatings used in the study.
Chemical composition (m-%) SG I SG II
Organic components 0 38.0 Si 46.7 29.0 C 0 27.1 O 53.3 40.5 H 0 3.4
The surface treatments of the wood specimens were carried out by spill-coating followed by heat-treatment at 100 °C to form thin solid coatings through condensation reactions.
Exposure to UV light
The specimens were exposed to UV-light correlating with half of the radiation received within 50 and 100 hours at the northern latitude of 50 degrees on a sunny day in July. The exposure was carried out in a chamber equipped with a circulating cooling air system. Consequently, the temperature during the exposure did not exceed 35 °C. The relative humidity was around 40%.
Characterization of the effect of UV light exposure
The efficacy of the sol-gel treatments was evaluated by means of surface property (gloss, color, wettability) characterization of the specimens before and after the exposure. The wood specimens were stored at 65% relative humidity (25 °C) prior to the analyses.
For the color measurements, a Minolta 525i spectrophotometer was used and the total color differences (∆E*) before and after the exposure were calculated by the following equation:
∆E* = [ (∆L*)2 + (∆a*)2 + (∆b*)2 ]1/2 (1)
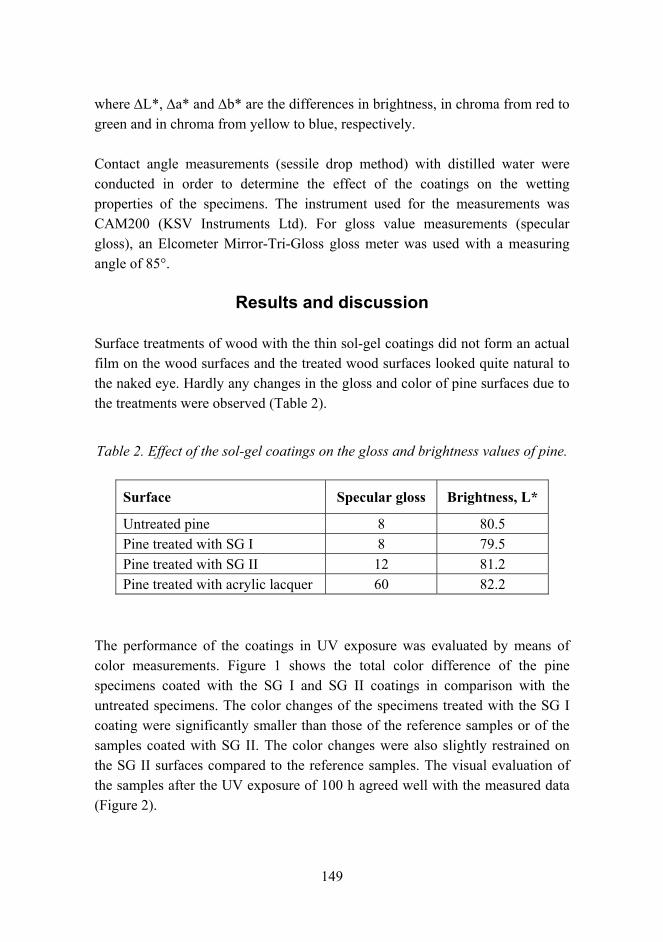
149
where ∆L*, ∆a* and ∆b* are the differences in brightness, in chroma from red to green and in chroma from yellow to blue, respectively.
Contact angle measurements (sessile drop method) with distilled water were conducted in order to determine the effect of the coatings on the wetting properties of the specimens. The instrument used for the measurements was CAM200 (KSV Instruments Ltd). For gloss value measurements (specular gloss), an Elcometer Mirror-Tri-Gloss gloss meter was used with a measuring angle of 85°.
Results and discussion
Surface treatments of wood with the thin sol-gel coatings did not form an actual film on the wood surfaces and the treated wood surfaces looked quite natural to the naked eye. Hardly any changes in the gloss and color of pine surfaces due to the treatments were observed (Table 2).
Table 2. Effect of the sol-gel coatings on the gloss and brightness values of pine.
Surface Specular gloss Brightness, L*
Untreated pine 8 80.5 Pine treated with SG I 8 79.5 Pine treated with SG II 12 81.2 Pine treated with acrylic lacquer 60 82.2
The performance of the coatings in UV exposure was evaluated by means of color measurements. Figure 1 shows the total color difference of the pine specimens coated with the SG I and SG II coatings in comparison with the untreated specimens. The color changes of the specimens treated with the SG I coating were significantly smaller than those of the reference samples or of the samples coated with SG II. The color changes were also slightly restrained on the SG II surfaces compared to the reference samples. The visual evaluation of the samples after the UV exposure of 100 h agreed well with the measured data (Figure 2).
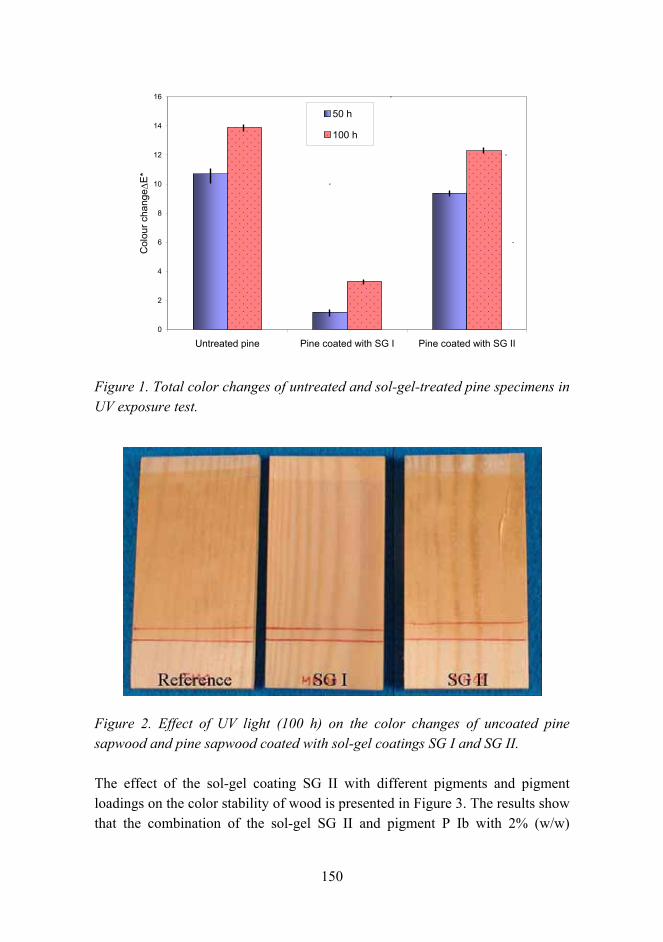
150
0
2
4
6
8
10
12
14
16
Untreated pine Pine coated with SG I Pine coated with SG II
Col
our c
hang
e ∆E
*
50 h
100 h
Figure 1. Total color changes of untreated and sol-gel-treated pine specimens in UV exposure test.
Figure 2. Effect of UV light (100 h) on the color changes of uncoated pine sapwood and pine sapwood coated with sol-gel coatings SG I and SG II.
The effect of the sol-gel coating SG II with different pigments and pigment loadings on the color stability of wood is presented in Figure 3. The results show that the combination of the sol-gel SG II and pigment P Ib with 2% (w/w)
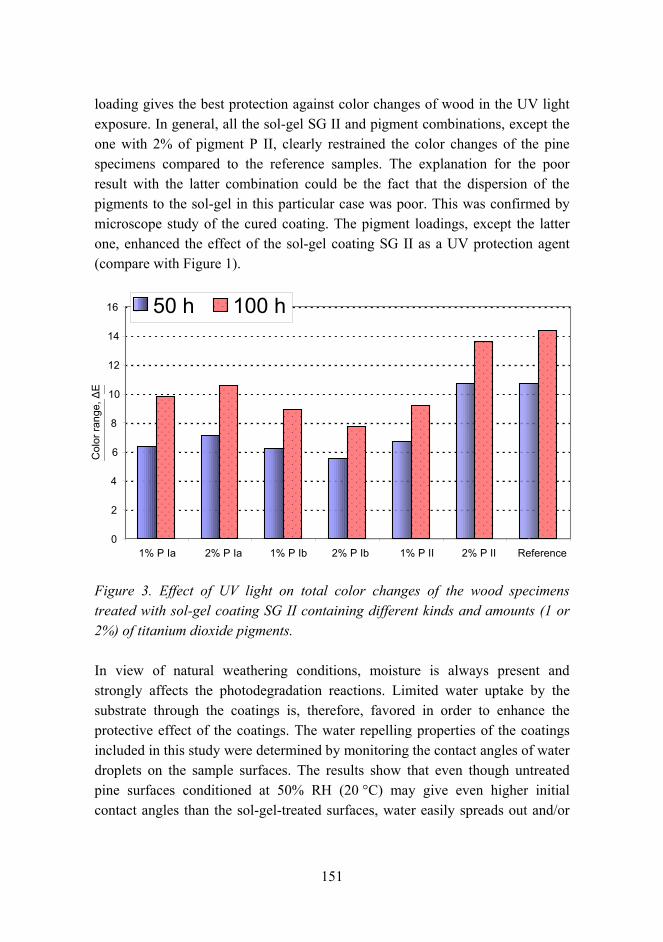
151
loading gives the best protection against color changes of wood in the UV light exposure. In general, all the sol-gel SG II and pigment combinations, except the one with 2% of pigment P II, clearly restrained the color changes of the pine specimens compared to the reference samples. The explanation for the poor result with the latter combination could be the fact that the dispersion of the pigments to the sol-gel in this particular case was poor. This was confirmed by microscope study of the cured coating. The pigment loadings, except the latter one, enhanced the effect of the sol-gel coating SG II as a UV protection agent (compare with Figure 1).
Figure 3. Effect of UV light on total color changes of the wood specimens treated with sol-gel coating SG II containing different kinds and amounts (1 or 2%) of titanium dioxide pigments.
In view of natural weathering conditions, moisture is always present and strongly affects the photodegradation reactions. Limited water uptake by the substrate through the coatings is, therefore, favored in order to enhance the protective effect of the coatings. The water repelling properties of the coatings included in this study were determined by monitoring the contact angles of water droplets on the sample surfaces. The results show that even though untreated pine surfaces conditioned at 50% RH (20 °C) may give even higher initial contact angles than the sol-gel-treated surfaces, water easily spreads out and/or
0
2
4
6
8
10
12
14
16
1% P Ia 2% P Ia 1% P Ib 2% P Ib 1% P II 2% P II Reference
¬
50 h 100 h
Col
or ra
nge,
∆E
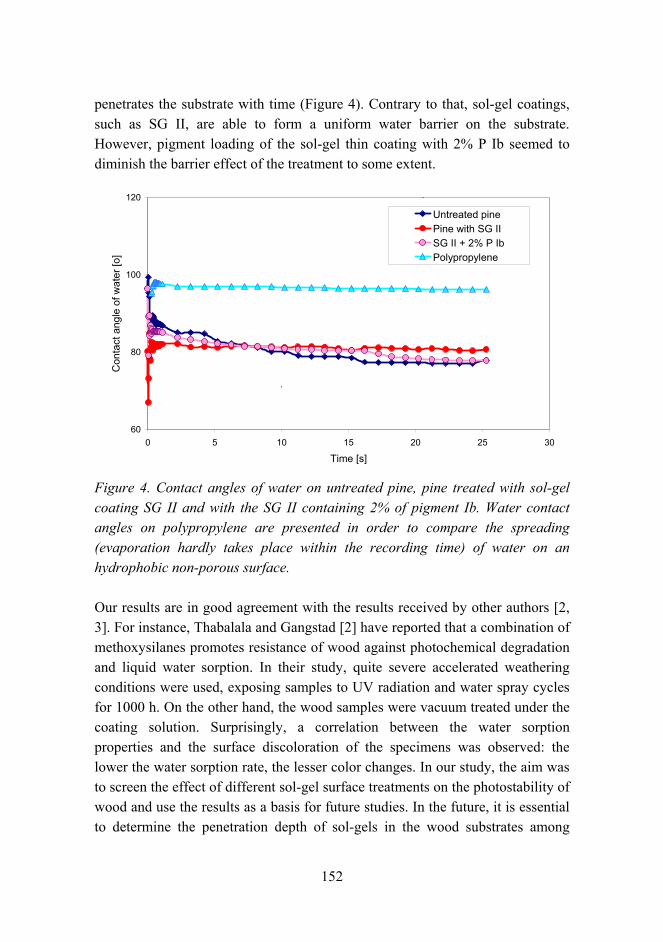
152
penetrates the substrate with time (Figure 4). Contrary to that, sol-gel coatings, such as SG II, are able to form a uniform water barrier on the substrate. However, pigment loading of the sol-gel thin coating with 2% P Ib seemed to diminish the barrier effect of the treatment to some extent.
60
80
100
120
0 5 10 15 20 25 30
Time [s]
Con
tact
ang
le o
f wat
er [o
]
Untreated pinePine with SG IISG II + 2% P IbPolypropylene
Figure 4. Contact angles of water on untreated pine, pine treated with sol-gel coating SG II and with the SG II containing 2% of pigment Ib. Water contact angles on polypropylene are presented in order to compare the spreading (evaporation hardly takes place within the recording time) of water on an hydrophobic non-porous surface.
Our results are in good agreement with the results received by other authors [2, 3]. For instance, Thabalala and Gangstad [2] have reported that a combination of methoxysilanes promotes resistance of wood against photochemical degradation and liquid water sorption. In their study, quite severe accelerated weathering conditions were used, exposing samples to UV radiation and water spray cycles for 1000 h. On the other hand, the wood samples were vacuum treated under the coating solution. Surprisingly, a correlation between the water sorption properties and the surface discoloration of the specimens was observed: the lower the water sorption rate, the lesser color changes. In our study, the aim was to screen the effect of different sol-gel surface treatments on the photostability of wood and use the results as a basis for future studies. In the future, it is essential to determine the penetration depth of sol-gels in the wood substrates among
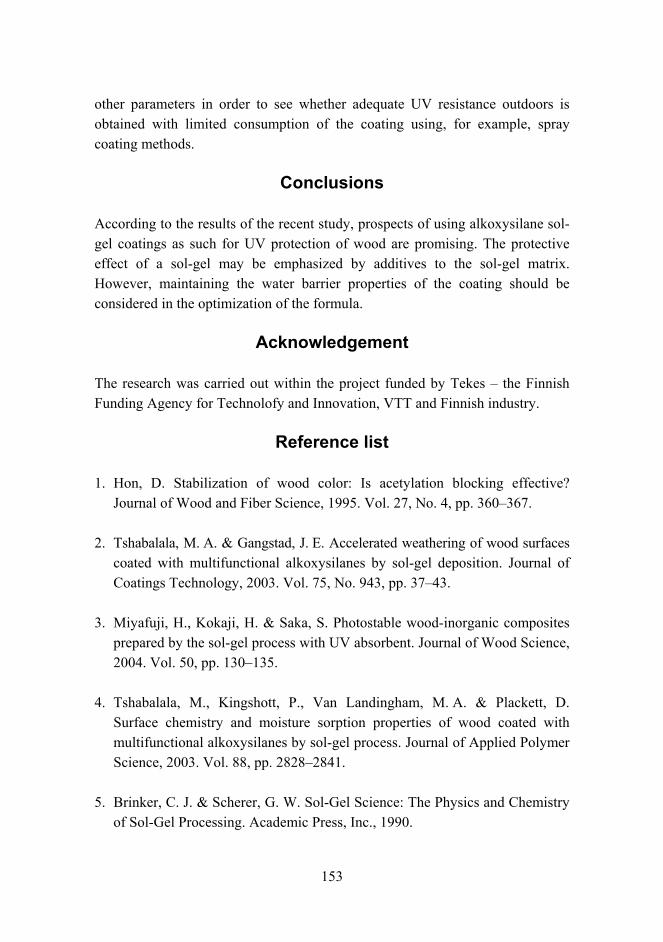
153
other parameters in order to see whether adequate UV resistance outdoors is obtained with limited consumption of the coating using, for example, spray coating methods.
Conclusions
According to the results of the recent study, prospects of using alkoxysilane sol-gel coatings as such for UV protection of wood are promising. The protective effect of a sol-gel may be emphasized by additives to the sol-gel matrix. However, maintaining the water barrier properties of the coating should be considered in the optimization of the formula.
Acknowledgement
The research was carried out within the project funded by Tekes the Finnish Funding Agency for Technolofy and Innovation, VTT and Finnish industry.
Reference list
1. Hon, D. Stabilization of wood color: Is acetylation blocking effective? Journal of Wood and Fiber Science, 1995. Vol. 27, No. 4, pp. 360367.
2. Tshabalala, M. A. & Gangstad, J. E. Accelerated weathering of wood surfaces coated with multifunctional alkoxysilanes by sol-gel deposition. Journal of Coatings Technology, 2003. Vol. 75, No. 943, pp. 3743.
3. Miyafuji, H., Kokaji, H. & Saka, S. Photostable wood-inorganic composites prepared by the sol-gel process with UV absorbent. Journal of Wood Science, 2004. Vol. 50, pp. 130135.
4. Tshabalala, M., Kingshott, P., Van Landingham, M. A. & Plackett, D. Surface chemistry and moisture sorption properties of wood coated with multifunctional alkoxysilanes by sol-gel process. Journal of Applied Polymer Science, 2003. Vol. 88, pp. 28282841.
5. Brinker, C. J. & Scherer, G. W. Sol-Gel Science: The Physics and Chemistry of Sol-Gel Processing. Academic Press, Inc., 1990.
154
The effects of chemical parameters and topography on the properties of the hybrid
sol-gel coatings
1Juha Nikkola, 1Marke Kallio, 1Juha Mannila, 1Anne Pahkala, 1Mika Kolari, 2Riitta Mahlberg, 2Olli Posti & 3Amar Mahiout
VTT Technical Research Centre of Finland 1Sinitaival 6, Tampere, P.O. Box 1300, FI-33101 Tampere
2Betonimiehenkuja 5, Espoo, P.O. Box 1000, FI-02044 VTT 3Metallimiehenkuja 8, Espoo, P.O. Box 1000, FI-02044 VTT
Abstract
Corrosion, fouling and wearing of metal surfaces are the most common problems that can cause a decrease in the use value of metal products and therefore financial losses in the metal industry. For this reason, nanoscale hybrid sol-gel coatings have been developed to protect metal surfaces. The aim of this research was to study the effects of chemical parameters and topography on the properties of the sol-gel coating developed by VTT. The inorganic-organic sol-gel coating was studied as such and as coated on stainless steel and copper substrates. The early-stage sol-gel reactions were examined with ATR-FTIR and with measurements of surface tension of the sol. FTIR and DSC were used to determine thermal curing processes. Topography of the sol-gel coating was studied by using profilometry and coating thickness measurements. In addition, surface properties of the sol-gel coating were examined. The sol-gel chemistry characterizations gave information about the phases of sol-gel reactions. Moreover, the topography measurements indicated changes in surface roughness of the thin film during the ageing process of the sol. On the basis of the important information obtained in this study, the protective properties of sol-gel coatings can be tailored for different purposes.
155
Introduction
During the last ten years there has been a general interest to study the potential of nanoscale inorganic-organic hybrid sol-gel coatings to improve the properties of metal surfaces. The sol-gel process involves the evolution of inorganic networks in a continuous liquid phase through the formation of colloidal suspension and the following gelation of the sol. Controlled hydrolysis and condensation reactions are the keys for the formation of the sol-gel matrix. Due to these reactions the sol-gel technique offers a great opportunity to produce functional and premium transparent thin films. Hydrolysis acts as a rapid initial reaction of the sol-gel process, where reactive alkoxide groups react with water molecules to form hydroxyl groups. Reaction 1 represents the hydrolysis, where M is usually silicon, zirconium or titanium and n equals generally four. [1]
M(OR)n + H2O (OR) n-1M(OH) + ROH (1)
After the initiation the hydrolyzed alkoxides react easily with each other to produce the backbone of the sol-gel network. Water or alcohol is obtained as a by-product depending on the reaction mechanism. The condensation reactions are also explained by reactions 2 and 3. [1]
M(OH)(OR)n-1 + M(OR)n (OR)n-1MOM(OR)n-1 + ROH (2)
2M(OH)(OR)n-1 (OR)n-1MOM(OR)n-1 + H2O (3)
Hybrid sol-gel coatings have been studied by several research groups around the world. These coatings can be deposited on several substrates, like ceramics, glasses, metals, wood and plastics. The benefits of the hybrid sol-gel thin films are low processing temperatures, relatively low cost precursors and the possibility to add functional molecules in the sol-gel matrix. [1] Consequently, sol-gel coatings can improve and modify surface properties of substrates, for instance wear and scratch resistance, chemical and corrosion resistance, topography and also surface energy. Most of these properties are fundamental when protective surface treatments for metals are developed. Sol-gel coatings usually have excellent adhesion properties and they may form very tough bonds with the metal surface. In addition, in few cases decorative properties and UV
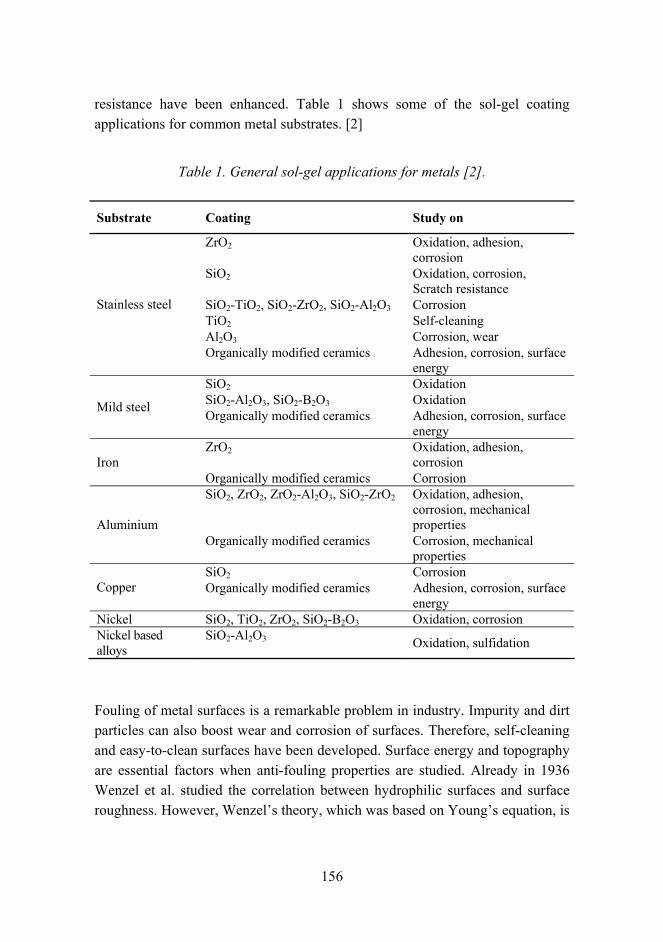
156
resistance have been enhanced. Table 1 shows some of the sol-gel coating applications for common metal substrates. [2]
Table 1. General sol-gel applications for metals [2].
Substrate Coating Study on
ZrO2 Oxidation, adhesion, corrosion
SiO2 Oxidation, corrosion, Scratch resistance
SiO2-TiO2, SiO2-ZrO2, SiO2-Al2O3 Corrosion TiO2 Self-cleaning Al2O3 Corrosion, wear
Stainless steel
Organically modified ceramics Adhesion, corrosion, surface energy
SiO2 Oxidation SiO2-Al2O3, SiO2-B2O3 Oxidation Mild steel Organically modified ceramics Adhesion, corrosion, surface
energy ZrO2 Oxidation, adhesion,
corrosion Iron Organically modified ceramics Corrosion SiO2, ZrO2, ZrO2-Al2O3, SiO2-ZrO2 Oxidation, adhesion,
corrosion, mechanical properties Aluminium
Organically modified ceramics Corrosion, mechanical properties
SiO2 Corrosion Copper Organically modified ceramics Adhesion, corrosion, surface
energy Nickel SiO2, TiO2, ZrO2, SiO2-B2O3 Oxidation, corrosion Nickel based alloys
SiO2-Al2O3 Oxidation, sulfidation
Fouling of metal surfaces is a remarkable problem in industry. Impurity and dirt particles can also boost wear and corrosion of surfaces. Therefore, self-cleaning and easy-to-clean surfaces have been developed. Surface energy and topography are essential factors when anti-fouling properties are studied. Already in 1936 Wenzel et al. studied the correlation between hydrophilic surfaces and surface roughness. However, Wenzels theory, which was based on Youngs equation, is
157
useful only for homogeneous surfaces with a smooth surface roughness. Cassie and Baxter have modified Wenzels equation to be more applicable to heterogeneous and rougher surfaces. Several studies have pointed out that topography and morphology have an impact on the surface chemistry. Particularly, surfaces that simulate the well-known Lotus-effect prevent the adhesion of contaminating particles and improve water repellence. [1, 3] According to these studies, regularly nanostructured surfaces would be optimal for easy-to-clean surfaces. Self-cleaning surfaces are usually photocatalytically active and either hydrophilic or superhydrophilic in which cases the lowest value for the water contact angle can be even zero degree. The surface can then attract organic dirt particles that decompose when the surface is activated by UV light. Eventually, water spreads easily under the dirt and cleans the surface. [1]
The present work studies the effects of chemical parameters and topography on the properties of the hybrid sol-gel coating developed by VTT. The hybrid thin film was deposited on stainless steel and copper substrates. The study was carried out as a part of the PUHTEET project in collaboration with Finnish metal industry, Tekes and VTT.
Experimental
Materials
The coated substrates were stainless steel (EN 1.4301 2J, marked here as SS DB) with dry brushed finishing and three copper products including two different coppers and one copper alloy (Oxygen-free, dark oxidation and copper-nickel alloy). Before the deposition the substrates were rinsed and cleaned with acetone and ethanol. The metal substrates were spill-coated with a silane-based hybrid sol-gel coating with total mass content of polymer approximately 13%. A stoichiometrical amount of water was used to begin and control the hydrolysis and condensation reactions.
Characterization of the chemical parameters
The hydrolysis and condensation reactions were characterised by using attenuated total reflectance infrared spectroscopy (ATR-FTIR). The measurements were performed with a Perkin Elmer FTIR Spectrum One spectrometer. In the
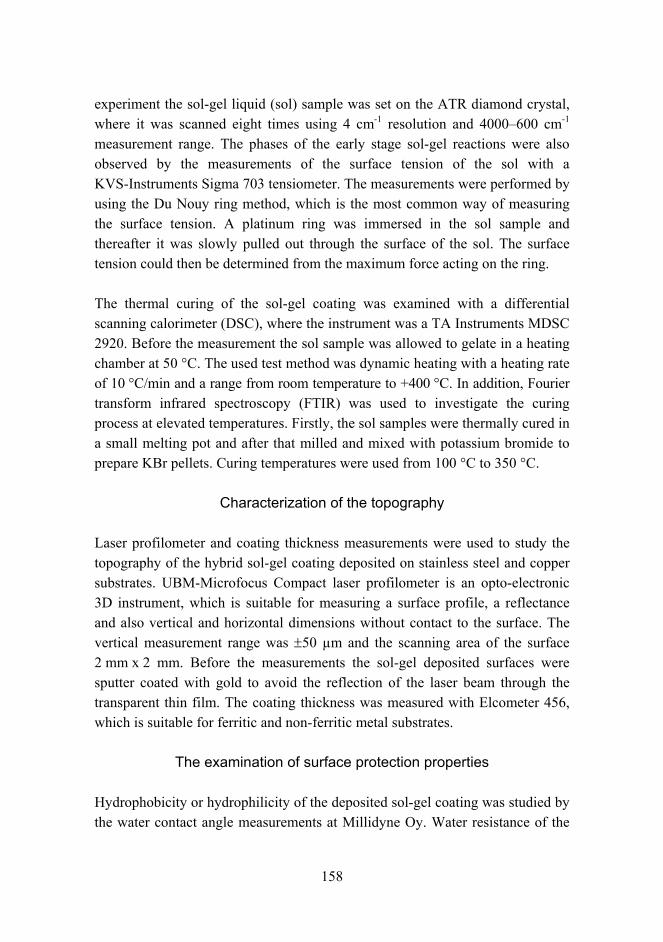
158
experiment the sol-gel liquid (sol) sample was set on the ATR diamond crystal, where it was scanned eight times using 4 cm-1 resolution and 4000600 cm-1
measurement range. The phases of the early stage sol-gel reactions were also observed by the measurements of the surface tension of the sol with a KVS-Instruments Sigma 703 tensiometer. The measurements were performed by using the Du Nouy ring method, which is the most common way of measuring the surface tension. A platinum ring was immersed in the sol sample and thereafter it was slowly pulled out through the surface of the sol. The surface tension could then be determined from the maximum force acting on the ring.
The thermal curing of the sol-gel coating was examined with a differential scanning calorimeter (DSC), where the instrument was a TA Instruments MDSC 2920. Before the measurement the sol sample was allowed to gelate in a heating chamber at 50 °C. The used test method was dynamic heating with a heating rate of 10 °C/min and a range from room temperature to +400 °C. In addition, Fourier transform infrared spectroscopy (FTIR) was used to investigate the curing process at elevated temperatures. Firstly, the sol samples were thermally cured in a small melting pot and after that milled and mixed with potassium bromide to prepare KBr pellets. Curing temperatures were used from 100 °C to 350 °C.
Characterization of the topography
Laser profilometer and coating thickness measurements were used to study the topography of the hybrid sol-gel coating deposited on stainless steel and copper substrates. UBM-Microfocus Compact laser profilometer is an opto-electronic 3D instrument, which is suitable for measuring a surface profile, a reflectance and also vertical and horizontal dimensions without contact to the surface. The vertical measurement range was ±50 µm and the scanning area of the surface 2 mm x 2 mm. Before the measurements the sol-gel deposited surfaces were sputter coated with gold to avoid the reflection of the laser beam through the transparent thin film. The coating thickness was measured with Elcometer 456, which is suitable for ferritic and non-ferritic metal substrates.
The examination of surface protection properties
Hydrophobicity or hydrophilicity of the deposited sol-gel coating was studied by the water contact angle measurements at Millidyne Oy. Water resistance of the
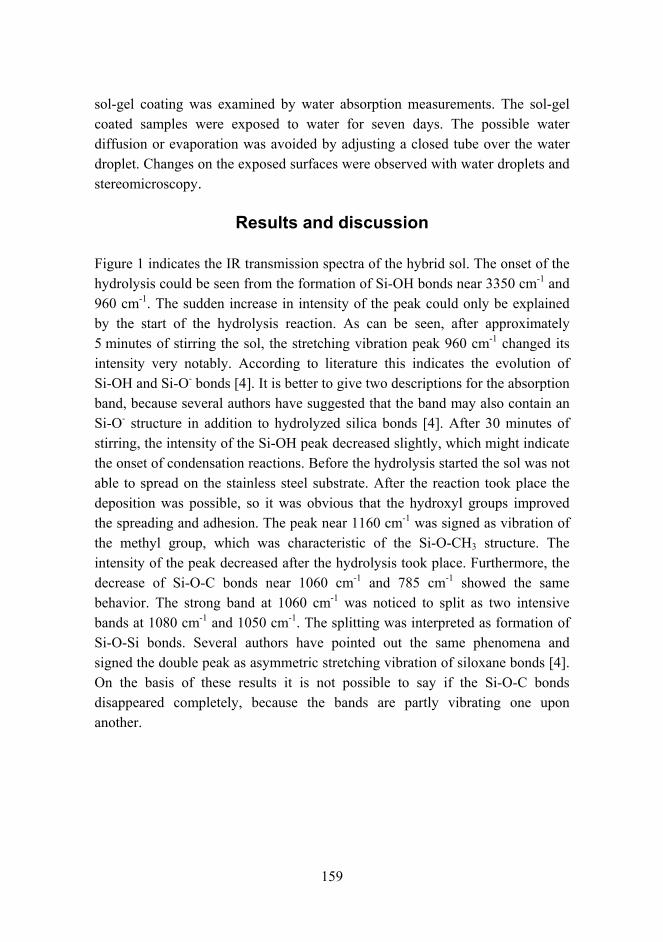
159
sol-gel coating was examined by water absorption measurements. The sol-gel coated samples were exposed to water for seven days. The possible water diffusion or evaporation was avoided by adjusting a closed tube over the water droplet. Changes on the exposed surfaces were observed with water droplets and stereomicroscopy.
Results and discussion
Figure 1 indicates the IR transmission spectra of the hybrid sol. The onset of the hydrolysis could be seen from the formation of Si-OH bonds near 3350 cm-1 and 960 cm-1. The sudden increase in intensity of the peak could only be explained by the start of the hydrolysis reaction. As can be seen, after approximately 5 minutes of stirring the sol, the stretching vibration peak 960 cm-1 changed its intensity very notably. According to literature this indicates the evolution of Si-OH and Si-O- bonds [4]. It is better to give two descriptions for the absorption band, because several authors have suggested that the band may also contain an Si-O- structure in addition to hydrolyzed silica bonds [4]. After 30 minutes of stirring, the intensity of the Si-OH peak decreased slightly, which might indicate the onset of condensation reactions. Before the hydrolysis started the sol was not able to spread on the stainless steel substrate. After the reaction took place the deposition was possible, so it was obvious that the hydroxyl groups improved the spreading and adhesion. The peak near 1160 cm-1 was signed as vibration of the methyl group, which was characteristic of the Si-O-CH3 structure. The intensity of the peak decreased after the hydrolysis took place. Furthermore, the decrease of Si-O-C bonds near 1060 cm-1 and 785 cm-1 showed the same behavior. The strong band at 1060 cm-1 was noticed to split as two intensive bands at 1080 cm-1 and 1050 cm-1. The splitting was interpreted as formation of Si-O-Si bonds. Several authors have pointed out the same phenomena and signed the double peak as asymmetric stretching vibration of siloxane bonds [4]. On the basis of these results it is not possible to say if the Si-O-C bonds disappeared completely, because the bands are partly vibrating one upon another.
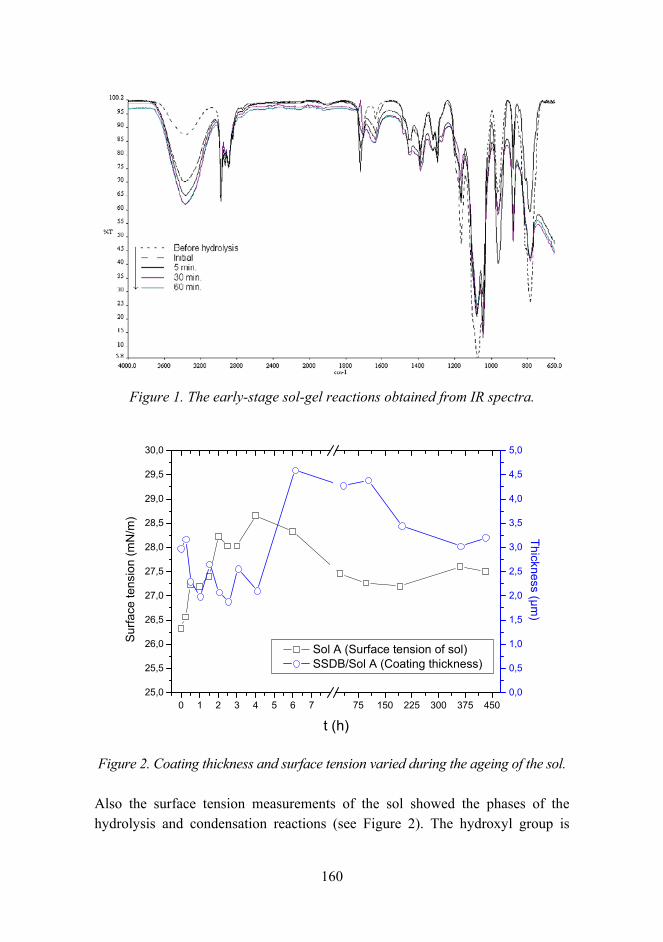
160
Figure 1. The early-stage sol-gel reactions obtained from IR spectra.
0 1 2 3 4 5 6 7 75 150 225 300 375 45025,0
25,5
26,0
26,5
27,0
27,5
28,0
28,5
29,0
29,5
30,0
Sol A (Surface tension of sol) SSDB/Sol A (Coating thickness)
t (h)
Sur
face
tens
ion
(mN
/m)
0,0
0,5
1,0
1,5
2,0
2,5
3,0
3,5
4,0
4,5
5,0
Thickness (µm)
Figure 2. Coating thickness and surface tension varied during the ageing of the sol.
Also the surface tension measurements of the sol showed the phases of the hydrolysis and condensation reactions (see Figure 2). The hydroxyl group is
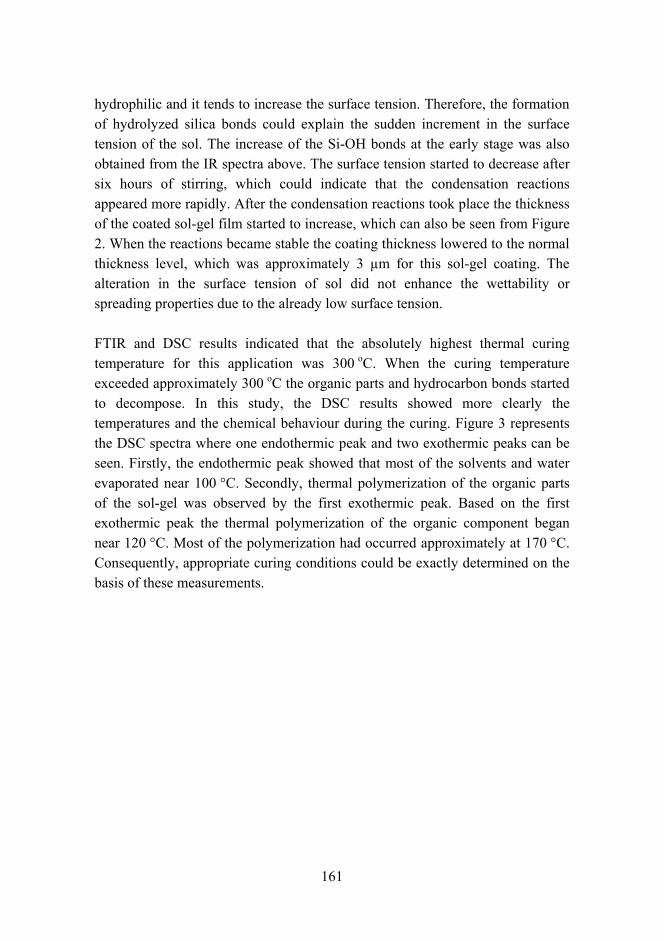
161
hydrophilic and it tends to increase the surface tension. Therefore, the formation of hydrolyzed silica bonds could explain the sudden increment in the surface tension of the sol. The increase of the Si-OH bonds at the early stage was also obtained from the IR spectra above. The surface tension started to decrease after six hours of stirring, which could indicate that the condensation reactions appeared more rapidly. After the condensation reactions took place the thickness of the coated sol-gel film started to increase, which can also be seen from Figure 2. When the reactions became stable the coating thickness lowered to the normal thickness level, which was approximately 3 µm for this sol-gel coating. The alteration in the surface tension of sol did not enhance the wettability or spreading properties due to the already low surface tension.
FTIR and DSC results indicated that the absolutely highest thermal curing temperature for this application was 300 oC. When the curing temperature exceeded approximately 300 oC the organic parts and hydrocarbon bonds started to decompose. In this study, the DSC results showed more clearly the temperatures and the chemical behaviour during the curing. Figure 3 represents the DSC spectra where one endothermic peak and two exothermic peaks can be seen. Firstly, the endothermic peak showed that most of the solvents and water evaporated near 100 °C. Secondly, thermal polymerization of the organic parts of the sol-gel was observed by the first exothermic peak. Based on the first exothermic peak the thermal polymerization of the organic component began near 120 °C. Most of the polymerization had occurred approximately at 170 °C. Consequently, appropriate curing conditions could be exactly determined on the basis of these measurements.
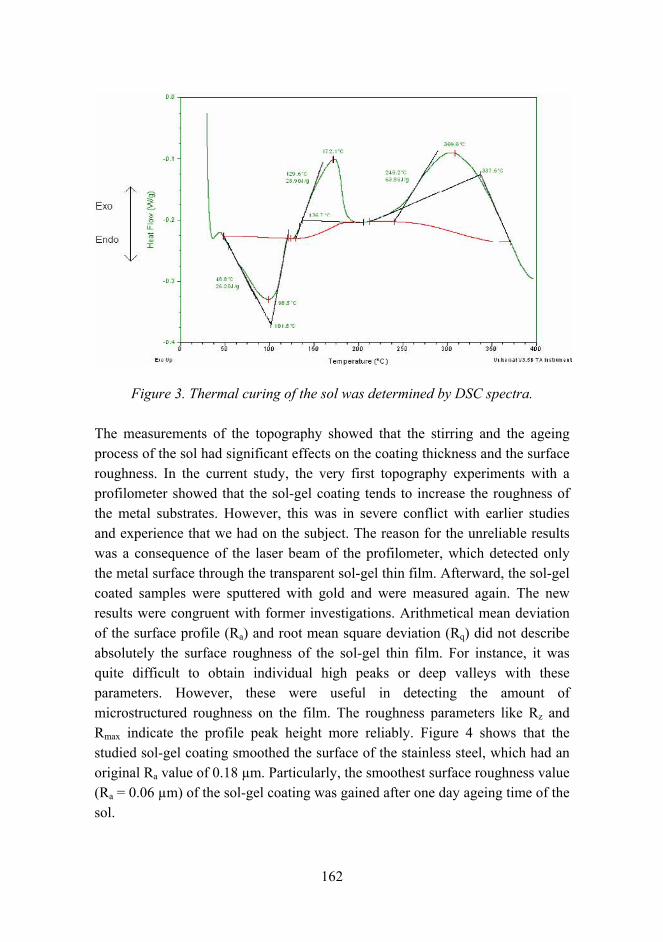
162
Figure 3. Thermal curing of the sol was determined by DSC spectra.
The measurements of the topography showed that the stirring and the ageing process of the sol had significant effects on the coating thickness and the surface roughness. In the current study, the very first topography experiments with a profilometer showed that the sol-gel coating tends to increase the roughness of the metal substrates. However, this was in severe conflict with earlier studies and experience that we had on the subject. The reason for the unreliable results was a consequence of the laser beam of the profilometer, which detected only the metal surface through the transparent sol-gel thin film. Afterward, the sol-gel coated samples were sputtered with gold and were measured again. The new results were congruent with former investigations. Arithmetical mean deviation of the surface profile (Ra) and root mean square deviation (Rq) did not describe absolutely the surface roughness of the sol-gel thin film. For instance, it was quite difficult to obtain individual high peaks or deep valleys with these parameters. However, these were useful in detecting the amount of microstructured roughness on the film. The roughness parameters like Rz and Rmax indicate the profile peak height more reliably. Figure 4 shows that the studied sol-gel coating smoothed the surface of the stainless steel, which had an original Ra value of 0.18 µm. Particularly, the smoothest surface roughness value (Ra = 0.06 µm) of the sol-gel coating was gained after one day ageing time of the sol.
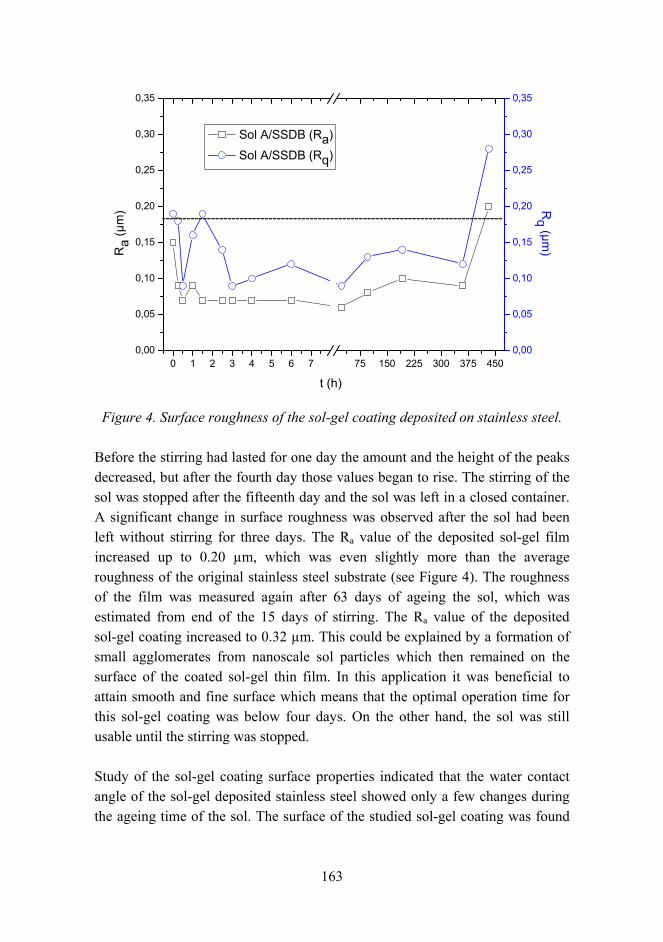
163
0 1 2 3 4 5 6 7 75 150 225 300 375 4500,00
0,05
0,10
0,15
0,20
0,25
0,30
0,35
Sol A/SSDB (Ra)
Sol A/SSDB (Rq)
t (h)
Ra
(µm
) -----------------------------------------------------------------------------------
0,00
0,05
0,10
0,15
0,20
0,25
0,30
0,35
Rq
(µm)
Figure 4. Surface roughness of the sol-gel coating deposited on stainless steel.
Before the stirring had lasted for one day the amount and the height of the peaks decreased, but after the fourth day those values began to rise. The stirring of the sol was stopped after the fifteenth day and the sol was left in a closed container. A significant change in surface roughness was observed after the sol had been left without stirring for three days. The Ra value of the deposited sol-gel film increased up to 0.20 µm, which was even slightly more than the average roughness of the original stainless steel substrate (see Figure 4). The roughness of the film was measured again after 63 days of ageing the sol, which was estimated from end of the 15 days of stirring. The Ra value of the deposited sol-gel coating increased to 0.32 µm. This could be explained by a formation of small agglomerates from nanoscale sol particles which then remained on the surface of the coated sol-gel thin film. In this application it was beneficial to attain smooth and fine surface which means that the optimal operation time for this sol-gel coating was below four days. On the other hand, the sol was still usable until the stirring was stopped.
Study of the sol-gel coating surface properties indicated that the water contact angle of the sol-gel deposited stainless steel showed only a few changes during the ageing time of the sol. The surface of the studied sol-gel coating was found
164
to represent more hydrophilic than hydrophobic effects. In the corrent study the water contact angle of the sol-gel coated stainless steel seemed to increase slightly as function of the peak-to-valley ratio. According to the measured water contact angle results, the value changed mostly when distance of the peaks and valleys became longer. The protection of the stainless steel and copper substrates by sol-gel coating was examined by measuring the water absorption. The measurements indicated that the surface of the thin film turned slightly more hydrophilic after seven days of exposure to water. This was assumed to be the result of the formation of hydroxyl groups on the surface. The results showed that the sol-gel coating was not vulnerable for minor water exposure. Additionally, ageing of the sol did not have influence on the water resistance.
Conclusion
The studied hybrid sol-gel coating was successfully deposited on stainless steel after the hydrolysis of the alkoxide groups was observed. The formation of hydroxyl groups and siloxane bonds played a key role in the study of the sol-gel chemistry. Particularly, after the condensation reactions clearly took place the film thickness of the sol-gel coating tended to increase. In the future, the early stage sol-gel reactions should be studied more with measurements of the surface tension of sols. Investigations of the topography of the sol-gel coating indicated a variation of surface roughness during the ageing of the sol. For instance, the smoothest surface of the sol-gel coating was obtained after one day of stirring the sol. As a result of the current study better knowledge of the sol-gel chemistry and the topography was achieved.
Acknowledgement
The Finnish metal industry, Tekes the Finnish Funding Agency for Technology and Innovation and VTT are acknowledged for funding the PUHTEET-project and Professor Helge Lemmetyinen from TUT for reviewing the study.
165
Reference list
1. Brinker, C. J. & Scherer, G. W. Sol-Gel Science: The Physics and Chemistry of Sol-Gel Processing. Academic Press, Inc., 1990. ISBN 0-12-134970-5.
2. Guglielmi, M. Sol-Gel Coatings on Metals. Journal of Sol-Gel Science and Technology, 1997. Vol. 8, pp. 443449. ISSN 0928-0707.
3. Pilotek, S. & Schmidt, H. K. Wettability of Microstructured Hydrophobic Sol-Gel Coatings. Journal of Sol-Gel Science and Technology, 2003. Vol. 26, pp. 789792. ISSN 0928-0707.
4. Innocenzi, P. Infrared Spectroscopy of Sol-Gel Derived Silica-Based Films: A Spectra-Microstructure Overview. Journal of Non-Crystalline Solids, 2003. Vol. 316, pp. 309319. ISSN 0022-3093.
166
Combination of protective coating and temperature monitoring in boilers
Maria Oksa, Sanni Mustala, Stefan Sandlin, Erja Turunen, Tommi Varis & Satu Tuurna
VTT Technical Research Centre of Finland Metallimiehenkuja 8, Espoo, P.O. Box 1000, FI-02044 VTT
Abstract
Waste incineration and biomass combustion produce a complex and hard to control combustion process, which also causes detrimental conditions to boiler materials. Boiler tubing, such as superheaters, can experience severe material wastage due to corrosion and erosion. In this study, a novel approach to both monitor the temperature of a boiler and protect the susceptible boiler construction is introduced. The main innovation is to combine a protective coating and temperature monitoring optical fiber by developing a novel temperature monitoring protective coating. Protective HVOF and arc sprayed coatings have been tested in high temperature corrosion laboratory tests and in real boiler conditions. Analysis of the samples has been performed with SEM/EDS. In this paper, the preliminary results of developing the monitoring coating system are introduced.
Introduction
Waste incineration and biomass combustion are both growing rapidly due to the environmental aspects, minimization of landfills, utilization of waste, reduction of greenhouse gases, and ambition to self-sufficiency of energy sources in European countries as an alternative to imported oil, coal and gas. However, co-combustion, burning different fuels together (including fuels such as waste, biomass, oil, coal), produces a more complex and hard to control combustion process than traditional fuel combustion. The new harsh conditions detrimentally affect the boiler construction, i.e. boiler tubing, shortening the lifetime by corrosion and erosion. Hence the control of the burning process, control of emissions, and the safe and long-life use of boilers are becoming more important.
167
To gain more efficient control and better reliability of boilers, new methods and protective means have to be applied. A novel approach to both monitor the temperature of a boiler and protect the susceptible boiler construction is to combine a protective coating and a temperature monitoring optical fiber. The objective is to improve the lifetime and reliability of co-combustion boilers by a monitoring coating, in order to achieve better control of the burning process, increase operational reliability of boiler components, gain better efficiency and produce lower emissions. The monitoring coating can be applied in various boiler components, such as superheaters, lining boundary, and economizer. Smart coatings can also be applied to other applications such as different types of tribological components (valves, bearings, etc.), where the increased heat due to the increasing friction between the counterparts often causes significant damage.
Boiler materials and coatings
Problems in power plant boilers that use biomass and waste as fuel are often caused by high temperature corrosion, especially due to alkali metals and chlorine, and by erosion, especially in the case of fluidized bed boilers [1, 2, 3]. Fuels used in biomass boilers contain for example wood, straw, agricultural waste, and crops, all of which may contain high amounts of chlorine. In addition, waste fuel is heterogeneous and causes aggressive corrosion conditions in boilers [4]. Formation of deposits containing alkali metals and chlorine on boiler tubes is a serious problem causing, in addition to corrosion, fouling and a high need for maintenance of boiler [5, 6]. High temperature corrosion limits the effective use of both the biomass combustion and waste incineration boilers lowering steam temperatures. Material wastage is mainly caused by chlorine induced high temperature corrosion and erosion depending on the fuel and boiler type. Critical components for corrosion are heat exchanger surfaces, such as water walls and superheaters. In order to minimize material related risks, normally used low alloy steels have been replaced with high alloy steels in more aggressive conditions. These alloys normally contain a large amount of nickel and chromium for enhancing high temperature corrosion resistance. The high cost and sometimes difficult to manufacture bulk materials could be replaced with coatings, which can be applied on the more economical low alloy steel.
Thermal spraying is one possibility to manufacture protective coatings on boiler components. Suitable methods are arc and HVOF (high velocity oxy-fuel)
168
spraying. The benefits of the thermal spray coatings are typically lower cost, improved engineering performance, and increased component life. Coating properties can be tailored in order to achieve desired material properties, such as corrosion resistance, erosion resistance, hardness and low friction. Most potential material combinations to provide good corrosion properties are chromium and nickel. When mixed with different carbides good properties against erosion is achievec [7, 8, 9, 10]. However, since the financial cost of coatings has to be considered, iron based materials with chromium alloying were also chosen for testing.
Fiber optical sensing
Fiber optic sensing technology provides some possibilities that cannot be realized by conventional electrical sensors. For example, certain parts of the fiber can be made sensitive to the quantity we want to monitor. This means that different kinds of sensing networks can be constructed. The technique in which many point sensors form a sensing network is sometimes called quasi-distributed. The sensors could, for instance, be in-fiber Bragg gratings.
Another possibility is the distributed optical fiber sensing (DTS) where the whole fiber length acts as sensor. In this case a single fiber gives both the spatial and temporal variations of the measuring field. The spatial distribution of the temperature along the fiber is given by the time-of-flight of the light pulses. The principle is illustrated in Figure 1. Commercial systems for distributed temperature sensing (DTS) are available and these have a spatial resolution of about 1 m. By using a highly sophisticated instrument based on a time-correlated single photon counting technique, a spatial resolution of less than 10 cm can be reached [12] with a temperature resolution of 2 °C. This instrument is based on Raman scattering. A short laser pulse is launched into the fiber. As a result, some anti-Stokes and Stokes photons are generated. A fraction of these propagates backward along the fiber and can be collected at the launching end. The amount of anti-Stokes photons produced in the scattering process is temperature dependent while the amount of Stokes photons is almost temperature independent. Therefore the ratio of the intensities of the Anti-Stokes and the Stokes peaks can usually be taken as an intensity independent measure of temperature along the fiber [11].
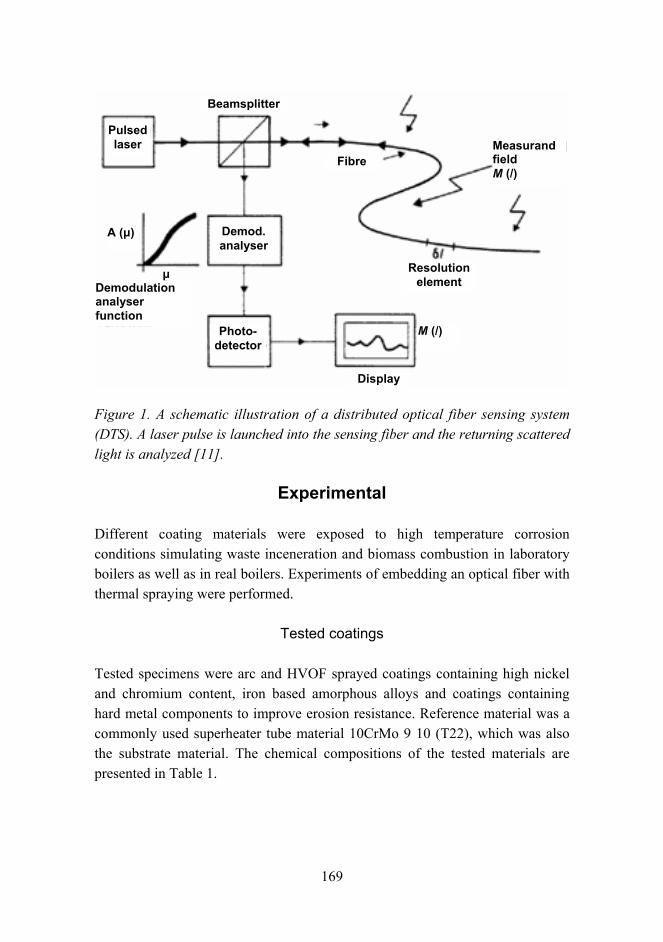
169
Figure 1. A schematic illustration of a distributed optical fiber sensing system (DTS). A laser pulse is launched into the sensing fiber and the returning scattered light is analyzed [11].
Experimental
Different coating materials were exposed to high temperature corrosion conditions simulating waste inceneration and biomass combustion in laboratory boilers as well as in real boilers. Experiments of embedding an optical fiber with thermal spraying were performed.
Tested coatings
Tested specimens were arc and HVOF sprayed coatings containing high nickel and chromium content, iron based amorphous alloys and coatings containing hard metal components to improve erosion resistance. Reference material was a commonly used superheater tube material 10CrMo 9 10 (T22), which was also the substrate material. The chemical compositions of the tested materials are presented in Table 1.
Beamsplitter
Fibre Measurand field M (/)
Demodulationanalyser function
Photo- detector
Demod.analyser
Resolutionelement
Display
Pulsed laser
M (/)
A (µ)
µ
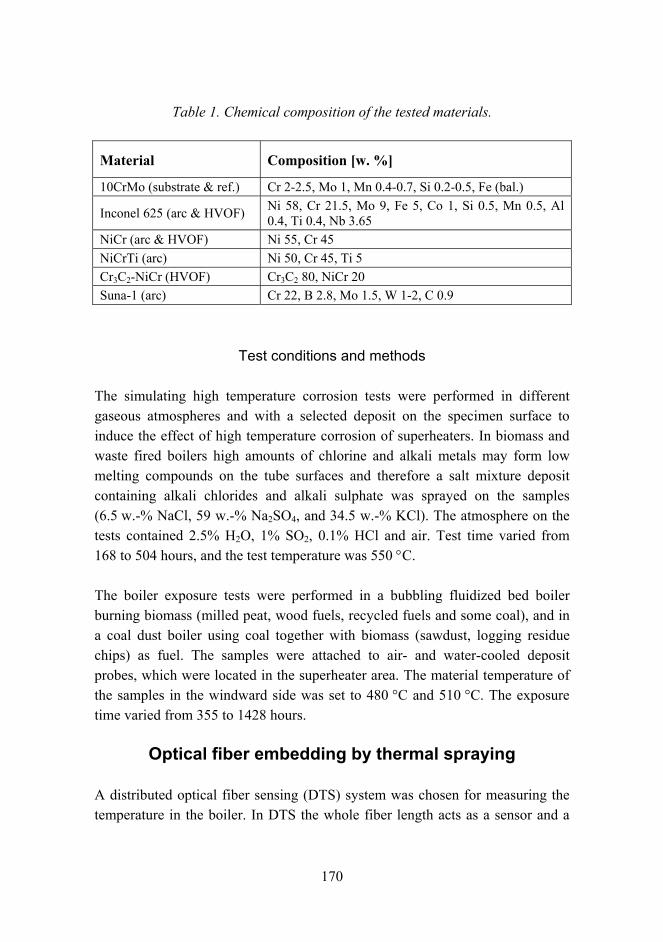
170
Table 1. Chemical composition of the tested materials.
Material Composition [w. %]
10CrMo (substrate & ref.) Cr 2-2.5, Mo 1, Mn 0.4-0.7, Si 0.2-0.5, Fe (bal.)
Inconel 625 (arc & HVOF) Ni 58, Cr 21.5, Mo 9, Fe 5, Co 1, Si 0.5, Mn 0.5, Al 0.4, Ti 0.4, Nb 3.65
NiCr (arc & HVOF) Ni 55, Cr 45 NiCrTi (arc) Ni 50, Cr 45, Ti 5 Cr3C2-NiCr (HVOF) Cr3C2 80, NiCr 20 Suna-1 (arc) Cr 22, B 2.8, Mo 1.5, W 1-2, C 0.9
Test conditions and methods
The simulating high temperature corrosion tests were performed in different gaseous atmospheres and with a selected deposit on the specimen surface to induce the effect of high temperature corrosion of superheaters. In biomass and waste fired boilers high amounts of chlorine and alkali metals may form low melting compounds on the tube surfaces and therefore a salt mixture deposit containing alkali chlorides and alkali sulphate was sprayed on the samples (6.5 w.-% NaCl, 59 w.-% Na2SO4, and 34.5 w.-% KCl). The atmosphere on the tests contained 2.5% H2O, 1% SO2, 0.1% HCl and air. Test time varied from 168 to 504 hours, and the test temperature was 550 °C.
The boiler exposure tests were performed in a bubbling fluidized bed boiler burning biomass (milled peat, wood fuels, recycled fuels and some coal), and in a coal dust boiler using coal together with biomass (sawdust, logging residue chips) as fuel. The samples were attached to air- and water-cooled deposit probes, which were located in the superheater area. The material temperature of the samples in the windward side was set to 480 °C and 510 °C. The exposure time varied from 355 to 1428 hours.
Optical fiber embedding by thermal spraying
A distributed optical fiber sensing (DTS) system was chosen for measuring the temperature in the boiler. In DTS the whole fiber length acts as a sensor and a
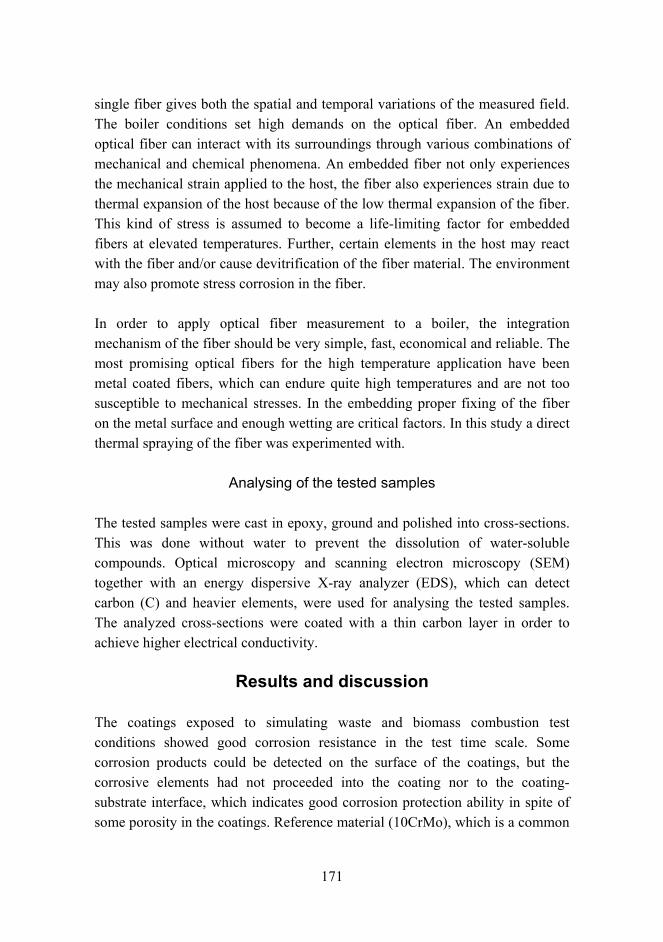
171
single fiber gives both the spatial and temporal variations of the measured field. The boiler conditions set high demands on the optical fiber. An embedded optical fiber can interact with its surroundings through various combinations of mechanical and chemical phenomena. An embedded fiber not only experiences the mechanical strain applied to the host, the fiber also experiences strain due to thermal expansion of the host because of the low thermal expansion of the fiber. This kind of stress is assumed to become a life-limiting factor for embedded fibers at elevated temperatures. Further, certain elements in the host may react with the fiber and/or cause devitrification of the fiber material. The environment may also promote stress corrosion in the fiber.
In order to apply optical fiber measurement to a boiler, the integration mechanism of the fiber should be very simple, fast, economical and reliable. The most promising optical fibers for the high temperature application have been metal coated fibers, which can endure quite high temperatures and are not too susceptible to mechanical stresses. In the embedding proper fixing of the fiber on the metal surface and enough wetting are critical factors. In this study a direct thermal spraying of the fiber was experimented with.
Analysing of the tested samples
The tested samples were cast in epoxy, ground and polished into cross-sections. This was done without water to prevent the dissolution of water-soluble compounds. Optical microscopy and scanning electron microscopy (SEM) together with an energy dispersive X-ray analyzer (EDS), which can detect carbon (C) and heavier elements, were used for analysing the tested samples. The analyzed cross-sections were coated with a thin carbon layer in order to achieve higher electrical conductivity.
Results and discussion
The coatings exposed to simulating waste and biomass combustion test conditions showed good corrosion resistance in the test time scale. Some corrosion products could be detected on the surface of the coatings, but the corrosive elements had not proceeded into the coating nor to the coating-substrate interface, which indicates good corrosion protection ability in spite of some porosity in the coatings. Reference material (10CrMo), which is a common
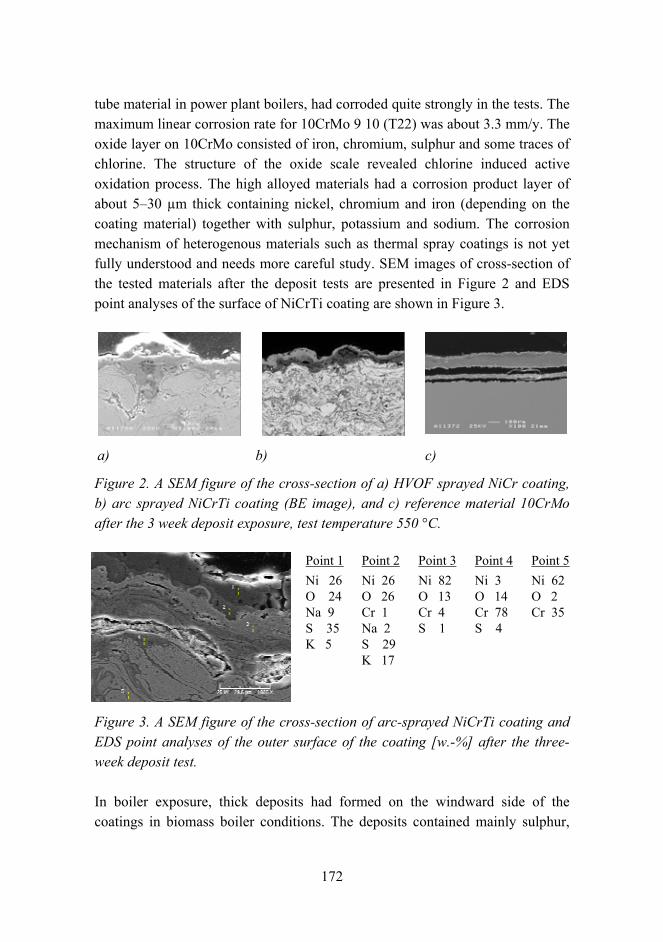
172
tube material in power plant boilers, had corroded quite strongly in the tests. The maximum linear corrosion rate for 10CrMo 9 10 (T22) was about 3.3 mm/y. The oxide layer on 10CrMo consisted of iron, chromium, sulphur and some traces of chlorine. The structure of the oxide scale revealed chlorine induced active oxidation process. The high alloyed materials had a corrosion product layer of about 530 µm thick containing nickel, chromium and iron (depending on the coating material) together with sulphur, potassium and sodium. The corrosion mechanism of heterogenous materials such as thermal spray coatings is not yet fully understood and needs more careful study. SEM images of cross-section of the tested materials after the deposit tests are presented in Figure 2 and EDS point analyses of the surface of NiCrTi coating are shown in Figure 3.
a) b) c)
Figure 2. A SEM figure of the cross-section of a) HVOF sprayed NiCr coating, b) arc sprayed NiCrTi coating (BE image), and c) reference material 10CrMo after the 3 week deposit exposure, test temperature 550 °C.
Point 1 Ni 26 O 24 Na 9 S 35 K 5
Point 2 Ni 26 O 26 Cr 1 Na 2 S 29 K 17
Point 3 Ni 82 O 13 Cr 4 S 1
Point 4 Ni 3 O 14 Cr 78 S 4
Point 5 Ni 62 O 2 Cr 35
Figure 3. A SEM figure of the cross-section of arc-sprayed NiCrTi coating and EDS point analyses of the outer surface of the coating [w.-%] after the three-week deposit test.
In boiler exposure, thick deposits had formed on the windward side of the coatings in biomass boiler conditions. The deposits contained mainly sulphur,
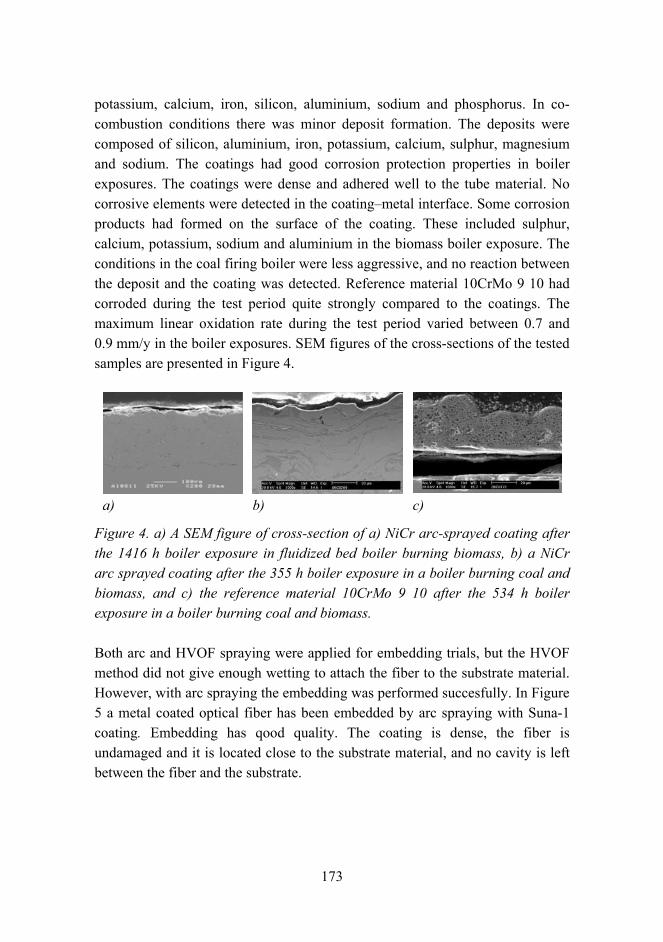
173
potassium, calcium, iron, silicon, aluminium, sodium and phosphorus. In co-combustion conditions there was minor deposit formation. The deposits were composed of silicon, aluminium, iron, potassium, calcium, sulphur, magnesium and sodium. The coatings had good corrosion protection properties in boiler exposures. The coatings were dense and adhered well to the tube material. No corrosive elements were detected in the coatingmetal interface. Some corrosion products had formed on the surface of the coating. These included sulphur, calcium, potassium, sodium and aluminium in the biomass boiler exposure. The conditions in the coal firing boiler were less aggressive, and no reaction between the deposit and the coating was detected. Reference material 10CrMo 9 10 had corroded during the test period quite strongly compared to the coatings. The maximum linear oxidation rate during the test period varied between 0.7 and 0.9 mm/y in the boiler exposures. SEM figures of the cross-sections of the tested samples are presented in Figure 4.
a) b) c)
Figure 4. a) A SEM figure of cross-section of a) NiCr arc-sprayed coating after the 1416 h boiler exposure in fluidized bed boiler burning biomass, b) a NiCr arc sprayed coating after the 355 h boiler exposure in a boiler burning coal and biomass, and c) the reference material 10CrMo 9 10 after the 534 h boiler exposure in a boiler burning coal and biomass.
Both arc and HVOF spraying were applied for embedding trials, but the HVOF method did not give enough wetting to attach the fiber to the substrate material. However, with arc spraying the embedding was performed succesfully. In Figure 5 a metal coated optical fiber has been embedded by arc spraying with Suna-1 coating. Embedding has qood quality. The coating is dense, the fiber is undamaged and it is located close to the substrate material, and no cavity is left between the fiber and the substrate.
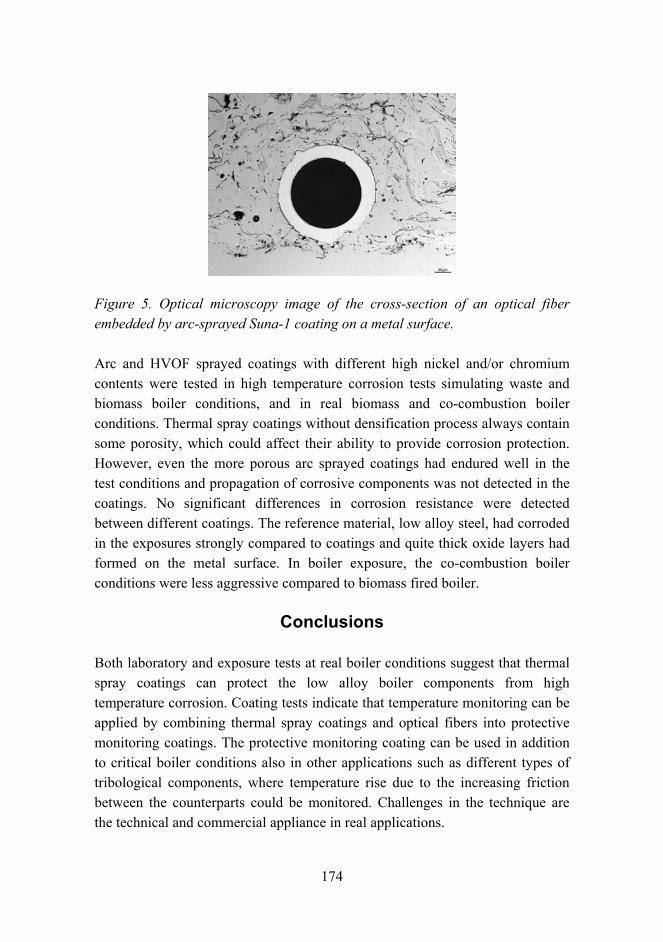
174
Figure 5. Optical microscopy image of the cross-section of an optical fiber embedded by arc-sprayed Suna-1 coating on a metal surface.
Arc and HVOF sprayed coatings with different high nickel and/or chromium contents were tested in high temperature corrosion tests simulating waste and biomass boiler conditions, and in real biomass and co-combustion boiler conditions. Thermal spray coatings without densification process always contain some porosity, which could affect their ability to provide corrosion protection. However, even the more porous arc sprayed coatings had endured well in the test conditions and propagation of corrosive components was not detected in the coatings. No significant differences in corrosion resistance were detected between different coatings. The reference material, low alloy steel, had corroded in the exposures strongly compared to coatings and quite thick oxide layers had formed on the metal surface. In boiler exposure, the co-combustion boiler conditions were less aggressive compared to biomass fired boiler.
Conclusions
Both laboratory and exposure tests at real boiler conditions suggest that thermal spray coatings can protect the low alloy boiler components from high temperature corrosion. Coating tests indicate that temperature monitoring can be applied by combining thermal spray coatings and optical fibers into protective monitoring coatings. The protective monitoring coating can be used in addition to critical boiler conditions also in other applications such as different types of tribological components, where temperature rise due to the increasing friction between the counterparts could be monitored. Challenges in the technique are the technical and commercial appliance in real applications.
175
Acknowledgement
The study has been funded by the European Commission. The authors wish to present their appreciation to attending project partners ART Photonics, Diamondblade, Durum Verschleiss-Schutz, Flame Spray, and Hitele Systems. The authors also wish to thank the boiler plants for the opportunity to test the materials under actual boiler conditions.
Reference list
1. Bryers, R. W. Fireside slagging, fouling, and high-temperature corrosion of heat-transfer surface due to impurities in steam-raising fuels. Progress in Energy and Combustion Science, Vol. 22, Issue 1, 1996, pp. 29120.
2. Hansen, L. A. et al. Influence of deposit formation on corrosion at a straw-fired boiler. Fuel Processing Technology, Vol. 64, Issues 13, May 2000, pp. 189209.
3. Kawahara, Y. High temperature corrosion mechanisms and effect of alloying elements for materials used in waste incineration environment. Corrosion Science, Vol. 44, Issue 2, February 2002, pp. 223245.
4. Spiegel, M. Salt melt induced corrosion of metallic materials in waste incineration plants. Materials and Corrosion, 50 (1999), pp. 373393.
5. Åmand, L.-E. et al. Deposits on heat transfer tubes during co-combustion of bioflues and sewage sludge. Fuel, 85 (2006), pp. 13131322.
6. Frandsen, F. J. Utilizing biomass and waste for power production a decade of contributing to the understanding, interpretation and analysis of deposits and corrosion products. Fuel, 84 (2005), pp. 12771294.
7. Uusitalo, M. A. Vuoristo, P. M. J. & Mäntylä, T. A., High temperature corrosion of coatings and boiler steels below chlorine-containing salt deposits. Corrosion Science, 46 (2004), pp. 13111331.
176
8. Wang, B. Q. et al. Erosion-corrosion behaviour of HVOF NiAl-Al2O3 intermetallic-ceramic coatings. Wear, 239 (2000), pp. 8390.
9. Hidalgo, V. H. et al. High temperature erosion wear of flame and plasma-sprayed nickel-chromium coatings under simulated coal-fired boiler atmospheres. Wear, 247 (2001), pp. 214222.
10. Uusitalo, M. A. et al. High temperature corrosion of coatings and boiler steels in oxidizing chlorine-containing atmosphere. Mat. Sci. and Eng. A, 346 (2003), pp. 168177.
11. Rogers, A. 1999. Distributed optical-fibre sensing. Meas. Sci. Technol., 10, pp. R75R99.
12. Feced, R. et al. Advances in high resolution distributed temperature sensing using the time-correlated single photon counting technique. IEE Proc. Optoelectron., Vol. 144, No. 3, 1997, pp. 183188.
177
Anti-fouling and scratch resistant hybrid sol-gel coatings
Anne Pahkala1, Juha Mannila1, Marke Kallio1, Juha Nikkola1, Amar Mahiout2, Jarmo Siivinen2, Anne-Christine Ritschkoff3, Riitta Mahlberg3, Olli Posti3,
Mia Löija3 & Soili Takala3
VTT Technical Research Centre of Finland 1Sinitaival 6, P.O. Box 1300, FI-33101 Tampere
2Metallimiehenkuja 8, P.O. Box 1000, FI-02044 VTT 3Betonimiehenkuja 5, P.O. Box 1000, FI-02044 VTT
Abstract
All surfaces are exposed to fouling, wearing and other degrading environmental effects during their lifetime. Continuous cleaning and repairing of surfaces causes financial losses and shutdowns in industrial processes. The aim of this study was to develop anti-fouling and scratch resistant hybrid sol-gel coatings for metal surfaces. Two different hybrid sol-gel coatings were prepared from modified solutions of silicon based alkoxides and coated on stainless steel by using spill and spray coating techniques. Anti-fouling properties were studied with contact angle measurements, fouling tests and FTIR scanning analysis. Abrasion properties were measured with pin-on-disk test and with an abrasive washing test (modified DIN 53778, Erichsen). Coatings were characterized with SEM and optical microscopy. According to performed anti-fouling tests, the cleanability of the anti-fouling sol-gel coated steel was enhanced compared to the uncoated steel surface. Measured water and oil contact angles were higher on the coated surface and the coated surface was not tainted. The abrasion tests showed that the scratch resistant coating abraded only slightly when the uncoated steel was abraded under the same load on a large scale.
Introduction
Sol-gel hybrid coatings are promising new materials for enhancing the anti-fouling properties and abrasion resistance of different material surfaces [1]. The hybrid coatings are organic-inorganic composites with an amorphous nanoscale
178
structure. They do not have clear grain or phase boundaries, which are typical for traditional composite materials. The sol-gel technique is used for creating coatings with thickness varying from nanoscale to several microns, and it allows the properties of the hybrid coatings to be varied on a wide scale. Parent substances such as different alkoxides will build a nanoscale network through hydrolysis and condensation reactions, which form the actual coating. By optimizing the composition of the sols, thin hybrid coatings can resist fouling and scratching [25]. Functional groups of the coating surface define how the other substances behave on the coating surface. For example, hydrophobic and oleophobic properties enhance the cleanability of the surfaces. By modifying these functional groups in a specific way anti-fouling properties can be achieved [3]. Ceramic components can give hardness and polymeric components flexibility for the tough and durable coatings. By increasing the polymer content the coating thickness can be increased and the coatings become denser, but their hardness diminishes respectively [4]. Sol-gels can have a low viscosity and they are easily applied to larger surfaces by spraying. Sol-gel coatings can be tailored to have a good adhesion on many substrate materials [1, 4]. One major advantage in using these coatings is their transparency to visible light. Because the coatings can be made very thin and transparent, they do not remarkably change the visual appearance of the substrate material [1].
Metals are susceptible to fouling in many applications and especially greasy stains degrade the appearance of metallic surfaces. Stainless steel is used increasingly more in households especially in decorative applications where a clean and stainless appearance is very important. Abrasion of metal surfaces is also very closely connected to the fouling phenomenon. Different fouling substances tend to stick to the abraded scratches and the surface fouls rapidly [3]. Although metals in general are quite hard materials, they abrade and scratch quite easily. There are some studies concerning anti-fouling and abrasion resistant sol-gel coatings for metals in the literature and many studies are currently carried out about this subject [5]. The surface fouling and abrasion of metals is a complicated phenomenon with many affecting factors.
In this study, two different hybrid sol-gel coatings were developed and coated on stainless steel substrates. The anti-fouling and abrasion resistance properties of the coatings were measured with different testing methods. The results of these
179
tests showed that the sol-gel coatings clearly improved the anti-fouling properties and abrasion resistance of the stainless steel surface.
Experimental
The stainless steel substrates (EN 1.4301) 2B and 2J were coated using two silane-based sol-gel coatings A and B by spill-coating and spraying. 2B substrate was finished by cold rolling and 2J was dry brushed. Because of the different surface finishes, stainless steel plates had different Ra values and different topography. The Ra value of 2B ranged from 0.1 to 0.5 µm and 2J from 0.1 to 0.2 µm. Before coating, the stainless steel substrates were cleaned with acetone and ethanol. Coating A was modified with functional groups to have anti-fouling properties and coating B abrasion resistance. Both coatings were based on silicon alkoxides and the coating A contained 34 mass-% of polymeric additions and coating B 42 mass-%. Ethanol was used as a solvent in the sol and water was added for the hydrolysis reaction. After thorough mixing of the constituents, the sol was stirred for several hours and most of the hydrolysis was allowed to go through before coating. After the coating was done, the samples were cured at 110 °C to form thin solid coatings.
The anti-fouling properties, abrasion resistance and other chemical and mechanical properties of the cured coatings were measured by using different methods. The thickness was measured with an Elcometer 456 coating thickness measurement system (Elcometer Instruments Ltd.) using an eddy current gauge for ferritic and non-ferritic metal substrates. The adhesion of the coatings to the substrate was tested with a standard tape-test (ASTM D 3359-02). The hardness of the coatings was measured with a standard pencil test (ASTM D 3363-00).
Surface energy, hydrophobic and oleophobic properties were measured with contact angle measurements (CAM 200 Optical Contact Angle Meter, KSV Instruments Ltd, CAM 200 software). Anti-fouling properties were studied with a designed fouling test where fingerprints and oleic acid were used as fouling agents. An equal amount of fouling agents was pressed to the coated surfaces of the samples and then cleaned with a dry micro fiber cloth. Remained stains were characterised with a FTIR mapping system (BioRad FTS 6000, Shadow Pro Mapping Software) where IR beam is directed to the sample surface through an optical microscope. The surface was divided into 50 x 50 µm areas that were
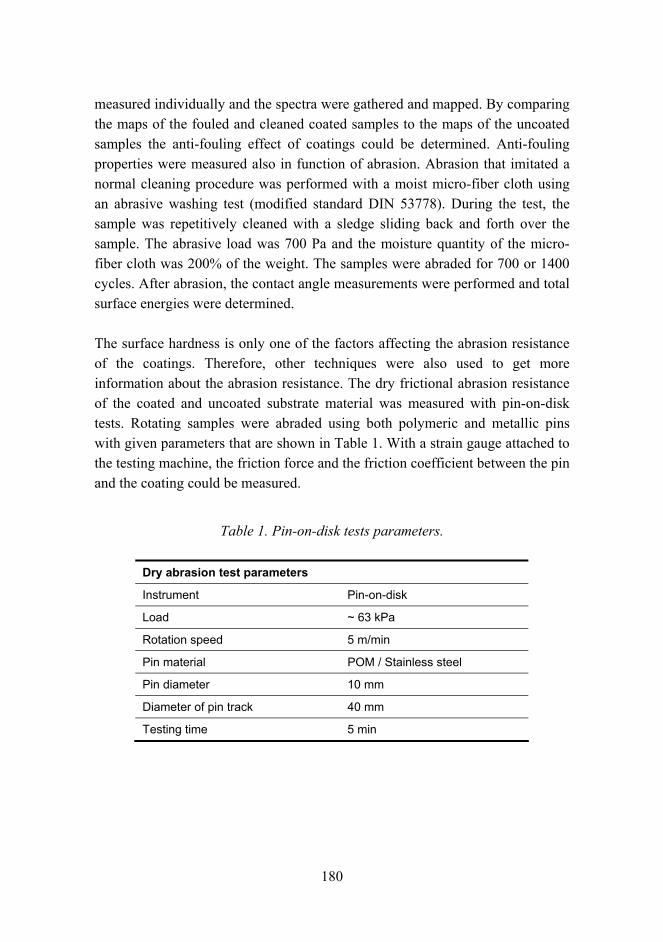
180
measured individually and the spectra were gathered and mapped. By comparing the maps of the fouled and cleaned coated samples to the maps of the uncoated samples the anti-fouling effect of coatings could be determined. Anti-fouling properties were measured also in function of abrasion. Abrasion that imitated a normal cleaning procedure was performed with a moist micro-fiber cloth using an abrasive washing test (modified standard DIN 53778). During the test, the sample was repetitively cleaned with a sledge sliding back and forth over the sample. The abrasive load was 700 Pa and the moisture quantity of the micro-fiber cloth was 200% of the weight. The samples were abraded for 700 or 1400 cycles. After abrasion, the contact angle measurements were performed and total surface energies were determined.
The surface hardness is only one of the factors affecting the abrasion resistance of the coatings. Therefore, other techniques were also used to get more information about the abrasion resistance. The dry frictional abrasion resistance of the coated and uncoated substrate material was measured with pin-on-disk tests. Rotating samples were abraded using both polymeric and metallic pins with given parameters that are shown in Table 1. With a strain gauge attached to the testing machine, the friction force and the friction coefficient between the pin and the coating could be measured.
Table 1. Pin-on-disk tests parameters.
Dry abrasion test parameters
Instrument Pin-on-disk
Load ~ 63 kPa
Rotation speed 5 m/min
Pin material POM / Stainless steel
Pin diameter 10 mm
Diameter of pin track 40 mm
Testing time 5 min
181
Results and discussion
The measured average thickness of the coatings varied between 1.7 to 4.7 µm depending of the coating composition, the substrate material and the coating technique. The measured thicknesses are shown in Table 2. The coating thicknesses were in the same range with both coating techniques. The smoothest and most evenly spread coatings were obtained by spraying. Sprayed coating thickness varied slightly between the samples because of manually performed spraying. Spill coating thickness increased in the direction of spilling. The substrate also affects the coating thickness. From the spill-coated samples it can be seen that the coatings on the 2J substrate are thinner than the coatings on the 2B substrate. This may be a consequence of the differences in surface roughness of the substrates. Rougher surface of 2B gathers more liquid sol to the hills and valleys in spill coating. All the coatings had good adhesion to the substrate. Adhesion was measured with a standard tape test, where the coating surface was first cross cut and the tape was then attached to the coated surface. The applied adhesion test could not pull out the coatings from the substrate surfaces. Only small fractured pieces from cutting the coating were attached to the tape. Good adhesion of the coatings may result from the chemical bonds that are formed between the coating and the oxide layer of the stainless steel. Mechanical adhesion may also take place because of the micro scale roughness of the stainless steel. Quite surprisingly, all measured coatings regardless of the composition were harder than the hardest pencil 6H in the standard pencil scale. Only the sharp point of the pencil was deteriorated but the coatings were not scratched. The pencil test is a good testing method for the polymeric coatings, but for the hybrid coatings with more ceramic content the hardness scale seems to be too low. However, the results gave important information for planning the subsequent hardness tests.
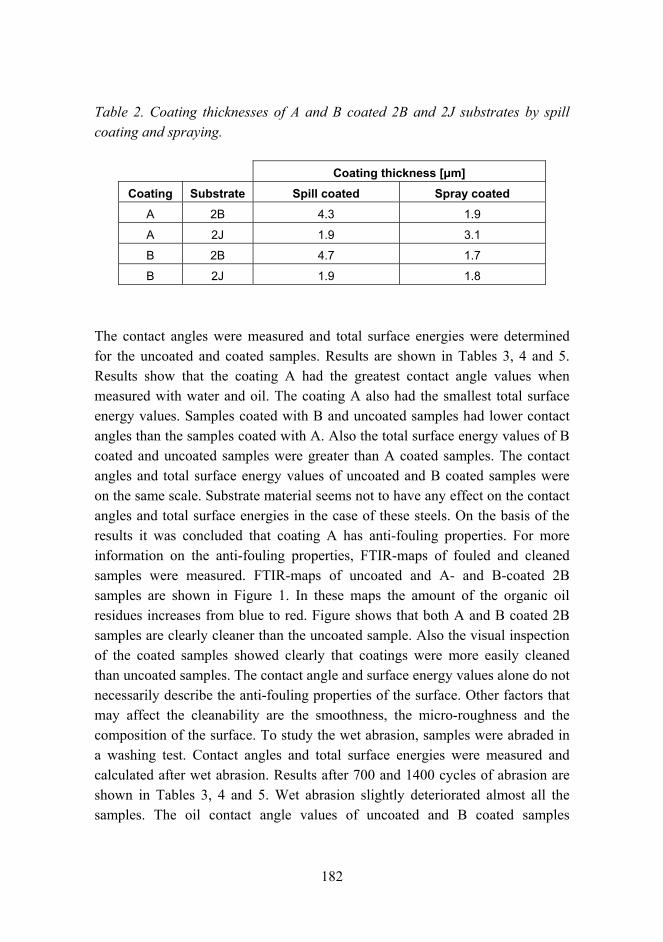
182
Table 2. Coating thicknesses of A and B coated 2B and 2J substrates by spill coating and spraying.
Coating thickness [µm] Coating Substrate Spill coated Spray coated
A 2B 4.3 1.9
A 2J 1.9 3.1
B 2B 4.7 1.7
B 2J 1.9 1.8
The contact angles were measured and total surface energies were determined for the uncoated and coated samples. Results are shown in Tables 3, 4 and 5. Results show that the coating A had the greatest contact angle values when measured with water and oil. The coating A also had the smallest total surface energy values. Samples coated with B and uncoated samples had lower contact angles than the samples coated with A. Also the total surface energy values of B coated and uncoated samples were greater than A coated samples. The contact angles and total surface energy values of uncoated and B coated samples were on the same scale. Substrate material seems not to have any effect on the contact angles and total surface energies in the case of these steels. On the basis of the results it was concluded that coating A has anti-fouling properties. For more information on the anti-fouling properties, FTIR-maps of fouled and cleaned samples were measured. FTIR-maps of uncoated and A- and B-coated 2B samples are shown in Figure 1. In these maps the amount of the organic oil residues increases from blue to red. Figure shows that both A and B coated 2B samples are clearly cleaner than the uncoated sample. Also the visual inspection of the coated samples showed clearly that coatings were more easily cleaned than uncoated samples. The contact angle and surface energy values alone do not necessarily describe the anti-fouling properties of the surface. Other factors that may affect the cleanability are the smoothness, the micro-roughness and the composition of the surface. To study the wet abrasion, samples were abraded in a washing test. Contact angles and total surface energies were measured and calculated after wet abrasion. Results after 700 and 1400 cycles of abrasion are shown in Tables 3, 4 and 5. Wet abrasion slightly deteriorated almost all the samples. The oil contact angle values of uncoated and B coated samples
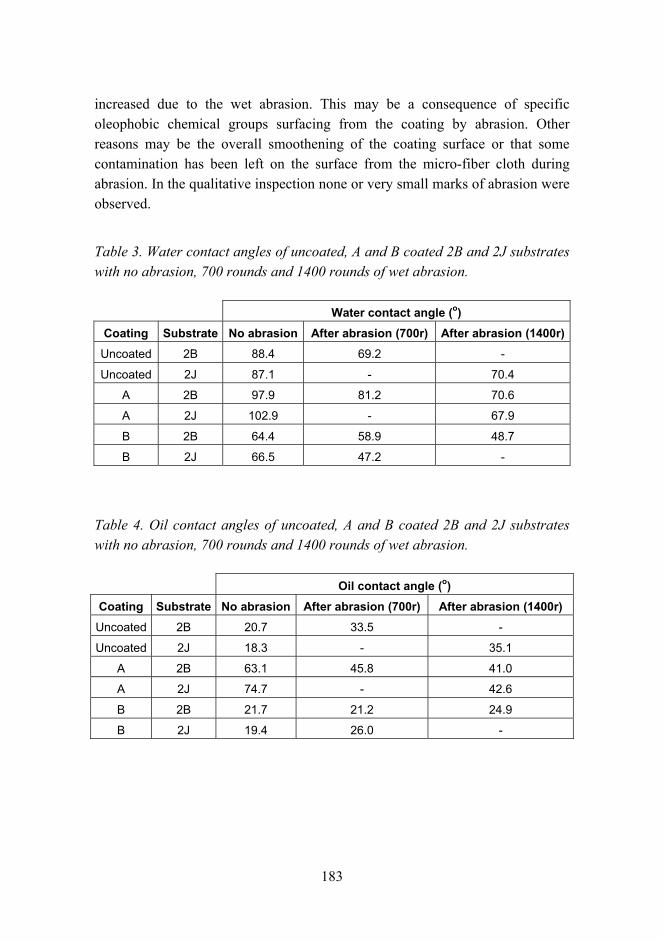
183
increased due to the wet abrasion. This may be a consequence of specific oleophobic chemical groups surfacing from the coating by abrasion. Other reasons may be the overall smoothening of the coating surface or that some contamination has been left on the surface from the micro-fiber cloth during abrasion. In the qualitative inspection none or very small marks of abrasion were observed.
Table 3. Water contact angles of uncoated, A and B coated 2B and 2J substrates with no abrasion, 700 rounds and 1400 rounds of wet abrasion.
Water contact angle (o) Coating Substrate No abrasion After abrasion (700r) After abrasion (1400r) Uncoated 2B 88.4 69.2 -
Uncoated 2J 87.1 - 70.4
A 2B 97.9 81.2 70.6
A 2J 102.9 - 67.9
B 2B 64.4 58.9 48.7
B 2J 66.5 47.2 -
Table 4. Oil contact angles of uncoated, A and B coated 2B and 2J substrates with no abrasion, 700 rounds and 1400 rounds of wet abrasion.
Oil contact angle (o) Coating Substrate No abrasion After abrasion (700r) After abrasion (1400r) Uncoated 2B 20.7 33.5 -
Uncoated 2J 18.3 - 35.1
A 2B 63.1 45.8 41.0
A 2J 74.7 - 42.6
B 2B 21.7 21.2 24.9
B 2J 19.4 26.0 -
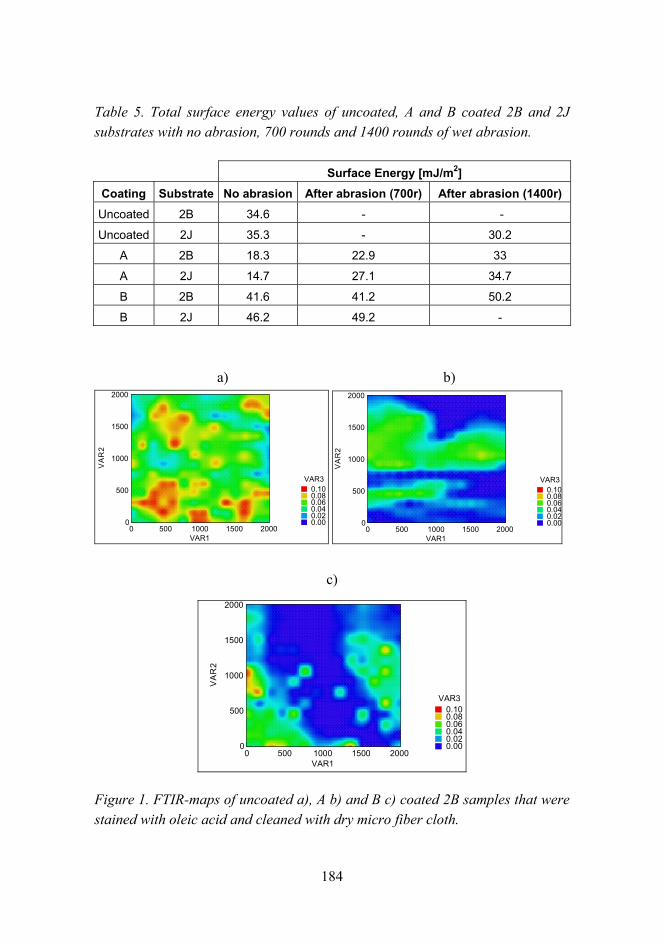
184
Table 5. Total surface energy values of uncoated, A and B coated 2B and 2J substrates with no abrasion, 700 rounds and 1400 rounds of wet abrasion.
Surface Energy [mJ/m2] Coating Substrate No abrasion After abrasion (700r) After abrasion (1400r) Uncoated 2B 34.6 - -
Uncoated 2J 35.3 - 30.2
A 2B 18.3 22.9 33
A 2J 14.7 27.1 34.7
B 2B 41.6 41.2 50.2
B 2J 46.2 49.2 -
a) b)
0 500 1000 1500 2000VAR1
0
500
1000
1500
2000
VA
R2
0.000.020.040.060.080.10
VAR3
0 500 1000 1500 2000
VAR1
0
500
1000
1500
2000
VA
R2
0.000.020.040.060.080.10
VAR3
c)
0 500 1000 1500 2000VAR1
0
500
1000
1500
2000
VA
R2
0.000.020.040.060.080.10
VAR3
Figure 1. FTIR-maps of uncoated a), A b) and B c) coated 2B samples that were stained with oleic acid and cleaned with dry micro fiber cloth.
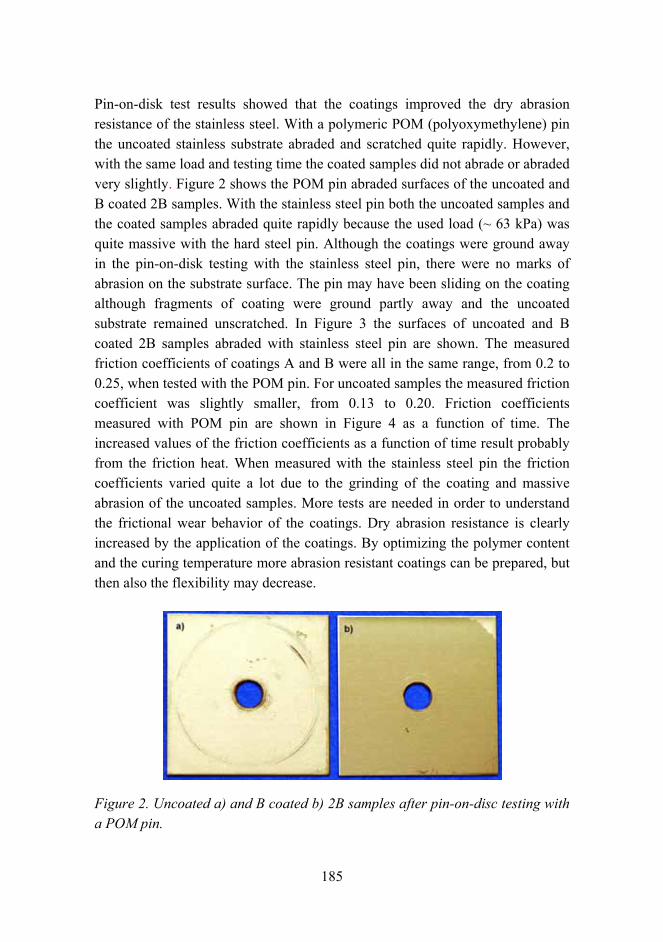
185
Pin-on-disk test results showed that the coatings improved the dry abrasion resistance of the stainless steel. With a polymeric POM (polyoxymethylene) pin the uncoated stainless substrate abraded and scratched quite rapidly. However, with the same load and testing time the coated samples did not abrade or abraded very slightly. Figure 2 shows the POM pin abraded surfaces of the uncoated and B coated 2B samples. With the stainless steel pin both the uncoated samples and the coated samples abraded quite rapidly because the used load (~ 63 kPa) was quite massive with the hard steel pin. Although the coatings were ground away in the pin-on-disk testing with the stainless steel pin, there were no marks of abrasion on the substrate surface. The pin may have been sliding on the coating although fragments of coating were ground partly away and the uncoated substrate remained unscratched. In Figure 3 the surfaces of uncoated and B coated 2B samples abraded with stainless steel pin are shown. The measured friction coefficients of coatings A and B were all in the same range, from 0.2 to 0.25, when tested with the POM pin. For uncoated samples the measured friction coefficient was slightly smaller, from 0.13 to 0.20. Friction coefficients measured with POM pin are shown in Figure 4 as a function of time. The increased values of the friction coefficients as a function of time result probably from the friction heat. When measured with the stainless steel pin the friction coefficients varied quite a lot due to the grinding of the coating and massive abrasion of the uncoated samples. More tests are needed in order to understand the frictional wear behavior of the coatings. Dry abrasion resistance is clearly increased by the application of the coatings. By optimizing the polymer content and the curing temperature more abrasion resistant coatings can be prepared, but then also the flexibility may decrease.
Figure 2. Uncoated a) and B coated b) 2B samples after pin-on-disc testing with a POM pin.
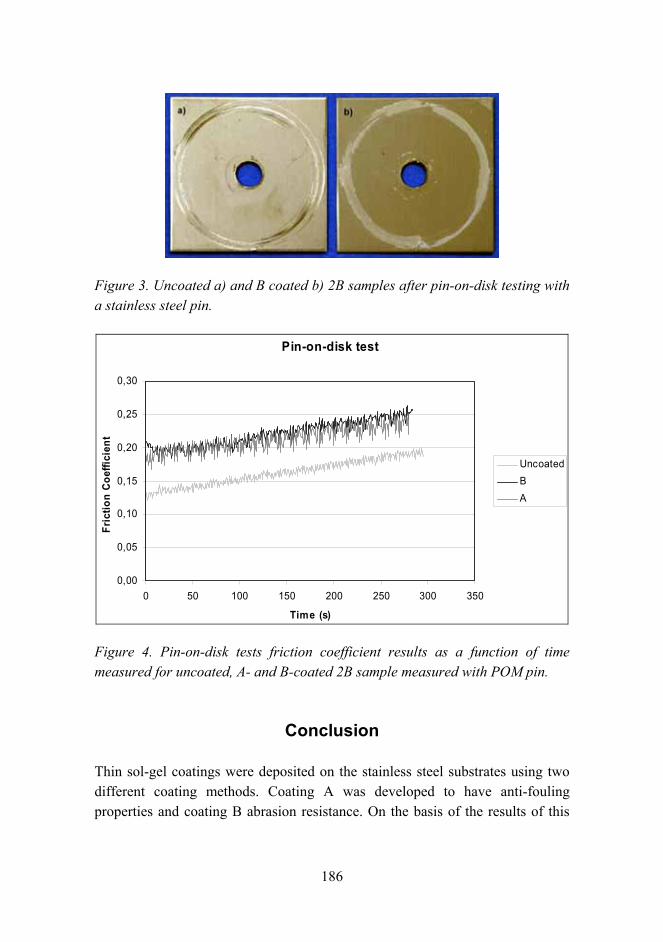
186
Figure 3. Uncoated a) and B coated b) 2B samples after pin-on-disk testing with a stainless steel pin.
Pin-on-disk test
0,00
0,05
0,10
0,15
0,20
0,25
0,30
0 50 100 150 200 250 300 350
Time (s)
Fric
tion
Coef
ficie
nt
UncoatedBA
Figure 4. Pin-on-disk tests friction coefficient results as a function of time measured for uncoated, A- and B-coated 2B sample measured with POM pin.
Conclusion
Thin sol-gel coatings were deposited on the stainless steel substrates using two different coating methods. Coating A was developed to have anti-fouling properties and coating B abrasion resistance. On the basis of the results of this
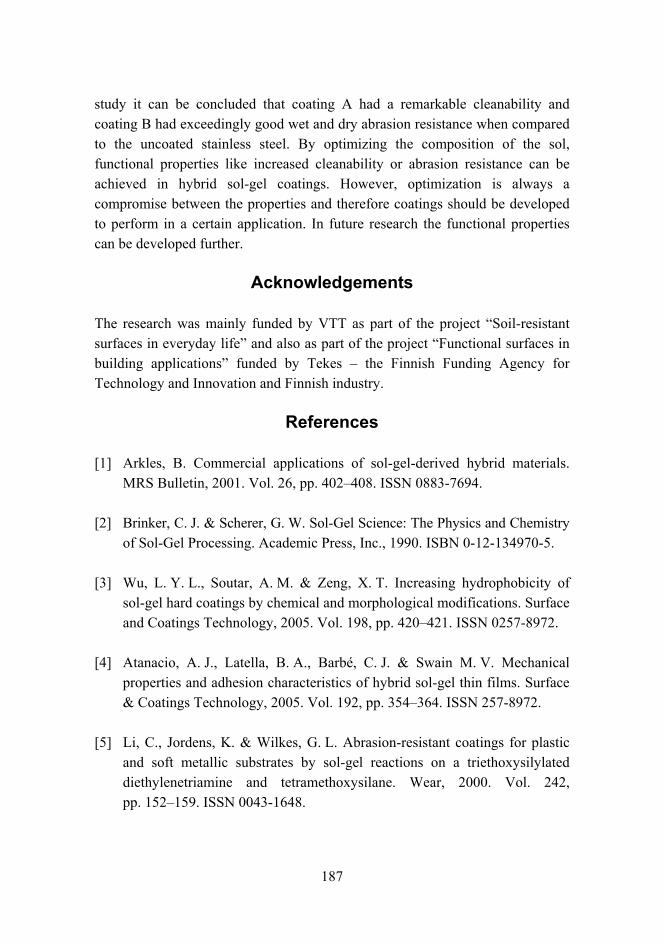
187
study it can be concluded that coating A had a remarkable cleanability and coating B had exceedingly good wet and dry abrasion resistance when compared to the uncoated stainless steel. By optimizing the composition of the sol, functional properties like increased cleanability or abrasion resistance can be achieved in hybrid sol-gel coatings. However, optimization is always a compromise between the properties and therefore coatings should be developed to perform in a certain application. In future research the functional properties can be developed further.
Acknowledgements
The research was mainly funded by VTT as part of the project Soil-resistant surfaces in everyday life and also as part of the project Functional surfaces in building applications funded by Tekes the Finnish Funding Agency for Technology and Innovation and Finnish industry.
References
[1] Arkles, B. Commercial applications of sol-gel-derived hybrid materials. MRS Bulletin, 2001. Vol. 26, pp. 402408. ISSN 0883-7694.
[2] Brinker, C. J. & Scherer, G. W. Sol-Gel Science: The Physics and Chemistry of Sol-Gel Processing. Academic Press, Inc., 1990. ISBN 0-12-134970-5.
[3] Wu, L. Y. L., Soutar, A. M. & Zeng, X. T. Increasing hydrophobicity of sol-gel hard coatings by chemical and morphological modifications. Surface and Coatings Technology, 2005. Vol. 198, pp. 420421. ISSN 0257-8972.
[4] Atanacio, A. J., Latella, B. A., Barbé, C. J. & Swain M. V. Mechanical properties and adhesion characteristics of hybrid sol-gel thin films. Surface & Coatings Technology, 2005. Vol. 192, pp. 354364. ISSN 257-8972.
[5] Li, C., Jordens, K. & Wilkes, G. L. Abrasion-resistant coatings for plastic and soft metallic substrates by sol-gel reactions on a triethoxysilylated diethylenetriamine and tetramethoxysilane. Wear, 2000. Vol. 242, pp. 152159. ISSN 0043-1648.
188
Improved mechanical properties by nanoreinforced HVOF-sprayed ceramic
composite coatings
Erja Turunen1, Tommi Varis1, Tom. E. Gustafsson1, Jari Keskinen2, Pertti Lintunen2, Pekka Lintula2 & Simo-Pekka Hannula1
VTT Technical Research Centre of Finland 1Metallimiehenkuja 8, Espoo, P.O. Box 1000, FI-02044 VTT
2Sinitaival 6, Tampere, P.O. Box 1300, FI-33101 Tampere
Abstract
HVOF-sprayed ceramic coatings can be considered as potential candidates for applications where good chemical and corrosion resistance of ceramics is needed. Due to the less porous structure of the HVOF-sprayed coating as compared to the plasma sprayed one, the protection capability of the coating is increased. Despite the dense structure, the coating properties are inferior as compared to bulk ceramics because of pores and microcracks, which influence adversely the coating properties (i.e., toughness, hardness and wear resistance). Improved mechanical properties have widely been demonstrated for bulk nanocrystalline materials. Especially with ceramic materials the decreasing of grain size has been found to be favorable.
Dense nanostructured ceramic coatings containing various nanostructured particles were manufactured by HVOF-spraying by using an HV-2000 spray gun. Mechanical properties, especially elastic modulus and relative fracture toughness, were studied. The techniques used were instrumented nanoindentation and KIC evaluation. As a result coatings with nearly 100% improvements in relative fracture toughness were produced for nanoreinforced composite coating.
Introduction
Ceramic coatings offer an interesting alternative for producing a protective layer over a steel structure due their excellent chemical, corrosion and thermal resistance. Thermal sprayed ceramic coatings also show interesting electrical
189
properties and can be considered to offer an economical solution as dielectric coatings in a variety of thick film and insulated metal substrate based electronics applications. In the thermal spray process the coating is built up from lamellas formed by rapid solidification of the melted or semi-melted droplets attached to the substrate. A typical structure for the coating is a pancake-like lamellar structure, where the flattening rate and adhesion between the lamellas, together with the coating material itself, define the main properties of the coating. Extensive development work on plasma sprayed coatings has been carried out, but recent studies have shown that HVOF is capable of depositing dense ceramic coatings [1, 2, 3].
Even though HVOF coatings are much denser as compared to ordinary plasma sprayed coatings, the coating properties are inferior as compared to bulk ceramics because of pores and microcracks, which adversely influence the coating properties (i.e., toughness, hardness and wear resistance). Poor mechanical strength as well as mismatches in coefficient of thermal expansion (CTE) often limits the use of dense ceramic coatings on metals. However, increasing porosity would decrease the protection capability of the coating.
Improved mechanical properties have been widely demonstrated for bulk nano-crystalline materials. Especially with ceramic materials the decreasing of grain size has been found to be favorable [4, 5]. Nanocrystalline materials offer better thermal shock resistance, lower thermal conductivity and better wear resistance than their conventional counterparts. For nanostructured bulk composites with nanosized metal precipitations in the nanocrystalline ceramic matrix, improved fracture toughness properties have also been reported [6, 7]. An increasing effort has been made to transfer such improvements into thermal sprayed ceramic coatings as well. Work has mainly been carried out with plasma spray systems, but recently it has been shown that a HVOF (High Velocity Oxy-Fuel) process can produce much denser coatings and hence better environmental protection capacity.
Due to the higher kinetic energy, shorter dwell time of particles in the flame and lower flame temperature compared to the plasma spray, HVOF offers an interesting combination to produce dense coatings with less phase transformations [8]. However, thermal spraying is a very complex process and includes a number of variables. The particle melting stage and possible phase transformations during particle flight in the thermal spray flame must be
190
controlled, as well as the coating build up mechanism including splat interface and stress stages. In order to produce a coating with desired properties, for example, with high fracture strength, it is not sufficient to control only material structure inside one lamella. Interaction between lamellae, stress stages of the final coating, adhesion to the substrate and cracking must be also controlled.
In this work the HVOF coating process for producing nanocrystalline Al2O3 and Cr2O3 based composite coatings is described. Mechanical properties, especially elastic modulus and relative fracture toughness were studied. Used techniques were instrumented nanoindentation and KIC evaluation. As a result, coatings with nearly 100% improvements in relative fracture toughness were produced for nanoreinforced alumina composite coating. Results of the microstructure, hardness and abrasive wear resistance of the coatings are reported.
Experimental
Powder development
Various ways to produce ceramic nanocomposite powders exist. In this work, both chemical routes and mechanical routes were used to produce nanosized raw material. The main goal was to combine nanosized basic ceramic, with a size of approximately 200 nm, with nanosized alloying element having a size of approximately 50 nm. Different alloying elements were selected to obtain different melting temperatures. The used alloying elements were Ni, NiO, SiC and ZrO2, having melting temperatures of 1455 °C, 1957 °C, 2500 °C and 2800 °C, respectively. After pre-alloying, nanostructured powder was spray dried to obtain larger agglomerates suitable for the thermal spray process. The powder development procedure is explained in more detail in publications [9, 10].
Thermal spray test setup
Coating deposition and spray diagnostics were accomplished with a Praxair HV-2000 spray gun, fitted with a 22 mm combustion chamber allowing for varying process parameters. Nitrogen was selected as a carrier gas, along with hydrogen as a fuel gas. A two-axis traverse unit was used to manipulate the gun during coating deposition. A Thermico CPF-2HP powder feeder was used to
191
ensure sufficient powder feed rate also for experimental powders having a non-optimal size distribution and flow capability.
On-line diagnostics by using the Spraywatch 2i equipment were carried out at different spray conditions to measure the particle velocity and temperature. The measurement is based on two-color pyrometry and a fast CCD camera [11].
Coatings were sprayed onto the steel plates having a size of 25 × 50 × 2 mm for microstructural and property characterization. The microstructural development was controlled by controlling the traverse rate of the gun and the powder feed rate, resulting in a certain thickness per pass.
Characterization
Powder agglomerate size was determined by using a Lecotrac LT100 particle size analyzer. The crystal structures of the powders and the coatings were characterized by X-ray diffraction (XRD) using Cu-Kα and Mo-Kα radiation. Electron microscopy using JEOL JSM-6400 (SEM) combined with a PGT PRISM 2000 X-ray analyzer, a LEO982 Gemini (FEG-SEM), and a Philips CM 200 (FEG-STEM) combined with a Noran Voyager X-ray analyzer were used to study the coating microstructures.
Hardness of the coatings was determined by Vickers micro-hardness method using a weight of 300 grams. Instrumented nanoindentation with a Nanotest 550 instrument equipped with a 0.79 mm ball indenter was used to characterize the elasto-plastic properties of the coating. Calculation of elastic modulus was made by using the method developed by Field and Swain [12, 13]. Indentation fracture toughness was determined from coating cross sections by the indentation method. The relative fracture toughness of the samples was measured using the load at which radial cracks at the corners of the indent are well developed and reproducible. The value for fracture toughness is given as relative only due to the fact that also non-optimal crack formation occurred in some samples due to the lamella structure of the coating. A number of semispherical formulas have been proposed based on the crack types and materials. In this work, we utilized the model of Niihara [14]. Wear resistance of the coatings was evaluated by a rubber wheel abrasion test according to standard ASTM G 65-91.
192
Results and discussion
Powder characterization
Powders were analyzed before HVOF-spray tests to confirm the phase structure of the particles. Powders consisted of α-alumina and the appearance of each alloying element was approved for each powder type. Size distribution of the powder fraction was measured to be between 2 and 29 µm. Detailed information of the produced powders and the reference powder are presented in Table 1. Typical morphology for the powders is presented in Figure 1.
Table 1. Produced powders and the reference powder.
Powder Material code Manufacturer and method
Agglomerate size [µm[ Crystal size
Al-1110 ref-Al2O3 Praxair, fused and crushed
522 conventional
Boehmite n-Al2O3 VTT, agglomerated and sintered
225 < 200nm*
Boehmite n-Al2O3 -2% Ni VTT, agglomerated and sintered
423 < 200nm*
Boehmite n-Al2O3 -5% Ni VTT, agglomerated and sintered
226 < 200nm*
Boehmite n-Al2O3 -5% NiO VTT, agglomerated and sintered
221 < 200nm*
Boehmite n-Al2O3 -5% ZrO2 VTT, agglomerated and sintered
229 < 200nm*
Boehmite n-Al2O3 -5% SiC VTT, agglomerated and sintered
229 < 200nm*
Norton ref-Cr2O3 Norton, fused and crushed
515 conventional
Bayer GN-M n-Cr2O3 VTT, agglomerated and sintered
622 < 300nm*
Bayer GN-M n-Cr2O3 -5% ZrO2 VTT, agglomerated and sintered
220 < 300nm*
Bayer GN-M n-Cr2O3 -5% SiC VTT, agglomerated and sintered
120 < 300nm*
* given by the manufacturer
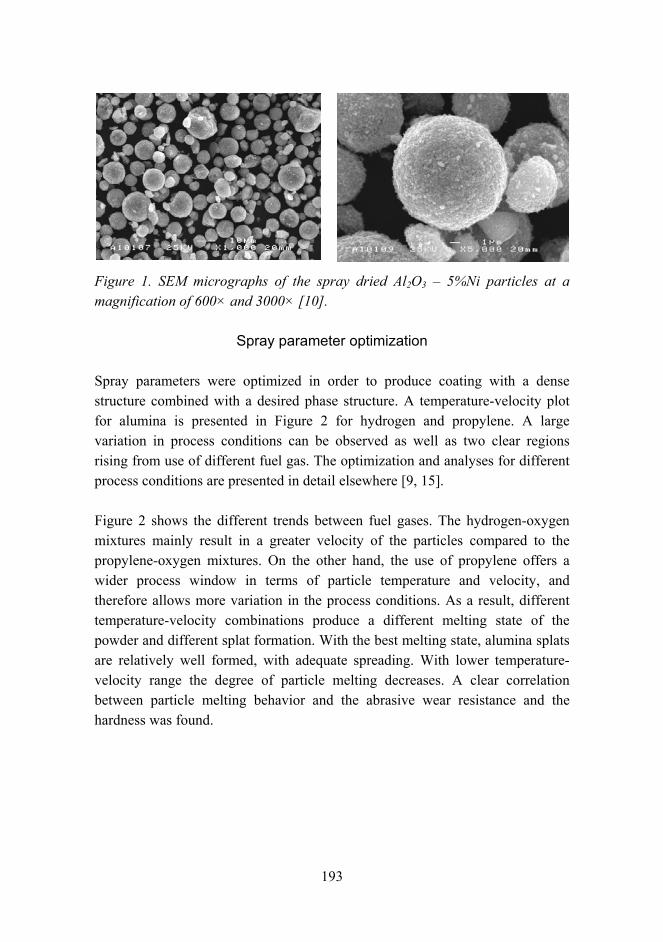
193
Figure 1. SEM micrographs of the spray dried Al2O3 5%Ni particles at a magnification of 600× and 3000× [10].
Spray parameter optimization
Spray parameters were optimized in order to produce coating with a dense structure combined with a desired phase structure. A temperature-velocity plot for alumina is presented in Figure 2 for hydrogen and propylene. A large variation in process conditions can be observed as well as two clear regions rising from use of different fuel gas. The optimization and analyses for different process conditions are presented in detail elsewhere [9, 15].
Figure 2 shows the different trends between fuel gases. The hydrogen-oxygen mixtures mainly result in a greater velocity of the particles compared to the propylene-oxygen mixtures. On the other hand, the use of propylene offers a wider process window in terms of particle temperature and velocity, and therefore allows more variation in the process conditions. As a result, different temperature-velocity combinations produce a different melting state of the powder and different splat formation. With the best melting state, alumina splats are relatively well formed, with adequate spreading. With lower temperature-velocity range the degree of particle melting decreases. A clear correlation between particle melting behavior and the abrasive wear resistance and the hardness was found.
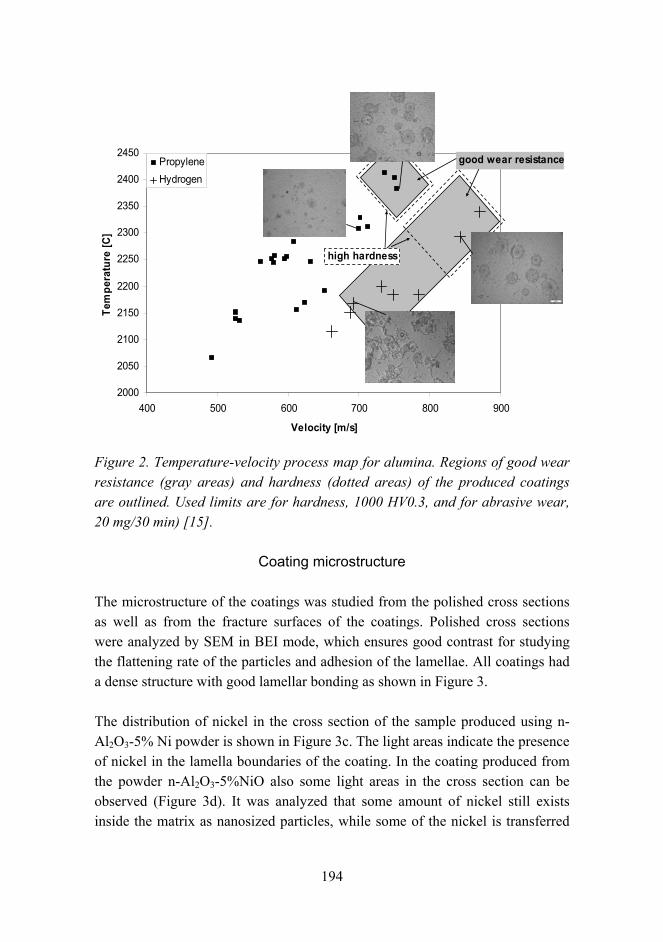
194
2000
2050
2100
2150
2200
2250
2300
2350
2400
2450
400 500 600 700 800 900
Velocity [m/s]
Tem
pera
ture
[C]
PropyleneHydrogen
good wear resistance
high hardness
Figure 2. Temperature-velocity process map for alumina. Regions of good wear resistance (gray areas) and hardness (dotted areas) of the produced coatings are outlined. Used limits are for hardness, 1000 HV0.3, and for abrasive wear, 20 mg/30 min) [15].
Coating microstructure
The microstructure of the coatings was studied from the polished cross sections as well as from the fracture surfaces of the coatings. Polished cross sections were analyzed by SEM in BEI mode, which ensures good contrast for studying the flattening rate of the particles and adhesion of the lamellae. All coatings had a dense structure with good lamellar bonding as shown in Figure 3.
The distribution of nickel in the cross section of the sample produced using n-Al2O3-5% Ni powder is shown in Figure 3c. The light areas indicate the presence of nickel in the lamella boundaries of the coating. In the coating produced from the powder n-Al2O3-5%NiO also some light areas in the cross section can be observed (Figure 3d). It was analyzed that some amount of nickel still exists inside the matrix as nanosized particles, while some of the nickel is transferred
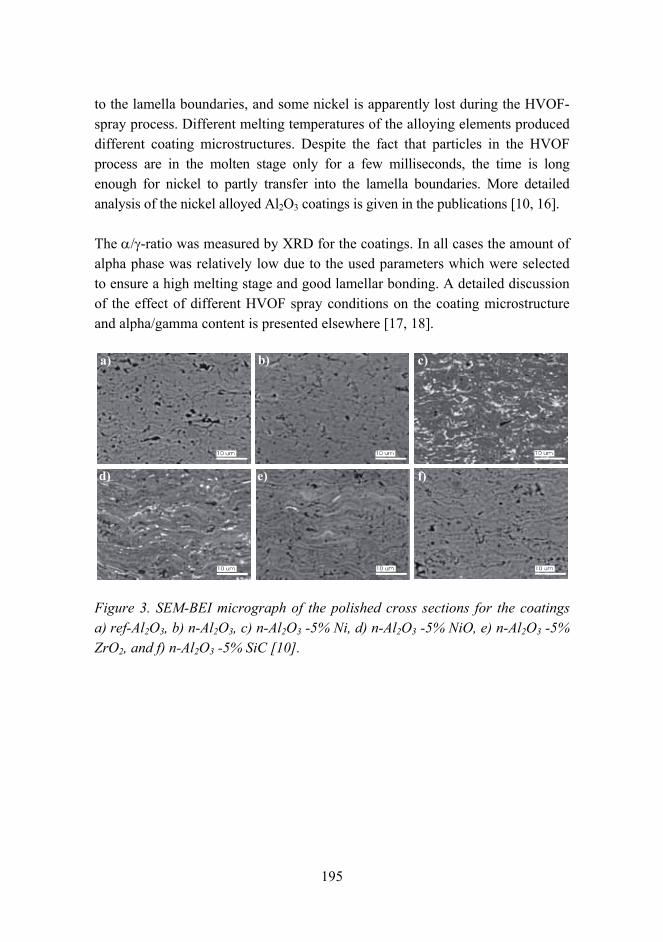
195
to the lamella boundaries, and some nickel is apparently lost during the HVOF-spray process. Different melting temperatures of the alloying elements produced different coating microstructures. Despite the fact that particles in the HVOF process are in the molten stage only for a few milliseconds, the time is long enough for nickel to partly transfer into the lamella boundaries. More detailed analysis of the nickel alloyed Al2O3 coatings is given in the publications [10, 16].
The α/γ-ratio was measured by XRD for the coatings. In all cases the amount of alpha phase was relatively low due to the used parameters which were selected to ensure a high melting stage and good lamellar bonding. A detailed discussion of the effect of different HVOF spray conditions on the coating microstructure and alpha/gamma content is presented elsewhere [17, 18].
a)
d)
b)
e)
c)
f)
Figure 3. SEM-BEI micrograph of the polished cross sections for the coatings a) ref-Al2O3, b) n-Al2O3, c) n-Al2O3 -5% Ni, d) n-Al2O3 -5% NiO, e) n-Al2O3 -5% ZrO2, and f) n-Al2O3 -5% SiC [10].
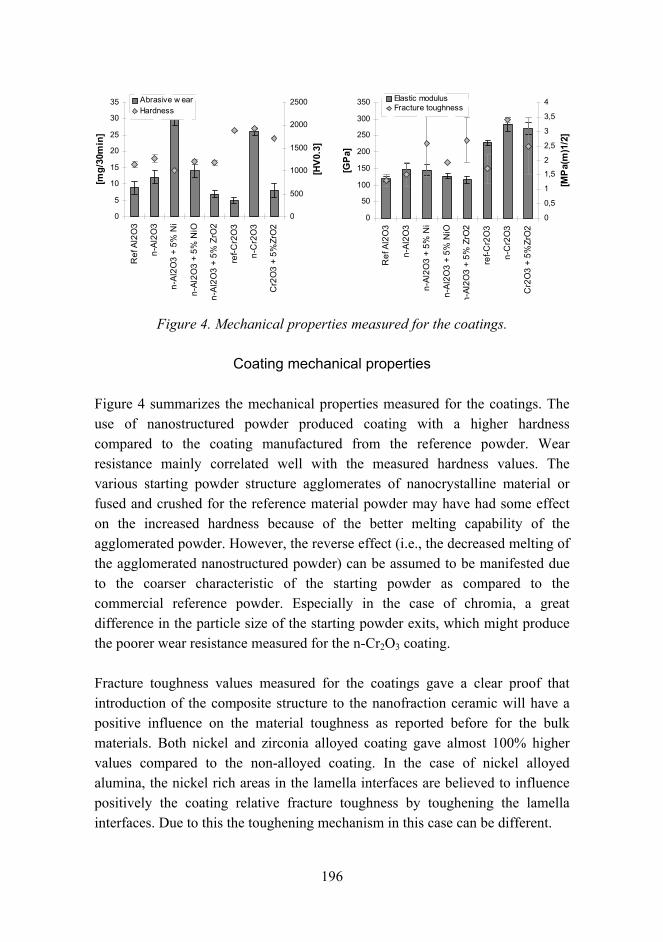
196
0
5
10
15
20
25
30
35
Ref
Al2
O3
n-A
l2O
3
n-A
l2O
3 +
5% N
i
n-Al
2O3
+ 5%
NiO
n-A
l2O
3 +
5% Z
rO2
ref-C
r2O
3
n-C
r2O
3
Cr2
O3
+ 5%
ZrO
2
[mg/
30m
in]
0
500
1000
1500
2000
2500
[HV0
.3]
Abrasive w earHardness
0
50
100
150
200
250
300
350
Ref
Al2
O3
n-A
l2O
3
n-A
l2O
3 +
5% N
i
n-A
l2O
3 +
5% N
iO
n-Al
2O3
+ 5%
ZrO
2
ref-C
r2O
3
n-C
r2O
3
Cr2
O3
+ 5%
ZrO
2
[GPa
]
0
0,5
1
1,5
2
2,5
3
3,5
4
[MP
a(m
)1/2
]
Elastic modulusFracture toughness
Figure 4. Mechanical properties measured for the coatings.
Coating mechanical properties
Figure 4 summarizes the mechanical properties measured for the coatings. The use of nanostructured powder produced coating with a higher hardness compared to the coating manufactured from the reference powder. Wear resistance mainly correlated well with the measured hardness values. The various starting powder structure agglomerates of nanocrystalline material or fused and crushed for the reference material powder may have had some effect on the increased hardness because of the better melting capability of the agglomerated powder. However, the reverse effect (i.e., the decreased melting of the agglomerated nanostructured powder) can be assumed to be manifested due to the coarser characteristic of the starting powder as compared to the commercial reference powder. Especially in the case of chromia, a great difference in the particle size of the starting powder exits, which might produce the poorer wear resistance measured for the n-Cr2O3 coating.
Fracture toughness values measured for the coatings gave a clear proof that introduction of the composite structure to the nanofraction ceramic will have a positive influence on the material toughness as reported before for the bulk materials. Both nickel and zirconia alloyed coating gave almost 100% higher values compared to the non-alloyed coating. In the case of nickel alloyed alumina, the nickel rich areas in the lamella interfaces are believed to influence positively the coating relative fracture toughness by toughening the lamella interfaces. Due to this the toughening mechanism in this case can be different.
197
Conclusions
Dense ceramic coating with various alloying elements was produced by HVOF-spraying. Nickel alloyed coating was a combination of a more macroscopic composite structure consisting of nickel rich areas in the lamella interfaces combined with nanosized precipitations inside the alumina matrix. For this type of coating slightly reduced harness and abrasive wear resistance was measured combining with high elastic modulus and relative fracture toughness.
The zirconia alloyed coating produced the most interesting values when considering coating which could combine good protection capability, such as dense structure, high hardness and high wear resistance combined with good toughness.
The type of coatings produced are considered to be a potential candidate for a protective coating in harsh environments where good relative fracture toughness combined with excellent chemical and corrosion resistance of ceramics is needed.
Acknowledgement
This work was sponsored by Tekes the Finnish Funding Agency for Technology and Innovation, VTT Technical Research Centre of Finland, and Finnish industry (Kemira Pigments Oy, Fortum Oil Oy, Rautaruukki Oyj, OMG Kokkola Chemicals Oy, Outokumpu Research Oy, ABR Innova Oy, Pikoteknik Oy, Ionhawk Oy, and Stratum Oy).
Stony Brook University in the USA, Osaka University in Japan, and Modena University in Italy are acknowledged for close co-operation related to this work.
Reference list
1. Sturgeon, A. J. et al. The influence of fuel gas on the microstructure and wear performance of alumina coatings produced by the High Velocity Oxyfuel (HVOF) thermal spray process. British Ceramic Proceedings, 1997, Vol. 54, pp. 5764.
198
2. Kulkarni, A., Gutleber, J., Sampath, S., Goland, A., Lindquist, W. B., Herman, H., Allen, A. J. & Dowd, B. Studies of the microstructure and properties of dense ceramic coatings produced by high-velocity oxygen-fuel combustion spraying. Materials Science and Engineering A369, 2004, pp. 124137.
3. Turunen, E., Varis, T., Hannula, S.-P., Kulkarni, A., Gutleber, J., Vaidya, A., Sampath, S. & Herman, H. On the role of particle state and deposition procedure on mechanical, tribological and dielectric response of high velocity oxy-fuel sprayed alumina coatings. Materials Science and Engineering, A 415, 2006, pp. 111.
4. Hannula, S.-P., Koskinen, J., Haimi, E. & Nowak, R. Encyclopedia of Nanoscience and Nanotechnology, Vol. 5, 2004, H. S. Nalwa, Ed., American Scientific Publishers, USA. 131 p.
5. Mohammed, F. A. & Li, Y. Creep and superplasticity in nanocrystalline materials: current understanding and future prospects. Mater. Sci. Eng., Vol. 298A, 2001, pp. 115.
6. Jeong, Y. K. & Niihara, K. Microstructure and mechanical properties of pressureless sintered Al2O3/SiC nanocomposites. Nanostructured Materials, 1997, Vol. 9, pp. 193196.
7. Oh, S.-T., Sando, M. & Niihara, K. Processing and Properties of Ni-Co Alloy Dispersed Al2O3 Nanocomposites. Scripta Materialia, 1998, Vol. 39, pp. 14131418.
8. Lima, R. S. & Marple, B. R. From APS to HVOF-spraying of conventional and nanostructured titania feedstock powders: a study on the enhancement of the mechanical properties. Surface and Coatings Technology, 15 March 2006, Vol. 200, Issue 11, pp. 34283437.
9. Turunen, E., Varis, T., Gustafsson, T. E., Keskinen, J., Fält, T. & Hannula, S.-P. Parameter optimization of HVOF-sprayed nanostructured alumina and alumina-nickel composite coatings. Surface and Coatings Technology, 200, 2006, pp. 49874994.
199
10. Turunen, E., Varis, T., Gustafsson, T. E., Keskinen, J., Lintunen, P., Fält, T. & Hannula, S.-P. Process optimization and performance of nanoreinforced HVOF-sprayed ceramic coatings. Proceedings of 16th International Plansee Seminar, May 30 June 3 2005, Reutte, Austria (2005), PM43. Vol. 1. Pp. 422433.
11. Vattulainen, J., Hämäläinen, E., Hernberg, R., Vuoristo, P. & Mäntylä, T. Journal of Thermal Spray Technology, 2001, Vol. 10(1), p. 94.
12. Field, J. S. & Swain, M. V. A Simple Predictive Model for Spherical Indentation. Journal of Materials Research (USA), Feb. 1993, Vol. 8, No. 2, pp. 297306. ISSN 0884-2914.
13. Field, J. S. & Swain, M. V. Determining the mechanical properties of small volumes of material from submicrometer spherical indentations. J. Mater. Res., Jan. 1995, Vol. 10, No. 1, pp. 101112. ISSN 0884-2914.
14. Niihara, K. A fracture mechanics analysis of indentation-induced Palmqvist crack in ceramics. J. Mat. Sci Let, 1983, Vol. 2, No. 5, pp. 221223.
15. Turunen, E. Diagnostic tools for HVOF process optimization. VTT Publications 583. Espoo, VTT, 2005. 66 p. + app. 92 p. ISBN 951-38-6677-7; 951-38-6678-5. http://virtual.vtt.fi/inf/pdf/publications/2005/P583.pdf.
16. Turunen, E., Varis, T., Hannula, S.-P., Keskinen, J., Lintunen, P. & Fält, T. Nanoreinforced HVOF-sprayed ceramic coatings, Thermal Spray connects: Explore its surfacing potential, CD-ROM Part HVOF II, International Thermal Spray Conference, ITSC 2005, 13 May 2005, Basel, Switzerland, (2005). 6 p.
17. Hannula, S.-P., Turunen, E., Keskinen, J., Varis, T., Fält, T., Gustafsson, T. E. & Nowak, R. Development of Nanostructured Al2O3Ni HVOF coatings, Key Engineering Materials, August 2006, Vols. 317318, pp. 539544.
18. Turunen, E., Hirvonen, A., Varis, T., Fält, T., Hannula, S.-P., Sekino, T. & Niihara, K. Application of HVOF Techniques for Spraying of Ceramic Coatings, the Proceedings of International Symposium on Hybrid Nano Materials Toward Future Industries, 2006. (In press).

200

201
Materials properties and characterization

202
203
Improved fire performance for wood-based products
Tuula Hakkarainen & Esko Mikkola
VTT Technical Research Centre of Finland Betonimiehenkuja 5, Espoo, P.O. Box 1000, FI-02044 VTT
Abstract
In many building and construction applications, ordinary wood cannot be used due to its natural combustibility. However, wood-based products with improved fire performance can meet even very stringent requirements, thus extending the usability of wood as a building material. Three assessment tools for the evaluation of improvements in fire performance of wood-based products are introduced in this paper. The first tool is based on material properties having an influence on fire performance, and it estimates the change of fire performance that can realistically be achieved by a given change of an actuating quantity. The second tool offers simple rules of thumb according to which the reaction-to-fire classification of a wood product can be estimated on the basis of a small-scale fire test. The third tool is based on a one-dimensional thermal flame spread model, applied to predict the heat release rate in the classification test on the basis of small-scale test data. An example of wood products with improved fire properties developed using these tools is phenol coated birch plywood including an aluminium layer of an optimized thickness to protect the veneers. This product has possibilities to meet the requirements of Euroclass B.
Introduction
Due to its natural combustibility, timber burns if exposed to severe fire conditions. However, wood products can be used safely either by improving their fire performance or by choosing the end use conditions properly. Methods for improving the fire performance of wood products include chemical, biochemical and physical modification, as well as structural means. A wide range of wood based products can meet even very stringent requirements, thus extending the market use of wood as a building material.

204
In many applications, ordinary wood cannot be used due to fire risks and restrictions in national building codes [1]. The main advantage of wood-based products with improved fire performance is that they extend the usability of wood. High fire performance wood products can meet the requirements of class B in the European classification system for construction products, whereas ordinary wood products typically fall into class D.
The main objective of the project Innovative eco-efficient high fire performance wood products for demanding applications InnoFireWood is to develop a new generation of innovative wood products whose main characteristics are substantial improvements in the fire performance with maintained eco-efficiency, durability and other properties of the original wood product. The set of tools introduced in this paper has been developed for assisting the product development of wood products with improved fire performance.
Tools for product development
The assessment tools for the product development of wood products with improved reaction-to-fire properties provide new methods for the design and development of high fire performance wood products that meet the end-use requirements of various applications.
The first tool is based on the material properties of wood having an influence on fire performance, including the surface properties of the product studied. It estimates the change of fire performance that can realistically be achieved by a given change of an actuating quantity.
Using the second tool, the improvement of fire performance can be assessed on the basis of small-scale fire tests performed using the cone calorimeter [2]. This tool provides a link between the cone calorimeter and the European reaction-to-fire classification by the SBI test [3], offering simple rules of thumb according to which the Euroclass of a wood product with improved fire performance can be estimated.
The third tool is based on a one-dimensional thermal flame spread model [4], applied to predict the heat release rate in the classification test on the basis of
205
cone calorimeter data [5]. Predictions for classification parameters can be determined from the calculated heat release rate curve. The basic model works well for many product types, including untreated wood products. For fire-retardant treated wood products with low heat release, the input parameters have been separately optimized to improve the accuracy of predictions [6].
Tool 1: effect evaluation of material property changes
The starting points of the assessment are the material properties of wood having an influence on fire performance, including the surface properties of the product studied. The basic idea is to estimate the change of fire performance that can realistically be achieved by a given change of an actuating quantity.
For example, the dependence of the time to ignition on the density of wood is well known [7]. Consequently, it can be calculated how much the time to ignition changes if the surface density of a wood product is changed.
The improvements of fire performance achievable by realistic changes of material properties are seldom significant enough to upgrade the classification of a wood product. In the case of borderline products, however, small changes may be crucial.
Tool 2: rules of thumb
By studying the SBI and cone calorimeter test results of wood products belonging to a certain European reaction-to-fire class, similarities in the ignition and heat release behavior have been found. Typical class B products, for example, exhibit heat release rate levels of 100 kW/m2 at maximum (throughout the test) and times to ignition of 40 seconds or more in cone calorimeter tests at the irradiance of 50 kW/m2. Figure 1 shows heat release rate curves of several class B products. Similar limits can be found to correspond to classes C and D. By analyzing an extensive collection of cone calorimeter and SBI test data and modelling results of wood products, the rules of thumb presented in Table 1 have been defined.
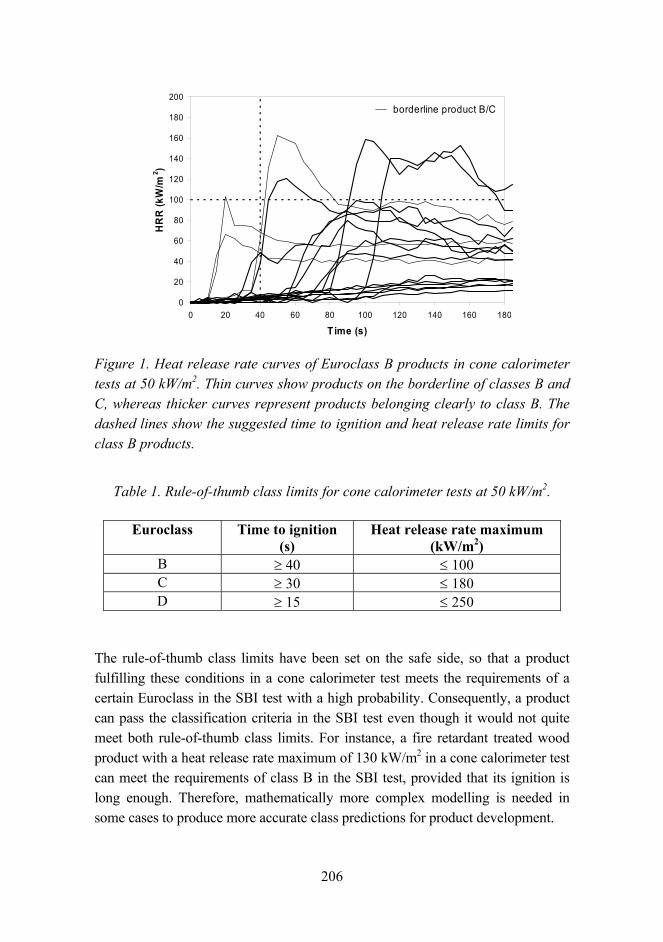
206
0
20
40
60
80
100
120
140
160
180
200
0 20 40 60 80 100 120 140 160 180
Time (s)
HR
R (k
W/m
2 )
borderline product B/C
Figure 1. Heat release rate curves of Euroclass B products in cone calorimeter tests at 50 kW/m2. Thin curves show products on the borderline of classes B and C, whereas thicker curves represent products belonging clearly to class B. The dashed lines show the suggested time to ignition and heat release rate limits for class B products.
Table 1. Rule-of-thumb class limits for cone calorimeter tests at 50 kW/m2.
Euroclass Time to ignition (s)
Heat release rate maximum (kW/m2)
B ≥ 40 ≤ 100 C ≥ 30 ≤ 180 D ≥ 15 ≤ 250
The rule-of-thumb class limits have been set on the safe side, so that a product fulfilling these conditions in a cone calorimeter test meets the requirements of a certain Euroclass in the SBI test with a high probability. Consequently, a product can pass the classification criteria in the SBI test even though it would not quite meet both rule-of-thumb class limits. For instance, a fire retardant treated wood product with a heat release rate maximum of 130 kW/m2 in a cone calorimeter test can meet the requirements of class B in the SBI test, provided that its ignition is long enough. Therefore, mathematically more complex modelling is needed in some cases to produce more accurate class predictions for product development.
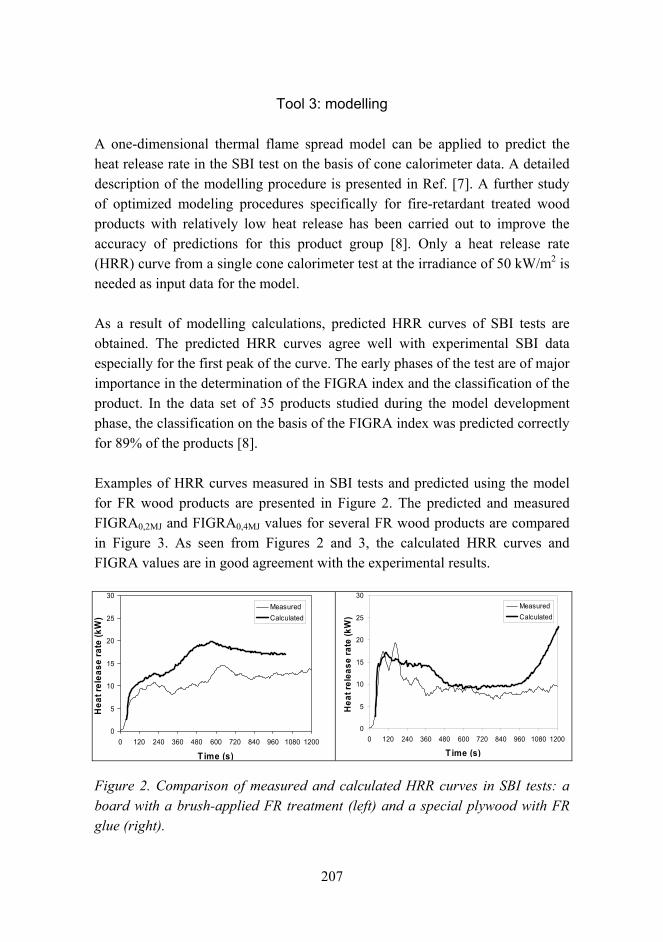
207
Tool 3: modelling
A one-dimensional thermal flame spread model can be applied to predict the heat release rate in the SBI test on the basis of cone calorimeter data. A detailed description of the modelling procedure is presented in Ref. [7]. A further study of optimized modeling procedures specifically for fire-retardant treated wood products with relatively low heat release has been carried out to improve the accuracy of predictions for this product group [8]. Only a heat release rate (HRR) curve from a single cone calorimeter test at the irradiance of 50 kW/m2 is needed as input data for the model.
As a result of modelling calculations, predicted HRR curves of SBI tests are obtained. The predicted HRR curves agree well with experimental SBI data especially for the first peak of the curve. The early phases of the test are of major importance in the determination of the FIGRA index and the classification of the product. In the data set of 35 products studied during the model development phase, the classification on the basis of the FIGRA index was predicted correctly for 89% of the products [8].
Examples of HRR curves measured in SBI tests and predicted using the model for FR wood products are presented in Figure 2. The predicted and measured FIGRA0,2MJ and FIGRA0,4MJ values for several FR wood products are compared in Figure 3. As seen from Figures 2 and 3, the calculated HRR curves and FIGRA values are in good agreement with the experimental results.
0
5
10
15
20
25
30
0 120 240 360 480 600 720 840 960 1080 1200
Time (s)
Hea
t rel
ease
rate
(kW
)
MeasuredCalculated
0
5
10
15
20
25
30
0 120 240 360 480 600 720 840 960 1080 1200
Time (s)
Hea
t rel
ease
rate
(kW
)
MeasuredCalculated
Figure 2. Comparison of measured and calculated HRR curves in SBI tests: a board with a brush-applied FR treatment (left) and a special plywood with FR glue (right).
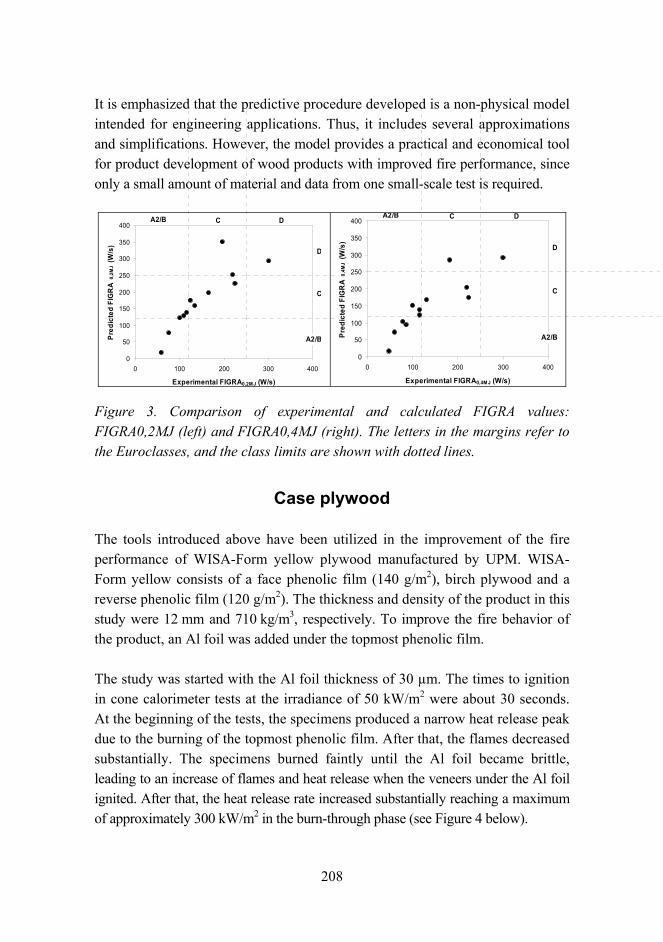
208
It is emphasized that the predictive procedure developed is a non-physical model intended for engineering applications. Thus, it includes several approximations and simplifications. However, the model provides a practical and economical tool for product development of wood products with improved fire performance, since only a small amount of material and data from one small-scale test is required.
0
50
100
150
200
250
300
350
400
0 100 200 300 400
Experimental FIGRA0,2MJ (W/s)
Pred
icte
d FI
GR
A0,
2MJ
(W/s
)
A2/B
A2/B
C D
C
D
0
50
100
150
200
250
300
350
400
0 100 200 300 400
Experimental FIGRA0,4MJ (W/s)
Pred
icte
d FI
GR
A0,
4MJ
(W/s
)
A2/B
A2/B
C D
C
D
Figure 3. Comparison of experimental and calculated FIGRA values: FIGRA0,2MJ (left) and FIGRA0,4MJ (right). The letters in the margins refer to the Euroclasses, and the class limits are shown with dotted lines.
Case plywood
The tools introduced above have been utilized in the improvement of the fire performance of WISA-Form yellow plywood manufactured by UPM. WISA-Form yellow consists of a face phenolic film (140 g/m2), birch plywood and a reverse phenolic film (120 g/m2). The thickness and density of the product in this study were 12 mm and 710 kg/m3, respectively. To improve the fire behavior of the product, an Al foil was added under the topmost phenolic film.
The study was started with the Al foil thickness of 30 µm. The times to ignition in cone calorimeter tests at the irradiance of 50 kW/m2 were about 30 seconds. At the beginning of the tests, the specimens produced a narrow heat release peak due to the burning of the topmost phenolic film. After that, the flames decreased substantially. The specimens burned faintly until the Al foil became brittle, leading to an increase of flames and heat release when the veneers under the Al foil ignited. After that, the heat release rate increased substantially reaching a maximum of approximately 300 kW/m2 in the burn-through phase (see Figure 4 below).
209
When the time to ignition and the heat release rate maximum of WISA-Form yellow with an Al foil of 30 µm were compared to the rules of thumb of Tool 2, neither of them fulfilled the conditions for Euroclass B. Due to the exceptional heat release behavior (i.e., a narrow peak followed by a very low level, the main heat release in a late phase), however, it was decided to apply Tool 3 to the results.
The model predicted FIGRA0,2MJ values of approximately 100 W/s, meeting the requirement of Euroclass B (FIGRA0,2MJ ≤ 120 W/s). In a single SBI test of WISA-Form yellow with an Al foil of 30 µm, however, the results FIGRA0,2MJ = 122 W/s and THR600s = 11,7 MJ were obtained. In terms of FIGRA0,2MJ, the product was on the borderline of classes B and C. Considering THR600s, however, it was clearly in class C (7,5 MJ < THR600s ≤ 15 MJ). (Note: three SBI replicate tests and additional testing defined in EN 13501-1 [9] are required for official classification.)
It is noted that in the SBI test that the plywood was backed by glass wool (thickness 50 mm, density 11 kg/m3) to represent end-use conditions. The structure behind an SBI test specimen cannot be taken into consideration in modelling based on cone calorimeter data, even though it can have a significant influence on the results and the Euroclass achieved.
To examine whether a thicker Al foil could protect the veneers longer and thus improve the classification of the product, cone calorimeter tests of WISA-Form yellow with Al foils of thicknesses 50 and 70 µm were performed. The heat release rate curves are presented in Figure 4.
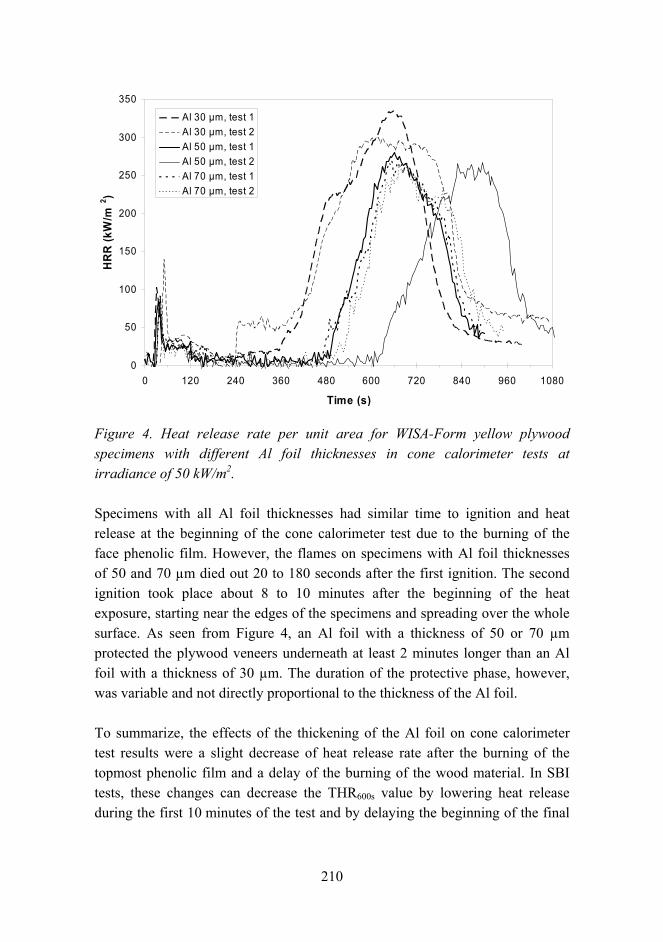
210
0
50
100
150
200
250
300
350
0 120 240 360 480 600 720 840 960 1080
Time (s)
HR
R (k
W/m
2 )Al 30 µm, test 1Al 30 µm, test 2Al 50 µm, test 1Al 50 µm, test 2Al 70 µm, test 1Al 70 µm, test 2
Figure 4. Heat release rate per unit area for WISA-Form yellow plywood specimens with different Al foil thicknesses in cone calorimeter tests at irradiance of 50 kW/m2.
Specimens with all Al foil thicknesses had similar time to ignition and heat release at the beginning of the cone calorimeter test due to the burning of the face phenolic film. However, the flames on specimens with Al foil thicknesses of 50 and 70 µm died out 20 to 180 seconds after the first ignition. The second ignition took place about 8 to 10 minutes after the beginning of the heat exposure, starting near the edges of the specimens and spreading over the whole surface. As seen from Figure 4, an Al foil with a thickness of 50 or 70 µm protected the plywood veneers underneath at least 2 minutes longer than an Al foil with a thickness of 30 µm. The duration of the protective phase, however, was variable and not directly proportional to the thickness of the Al foil.
To summarize, the effects of the thickening of the Al foil on cone calorimeter test results were a slight decrease of heat release rate after the burning of the topmost phenolic film and a delay of the burning of the wood material. In SBI tests, these changes can decrease the THR600s value by lowering heat release during the first 10 minutes of the test and by delaying the beginning of the final
211
heat release rate maximum. As a result, the THR600s value probably approaches the upper limit of class B (7,5 MJ). On the basis of the data available, however, it cannot be estimated on which side of the limit the product would fall. Changes on FIGRA values cannot be expected as a result of the thickening of the Al foil because they are determined by the ignition and burning of the phenolic film.
In conclusion, WISA-Form yellow plywood with an Al foil of 50 or 70 µm has the potential to meet the requirements of Euroclass B. However, it may still be a borderline product on the limit of classes B and C in terms of both FIGRA0,2MJ and THR600s values.
Conclusions
Three assessment tools for the development of high fire performance wood products have been developed in the InnoFireWood project. They provide practical and economical methods for product development of wood products with improved fire performance.
The first tool is based on material properties having an influence on fire performance, and it estimates the change of fire performance that can realistically be achieved by a given change of an actuating quantity. The improvements achievable by changing material properties are often relatively small, but they may be decisive in the case of borderline products.
The second and third tool are based on cone calorimeter tests requiring only a small piece of material. Tool 2 offers simple rules of thumb according to which the classification of a wood product can be estimated. It is best suited for fire retardant treated products. However, if the heat release behavior of the product studied is exceptional, for example due to physical modifications, a more accurate means is needed to reliably predict the classification. Tool 3 is based on a one-dimensional thermal flame spread model. It estimates the classification on the basis of the predicted heat release rate curve of the SBI test. Even though the official classification of products in Europe is made on the basis of the SBI test results, the combination of the cone calorimeter and Tools 2 and 3 is a useful method for product development.
212
The tools have been applied to prototype products in the InnoFireWood project. An example of wood products with improved fire properties developed using these tools is phenol coated birch plywood including an Al layer of an optimized thickness to protect the veneers. This product has possibilities to meet the requirements of Euroclass B.
Acknowledgements
The financial support of VTT, Tekes the Finnish Funding Agency for Technology and Innovation (project no. 40047/04), Wood Focus Oy and Oy Interenergy Ltd Presso Center is gratefully acknowledged.
References
1. Östman, B. & Rydholm, D. National fire regulations in relation to the use of wood in European and some other countries. Stockholm: Swedish Institute for Wood Technology Research, 2002. (Trätek Report P 0212044). 57 p. ISSN 1102-1071.
2. ISO 5660-1:2002. Reaction-to-fire tests Heat release, smoke production and mass loss rate Part 1: Heat release rate (cone calorimeter method). Geneva: International Organization for Standardization, 2002. 39 p.
3. EN 13823:2002. Reaction to fire test for building products Building products excluding floorings exposed to the thermal attack by a single burning item. Brussels: European Committee for Standardization, 2002. 95 p.
4. Kokkala, M., Baroudi, D. & Parker, W. J. Upward flame spread on wooden surface products: Experiments and numerical modelling. In: Hasemi, Y. (ed.). Fire Safety Science Proceedings of the 5th International Symposium. Melbourne, 37 March 1997. International Association for Fire Safety Science, 1997. Pp. 309320. ISBN 4-9900625-5-5.
5. Hakkarainen, T. & Kokkala, M. A. Application of a one-dimensional thermal flame spread model on predicting the rate of heat release in the SBI test. Fire and Materials, 2001. Vol. 25, No. 2, pp. 6170. ISSN 0308-0501.
213
6. Hietaniemi, J., Hakkarainen, T. & Mikkola, E. Modern tools for estimating fire performance of wood based products. COST Action E29: International Symposium of Advanced Timber and Timber-Composite Elements for Buildings. Florence, 2729 October 2004.
7. Mikkola, E. & Wichman, I. S. On the thermal ignition of combustible materials. Fire and Materials, 1989. Vol. 14, No. 3, pp. 8796.
8. Hakkarainen, T. Correlation studies of SBI and cone calorimeter test results. In: Interflam 2001 Proceedings of the 9th International Conference (Vol. 1). Edinburgh, UK, 1719 September 2001. London: Interscience Communications, 2001. Pp. 519530.
9. EN 13501-1:2002. Fire classification of construction products and building elements Part 1: Classification using test data from reaction to fire tests. Brussels: European Committee for Standardization, February 2002. 41 p.
214
New aspects for the cracking behavior of wood
Saila Jämsä, Mia Löija & Tuomo Ojanen
VTT Technical Research Centre of Finland Betonimiehenkuja 5, Espoo, P.O. Box 1000, FI-02044 VTT
Abstract
Wetting and drying of wood cause stresses and deformations in the material. These changes may cause cracks in the wood and wood coatings. Crack formation is a serious defect that may reduce the service life of the structure.
Cracking of wood has usually been studied as a result of stresses induced by moisture content difference between surface and interior. Minor attention has been paid to the stresses between earlywood and latewood. VTT has developed an application based on NIR spectroscopy to determine the moisture content in wood. FT-NIR mapping made it possible to distinguish earlywood and latewood of wood samples and enabled detecting of the moisture distribution along the surface of materials. The NIR- method confirmed the assumption that under the same relative humidity conditions the latewood had a higher moisture content than early wood. In a series of moisture load tests, the cracking of wood was observed to start close to the border of earlywood and latewood, but typically in the early wood region. This is an indication of internal stresses caused by moisture gradients between earlywood and latewood.
The dynamic moisture behavior of timber material layer consisting of earlywood and latewood plies having (assumed) different moisture properties were numerically simulated. The results showed how the local moisture gradients might have very high levels and variations by the border of earlywood and latewood during dynamic moisture load conditions.
Introduction
The moisture performance properties of structures are very important in planning the service life of wooden constructions. A major demand for facades
215
is high durability. Resistance to crack formation is an important factor influencing the durability of wood. Deep cracks collect water from rainfall thus developing favorable moisture content for mold, blue stain and decay fungi [1].
Wetting and drying of wood surfaces cause stresses and deformations in the wood. Stresses are formed in the wood as it swells and shrinks due to the moisture gradients between the surface and the interior. These induced stresses are greater the steeper the moisture gradient is and are usually largest near the surface of wood [2]. Cracking of wood has usually been studied as a result of stresses induced by moisture content difference between surface and interior. Minor attention has been paid to the stresses between earlywood and latewood. This may be due to the lack of appropriate measuring devices, which could monitor earlywood and latewood separately. VTT has developed an application based on NIR spectroscopy to determine the moisture content in wood [3]. FT-NIR mapping made it possible to see the difference in the moisture content between the earlywood and latewood and enabled detecting of the moisture distribution along the surface of materials.
The material properties, such as the density of earlywood and latewood, are quite different and the hygroscopic moisture content of these materials is supposed to be significantly different. Latewood is denser, harder, smoother and darker than earlywood and its cells have thicker walls and smaller cavities. The proportion of early wood to latewood varies depending on the species and growing conditions. The density from the end of the growing season to the beginning of the next is always abrupt. If the differences are large, the stresses imposed after wetting and drying can be quite large when dimensional changes occur at this transition zone and result in many parallel cracks [4, 5]. The annual ring orientation also affects the cracking sensitivity. Thus, boards with vertical annual ring orientation crack and split less than boards with horizontal annual ring orientation [4, 5, 6]. Different machining operations may also cause cracks [7].
This study is part of the project Takuupinta, where factors affecting service life of wood and coated wood have been studied. Among other things the moisture profiles during cracking were studied. The objective of this study was to find out the moisture distribution in wood surface and its effect on the dynamic moisture behavior of timber material consisting of earlywood and latewood parts. The hypothesis is that high gradients and fast changes of moisture conditions may
216
enhance the deterioration of timber material by creating stress along the interface region of early and latewood.
Experimental
The wood material studied was sapwood of Scots pine. Pine sapwood samples with a size of 5 x 10 x 100 mm were used in studying the moisture contents of earlywood and latewood. In the cracking studies, the sample size was 150 mm (length), 70 mm (width) and 20 mm (thickness).The samples were cut tangentially. The edges of the samples were sealed. The cyclic wetting and drying of the samples was carried out by floating the samples in water with the surfaces facing the water for 1 hour and after that drying them under a halogen lamp for 1 hour. The temperature during the floating was 20,5 °C and during the drying 80 °C on the surface of the sample. After each cycle, the cracks were detected.
FT-NIR mapping
Measurements of the moisture contents along the surface of wood were carried out using a FTIR spectrometer Bio-Rad FTS 6000 equipped with a UMA 500 IR microscope. The spectrometer was equipped with a liquid nitrogen MCT detector (mercury-cadmium-tellurium). A kalium-bromine window was used as the beam splitter. The spectra were recorded by using a reflection technique that measures the spectra only from the surface of the sample.
During collection of the spectra, the mirror speed was 0.64 cm/sec. This corresponds to 20 kHz modulation frequency. All spectra were taken at 8 cm-1 resolution using 15 scans. The spectra were collected at the wave number range of 6000700 cm-1 which means 1.6714.3 µm in wavelength. The mid-IR region ends at 4000 cm-1, however IR light gave enough energy to extend the measurements to the near IR-region (6000 cm-1). A background spectrum was taken with a gold-plated mirror. The NIR moisture content was calculated by integrating the OH vibrations at the wave number region from 53005000 cm-1.
The samples were conditioned at RH 35, 55, 65, 76, 85, 90, 95 and 100% relative humidity until constant mass was reached. For the NIR-measurement, the samples were sealed in an aluminium foil and a hole of 10 x 20 mm was cut in the middle of the foil. The IR measurement was separately focused to
217
earlywood and latewood. The average moisture contents were determined by weighing the samples. The moisture contents are expressed as weight per cents from the oven dried wood.
NIR mapping was carried out with a microscope (UMA 500) equipped with a motorized stage. IR maps consisted of 300 (10 x 30) separate areas, the dimension of each area was 200 x 205 µm. Total map dimension was 6.1 x 2 mm. There were 10 steps in the x-direction and 30 in the y-direction. The detection depth was the same during each measurement. Results were processed in SYSTAT version 10 software to make 3D image from the map.
Simulations of moisture gradients under dynamic conditions
Typical building physics simulations consider wood as a homogenous material layer. This assumption is not correct, but mostly adequate to predict the overall moisture performance of a building structure having timber layers.
Under stationary conditions, the main moisture performance difference between materials is caused by the material specific sorption properties, i.e. the moisture content of different materials typically differ from each other under the same relative humidity conditions. These differences will be highly pronounced under dynamic conditions when the moisture transport properties of different materials may cause significant transition on material boundaries. Most likely this happens in wood that is a matrix consisting of earlywood and latewood and their interfaces with mixed properties.
In this study, the earlywood and latewood were treated as separate material layers that have different material properties. The actual stresses or forces caused by the differences in the dimensional changes (time and magnitude) of these layers were not analyzed, but the moisture content distributions were used to demonstrate the moisture performance differences between the earlywood and latewood matrix compared to the approximation of homogeneous timber material.
Numerical simulations were carried out using the 1-D heat and moisture analysis model WUFI VTT 4.0 Pro [8]. The simulation period was 96 hours consisting of 24-hour long constant relative humidity conditions at the exterior side of the component. The boundary conditions and structures are presented in Figure 1.
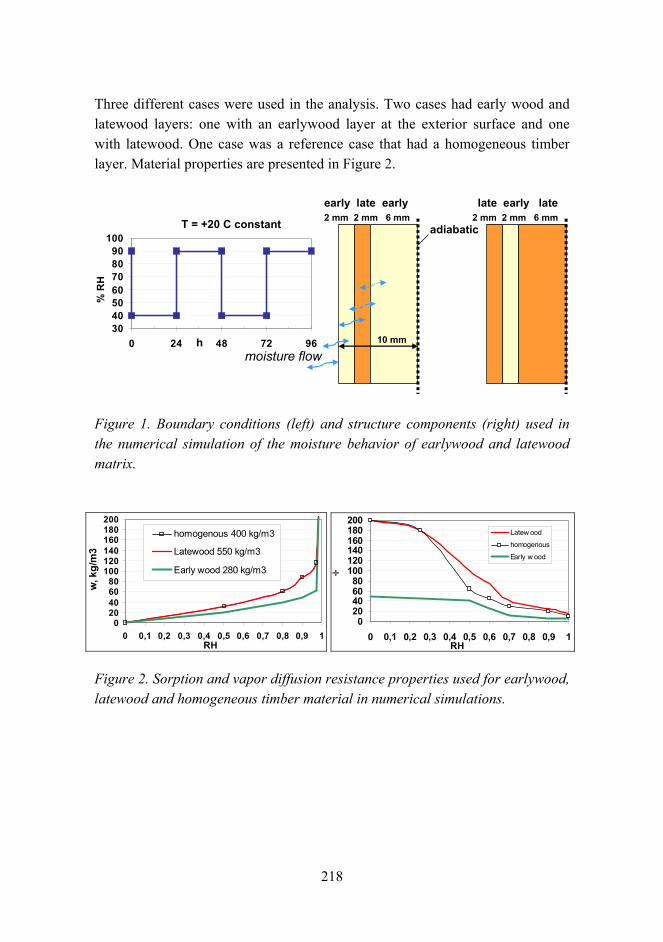
218
Three different cases were used in the analysis. Two cases had early wood and latewood layers: one with an earlywood layer at the exterior surface and one with latewood. One case was a reference case that had a homogeneous timber layer. Material properties are presented in Figure 2.
2 mm 2 mm 6 mm
10 mm30405060708090
100
0 24 48 72 96h
% R
H
2 mm 2 mm 6 mmlate early late
T = +20 C constant adiabatic
moisture flow
early late early
Figure 1. Boundary conditions (left) and structure components (right) used in the numerical simulation of the moisture behavior of earlywood and latewood matrix.
020406080
100120140160180200
0 0,1 0,2 0,3 0,4 0,5 0,6 0,7 0,8 0,9 1RH
w, k
g/m
3
homogenous 400 kg/m3
Latewood 550 kg/m3
Early wood 280 kg/m3
020406080
100120140160180200
0 0,1 0,2 0,3 0,4 0,5 0,6 0,7 0,8 0,9 1RH
÷
Latew ood
homogenous
Early w ood
Figure 2. Sorption and vapor diffusion resistance properties used for earlywood, latewood and homogeneous timber material in numerical simulations.
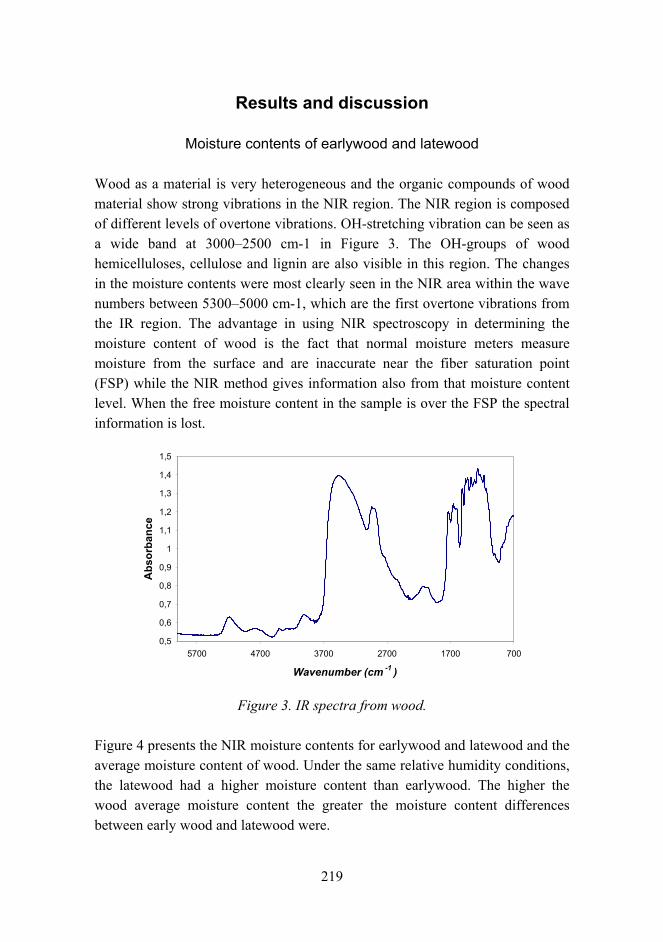
219
Results and discussion
Moisture contents of earlywood and latewood
Wood as a material is very heterogeneous and the organic compounds of wood material show strong vibrations in the NIR region. The NIR region is composed of different levels of overtone vibrations. OH-stretching vibration can be seen as a wide band at 30002500 cm-1 in Figure 3. The OH-groups of wood hemicelluloses, cellulose and lignin are also visible in this region. The changes in the moisture contents were most clearly seen in the NIR area within the wave numbers between 53005000 cm-1, which are the first overtone vibrations from the IR region. The advantage in using NIR spectroscopy in determining the moisture content of wood is the fact that normal moisture meters measure moisture from the surface and are inaccurate near the fiber saturation point (FSP) while the NIR method gives information also from that moisture content level. When the free moisture content in the sample is over the FSP the spectral information is lost.
0,5
0,6
0,7
0,8
0,9
1
1,1
1,2
1,3
1,4
1,5
70017002700370047005700
Wavenumber (cm -1 )
Abs
orba
nce
Figure 3. IR spectra from wood.
Figure 4 presents the NIR moisture contents for earlywood and latewood and the average moisture content of wood. Under the same relative humidity conditions, the latewood had a higher moisture content than earlywood. The higher the wood average moisture content the greater the moisture content differences between early wood and latewood were.
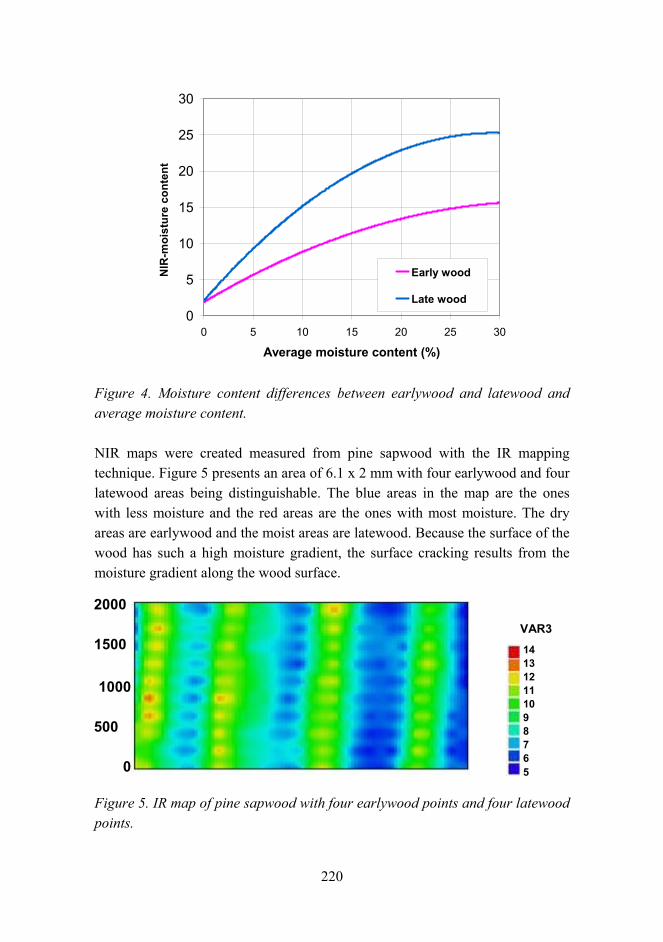
220
0
5
10
15
20
25
30
0 5 10 15 20 25 30
Average moisture content (%)
NIR
-moi
stur
e co
nten
t
Early wood
Late wood
Figure 4. Moisture content differences between earlywood and latewood and average moisture content.
NIR maps were created measured from pine sapwood with the IR mapping technique. Figure 5 presents an area of 6.1 x 2 mm with four earlywood and four latewood areas being distinguishable. The blue areas in the map are the ones with less moisture and the red areas are the ones with most moisture. The dry areas are earlywood and the moist areas are latewood. Because the surface of the wood has such a high moisture gradient, the surface cracking results from the moisture gradient along the wood surface.
Figure 5. IR map of pine sapwood with four earlywood points and four latewood points.
2000
1500
1000
500
0
VAR3 14 13 12 11 10 9 8 7 6 5
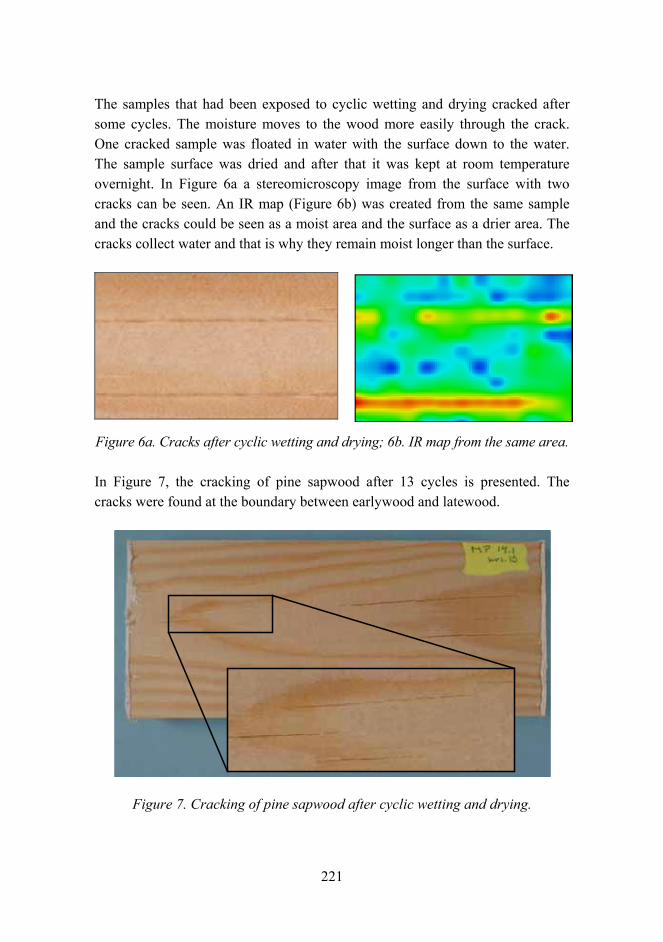
221
The samples that had been exposed to cyclic wetting and drying cracked after some cycles. The moisture moves to the wood more easily through the crack. One cracked sample was floated in water with the surface down to the water. The sample surface was dried and after that it was kept at room temperature overnight. In Figure 6a a stereomicroscopy image from the surface with two cracks can be seen. An IR map (Figure 6b) was created from the same sample and the cracks could be seen as a moist area and the surface as a drier area. The cracks collect water and that is why they remain moist longer than the surface.
Figure 6a. Cracks after cyclic wetting and drying; 6b. IR map from the same area.
In Figure 7, the cracking of pine sapwood after 13 cycles is presented. The cracks were found at the boundary between earlywood and latewood.
Figure 7. Cracking of pine sapwood after cyclic wetting and drying.
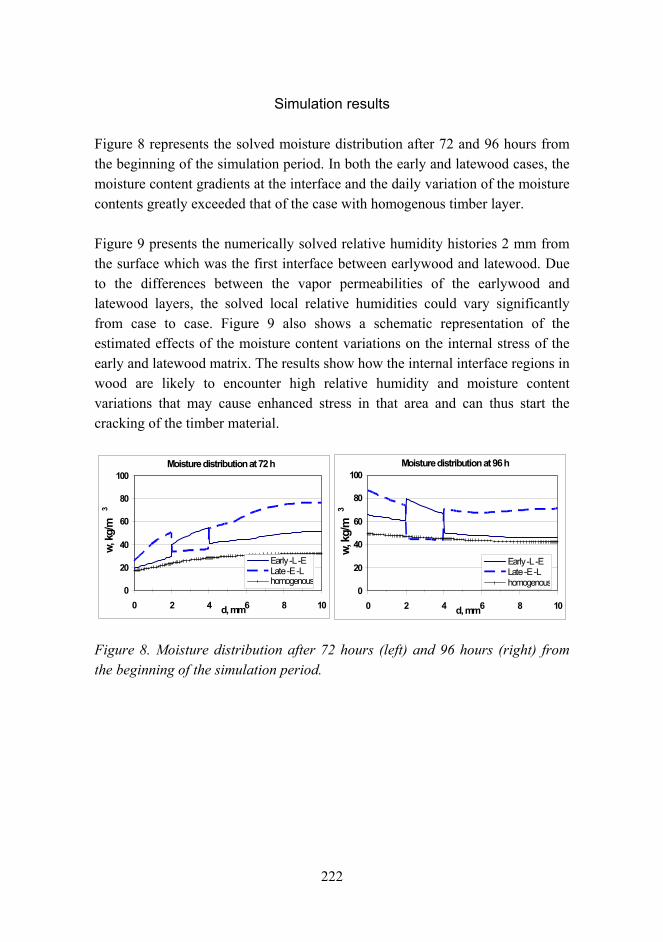
222
Simulation results
Figure 8 represents the solved moisture distribution after 72 and 96 hours from the beginning of the simulation period. In both the early and latewood cases, the moisture content gradients at the interface and the daily variation of the moisture contents greatly exceeded that of the case with homogenous timber layer.
Figure 9 presents the numerically solved relative humidity histories 2 mm from the surface which was the first interface between earlywood and latewood. Due to the differences between the vapor permeabilities of the earlywood and latewood layers, the solved local relative humidities could vary significantly from case to case. Figure 9 also shows a schematic representation of the estimated effects of the moisture content variations on the internal stress of the early and latewood matrix. The results show how the internal interface regions in wood are likely to encounter high relative humidity and moisture content variations that may cause enhanced stress in that area and can thus start the cracking of the timber material.
0
20
40
60
80
100
0 2 4 6 8 10d, mm
w, kg
/m3
Early -L -ELate -E -Lhomogenous
Moisture distribution at 72 h
0
20
40
60
80
100
0 2 4 6 8 10d, mm
w, k
g/m
3
Early -L -ELate -E -Lhomogenous
Moisture distribution at 96 h
Figure 8. Moisture distribution after 72 hours (left) and 96 hours (right) from the beginning of the simulation period.
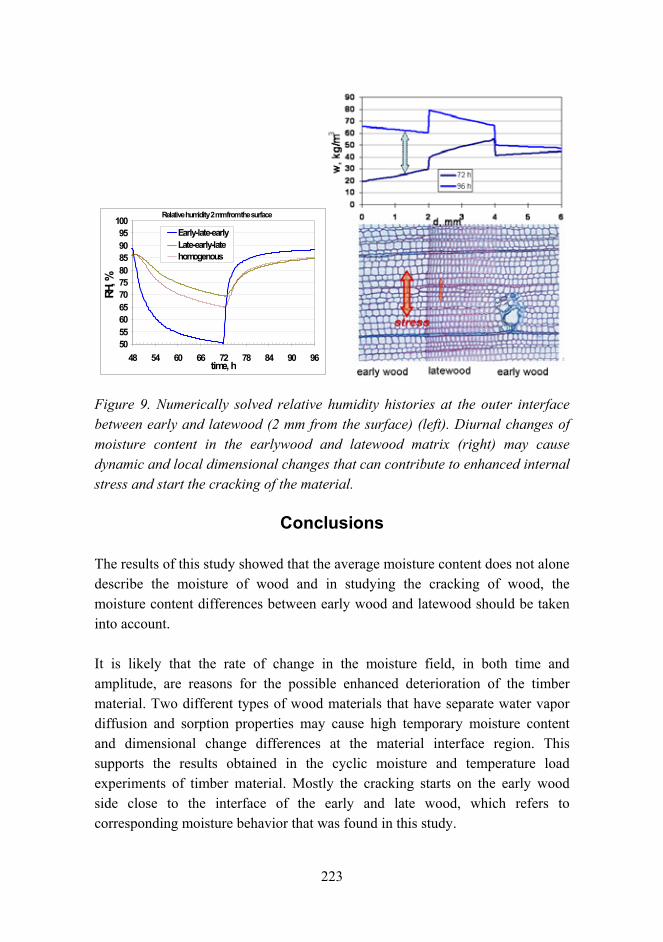
223
50556065707580859095
100
48 54 60 66 72 78 84 90 96time, h
RH, %
Early-late-earlyLate-early-latehomogenous
Relative humidity 2 mm from the surface
Figure 9. Numerically solved relative humidity histories at the outer interface between early and latewood (2 mm from the surface) (left). Diurnal changes of moisture content in the earlywood and latewood matrix (right) may cause dynamic and local dimensional changes that can contribute to enhanced internal stress and start the cracking of the material.
Conclusions
The results of this study showed that the average moisture content does not alone describe the moisture of wood and in studying the cracking of wood, the moisture content differences between early wood and latewood should be taken into account.
It is likely that the rate of change in the moisture field, in both time and amplitude, are reasons for the possible enhanced deterioration of the timber material. Two different types of wood materials that have separate water vapor diffusion and sorption properties may cause high temporary moisture content and dimensional change differences at the material interface region. This supports the results obtained in the cyclic moisture and temperature load experiments of timber material. Mostly the cracking starts on the early wood side close to the interface of the early and late wood, which refers to corresponding moisture behavior that was found in this study.
224
If the moisture flow rate was used as one criterion for deterioration, new aspects could be used to evaluate the drying process of timber, initial moisture contents of building materials, surface-coating criteria, etc. This would require the determination of the material properties separately for the earlywood and latewood. The IR method offers one possibility to determine the moisture contents of these layers.
Acknowledgement
This study was carried out as part of the Takuupinta project, in which factors affecting the service life of wood and wood coatings were studied. VTT, Tekes the Finnish Funding Agency for Technology and Innovation, Wood Focus Ltd and Teknos Ltd are gratefully acknowledged for their financial support.
Reference list
1. Ekstedt, J. Studies on the barrier properties of exterior wood coatings. Doctoral thesis. Stockholm: Trätek, 2002. 81 p. ISBN 91-7283-394-7.
2. Feist, W. & Hon, D. Chemistry of weathering and protection. In: Rowell, R. (ed.). The chemistry of solid wood. Washington D.C.: American Chemical Soc., 1984. Pp. 401451.
3. Löija, M., Ahonen, J., Jämsä, S. & Viitaniemi, P. Moisture contents of early and latewood determined with NIR spectroscopy. 2006. (Manuscript).
4. Williams, S., Jourdain, C., Daisey, G. & Springate, R. Wood properties affecting finish service life. Journal of Coatings Technology, 2000. Vol. 72, No. 902, pp. 3542.
5. Wood handbook Wood as an engineering material. Forest Products Laboratory. Gen. Tech. Rep. FPLGTR113. Madison, WI: U.S. Department of Agriculture, Forest Service, Forest Products Laboratory, 1999. 463 p.
225
6. Flaete, P., Höjbö, A., Fjaertoft, F. & Nilsen, T. Crack formation in unfinished siding of aspen (Populus tremula L.) and Norway spruce (Picea abies (l.) karst) during accelerated weathering. Holz als Roh und Werkstoff, 2000. Vol. 58, pp. 135139.
7. Stehr, M. & Östlund, S. An investigation of the crack tendency on wood surfaces after different machining operations. Holzforschung, 2000. Vol. 54, No. 4, pp. 427436.
8. WUFI (Wärme und Feuchte instationär Transient Heat and Moisture) 4.0 Pro software, The Fraunhofer Institute for Building Physics IBP.
226
Improved mechanical properties with wood fiber reinforced polymer composite technology
Jyrki Mali1, Johanna Lampinen2, Riitta Mahlberg1, Juha Mannila2 & Anne-Christine Ritschkoff1
VTT Technical Research Centre of Finland 1Betonimiehenkuja 5, Espoo, P.O. Box 1000, FI-02044 VTT
2Sinitaival 6, Tampere, P.O. Box 1300, FI-33101 Tampere
Abstract
The overall objective of this research is to develop high-performance wood polymer composites (WPCs) and novel wood-WPC hybrid materials for joinery products. These WPCs and hybrids represent new, innovative and eco-efficient biocomposites for targeted product profiles with improved mechanical performance. The composites were prepared by blending hardwood (birch) or softwood (a mixture of pine and spruce) chips with polypropylene matrix. The percentage of the wood material in the blends was 60%. Coupling agents (maleated polypropylene) and other additives were added in the blends in small quantities. Some material combinations were also treated with additives, such as UV pigments and nanomers, in order to improve the UV- and abrasion resistance of the samples. An injection molding technique was used to make test samples from the different material combinations.
Introduction
In recent years, there has been a remarkable growth worldwide in the production of biomaterial-based composites. In Europe, biocomposite materials have mainly been natural (e.g., agricultural) fiber-polymer composites (NFPC) for the automotive industry and in North America mainly wood polymer composites (WPC) for the building material industry. The rapid development in material science and nanotechnology provides great opportunities for the development of new knowledge-based material combinations and technical breakthroughs. In order to be considered as adequate alternatives to existing joinery products, the
227
eco-efficient concepts have to fulfill material and process requirements, such as good mechanical properties.
The components of the new composites, polypropylene and wood, are known to be susceptible to degradation by UV light. Therefore, one of the main focuses of recent studies has been in improvement of the UV resistance of the composites [1]. Besides UV resistance, attention should be paid to moisture behavior and biological resistance of the composites, when polymers are reinforced with natural fibers. [2.] Dimensional stability and biological resistance of wood can be enhanced to a certain extent by heat treatment, which could be a potential treatment also for fibers to be used in WPCs. Traditional additives promoting weather resistance of wood may be effective in WPC as well. However, the effect of the additives on the mechanical properties of the composites needs to be verified.
The overall objective of this research is to develop high-performance wood polymer composites (WPCs) and novel wood-WPC hybrid materials for joinery products. The wood material used in the composites was waste material such as cutter chips from planning mills. Composites with heat-treated fibers or weather and abrasion resistance-promoting additives were included in the study. These WPCs and hybrids represent new, innovative and eco-efficient biocomposites for targeted product profiles with improved mechanical performance.
Materials and methods
Materials
Scots pine (Pinus sylvestris), spruce (Picea abies) and birch (Betula verrucosa) were used as wood raw materials in this investigation. The wooden raw materials were in the form of pure cutter chips. They were delivered from small planing mills. Also heat treated Scots pine (ThermoWood, 212 °C peak temperature) from Finnforest Kaskinen was used as raw material.
The thermoplastic matrix used was polypropylene PP BH345. Coupling agent MAH Licomont was used with 3% loading (weight-% of polymer). In addition, Irganox was used as additive with 0.2% loading (weight-% of polymer).
228
WPC production
Compounding
In this study, compounding was performed in a twin-screw extruder, into which the polymer (PP), additives and reinforcement/filler (wood fibers) were fed. The mixing took place at elevated temperatures in the mixing area consisting of two co-rotating screws with specifically designed screw geometry. After mixing, the screws forced the compound out of the die opening as a string, which was then granulated after cooling.
Before compounding, the wood fibers were dried in order to prevent moisture from incorporating the structure. After granulation, the compounded granules were dried (103 °C) again before injection molding.
Injection molding
Injection molding is a widely used technology in the thermoplastics industry, especially when fabricating large series of products. It is a process where plastic is first melted on a single screw and then injected with pressure into a mold cavity. Once the plastic has cooled in the mold, the mold opens and the part is ejected. In this project, injection molding was mainly performed with an ES200/50HL injection molding machine (Engel GmbH, Schwertberg, Austria). In this case, special attention had to be paid to the processing temperatures, as wood fibers are prone to degradation at elevated temperatures.
Produced and tested samples
The following wooden raw materials in the form of pure cutter chips from small planing mills were prepared for manufacturing of injection molded test samples:
* conifer ( 50% Scots pine and 50% spruce), 10.9% moisture content (MC) * birch, 15.9% MC * heat treated pine (ThermoWood, 212 °C peak temperature), 8.8% MC.
The composites were prepared by blending hardwood (birch) or softwood (a mixture of pine and spruce) chips with polypropylene matrix. The percentage of
229
the wood material in the blends was 60%. Coupling agents (maleated polypropylene) and other additives were added in the blends in small quantities. Some material combinations were also treated with additives, such as UV pigments and nanomers, in order to improve the UV- and abrasion resistance of the samples.
With these raw materials, the following injection-molded test samples were manufactured:
• Polypropylene/Conifer (untreated); injection molded with 60% wood content.
• Polypropylene/Birch (untreated); injection molded with 60% wood content.
• Polypropylene/ThermoWood D (pine, 212 °C peak temperature); injection molded with 60% wood content.
• Polypropylene/Conifer; injection-molded with 60% wood content using four different UV protection systems.
Analyses
Size distribution analyses
The wood chips were sieved into six different fractions: < 0.297 mm, 0.297–0.71 mm, 0.71–1.41 mm, 1.41–2.83 mm, 2.83–5.66 mm and > m5.66 mm.
Bending strength (EN 408)
Bending strength and modulus of elasticity were determined as the 4-point bend. Test speed was 10 mm/min. Tests were run with five replicates of each injection molding. Test specimens were conditioned to constant mass in an atmosphere with a mean relative humidity of (65 ± 5)% and a temperature of (20 ± 2) °C.
Tensile strength (ISO 527-4)
Tensile testing of the injection-molded composite specimens (ISO3167) was performed with an Instron 4505 universal testing machine (Instron Ltd, Buckinghamshire, UK) using 10kN power sensors. The tests were performed
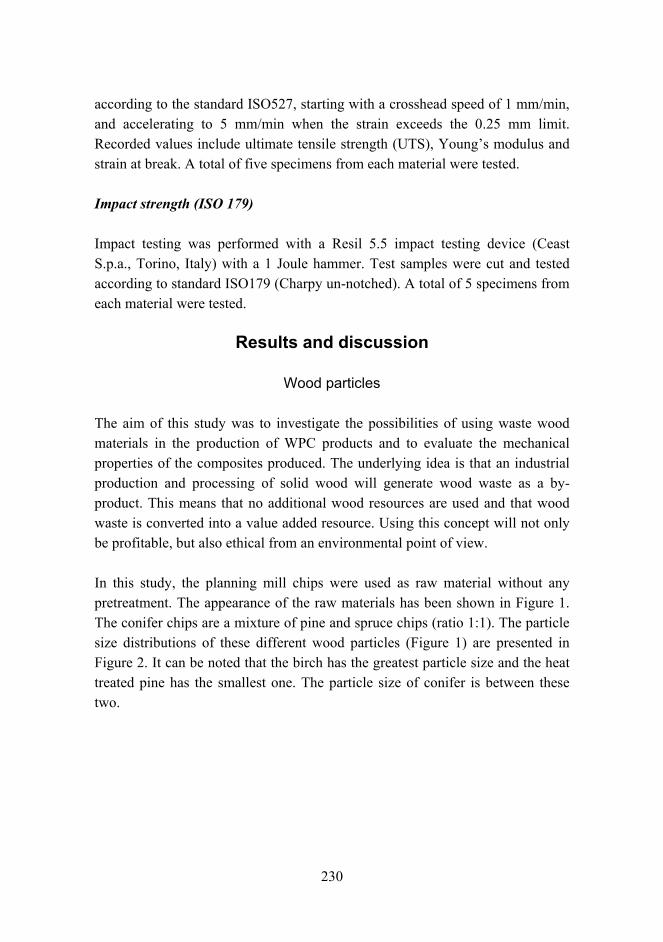
230
according to the standard ISO527, starting with a crosshead speed of 1 mm/min, and accelerating to 5 mm/min when the strain exceeds the 0.25 mm limit. Recorded values include ultimate tensile strength (UTS), Youngs modulus and strain at break. A total of five specimens from each material were tested.
Impact strength (ISO 179)
Impact testing was performed with a Resil 5.5 impact testing device (Ceast S.p.a., Torino, Italy) with a 1 Joule hammer. Test samples were cut and tested according to standard ISO179 (Charpy un-notched). A total of 5 specimens from each material were tested.
Results and discussion
Wood particles
The aim of this study was to investigate the possibilities of using waste wood materials in the production of WPC products and to evaluate the mechanical properties of the composites produced. The underlying idea is that an industrial production and processing of solid wood will generate wood waste as a by-product. This means that no additional wood resources are used and that wood waste is converted into a value added resource. Using this concept will not only be profitable, but also ethical from an environmental point of view.
In this study, the planning mill chips were used as raw material without any pretreatment. The appearance of the raw materials has been shown in Figure 1. The conifer chips are a mixture of pine and spruce chips (ratio 1:1). The particle size distributions of these different wood particles (Figure 1) are presented in Figure 2. It can be noted that the birch has the greatest particle size and the heat treated pine has the smallest one. The particle size of conifer is between these two.
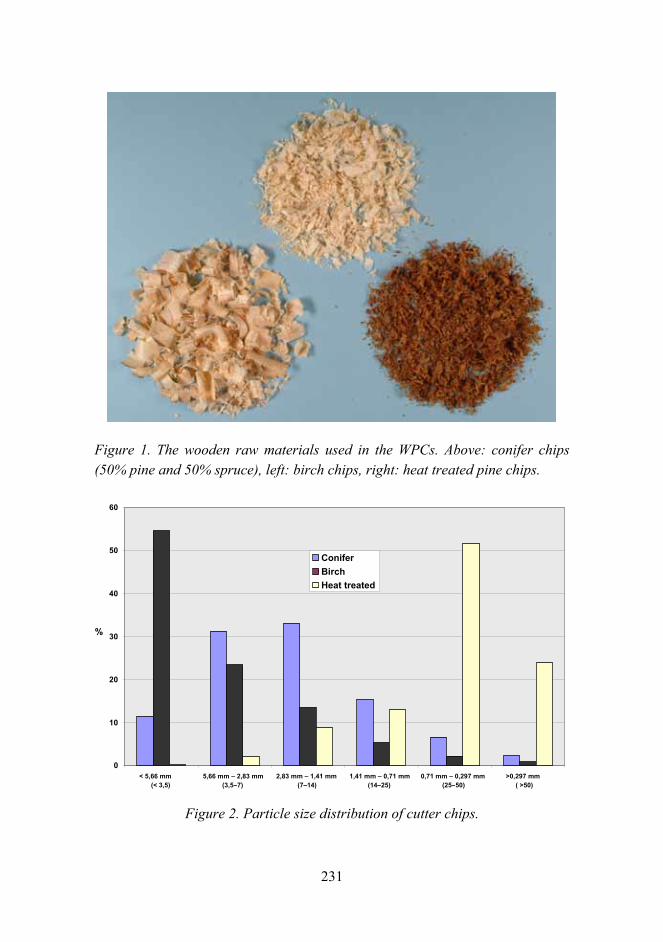
231
Figure 1. The wooden raw materials used in the WPCs. Above: conifer chips (50% pine and 50% spruce), left: birch chips, right: heat treated pine chips.
Figure 2. Particle size distribution of cutter chips.
0
10
20
30
40
50
60
< 5,66 mm (< 3,5)
5,66 mm 2,83 mm(3,57) 2,83 mm 1,41 mm
(714)1,41 mm 0,71 mm
(1425)0,71 mm 0,297 mm
(2550) >0,297 mm
( >50)
%
ConiferBirchHeat treated
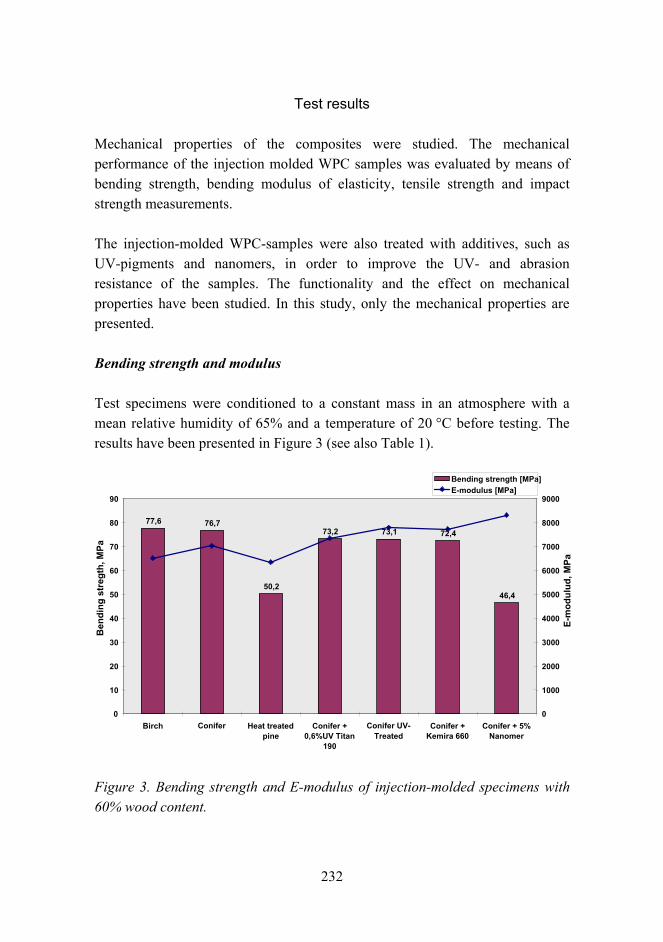
232
Test results
Mechanical properties of the composites were studied. The mechanical performance of the injection molded WPC samples was evaluated by means of bending strength, bending modulus of elasticity, tensile strength and impact strength measurements.
The injection-molded WPC-samples were also treated with additives, such as UV-pigments and nanomers, in order to improve the UV- and abrasion resistance of the samples. The functionality and the effect on mechanical properties have been studied. In this study, only the mechanical properties are presented.
Bending strength and modulus
Test specimens were conditioned to a constant mass in an atmosphere with a mean relative humidity of 65% and a temperature of 20 °C before testing. The results have been presented in Figure 3 (see also Table 1).
Figure 3. Bending strength and E-modulus of injection-molded specimens with 60% wood content.
77,6 76,7
50,2
73,2 73,1 72,4
46,4
0
10
20
30
40
50
60
70
80
90
Birch Conifer Heat treatedpine
Conifer +0,6%UV Titan
190
Conifer UV-Treated
Conifer +Kemira 660
Conifer + 5% Nanomer
Ben
ding
str
egth
, MPa
0
1000
2000
3000
4000
5000
6000
7000
8000
9000
E-m
odul
ud, M
Pa
Bending strength [MPa] E-modulus [MPa]
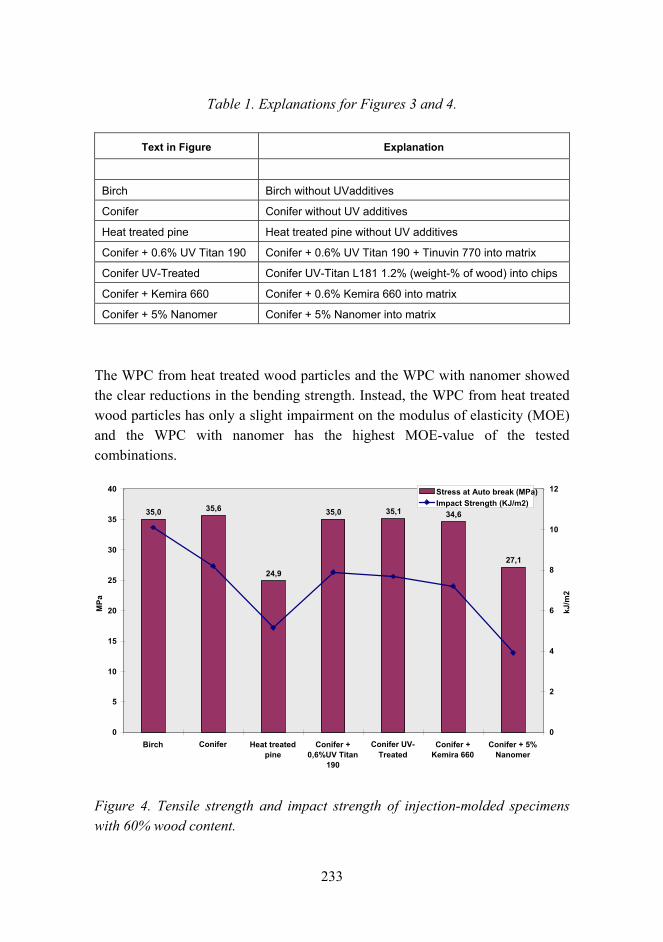
233
Table 1. Explanations for Figures 3 and 4.
Text in Figure Explanation
Birch Birch without UVadditives
Conifer Conifer without UV additives
Heat treated pine Heat treated pine without UV additives
Conifer + 0.6% UV Titan 190 Conifer + 0.6% UV Titan 190 + Tinuvin 770 into matrix
Conifer UV-Treated Conifer UV-Titan L181 1.2% (weight-% of wood) into chips
Conifer + Kemira 660 Conifer + 0.6% Kemira 660 into matrix
Conifer + 5% Nanomer Conifer + 5% Nanomer into matrix
The WPC from heat treated wood particles and the WPC with nanomer showed the clear reductions in the bending strength. Instead, the WPC from heat treated wood particles has only a slight impairment on the modulus of elasticity (MOE) and the WPC with nanomer has the highest MOE-value of the tested combinations.
Figure 4. Tensile strength and impact strength of injection-molded specimens with 60% wood content.
35,0 35,6
24,9
35,0 35,1 34,6
27,1
0
5
10
15
20
25
30
35
40
Birch Conifer Heat treatedpine
Conifer +0,6%UV Titan
190
Conifer UV-Treated
Conifer +Kemira 660
Conifer + 5% Nanomer
MPa
0
2
4
6
8
10
12
kJ/m
2
Stress at Auto break (MPa) Impact Strength (KJ/m2)
234
Figure 4 (see also Table 1) shows that the WPC from heat treated wood particles and the WPC with nanomer had clear reductions in both the tensile strength and the impact strength. On the contrary, the UV additives have no significant effect on the tensile or impact strength when compared with WPC from untreated conifer.
In general, UV pigments have a slight impairment on the bending and impact strength.
Conclusions
It has been demonstrated that injection-molded wood plastic composites could be successfully produced using industrial cutter chip waste without any pre-treatment or fractioning before compounding except drying. The strength properties are at a high level when using untreated conifer or birch material. Heat treated pine material gives clearly lower strength figures than untreated conifer (about 2530% less). The effect of UV pigments on strength properties is very small, but they have a slight impairment on the bending and impact strength. On the contrary, nanomer does not work with WPC materials. The strength properties fall 35 to 40% compared to properties of untreated ones.
Reference list
1. Lange, S. E. & Rowell, R. M. Weathering performance of aspen-polypropylene composites. The Fifth International Conference on Woodfiber-Plastic Composites Proceedings, Madison, 2627 May, 1999. The Forest Products Society, Proceedings No. 7263. P. 317. ISBN 0-892529-07-6.
2. Johnson, D. A., Johnson, D. A., Urich, J. L., Rowell, R. M., Jacobson, R. & Caufield, D. F. Weathering characteristics of fiber-polymer composites. The Fifth International Conference on Woodfiber-Plastic Composites Proceedings, Madison, 2627 May, 1999. The Forest Products Society, Proceedings No. 7263. Pp. 203209. ISBN 0-892529-07-6.
235
Novel method for preparation of spherical starch ester pigment with excellent optical properties
in paper coatings
Hannu Mikkonen1, Lauri Kuutti1, Kirsi Kataja2, Pia Qvintus-Leino2 & Soili Peltonen1
VTT Technical Research Centre of Finland 1 Tykkimäentie 15, P.O. Box 21, FI-05201 Rajamäki
2 Biologinkuja 7, P.O. Box 1000, FI-02044 VTT
Abstract
The preparation of highly porous starch acetate particles suitable for filler for paper was studied using solution precipitation techniques. Chemically cleaved starch acetate with a DS value of 2 to 3 and glass transition temperature of +158160 °C was used as starting material for the preparation of ideally spherical particles in diameter as one half of the wave length of the visible light. Particle shape and size take form spontaneously when solvated (e.g., acetone-ethanol mixture) starch polymer is mixed with non-solvent (e.g., water). The refractive index of the starch pigment is 1.47 and an ISO brightness value as high as 94 has been measured. The preparation of starch pigment dispersion of 2030% solid contents has been carried out on a semi-industrial scale by using 0.25 m3 DRAISS reactor in combination with 0.2 micron cut-off continuous filtering unit. Starch pigment has improved affinity to paper surface and it can be used as such or mixed with other pigments to enhance optical or printing properties of paper.
Introduction
In the print paper industry two of the main bases for producing high quality printing on paper are brightness and opacity, which are achieved by good fillers and coating pigments. Brightness and opacity are based on effective light scattering of the wood fiber network deposit by fillers and pigments. The mineral pigments and fillers have been used mainly for papermaking to produce high quality printing and the plastic pigments (typically consisting of 100%
236
modified polystyrene) have been used only for certain special printing applications. The reasons for the widespread use of mineral pigments are cost-effectiveness, availability, high brightness and opacity.
However, mineral pigments have a notable environmental aspect in de-inking waste.
In Europe 81.7 million tons of paper was consumed and 46.1 million tons were recycled, 23.8 million tons of paper ended up directly to final disposal (landfill, combustion) after primary use. If fillers and pigments were organic and they could be combusted, 8 million tons of fuel oil could be replaced by them in energy production [1]. Unlike mineral pigment de-inking waste, organic starch-based pigment waste can be incinerated. Other possible advantages that might be derived from the use of renewable starch based pigments are lighter weights, better paper strength properties, less abrasive character for paper machine components (wires, cutters, etc.) and environmental friendliness.
Our ambitious target was to develop from scratch starch-based non-mineral paper pigments to replace mineral pigments. The opacity goal has been approached from three different directions. The first approach has been to process rigid, water in-soluble pigment particles with a particle size ideal for obtaining maximum light scattering properties.
The second approach to obtain maximum light scattering was to develop relatively rigid and porous pigment particles. The assumption was that appropriate pore structure in rigid pigment may increase its light scattering properties [2]. The third approach abandons completely solid and rigid pigment particles and uses foam (micro-capsules) to build light scattering interfaces. A rigid foam structure containing suitable sized micro capsule structure coated on paper may also produce good light scattering properties [3].
In the literature there are actually very few references to non-mineral coating pigments or fillers. Mälkki et al. [4] has produced a method for preparing an organic filler pigment from starch. Starch granules are swollen to increase their volume and plasticity. Their stability towards changes in volume and shape is improved by cross-linking and by derivatization or by making the surface hydrophobic. Bengts et al. [5] has produced a method for production of spherical
237
microparticles consisting totally or partly of at least one water-insoluble polysaccharide. The polysaccharide is dissolved in a solvent or solvent mixture and the solution thus formed is introduced into a precipitating agent or precipitating agent mixture. The mixture obtained is optionally cooled and the micro particles are separated.
Giezen et al. [6] has a process for producing biopolymers nanoparticles in which the biopolymer is plasticized using shear forces, a cross-linking agent being added during the process. After said processing, the biopolymer can be dissolved or dispersed in an aqueous medium to a concentration between 4 to 40 wt. %. This results in starch nanoparticles which are characterized by an average particle size of less than 400 nm.
Biopolymer nanoparticles (the biopolymer latex adhesive) can be obtained by extruding a plasticized biopolymer, especially starch, in the presence of a cross-linking agent (e.g., glyoxal). The preparation of the latex adhesive and its application in corrugating operation do not require a gelatinization step, nor the use of caustic soda or borax [7].
We report in this paper the development of spherical particles in diameter as one half of the wave length of the visible light. Particle shape and size take form spontaneously when a solvated (e.g., acetone-ethanol mixture) starch polymer is mixed with a non-solvent (e.g., water). The optimization of the processes, the scale-up from laboratory scale to pilot scale and how to control the particle size distribution will be discussed in this paper. Some preliminary results on the pilot trials will also be reported here.
Methods and materials
The potato starch used in acetylating was provided by Periva Oy (Kokemäki, Finland). The used starch acetate was manufactured according to our patents (FI 107386, FI 20020313) [8], [9]. A chemically cleaved starch acetate (Mw: 50 000250 000 with a DS value of 2 to 3, a glass transition temperature of +158160 °C and an ISO brightness value of 88) was used as starting material for preparation of highly porous precipitated starch acetate. Molecular weight was determined with size exclusion chromatography. Three µHydrogel colons and one corresponding pre-colon was supplied by Waters Co.
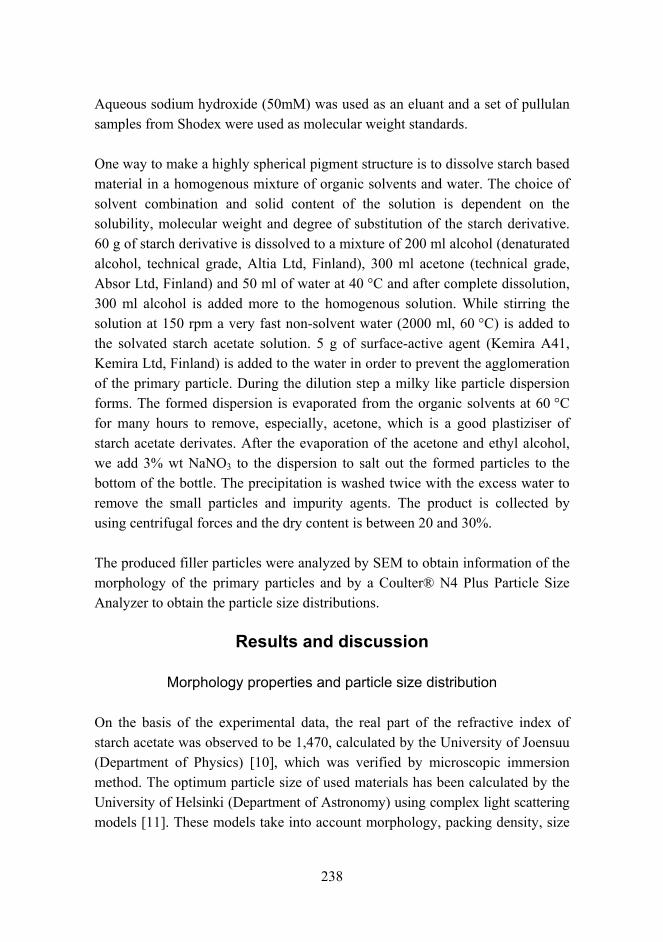
238
Aqueous sodium hydroxide (50mM) was used as an eluant and a set of pullulan samples from Shodex were used as molecular weight standards.
One way to make a highly spherical pigment structure is to dissolve starch based material in a homogenous mixture of organic solvents and water. The choice of solvent combination and solid content of the solution is dependent on the solubility, molecular weight and degree of substitution of the starch derivative. 60 g of starch derivative is dissolved to a mixture of 200 ml alcohol (denaturated alcohol, technical grade, Altia Ltd, Finland), 300 ml acetone (technical grade, Absor Ltd, Finland) and 50 ml of water at 40 °C and after complete dissolution, 300 ml alcohol is added more to the homogenous solution. While stirring the solution at 150 rpm a very fast non-solvent water (2000 ml, 60 °C) is added to the solvated starch acetate solution. 5 g of surface-active agent (Kemira A41, Kemira Ltd, Finland) is added to the water in order to prevent the agglomeration of the primary particle. During the dilution step a milky like particle dispersion forms. The formed dispersion is evaporated from the organic solvents at 60 °C for many hours to remove, especially, acetone, which is a good plastiziser of starch acetate derivates. After the evaporation of the acetone and ethyl alcohol, we add 3% wt NaNO3 to the dispersion to salt out the formed particles to the bottom of the bottle. The precipitation is washed twice with the excess water to remove the small particles and impurity agents. The product is collected by using centrifugal forces and the dry content is between 20 and 30%.
The produced filler particles were analyzed by SEM to obtain information of the morphology of the primary particles and by a Coulter® N4 Plus Particle Size Analyzer to obtain the particle size distributions.
Results and discussion
Morphology properties and particle size distribution
On the basis of the experimental data, the real part of the refractive index of starch acetate was observed to be 1,470, calculated by the University of Joensuu (Department of Physics) [10], which was verified by microscopic immersion method. The optimum particle size of used materials has been calculated by the University of Helsinki (Department of Astronomy) using complex light scattering models [11]. These models take into account morphology, packing density, size
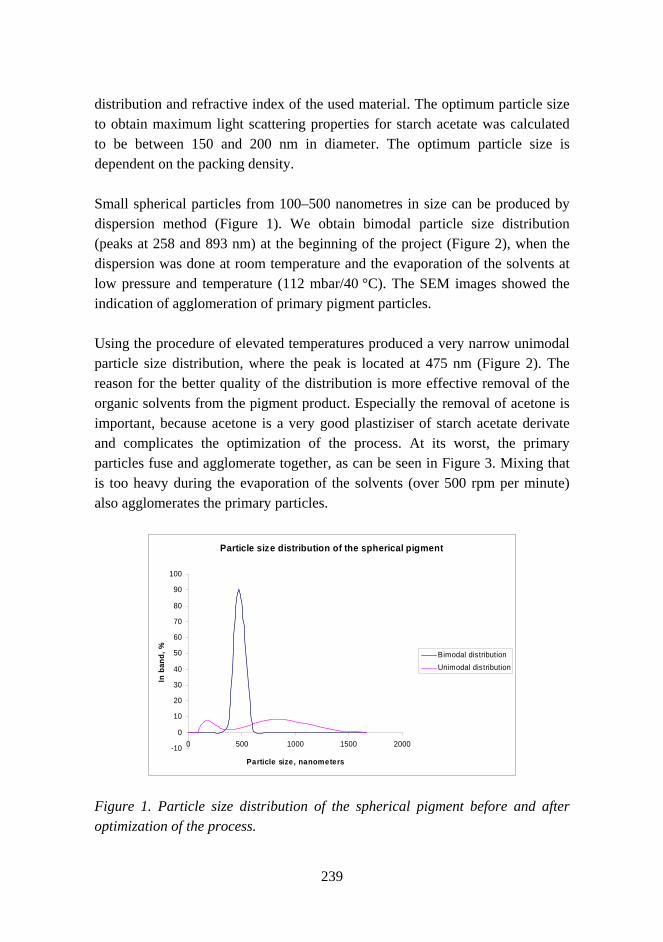
239
distribution and refractive index of the used material. The optimum particle size to obtain maximum light scattering properties for starch acetate was calculated to be between 150 and 200 nm in diameter. The optimum particle size is dependent on the packing density.
Small spherical particles from 100–500 nanometres in size can be produced by dispersion method (Figure 1). We obtain bimodal particle size distribution (peaks at 258 and 893 nm) at the beginning of the project (Figure 2), when the dispersion was done at room temperature and the evaporation of the solvents at low pressure and temperature (112 mbar/40 °C). The SEM images showed the indication of agglomeration of primary pigment particles.
Using the procedure of elevated temperatures produced a very narrow unimodal particle size distribution, where the peak is located at 475 nm (Figure 2). The reason for the better quality of the distribution is more effective removal of the organic solvents from the pigment product. Especially the removal of acetone is important, because acetone is a very good plastiziser of starch acetate derivate and complicates the optimization of the process. At its worst, the primary particles fuse and agglomerate together, as can be seen in Figure 3. Mixing that is too heavy during the evaporation of the solvents (over 500 rpm per minute) also agglomerates the primary particles.
Particle size distribution of the spherical pigment
-10
0
10
20
30
40
50
60
70
80
90
100
0 500 1000 1500 2000
Particle size, nanometers
In b
and,
%
Bimodal distribution
Unimodal distribution
Figure 1. Particle size distribution of the spherical pigment before and after optimization of the process.
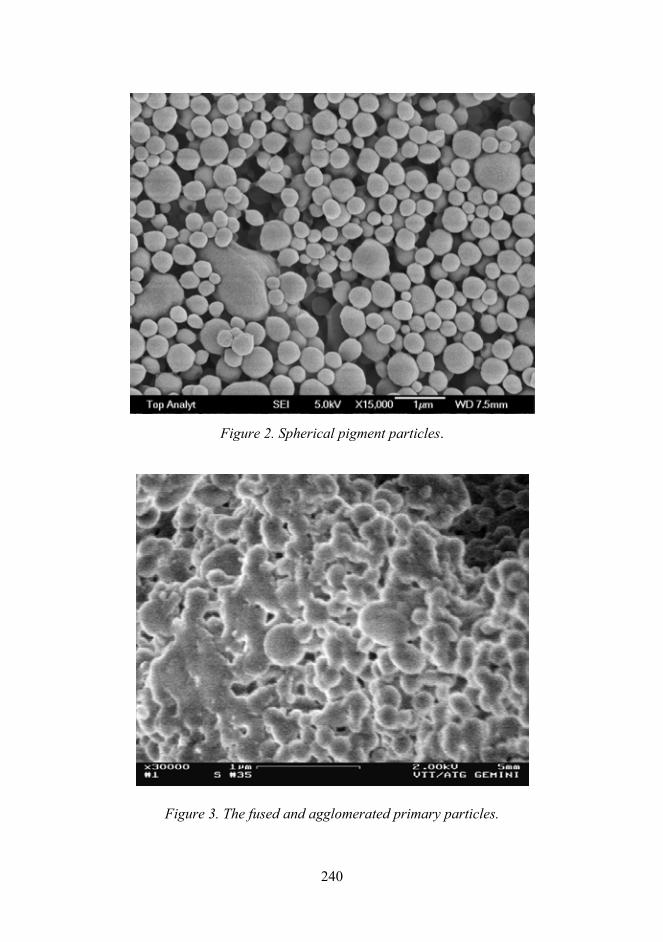
240
Figure 2. Spherical pigment particles.
Figure 3. The fused and agglomerated primary particles.
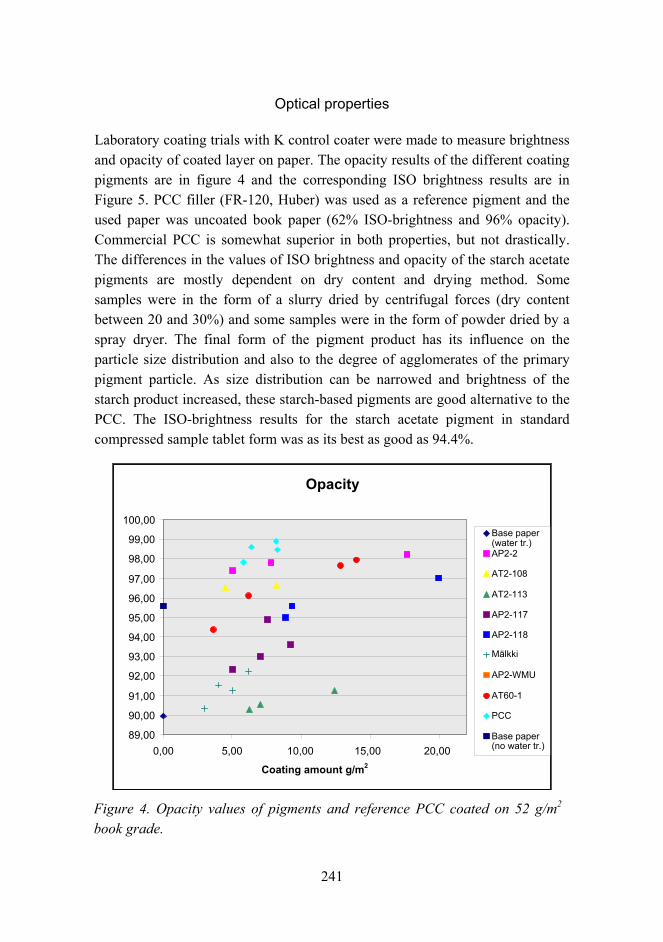
241
Optical properties
Laboratory coating trials with K control coater were made to measure brightness and opacity of coated layer on paper. The opacity results of the different coating pigments are in figure 4 and the corresponding ISO brightness results are in Figure 5. PCC filler (FR-120, Huber) was used as a reference pigment and the used paper was uncoated book paper (62% ISO-brightness and 96% opacity). Commercial PCC is somewhat superior in both properties, but not drastically. The differences in the values of ISO brightness and opacity of the starch acetate pigments are mostly dependent on dry content and drying method. Some samples were in the form of a slurry dried by centrifugal forces (dry content between 20 and 30%) and some samples were in the form of powder dried by a spray dryer. The final form of the pigment product has its influence on the particle size distribution and also to the degree of agglomerates of the primary pigment particle. As size distribution can be narrowed and brightness of the starch product increased, these starch-based pigments are good alternative to the PCC. The ISO-brightness results for the starch acetate pigment in standard compressed sample tablet form was as its best as good as 94.4%.
Opacity
89,00 90,00 91,00 92,00 93,00 94,00 95,00 96,00 97,00 98,00 99,00
100,00
0,00 5,00 10,00 15,00 20,00
Coating amount g/m2
Base paper (water tr.) AP2-2 AT2-108 AT2-113 AP2-117 AP2-118 Mälkki AP2-WMU AT60-1 PCC Base paper (no water tr.)
Figure 4. Opacity values of pigments and reference PCC coated on 52 g/m2 book grade.
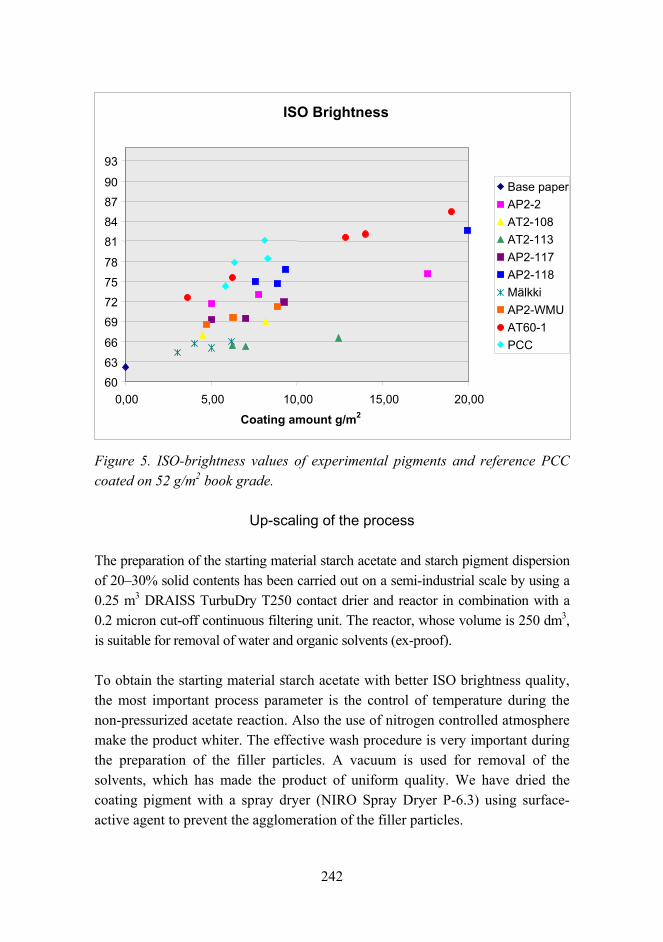
242
Figure 5. ISO-brightness values of experimental pigments and reference PCC coated on 52 g/m2 book grade.
Up-scaling of the process
The preparation of the starting material starch acetate and starch pigment dispersion of 2030% solid contents has been carried out on a semi-industrial scale by using a 0.25 m3 DRAISS TurbuDry T250 contact drier and reactor in combination with a 0.2 micron cut-off continuous filtering unit. The reactor, whose volume is 250 dm3, is suitable for removal of water and organic solvents (ex-proof).
To obtain the starting material starch acetate with better ISO brightness quality, the most important process parameter is the control of temperature during the non-pressurized acetate reaction. Also the use of nitrogen controlled atmosphere make the product whiter. The effective wash procedure is very important during the preparation of the filler particles. A vacuum is used for removal of the solvents, which has made the product of uniform quality. We have dried the coating pigment with a spray dryer (NIRO Spray Dryer P-6.3) using surface-active agent to prevent the agglomeration of the filler particles.
ISO Brightness
60 63 66 69 72 75 78 81 84 87 90 93
0,00 5,00 10,00 15,00 20,00
Coating amount g/m2
Base paper AP2-2 AT2-108 AT2-113 AP2-117 AP2-118 Mälkki AP2-WMUAT60-1 PCC
243
Conclusion and future work
All the previous morphologies introduced have theoretical potential to replace mineral filler or coating pigments in obtaining as good or even higher opacity and brightness to paper. Importantly it was shown that it is quite possible to produce water insoluble primary particles with optimum size to obtain light scattering that competes with commercial PCC products. Further work continues to narrow the deviation in particle size. Also more concern is being focused on increasing the brightness of the starting material and the final products.
As the project progresses, the approaches will be limited to develop one or two techniques and pigment morphologies to paper filler and coating applications. Also more emphasis has to be put on coating trials and to the retention issues in sheet and web forming. (These tests have already started.) Pilot scale coating and printing trials have been done at Western Michigan University. Preliminary results from pilot-scale paper making trials indicate that the usage of starch-based coating pigment in fact increase the strength of paper. The results of the pilot-scale trials have been reported elsewhere [12].
Acknowledgement
This work has been carried out as part of the projects of the Nonfillpap consortium (1.8.200331.7.2005), which is coordinated by VTT Technical Research Centre of Finland and financially supported by Tekes the Finnish Funding Agency for Technology and Innovation, Metso Corporation, M-Real Corporation, Ciba Specialty Chemicals Corporation and Stora Enso Corporation. The authors wish to thank the project researchers of the University of Helsinki (University of Helsinki Observatory), the University of Joensuu (Department of Physics), the Geological Survey of Finland (GTK), the technician personnel of the laboratory and of the pilot plant at Rajamäki and the representatives of the above mentioned companies for fruitful cooperation and especially Tekes for financial support. In the management group the representatives from financing partners have contributed significantly to the project.
244
Reference list
1. European Fiber Flown Chart 2003, http://www.cepi.org, Confederation of European Paper Industries, 2003.
2. Mikkonen, H., Kuutti, L., Kataja, K., Qvintus-Leino, P. & Peltonen, S. Novel method for preparation of sub-micron scale highly porous starch acetate suitable for filler of paper with improved strength and optical properties. (In preparation.)
3. Miettinen, M., Mikkonen, H. & Luukkanen, S. (In preparation.)
4. Mälkki, H. & Lehtilä, R. US Patent 6, 582, 509, B2, 2003.
5. Bengts, H. & Grande, J. US Patent 6, 562, 459 B1, 2003.
6. Giezen, F., Jongboom, R. Feil, H., Gotlieb, K. & Boersma, A. PCT WO 00/69916, 2000.
7. Bloembergen, S., Kappen, F. & Van Leeuwen, M. EP 1254939, 2002.
8. Peltonen et al. FI 107386, 1996.
9. Peltonen et al. FI 20020313, 2002.
10. Karvinen, P., Oksman, A., Mikkonen, H. & Silvennoinen, R. Complex refractive index of starch acetate used as a biodegradable pigment and filler of paper. (In preparation.)
11. Penttilä, A., Lumme, K. & Kuutti L. Light scattering efficiency of starch acetate pigments as a function of size and packing density. (Accepted to Applied Optics.)
12. Saari, J. et al. (In preparation.)
245
Railway tunneling in frozen ground on Bothniabana
Seppo Saarelainen, Leena Korkiala-Tanttu & Harri Kivikoski
VTT Technical Research Centre of Finland Lämpömiehenkuja 2, P.O. Box 1000, FI-02044 VTT
Abstract
A new railway line was under construction in north-eastern Sweden, along the shoreline of the Gulf of Bothnia. The terrain consisted of Postglacial clay and silt valleys, and ridges of Precambrian bedrock crossed the railway line. The railway level was about 20 m below the surface of the ground. For the design of freezing, a freezing analysis was carried out to determine the pipeline depths and distances, to estimate the necessary time for freezing and to determine temperatures within the frozen zone. To estimate the deformations, displacements and safety level, a mechanical analysis of the tunnel cross-section was carried out. Time- and temperature-dependent mechanical parameters were determined for the actual soils and design temperatures. The analysis was carried out for 12 different phases during tunneling. The estimated displacements for the tunnel arch were negligible, if the temperatures were at or below -15 °C. The freezing was started in May 2002, and completed in September 2002. Tunneling was started in September, and it was completed in November 2002, following with the casting of the final liner.
The application of ground freezing in deep excavations and tunnelling in soft soils is not a new idea. It has been widely discussed in ground freezing symposia since the 1970s. There are certain reasons why ground freezing has proved to be recommendable: the applications do not cause any environmental impacts on the site, freezing can be rationally planned, designed and controlled, and it uses the ground itself as a structural element. Ground freezing causes, of course, certain permanent changes to the freezing soils after thaw. Frost action causes ice segregation in the frost-susceptible soils, and results in consolidation settlements after thaw. These can be pre-estimated and evaluated in relation to neighbouring structures, if needed. As a geotechnical procedure, ground freezing has been
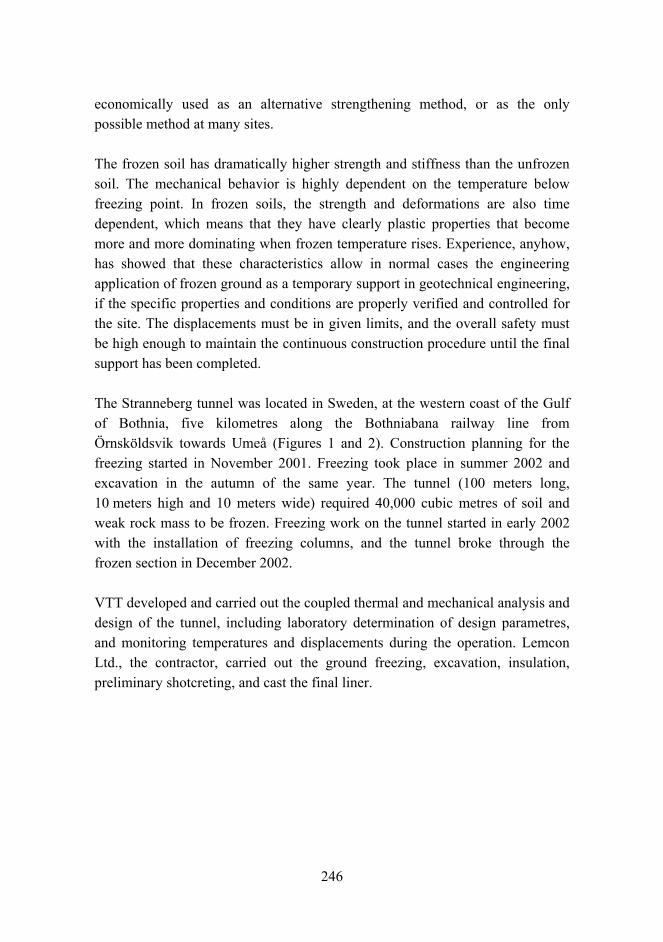
246
economically used as an alternative strengthening method, or as the only possible method at many sites.
The frozen soil has dramatically higher strength and stiffness than the unfrozen soil. The mechanical behavior is highly dependent on the temperature below freezing point. In frozen soils, the strength and deformations are also time dependent, which means that they have clearly plastic properties that become more and more dominating when frozen temperature rises. Experience, anyhow, has showed that these characteristics allow in normal cases the engineering application of frozen ground as a temporary support in geotechnical engineering, if the specific properties and conditions are properly verified and controlled for the site. The displacements must be in given limits, and the overall safety must be high enough to maintain the continuous construction procedure until the final support has been completed.
The Stranneberg tunnel was located in Sweden, at the western coast of the Gulf of Bothnia, five kilometres along the Bothniabana railway line from Örnsköldsvik towards Umeå (Figures 1 and 2). Construction planning for the freezing started in November 2001. Freezing took place in summer 2002 and excavation in the autumn of the same year. The tunnel (100 meters long, 10 meters high and 10 meters wide) required 40,000 cubic metres of soil and weak rock mass to be frozen. Freezing work on the tunnel started in early 2002 with the installation of freezing columns, and the tunnel broke through the frozen section in December 2002.
VTT developed and carried out the coupled thermal and mechanical analysis and design of the tunnel, including laboratory determination of design parametres, and monitoring temperatures and displacements during the operation. Lemcon Ltd., the contractor, carried out the ground freezing, excavation, insulation, preliminary shotcreting, and cast the final liner.
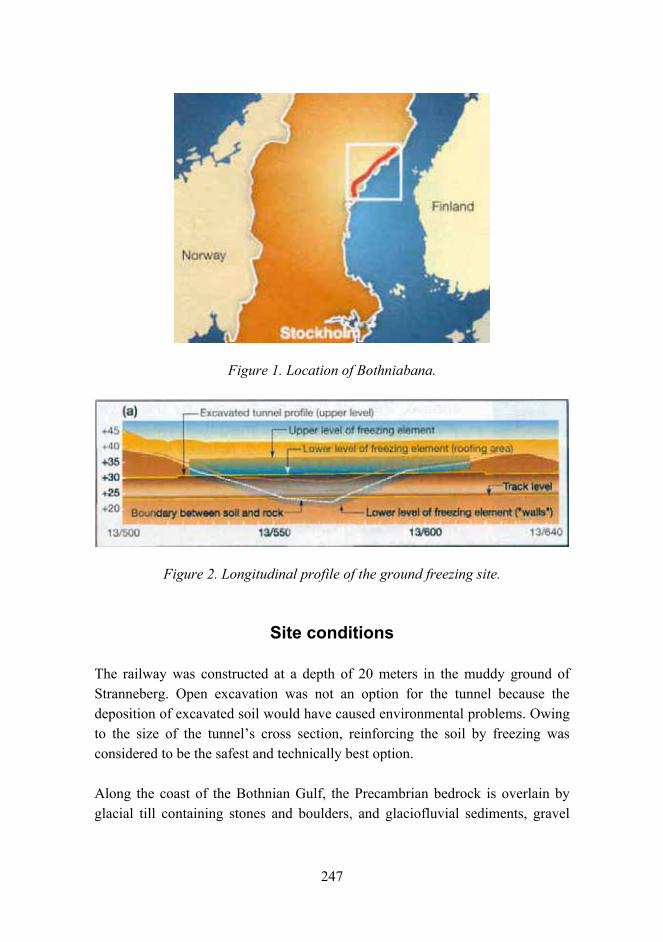
247
Figure 1. Location of Bothniabana.
Figure 2. Longitudinal profile of the ground freezing site.
Site conditions
The railway was constructed at a depth of 20 meters in the muddy ground of Stranneberg. Open excavation was not an option for the tunnel because the deposition of excavated soil would have caused environmental problems. Owing to the size of the tunnels cross section, reinforcing the soil by freezing was considered to be the safest and technically best option.
Along the coast of the Bothnian Gulf, the Precambrian bedrock is overlain by glacial till containing stones and boulders, and glaciofluvial sediments, gravel
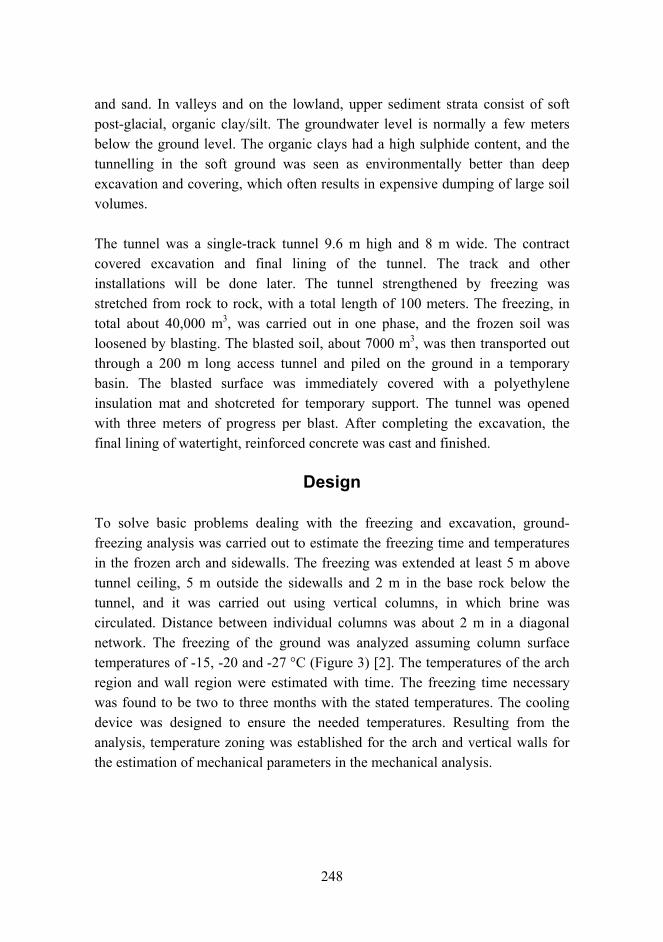
248
and sand. In valleys and on the lowland, upper sediment strata consist of soft post-glacial, organic clay/silt. The groundwater level is normally a few meters below the ground level. The organic clays had a high sulphide content, and the tunnelling in the soft ground was seen as environmentally better than deep excavation and covering, which often results in expensive dumping of large soil volumes.
The tunnel was a single-track tunnel 9.6 m high and 8 m wide. The contract covered excavation and final lining of the tunnel. The track and other installations will be done later. The tunnel strengthened by freezing was stretched from rock to rock, with a total length of 100 meters. The freezing, in total about 40,000 m3, was carried out in one phase, and the frozen soil was loosened by blasting. The blasted soil, about 7000 m3, was then transported out through a 200 m long access tunnel and piled on the ground in a temporary basin. The blasted surface was immediately covered with a polyethylene insulation mat and shotcreted for temporary support. The tunnel was opened with three meters of progress per blast. After completing the excavation, the final lining of watertight, reinforced concrete was cast and finished.
Design
To solve basic problems dealing with the freezing and excavation, ground-freezing analysis was carried out to estimate the freezing time and temperatures in the frozen arch and sidewalls. The freezing was extended at least 5 m above tunnel ceiling, 5 m outside the sidewalls and 2 m in the base rock below the tunnel, and it was carried out using vertical columns, in which brine was circulated. Distance between individual columns was about 2 m in a diagonal network. The freezing of the ground was analyzed assuming column surface temperatures of -15, -20 and -27 °C (Figure 3) [2]. The temperatures of the arch region and wall region were estimated with time. The freezing time necessary was found to be two to three months with the stated temperatures. The cooling device was designed to ensure the needed temperatures. Resulting from the analysis, temperature zoning was established for the arch and vertical walls for the estimation of mechanical parameters in the mechanical analysis.
249
Shot
cret
eIn
side
tem
pera
ture
of t
he tu
nnel
+10
°C
-25
-20
-20
-15
-15
-10
-5
0
5
0 1 2 3 4 5 6 7 8 9 10 110
1
2
3
4
5
6
7
Figure 3. Temperature zones in Temp/W -analysis. Horizontal section on the frozen wall with shotcrete and thermal insulation (R = 1 m2K/W). Phase: 90 days after shotcreting, column temperature -27 °C.
The mechanical behavior was analyzed applying creep strength vs. temperature and time, and creep deformation modulus vs. temperature and time for the frozen soil horizons [3]. The basic parameter models were established from the literature [4, 5], and controlled with the preliminary laboratory testing data from the Technical University of Luleå [1]. The characteristics were controlled. Examples of the design characteristics for stress-strain analysis for the loading time of 90d are illustrated in Figures 4 and 5.
The strength and deformation properties of the weakest soil horizon, consisting of organic clay (Figure 4), were later checked with laboratory testing in the frost laboratory of VTT. Unfrozen, undisturbed samples were taken, and with specimens, frozen in the laboratory. Standard compression tests at temperatures -10 °C and -20 °C as well as creep tests at -10 °C with two constant axial load levels were conducted (Figure 6). The results proved that the pre-estimated characteristics were slightly on the safe side.
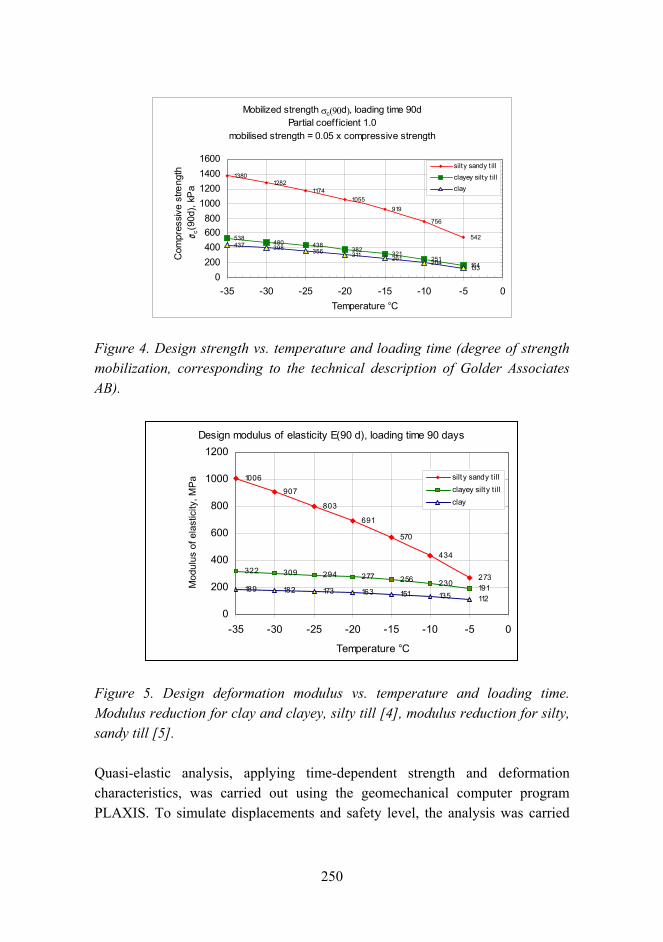
250
Mobilized strength σc(90d), loading time 90d Partial coefficient 1.0
mobilised strength = 0.05 x compressive strength
542
756
9191055
12821380
164251
321382
438480538
133204
261311356398437
1174
0200400600800
1000120014001600
-35 -30 -25 -20 -15 -10 -5 0Temperature °C
Com
pres
sive
stre
ngth
c(
90d)
, kP
a
silty sandy t illclayey silty t illclay
Figure 4. Design strength vs. temperature and loading time (degree of strength mobilization, corresponding to the technical description of Golder Associates AB).
Design modulus of elasticity E(90 d), loading time 90 days
273
434
570
691
803
907
1006
191230256277294309322
112135151163173182189
0
200
400
600
800
1000
1200
-35 -30 -25 -20 -15 -10 -5 0
Temperature °C
Mod
ulus
of e
last
icity
, MP
a silty sandy t illclayey silty t illclay
Figure 5. Design deformation modulus vs. temperature and loading time. Modulus reduction for clay and clayey, silty till [4], modulus reduction for silty, sandy till [5].
Quasi-elastic analysis, applying time-dependent strength and deformation characteristics, was carried out using the geomechanical computer program PLAXIS. To simulate displacements and safety level, the analysis was carried
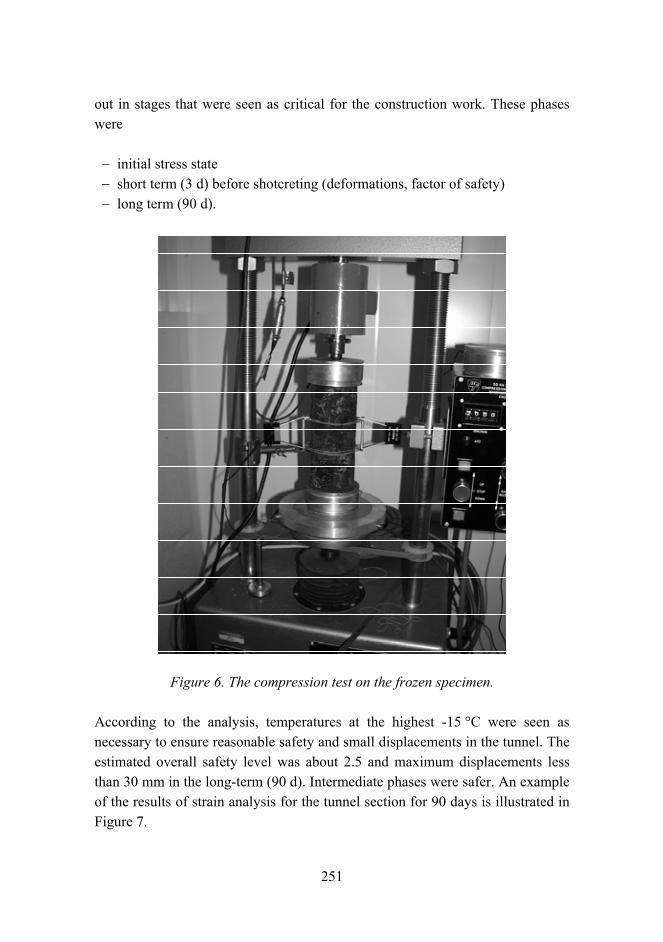
251
out in stages that were seen as critical for the construction work. These phases were
− initial stress state − short term (3 d) before shotcreting (deformations, factor of safety) − long term (90 d).
Figure 6. The compression test on the frozen specimen.
According to the analysis, temperatures at the highest -15 °C were seen as necessary to ensure reasonable safety and small displacements in the tunnel. The estimated overall safety level was about 2.5 and maximum displacements less than 30 mm in the long-term (90 d). Intermediate phases were safer. An example of the results of strain analysis for the tunnel section for 90 days is illustrated in Figure 7.
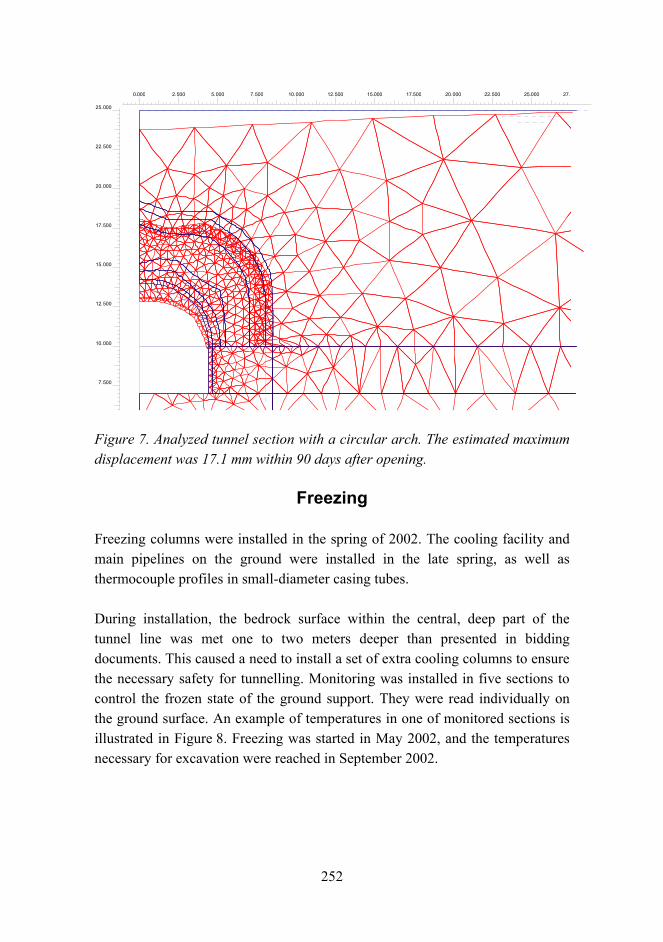
252
0.000 2.500 5.000 7.500 10.000 12.500 15.000 17.500 20.000 22.500 25.000 27.5
7.500
10.000
12.500
15.000
17.500
20.000
22.500
25.000
Figure 7. Analyzed tunnel section with a circular arch. The estimated maximum displacement was 17.1 mm within 90 days after opening.
Freezing
Freezing columns were installed in the spring of 2002. The cooling facility and main pipelines on the ground were installed in the late spring, as well as thermocouple profiles in small-diameter casing tubes.
During installation, the bedrock surface within the central, deep part of the tunnel line was met one to two meters deeper than presented in bidding documents. This caused a need to install a set of extra cooling columns to ensure the necessary safety for tunnelling. Monitoring was installed in five sections to control the frozen state of the ground support. They were read individually on the ground surface. An example of temperatures in one of monitored sections is illustrated in Figure 8. Freezing was started in May 2002, and the temperatures necessary for excavation were reached in September 2002.
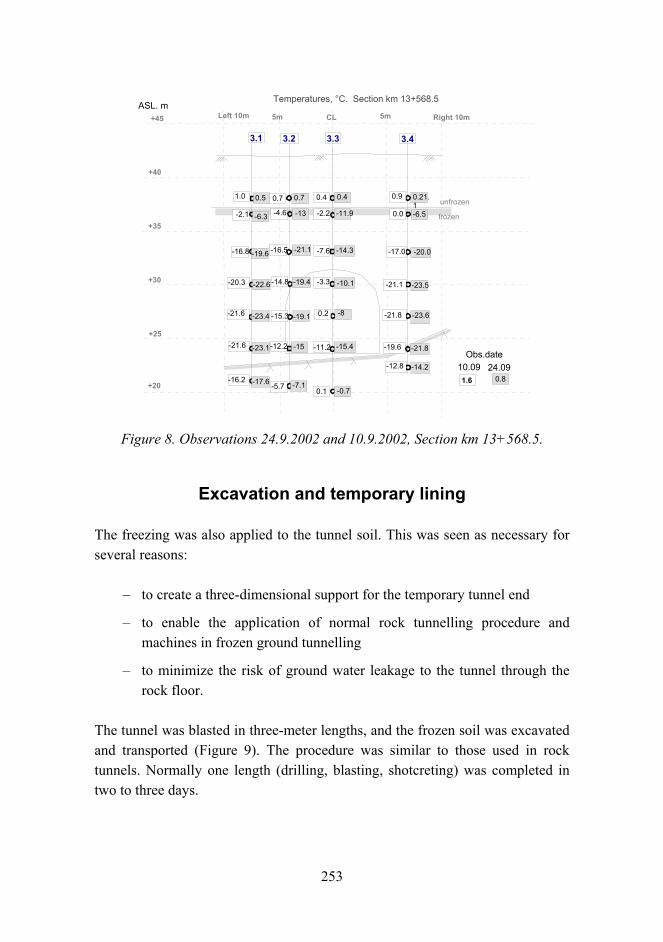
253
3.1 3.2 3.3
Left 10m Right 10m5mCL 5m+45
+25
+30
+35
+40
unfrozen
frozen
Temperatures, °C. Section km 13+568.5
3.4
+20
0.5
-6.3
-19.6
-22.6
-23.4
-23.1
-17.6
0.7 0.21.1
-10.1
-13 -6.5
-21.1
-19.1
-19.4
-15.4
-8
-14.3
-15
-7.1
0.4
-11.9
-0.7
-20.0
-14.2
-21.8
-23.6
-23.5
Obs.date10.09
1.0
-2.1
-16.8
-20.3
-21.6
-21.6
-16.2
0.7
-4.6
-16.5
-14.8
-15.3
-12.2
-5.7
0.4
-2.2
-7.6
-3.3
-11.2
0.2
0.1
0.9
0.0
-17.0
-21.1
-21.8
-19.6
-12.8
1.6 0.824.09
ASL. m
Figure 8. Observations 24.9.2002 and 10.9.2002, Section km 13+568.5.
Excavation and temporary lining
The freezing was also applied to the tunnel soil. This was seen as necessary for several reasons:
to create a three-dimensional support for the temporary tunnel end
to enable the application of normal rock tunnelling procedure and machines in frozen ground tunnelling
to minimize the risk of ground water leakage to the tunnel through the rock floor.
The tunnel was blasted in three-meter lengths, and the frozen soil was excavated and transported (Figure 9). The procedure was similar to those used in rock tunnels. Normally one length (drilling, blasting, shotcreting) was completed in two to three days.
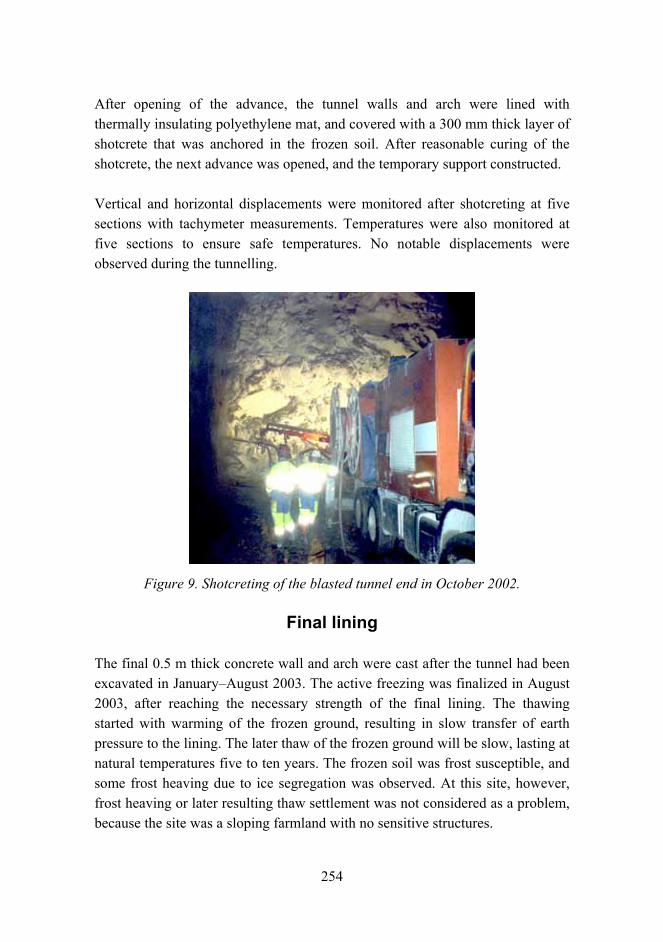
254
After opening of the advance, the tunnel walls and arch were lined with thermally insulating polyethylene mat, and covered with a 300 mm thick layer of shotcrete that was anchored in the frozen soil. After reasonable curing of the shotcrete, the next advance was opened, and the temporary support constructed.
Vertical and horizontal displacements were monitored after shotcreting at five sections with tachymeter measurements. Temperatures were also monitored at five sections to ensure safe temperatures. No notable displacements were observed during the tunnelling.
Figure 9. Shotcreting of the blasted tunnel end in October 2002.
Final lining
The final 0.5 m thick concrete wall and arch were cast after the tunnel had been excavated in JanuaryAugust 2003. The active freezing was finalized in August 2003, after reaching the necessary strength of the final lining. The thawing started with warming of the frozen ground, resulting in slow transfer of earth pressure to the lining. The later thaw of the frozen ground will be slow, lasting at natural temperatures five to ten years. The frozen soil was frost susceptible, and some frost heaving due to ice segregation was observed. At this site, however, frost heaving or later resulting thaw settlement was not considered as a problem, because the site was a sloping farmland with no sensitive structures.

255
Discussion and conclusions
The experience gained in this project could be concluded as follows:
The developed analysis of freezing, applying the laboratory-tested, temperature-dependent characteristics of local soils, proved to be realistic.
The characteristics determined in the laboratory using laboratory-frozen and in situ-frozen specimens were mutually well comparable.
The determined strength and creep characteristics of the frozen organic clay and silt were comparable to those published in the literature.
The mechanical behavior, simulated for different phases in the framework of time-dependent mechanical characteristics, and changing loadings and geometry, was pre-estimated with success.
The tunnelling process was monitored to ensure a safe construction.
The project could be carried out in the planned schedule and costs and applying standard rock tunnelling procedure.
Acknowledgement
The client of this project was Bothniabanan AB, which offered a good platform and support during the construction process. The project was based on the qualified preliminary investigations and design of Golder Associates AB, enabling the detailed design and construction with realistic principles and basic data.
The professional enthusiasm and activity of the management as well as site team of Lemcon Ltd. was a key factor for the successful implementation. For VTT, this was a challenging, multi-disciplinary geotechnical mission, which demanded application of sophisticated, coupled analysis tools and advanced testing facilities for frozen soils.
256
References
1. Knutsson, S. & Stenman, U. [1999]. Laboratory investigations on frozen till specimens. Samples from Bothniabana railway line. Lulea University of Technology, Institution of Civil and Mining Engineering, Report. 8 p. + app.
2. PLAXIS 2D-Version 8 [2002]. PLAXIS b.v., Netherlands.
3. Temp/W for finite element geothermal analysis. Version 4 for Windows 95 and NT. Geo-Slope International Ltd. 19911998.
4. Zhu, Y. & Carbee, D. L. [1987]. Creep and strength behaviour of frozen silt in uniaxial compression. Hanover N.H., US Army Corps of Engineers, Cold Regions Research and Engineering Laboratory, CRREL, Report 87-10. 67 p.
5. Zhu, Y., Zhang, J. & Sheng, Z. [1988]. Uniaxial compressive strength of frozen sand under constant deformation rates. Proc. Int. Symp. on Ground Freezing, Nottingham. Pp. 225232.
257
Modelling surface tension in binary and ternary systems
Risto Pajarre1, Karri Penttilä1, Pertti Koukkari1, Joonho Lee2 & Toshihiro Tanaka3
1VTT Technical Research Centre of Finland Biologinkuja 7, Espoo, P.O. Box 1000, FI-02044 VTT
2Korea University Anam-Dong, Seongbuk-Gu, Seoul 136-701, Korea
3Osaka University 2-1 Yamadaoka, Suita, Osaka 565-0871, Japan
Abstract
A thermodynamic model for calculating surface tension has been implemented using a standard Gibbs energy minimizing software, ChemSheet. The surface is modelled as a monolayer phase, and surface tension values and the composition of the surface layer are is received using the model in a single equilibrium calculation. In the model, surface area is considered a component of the system and the corresponding calculated chemical potential is directly proportional to the surface tension of the mixture. The results are equivalent to with those of the commonly used Butler model and in a good agreement with experimental values. The model can handle mixtures of multiple components and any non-ideal mixture phase data compatible with the ChemSheet (ChemApp/ChemSage) data format, while the thermodynamic excess energy equations for the surface phase can be adjusted in the model based on theoretical and empirical considerations for the surface phase interactions. Model cases include binary and ternary metal alloys.
Introduction
Information about the surface tension of metal alloy systems is essential for understanding and predicting on of things such as wettability, crystal growth or phase properties of nanoscale particles. A commonly used assumption is that the
258
surface can be modelled as a single monolayer. The purpose of this work is to show how the monolayer model can by handled by normal thermodynamic equilibrium programs based on the minimisation of the total Gibbs energy of the system. The model results are compared with experimental data in two example cases.
Experimental
Experimental surface tension values for the Ag-Au-Cu system were determined by the sessile drop method at 1381 K. The shape of a metal alloy drops of about 68 mm in equatorial diameter and 46 mm in height was determined using a CCD camera and image analysis software and the drop shape was used to calculate the surface tension of the alloy. A detailed description of the experimental procedure can be found in reference [1].
Theory
Basic thermodynamic relations
If a system containing a surface is considered as being comprised of two parts (phases), a surface layer (s) and an isotropic bulk (b), the total Gibbs energy of the system can be written as
σµµσµ AnnAnG ii
sii
i
bii
ii ++=+= ∑∑∑ (1)
where ni is the molar amount and µi the chemical potential of species i, σ the surface tension in the system and A the surface area. If the surface phase is considered to be of a monolayer thickness, Equation (1) can be rewritten in thea form
( )σµµ iii
sii
i
bi AnnG ++= ∑∑ (2)
where Ai is the molar surface area of the species i. The chemical potential of species i in the bulk phase can be written as

259
biii aRT ln0 += µµ (3)
and in the surface phase as
σµµ isi
sii AaRT −+= ln,0 (4)
By applying Equations (3) and (4) to the case of a pure one component system, a relationship between the standard states of the bulk and surface phase can be derived
iiis
i Aσµµ += 0,0 (5)
By combining Equations (1), (3) and (4), the total Gibbs energy of the system can be given in a simple form that does not explicitly include the surface tension term:
( ) ( )si
si
i
si
bii
i
bi aRTnaRTnG lnln ,00 +++= ∑∑ µµ (6)
while from Equations (3), (4) and (5) one arrives at the
bi
si
ii
biii
siiii a
aARTaRTAaRTA lnlnln 00 +=⇒+=−++ σσµσσµ (7)
equation first derived by Butler [2], and used extensively in calculating surface tension in various mixtures, including metal alloy systems [3].
Use of Gibbs energy minimiser for surface equilibria calculations
When a Gibbs energy minimiser is used to solve chemical equilibrium states, the total Gibbs energy is usually calculated as:
∑∑=α
αµi
iinG (over all phases (α) and species (i) present in the system) (8)
260
where the chemical potentials of the species are calculated from supplied thermodynamic data using an equation of the type or equivalent to
( ) αααα γµµ iiii xRTpT ln,,0 += (9)
Comparing Equations (2), (4) and (9) one can see that the chemical potential for a species in the surface phase as calculated by a Gibbs energy minimiser would really be the total molar Gibbs energy of the surface species, marked here with
*iµ
σµµ iii A+≡* (10)
For a traditional chemical equilibrium calculation the mass balance relations restricting the possible states can be given in the form
0=−∑∑ ki
iik bnvα
α (for all components k) (11)
where bk is the total molar amount of component k and ikν the stoichiometric coefficient between species i and component k. The condition of constant total surface area can be stated in a similar form as
0=−∑i
sii AnA (12)
or alternatively as
0=−∑∑α
αα
iii AnA (13)
where the molar surface for any species in any non-surface phase α is zero. A is the total surface area of the system. As the constant surface area condition (Equation 13) is of the same form as the traditional mass balances (Equation 11), it can for the mathematical handling of the system be combined with them by considering the surface area as a new component in the system.
261
In a chemical equilibrium state, in addition to species and phases, chemical potentials can also be defined for the different components in the system [4]. The chemical potential of individual species are related to the chemical potentials of the components by Equation (14)
∑=k
kiki v πµ (14)
where kπ is the chemical potential of the component k, and ikν the stoichiometric coefficient between species i and component k. Applied to the surface system, Equation (14) can be stated for a bulk species as
∑∑=
+
=
==M
kkik
M
kkiki vv
1
1
1ππµ (15)
and for the surface species as
areai
M
kiik
M
kkiki A
Avv πππµ01
1
1
* +== ∑∑=
+
=
(15)
where areaπ is the chemical potential of the new component defined to fix the total surface area of the system. Finally, from Equations (15) and (10) we have the equalities
( ) σµµπ =−= iiiarea AA *0 (16)
The chemical potential (divided by the normalization constant 0A ) of the new area component is equal to the surface tension of the system.
As examples we consider a binary and a ternary alloy system in the liquid state. The method described above is applied to calculate the surface tension and composition of Bi-Sn and Ag-Au-Cu melts in temperatures where experimental surface tension data is available for these mixtures.
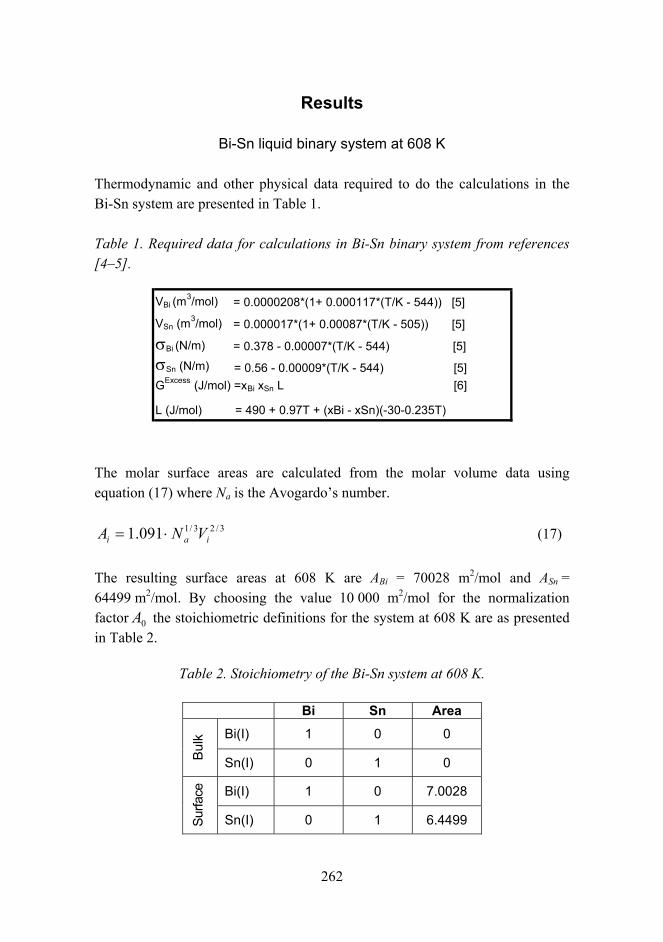
262
Results
Bi-Sn liquid binary system at 608 K
Thermodynamic and other physical data required to do the calculations in the Bi-Sn system are presented in Table 1.
Table 1. Required data for calculations in Bi-Sn binary system from references [45].
The molar surface areas are calculated from the molar volume data using equation (17) where Na is the Avogardos number.
3/23/1091.1 iai VNA ⋅= (17)
The resulting surface areas at 608 K are ABi = 70028 m2/mol and ASn = 64499 m2/mol. By choosing the value 10 000 m2/mol for the normalization factor 0A the stoichiometric definitions for the system at 608 K are as presented in Table 2.
Table 2. Stoichiometry of the Bi-Sn system at 608 K.
Bi Sn Area
Bi(I) 1 0 0
Bul
k
Sn(I) 0 1 0
Bi(I) 1 0 7.0028
Surfa
ce
Sn(I) 0 1 6.4499
V Bi (m 3 /mol) = 0.0000208*(1+ 0.000117*(T/K - 544)) [5]
V Sn (m 3 /mol) = 0.000017*(1+ 0.00087*(T/K - 505)) [5]
σBi (N/m) = 0.378 - 0.00007*(T/K - 544) [5]σSn (N/m) = 0.56 - 0.00009*(T/K - 544) [5]G Excess (J/mol) =x Bi xSn L [6]
L (J/mol) = 490 + 0.97T + (xBi - xSn)(-30-0.235T)
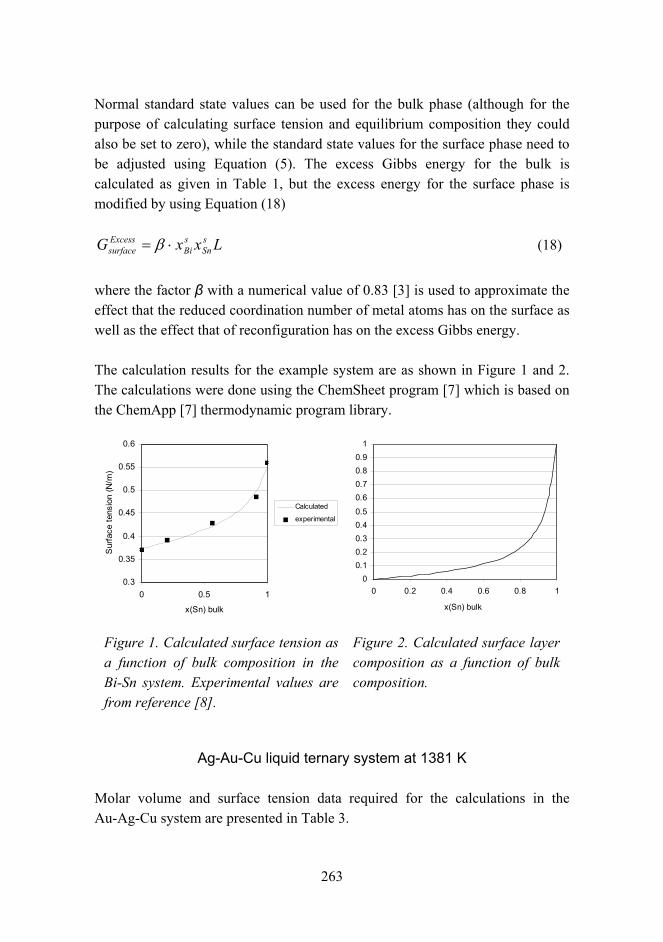
263
Normal standard state values can be used for the bulk phase (although for the purpose of calculating surface tension and equilibrium composition they could also be set to zero), while the standard state values for the surface phase need to be adjusted using Equation (5). The excess Gibbs energy for the bulk is calculated as given in Table 1, but the excess energy for the surface phase is modified by using Equation (18)
LxxG sSn
sBi
Excesssurface ⋅= β (18)
where the factor β with a numerical value of 0.83 [3] is used to approximate the effect that the reduced coordination number of metal atoms has on the surface as well as the effect that of reconfiguration has on the excess Gibbs energy.
The calculation results for the example system are as shown in Figure 1 and 2. The calculations were done using the ChemSheet program [7] which is based on the ChemApp [7] thermodynamic program library.
0.3
0.35
0.4
0.45
0.5
0.55
0.6
0 0.5 1
x(Sn) bulk
Sur
face
tens
ion
(N/m
)
Calculated
experimental
00.10.20.30.40.5
0.60.70.80.9
1
0 0.2 0.4 0.6 0.8 1
x(Sn) bulk
Figure 1. Calculated surface tension as a function of bulk composition in the Bi-Sn system. Experimental values are from reference [8].
Figure 2. Calculated surface layer composition as a function of bulk composition.
Ag-Au-Cu liquid ternary system at 1381 K
Molar volume and surface tension data required for the calculations in the Au-Ag-Cu system are presented in Table 3.
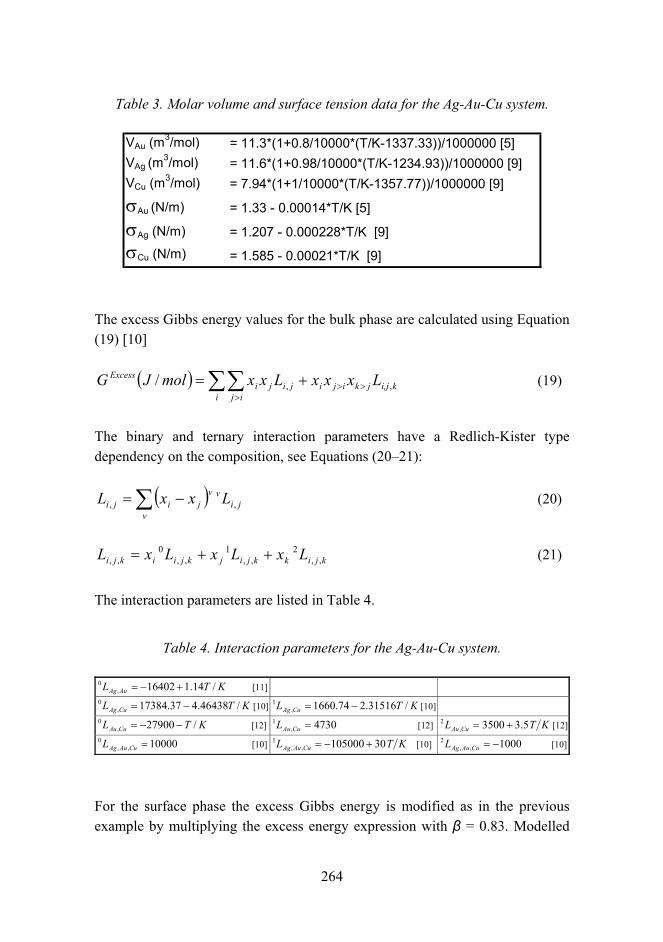
264
Table 3. Molar volume and surface tension data for the Ag-Au-Cu system.
VAu (m3/mol) = 11.3*(1+0.8/10000*(T/K-1337.33))/1000000 [5]
VAg (m3/mol) = 11.6*(1+0.98/10000*(T/K-1234.93))/1000000 [9]
VCu (m3/mol) = 7.94*(1+1/10000*(T/K-1357.77))/1000000 [9]
σAu (N/m) = 1.33 - 0.00014*T/K [5]
σAg (N/m) = 1.207 - 0.000228*T/K [9]σCu (N/m) = 1.585 - 0.00021*T/K [9]
The excess Gibbs energy values for the bulk phase are calculated using Equation (19) [10]
( ) ki,jjkijii ij
jijiExcess LxxxLxxmolJG ,,/ >>
>
+= ∑∑ (19)
The binary and ternary interaction parameters have a Redlich-Kister type dependency on the composition, see Equations (2021):
( )∑ −=v
jivv
jiji LxxL ,, (20)
kjikkjijkjiikji LxLxLxL ,,2
,,1
,,0
,, ++= (21)
The interaction parameters are listed in Table 4.
Table 4. Interaction parameters for the Ag-Au-Cu system.
KTL AuAg /14.116402,0 +−= [11]
KTL CuAg /46438.437.17384,0 −= [10] KTL CuAg /31516.274.1660,
1 −= [10]
KTL CuAu /27900,0 −−= [12] 4730,
1 =CuAuL [12] KTL CuAu 5.33500,2 += [12]
10000,,0 =CuAuAgL [10] KTL CuAuAg 30105000,,
1 +−= [10] 1000,,2 −=CuAuAgL [10]
For the surface phase the excess Gibbs energy is modified as in the previous example by multiplying the excess energy expression with β = 0.83. Modelled
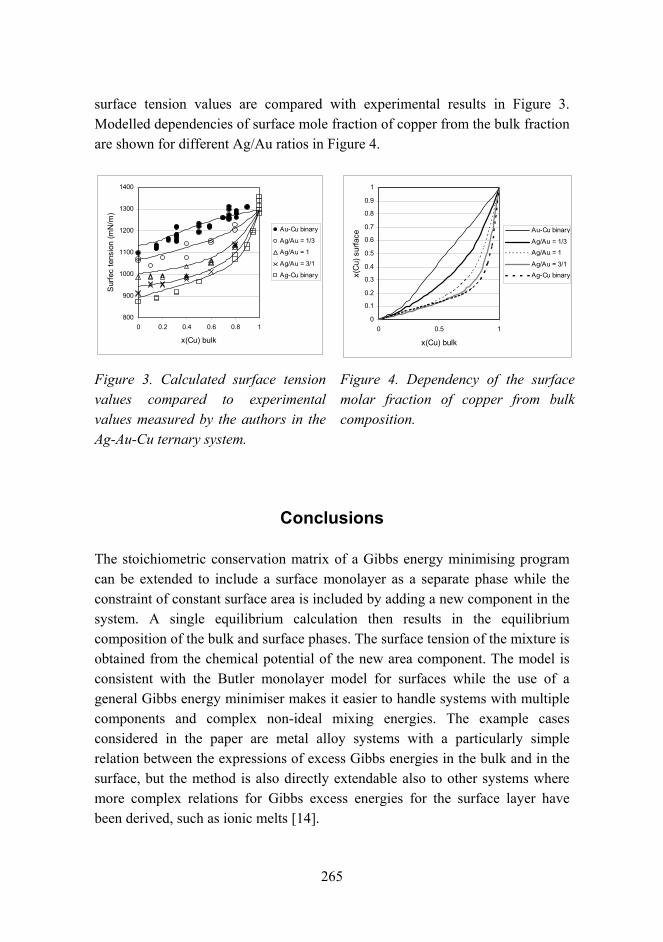
265
surface tension values are compared with experimental results in Figure 3. Modelled dependencies of surface mole fraction of copper from the bulk fraction are shown for different Ag/Au ratios in Figure 4.
800
900
1000
1100
1200
1300
1400
0 0.2 0.4 0.6 0.8 1
x(Cu) bulk
Sur
fec
tens
ion
(mN
/m)
Au-Cu binary
Ag/Au = 1/3
Ag/Au = 1
Ag/Au = 3/1
Ag-Cu binary
0
0.1
0.2
0.3
0.4
0.5
0.6
0.7
0.8
0.9
1
0 0.5 1
x(Cu) bulkx(
Cu)
sur
face
Au-Cu binary
Ag/Au = 1/3Ag/Au = 1
Ag/Au = 3/1Ag-Cu binary
Figure 3. Calculated surface tension values compared to experimental values measured by the authors in the Ag-Au-Cu ternary system.
Figure 4. Dependency of the surface molar fraction of copper from bulk composition.
Conclusions
The stoichiometric conservation matrix of a Gibbs energy minimising program can be extended to include a surface monolayer as a separate phase while the constraint of constant surface area is included by adding a new component in the system. A single equilibrium calculation then results in the equilibrium composition of the bulk and surface phases. The surface tension of the mixture is obtained from the chemical potential of the new area component. The model is consistent with the Butler monolayer model for surfaces while the use of a general Gibbs energy minimiser makes it easier to handle systems with multiple components and complex non-ideal mixing energies. The example cases considered in the paper are metal alloy systems with a particularly simple relation between the expressions of excess Gibbs energies in the bulk and in the surface, but the method is also directly extendable also to other systems where more complex relations for Gibbs excess energies for the surface layer have been derived, such as ionic melts [14].
266
Acknowledgement
The authors would like to thank Tekes the Finnish Funding Agency for Technology and Innovation and VTT for their financial support.
References
1. Tanaka, T., Matsuda, M., Nakao, K., Katayama, Y., Kaneko, D., Hara, S., Xing, X. & Qiao, Z. Measurement of surface tension of liquid Ga-base alloys by a sessile drop method. Z. Metallkd., 92 (2001), pp. 12421246.
2. Butler, J. A. V. The thermodynamics of the surfaces of solutions. Proc. Roy. Soc. A, 135 (1932), pp. 348375.
3. Tanaka, T., Hack, K., Ida, T. & Hara, S. Application of thermodynamic databases to the evaluation of surface tensions of molten alloys, salt mixtures and oxide mixtures. Z. Metallkd., 87 (1996), pp. 380389.
4. Beattie, J. A. Oppenheim, I., Principles of Thermodynamics. Elsevier (1979). 298 p.
5. Iida, T. & Guthrie, R. I. L. The Physical Properties of Liquid Metals. Clarendon Press, Oxford (1988).
6. Ohtani, H. & Ishida, K. A thermodynamic study of the phase equilibria in the Bi-Sn-Sb system. J. Electric Mater., 23 (1994), pp. 747756.
7. http://www.gtt-technologies.de/
8. Taylor, J. W. The surface tensions of liquid metal solutions. Acta Metall., 4 (1956), pp. 460468.
9. Lee, J., Shimoda, W. & Tanaka, T. Surface tension and its temperature coefficient of liquid Sn-X (X=Ag, Cu) alloys. Materials Transactions, 45(9) (2004), pp. 28642870.
267
10. Kusoffsky, A. Thermodynamic evaluation of the ternary Ag-Au-Cu system including a short range order description. Acta Materialia, 50 (2002), pp. 51395145.
11. Hassam, S., Agren, J., Gaune-Escard, M. & Bros, J. P. Ag-Au-Si system: Experimental and calculated phase diagram. Met. Trans., 21A(7) (1990), p. 1877.
12. Sundman, B., Fries, S. G. & Oates, W. A. A thermodynamic assessment of the Cu-Au System. Calphad, 22(2) (1998), pp. 335354.
13. Lee, J., Kiyose, A., Nakatsuka, A., Nakamato, M. & Tanaka, T. Improvements in surface tension measurements of liquid metals having low capillary constants by the constrained drop method. ISIJ International, 44 (2004), pp. 17931799.
14. Ueda, T., Tanaka, T. & Hara, S. Thermodynamic evaluation of surface tension of molten salt mixtures in alkali halides, nitrate, carbonate and sulfate systems. Z. Metallkd., 90 (1999), pp. 342347.
268
Service life and biological durability of wooden products, Optikesto
Hannu Viitanen1, Sini Metsä-Kortelainen1, Pekka Saranpää2, Tapio Laakso2, Hanna Iitti1, Mia Löija1, Leena Paajanen1, Anni Harju3 & Martti Venäläinen3
1VTT Technical Research Centre of Finland Betonimiehenkuja 5, Espoo, P.O. Box 1000, FI-02044 VTT
2Finnish Forest Research Institute (Metla) Vantaa Research Unit, PB 18, 01301 Vantaa
3Finnish Forest Research Institute (Metla) Punkaharju Research Unit, 58450 Punkaharju
Abstract
To minimize mold growth and decay on timber and wood products in a given situation, it is necessary to consider the type of the wood, the entire production chain and use conditions. Efforts should focus on the critical processes. The material parameter for service life prediction is in itself a highly complex conglomeration of various parameters, ranging from inherent chemical and physical properties of the particular wood used over production process operations to finishing treatments. There is a limited selection of fast tools to evaluate chemical composition of wood, which is a base for the biological durability of wood. Screening or accelerated tests are optional methods to measure the biological durability of wooden products. In this paper, results on the durability of pine heartwood connected with the optional measurement of the chemical composition of wood are given. There was vide variation of durability within one wood species, but coated pine heartwood and spruce performed very well against mold and decay fungi in an accelerated laboratory test.
Introduction
The durability of building materials is one key issue in the EUs Construction Products Directive (CPD). For wood, this issue is of paramount importance in
269
market competition. A good building design preventing high moisture contents in the wood will give a structure with a long service life. Long periods of high moisture loads and wetting are in many cases inevitable, which cause increased risks for biological degradation, especially in structures exposed to weather in conditions of use class 3 [1]. To minimize mold growth and decay on timber and wood products in a given situation, it is necessary to consider the type of wood and the entire production chain and focus efforts on the critical processes. According to the ISO standard [2], a factor method is one optional method to evaluate the service life of building products. The factors governing the durability and resistance of wood products include the properties of the wood, methods of processing and drying, application of protective agents, material modifications, surface finishing, design, environmental and service conditions such as humidity and temperature as well as the related time of exposure, maintenance and repair [3, 4, 5]. The material parameter is in itself a highly complex conglomeration of various parameters, ranging from inherent chemical and physical properties of the particular wood used during the production process operations to finishing treatments. There is a limited selection of fast tools to evaluate the chemical composition of wood, which is a base for the biological durability of wood. In the consortium study, Optikesto Optimizing durability and standardization of resistance of wood products, to attack of discolouring and decay fungi, detection of chemical composition and durability of wood has been studied. This paper focuses mainly on the durability properties of pine heartwood.
Biological durability and service life of wooden products
Several factors are involved in the durability and service life of wooden products (Figures 1 and 2). For material factor of ISO 15686 standard method, properties of wood material and protection like preservation, modification and surface treatments are the main parts of the material factor. In the future, more data are needed on the durability parameters of wood materials for the service life prediction and biological durability. During the processing and use of wooden products, the basic properties of wood material will remain even if they are modified with different kinds of wood working and treatment processes.
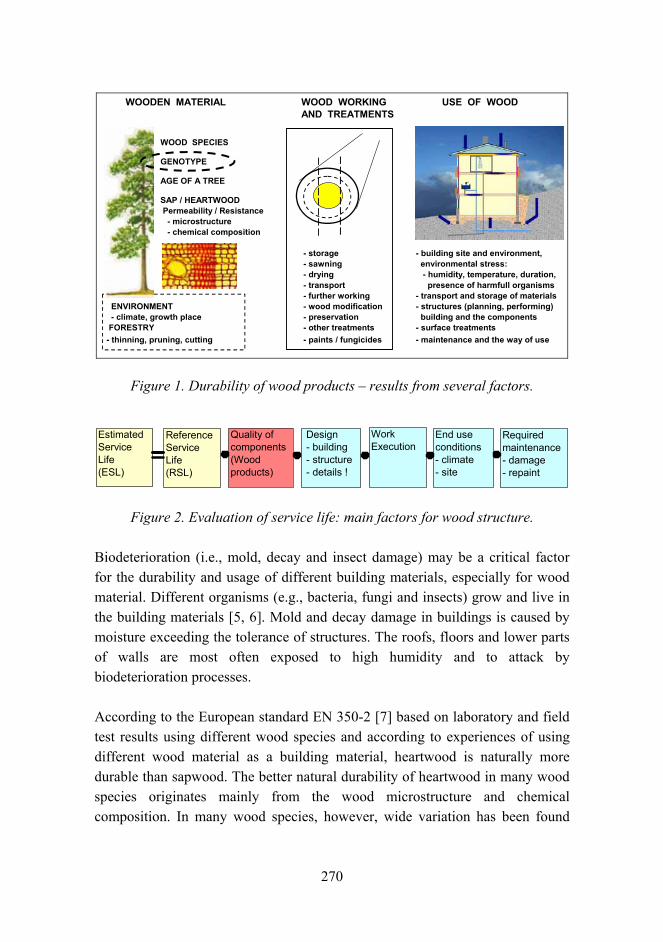
270
WOODEN MATERIAL WOOD WORKING USE OF WOODAND TREATMENTS
WOOD SPECIES
GENOTYPE
AGE OF A TREE
SAP / HEARTWOOD Permeability / Resistance - microstructure - chemical composition
- storage - building site and environment, - sawning environmental stress: - drying - humidity, temperature, duration, - transport presence of harmfull organisms - further working - transport and storage of materials
ENVIRONMENT - wood modification - structures (planning, performing) - climate, growth place - preservation building and the components FORESTRY - other treatments - surface treatments - thinning, pruning, cutting - paints / fungicides - maintenance and the way of use
Figure 1. Durability of wood products results from several factors.
Estimated Service Life(ESL)
Reference Service Life(RSL)
Quality of components(Wood products)
Design - building - structure - details !
Work Execution
End use conditions- climate- site
Required maintenance- damage- repaint
Figure 2. Evaluation of service life: main factors for wood structure.
Biodeterioration (i.e., mold, decay and insect damage) may be a critical factor for the durability and usage of different building materials, especially for wood material. Different organisms (e.g., bacteria, fungi and insects) grow and live in the building materials [5, 6]. Mold and decay damage in buildings is caused by moisture exceeding the tolerance of structures. The roofs, floors and lower parts of walls are most often exposed to high humidity and to attack by biodeterioration processes.
According to the European standard EN 350-2 [7] based on laboratory and field test results using different wood species and according to experiences of using different wood material as a building material, heartwood is naturally more durable than sapwood. The better natural durability of heartwood in many wood species originates mainly from the wood microstructure and chemical composition. In many wood species, however, wide variation has been found
271
between individual trees and within the individual logs. The variation of durability or decay resistance has been compensated by using chemical treatments, preservation, modifications or different kinds of surface treatments of wood [6].
The heartwood of Scots pine (Pinus sylvestris) is classified to natural durability classes 34 (moderately to slightly durable) and the heartwood Norway spruce (Picea abies) belongs to the natural durability class 4 (slightly durable) according to the standard EN 350-2. Discussion about the durability of wooden products and service life has been activated, and the exploitation of the natural durable wood material is in focus [8]. However, there are problems concerning the using of results of biological tests for service life prediction of wooden products. There are several methods for testing the biological durability of impregnated wood material, but very few of them are suitable for testing the durability of wooden products. Three key issues have been identified as being important to wood and wood-based products:
• resistance to biological deterioration • the effect of the environment on the expression of biological activity • the need to define broad service classes, equivalent to design lives.
Materials and methods for the laboratory work
Natural durability depends strongly on the chemical composition of wood. In the project Optikesto, the effect of chemical composition on the decay and mold resistance of wood was studied. The volatile organic compounds (VOC) of the wood samples were also measured and the results were compared to chemical composition and durability results.
Two separate sets of research material were used in the tests. The research material 1 (sapwood and heartwood of pine) was provided by Metla. The two-phased sampling of the material and the decay test are described by Harju and Venäläinen [9]. Research material 1 was used in chemical analyses, and a sub-sample of it (Figure 3) in the mold test and in the analysis of volatile organic compounds.
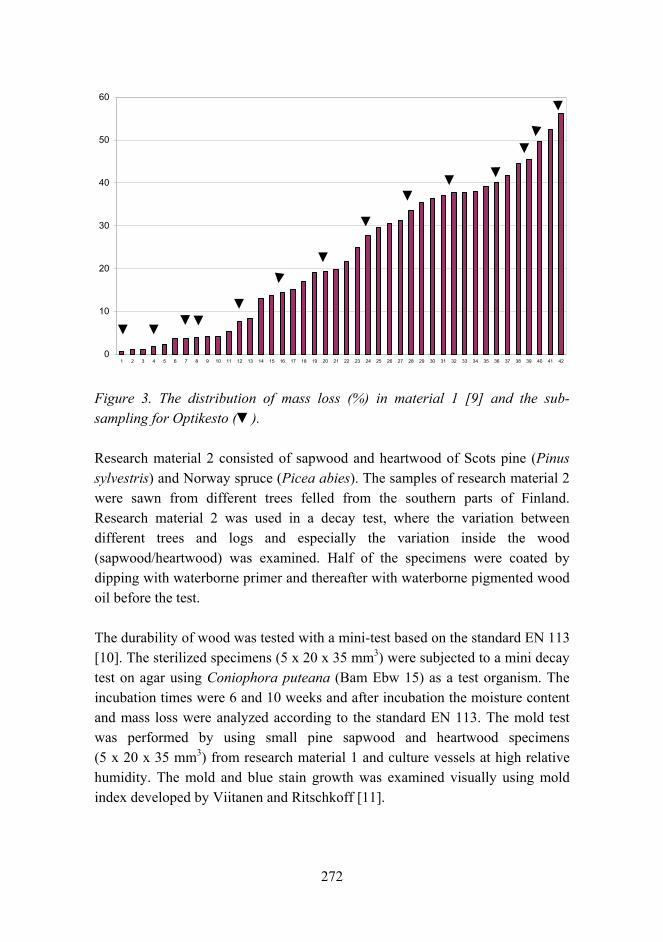
272
0
10
20
30
40
50
60
1 2 3 4 5 6 7 8 9 10 11 12 13 14 15 16 17 18 19 20 21 22 23 24 25 26 27 28 29 30 31 32 33 34 35 36 37 38 39 40 41 42
Figure 3. The distribution of mass loss (%) in material 1 [9] and the sub-sampling for Optikesto ().
Research material 2 consisted of sapwood and heartwood of Scots pine (Pinus sylvestris) and Norway spruce (Picea abies). The samples of research material 2 were sawn from different trees felled from the southern parts of Finland. Research material 2 was used in a decay test, where the variation between different trees and logs and especially the variation inside the wood (sapwood/heartwood) was examined. Half of the specimens were coated by dipping with waterborne primer and thereafter with waterborne pigmented wood oil before the test.
The durability of wood was tested with a mini-test based on the standard EN 113 [10]. The sterilized specimens (5 x 20 x 35 mm3) were subjected to a mini decay test on agar using Coniophora puteana (Bam Ebw 15) as a test organism. The incubation times were 6 and 10 weeks and after incubation the moisture content and mass loss were analyzed according to the standard EN 113. The mold test was performed by using small pine sapwood and heartwood specimens (5 x 20 x 35 mm3) from research material 1 and culture vessels at high relative humidity. The mold and blue stain growth was examined visually using mold index developed by Viitanen and Ritschkoff [11].
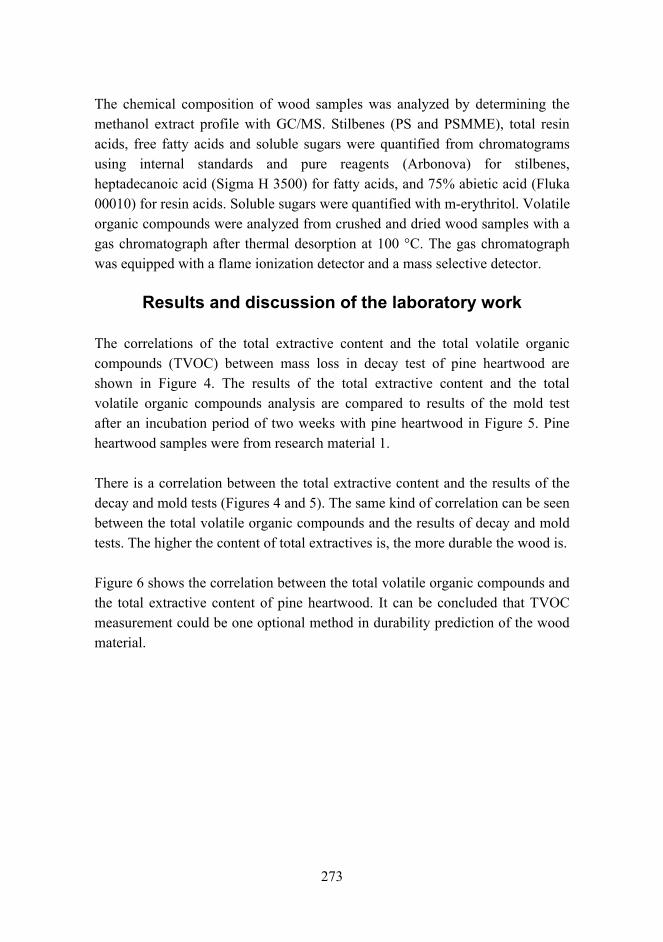
273
The chemical composition of wood samples was analyzed by determining the methanol extract profile with GC/MS. Stilbenes (PS and PSMME), total resin acids, free fatty acids and soluble sugars were quantified from chromatograms using internal standards and pure reagents (Arbonova) for stilbenes, heptadecanoic acid (Sigma H 3500) for fatty acids, and 75% abietic acid (Fluka 00010) for resin acids. Soluble sugars were quantified with m-erythritol. Volatile organic compounds were analyzed from crushed and dried wood samples with a gas chromatograph after thermal desorption at 100 °C. The gas chromatograph was equipped with a flame ionization detector and a mass selective detector.
Results and discussion of the laboratory work
The correlations of the total extractive content and the total volatile organic compounds (TVOC) between mass loss in decay test of pine heartwood are shown in Figure 4. The results of the total extractive content and the total volatile organic compounds analysis are compared to results of the mold test after an incubation period of two weeks with pine heartwood in Figure 5. Pine heartwood samples were from research material 1.
There is a correlation between the total extractive content and the results of the decay and mold tests (Figures 4 and 5). The same kind of correlation can be seen between the total volatile organic compounds and the results of decay and mold tests. The higher the content of total extractives is, the more durable the wood is.
Figure 6 shows the correlation between the total volatile organic compounds and the total extractive content of pine heartwood. It can be concluded that TVOC measurement could be one optional method in durability prediction of the wood material.
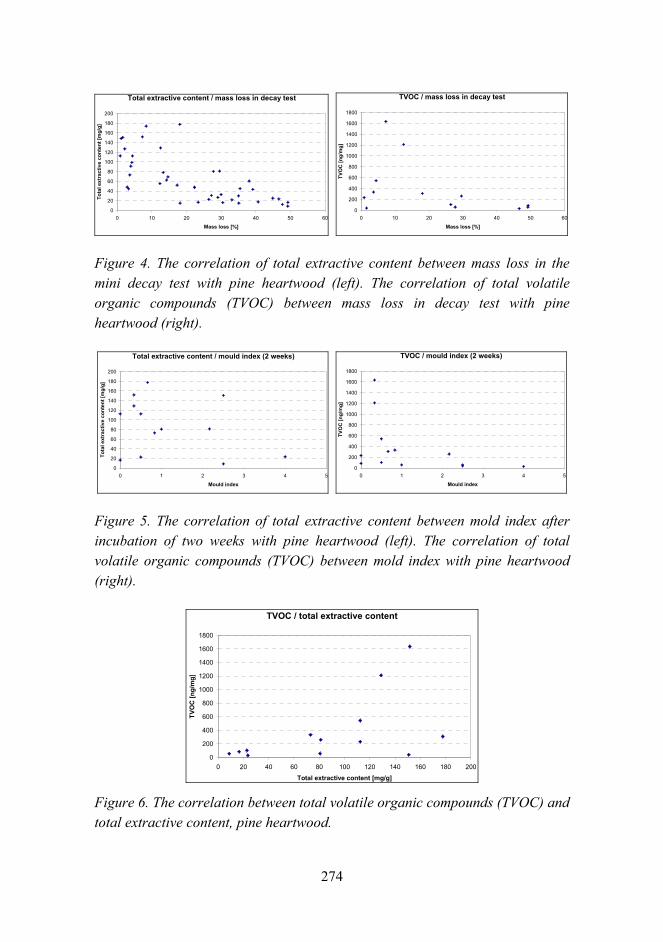
274
Total extractive content / mass loss in decay test
0
20
40
60
80
100
120
140
160
180
200
0 10 20 30 40 50 60
Mass loss [%]
Tota
l ext
ract
ive
cont
ent [
mg/
g]
TVOC / mass loss in decay test
0
200
400
600
800
1000
1200
1400
1600
1800
0 10 20 30 40 50 60
Mass loss [%]
TVO
C [n
g/m
g]
Figure 4. The correlation of total extractive content between mass loss in the mini decay test with pine heartwood (left). The correlation of total volatile organic compounds (TVOC) between mass loss in decay test with pine heartwood (right).
Total extractive content / mould index (2 weeks)
0
20
40
60
80
100
120
140
160
180
200
0 1 2 3 4 5
Mould index
Tota
l ext
ract
ive
cont
ent [
mg/
g]
TVOC / mould index (2 weeks)
0
200
400
600
800
1000
1200
1400
1600
1800
0 1 2 3 4 5
Mould index
TVO
C [n
g/m
g]
Figure 5. The correlation of total extractive content between mold index after incubation of two weeks with pine heartwood (left). The correlation of total volatile organic compounds (TVOC) between mold index with pine heartwood (right).
TVOC / total extractive content
0
200
400
600
800
1000
1200
1400
1600
1800
0 20 40 60 80 100 120 140 160 180 200
Total extractive content [mg/g]
TVO
C [n
g/m
g]
Figure 6. The correlation between total volatile organic compounds (TVOC) and total extractive content, pine heartwood.
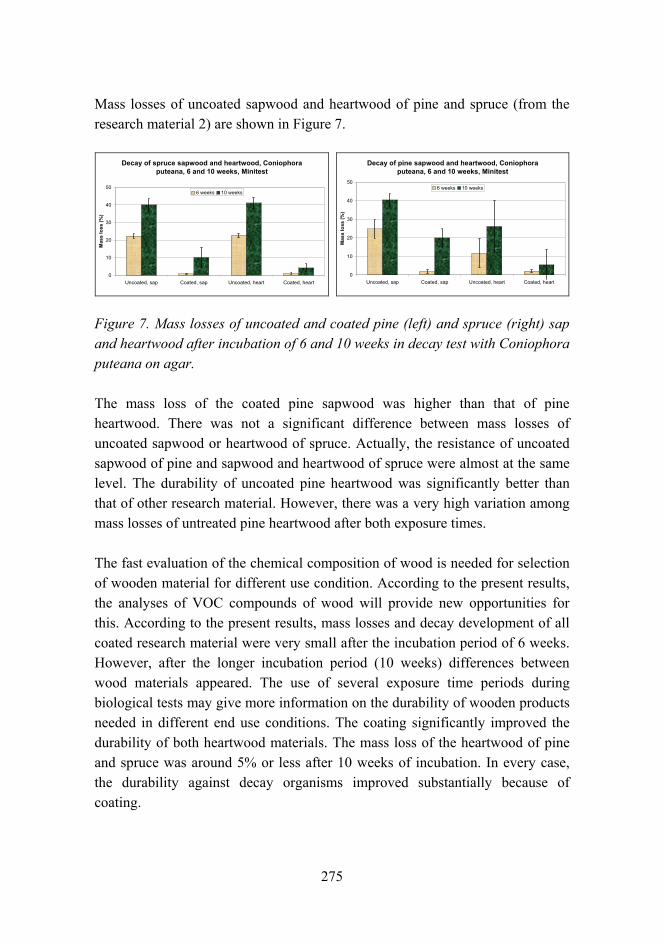
275
Mass losses of uncoated sapwood and heartwood of pine and spruce (from the research material 2) are shown in Figure 7.
Decay of spruce sapwood and heartwood, Coniophora puteana, 6 and 10 weeks, Minitest
0
10
20
30
40
50
Uncoated, sap Coated, sap Uncoated, heart Coated, heart
Mas
s lo
ss (%
)
6 weeks 10 weeks
Decay of pine sapwood and heartwood, Coniophora puteana, 6 and 10 weeks, Minitest
0
10
20
30
40
50
Uncoated, sap Coated, sap Uncoated, heart Coated, heart
Mas
s lo
ss (%
)
6 weeks 10 weeks
Figure 7. Mass losses of uncoated and coated pine (left) and spruce (right) sap and heartwood after incubation of 6 and 10 weeks in decay test with Coniophora puteana on agar.
The mass loss of the coated pine sapwood was higher than that of pine heartwood. There was not a significant difference between mass losses of uncoated sapwood or heartwood of spruce. Actually, the resistance of uncoated sapwood of pine and sapwood and heartwood of spruce were almost at the same level. The durability of uncoated pine heartwood was significantly better than that of other research material. However, there was a very high variation among mass losses of untreated pine heartwood after both exposure times.
The fast evaluation of the chemical composition of wood is needed for selection of wooden material for different use condition. According to the present results, the analyses of VOC compounds of wood will provide new opportunities for this. According to the present results, mass losses and decay development of all coated research material were very small after the incubation period of 6 weeks. However, after the longer incubation period (10 weeks) differences between wood materials appeared. The use of several exposure time periods during biological tests may give more information on the durability of wooden products needed in different end use conditions. The coating significantly improved the durability of both heartwood materials. The mass loss of the heartwood of pine and spruce was around 5% or less after 10 weeks of incubation. In every case, the durability against decay organisms improved substantially because of coating.
276
Conclusions
There is an increasing requirement to improve current approaches to performance-based classification of wood and wood-based products with regards to durability. A new approach to the development of prediction methods is necessary, in order to satisfy the requirements given in the Construction Products Directive. Screening tests are optional ways to measure wood resistance against biological deterioration. Several time periods, however, are needed for the use of the results for the basic data for service life evaluation.
Acknowledgement
This work is a part of the consortium study Optikesto Optimizing durability and standardization of the resistance of wood products, to attack of discoloring and decay fungi financed by Tekes the Finnish Funding Agency for Technology and Innovation, Industry, VTT and Metla. The practical work for wood drying, working and sample preparation at VTT was performed by Holger Forsen, Veikko Tarvainen, Pentti Ek and Heikki Murto. The practical work for decay test was performed by Liisa Seppänen, Hellevi Botska and Pauliina Saurus. The sample preparation for chemical analyses at Metla was performed by Irmeli Luovula.
Reference list
1. European standard EN 335-1. Durability of wood and wood based products Definition of hazard (use) classes Part 1: General. Brussels. European Committee for Standardization. 1992.
2. International Standard ISO 15686-1. Building and constructed assets Service life planning Part 1: General principles. 2000. 40 p.
3. Vesikari, E., Rautiainen, L., Häkkä-Rönnholm, E., Silvennoinen, K., Salonvaara, M. & Viitanen, H. Julkisivujen ja katteiden käyttöiän ennakointi. VTT, Espoo. 2001. 158 p. (VTT Julkaisuja Publikationer 850.) ISBN 951-38-5035-8.
277
4. Viitanen, H., Ritschkoff, A.-C. & Paajanen, L. The durability of different wood products. In: Bertolini et al. (ed.) European Timber Building as an Expression of Technological and Technical Cultures. Elsevier, Paris. 2002. Pp. 173186.
5. Viitanen, H., Ritschkoff, A.-C., Ojanen, T. & Salonvaara, M. Moisture conditions and biodeterioration risk of building materials and structure. Proceedings of the 2nd International Symposium ILCDES 2003. Integrated Lifetime Engineering of Buildings and Civil Infrastructures, Kuopio, 13 Dec. 2003 RIL, VTT, RILEM, IABSE, ECCE, ASCE. Espoo. 2003. Pp. 151156.
6. Zabel, R. A. & Morrell, J. J. Wood Microbiology: Decay and its Prevention. Academic Press Inc., California. 1992.
7. European standard EN 350-2. Wood and wood based products Natural durability of wood Part 2: Natural durability and treatability of selected wood species of importance in Europe. Brussels. European Committee for Standardization. 1994. 37 p.
8. CEN/TC 38 N 1618. Report of the COST E 37 Task Force. Performance-based classification in wood durability and protection: a proposal to CEN TC 38 for future progress. 2005.
9. Harju, A. & Venäläinen, M. Measuring the decay resistance of Scots pine heartwood indirectly by the Folin-Ciocalteu assay. Can. J. For. Res. 2006. (In press).
10. European standard EN 113. Determination of toxic values of wood preservatives against wood destroying Basidiomycetes cultured on agar medium. Brussels. European Committee for Standardization. 1996. 24 p.
11. Viitanen, H. & Ritschkoff, A. Mould growth in pine and spruce sapwood in relation to air humidity and temperature. Uppsala. The Swedish University of Agricultural Sciences, Department of Forest Products. Report no 221. 1991. 40 p. + app.
278
Improved micro-pitting performance of power transmission gears
Helena Ronkainen, Tiina Ahlroos, Simo Varjus & Jouko Virta
VTT Technical Research Centre of Finland Metallimiehenkuja 6, Espoo, P.O. Box 1000, FI-02044 VTT
Abstract
Gears are one of the most complicated applications of tribology with combined rolling and sliding action on the gear teeth. There is the tendency to increase the amount of power to be transmitted through the gears with the simultaneous need to decrease the size of gears. Also environmental aspects need to be taken into account in modern gear design. The typical tribological failures that gears experience are scuffing, macro-pitting and micro-pitting. In this study the effect of surface roughness, lubricant type and surface treatment on micro-pitting performance was studied by twin disc tests. The parameters studied were surface roughness, lubricant type and surface treatment.
Introduction
Gears are important power transmission components. The most commonly used gear types are spur, helical, bevel, hypoid and worm gears. The efficiency and durability of gears depend strongly on the tribological performance. Gear teeth contact is a complicated tribological application with combined rolling and sliding action and the load transmitted through Herzian lubricated contacts. The selection of gear material and heat treatment is the most basic decision of gear design. The most widely used material in gears is steel and the performance of gears can be improved by proper heat treatment or by using coatings. Also the surface finish is one of the determining factors in the gear tooth performance, smoother surfaces giving improved performance. Gears are typically run lubricated, mineral oil being mostly used for the gears, but synthetic lubricants, like polyalphaolefine and esters, are increasing in usage due to their excellent properties. Also environmentally adapted lubricants are finding selected applications as gear lubricants. Additives are typically used in gear lubricants to
279
improve the performance of gear oils. Even though the gear performance and gear lubrication has been under thorough research effort, gear failures are still common in many gearing applications. Also the further increased requirements for gear performance have increased the need for research work in order to improve gear performance.
There are four modes of gear tooth failure, which are directly related to tribological aspects, like deterioration of lubrication or change of lubricant performance in gear tooth contact, rapid increase in contact temperature or excessive foreign particles in the lubricant. These failure modes include macro-pitting, micro-pitting, scuffing and mild wear. Other failure types, like cracking, bending fatigue or fracture due to overload are not reviewed here, since they are not tribology related failures.
Micro-pitting, also referred to as grey staining or frosting, is a fatigue failure of the surface, where micro-cracking leads to breaking out of material from the surface. The cracks propagate on the pinion towards the pitch line and on the wheel away from the pitch line, indicating that the direction of propagation depends on the direction of sliding [1, 2]. Higher speeds of gears lead to higher absolute sliding speeds on the gear tooth. Experiments have shown that the increase in sliding speed reduces the micro-pitting life. The gears do not fail by micro-pitting at the locations of the highest contact pressure, but often where the sliding speed is somewhat greater. Micro-pitting is a form of surface damage strongly associated with low lubricanting film thickness and it is the dominant life limitation for the ground hard gears operating under modest conditions [3].
Microscopically micro-pitting shows similar features as macro-pitting, but the scale is different. A micro-pit is characterized by a depth, length and width on the order of a few microns. The cracks propagate into the steel at a shallow angle, usually less than 30° and they can merge resulting in a continuous loss of material on a wide area, resulting in greyish patches. Micro-pitting can be a slow progressive degradation and is often considered to be non-destructive unless it leads to large sized macro-pits [2, 4].
Micro-pitting is strongly influenced by the relative film thickness λ as the relation of film thickness to surface roughness and thus by operating viscosity and additive type of the lubricant. The specific surface energy has been
280
suggested to be responsible for micro-pitting by affecting elastohydrodynamic and tribological film formation. The specific surface energy is dependant on the heat capacity and density, gear bulk temperature, friction coefficient, normal force, face width and the film thickness [1].
The most significant factor that influences micro-pitting initiation is the contact pressure. At high contact pressures the number of cycles necessary for micro-pitting to initiate is almost independent of other factors. Under experimental conditions the only way to retard micro-pitting initiation is an improvement in the surface finish. At low contact pressure, micro-pitting initiation is strongly affected by other factors, like material, lubricant, temperature, surface roughness, speed and slide-to-roll ratio. The main effects on micro-pitting progression rate are the speed and slide-to-roll ratio. At high speeds micro-pitting propagates at a high rate regardless of the other factors. It is suggested that the mechanism of micro-pitting and martensite decay are related to each other. The martensite decay is affected by the material and heat treatment used and thus micro-pitting endurance can be improved by proper material and heat treatment selection. Growth of micro-pits depends on the frictional power dissipation by sliding of surface asperities that result in plastic deformation and heating of the surfaces. The increased temperature also reduces the lubricant viscosity and load carrying capacity, which also contribute to poor micro-pitting performance. Several approaches for reduction of frictional heating and thus improvement in micro-pitting resistance can be considered, namely reduction of surface roughness, reduction of friction by using EP additives or carbon coatings, the use of thermally stabile surfaces and the use of hard surfaces. [2]
In the Development of Power Transmission Capacity and Lubrication project the influence of the newly developed gear material, diamond-like carbon (DLC) coatings, carbonitriding and environmentally acceptable ester lubricant on gear performance will be studied. Also the effect of improved surface finish will be reviewed. The effect of different material parameters on micro-pitting performance will be evaluated by twin disc tests at VTT. In this article the effect of surface roughness, DLC coating and lubricant type is presented.
Experimental
For the twin on-disc tests, discs were manufactured from the conventional case carburizing steel (20MnCr5). The discs were case hardened to a surface hardness
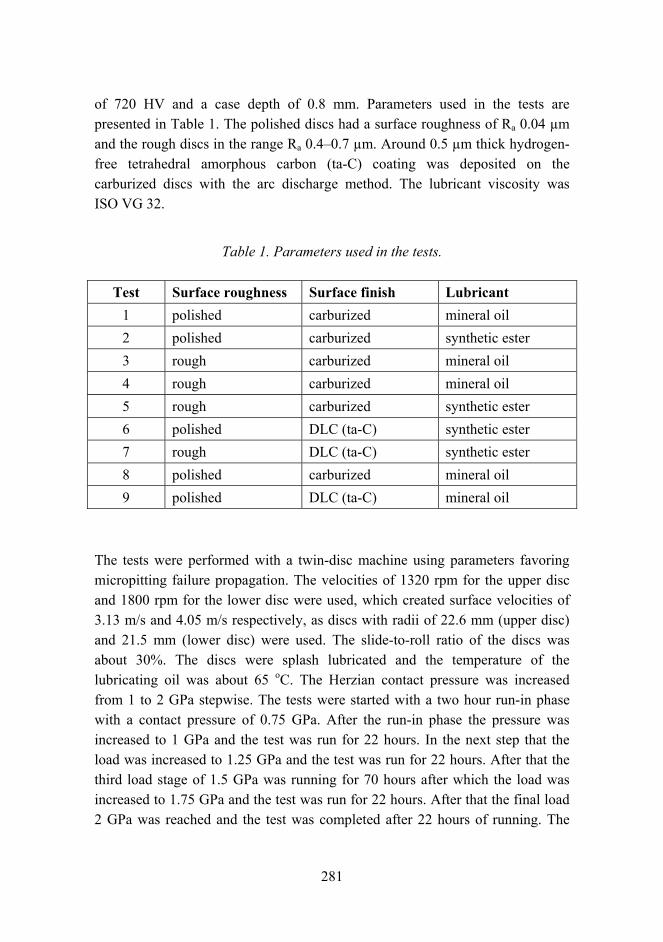
281
of 720 HV and a case depth of 0.8 mm. Parameters used in the tests are presented in Table 1. The polished discs had a surface roughness of Ra 0.04 µm and the rough discs in the range Ra 0.40.7 µm. Around 0.5 µm thick hydrogen-free tetrahedral amorphous carbon (ta-C) coating was deposited on the carburized discs with the arc discharge method. The lubricant viscosity was ISO VG 32.
Table 1. Parameters used in the tests.
Test Surface roughness Surface finish Lubricant 1 polished carburized mineral oil 2 polished carburized synthetic ester 3 rough carburized mineral oil 4 rough carburized mineral oil 5 rough carburized synthetic ester 6 polished DLC (ta-C) synthetic ester 7 rough DLC (ta-C) synthetic ester 8 polished carburized mineral oil 9 polished DLC (ta-C) mineral oil
The tests were performed with a twin-disc machine using parameters favoring micropitting failure propagation. The velocities of 1320 rpm for the upper disc and 1800 rpm for the lower disc were used, which created surface velocities of 3.13 m/s and 4.05 m/s respectively, as discs with radii of 22.6 mm (upper disc) and 21.5 mm (lower disc) were used. The slide-to-roll ratio of the discs was about 30%. The discs were splash lubricated and the temperature of the lubricating oil was about 65 oC. The Herzian contact pressure was increased from 1 to 2 GPa stepwise. The tests were started with a two hour run-in phase with a contact pressure of 0.75 GPa. After the run-in phase the pressure was increased to 1 GPa and the test was run for 22 hours. In the next step that the load was increased to 1.25 GPa and the test was run for 22 hours. After that the third load stage of 1.5 GPa was running for 70 hours after which the load was increased to 1.75 GPa and the test was run for 22 hours. After that the final load 2 GPa was reached and the test was completed after 22 hours of running. The
282
total amount of cycles experienced by the discs was about 12.5 million cycles for the upper disc and about 17 million for the lower disc. During the tests the friction torque was measured and the friction coefficient was determined for each test. The discs contact surfaces were examined after each load stage by optical microscopy and scanning electron microscopy (SEM) examination was performed for the discs after the tests.
Results
The surfaces of the discs after the test are presented in Figure 1, which shows the micro-pitting failure for the discs that had a high surface roughness, in the range Ra 0.40.7 µm, before the test and were lubricated with mineral oil. The test with rough discs lubricated with mineral oil had to be stopped after stage 3 due to increased torque in the test.
Also on rough discs lubricated with ester oil micro-pitting was observed, but in a smaller amount compared to mineral oil. The discs with polished surface or rough surface coated by DLC coating showed no signs of micro-pitting. Figure 2 represents the effect of diamond-like carbon coating on disc performance. The rough coated surface seems to experience polishing type of effect during the testing with no signs of micro-pitting.
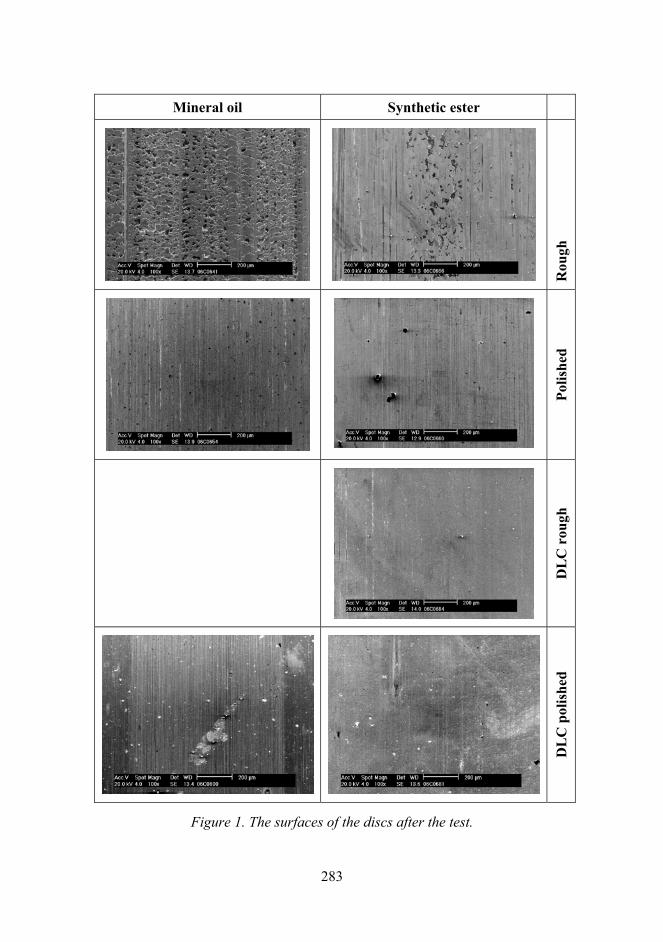
283
Mineral oil Synthetic ester
Rou
gh
Polis
hed
DL
C r
ough
DL
C p
olis
hed
Figure 1. The surfaces of the discs after the test.
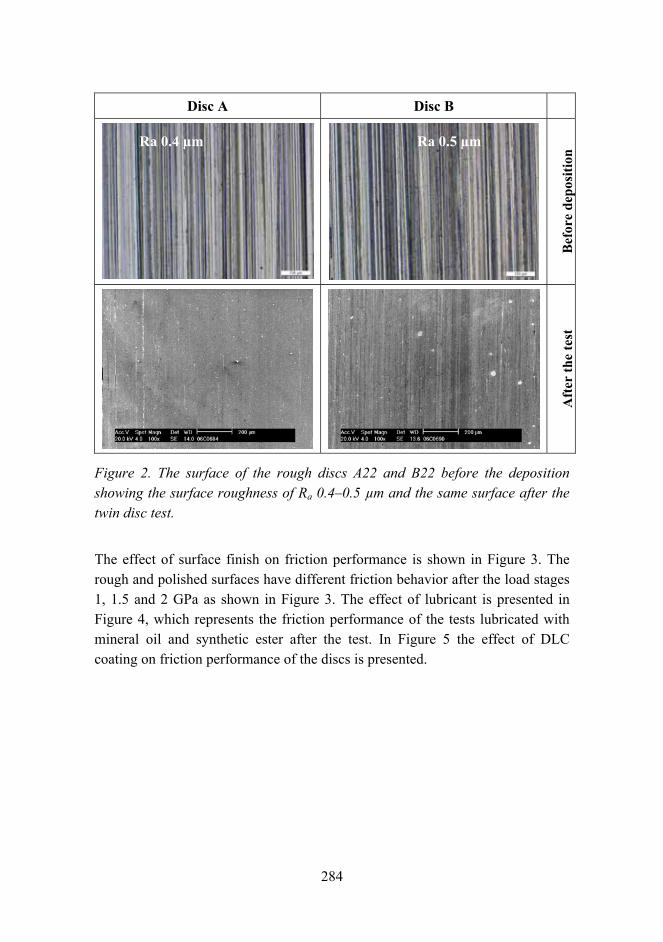
284
Disc A Disc B
Bef
ore
depo
sitio
n
Aft
er th
e te
st
Figure 2. The surface of the rough discs A22 and B22 before the deposition showing the surface roughness of Ra 0.40.5 µm and the same surface after the twin disc test.
The effect of surface finish on friction performance is shown in Figure 3. The rough and polished surfaces have different friction behavior after the load stages 1, 1.5 and 2 GPa as shown in Figure 3. The effect of lubricant is presented in Figure 4, which represents the friction performance of the tests lubricated with mineral oil and synthetic ester after the test. In Figure 5 the effect of DLC coating on friction performance of the discs is presented.
Ra 0.4 µm Ra 0.5 µm
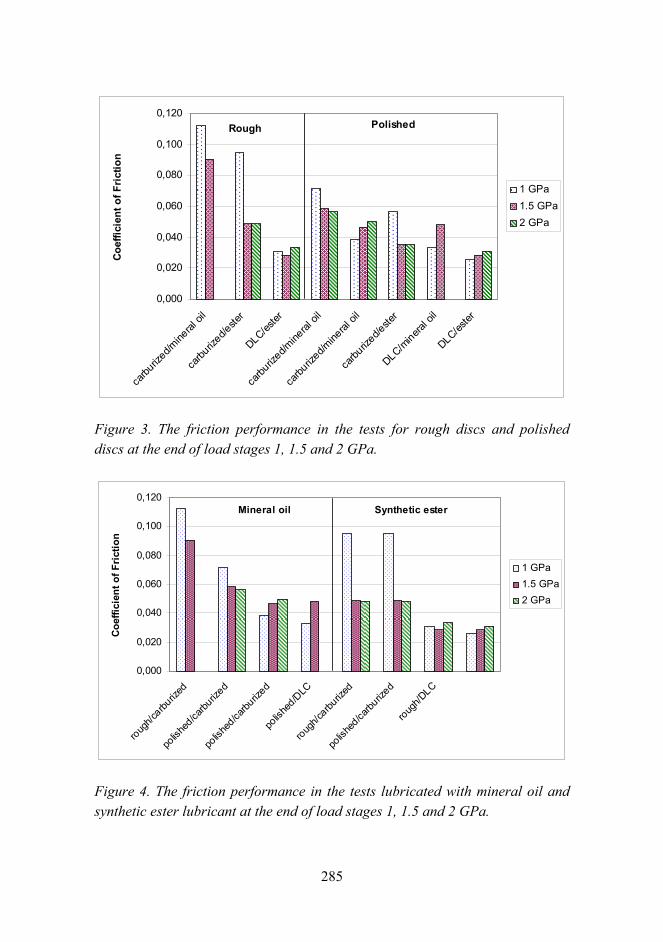
285
0,000
0,020
0,040
0,060
0,080
0,100
0,120
carbu
rized/m
ineral
oil
carbu
rized/e
ster
DLC/ester
carbu
rized/m
ineral
oil
carbu
rized/m
ineral
oil
carbu
rized/e
ster
DLC/minera
l oil
DLC/ester
Coef
ficie
nt o
f Fric
tion
1 GPa1.5 GPa2 GPa
Rough Polished
Figure 3. The friction performance in the tests for rough discs and polished discs at the end of load stages 1, 1.5 and 2 GPa.
0,000
0,020
0,040
0,060
0,080
0,100
0,120
rough/c
arburiz
ed
polish
ed/ca
rburiz
ed
polish
ed/ca
rburiz
ed
polish
ed/D
LC
rough/c
arburiz
ed
polish
ed/ca
rburiz
ed
rough/D
LC
Coe
ffici
ent o
f Fric
tion
1 GPa1.5 GPa2 GPa
Mineral oil Synthetic ester
Figure 4. The friction performance in the tests lubricated with mineral oil and synthetic ester lubricant at the end of load stages 1, 1.5 and 2 GPa.
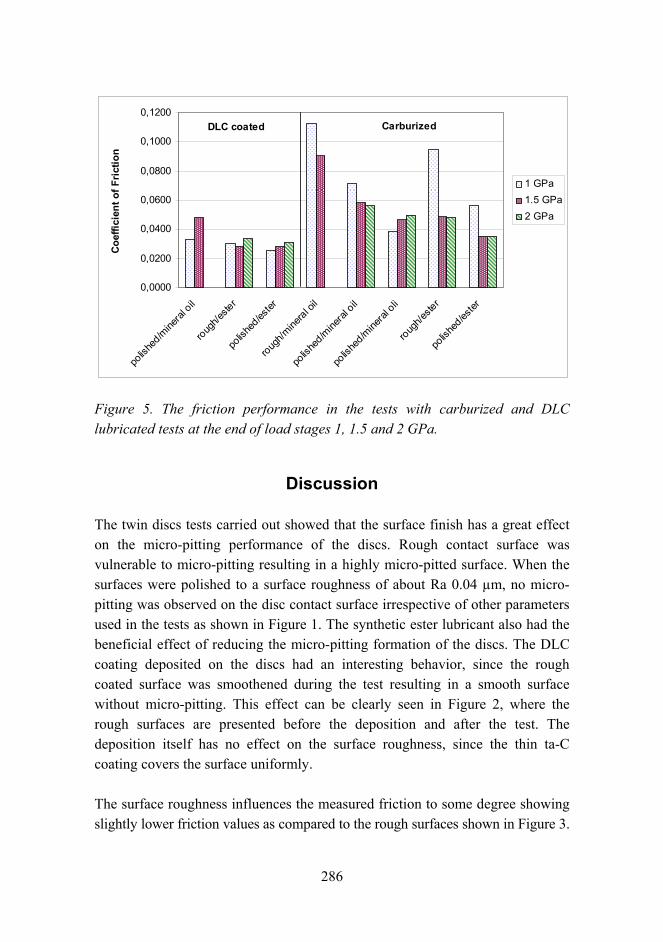
286
0,0000
0,0200
0,0400
0,0600
0,0800
0,1000
0,1200
polish
ed/m
ineral
oil
rough/e
ster
polish
ed/es
ter
rough/m
ineral o
il
polish
ed/m
ineral
oil
polish
ed/m
ineral
oli
rough/e
ster
polish
ed/es
ter
Coef
ficie
nt o
f Fric
tion
1 GPa1.5 GPa2 GPa
DLC coated Carburized
Figure 5. The friction performance in the tests with carburized and DLC lubricated tests at the end of load stages 1, 1.5 and 2 GPa.
Discussion
The twin discs tests carried out showed that the surface finish has a great effect on the micro-pitting performance of the discs. Rough contact surface was vulnerable to micro-pitting resulting in a highly micro-pitted surface. When the surfaces were polished to a surface roughness of about Ra 0.04 µm, no micro-pitting was observed on the disc contact surface irrespective of other parameters used in the tests as shown in Figure 1. The synthetic ester lubricant also had the beneficial effect of reducing the micro-pitting formation of the discs. The DLC coating deposited on the discs had an interesting behavior, since the rough coated surface was smoothened during the test resulting in a smooth surface without micro-pitting. This effect can be clearly seen in Figure 2, where the rough surfaces are presented before the deposition and after the test. The deposition itself has no effect on the surface roughness, since the thin ta-C coating covers the surface uniformly.
The surface roughness influences the measured friction to some degree showing slightly lower friction values as compared to the rough surfaces shown in Figure 3.
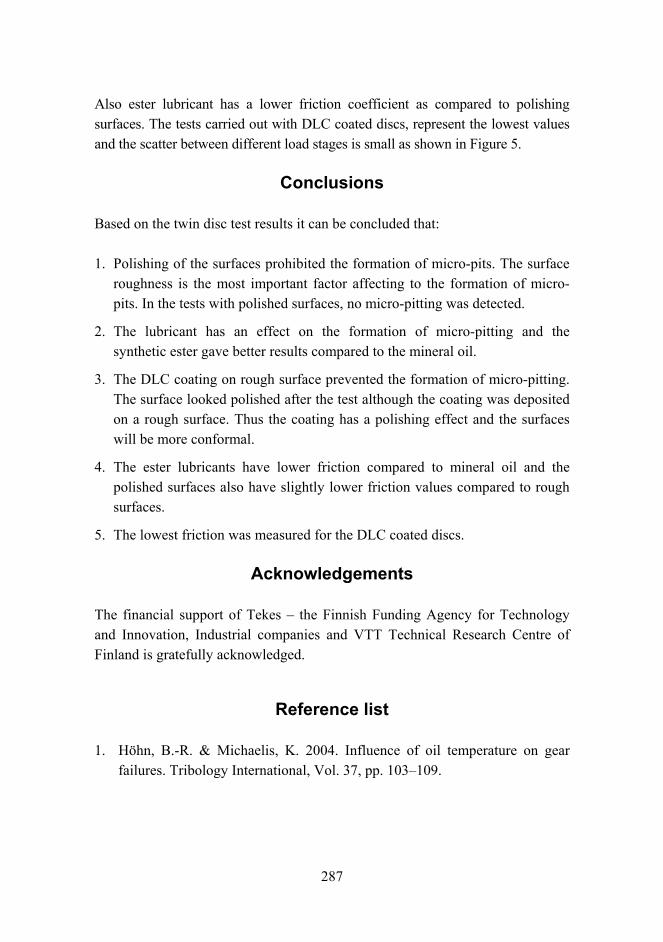
287
Also ester lubricant has a lower friction coefficient as compared to polishing surfaces. The tests carried out with DLC coated discs, represent the lowest values and the scatter between different load stages is small as shown in Figure 5.
Conclusions
Based on the twin disc test results it can be concluded that:
1. Polishing of the surfaces prohibited the formation of micro-pits. The surface roughness is the most important factor affecting to the formation of micro-pits. In the tests with polished surfaces, no micro-pitting was detected.
2. The lubricant has an effect on the formation of micro-pitting and the synthetic ester gave better results compared to the mineral oil.
3. The DLC coating on rough surface prevented the formation of micro-pitting. The surface looked polished after the test although the coating was deposited on a rough surface. Thus the coating has a polishing effect and the surfaces will be more conformal.
4. The ester lubricants have lower friction compared to mineral oil and the polished surfaces also have slightly lower friction values compared to rough surfaces.
5. The lowest friction was measured for the DLC coated discs.
Acknowledgements
The financial support of Tekes the Finnish Funding Agency for Technology and Innovation, Industrial companies and VTT Technical Research Centre of Finland is gratefully acknowledged.
Reference list
1. Höhn, B.-R. & Michaelis, K. 2004. Influence of oil temperature on gear failures. Tribology International, Vol. 37, pp. 103109.

288
2. Oila, A. & Bull, S. J. 2004. Assessment of the factors influencing micropitting in rolling/sliding contacts. Wear. 15 p. (In press).
3. Olver, A. V. 2002. Gear lubrication a review. Proc Instn Mech Engrs, Part J: Journal of Engineering Tribology, Vol. 216, pp. 255267.
4. Cheng, H. S. 2001. Gears. In: Bhushan, B. (ed.) Modern Tribology Handbook, Vol. II, Materials, Coatings and Industrial Applications. CRC Press Boca Raton, USA. Pp. 10951129.
289
Corrosion risk prediction of stainless steel structures
Leena Carpén1, Pekka Pohjanne1, Petri Kinnunen1 & Tero Hakkarainen2 1VTT Technical Research Centre of Finland
Kemistintie 3, Espoo, P.O. Box 1000, FI-02044 VTT 2 Mäntyviita 3 A 2, FI-02110 Espoo
Abstract
Stainless steels are extensively used as construction materials in various environments due to their good corrosion resistance. However, localized corrosion of stainless steel may cause unexpected material failures in environments that, according to their chemical compositions, should be harmless. One explanation for this is that the solution in contact with the material concentrates because of water evaporation or precipitation. The aim of this study was to develop methods and procedures to verify the localized corrosion risk of stainless steel in concentrated solutions. The pitting corrosion susceptibility of stainless steel UNS S30400 (AISI 304, EN 1.4301) was evaluated as a function of chloride and sulphate concentration at temperatures up to 40 oC. Special attention was paid to concentrated solutions that can form due to extensive evaporation and contain precipitates. Based on the experimental work a localized corrosion database for pitting corrosion susceptibility of EN 1.4301 stainless steel was created. A quantitative corrosion risk prediction approach is presented and a quantitative corrosion risk model for pitting corrosion susceptibility of EN 1.4301 stainless steel that considers the relationships between different variables is described.
Introduction
Stainless steels are nowadays used in diverse environments and applications due to their good corrosion resistance. In some cases, however, pitting, crevice corrosion and stress corrosion cracking may cause unexpected failures even in environments considered harmless. The risk for failures increases if there is a possibility for the solution to concentrate due to evaporation of water. Because
290
of the evaporation, some salts may start to precipitate and thus the ionic ratios of the solution can change in an unexpected way.
The most important anions in consideration of localized corrosion of stainless steels in water environments are sulphates and chlorides. It is generally known that the risk of localized corrosion of stainless steels increases with increasing chloride concentration and decreases with increasing sulphate/chloride ratio [1]. Increasing temperature and/or oxidizing environment are also known to increase the susceptibility to corrosion [1]. Precipitation of sulphur compounds, for instance, can remarkably change the ionic relationship between chlorides and sulphates. The role of cations must not be neglected, since cations affect the solubility of compounds. The most common cations in natural waters are sodium and calcium. The solubility of calcium sulphate in water is crucially smaller than that of sodium sulphate. Therefore, water with a calcium concentration high enough gradually changes to an almost pure chloride solution when water is evaporated from the solution. This can happen even if the concentration of sulphate in the beginning would have been multifold compared to that of chloride. The corrosion failures detected on the splash zones of paper machines are one type of example of phenomenon caused by evaporation [2].
It is expected that when the use of stainless steels increases in various atmospheric applications, like cars and supporting structures of buildings, the possibility of localized corrosion failures resulting from concentrated solutions increases. A number of catastrophic stress corrosion cracking failures of stainless steel swimming pool roof constructions in Europe during the last two decades are unfortunate examples of the way the localized corrosion may have an effect [3].
The aim of this study was to develop methods and procedures to verify the localized corrosion risk of stainless steels in concentrated solutions. The pitting corrosion susceptibility of stainless steel UNS S30400 (AISI 304, EN 1.4301) was evaluated as a function of chloride and sulphate concentration at temperatures up to 40 °C. Special attention was paid to concentrated solutions, which can form due to extensive evaporation and also contain precipitates. Based on the experimental work a localized corrosion database for pitting corrosion susceptibility of EN 1.4301 stainless steel was created. A quantitative corrosion risk prediction approach is presented and a quantitative corrosion risk
291
model for pitting corrosion susceptibility of EN 1.4301 stainless steel considering the relationships between different variables is described.
Experimental
The material used in this study was EN 1.4301 (AISI 304) stainless steel sheet (2.0 mm) manufactured by Outokumpu Stainless Oy. The main components, %, w/w of the steel were as following: 0.049 C, 0.50 Si, 1.59 Mn, 0.038 P, 0.002 S, 18.2 Cr and 8.1 Ni. All experiments were performed in the as-received state (cold-rolled, heat-treated, pickled and skin-passed, surface finish 2B). Prior to experiments the surfaces were only cleaned with acetone, rinsed with water and ethanol and air dried.
The pitting corrosion studies were performed using a special test cell, which allows the simulation of stagnant conditions, avoids crevice corrosion and eliminates the effect of convection (Figure 1). Test solutions were made of distilled water and sodium chloride (NaCl) and sodium sulfate (Na2SO4). The chloride content varied from 0.005 mol/l (178 mg/l) to 5 mol/l (177 500 mg/l) at room temperature and from 0.002 mol/l (71 mg/l) to 5 mol/l at 40 °C. The concentration of sulfate varied from 0 to 1 mol/l (098 000 mg/l), the smallest amount added being 0.01 mol/l (960 mg/l). The molar ratio of sulfate to chloride was between 0.01 and 2 at both temperatures. For comparison some tests were also performed in pure chloride solutions with concentrations of 0.02, 2 and 5 mol/l at room temperature and with concentrations of 0.002, 0.01, 0.1, 1, 2 and 5 mol/l of Cl- at 40 °C. The used concentrations expressed in g/l are summarized in Table 1.
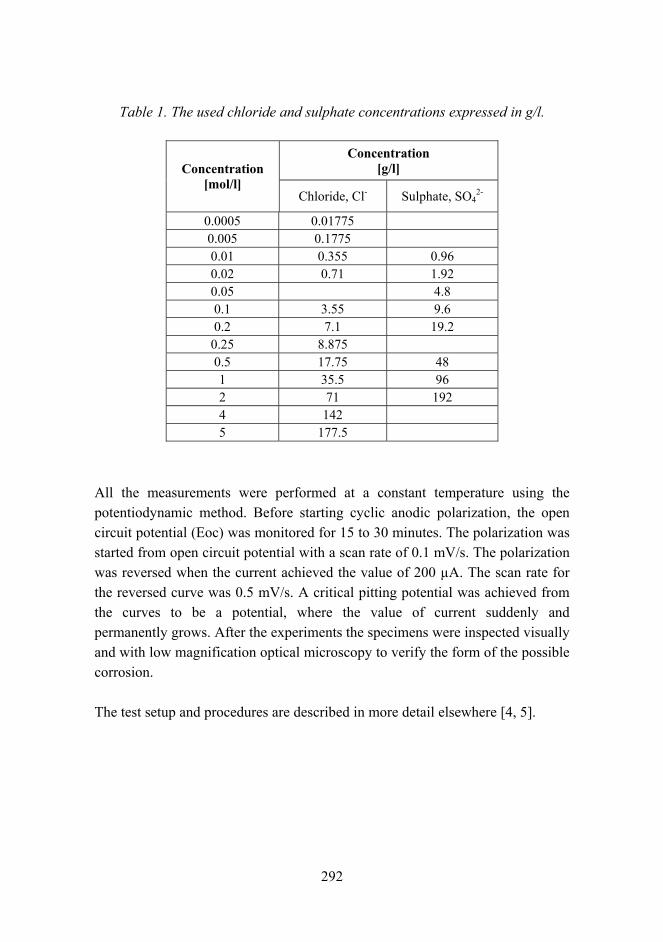
292
Table 1. The used chloride and sulphate concentrations expressed in g/l.
Concentration [g/l] Concentration
[mol/l] Chloride, Cl- Sulphate, SO4
2-
0.0005 0.01775 0.005 0.1775 0.01 0.355 0.96 0.02 0.71 1.92 0.05 4.8 0.1 3.55 9.6 0.2 7.1 19.2
0.25 8.875 0.5 17.75 48 1 35.5 96 2 71 192 4 142 5 177.5
All the measurements were performed at a constant temperature using the potentiodynamic method. Before starting cyclic anodic polarization, the open circuit potential (Eoc) was monitored for 15 to 30 minutes. The polarization was started from open circuit potential with a scan rate of 0.1 mV/s. The polarization was reversed when the current achieved the value of 200 µA. The scan rate for the reversed curve was 0.5 mV/s. A critical pitting potential was achieved from the curves to be a potential, where the value of current suddenly and permanently grows. After the experiments the specimens were inspected visually and with low magnification optical microscopy to verify the form of the possible corrosion.
The test setup and procedures are described in more detail elsewhere [4, 5].
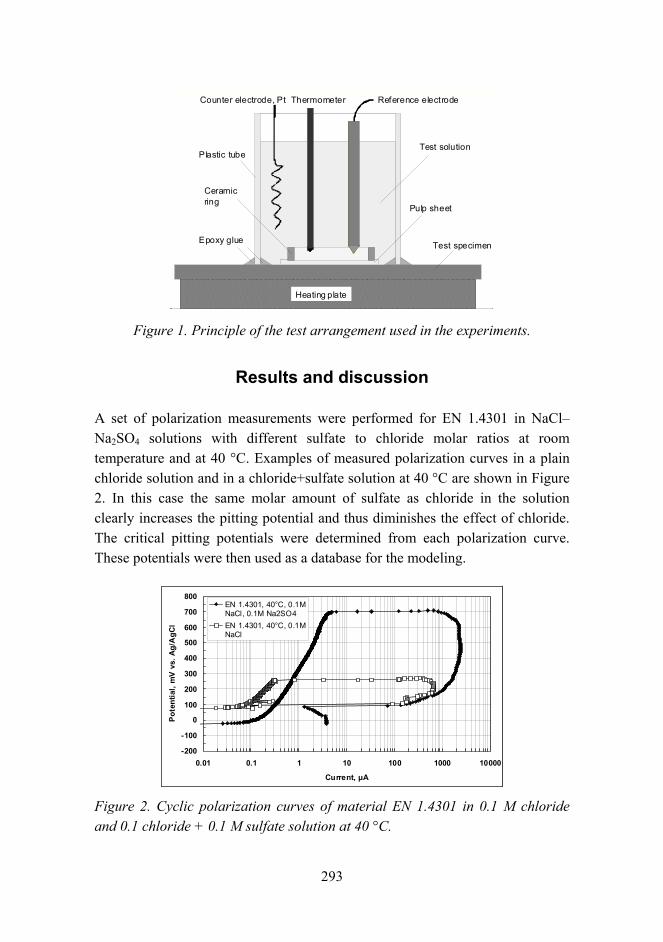
293
Lämpölevy
Näytelevy
Vas taelek trodi (Pt)
Koeliuos
Muoviputki
Lämpömit tari
Sellumassaa
Epoksiliimaa
Vertailuelektrodi
Heating plate
Test specimen
Counter electrode, Pt
Test solutionPlastic tube
Thermometer
Pulp sheet
Epoxy glue
Reference electrode
Ceramic ring
Lämpölevy
Näytelevy
Vas taelek trodi (Pt)
Koeliuos
Muoviputki
Lämpömit tari
Sellumassaa
Epoksiliimaa
Vertailuelektrodi
Heating plate
Test specimen
Counter electrode, Pt
Test solutionPlastic tube
Thermometer
Pulp sheet
Epoxy glue
Reference electrode
Ceramic ring
Figure 1. Principle of the test arrangement used in the experiments.
Results and discussion
A set of polarization measurements were performed for EN 1.4301 in NaClNa2SO4 solutions with different sulfate to chloride molar ratios at room temperature and at 40 °C. Examples of measured polarization curves in a plain chloride solution and in a chloride+sulfate solution at 40 °C are shown in Figure 2. In this case the same molar amount of sulfate as chloride in the solution clearly increases the pitting potential and thus diminishes the effect of chloride. The critical pitting potentials were determined from each polarization curve. These potentials were then used as a database for the modeling.
-200
-100
0
100
200
300
400
500
600
700
800
0.01 0.1 1 10 100 1000 10000
Current, µA
Pote
ntia
l, m
V vs
. Ag/
AgC
l
EN 1.4301, 40°C, 0.1MNaCl, 0.1M Na2SO4 EN 1.4301, 40°C, 0.1MNaCl
Figure 2. Cyclic polarization curves of material EN 1.4301 in 0.1 M chloride and 0.1 chloride + 0.1 M sulfate solution at 40 °C.
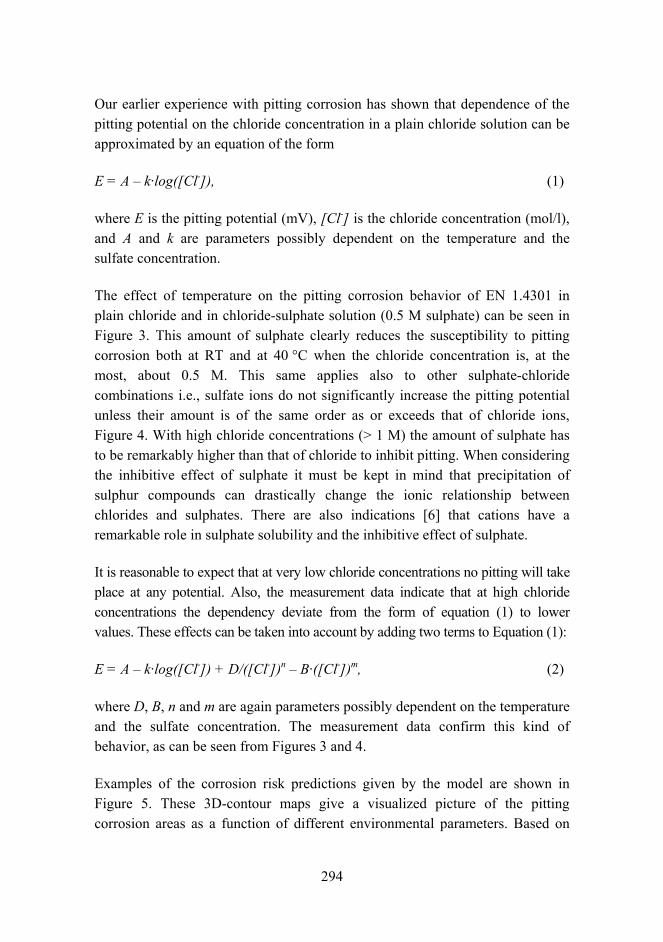
294
Our earlier experience with pitting corrosion has shown that dependence of the pitting potential on the chloride concentration in a plain chloride solution can be approximated by an equation of the form
E = A k·log([Cl-]), (1)
where E is the pitting potential (mV), [Cl-] is the chloride concentration (mol/l), and A and k are parameters possibly dependent on the temperature and the sulfate concentration.
The effect of temperature on the pitting corrosion behavior of EN 1.4301 in plain chloride and in chloride-sulphate solution (0.5 M sulphate) can be seen in Figure 3. This amount of sulphate clearly reduces the susceptibility to pitting corrosion both at RT and at 40 °C when the chloride concentration is, at the most, about 0.5 M. This same applies also to other sulphate-chloride combinations i.e., sulfate ions do not significantly increase the pitting potential unless their amount is of the same order as or exceeds that of chloride ions, Figure 4. With high chloride concentrations (> 1 M) the amount of sulphate has to be remarkably higher than that of chloride to inhibit pitting. When considering the inhibitive effect of sulphate it must be kept in mind that precipitation of sulphur compounds can drastically change the ionic relationship between chlorides and sulphates. There are also indications [6] that cations have a remarkable role in sulphate solubility and the inhibitive effect of sulphate.
It is reasonable to expect that at very low chloride concentrations no pitting will take place at any potential. Also, the measurement data indicate that at high chloride concentrations the dependency deviate from the form of equation (1) to lower values. These effects can be taken into account by adding two terms to Equation (1):
E = A k·log([Cl-]) + D/([Cl-])n B·([Cl-])m, (2)
where D, B, n and m are again parameters possibly dependent on the temperature and the sulfate concentration. The measurement data confirm this kind of behavior, as can be seen from Figures 3 and 4.
Examples of the corrosion risk predictions given by the model are shown in Figure 5. These 3D-contour maps give a visualized picture of the pitting corrosion areas as a function of different environmental parameters. Based on
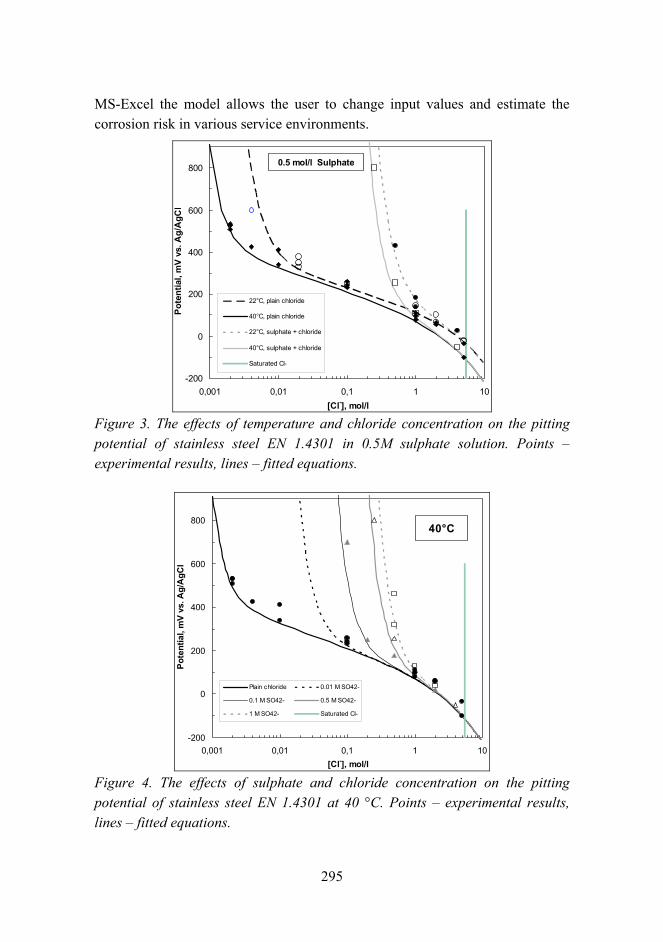
295
MS-Excel the model allows the user to change input values and estimate the corrosion risk in various service environments.
-200
0
200
400
600
800
0,001 0,01 0,1 1 10[Cl-], mol/l
Pote
ntia
l, m
V vs
. Ag/
AgC
l
22°C, plain chloride
40°C, plain chloride
22°C, sulphate + chloride
40°C, sulphate + chloride
Saturated Cl-
0.5 mol/l Sulphate
Figure 3. The effects of temperature and chloride concentration on the pitting potential of stainless steel EN 1.4301 in 0.5M sulphate solution. Points experimental results, lines fitted equations.
-200
0
200
400
600
800
0,001 0,01 0,1 1 10[Cl-], mol/l
Pote
ntia
l, m
V vs
. Ag/
AgC
l
Plain chloride 0.01 M SO42-
0.1 M SO42- 0.5 M SO42-
1 M SO42- Saturated Cl-
40°C
Figure 4. The effects of sulphate and chloride concentration on the pitting potential of stainless steel EN 1.4301 at 40 °C. Points experimental results, lines fitted equations.
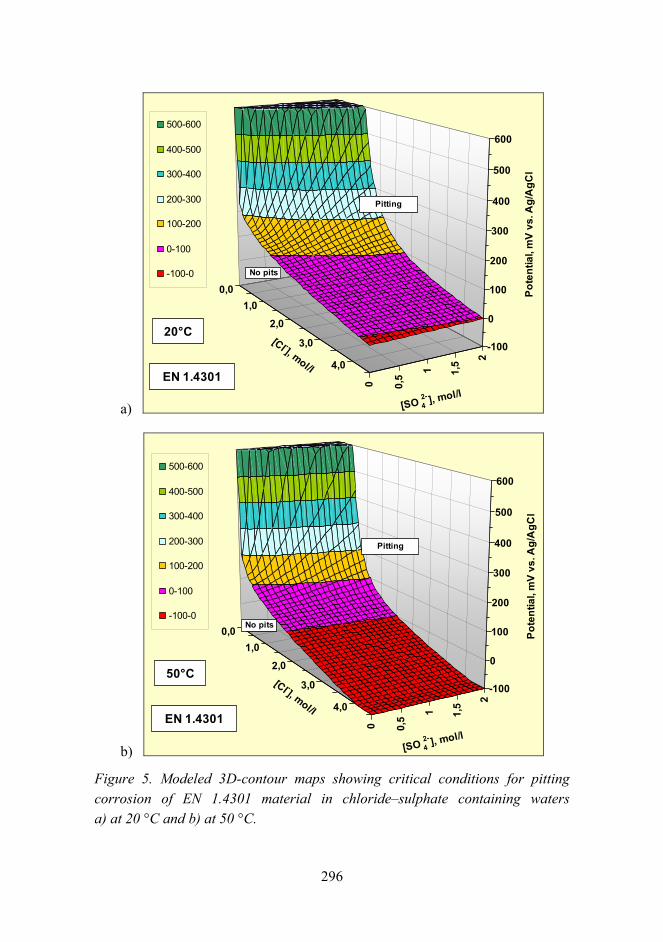
296
a)
0,01,0
2,0
3,0
4,00 0,
5 1 1,5 2
-100
0
100
200
300
400
500
600
Pote
ntia
l, m
V v
s. A
g/A
gCl
[Cl -], mol/l
[SO 42- ], mol/l
500-600
400-500
300-400
200-300
100-200
0-100
-100-0
20°C
EN 1.4301
No pits
Pitting
b)
0,01,0
2,0
3,0
4,0
0 0,5 1 1,
5 2
-100
0
100
200
300
400
500
600
Pote
ntia
l, m
V vs
. Ag/
AgC
l
[Cl -], mol/l
[SO 42- ], mol/l
500-600
400-500
300-400
200-300
100-200
0-100
-100-0
50°C
EN 1.4301
No pits
Pitting
Figure 5. Modeled 3D-contour maps showing critical conditions for pitting corrosion of EN 1.4301 material in chloridesulphate containing waters a) at 20 °C and b) at 50 °C.
297
Conclusions
From the results the following conclusions can be drawn:
• The test arrangement developed was found to be successful for studying the pitting corrosion, simulating the stagnant conditions and avoiding the crevice corrosion.
• With moderate chloride concentrations (≤ 0.5 M) sulfate significantly increases the pitting potential when its amount is of the same order as or exceeds that of chloride.
• With high chloride concentrations (> 1 M) the amount of sulphate has to be remarkably higher than that of chloride to inhibit pitting.
• A quantitative model considering the relationships between different variables (potential, chloride and sulfate concentration and temperature) affecting the pitting corrosion of EN 1.4301 stainless steel is developed.
• The model enables the making of corrosion risk predictions in waters with different chloridesulphate contents and temperatures.
Acknowledgement
Financial support from Tekes the Finnish Funding Agency for Technology and Innovation as well as the Finnish companies Outokumpu Stainless Oy, Kemira Oyj, Rautaruukki Oyj and Finnish Constructional Steel-work Association is gratefully acknowledged. Päivi Varis is thanked for the metallography. The authors thank for Tuomo Kinnunen and Kirsti Nöjd for their skillful assistance in the experimental work.
Reference list
1. Sedriks, J. A. 1979. Corrosion of stainless steels. John Wiley & Sons, New York. 282 p.
298
2. Carpen, L., Raaska, L., Kujanpää, K., Mattila, K., Uutela, P., Salkinoja-Salonen, M. & Hakkarainen, T. Laboratory simulator for splash zone biofouling and corrosion in paper machine environment. 10th International Symposium on Corrosion in the Pulp and Paper Industry. Helsinki, 2124 August 2001. Pp. 587598.
3. Oldfield, J. W. & Todd, B. 1991. Stress Corrosion Cracking of Austenitic Stainless Steel in Atmospheres in Indoor Swimming Pools. Proc. of Int. Conf. of Stainless Steels, Chiba, 1991. Pp. 204213.
4. Kinnunen, P., Carpén, L., Hakkarainen, T., Sarpola, A., Riihimäki, M., Rämö, J. & Pohjanne, P. 2005. Susceptibility of EN 1.4301 stainless steel to pitting corrosion in concentrated solutions. Eurocorr 2005, Lisbon, Portugal, 48 September 2005. 10 p.
5. Carpén, L., Kinnunen, P., Hakkarainen, T., Sarpola, A., Riihimäki, M., Rämö, J. & Pohjanne, P. 2006. Prediction of corrosion risk of stainless steel in concentrated solutions. Corrosion 2006, San Diego, CA, 1216 March, 2006. 12 p.
6. Pohjanne, P., Carpén, L., Kinnunen, P., Rämö, J., Sarpola, A., Riihimäki, M. & Hakkarainen, T. Stainless steel pitting in chloride sulphate solutions The role of cations. Proposal to Corrosion 2007. Nashville, TN, 1115 March, 2007.
299
Repository tunnel backfill material tests in-situ
Leena Korkiala-Tanttu
VTT Technical Research Centre of Finland Lämpömiehenkuja 2 C, Espoo, P.O. Box 1000, FI-02044 VTT
Abstract
Methods for backfilling nuclear waste repository tunnels have been studied in cooperation between Finland and Sweden. The study concentrates on the backfilling of bentonite crushed rock mixture (30%/70%) and compaction methods on site. Strict criteria have been set for the backfill in order to maintain the long term properties. For example, the hydraulic conductivity (k) of the backfill material has to be lower than 1·10-10 m/s. This means that the mixture needs to be compacted to a very high dry density. The main objective of the study was to develop compaction methods and to collect data for compaction modelling. Two test structures were constructed: one with horizontal and one with inclined (about 30°) layers with thickness of 200...250 mm. Four types of compaction equipments were used: a vibrating plate, a modified roof compactor, a multipurpose compactor and a heavy roller. With these methods the target density could not be achieved. Yet, reasonably high densities were obtained. The highest average dry densities were achieved with the heavy roller. The target degree of compaction (90%) was achieved with the heavy roller. Horizontal compaction with a vibratory plate proved to be nearly as efficient as the heavy roller. The bentonite crushed rock mixture proved to be very sensitive to the excess of optimum water content.
Introduction
In situ backfilling has been used as a reference concept of backfilling the deep repository [1]. In situ backfilling to inclined layers with a mixture of crushed rock and bentonite has been studied in several field and laboratory tests (reference backfill and plug, prototype repository, etc.) (for example, see [1]). Inclined layers have been selected as the main alternative due to the following facts:
300
• the space above the deposition hole up to the roof will be backfilled quickly
• inclined layers are not as sensitive for groundwater dripping to the tunnel as horizontal layers
• testing has been showed that the method is feasible and fulfils the requirements when salinity is maxium TDS 1g/l.
The field test construction had two targets. The first objective was to acquire parameters for the modeling of compaction of backfill. The modeling will be done at the University of Vienna by Professor Dietmar Adam. The results will be reported separately. The second objective was to test different compaction methods and to develop them further. The tested compactors included a modified roof compactor (tested previously in the Prototype tests at Äspö) in order to see if the equipment can be used also for compacting the main part of the slope. Other tested compactors were vibratory plate, multipurpose compactor and a bigger roller.
The field tests were performed in two stages: 10.11.11.2005 and 28.11.2005. During the first stage, two different types of vibratory plate were tested. A modified roof compactor was tested to study the compaction procedure of the inclined structure. A plate compactor was tested in a horizontal structure mostly to produce data for modeling. During the second stage two types of compactors were tested to observe the applicability of these methods in inclined layers. The test results are reported in more detail elsewhere [3].
Test site and tested material
The test site was located next to Ekokem Oys production facility at Riihimäki. The test site was an indoor hall, which had a floor of asphalt concrete with fringe areas about 2 meters high, and sloped 1:1.5. Two different test embankments with horizontal and inclined layers were constructed.
The general requirements of the backfill material are presented in Posivas working report [2]. The maximum grain size of the backfill material in this test construction was 8 mm. Otherwise, there were no special requirements on the grain size distribution of the material. Posiva Oy provided the used crushed rock from the ONKALO project in Olkiluoto. The used bentonite was activated
301
Ca-bentonite from Milos Greece (AC-200). The backfill material included 30 weight-% of bentonite and 70 weight-% of crushed rock. The target water content of the mixture was about 12%, which was the assumed optimum value of the mixture according to the tests [2]. The target dry density of the compacted backfill material was 1.9 tn/m3. The mixture can be described as a semi-cohesive material with low plasticity.
The water content of the mixture was determined with three different methods (infrared, micro & drying oven). The mixture was very sensitive to water content. If the water content was too high, the material turned lumpy. The water content of the approved mixture varied between 11.5%13% while most of the values were between 11.5%12%. The mixing plant was a modified concrete mixing plant with silos for bentonite and crushed rock. The bentonite was added to the mix at the same time with the water.
Tested equipments
The inclined test construction was compacted with a vibratory plate compactor from Halltek (later roof compactor) provided and developed by Halltek AB. The vibratory plate used was a modified version of the roof compactor tested at the Prototype repository at Äspö HRL. The plate had a weight of 450 kg (excluding the extension arm), a vibrating weight of 293 kg, a frequency of 43 Hz and an amplitude of 2.6 mm. The plate was modified by changing the shape of the foot of the plate. The width of the foot was 800 mm. The vibratory plate was attached to the carrier of a Gradall XL3300 excavator with a telescopic boom. The boom of the carrier was provided with a quick-disconnect fitting enabling fast change of equipment (e.g., bucket/plate).
The vibratory plate tested for the horizontal layer compaction was a Dynapac LH700 (later LH700) with a net weight of 765 kg, a frequency of 53 Hz and an amplitude of 2.5 mm. The width of the plate was 660 mm and the length was 1050 mm.
The lightweight padfoot compactor tested was a BOMAG multipurpose compactor BMP851 (later BMP851) with a weight of approximately 1.5 t. The height of the compactor was 1.2 m and the width of the drum 610 mm. The
302
compaction frequency of the multipurpose compactor was 32 Hz and the amplitude was 2.1 mm.
The other tested compactor used was a BOMAG vibratory roller BW211-D3 (later roller 13 tn), with a weight of approximately 13 t. The compaction frequency of BW211-3 was 36 Hz and the amplitude 0.91.8 mm.
Measurements and sampling
The densities of the compacted layers were measured with both Troxler and sand volumeter tests. The volumeter tests were laborious, thus the test holes remained quite small. Thus, it is probable that the volumeter test results underestimate the density. Since Troxler measures the hydrogen content, and because the bentonite itself includes hydrogen, the on-line measured water contents were too high. That is why the water contents and dry densities had to be corrected.
The parameters for the modeling (deflection and stiffness modulus E after different passes) were measured with a Light Drop Weight Tester (LDWT). For comparison, deflections were measured also with a Loadman, which is a lightweight portable deflectometer. LDWT and Loadman tests were also done from the test cuttings of the inclined structure.
The target thickness of the layers was 200 mm with a tolerance of 50 mm (totally 150250 mm). The thickness was measured with a simple stick before compaction and occasionally also after compaction. The mixture was sampled for later laboratory tests.
Compaction of inclined structure
The mixed material for each layer was laid with the help of an excavator. The material was laid against the fringe slope. The target thickness of the compacted layer was 200...250 mm. The principal cross section of the construction is illustrated in Figure 1.
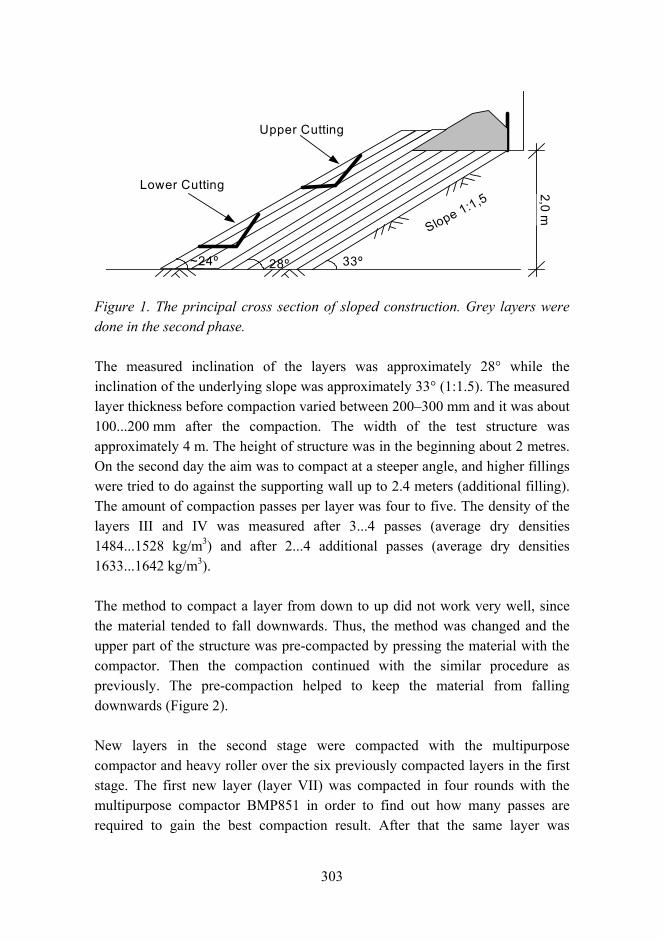
303
Slope 1:1,5
2,0 m
Lower Cutting
33º28º
Upper Cutting
~24º
Figure 1. The principal cross section of sloped construction. Grey layers were done in the second phase.
The measured inclination of the layers was approximately 28° while the inclination of the underlying slope was approximately 33° (1:1.5). The measured layer thickness before compaction varied between 200300 mm and it was about 100...200 mm after the compaction. The width of the test structure was approximately 4 m. The height of structure was in the beginning about 2 metres. On the second day the aim was to compact at a steeper angle, and higher fillings were tried to do against the supporting wall up to 2.4 meters (additional filling). The amount of compaction passes per layer was four to five. The density of the layers III and IV was measured after 3...4 passes (average dry densities 1484...1528 kg/m3) and after 2...4 additional passes (average dry densities 1633...1642 kg/m3).
The method to compact a layer from down to up did not work very well, since the material tended to fall downwards. Thus, the method was changed and the upper part of the structure was pre-compacted by pressing the material with the compactor. Then the compaction continued with the similar procedure as previously. The pre-compaction helped to keep the material from falling downwards (Figure 2).
New layers in the second stage were compacted with the multipurpose compactor and heavy roller over the six previously compacted layers in the first stage. The first new layer (layer VII) was compacted in four rounds with the multipurpose compactor BMP851 in order to find out how many passes are required to gain the best compaction result. After that the same layer was
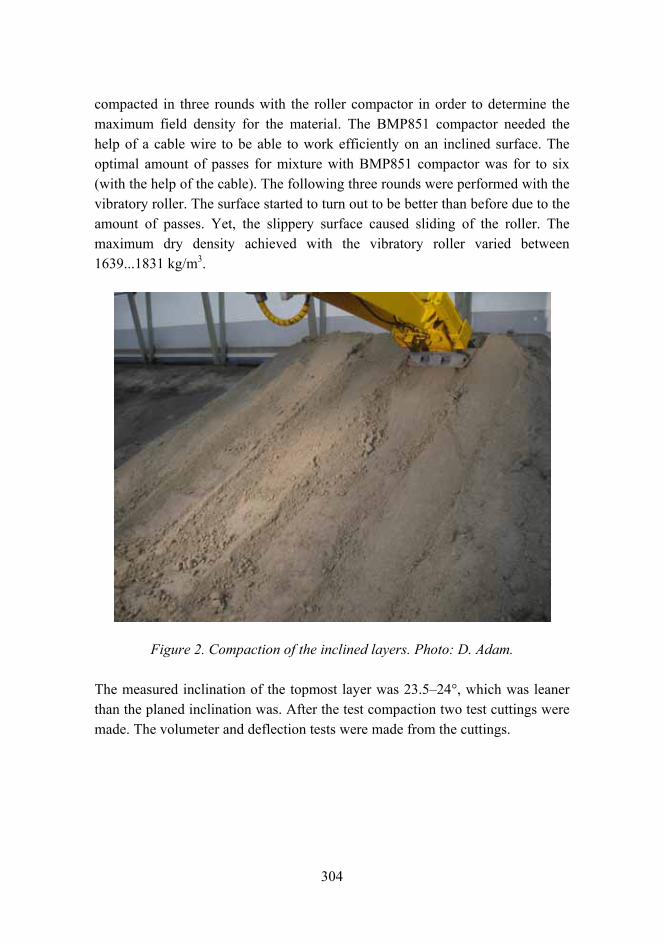
304
compacted in three rounds with the roller compactor in order to determine the maximum field density for the material. The BMP851 compactor needed the help of a cable wire to be able to work efficiently on an inclined surface. The optimal amount of passes for mixture with BMP851 compactor was for to six (with the help of the cable). The following three rounds were performed with the vibratory roller. The surface started to turn out to be better than before due to the amount of passes. Yet, the slippery surface caused sliding of the roller. The maximum dry density achieved with the vibratory roller varied between 1639...1831 kg/m3.
Figure 2. Compaction of the inclined layers. Photo: D. Adam.
The measured inclination of the topmost layer was 23.524°, which was leaner than the planed inclination was. After the test compaction two test cuttings were made. The volumeter and deflection tests were made from the cuttings.
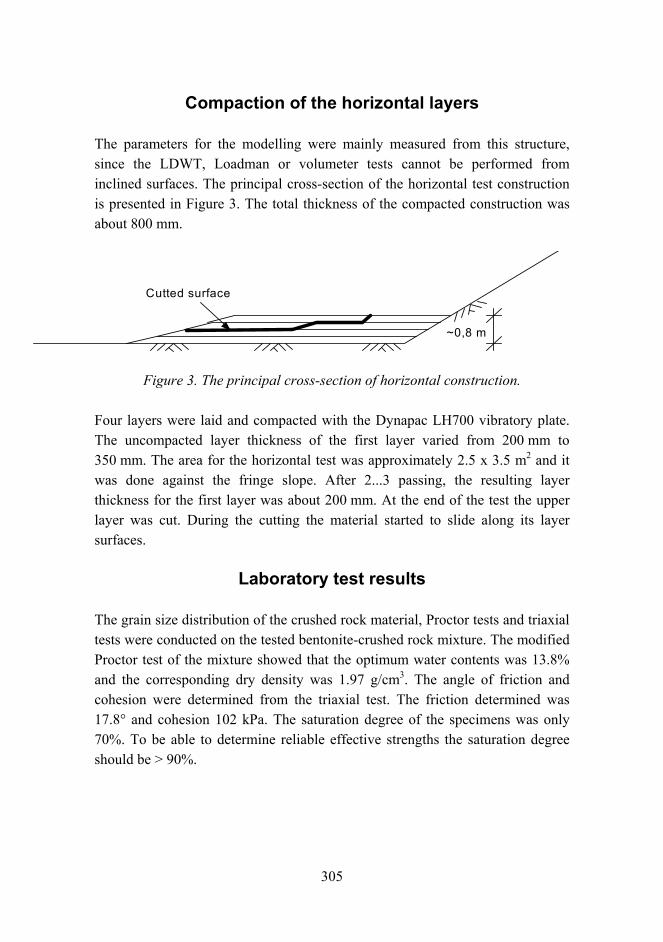
305
Compaction of the horizontal layers
The parameters for the modelling were mainly measured from this structure, since the LDWT, Loadman or volumeter tests cannot be performed from inclined surfaces. The principal cross-section of the horizontal test construction is presented in Figure 3. The total thickness of the compacted construction was about 800 mm.
~0,8 m
Cutted surface
Figure 3. The principal cross-section of horizontal construction.
Four layers were laid and compacted with the Dynapac LH700 vibratory plate. The uncompacted layer thickness of the first layer varied from 200 mm to 350 mm. The area for the horizontal test was approximately 2.5 x 3.5 m2 and it was done against the fringe slope. After 2...3 passing, the resulting layer thickness for the first layer was about 200 mm. At the end of the test the upper layer was cut. During the cutting the material started to slide along its layer surfaces.
Laboratory test results
The grain size distribution of the crushed rock material, Proctor tests and triaxial tests were conducted on the tested bentonite-crushed rock mixture. The modified Proctor test of the mixture showed that the optimum water contents was 13.8% and the corresponding dry density was 1.97 g/cm3. The angle of friction and cohesion were determined from the triaxial test. The friction determined was 17.8° and cohesion 102 kPa. The saturation degree of the specimens was only 70%. To be able to determine reliable effective strengths the saturation degree should be > 90%.
306
Discussion
The measured water contents of the mixture mass before the test was on average 12.2% and after the test the average was 11.6%. The mixed material was very sensitive to the excess of water. If the water content was higher than about 13...13.5%, the material gained a lumpy consistency and stuck to the compaction plate. The stuck mass had to be removed manually from the plate. The compaction of the lumpy mass was more difficult and much slower than the mass in the optimum water content. Yet, the reached dry densities were about the same as in other layers. Similar problems were not observed with the multipurpose compactor.
The deflections were measured with the LDWT and Loadman. The average value of the LDWT stiffness modulus of inclined measurements (2 points) was 35.3 MPa and of the horizontal structure after 6...9 passes 70.4 MPa. The corresponding Loadman stiffness modulus of the horizontal structure after 6...9 passes was 66.7 MPa and of the inclined structure with multipurpose and roller compaction 69.4 MPa.
The compaction tests proved that the optimum amount of passes was about 4 to 6 passes per layer. More compaction did not improve the density or even made it worse. The total average of the dry densities was 1572 kg/m3 and wet densities 1742 kg/m3. The highest dry density measured was 1793 kg/m3 and the lowest only 1342 kg/m3. In general, the densities achieved were somewhat lower than the ones gained in the Prototype repository (for the sloped structure with a coarser material and a heavier compactor).
The roof compactor seemed to work relatively well. The telescope boom seemed to be suitable for backfilling of inclined layers. Despite of the efforts to toughen the inclination of the slope to 3334° the measured inclination was about 28° (1:1.9). Besides these, the speed of the roof compactor could also be increased without lower compaction result.
During the test period the heavier roller performed quite well and the achieved dry densities were quite promising varying between 1639...1831 kg/m3. A thin film of water was observed occasionally on the compacted surface with both compactor, but in a bigger amount with the heavier roller. The separation of
307
water may indicate that the water content may have been too high. However, based on the compaction results, the effects of water separation were small or insignificant.
Both the roller and multipurpose compactor were sliding on the slippery surface. For a stable compaction work the multipurpose compactor had to be attached to the boom of an excavator with the help of a cable wire. Despite this, steering of the compactor was difficult. Additional layers were compacted with the multipurpose compactor. The dry densities varied from 1499...1652 kg/m3. The inclination of the topmost layer was 23.524°, which was leaner than the target inclination.
For horizontal layers the optimum amount of passes was about four to six passes per layer. The total average of the dry densities was bigger than in the sloped test structure 1612 kg/m3 and wet densities 1805 kg/m3. The highest dry density measured was 1809 kg/m3 and the lowest was 1362 kg/m3.
When the test structure was cut at the end of the test, the material slid along layer surfaces. This revealed that the contact between layers was distinct implying insufficient interlocking. The sliding reached out to the surface of the second layer.
Conclusions
A comparison of the tested equipments and methods is presented in Table 1.
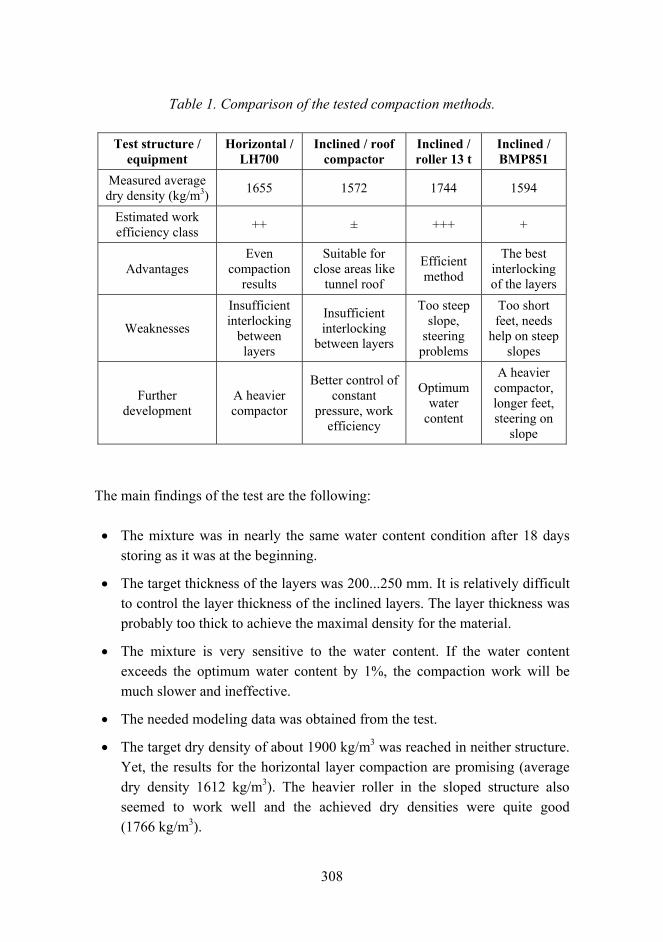
308
Table 1. Comparison of the tested compaction methods.
Test structure / equipment
Horizontal / LH700
Inclined / roof compactor
Inclined / roller 13 t
Inclined / BMP851
Measured average dry density (kg/m3) 1655 1572 1744 1594
Estimated work efficiency class ++ ± +++ +
Advantages Even
compaction results
Suitable for close areas like
tunnel roof
Efficient method
The best interlocking of the layers
Weaknesses
Insufficient interlocking
between layers
Insufficient interlocking
between layers
Too steep slope,
steering problems
Too short feet, needs
help on steep slopes
Further development
A heavier compactor
Better control of constant
pressure, work efficiency
Optimum water
content
A heavier compactor, longer feet, steering on
slope
The main findings of the test are the following:
• The mixture was in nearly the same water content condition after 18 days storing as it was at the beginning.
• The target thickness of the layers was 200...250 mm. It is relatively difficult to control the layer thickness of the inclined layers. The layer thickness was probably too thick to achieve the maximal density for the material.
• The mixture is very sensitive to the water content. If the water content exceeds the optimum water content by 1%, the compaction work will be much slower and ineffective.
• The needed modeling data was obtained from the test.
• The target dry density of about 1900 kg/m3 was reached in neither structure. Yet, the results for the horizontal layer compaction are promising (average dry density 1612 kg/m3). The heavier roller in the sloped structure also seemed to work well and the achieved dry densities were quite good (1766 kg/m3).
309
• The inclination of the slope (23...24°) was too steep for the tested multicompactor. The use of the multipurpose roller for compacting inclined layers is possible with the help of a cable wire.
• The most efficient way to get the best results with inclined layers is to use a heavy roller. Promising results could also be achieved with a vibratory plate. The modified roof compactor was the slowest method with the lowest compaction degrees. However, this equipment is the only one that can be used for compacting the roof of the tunnel. The efficiency of the prototype plate can be further developed.
• The interlocking between layers was insufficient for the roof compactor, vibratory plate (LH700) and heavy roller.
• The equipment used was not optimized and therefore higher densities can be expected with optimized equipment and methods.
• More research is needed to develop the compaction methods further and to optimize the layer thickness and water content. The further development will be based on these results and the modelling.
• Even though the highest density requirements of the repository tunnel were not achieved, the test gave many positive results and proved that a relatively compact tunnel backfilling can be achieved with these methods. The used methods could be used in the compaction of backfilling of other deep excavations.
Acknowledgement
The author wants to thank Johanna Hansen from Posiva Oy, who financied the test project and Paula Keto from Saanio & Riekkola, who actively took part in the testing. Also the other participants of field and laboratory testing are thanked for their work.
Reference list
1. Gunnarsson, D., Börgesson, L., Keto, P., Tolppanen, P. & Hansen, J. 2004. Backfilling of the Deep Repository. Assessment of backfill concepts. Posiva Oy, Eurajoki. Working Report 2003-77.

310
2. Keto, P., Kuula-Väisänen, P. & Ruuskanen, J. Effect of material parameters on the compactibility of the backfill materials. Report will be published as part of Posivas working report series, 2006.
3. Korkiala-Tanttu, L., Keto, P., Kuula-Väisänen, P. & Vuorimies, N. Posiva-SKB project backfilling the deep repository. Test constructions in Field Conditions of backfill Baclo, Phase II, WP2, Step2. Test report for Field Tests on 10.11.200511.11.2005 and 28.11.2005. (Report will be published as Posiva working report series, 2006).
311
Tribological analysis of TiN and DLC coated contacts by 3D FEM stress modeling and fracture
toughness determination
Kenneth Holmberg, Helena Ronkainen, Anssi Laukkanen, Kim Wallin & Jari Koskinen
VTT Technical Research Centre of Finland Metallimiehenkuja 6, Espoo, P.O. Box 1000, FI-02044 VTT
Abstract
Surface coatings, like titanium nitride (TiN) and diamond-like carbon (DLC) coatings offer high wear resistance and low friction performance for a wide range of applications. By using new techniques such as modeling and simulation, the coating performance under load can be estimated and thus provide valuable information for the coating design and for the use of coatings in different applications.
A three-dimensional Finite Element Method (3D FEM) model has been developed for calculating both the first principal stress distribution and the true stress components in the scratch test contact as the spherical diamond tip moves with increased load on a titanium nitride (TiN) and diamond-like carbon (DLC) coated steel surface. The three dimensional model is comprehensive in the sense that it considers elastic, plastic and fracture behavior of the contacting surfaces. Three main regions of stress concentration during the scratching action has been identified and analyzed.
The first cracks to appear on the surface of a high-speed steel sample coated with a 2 µm TiN coating or 1 µm DLC coating are angular cracks on the edge of the scratch channel as the spherical diamond tip slides on the coated surface. This corresponds to the area of high two-directional stresses occurring at the side of the scratch channel. By identifying the location of the first crack and the crack density along the scratch channel and by using this as input data the fracture toughness of the coating can be evaluated. The influence of the coating thickness
312
and elastic modulus on the stresses and strains generated during the sliding process is demonstrated.
Introduction
Surface coatings have attracted great interest during the last decades and the use of the coatings has increased in mechanical components in engines and transmissions, in tools in the production industry, in disc drives in the computer industry, in precision instruments, and in human replacement organs. The advanced deposition techniques, such as chemical vapor deposition (CVD) and physical vapor deposition (PVD), offer a wide variety of possibilities to tailor surfaces with many different materials and structures.
The tribological contact with two surfaces loaded against each other in relative motion is a very complex system and the system becomes even more complex when coatings are introduced on the surfaces. The parameters used to describe friction and wear behavior in coated tribological contacts are not clear and when it comes to the material parameters, the diversity increases considerably [1]. The importance of expressing the material response of a coated surface in its basic material parameters − elasticity as elastic modulus, plasticity as hardness or shear strength and ductility as fracture toughness − has been emphasized [2, 3, 4]. Hardness is an important material parameter that is widely used and well defined by several in-depth studies [5, 6, 7]. Youngs modulus is another important and well defined material parameter [6, 8]. However, other parameters that attempt to describe the failure or fracture performance, such as the coating fracture toughness and load-carrying capacity, are less well defined and their role is more uncertain.
The objective of this work is to develop a method for optimizing the mechanical properties of a coated surface to be used in tribological contacts. In the research work the contact condition consists of a sphere sliding over a surface coated with a thin coating. A 3D Finite Element Model has been developed for calculating the first principal stress distribution in the contact of a spherical tip moving with increased load on coated steel surface. Two titanium nitride and diamond-like carbon coatings were used in the study. The model is comprehensive, since it considers elastic, plastic and fracture behavior of the contacted surface.
313
Contact system
The sliding spherical diamond tip deforms the surface both plastically and elastically as schematically shown in Figure 1. At the initial stage, with 5 N preload, a small spherical indent is formed and the plastic material flow pushes up material around the indent in a torus formed shape. As the tip moves forward a groove with increasing depth is formed. Under the tip both plastic and elastic deformation occur and behind the tip only the plastic deformation prevails in the surface. Another torus shape is formed in front of the tip.
The stress field in the coated surface is formed as a result of the following four effects.
Friction force: The friction force between the sliding tip and the surface creates compressive stresses by the pushing force in front of the tip and tensional stresses by the pulling force behind the tip.
Geometry: The elastic and plastic performance produce spherical indent, groove and torus shaped deformations on the surface during scratching. Deformations result in bending of the coating as shown in figure 1 and both compressive and tensile are generated.
Bulk plasticity concentration: The spherical indentation pattern causes the substrate to deform plastically, reaching its peak value at an angle of about 45° from the plane of symmetry in the plane of the coating.
Residual stresses: It is very common, especially for thin ceramic coatings, that they contain even very considerable compressive residual stresses due to the deposition process.
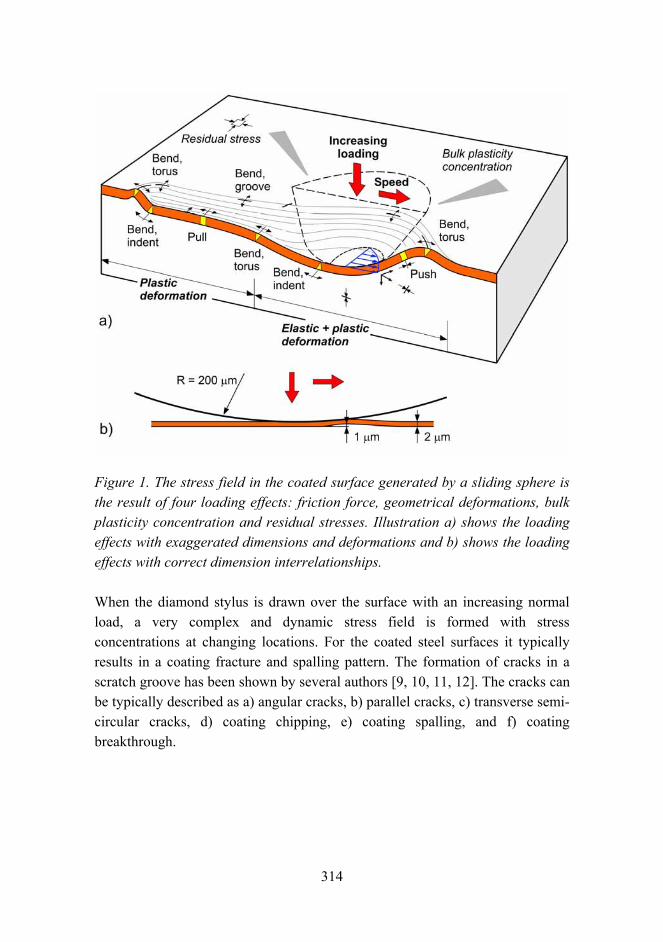
314
Figure 1. The stress field in the coated surface generated by a sliding sphere is the result of four loading effects: friction force, geometrical deformations, bulk plasticity concentration and residual stresses. Illustration a) shows the loading effects with exaggerated dimensions and deformations and b) shows the loading effects with correct dimension interrelationships.
When the diamond stylus is drawn over the surface with an increasing normal load, a very complex and dynamic stress field is formed with stress concentrations at changing locations. For the coated steel surfaces it typically results in a coating fracture and spalling pattern. The formation of cracks in a scratch groove has been shown by several authors [9, 10, 11, 12]. The cracks can be typically described as a) angular cracks, b) parallel cracks, c) transverse semi-circular cracks, d) coating chipping, e) coating spalling, and f) coating breakthrough.
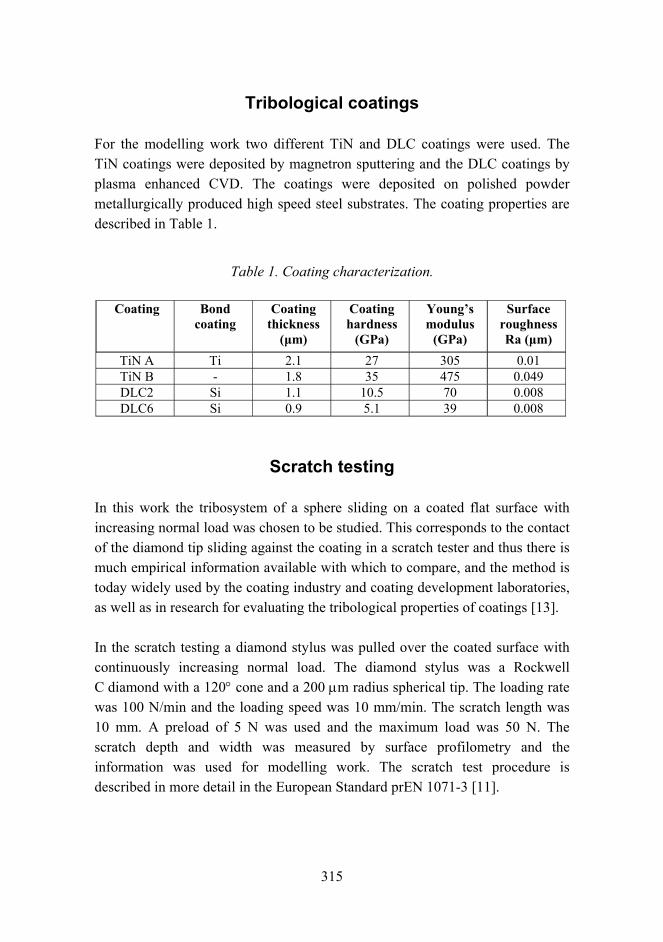
315
Tribological coatings
For the modelling work two different TiN and DLC coatings were used. The TiN coatings were deposited by magnetron sputtering and the DLC coatings by plasma enhanced CVD. The coatings were deposited on polished powder metallurgically produced high speed steel substrates. The coating properties are described in Table 1.
Table 1. Coating characterization.
Coating Bond coating
Coating thickness
(µm)
Coating hardness
(GPa)
Youngs modulus
(GPa)
Surface roughness Ra (µm)
TiN A Ti 2.1 27 305 0.01 TiN B - 1.8 35 475 0.049 DLC2 Si 1.1 10.5 70 0.008 DLC6 Si 0.9 5.1 39 0.008
Scratch testing
In this work the tribosystem of a sphere sliding on a coated flat surface with increasing normal load was chosen to be studied. This corresponds to the contact of the diamond tip sliding against the coating in a scratch tester and thus there is much empirical information available with which to compare, and the method is today widely used by the coating industry and coating development laboratories, as well as in research for evaluating the tribological properties of coatings [13].
In the scratch testing a diamond stylus was pulled over the coated surface with continuously increasing normal load. The diamond stylus was a Rockwell C diamond with a 120° cone and a 200 µm radius spherical tip. The loading rate was 100 N/min and the loading speed was 10 mm/min. The scratch length was 10 mm. A preload of 5 N was used and the maximum load was 50 N. The scratch depth and width was measured by surface profilometry and the information was used for modelling work. The scratch test procedure is described in more detail in the European Standard prEN 1071-3 [11].
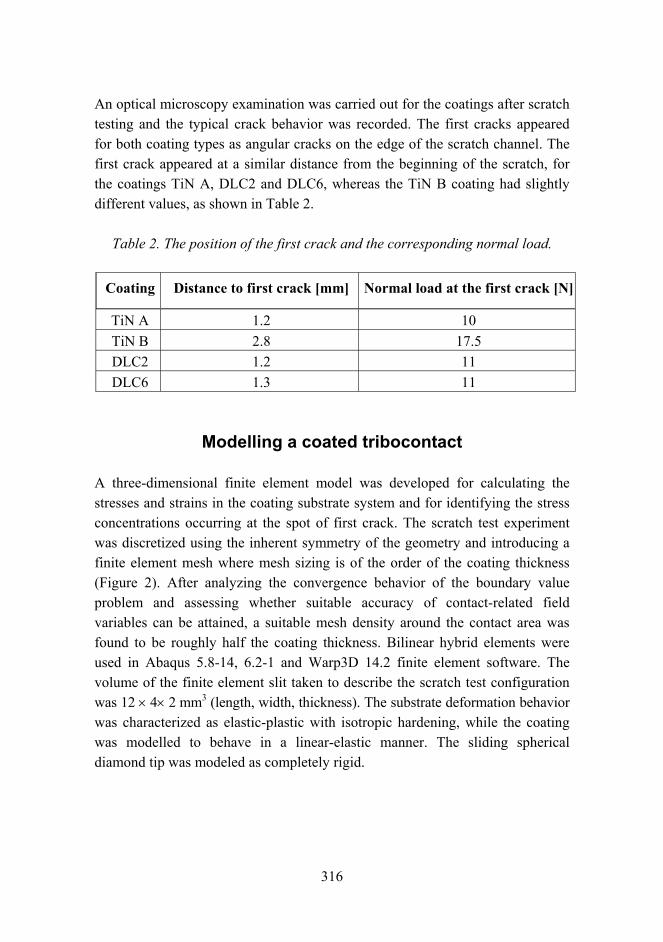
316
An optical microscopy examination was carried out for the coatings after scratch testing and the typical crack behavior was recorded. The first cracks appeared for both coating types as angular cracks on the edge of the scratch channel. The first crack appeared at a similar distance from the beginning of the scratch, for the coatings TiN A, DLC2 and DLC6, whereas the TiN B coating had slightly different values, as shown in Table 2.
Table 2. The position of the first crack and the corresponding normal load.
Coating Distance to first crack [mm] Normal load at the first crack [N]
TiN A 1.2 10 TiN B 2.8 17.5 DLC2 1.2 11 DLC6 1.3 11
Modelling a coated tribocontact
A three-dimensional finite element model was developed for calculating the stresses and strains in the coating substrate system and for identifying the stress concentrations occurring at the spot of first crack. The scratch test experiment was discretized using the inherent symmetry of the geometry and introducing a finite element mesh where mesh sizing is of the order of the coating thickness (Figure 2). After analyzing the convergence behavior of the boundary value problem and assessing whether suitable accuracy of contact-related field variables can be attained, a suitable mesh density around the contact area was found to be roughly half the coating thickness. Bilinear hybrid elements were used in Abaqus 5.8-14, 6.2-1 and Warp3D 14.2 finite element software. The volume of the finite element slit taken to describe the scratch test configuration was 12 × 4× 2 mm3 (length, width, thickness). The substrate deformation behavior was characterized as elastic-plastic with isotropic hardening, while the coating was modelled to behave in a linear-elastic manner. The sliding spherical diamond tip was modeled as completely rigid.
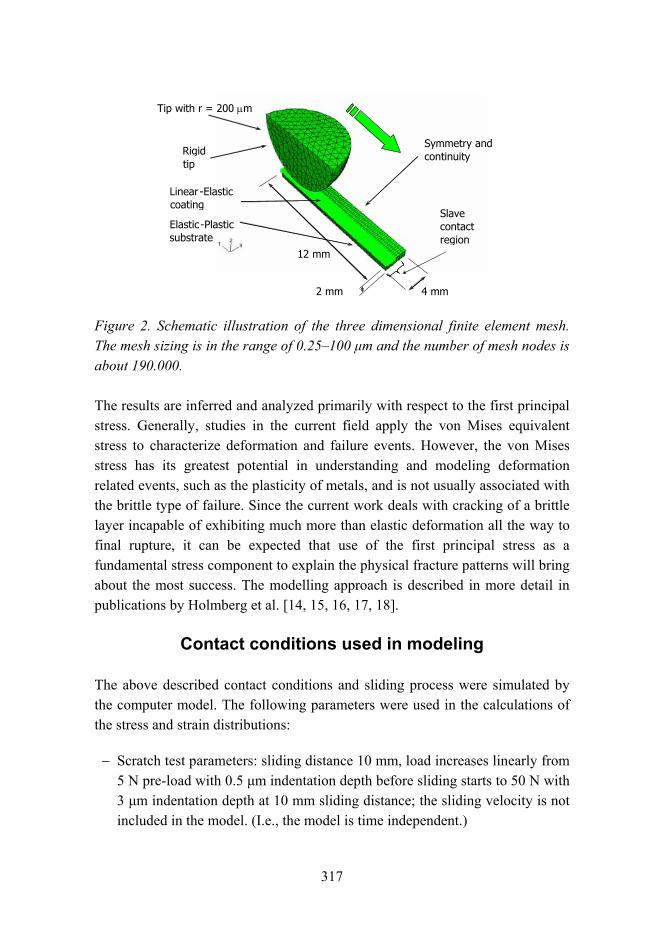
317
Figure 2. Schematic illustration of the three dimensional finite element mesh. The mesh sizing is in the range of 0.25100 µm and the number of mesh nodes is about 190.000.
The results are inferred and analyzed primarily with respect to the first principal stress. Generally, studies in the current field apply the von Mises equivalent stress to characterize deformation and failure events. However, the von Mises stress has its greatest potential in understanding and modeling deformation related events, such as the plasticity of metals, and is not usually associated with the brittle type of failure. Since the current work deals with cracking of a brittle layer incapable of exhibiting much more than elastic deformation all the way to final rupture, it can be expected that use of the first principal stress as a fundamental stress component to explain the physical fracture patterns will bring about the most success. The modelling approach is described in more detail in publications by Holmberg et al. [14, 15, 16, 17, 18].
Contact conditions used in modeling
The above described contact conditions and sliding process were simulated by the computer model. The following parameters were used in the calculations of the stress and strain distributions:
− Scratch test parameters: sliding distance 10 mm, load increases linearly from 5 N pre-load with 0.5 µm indentation depth before sliding starts to 50 N with 3 µm indentation depth at 10 mm sliding distance; the sliding velocity is not included in the model. (I.e., the model is time independent.)
Symmetry and continuity
Tip with r = 200 µm
Linear - Elastic coating Elastic - Plastic substrate
12 mm
4 mm2 mm
Rigid tip
Slave contact region
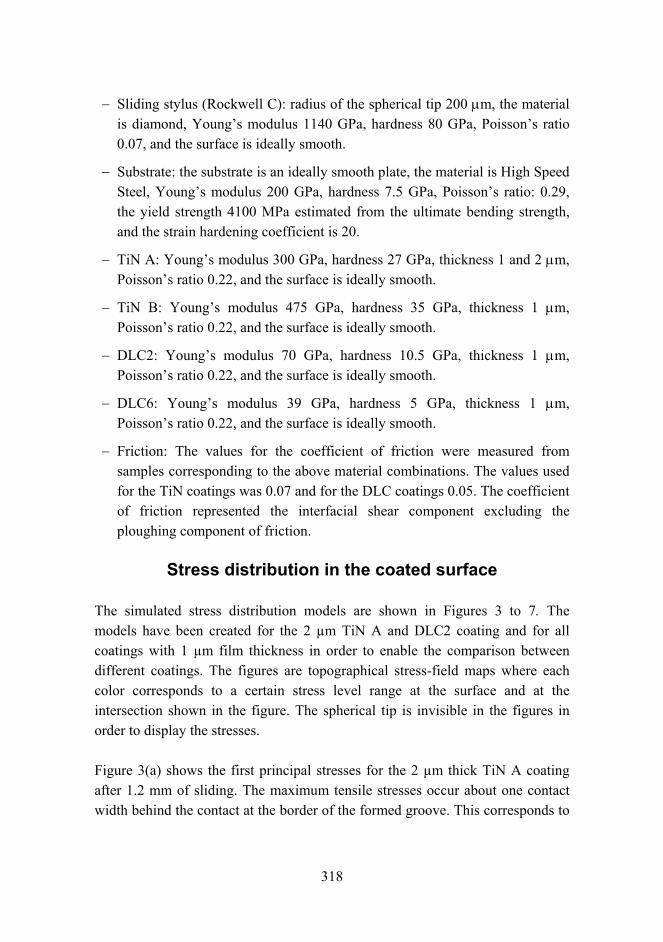
318
− Sliding stylus (Rockwell C): radius of the spherical tip 200 µm, the material is diamond, Youngs modulus 1140 GPa, hardness 80 GPa, Poissons ratio 0.07, and the surface is ideally smooth.
− Substrate: the substrate is an ideally smooth plate, the material is High Speed Steel, Youngs modulus 200 GPa, hardness 7.5 GPa, Poissons ratio: 0.29, the yield strength 4100 MPa estimated from the ultimate bending strength, and the strain hardening coefficient is 20.
− TiN A: Youngs modulus 300 GPa, hardness 27 GPa, thickness 1 and 2 µm, Poissons ratio 0.22, and the surface is ideally smooth.
− TiN B: Youngs modulus 475 GPa, hardness 35 GPa, thickness 1 µm, Poissons ratio 0.22, and the surface is ideally smooth.
− DLC2: Youngs modulus 70 GPa, hardness 10.5 GPa, thickness 1 µm, Poissons ratio 0.22, and the surface is ideally smooth.
− DLC6: Youngs modulus 39 GPa, hardness 5 GPa, thickness 1 µm, Poissons ratio 0.22, and the surface is ideally smooth.
− Friction: The values for the coefficient of friction were measured from samples corresponding to the above material combinations. The values used for the TiN coatings was 0.07 and for the DLC coatings 0.05. The coefficient of friction represented the interfacial shear component excluding the ploughing component of friction.
Stress distribution in the coated surface
The simulated stress distribution models are shown in Figures 3 to 7. The models have been created for the 2 µm TiN A and DLC2 coating and for all coatings with 1 µm film thickness in order to enable the comparison between different coatings. The figures are topographical stress-field maps where each color corresponds to a certain stress level range at the surface and at the intersection shown in the figure. The spherical tip is invisible in the figures in order to display the stresses.
Figure 3(a) shows the first principal stresses for the 2 µm thick TiN A coating after 1.2 mm of sliding. The maximum tensile stresses occur about one contact width behind the contact at the border of the formed groove. This corresponds to
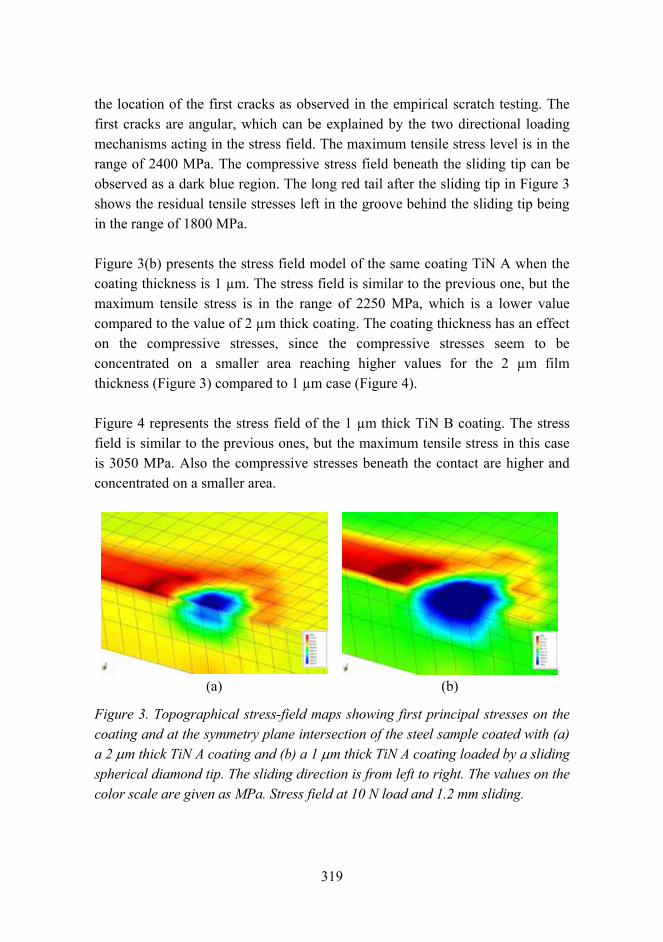
319
the location of the first cracks as observed in the empirical scratch testing. The first cracks are angular, which can be explained by the two directional loading mechanisms acting in the stress field. The maximum tensile stress level is in the range of 2400 MPa. The compressive stress field beneath the sliding tip can be observed as a dark blue region. The long red tail after the sliding tip in Figure 3 shows the residual tensile stresses left in the groove behind the sliding tip being in the range of 1800 MPa.
Figure 3(b) presents the stress field model of the same coating TiN A when the coating thickness is 1 µm. The stress field is similar to the previous one, but the maximum tensile stress is in the range of 2250 MPa, which is a lower value compared to the value of 2 µm thick coating. The coating thickness has an effect on the compressive stresses, since the compressive stresses seem to be concentrated on a smaller area reaching higher values for the 2 µm film thickness (Figure 3) compared to 1 µm case (Figure 4).
Figure 4 represents the stress field of the 1 µm thick TiN B coating. The stress field is similar to the previous ones, but the maximum tensile stress in this case is 3050 MPa. Also the compressive stresses beneath the contact are higher and concentrated on a smaller area.
(a) (b)
Figure 3. Topographical stress-field maps showing first principal stresses on the coating and at the symmetry plane intersection of the steel sample coated with (a) a 2 µm thick TiN A coating and (b) a 1 µm thick TiN A coating loaded by a sliding spherical diamond tip. The sliding direction is from left to right. The values on the color scale are given as MPa. Stress field at 10 N load and 1.2 mm sliding.
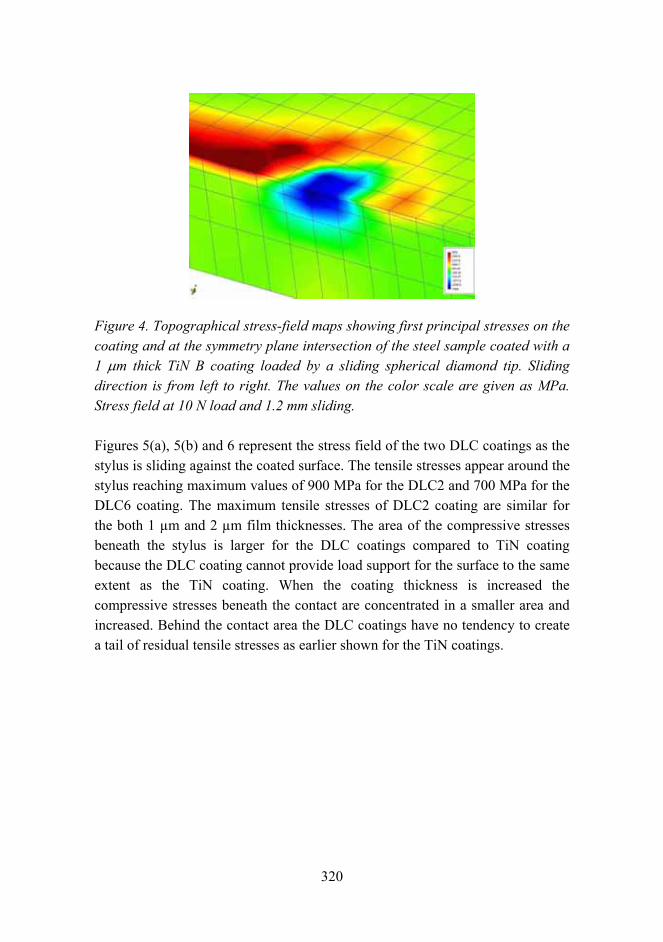
320
Figure 4. Topographical stress-field maps showing first principal stresses on the coating and at the symmetry plane intersection of the steel sample coated with a 1 µm thick TiN B coating loaded by a sliding spherical diamond tip. Sliding direction is from left to right. The values on the color scale are given as MPa. Stress field at 10 N load and 1.2 mm sliding.
Figures 5(a), 5(b) and 6 represent the stress field of the two DLC coatings as the stylus is sliding against the coated surface. The tensile stresses appear around the stylus reaching maximum values of 900 MPa for the DLC2 and 700 MPa for the DLC6 coating. The maximum tensile stresses of DLC2 coating are similar for the both 1 µm and 2 µm film thicknesses. The area of the compressive stresses beneath the stylus is larger for the DLC coatings compared to TiN coating because the DLC coating cannot provide load support for the surface to the same extent as the TiN coating. When the coating thickness is increased the compressive stresses beneath the contact are concentrated in a smaller area and increased. Behind the contact area the DLC coatings have no tendency to create a tail of residual tensile stresses as earlier shown for the TiN coatings.
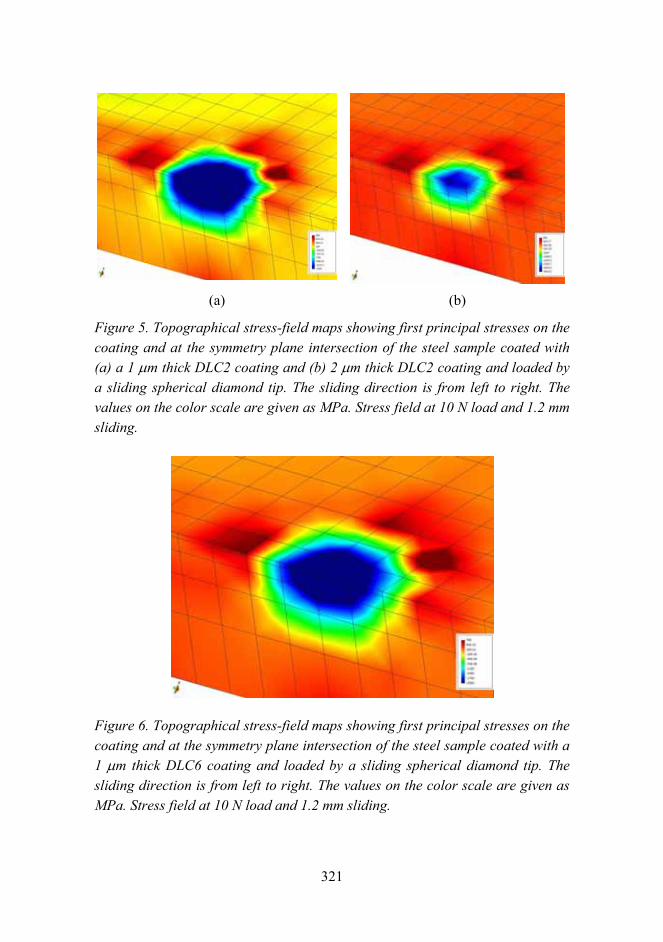
321
(a) (b)
Figure 5. Topographical stress-field maps showing first principal stresses on the coating and at the symmetry plane intersection of the steel sample coated with (a) a 1 µm thick DLC2 coating and (b) 2 µm thick DLC2 coating and loaded by a sliding spherical diamond tip. The sliding direction is from left to right. The values on the color scale are given as MPa. Stress field at 10 N load and 1.2 mm sliding.
Figure 6. Topographical stress-field maps showing first principal stresses on the coating and at the symmetry plane intersection of the steel sample coated with a 1 µm thick DLC6 coating and loaded by a sliding spherical diamond tip. The sliding direction is from left to right. The values on the color scale are given as MPa. Stress field at 10 N load and 1.2 mm sliding.
322
Fracture toughness evaluation
The results of the finite element (FE) evaluation are utilized in a boundary element method (BEM) substructure (i.e., the stress fields corresponding to location of crack generation are transferred to a BEM model and used as boundary conditions). As such, SIF solutions are evaluated for different types of crack fields with varying density. The solutions are utilized within a weight function concept in order to derive generalized SIF solutions that can be applied under a generic stress field.
For the fracture toughness determination the scratch density and the orientation of the crack field at different locations of the scratch channel were determined. The nominal stresses from the FEAs of the contact corresponding to the respective crack locations and types were used as input parameters in the fracture toughness calculation. The contact FEAs neglect coupling with the cracking itself, and as such, it is reasonable to assume that at some point the computed stress and strain fields will deviate from the ones experienced by the coating substrate system in the scratch test.
The crack densities were identified from experimental scratch results for the coatings TiN A. The results of the fracture toughness evaluation for transversal middle cracks and angular side cracks are given in Figure 7. The attained fracture toughness estimates are approximately 4 MPa m0.5 and relatively insensitive of sliding distance, l. The results are expected to be more accurate for the scratch middle cracks, since the side cracks are prone to various sources of error, primarily due to their much smaller size. The results are, however, quite close to each other.

323
1.25 1.50 1.75 2.00 2.25 2.50 2.75 3.00 3.250
1
2
3
4
5
6
7
8
9
10
5%
95%
transversal middle crackseq
v. F
ract
ure
toug
hnes
s, K
c E [M
Pa m
0.5 ]
sliding distance [mm]
4.75
1.0 1.2 1.4 1.6 1.8 2.0 2.2
0
1
2
3
4
5
6
7
8
9
10
5%
95%
angular side cracks
eqv.
Fra
ctur
e to
ughn
ess,
Kc E [M
Pa m
0.5 ]
sliding distance [mm]
3.5
(a) (b)
Figure 7. Equivalent fracture toughness in the scratch groove for (a) transversal middle cracks and (b) angular side cracks.
Discussion
The modeling of the stresses and strains in the surface illustrate very well what kind of load situations and deformations a surface is exposed to when a spherical counter surface is sliding over it. The stress fields result in elastic and plastic deformations that change the shape of the surface. The stresses in addition to the state of deformation are the origin of possible crack generation and crack propagation in the coating, at the coating/substrate interface or in the substrate. When cracks grow due to increased stresses and unite with other cracks, debris is formed and they may detach from the surface. This is the origin of the process of wear.
Modeling the scratching action of a coated steel surface creates a complex stress field at the surface with tensile and compressive stress as well as remaining residual stresses in the coating behind the sliding contact. The hard TiN coatings on the steel surface will be stretched and accumulate high tensile stresses. At the same time it is carrying part of the load and thus reducing the compressive stresses in the substrate under the sliding tip. For the softer DLC coatings the tensile stresses are lower and they do not experience such residual stresses after the scratching as the TiN coatings do. The DLC coating also has such no ability as Tin to improve the load carrying capacity of the surface which can be noticed as higher compressive stresses of the DLC coated surface beneath the contact area.
324
When investigating the coating performance, the coating stiffness compared to the stiffness of the substrate seems to make a difference. The TiN coatings had a higher hardness and Youngs modulus than the substrate material and they experienced high tensile stresses when loaded by a diamond stylus. For the coating TiN B the stresses were the highest after 1.2 mm sliding, in the range of 3050 MPa, due to the highest hardness and stiffness of the coatings. The coating TiN B also had high tensile residual stresses in the coating after the scratching. The TiN A coating had somewhat lower tensile stress values, in the range of 2000 MPa. On the TiN A coating the first cracks appeared after 1.2 mm of sliding, whereas the first cracks on the TiN B coating were initiated only after 2.8 mm of sliding. This suggests that the fracture toughness of the TiN B coating is higher compared to the TiN A coating.
The DLC coatings had a lower Youngs modulus and hardness compared to the substrate material and they experienced rather low tensile stresses during scratching. The maximum tensile stresses for both coatings were in the range of 700 to 900 MPa. Also the residual stresses left in the coating after the scratching were low. The first visible cracks were formed for the DLC coatings at a similar distance compared to the TiN A coating. Since the tensile stresses were clearly lower for the DLC coatings at this point, it is suggested that the fracture toughness of the DLC coating is lower when compared to that of the TiN coatings.
The coating thickness effect differs for these two coating types. The increase of coating thickness increases the tensile stresses experienced by the TiN coating. On the other hand the increase in the thickness of the DLC coating has no effect on the tensile stresses. However, the thickness influences the compressive stresses for the DLC and TiN in a similar way by reducing the contact area and in the same time increasing the level of compressive stresses.
The fracture toughness determination for the TiN A coating showed fracture toughness estimates to be approximately 4 MPa·m0.5. Experiments suggested that the most suitable area of the scratch to be used for fracture toughness calculation is between 1.25 mm and 2 mm of sliding. This is supported by the fracture toughness calculations, since it was indicated that between these sliding distances a nearly constant fracture toughness value was attained. It is noteworthy that by using the specified crack driving force solutions the different
325
crack types produced nearly identical estimates of fracture toughness. The attained fracture toughness values are comparable to literature values, referenced in [14]. A direct comparison is however difficult due to varying properties of coatings and since the behavior of the coating/substrate system cannot be expected to match that of a single material. As such, verification tests ought to be done on a coated specimen using a controlled fracture mechanics test, such as a four-point bending test.
In future work the influence of coating thickness will be studied in more detail, as will the influence of the intermediate layer. Also the fracture toughness values for different coatings will be determined in more detail.
Conclusions
A systematic approach to the analysis of tribological coated surfaces has been outlined. A finite element computer model for the contact system of a spherical rigid diamond tip with 200 µm radius sliding on a linearly elastic TiN and DLC coatings on an elastic-plastic steel substrate was developed. The created model describes the stresses and strains incorporating elastic and plastic behavior on the surface. The contact conditions were studied both by three dimensional finite element method stress modelling, computer simulation and experimentally by a scratch tester.
The contact mechanisms resulting in stresses when a sphere is sliding on a coated surface are the pulling and pushing by the friction force; the geometrical indent, groove and torus shaped changes of the flat surface; the bulk plasticity concentration and curvature minimum effects; and the residual stresses in the coating.
The coating/substrate stiffness ratio determines the coating behavior. The coating with higher hardness and Youngs modulus compared to the substrate material, like TiN coating, experienced high tensile stresses when loaded by diamond stylus. The coating with a lower stiffness compared to a substrate material, such as DLC coating, experienced rather low tensile stresses during scratching. For the TiN B coating the tensile stresses were in the range of 3050 MPa, and for the TiN A coatings in the range of 2000 MPa. The DLC coatings had maximum tensile stresses in the range of 700 to 900 MPa.
326
Acknowledgements
The authors want to acknowledge the following colleagues for interesting and valuable discussions in relation to the work: Philippe Kapsa, Ecole Central de Lyon, France; Henry Haefke and Imad Ahmed, CSEM, Switzerland; Ali Erdemir, Argonne National Laboratory, USA; Koij Kato, Tohoku University, Japan; and Kaj Pischow and Rosa Aimo, Savcor Coatings.
The financial support of Tekes the Finnish Funding Agency for Technology and Innovation; Taiho Kogyo Tribology Research Foundation, Japan; Savcor Coatings, Finland; and the VTT Technical Research Centre of Finland is gratefully acknowledged.
Reference list
1. Holmberg, K. & Matthews, A. Coatings tribology − properties, techniques and applications in surface engineering. Elsevier Tribology Series 28, Elsevier Science B.V., The Netherlands, 1994. 442 p.
2. Diao, D., Kato, K. & Hayashi, K. The maximum tensile stress on a hard coating under sliding friction. Tribology International 27 (1994) 4, pp. 267272.
3. Parr, G. M. Measurement of mechanical properties by ultra-low load indentation. Materials Science and Engineering A253 (1998), pp. 151159.
4. Holmberg, K. The basic material parameters that control friction and wear of coated surfaces under sliding. Tribologia − Finnish Journal of Tribology 19 (2000) 3, pp. 3−18.
5. Burnett, P. & Rickerby, D. The mechanical properties of wear-resistant coatings I: Modelling of hardness behaviour. Thin Solid Films 148 (1987), pp. 4150.
6. Rickerby, D. & Matthews, A. (Eds.). Advanced surface coatings: A handbook of surface engineering. Blackie, Glasgow, UK, 1991. 364 p.
327
7. Ye, N. & Komvopoulus, K. Indentation analysis of elastic-plastic homogeneous and layered media: Criteria for determining the real material hardness. J. Tribology, Trans. ASME, 125 (2003), pp. 685691.
8. Oliver, W. & Pharr, G. An improved technique for determining hardness and elastic modulus using load and displacement sensing indentation experiments. Journal of Materials Research 7 (1992) 6, pp. 15641583.
9. Bull, S. Failure modes in scratch adhesion testing. Surface and Coatings Technology 50 (1991), pp. 2532.
10. von Stebut, J., Rezakhanlou, R., Anoun, K., Michel, H. & Gantois, M. Major damage mechanisms during scratch and wear testing of hard coatings on hard substrates. Thin Solid Films 181 (1989), pp. 555564.
11. European Standard, 1999, Advanced technical ceramics Methods of tests for ceramic coatings Part 3: Determination of adhesion and other mechanical failure modes by scratch test. prEN1071-3. 42 p.
12. Larsson, M., Olsson, M., Hedenquist, P. & Hogmark, S. On the mechanism of coating failure as demonstrated by scratch and indentation testing of TiN and HSS. Submitted to Surface Engineering, 1996. (Included in Uppsala Dr Thesis by Larsson, M., No. 191/1996).
13. Valli, J. A review of adhesion test methods for thin hard coatings. Journal of Vacuum Science and Technology A4 (1986) 6, pp. 30073014.
14. Holmberg, K., Laukkanen, A., Ronkainen, H., Wallin, K. & Varjus, S. A model for stresses, crack generation and fracture toughness calculation in scratched TiN coated steel surfaces. Wear 254 (2003), pp. 278291.
15. Holmberg, K., Laukkanen, A., Ronkainen, H. & Wallin, K. 2005. Tribological analysis of fracture conditions in thin surface coatings by 3D FEM modelling and stress simulations. Tribology International, Vol. 38, pp. 10351049.
328
16. Holmberg, K., Laukkanen, A., Ronkainen, H., Wallin, K., Varjus, S. & Koskinen, J. Tribological contact analysis of a ball sliding on a flat coated surface, Part I: Modelling stresses and strains. Surface and Coatings Technology, Vol. 200, Issues 1213, 31 March 2006, pp. 37933809.
17. Holmberg, K., Laukkanen, A., Ronkainen, H., Wallin, K., Varjus, S. & Koskinen, J. Tribological contact analysis of a ball sliding on a flat coated surface, Part II: Material deformations, influence of coating thickness and Youngs modulus. Surface and Coatings Technology, Vol. 200, Issues 1213, 31 March 2006, pp. 38103823.
18. Laukkanen, A., Holmberg, K., Koskinen, J., Ronkainen, H., Wallin, K. & Varjus, S. Tribological contact analysis of a ball sliding on a flat coated surface, Part III: Fracture toughness calculation and influence of residual stresses. Surface and Coatings Technology, Vol. 200, Issues 1213, 31 March 2006, pp. 38243844.
329
Synthesis of single-walled CNTs from CO with novel floating catalyst methods the effect of
CO2 and H2O
Albert G. Nasibulin1∗, David P. Brown1, Paula Queipo1, David Gonzalez1, Hua Jiang2, Anton S. Anisimov1 & Esko I. Kauppinen1, 2
1NanoMaterials Group, Laboratory of Physics and Center for New Materials, Helsinki University of Technology, P.O. Box 1000, 02015 TKK
2VTT Technical Research Centre of Finland, P.O. Box 1000, 02044 VTT
Abstract
Single-walled carbon nanotubes (CNTs) were synthesized from carbon monoxide and iron catalyst nanoparticles by two different floating catalyst methods. The catalyst particles were produced by physical vapor nucleation (PVD) using a resistively heated iron wire (hot wire generator) and by thermal decomposition of ferrocene vapor. The essential role of etching agents (CO2 and H2O) in the CNT formation was demonstrated. Addition of small amounts of CO2 and H2O vapor in the reactor resulted in an increase in CNT length. Also, the CO2 introduction was found to decrease the minimum temperature of the CNT synthesis from 890 °C to below 600 °C.
Introduction
Recently, we have developed a novel aerosol method for the synthesis of CNTs relying on the introduction of pre-made catalyst particles into an aerosol reactor [1]. Experimental investigations initially exhibited unstable CNT production [2]. Analysis of the experimental data showed that these instabilities were primarily associated with the reactor wall conditions. In order to provide reproducible CNT synthesis conditions, the reactor walls must be saturated by catalyst material. The importance of having iron on the reactor walls can be explained by its catalytic activity in CO disproportionation and hydrogenation reactions that lead to the
∗ Corresponding author: e-mail: [email protected], phone: +358 50 339 7538, fax: +358 20 7227021.
330
release of gaseous products, such as carbon dioxide (CO2) and water (H2O). It can be conjectured that those gaseous components formed upstream on the reactor walls can play an important role downstream in the zone of the CNT growth.
This paper is focused on the role of CO2 and H2O vapor during the synthesis of CNTs in two different synthesis systems: using pre-made catalyst particles by a hot wire generator (HWG) method [1] and using particles grown in situ in a floating catalyst method relying on thermal decomposition of ferrocene vapor [3]. In addition, the influence of CO2 on the temperature range of the CNT formation was experimentally investigated.
Experimental results and discussion
Experimental setup
The HWG method for the production of CNTs has been described elsewhere [1]. Briefly, in this method, Fe particles were produced by vaporization from a resistively heated catalyst wire in a H2/N2 (with a 7/93 mol ratio) flow (400 cm3/min). Here, particles were formed and grown by vapor nucleation, condensation and particle coagulation processes. Subsequently, the produced particles were introduced into either a ceramic or a stainless steel tubular reactor, mixed with a carbon monoxide flow (400 cm3/min) and heated to induce CNT formation (from 550 °C to 1200 °C).
In a second experimental method, ferrocene was vaporized by passing room temperature CO (with a flow rate of 300 cm3/min) through a cartridge filled with ferrocene powder. The partial vapor pressure of ferrocene in the reactor was, thus, maintained at 0.7 Pa [3]. Subsequently, the flow containing ferrocene vapor was introduced into the high temperature zone of the ceramic tube reactor through a water-cooling probe and mixed with an additional CO flow (100 cm3/min). The reactor wall set temperature was varied from 800 °C to 1150 °C.
FT-IR measurements
FT-IR measurements showed the main gaseous product was CO2 with concentrations of 120 and 1540 ppm in the HWG method and ferrocene setup, respectively. It was experimentally found that the effluent composition did not
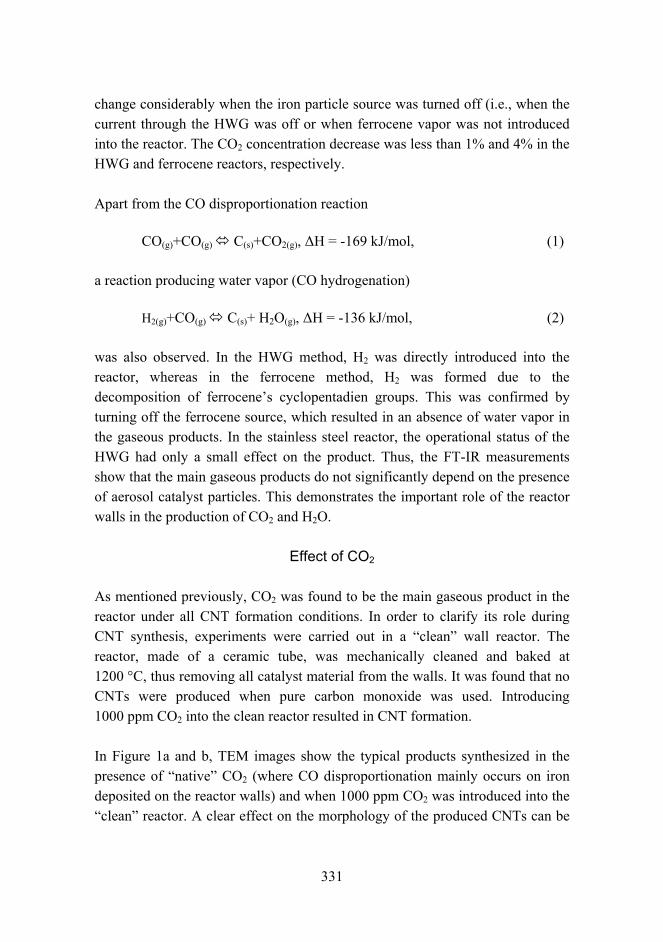
331
change considerably when the iron particle source was turned off (i.e., when the current through the HWG was off or when ferrocene vapor was not introduced into the reactor. The CO2 concentration decrease was less than 1% and 4% in the HWG and ferrocene reactors, respectively.
Apart from the CO disproportionation reaction
CO(g)+CO(g) ! C(s)+CO2(g), ∆H = -169 kJ/mol, (1)
a reaction producing water vapor (CO hydrogenation)
H2(g)+CO(g) ! C(s)+ H2O(g), ∆H = -136 kJ/mol, (2)
was also observed. In the HWG method, H2 was directly introduced into the reactor, whereas in the ferrocene method, H2 was formed due to the decomposition of ferrocenes cyclopentadien groups. This was confirmed by turning off the ferrocene source, which resulted in an absence of water vapor in the gaseous products. In the stainless steel reactor, the operational status of the HWG had only a small effect on the product. Thus, the FT-IR measurements show that the main gaseous products do not significantly depend on the presence of aerosol catalyst particles. This demonstrates the important role of the reactor walls in the production of CO2 and H2O.
Effect of CO2
As mentioned previously, CO2 was found to be the main gaseous product in the reactor under all CNT formation conditions. In order to clarify its role during CNT synthesis, experiments were carried out in a clean wall reactor. The reactor, made of a ceramic tube, was mechanically cleaned and baked at 1200 °C, thus removing all catalyst material from the walls. It was found that no CNTs were produced when pure carbon monoxide was used. Introducing 1000 ppm CO2 into the clean reactor resulted in CNT formation.
In Figure 1a and b, TEM images show the typical products synthesized in the presence of native CO2 (where CO disproportionation mainly occurs on iron deposited on the reactor walls) and when 1000 ppm CO2 was introduced into the clean reactor. A clear effect on the morphology of the produced CNTs can be
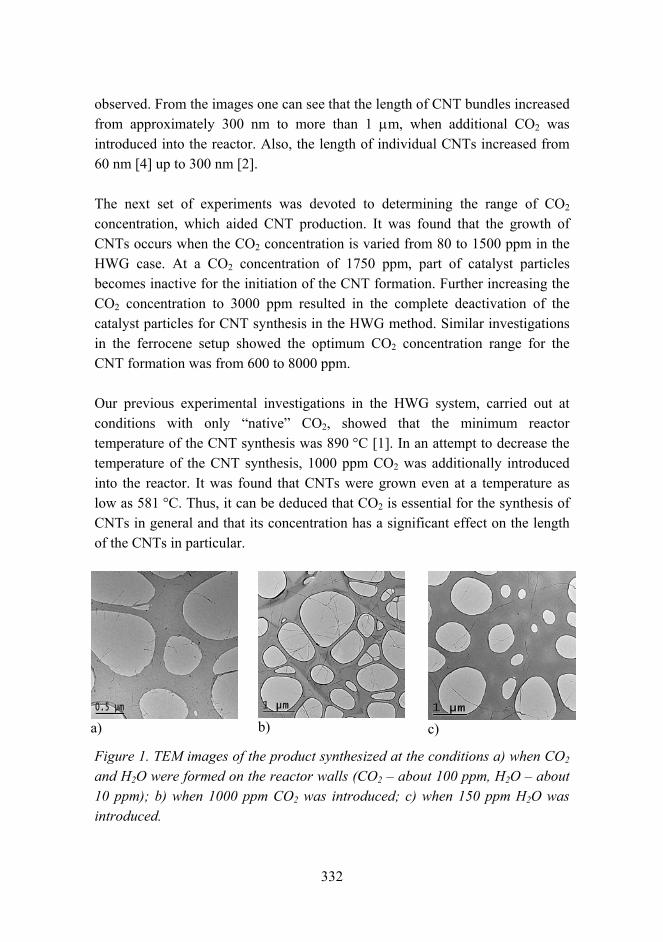
332
observed. From the images one can see that the length of CNT bundles increased from approximately 300 nm to more than 1 µm, when additional CO2 was introduced into the reactor. Also, the length of individual CNTs increased from 60 nm [4] up to 300 nm [2].
The next set of experiments was devoted to determining the range of CO2 concentration, which aided CNT production. It was found that the growth of CNTs occurs when the CO2 concentration is varied from 80 to 1500 ppm in the HWG case. At a CO2 concentration of 1750 ppm, part of catalyst particles becomes inactive for the initiation of the CNT formation. Further increasing the CO2 concentration to 3000 ppm resulted in the complete deactivation of the catalyst particles for CNT synthesis in the HWG method. Similar investigations in the ferrocene setup showed the optimum CO2 concentration range for the CNT formation was from 600 to 8000 ppm.
Our previous experimental investigations in the HWG system, carried out at conditions with only native CO2, showed that the minimum reactor temperature of the CNT synthesis was 890 °C [1]. In an attempt to decrease the temperature of the CNT synthesis, 1000 ppm CO2 was additionally introduced into the reactor. It was found that CNTs were grown even at a temperature as low as 581 °C. Thus, it can be deduced that CO2 is essential for the synthesis of CNTs in general and that its concentration has a significant effect on the length of the CNTs in particular.
0.5 µm0.5 µm a)
b)
1 µm1 µm c)
Figure 1. TEM images of the product synthesized at the conditions a) when CO2 and H2O were formed on the reactor walls (CO2 about 100 ppm, H2O about 10 ppm); b) when 1000 ppm CO2 was introduced; c) when 150 ppm H2O was introduced.
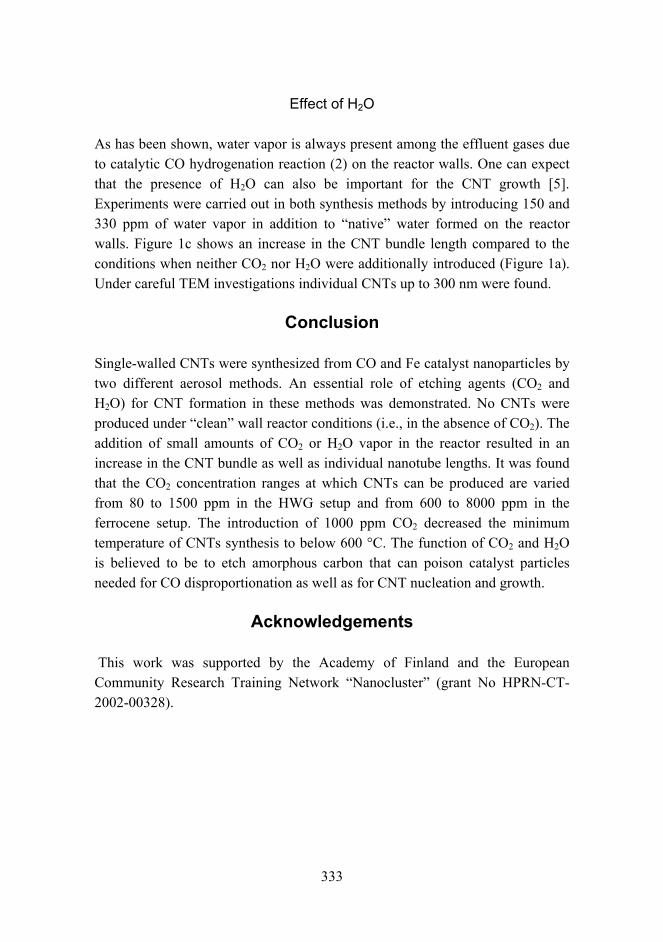
333
Effect of H2O
As has been shown, water vapor is always present among the effluent gases due to catalytic CO hydrogenation reaction (2) on the reactor walls. One can expect that the presence of H2O can also be important for the CNT growth [5]. Experiments were carried out in both synthesis methods by introducing 150 and 330 ppm of water vapor in addition to native water formed on the reactor walls. Figure 1c shows an increase in the CNT bundle length compared to the conditions when neither CO2 nor H2O were additionally introduced (Figure 1a). Under careful TEM investigations individual CNTs up to 300 nm were found.
Conclusion
Single-walled CNTs were synthesized from CO and Fe catalyst nanoparticles by two different aerosol methods. An essential role of etching agents (CO2 and H2O) for CNT formation in these methods was demonstrated. No CNTs were produced under clean wall reactor conditions (i.e., in the absence of CO2). The addition of small amounts of CO2 or H2O vapor in the reactor resulted in an increase in the CNT bundle as well as individual nanotube lengths. It was found that the CO2 concentration ranges at which CNTs can be produced are varied from 80 to 1500 ppm in the HWG setup and from 600 to 8000 ppm in the ferrocene setup. The introduction of 1000 ppm CO2 decreased the minimum temperature of CNTs synthesis to below 600 °C. The function of CO2 and H2O is believed to be to etch amorphous carbon that can poison catalyst particles needed for CO disproportionation as well as for CNT nucleation and growth.
Acknowledgements
This work was supported by the Academy of Finland and the European Community Research Training Network Nanocluster (grant No HPRN-CT-2002-00328).
334
References
[1] Nasibulin, A. G., Moisala, A., Brown, D. P., Jiang, H. & Kauppinen, E. I. A novel aerosol method for single walled carbon nanotube synthesis. Chemical Physics Letters 402, (2005), pp. 227232.
[2] Nasibulin, A. G., Queipo, P., Shandakov, S. D., Brown, D. P., Jiang, H., Pikhitsa, P. V., Tolochko, O. V., Kauppinen, E.I. & Nanosci, J. Studies on mechanism of single-walled carbon nanotube formation. J. Nanoscience and Nanotechnology 6, (2005), pp. 12331246.
[3] Moisala, A., Nasibulin, A. G., Shandakov, S. D., Jiang, H. & Kauppinen, E. I. On-line detection of single-walled carbon nanotube formation during aerosol synthesis method. Carbon 43, (2005), pp. 20662074.
[4] Nasibulin, A. G., Pikhitsa, P. V., Jiang, H. & Kauppinen, E. I. Correlation between catalyst particle and single-walled carbon nanotube diameters. Carbon 43, (2005), pp. 22512257.
[5] Hata, K., Futaba, D. N., Minuzo, K., Namai, T., Yumura, M. & Ijima, S. Water-Assisted Highly Efficient Synthesis of Impurity-Free Single-Walled Carbon Nanotubes. Science 306, (2004), pp. 13621364.
Published by
Series title, number and report code of publication
VTT Symposium 244 VTTSYMP244
Author(s) Ritschkoff, Anne-Christine, Koskinen, Jari & Paajanen, Mika (eds.) Title
Applied Material Research at VTT
Abstract VTT Technical Research Centre of Finland is an impartial multidisciplinary expert organisation under the auspices of the Ministry of Trade and Industry. Its objectives are to develop new technologies, create new innovations and offer value added services, thus increasing our clients' competitiveness and competencies. With its know-how, VTT produces research, development, testing and information services to the public sector and companies as well as international organisations.
Material research has a very strong role in the technical research at VTT. The volume is estimated to be about 300 man years per annum which is over 10% of the total research activities at VTT. The volume of the research on year 2005 was about 32 M. These research activities are mainly applied research carried out in projects involving the major industrial companies in the field, and networking with the leading research organizations both nationally and internationally. Materials research has been seen as a strategic effort in all industrial countries. It has an enormous role in aiding the economic and technological competitiveness. Material technology is generic and cross sectional in nature and the main innovations are expected when different fields of natural and technical sciences are combined with material expertise.
This VTT material symposium proceedings summary contains 30 reviewed articles from the research projects carried out by the VTT material experts in the fields of 1) functional material systems and components, 2) functional surfaces and coating applications, 3) structures and concepts based on nanomaterials and 4) novel trends in biomaterials research.
Keywords materials research, elastomers, isolators, nanostructured materials, catalysts, dielectric elastomers, shape-memory alloys, nanorods, ferroelectric materials, thin films, biomaterials, properties
ISBN 9513863115 (soft back ed.) 9513863123 (URL: http://www.vtt.fi/publications/index.jsp)
Series title and ISSN Project number VTT Symposium 03579387 (soft back ed.) 14550873 (URL: http://www.vtt.fi/publications/index.jsp)
8048
Date Language Pages Price December 2006 English 334 p. G
Name of project Commissioned by AMA-SYMPOSIUM
Contact Sold by VTT Technical Research Centre of Finland Vuorimiehentie 3, P.O. Box 1000 FI-02044 VTT, Finland Phone internat. +358 20 722 111 Fax +358 20 722 7027
VTT Technical Research Centre of Finland P.O. Box 1000 FI-02044 VTT, Finland Phone internat. +358 20 722 4404 Fax +358 20 722 4374
ESPOO 2006ESPOO 2006ESPOO 2006ESPOO 2006ESPOO 2006 VTT SYMPOSIUM 244
ISBN 951–38–6311–5 (soft back ed.) ISBN 951–38–63ISSN 0357–9387 (soft back ed.) ISSN 1455–0873
Tätä julkaisua myy Denna publikation säljs
VTT VTTPL 1000 PB 1000
02044 VTT 02044 VTTPuh. 020 722 4404 Tel. 020 722 4404Faksi 020 722 4374 Fax 020 722 4374
VTT SYMPOSIUM
232 The Food, GI-tract Functionality and Human HWorkshop. 3rd Workshop. Sitges, Spain 15–1Kuokka, Maria Saarela & Tiina Mattila-Sandho
233 BALTICA VI. International Conference on Life Power Plants. Vol. 1. Helsinki - Stockholm - HeVeivo & Pertti Auerkari. Espoo 2004. 354 p.
234 BALTICA VI. International Conference on Life Power Plants. Vol. 2. Helsinki - Stockholm - HeVeivo & Pertti Auerkari. Espoo 2004. 354 p.
235 URSI/IEEE XXIX Convention on Radio Scienc2004. Ed. by Manu Lahdes. Espoo 2004. 154 p
236 Teollisuuden käynnissäpidon prognostiikka. Es2005. 117 p. + CD-rom
237 Competent Design by Castings. Improvements 2005 final seminar. Espoo, 13.–14.6.2005. Ed. & Jussi Solin. 391 p. + app. 4 p.
238 COST ACTION E36. Modelling and simulation inings of Model Validation Workshop. Espoo, Johannes Kappen, Jussi Manninen & Risto Rit
239 Kunnossapito ja prognostiikka. Prognos-vuosiseToim. Aino Helle. 2005. 79 s. + liitt. 7 s.
240 37TH R3-NORDIC. CONTAMINATION CONTROMay 29–31, 2006. Ed. by Gun Wirtanen & Sa
241 The 7th International Conference on eXtreme PSoftware Engineering. Tutorials, Workshops, Oulu, Finland, June 17–22, 2006. Ed. by Outi Järing. 2006. 92 p. + app. 3 p.
242 International Specialised Symposium on Yeasts– from Models to Applications. Hanasaari, Espby Annemari Kuokka & Merja Penttilä. 2006.
243 Prognostics for industrial machinery availabilitEd. by Aino Helle. 2006. 168 p. + app. 19 p.
244 Applied Material Research at VTT. Ed. by Anne& Mika Paajanen. 2006. 334 p.
VT
T SYMP
OSIU
M 244
Applied M
aterial Research at V
TT
Applied Material Research at VTT
12–3 (URL: http://www.vtt.fi/inf/pdf/)(URL: http://www.vtt.fi/inf/pdf/)
av This publication is available from
VTTP.O. Box 1000
FI-02044 VTT, FinlandPhone internat. +358 20 722 4404
Fax +358 20 722 4374
ealth Cluster, PROEUHEALTH. 3rd7 March 2004. Toim. Annemarilm. Espoo 2003. 106 p.
Management and Maintenance forlsinki 8–10 June, 2004. Ed. by Juha
Management and Maintenance forlsinki 8–10 June, 2004. Ed. by Juha
e. Espoo, Finland, November 1–2,. + CD-rom
poo, 1.12.2004. Toim. Aino Helle.
in a Nordic project. GJUTDESIGN-by Jack Samuelsson, Gary Marquis
pulp and paper industry. Proceed-Finland, 6 October, 2005. Ed. byala. 2005. 87 p.
minaari 2005. Tampere, 3.11.2005.
L SYMPOSIUM. Tampere, Finland,tu Salo. 2006. 449 p. + app. 3 p.
rogramming and Agile Processes inActivities, and Keynote Speeches.Salo, Pekka Abrahamsson & Päivi
ISSY25. Systems Biology of Yeastsoo, Finland, June 18–21, 2006. Ed.177 p.
y. Final seminar. Espoo 12.12.2006.
-Christine Ritschkoff, Jari Koskinen