Embed Size (px)
Citation preview
arX
iv:h
ep-e
x/02
0604
1v1
18
Jun
2002
Tracking Performance of the Scintillating
Fiber Detector in the K2K Experiment
B. J. Kimm,∗, T. Iwashita f , T. Ishida c, E. J. Jeon c,
H. Yokoyama ℓ, S. Aoki f , H. G. Berns n, H. C. Bhangm,S. Boyd n, K. Fujii f , T. Hara f , Y. Hayato c, J. Hill i, T. Ishii c,
H. Ishino c, C. K. Jung i, E. Kearns a, H. I. Kimm, J. H. Kimm,J. Y. Kim b, S. B. Kimm, T. Kobayashi c, S. Matsuno e,
S. Mine d, K. Nakamura c, M. Nakamura h, K. Nishikawa g,T. Otaki f , Y. Oyama c, H. Park c,1, M. Sakuda c, K. Scholberg a,
E. Sharkey i, J. L. Stone a, A. Suzuki f , K. Takenaka f ,N. Tamura h, Y. Tanaka f , C. W. Walter a, J. Wilkes n, J. Yoom,
and M. Yoshida k
aDepartment of Physics, Boston University, Boston, MA 02215, USA
bDepartment of Physics, Chonnam National University, Kwangju 500-757, Korea
cHigh Energy Accelerator Research Organization, Tsukuba, Ibaraki 305-0801,
Japan
dDepartment of Physics and Astronomy, University of California, Irvine, CA
92697-4575, USA
eDepartment of Physics and Astronomy, University of Hawaii, Honolulu, HI
96822, USA
fKobe University, Kobe, Hyogo 657-8501, Japan
gDepartment of Physics, Kyoto University, Kyoto 606-8502, Japan
hDepartment of Physics, Niigata University, Niigata, Niigata 950-2181, Japan
iDepartment of Physics and Astronomy, State University of New York, Stony
Brook, NY 11794-3800, USA
jDepartment of Physics, Okayama University, Okayama, Okayama 700-8530,
Japan
kDepartment of Physics, Osaka University, Toyonaka, Osaka 560-0043, Japan
ℓDepartment of Physics, Science University of Tokyo, Noda, Chiba 278-0022,
Japan
mDepartment of Physics, Seoul National University, Seoul 151-742, Korea
nDepartment of Physics, University of Washington, Seatle, WA 98195-1560, USA
Preprint submitted to Elsevier Science 29 October 2018
Abstract
The K2K long-baseline neutrino oscillation experiment uses a Scintillating Fiber
Detector (SciFi) to reconstruct charged particles produced in neutrino interactions
in the near detector. We describe the track reconstruction algorithm and the per-
formance of the SciFi after three years of operation.
Key words: Tracking, Scintillating, Fiber, Neutrino, Long-baselinePACS: 14.60.Pq, 29.40.Gx, 29.40.Mc
1 K2K Experiment
The K2K experiment is the first long-baseline neutrino oscillation experimentin operation. Muon neutrinos(νµ) are produced via the decay of secondarypions from interactions of the KEK 12-GeV proton beam in an aluminumtarget. The neutrino beam is directed through a near detector system at KEKto the Super-Kamiokande underground detector[1] 250km away. By comparingthe neutrino fluxes and energy spectra measured at the near detector and atSuper-Kamiokande, we are able to investigate neutrino oscillations. Details ofthe K2K experiment have been presented elsewhere [2].
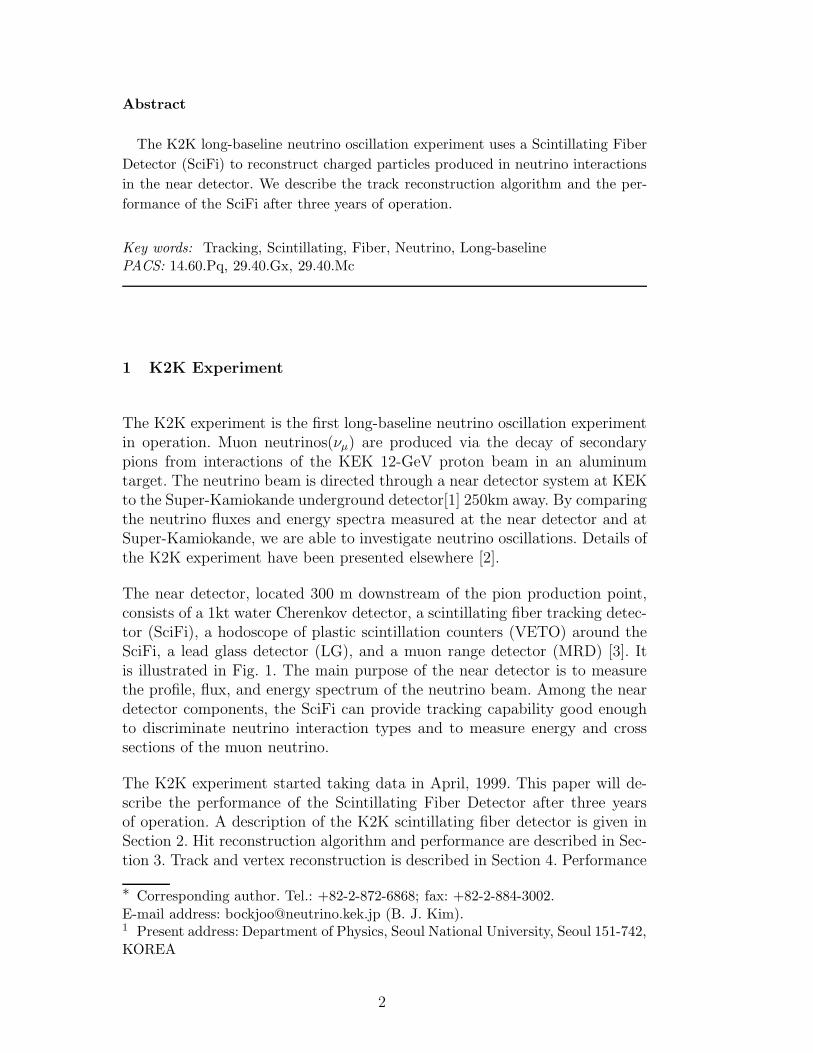
The near detector, located 300 m downstream of the pion production point,consists of a 1kt water Cherenkov detector, a scintillating fiber tracking detec-tor (SciFi), a hodoscope of plastic scintillation counters (VETO) around theSciFi, a lead glass detector (LG), and a muon range detector (MRD) [3]. Itis illustrated in Fig. 1. The main purpose of the near detector is to measurethe profile, flux, and energy spectrum of the neutrino beam. Among the neardetector components, the SciFi can provide tracking capability good enoughto discriminate neutrino interaction types and to measure energy and crosssections of the muon neutrino.
The K2K experiment started taking data in April, 1999. This paper will de-scribe the performance of the Scintillating Fiber Detector after three yearsof operation. A description of the K2K scintillating fiber detector is given inSection 2. Hit reconstruction algorithm and performance are described in Sec-tion 3. Track and vertex reconstruction is described in Section 4. Performance
∗ Corresponding author. Tel.: +82-2-872-6868; fax: +82-2-884-3002.E-mail address: [email protected] (B. J. Kim).1 Present address: Department of Physics, Seoul National University, Seoul 151-742,KOREA
2
Muon Range Detector
Lead Glass
Veto/Triggercounter
SciFi
DetectorWater Cherenkov
1kt
Neutrino Beam
Fig. 1. The layout of the K2K near detector. It consists of a 1-kt water Cherenkovdetector, a scintillating fiber detector, a hodoscope of plastic scintillation counters,a lead glass detector, and a muon range detector.
of the neutrino event reconstruction algorithms are presented in Section 5. Weconclude in Section 6.
2 Scintillating Fiber Detector
The SciFi is a charged particle tracking detector using scintillating fiber tech-nology. Scintillating fiber detectors have been used for charged particle track-ers by other experiments [4]. A scintillating fiber detector was chosen for thisapplication since it was necessary to have high tracking efficiency for recon-structing charged particles and their vertex positions when more than twovisible particles are produced in neutrino interactions. Using the detector, wecan separate quasi-elastic events from inelastic events, and define the fiducialvolume of the neutrino interactions with 1% accuracy.
The water is contained in a thin aluminium structure, and the water layersare interleaved with scintillating fiber layers. Water is chosen as a target ma-terial in order to minimize systematic uncertainties in neutrino cross-sectionwhen the event rates are compared between the SciFi and Super-Kamiokandedetectors. A scintillating fiber layer provides the hit-position measurement inboth horizontal and vertical directions 2 . An individual scintillation sheet has
2 In the K2K coordinate system, the z-axis is along the nominal neutrino beam di-rection. y-axis is the vertical direction pointing upwards, and x-axis is the horizontaldirection.
3
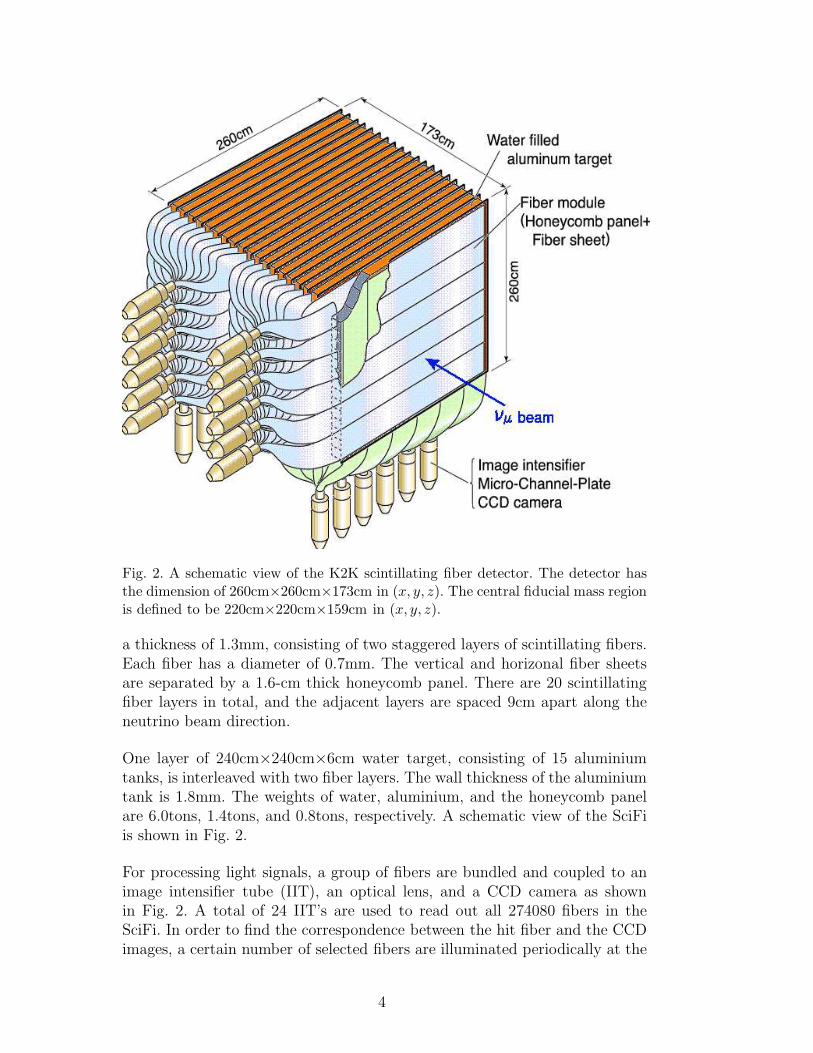
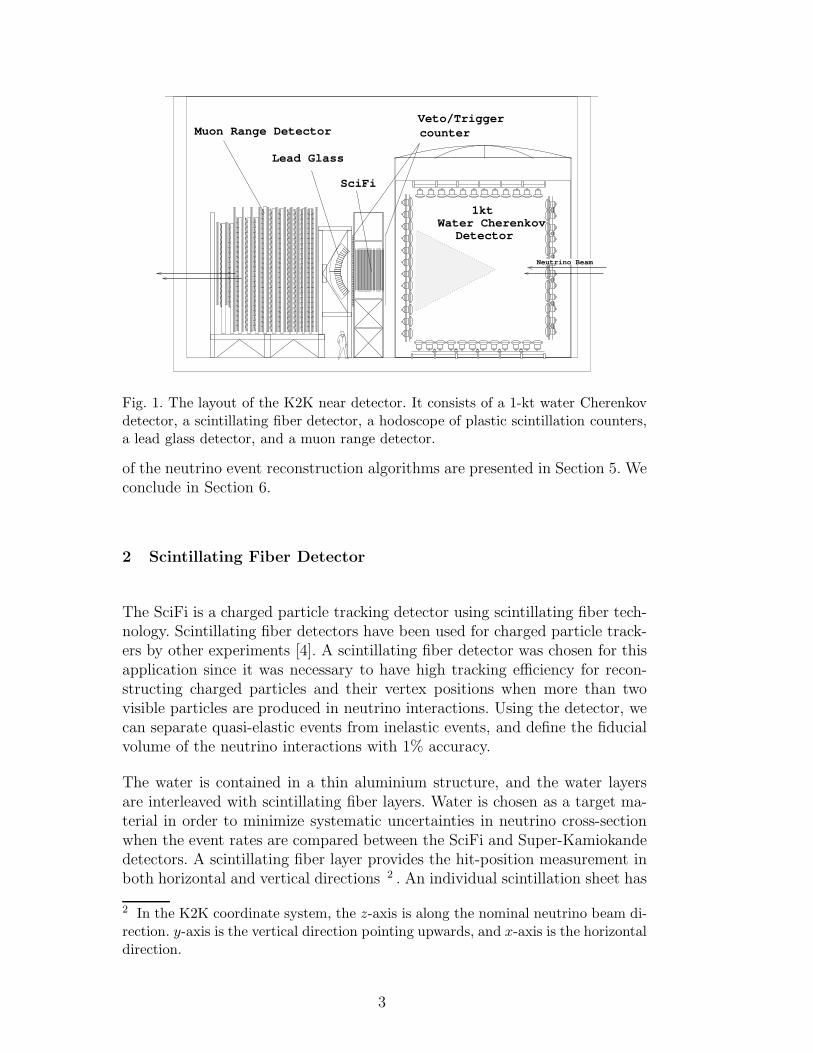
Fig. 2. A schematic view of the K2K scintillating fiber detector. The detector hasthe dimension of 260cm×260cm×173cm in (x, y, z). The central fiducial mass regionis defined to be 220cm×220cm×159cm in (x, y, z).
a thickness of 1.3mm, consisting of two staggered layers of scintillating fibers.Each fiber has a diameter of 0.7mm. The vertical and horizonal fiber sheetsare separated by a 1.6-cm thick honeycomb panel. There are 20 scintillatingfiber layers in total, and the adjacent layers are spaced 9cm apart along theneutrino beam direction.
One layer of 240cm×240cm×6cm water target, consisting of 15 aluminiumtanks, is interleaved with two fiber layers. The wall thickness of the aluminiumtank is 1.8mm. The weights of water, aluminium, and the honeycomb panelare 6.0tons, 1.4tons, and 0.8tons, respectively. A schematic view of the SciFiis shown in Fig. 2.
For processing light signals, a group of fibers are bundled and coupled to animage intensifier tube (IIT), an optical lens, and a CCD camera as shownin Fig. 2. A total of 24 IIT’s are used to read out all 274080 fibers in theSciFi. In order to find the correspondence between the hit fiber and the CCDimages, a certain number of selected fibers are illuminated periodically at the
4
Fig. 3. (a) A typical CCD image of an IIT from a cosmic-ray event. Small distortionsof the CCD image are introduced due to the position dependence of pixel size atthe IIT-CCD contact. (b) An expanded view of (a) for a typical SciFi hit. The sizeof hit pixel is proportional to brightness in the ADC. Hit fibers are represented bythe thick circles. A “SciFi hit” is defined as a cluster of neighboring hit fibers.
opposite side of IIT’s by an electro-luminescent (EL) plate. This is referredto as the EL calibration. A more detailed description of the SciFi detector isfound elsewhere [5].
3 Hit reconstruction
3.1 Hit Finding Algorithm
The CCD pixel images need to be handled to reconstruct hits in the SciFi.Fig. 3(a) shows a typical CCD image of an IIT from a cosmic-ray event. Afiber bundle, consisting of ten fiber sheets, is arranged to cover a sensitiveregion of an IIT effectively. Fig. 3(b) is an expanded view of (a), illustratinga typical “SciFi hit”, when a cosmic-ray muon passes through the fiber sheet.The hit reconstruction is performed in the following four steps:
1. Loading Hit Pixels The raw data of the SciFi consist of hit pixels inthe CCD coordinates (x, y) and 8 bits of ADC brightness. These are allencoded in one byte per pixel. Typically, there are 3,500 hit pixels in aneutrino event.
2. Finding Pixel Clusters A pixel cluster is determined by a group ofneighboring hit pixels. At this stage, isolated single pixel hits, coming fromrandom electrical noise of CCD, are rejected.
5
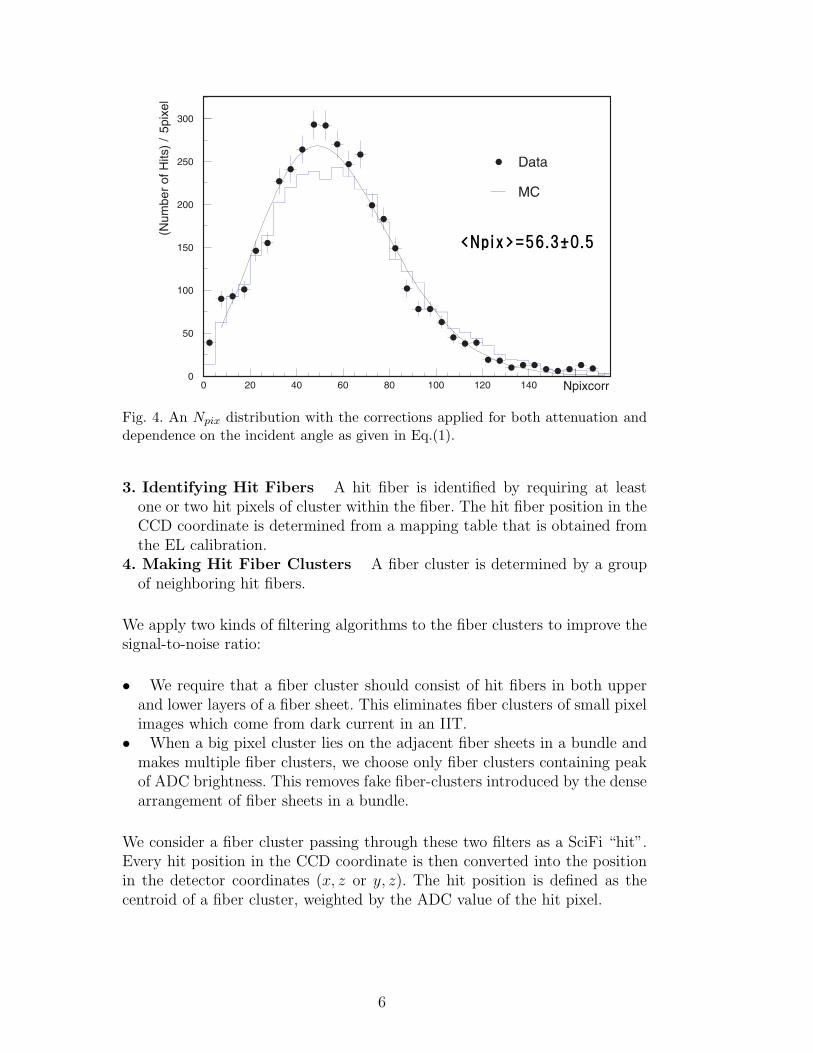
<Npix>=56.3+0.5
-
Fig. 4. An Npix distribution with the corrections applied for both attenuation anddependence on the incident angle as given in Eq.(1).
3. Identifying Hit Fibers A hit fiber is identified by requiring at leastone or two hit pixels of cluster within the fiber. The hit fiber position in theCCD coordinate is determined from a mapping table that is obtained fromthe EL calibration.
4. Making Hit Fiber Clusters A fiber cluster is determined by a groupof neighboring hit fibers.
We apply two kinds of filtering algorithms to the fiber clusters to improve thesignal-to-noise ratio:
• We require that a fiber cluster should consist of hit fibers in both upperand lower layers of a fiber sheet. This eliminates fiber clusters of small pixelimages which come from dark current in an IIT.
• When a big pixel cluster lies on the adjacent fiber sheets in a bundle andmakes multiple fiber clusters, we choose only fiber clusters containing peakof ADC brightness. This removes fake fiber-clusters introduced by the densearrangement of fiber sheets in a bundle.
We consider a fiber cluster passing through these two filters as a SciFi “hit”.Every hit position in the CCD coordinate is then converted into the positionin the detector coordinates (x, z or y, z). The hit position is defined as thecentroid of a fiber cluster, weighted by the ADC value of the hit pixel.
6
3.2 Number of pixels per hit(Npix) and its corrections
A found hit gives the number of pixels for the parent pixel cluster, Npix. LEDcalibration data show that Npix has good linearity with respect to the numberof photons injected to IIT. Since the intensity of observed light is proportionalto the energy loss in the fiber, Npix is expected to be a good estimator of theenergy of the parent particle.
Fig. 4 shows an Npix distribution for cosmic-ray muons. Based on a recon-structed track, Npix can be corrected to account for both the attenuation oflight in the fiber, and the dependence of light yields on the incident angle (θin)of a particle on a fiber sheet:
Npixcorr =F (l0)
F (l)× cosθin ×Npix. (1)
The first term is the correction for attenuation of the scintillation light inthe fiber and reflection at the far end of fiber coated with aluminum [5]. Thecorrection is normalized by the value in case of the light from the detectorcenter (l0=130cm). Thus, F (l) is given by:
F (l) = exp(−l + lgλ
) +R · exp(−2 · L− l + lg
λ), (2)
where l is the distance from the hit position to the near end of a fiber,lg(=100cm) is light guide length from the near end to the IIT, and λ(=323cm)is the attenuation length. R(=0.74) is the reflection coefficient at the far endof a fiber, and L(=254cm) is the length of a fiber.
The second term in Eq. (1) is the correction for the dependence of light yieldson the incident angle with respect to the fiber sheet. Here, θin=0 is perpen-dicular to the fiber sheet. Npixcorr is thus equivalent to Npix when a particlepasses fiber sheet at the center of the detector x/y planes with θin=0.
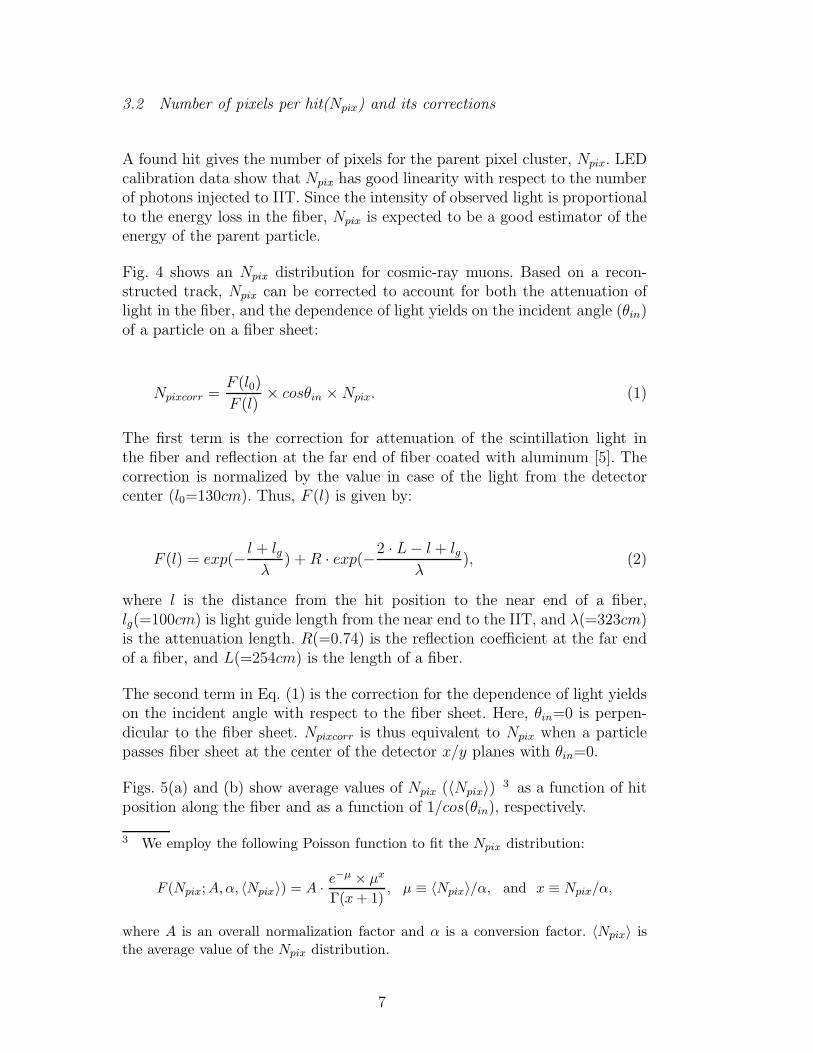
Figs. 5(a) and (b) show average values of Npix (〈Npix〉)3 as a function of hit
position along the fiber and as a function of 1/cos(θin), respectively.
3 We employ the following Poisson function to fit the Npix distribution:
F (Npix;A,α, 〈Npix〉) = A ·e−µ × µx
Γ(x+ 1), µ ≡ 〈Npix〉/α, and x ≡ Npix/α,
where A is an overall normalization factor and α is a conversion factor. 〈Npix〉 isthe average value of the Npix distribution.
7
(a) (b)
Fig. 5. An average value of Npix, 〈Npix〉, as a function of (a) hit position along thefiber and (b) 1/cosθin, where θin is the incident angle with respect to the fiber sheet,respectively. Solid (open) circles are before (after) the correction. The negative x, ycoordinates in (a) correspond to positions close to readout end of the fiber, and alarger value of 〈Npix〉 is expected before the correction.
3.3 Simulation of CCD hit pixels
To reproduce SciFi hits accurately in the K2K Monte Carlo simulation, weinclude simulation of hit pixels on CCD due to charged particles and noise inthe following three steps:
1. Charged particles are tracked through the detector using GEANT[6]. Theenergy loss of a particle traversing a fiber is computed and then convertedto the number of photoelectrons observed by the IIT/CCD imaging system,taking into account attentuation along the fiber, reflection by the aluminiumcoated at the end of a fiber, and the quantum efficiency of the IIT photo-cathodes.
2. The photoelectrons are converted to an image on the CCD camera surface.Individual photoelectrons are distributed around the fiber center accordingto a gaussian distribution with parameters determined using data of a sin-gle photoelectrons from LED calibration run. The size of the pixel clustercorresponding to the single photoelectron is then chosen from distributionsof the LED data, and the pixel cluster is simulated accordingly. The energyscale is tuned for each IIT using cosmic-ray muon data.
3. Random noise in a pixel cluster is generated for each IIT based on neutrino-beam data.
Two kinds of noise pixels are generated. One is isolated single hit pixels aroundthe main pixel cluster of a charged track in step 2.. The other is random noisepixels in a pixel cluster generated in step 3.. The total number of noise hitsaveraged over IITs is 1.67 for MC and 1.72 for cosmic-ray data. Based on thepixel simulation, the average number of noise hits is expected to be 70 perevent. In the cosmic-ray data we find 52 hits per event due to the random
8
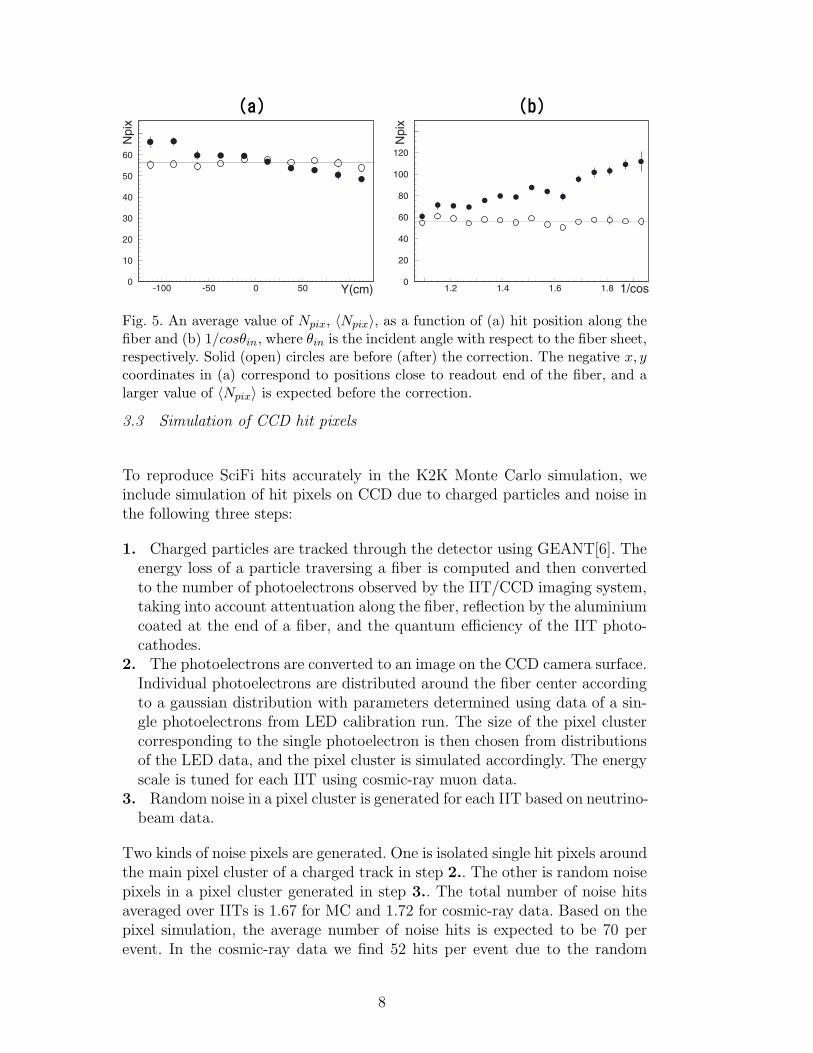
Fig. 6. Hit finding efficiency ǫhit obtained from cosmic-ray data
noise of CCD, and 17 hits per event due to the beam associated background.The noise rate is quite low, considering the total number of fibers (274,080).
3.4 Efficiency and Stability of Hit Reconstruction
We can obtain the hit finding efficiency ǫhit which is defined as:
ǫhit =Number of observed hits
Number of expected hits, (3)
where the expected number of hits (denominator) is obtained from the infor-mation of reconstructed tracks. Fig. 6 shows ǫhit for each IIT. Data and MonteCarlo shows a good agreement.
Cosmic-ray data are taken during the normal data-taking period, roughlyonce every two weeks. The efficiency is monitored using the data as a checkof detector stability.
We have performed a similar check on the stability of hit finding efficiencyusing the neutrino data. Clean single track events are selected by requiringa track with the number of hit layers larger than nine, and its matching toactivity in the downstream VETO counter.
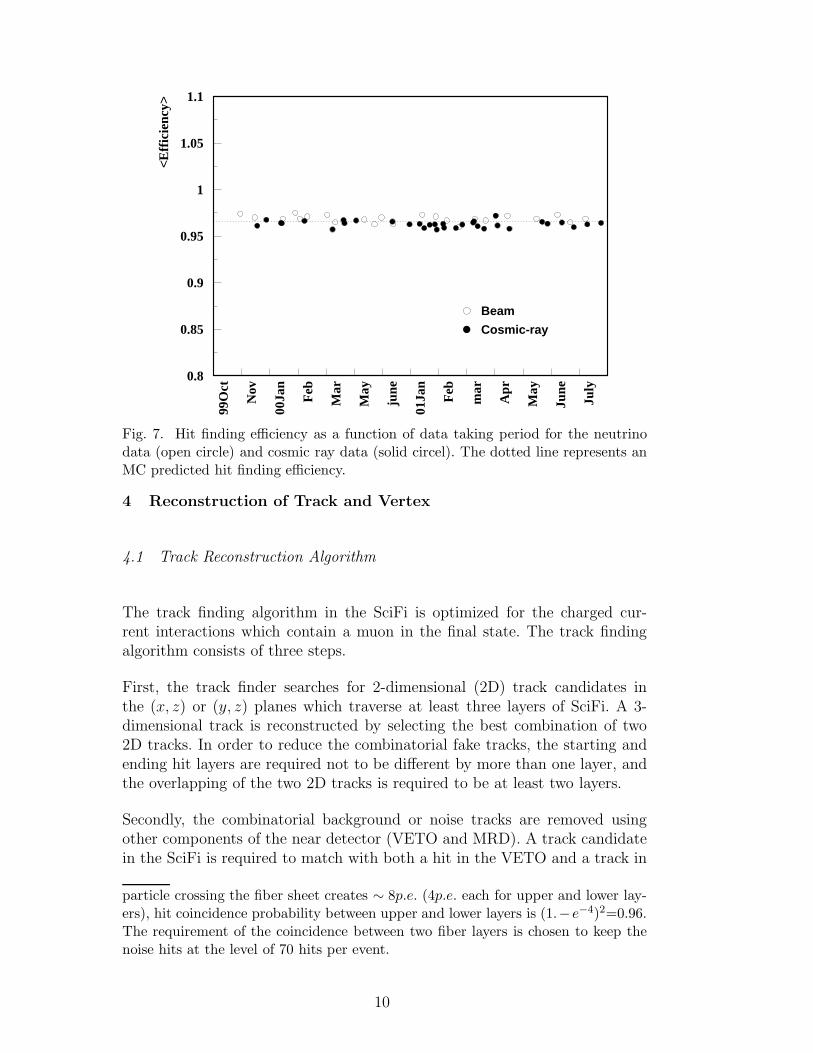
Fig. 7 shows hit finding efficiency, which is obtained by taking average over allIIT’s, as a function of data-taking period. The dotted line at 96.8% representsan MC prediction. For the cosmic-ray data, we find an average value of ǫhit tobe 96.5± 0.5% for all IIT’s and all time periods. 4 .
4 This is in good agreement with a simple estimation. When a minimum ionizing
9
0.8
0.85
0.9
0.95
1
1.05
1.1
99O
ct
Nov
00Ja
n
Feb
Mar
May
june
01Ja
n
Feb
mar
Apr
May
June
July
<Eff
icie
ncy>
Beam
Cosmic-ray
Fig. 7. Hit finding efficiency as a function of data taking period for the neutrinodata (open circle) and cosmic ray data (solid circel). The dotted line represents anMC predicted hit finding efficiency.
4 Reconstruction of Track and Vertex
4.1 Track Reconstruction Algorithm
The track finding algorithm in the SciFi is optimized for the charged cur-rent interactions which contain a muon in the final state. The track findingalgorithm consists of three steps.
First, the track finder searches for 2-dimensional (2D) track candidates inthe (x, z) or (y, z) planes which traverse at least three layers of SciFi. A 3-dimensional track is reconstructed by selecting the best combination of two2D tracks. In order to reduce the combinatorial fake tracks, the starting andending hit layers are required not to be different by more than one layer, andthe overlapping of the two 2D tracks is required to be at least two layers.
Secondly, the combinatorial background or noise tracks are removed usingother components of the near detector (VETO and MRD). A track candidatein the SciFi is required to match with both a hit in the VETO and a track in
particle crossing the fiber sheet creates ∼ 8p.e. (4p.e. each for upper and lower lay-ers), hit coincidence probability between upper and lower layers is (1.−e−4)2=0.96.The requirement of the coincidence between two fiber layers is chosen to keep thenoise hits at the level of 70 hits per event.
10
the MRD.
Once a good primary track is found, the most upstream hit-position of theprimary track is considered as a neutrino interaction point. The track finderstarts searching for extra tracks near the neutrino interaction point. Thesetracks are mostly short tracks with two or more SciFi hits. This method ofextra track finding turns out to be an effective way to find short tracks ofprotons and/or pions from the neutrino interactions. All the reconstructedtracks are subjected to a “global fit”, a straight line fit to the found hits.
4.2 Alignment and Position Resolution
The geometry of the SciFi and its support structure was surveyed by mechan-ical means after their installation was completed. Based on the mechanicalsurvey, the alignment of fibers is estimated to be good to within 5mm.
A better alignment was obtained by minimizing the sum of the squared hit-residuals using the global fit for cosmic ray tracks. From the mean shift of thehit residuals, we find the accuracy of the alignment to be ∼400µm.
Multiple scatterings occurring in the SciFi is not negligible compared with thesize of a fiber. A Kalman filtering technique [7] [8] [9] can be employed to takethe multiple scattering into account and, in principle, removes the multiplescattering effect during track fitting. The technique calculates the error of atrack fit relatively quickly, and avoids the tedious matrix inversion by theglobal fit. A track fit using the Kalman filtering technique is used to estimatethe detector resolution more accurately and to obtain a better alignment. Theimplementation adopts the prescriptions described in Refs. [9] and [10].
Some curvature was introduced in the fiber sheets due to bending when theywere glued to a fiber module. Production of the fiber modules is described inRef. [5]. The curvature of a fiber sheet causes displacement from the alignedfiber-position and results in a rotational misalignment. The bending of everyfiber sheet was measured after each fiber module was assembled. The curvatureof a fiber sheet was then obtained by fitting the measured fiber bendings to aforth-order polynomial, and used to correct the rotational misalignment.
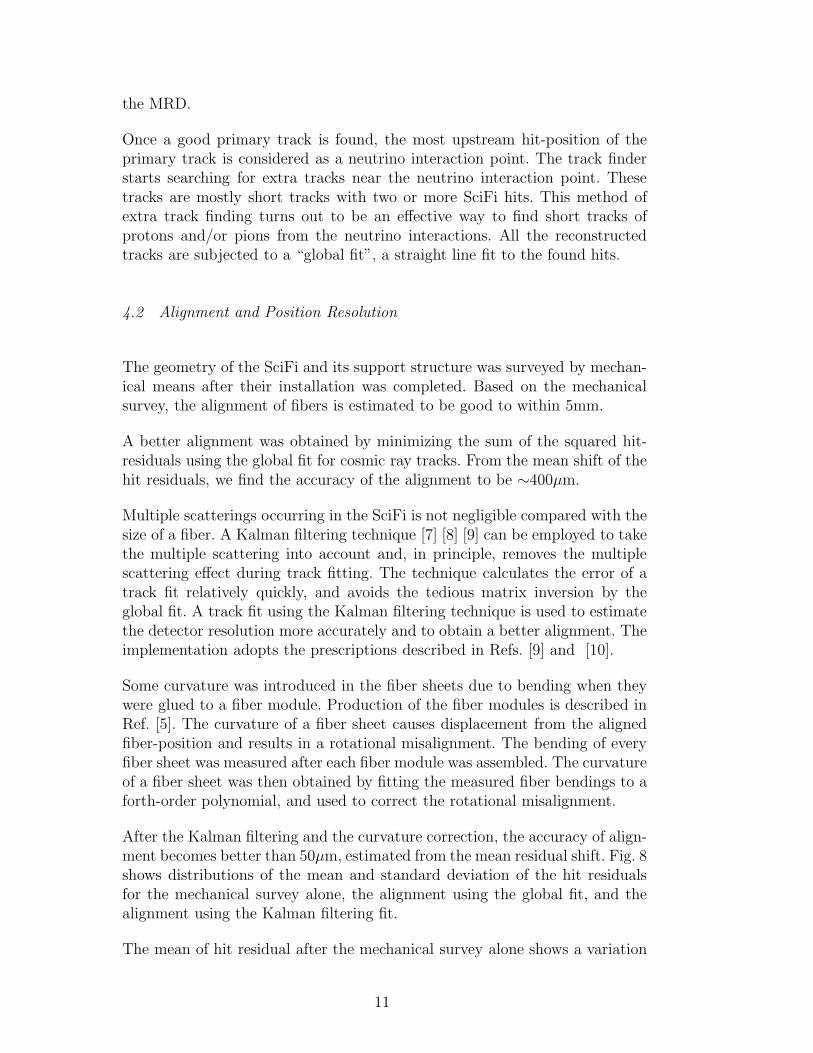
After the Kalman filtering and the curvature correction, the accuracy of align-ment becomes better than 50µm, estimated from the mean residual shift. Fig. 8shows distributions of the mean and standard deviation of the hit residualsfor the mechanical survey alone, the alignment using the global fit, and thealignment using the Kalman filtering fit.
The mean of hit residual after the mechanical survey alone shows a variation
11
Layer Number
(a)
Mea
n(H
it R
esid
ual)
(cm
)
Layer Number
(b)
σ(H
it R
esid
ual)
(cm
)
Fig. 8. (a) Means of hit residual and (b) standard deviations as a function of layersin y−z plane. Points are for the mechanical survey alone (open star), the alignmentusing the global fit (open circle), and the alignment using the Kalman filtering (solidcircle).
as large as 1cm. After the alignment using the global fit, the variation becomessmaller than 400µm. After the alignment using the Kalman filtering fit, thevariation becomes at most 50µm. The standard deviations of the hit residualalso exhibit such improvements of fiber alignment as the mean values. Thereare a few layers with large standard deviations of hit residual, compared withother layers. These are the outer most layers and indeed bent more than the
12
rest of inner layers.
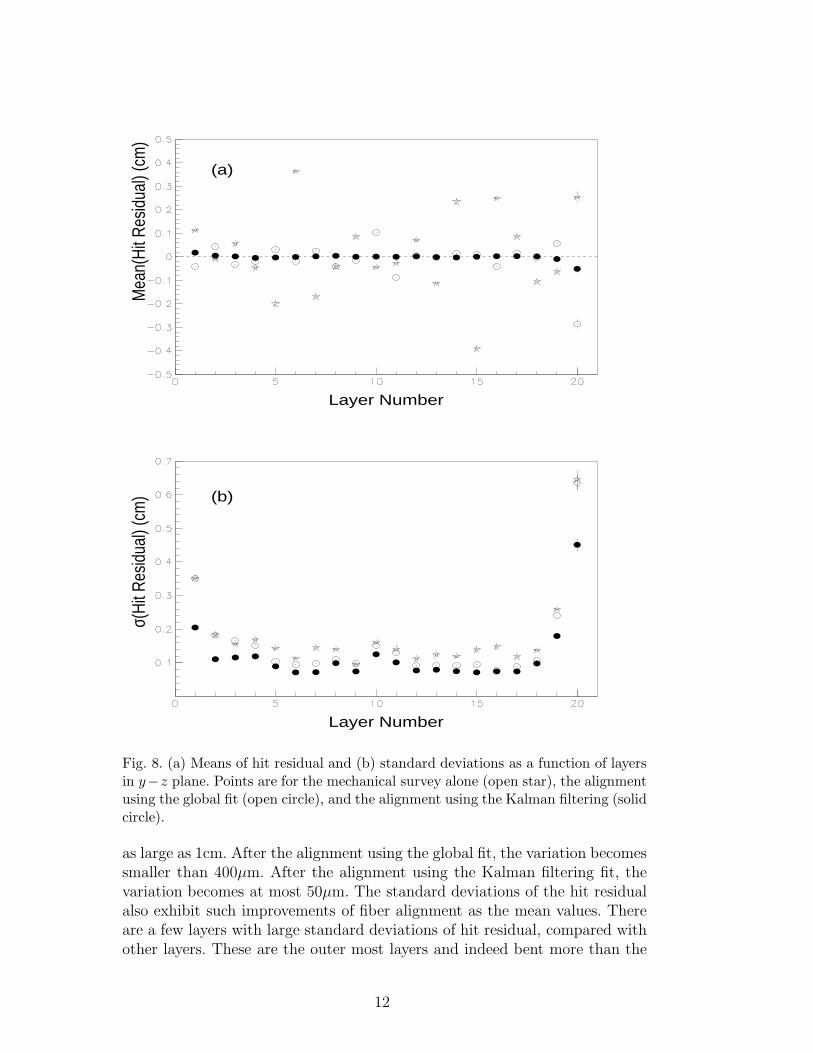
The alignment is checked using periodically taken cosmic-ray data. Fig. 9shows the variation in the mean values of hit residuals since May 1999, andthe variation is found to be less than 100µm.
Layer Number
Nov99-May99Jun00-May99Jan01-May99
∆<H
it R
esid
ual>
(cm
)
Fig. 9. The variation in the mean of hit residual, obtained from cosmic-ray data, asa function of layers in x− z plane (1-20) and y − z plane (21-40). The variation istaken relative to May 1999. The dotted line represents the variations of ±100µm.
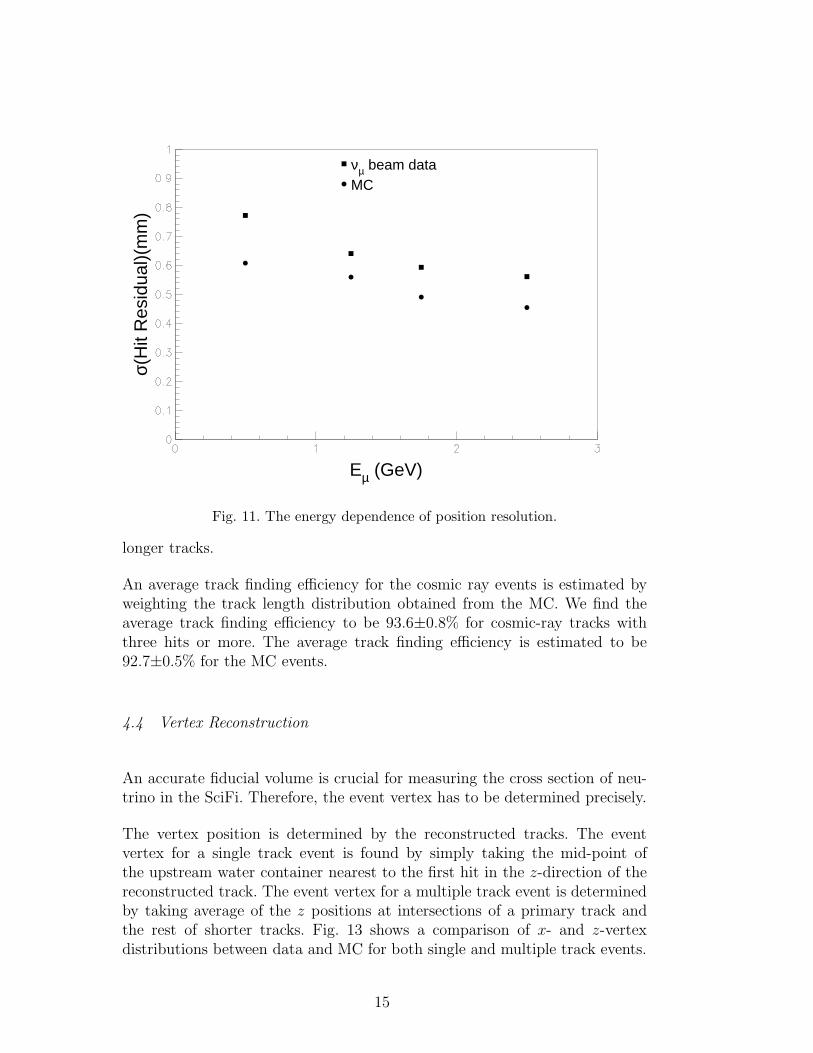
The neutrino data with the Kalman filtering fit are used to obtain the bestestimation for the position resolution. Fig. 10 shows the hit residual distri-bution using neutrino data. The position resolution is 0.73mm (0.61mm) formuon energy Eµ < 1GeV ( Eµ > 1GeV). The overall position resolution is0.64±0.07mm. Fig. 11 shows the energy dependence of the resolution. Theeffect of multiple scattering on the position resolution decreases as the muonenergy increases. The MC prediction explains the overall energy dependence.The difference between data and MC, ∼100µmm, is regarded as the system-atic error of our detector. The position resolution of 0.6mm is regarded as thatof the SciFi without the multiple scattering effect
13
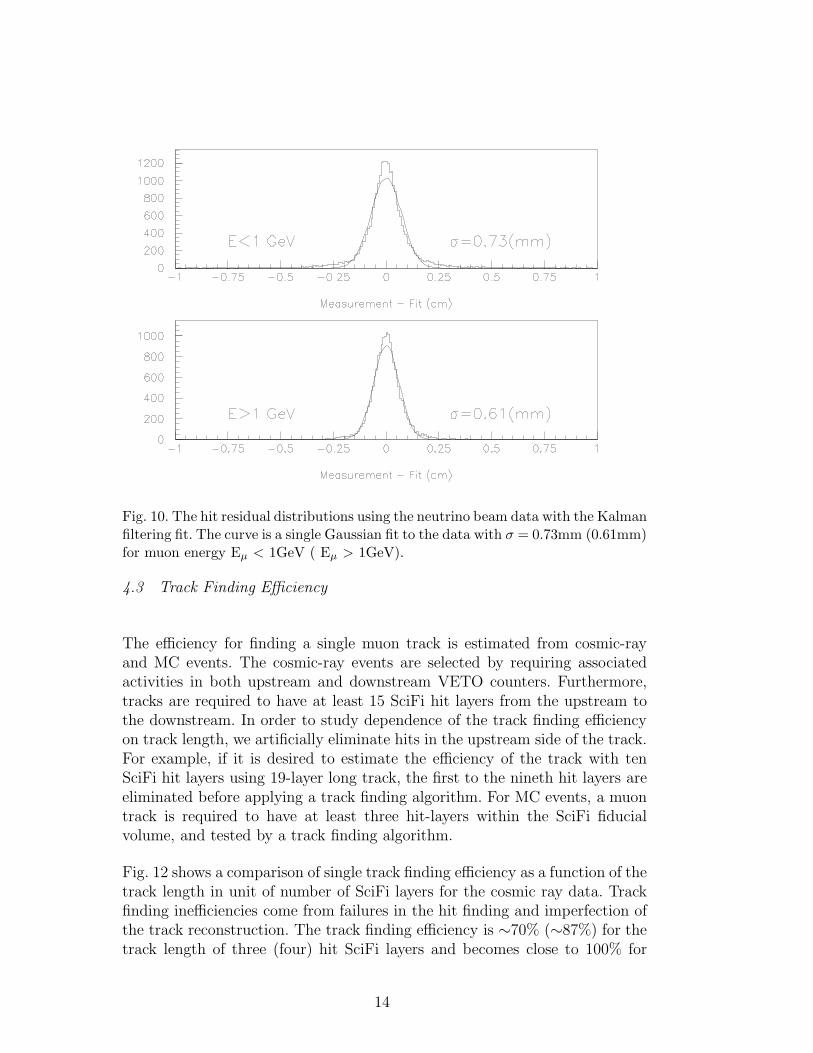
Fig. 10. The hit residual distributions using the neutrino beam data with the Kalmanfiltering fit. The curve is a single Gaussian fit to the data with σ = 0.73mm (0.61mm)for muon energy Eµ < 1GeV ( Eµ > 1GeV).
4.3 Track Finding Efficiency
The efficiency for finding a single muon track is estimated from cosmic-rayand MC events. The cosmic-ray events are selected by requiring associatedactivities in both upstream and downstream VETO counters. Furthermore,tracks are required to have at least 15 SciFi hit layers from the upstream tothe downstream. In order to study dependence of the track finding efficiencyon track length, we artificially eliminate hits in the upstream side of the track.For example, if it is desired to estimate the efficiency of the track with tenSciFi hit layers using 19-layer long track, the first to the nineth hit layers areeliminated before applying a track finding algorithm. For MC events, a muontrack is required to have at least three hit-layers within the SciFi fiducialvolume, and tested by a track finding algorithm.
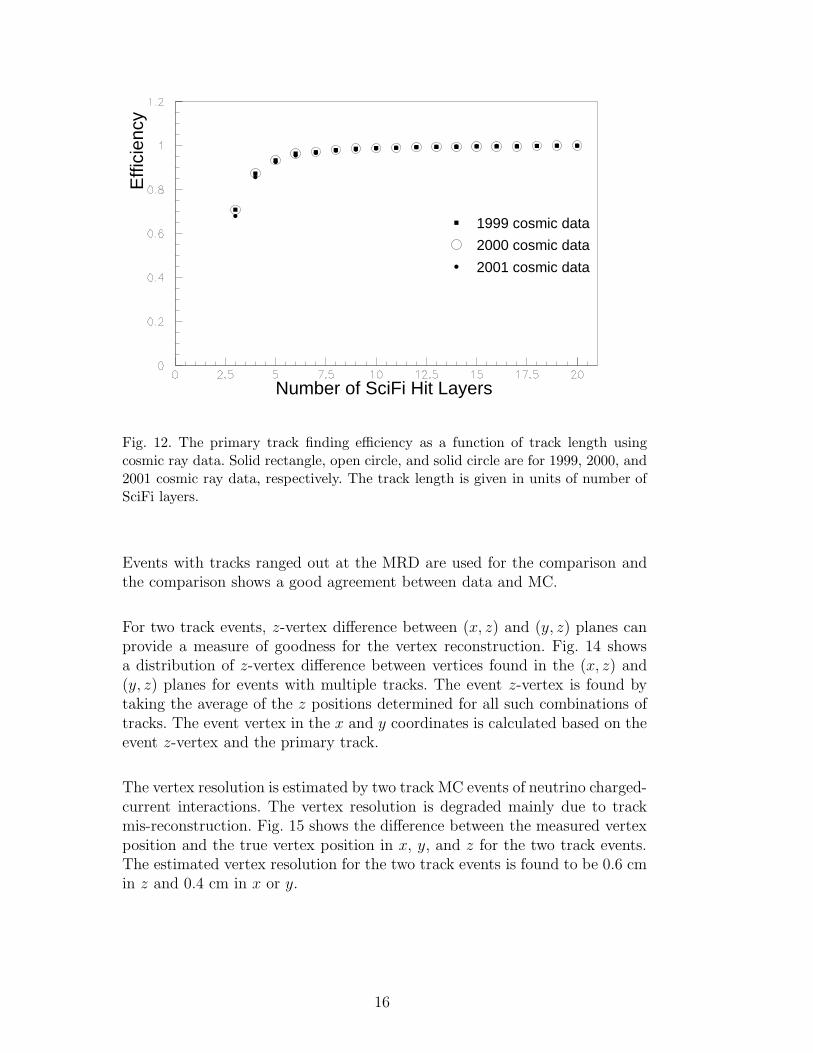
Fig. 12 shows a comparison of single track finding efficiency as a function of thetrack length in unit of number of SciFi layers for the cosmic ray data. Trackfinding inefficiencies come from failures in the hit finding and imperfection ofthe track reconstruction. The track finding efficiency is ∼70% (∼87%) for thetrack length of three (four) hit SciFi layers and becomes close to 100% for
14
Eµ (GeV)
σ(H
it R
esid
ual)(
mm
)νµ beam dataMC
Fig. 11. The energy dependence of position resolution.
longer tracks.
An average track finding efficiency for the cosmic ray events is estimated byweighting the track length distribution obtained from the MC. We find theaverage track finding efficiency to be 93.6±0.8% for cosmic-ray tracks withthree hits or more. The average track finding efficiency is estimated to be92.7±0.5% for the MC events.
4.4 Vertex Reconstruction
An accurate fiducial volume is crucial for measuring the cross section of neu-trino in the SciFi. Therefore, the event vertex has to be determined precisely.
The vertex position is determined by the reconstructed tracks. The eventvertex for a single track event is found by simply taking the mid-point ofthe upstream water container nearest to the first hit in the z-direction of thereconstructed track. The event vertex for a multiple track event is determinedby taking average of the z positions at intersections of a primary track andthe rest of shorter tracks. Fig. 13 shows a comparison of x- and z-vertexdistributions between data and MC for both single and multiple track events.
15
Effi
cien
cy
Number of SciFi Hit Layers
1999 cosmic data
2001 cosmic data
2000 cosmic data
Fig. 12. The primary track finding efficiency as a function of track length usingcosmic ray data. Solid rectangle, open circle, and solid circle are for 1999, 2000, and2001 cosmic ray data, respectively. The track length is given in units of number ofSciFi layers.
Events with tracks ranged out at the MRD are used for the comparison andthe comparison shows a good agreement between data and MC.
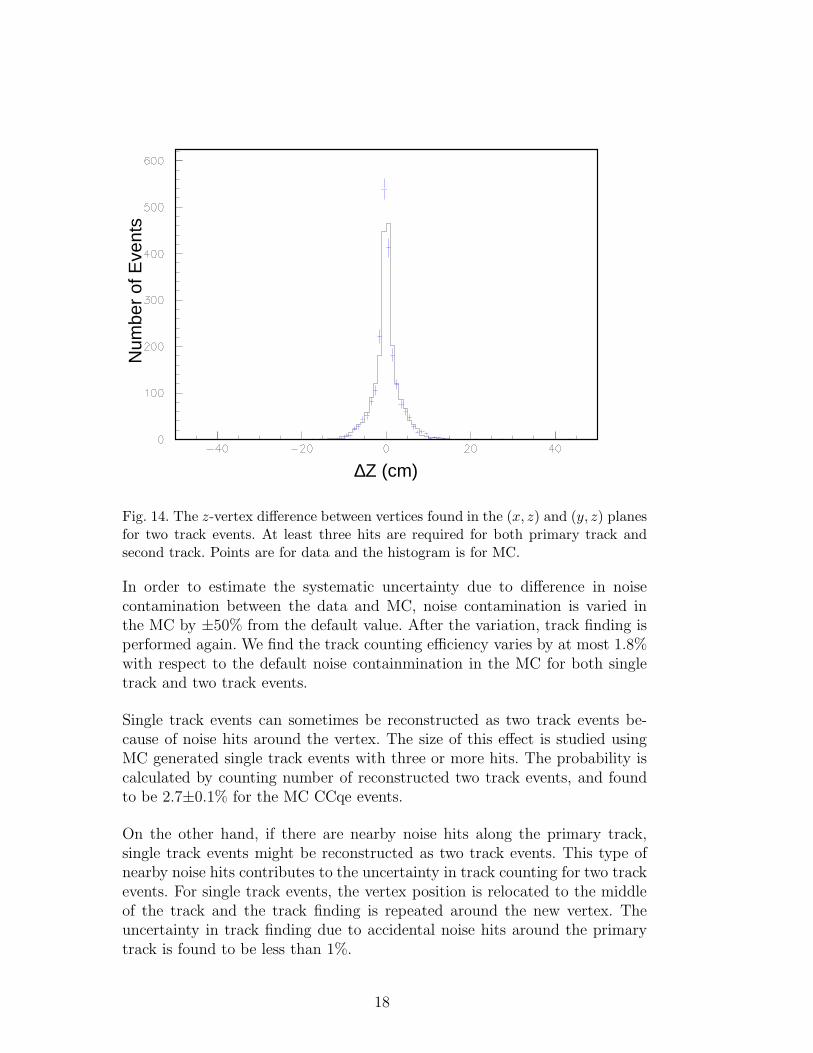
For two track events, z-vertex difference between (x, z) and (y, z) planes canprovide a measure of goodness for the vertex reconstruction. Fig. 14 showsa distribution of z-vertex difference between vertices found in the (x, z) and(y, z) planes for events with multiple tracks. The event z-vertex is found bytaking the average of the z positions determined for all such combinations oftracks. The event vertex in the x and y coordinates is calculated based on theevent z-vertex and the primary track.
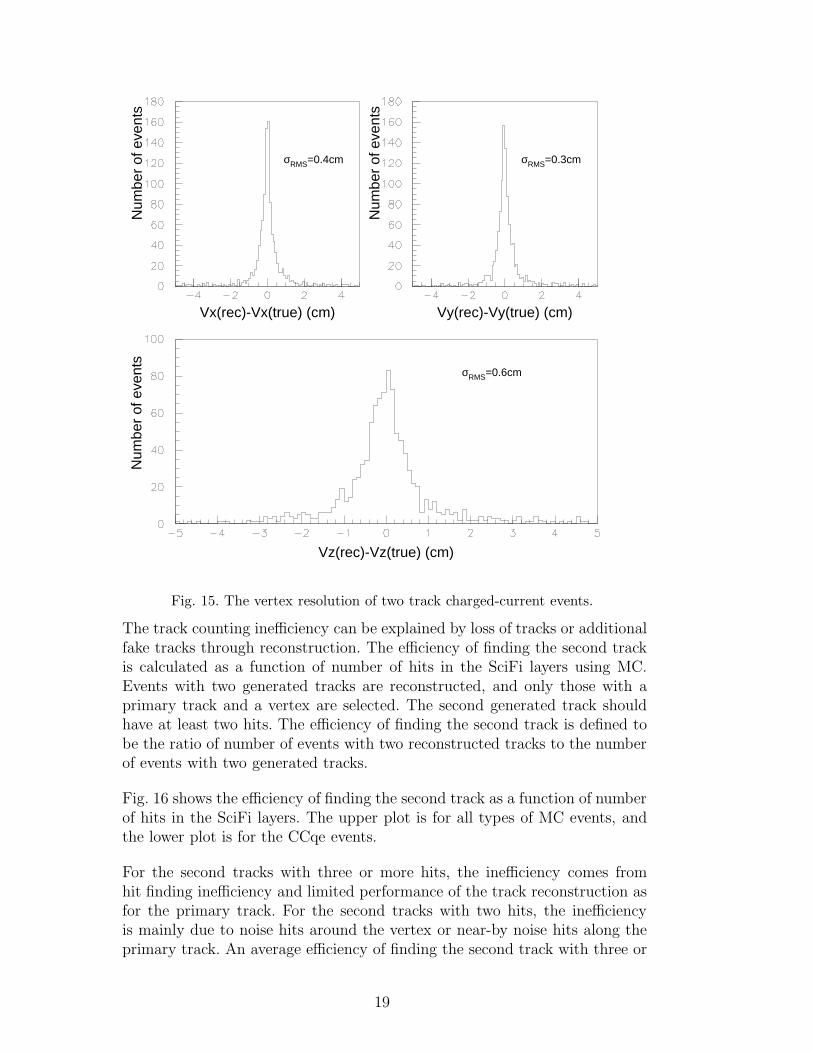
The vertex resolution is estimated by two track MC events of neutrino charged-current interactions. The vertex resolution is degraded mainly due to trackmis-reconstruction. Fig. 15 shows the difference between the measured vertexposition and the true vertex position in x, y, and z for the two track events.The estimated vertex resolution for the two track events is found to be 0.6 cmin z and 0.4 cm in x or y.
16
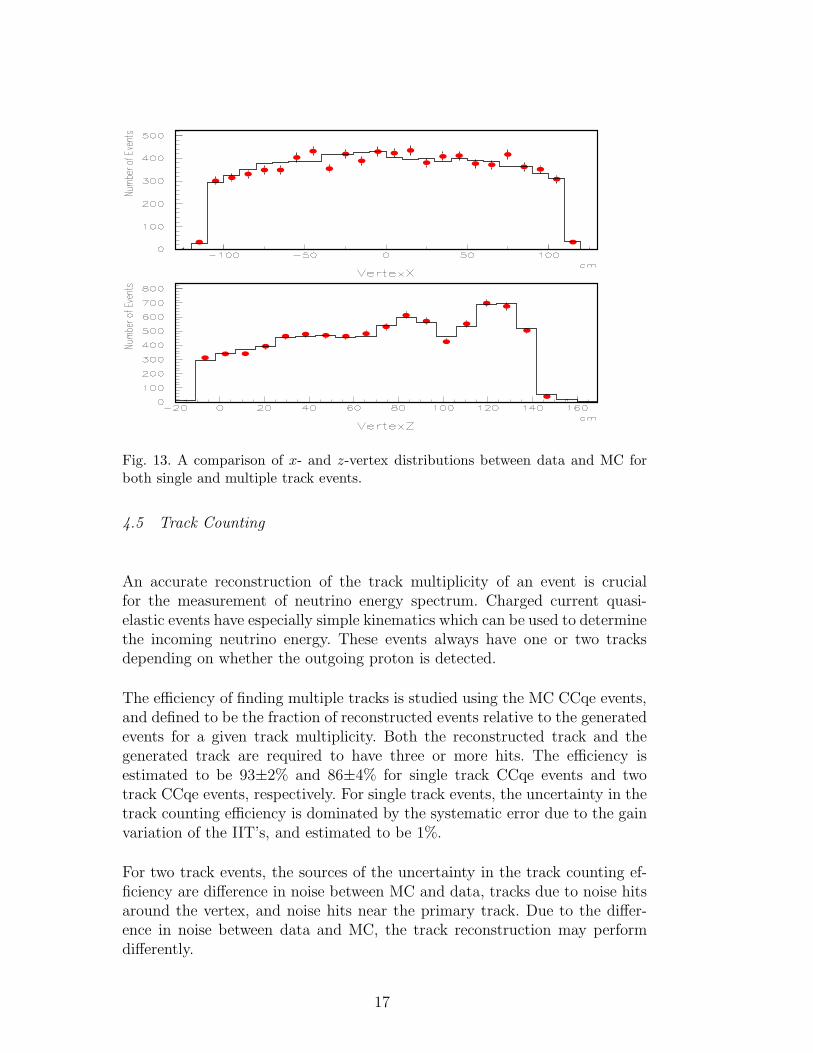
Fig. 13. A comparison of x- and z-vertex distributions between data and MC forboth single and multiple track events.
4.5 Track Counting
An accurate reconstruction of the track multiplicity of an event is crucialfor the measurement of neutrino energy spectrum. Charged current quasi-elastic events have especially simple kinematics which can be used to determinethe incoming neutrino energy. These events always have one or two tracksdepending on whether the outgoing proton is detected.
The efficiency of finding multiple tracks is studied using the MC CCqe events,and defined to be the fraction of reconstructed events relative to the generatedevents for a given track multiplicity. Both the reconstructed track and thegenerated track are required to have three or more hits. The efficiency isestimated to be 93±2% and 86±4% for single track CCqe events and twotrack CCqe events, respectively. For single track events, the uncertainty in thetrack counting efficiency is dominated by the systematic error due to the gainvariation of the IIT’s, and estimated to be 1%.
For two track events, the sources of the uncertainty in the track counting ef-ficiency are difference in noise between MC and data, tracks due to noise hitsaround the vertex, and noise hits near the primary track. Due to the differ-ence in noise between data and MC, the track reconstruction may performdifferently.
17
Num
ber
of E
vent
s
∆Z (cm)
Fig. 14. The z-vertex difference between vertices found in the (x, z) and (y, z) planesfor two track events. At least three hits are required for both primary track andsecond track. Points are for data and the histogram is for MC.
In order to estimate the systematic uncertainty due to difference in noisecontamination between the data and MC, noise contamination is varied inthe MC by ±50% from the default value. After the variation, track finding isperformed again. We find the track counting efficiency varies by at most 1.8%with respect to the default noise containmination in the MC for both singletrack and two track events.
Single track events can sometimes be reconstructed as two track events be-cause of noise hits around the vertex. The size of this effect is studied usingMC generated single track events with three or more hits. The probability iscalculated by counting number of reconstructed two track events, and foundto be 2.7±0.1% for the MC CCqe events.
On the other hand, if there are nearby noise hits along the primary track,single track events might be reconstructed as two track events. This type ofnearby noise hits contributes to the uncertainty in track counting for two trackevents. For single track events, the vertex position is relocated to the middleof the track and the track finding is repeated around the new vertex. Theuncertainty in track finding due to accidental noise hits around the primarytrack is found to be less than 1%.
18
Vx(rec)-Vx(true) (cm)
σRMS=0.4cm
Num
ber
of e
vent
s
Vy(rec)-Vy(true) (cm)
σRMS=0.3cm
Num
ber
of e
vent
s
Vz(rec)-Vz(true) (cm)
σRMS=0.6cm
Num
ber
of e
vent
s
Fig. 15. The vertex resolution of two track charged-current events.
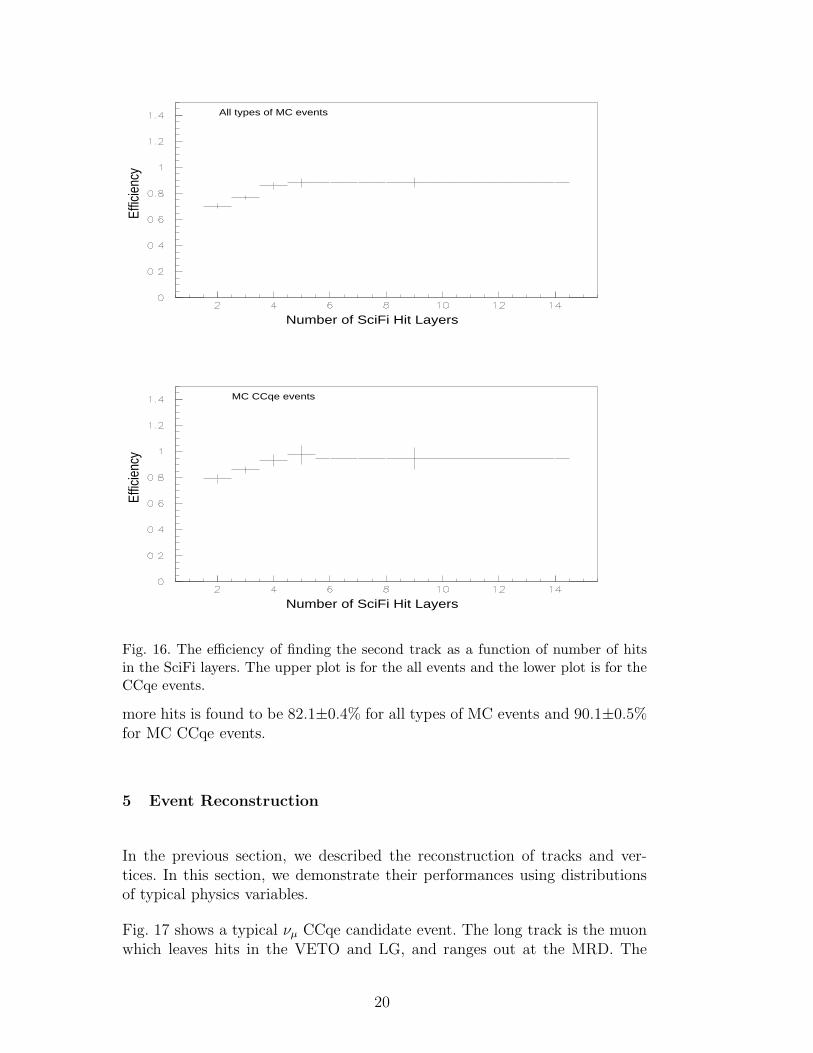
The track counting inefficiency can be explained by loss of tracks or additionalfake tracks through reconstruction. The efficiency of finding the second trackis calculated as a function of number of hits in the SciFi layers using MC.Events with two generated tracks are reconstructed, and only those with aprimary track and a vertex are selected. The second generated track shouldhave at least two hits. The efficiency of finding the second track is defined tobe the ratio of number of events with two reconstructed tracks to the numberof events with two generated tracks.
Fig. 16 shows the efficiency of finding the second track as a function of numberof hits in the SciFi layers. The upper plot is for all types of MC events, andthe lower plot is for the CCqe events.
For the second tracks with three or more hits, the inefficiency comes fromhit finding inefficiency and limited performance of the track reconstruction asfor the primary track. For the second tracks with two hits, the inefficiencyis mainly due to noise hits around the vertex or near-by noise hits along theprimary track. An average efficiency of finding the second track with three or
19
Effic
ienc
y
Number of SciFi Hit Layers
All types of MC events
Effic
ienc
y
Number of SciFi Hit Layers
MC CCqe events
Fig. 16. The efficiency of finding the second track as a function of number of hitsin the SciFi layers. The upper plot is for the all events and the lower plot is for theCCqe events.
more hits is found to be 82.1±0.4% for all types of MC events and 90.1±0.5%for MC CCqe events.
5 Event Reconstruction
In the previous section, we described the reconstruction of tracks and ver-tices. In this section, we demonstrate their performances using distributionsof typical physics variables.
Fig. 17 shows a typical νµ CCqe candidate event. The long track is the muonwhich leaves hits in the VETO and LG, and ranges out at the MRD. The
20
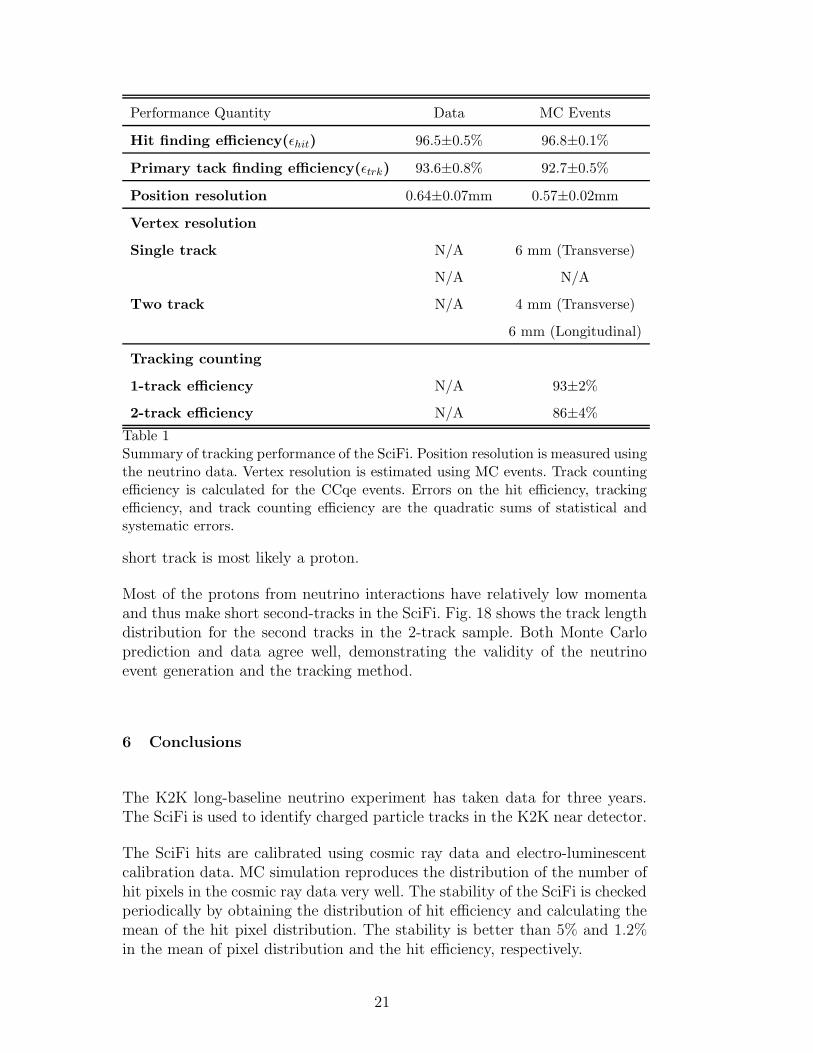
Performance Quantity Data MC Events
Hit finding efficiency(ǫhit) 96.5±0.5% 96.8±0.1%
Primary tack finding efficiency(ǫtrk) 93.6±0.8% 92.7±0.5%
Position resolution 0.64±0.07mm 0.57±0.02mm
Vertex resolution
Single track N/A 6 mm (Transverse)
N/A N/A
Two track N/A 4 mm (Transverse)
6 mm (Longitudinal)
Tracking counting
1-track efficiency N/A 93±2%
2-track efficiency N/A 86±4%
Table 1Summary of tracking performance of the SciFi. Position resolution is measured usingthe neutrino data. Vertex resolution is estimated using MC events. Track countingefficiency is calculated for the CCqe events. Errors on the hit efficiency, trackingefficiency, and track counting efficiency are the quadratic sums of statistical andsystematic errors.
short track is most likely a proton.
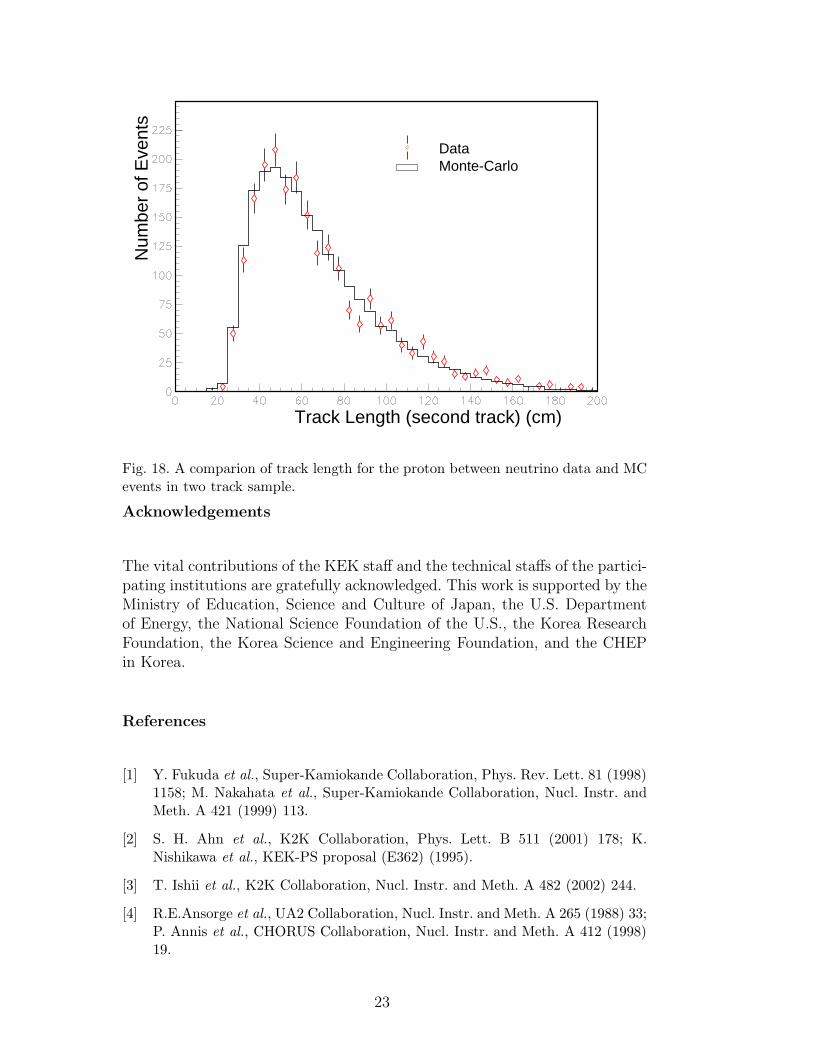
Most of the protons from neutrino interactions have relatively low momentaand thus make short second-tracks in the SciFi. Fig. 18 shows the track lengthdistribution for the second tracks in the 2-track sample. Both Monte Carloprediction and data agree well, demonstrating the validity of the neutrinoevent generation and the tracking method.
6 Conclusions
The K2K long-baseline neutrino experiment has taken data for three years.The SciFi is used to identify charged particle tracks in the K2K near detector.
The SciFi hits are calibrated using cosmic ray data and electro-luminescentcalibration data. MC simulation reproduces the distribution of the number ofhit pixels in the cosmic ray data very well. The stability of the SciFi is checkedperiodically by obtaining the distribution of hit efficiency and calculating themean of the hit pixel distribution. The stability is better than 5% and 1.2%in the mean of pixel distribution and the hit efficiency, respectively.
21
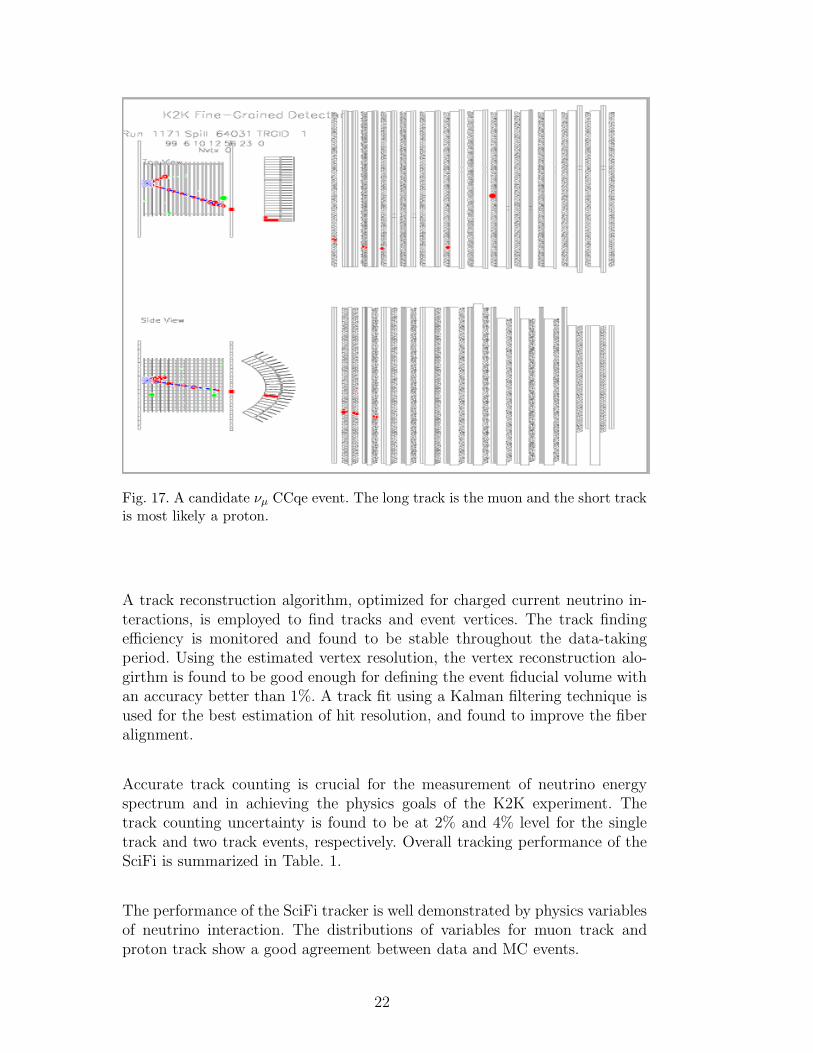
Fig. 17. A candidate νµ CCqe event. The long track is the muon and the short trackis most likely a proton.
A track reconstruction algorithm, optimized for charged current neutrino in-teractions, is employed to find tracks and event vertices. The track findingefficiency is monitored and found to be stable throughout the data-takingperiod. Using the estimated vertex resolution, the vertex reconstruction alo-girthm is found to be good enough for defining the event fiducial volume withan accuracy better than 1%. A track fit using a Kalman filtering technique isused for the best estimation of hit resolution, and found to improve the fiberalignment.
Accurate track counting is crucial for the measurement of neutrino energyspectrum and in achieving the physics goals of the K2K experiment. Thetrack counting uncertainty is found to be at 2% and 4% level for the singletrack and two track events, respectively. Overall tracking performance of theSciFi is summarized in Table. 1.
The performance of the SciFi tracker is well demonstrated by physics variablesof neutrino interaction. The distributions of variables for muon track andproton track show a good agreement between data and MC events.
22
Track Length (second track) (cm)
Num
ber
of E
vent
sDataMonte-Carlo
Fig. 18. A comparion of track length for the proton between neutrino data and MCevents in two track sample.
Acknowledgements
The vital contributions of the KEK staff and the technical staffs of the partici-pating institutions are gratefully acknowledged. This work is supported by theMinistry of Education, Science and Culture of Japan, the U.S. Departmentof Energy, the National Science Foundation of the U.S., the Korea ResearchFoundation, the Korea Science and Engineering Foundation, and the CHEPin Korea.
References
[1] Y. Fukuda et al., Super-Kamiokande Collaboration, Phys. Rev. Lett. 81 (1998)1158; M. Nakahata et al., Super-Kamiokande Collaboration, Nucl. Instr. andMeth. A 421 (1999) 113.
[2] S. H. Ahn et al., K2K Collaboration, Phys. Lett. B 511 (2001) 178; K.Nishikawa et al., KEK-PS proposal (E362) (1995).
[3] T. Ishii et al., K2K Collaboration, Nucl. Instr. and Meth. A 482 (2002) 244.
[4] R.E.Ansorge et al., UA2 Collaboration, Nucl. Instr. and Meth. A 265 (1988) 33;P. Annis et al., CHORUS Collaboration, Nucl. Instr. and Meth. A 412 (1998)19.
23
[5] A. Suzuki et al., K2K Collaboration, Nucl. Instr. and Meth. A 453 (2000) 165.
[6] R. Brun et al., GEANT3, CERN DD//EE/84-1, revised 1987.
[7] R.E. Kalman, Trans. ASME, J. Bas. Eng. 82D (1960) 35 ; and R.E. Kalmanand R.S. Bucy, Trans. ASME, J. Bas. Eng. 83D (1961) 95.
[8] P. Billoir, Nucl. Instr. and Meth. 225 (1984) 352.
[9] R. Fruhwirth, Nucl. Instr. and Meth. A262 (1987) 444.
[10] V. Innocente and E. Nagy, Nucl. Instr. and Meth. A324 (1993) 297; E. J.Wolin and L. L. Ho, Nucl. Instr. and Meth. A329 (1993) 493; and R. Harr,IEEE Trans. on Nucl. Sci. V42 (1995) 134.
24


![arXiv:1604.00857v2 [hep-ex] 20 Jun 2016 · 2018. 11. 8. · arXiv:1604.00857v2 [hep-ex] 20 Jun 2016 BABAR-PUB-15/009 SLAC-PUB-16505 Measurement of theneutral D meson mixing parameters](https://img.pdfslide.tips/doc/110x75/607c1126624ff633a376b036/arxiv160400857v2-hep-ex-20-jun-2016-2018-11-8-arxiv160400857v2-hep-ex.jpg)


![arXiv:1205.3387v2 [nucl-ex] 28 Jun 2012](https://img.pdfslide.tips/doc/110x75/620a6c82fe5cfd2a9f3fdc94/arxiv12053387v2-nucl-ex-28-jun-2012.jpg)