Embed Size (px)
Citation preview

8/20/2019 Asa Tr Ftech
http://slidepdf.com/reader/full/asa-tr-ftech 1/84
feed Technology
T e c
h ni c a
l R e p
or t S e
r i e s

8/20/2019 Asa Tr Ftech
http://slidepdf.com/reader/full/asa-tr-ftech 2/84
Published by American Soybean Association
International Marketing Southeast Asia
541 Orchard Road#11-03 Liat TowersSingapore 238881 Tel: (65) 6737 6233Fax: (65) 6737 5849Email: [email protected]: www.asasea.com
Copyright© 2006 American Soybean Association
International Marketing Southeast AsiaM04GX19403-082005-0500

8/20/2019 Asa Tr Ftech
http://slidepdf.com/reader/full/asa-tr-ftech 3/84
TechnicalReportSeries
feed Technology

8/20/2019 Asa Tr Ftech
http://slidepdf.com/reader/full/asa-tr-ftech 4/84
8/20/2019 Asa Tr Ftech
http://slidepdf.com/reader/full/asa-tr-ftech 5/84
feed Technology
T a b l e Of C o
n t e n t s
1. The Art (Science) of Pelleting 5
Keith C. Behnke
2. Post-Pelleting Liquid Application: A Practical Guide 10
Doug Decksheimer
3. Troubleshooting the Pelleting Process 17
John D. Payne
4. Particle Size Reduction for Animal Feeds 24
Doug Reuscher
5. Handling and Storage of Soybeans and Soybean Meal 34
Ulysses A. Acasio
6. Grain Storage: Considerations to Maintain Quality 44
Mark A. Myers
7. Oilseed Processing Modernization Opportunities 49Dan Andersen
8. Step Grinding for Improved Efficiency 53
of Grain and Meal Products
Mark Heimann
9. A Perspective on Mixing and Mix Uniformity 56
Keith C. Behnke
10. Ensuring Optimum Mixability in Feed Manufacturing 63
Chin Sou Fei
11. High Speed Hammermills for Fine Grinding 70
Mark Heimann
12. Extrusion Equipment Design and Selection 76
Keith C. Behnke

8/20/2019 Asa Tr Ftech
http://slidepdf.com/reader/full/asa-tr-ftech 6/84

8/20/2019 Asa Tr Ftech
http://slidepdf.com/reader/full/asa-tr-ftech 7/84
f e
e d T e c h n ol o g y
5
The Art (Science) Of Pelleting
Keith C. Behnke
Kansas State University
USA
Pelleting has been, and continues to be, a popular processing technique in feed manufacturing. In basicterms, pelleting converts a finely ground blend of ingredients into dense, free flowing agglomerates(pellets). There are many reasons used to justify the process, but it may be appropriate to list just a few:
• improved animal performance,• decreased feed wastage,
• reduced selective feeding,• improved bulk density,• better material handling characteristics,• destruction of deleterious organisms, and• customer expectations.
Pelleting operations are not without cost. It is a fairly expensive process in terms of both capital andvariable costs, but the expense is usually justified in improved plant profit as well as animal performance.
The purpose of this paper is to discuss the pelleting process in terms of operations and to describehow the success or failure of the operation can impact on profits as well as animal performance.
The Process The formation of the pellet actually occurs at the "nip"between the rolls and the die. All other activities associatedwith the operation such as conditioning, cooling, etc. reallysupport and augment the action at that point in the system.
In order to understand the process and be in a position tomake intelligent decision to improve throughput, quality orappearance, one must have a thorough understanding of what happens at the nip point. Figure 1 is a representationof the die-roll assembly and will help the reader understandthe process.
Depending upon the physical characteristics of the feed, alesser or greater proportion of the work done by the pelletmill is used for compression. For example, if the formulacontains a high level of fibrous ingredients such as bagasse,bran, or ground alfalfa, the mill will expend a large amountof energy simply compressing the mash to the density of the subsequent pellet. Conversely, for a relatively dense feedsuch as high grain and soy meal, the mill will expend a lesseramount of energy for compression and a greater amountfor throughput.
The "extrusion area" shown in the figure is the point at which
the mash has reached pellet density and begins to flowthrough the die holes. There are many physical forces thatmust be dealt with in the pelleting process. Figure 2 is includedto familiarize the reader with some of the major forces involved.
Figure 1. Roll And Die Relationships
Figure 2. Physical Forces

8/20/2019 Asa Tr Ftech
http://slidepdf.com/reader/full/asa-tr-ftech 8/84
The Art (Science) Of Pelleting
6
f e e d T e c h n o l o g y
The primary purpose of the roll is to provide a force on the mash to densify the feed and cause it to
flow toward the die. The gap between the roll and the die, the roll surface characteristics and thephysical properties of the mash determine how great this potential force might be.
The die provides, not only the final diameter of the pellet, but the resistance force on the feed andhas a direct influence on throughput rate and pellet quality. These two forces (roll and die) are appositeeach other as shown in the diagram, but must work together to provide quality pellets at an acceptableproduction rate. The force generated by the roll must be greater than the resistive force provided bythe die; if not, throughput is zero.
With a general understanding of the process inside the pellet chamber, it is appropriate to move toa discussion of various factors that affect both throughput and pellet quality.
Pellet Quality For purposes of this paper, pellet quality will be equated to the ability of pellets to withstand repeatedhandling without excessive breakage or fines generation. There are many factors that affect pelletquality, but the following will be discussed in some detail:
• formulation• ingredient particle size• mash conditioning• feed rate• die speed• die specifications (design)• other factors
Formulation There are feedstuff materials that pellet well and produce a durable pellet and others that will not.MacBain (1966) developed a pelletability chart in which he ranked feed ingredients in their pelletabilityand degree or abrasiveness. Bartikoski (1962) experimented with applying numerical value to eachmajor (feed) ingredient to indicate its "stickiness" or its ability to help form a tough, durable pellet.He called that value a "stick factor" and fed that factor into the computer along with the variousnutritive values of each ingredient to provide formulas that meet all nutritional specifications as wellas supplying a formula that will produce a quality pellet at least cost.
Those early workers led others to experiment with the effects of various ingredients - grains, milledgrain by-products, fats, pellet binders, minerals, etc. - on pellet quality or durability. They also led tothe development of a standard method for testing pellet durability perfected in the 1960's by Dr. Harry
B. Pfost at Kansas State University and accepted as a standard by the American Association of Agricultural Engineer - ASAE S-269.3 (ASAE, 2003). That method is generally known as the K-State,or tumbling can, durability test; and it provided a means of quantifying the toughness of pellets ortheir ability to withstand the downstream handling that is typical in feed plants and feed deliverysystems. That was a major breakthrough in the technology of pelleting and has served the industryfor all these years.
MineralsPellet mill performance can be significantly affected by the physical and chemical forms of the calciumand phosphorus sources used in the formula. Sutton (1979) investigated the effect of deflourinatedphosphate (two particle sizes) and dicalcium phosphate (18.5%) on pellet mill performance with abroiler grower formula. He found the production rate for the diet containing regular grind deflourinated
phosphate to be 68.9% greater than for the diet containing an equal amount of dicalcium phosphate. The finely ground deflourinated phosphate had a 52.5% advantage over dicalcium phosphate.
In a similar study (Behnke, 1981) we also studied the effect of mineral sources on pellet mill performanceand pellet quality. Two deflourinated phosphate sources, a fine grind (DPF) and a regular grind (DPR),

8/20/2019 Asa Tr Ftech
http://slidepdf.com/reader/full/asa-tr-ftech 9/84
The Art (Science) Of Pelleting
f e
e d T e c h n ol o g y
7
and an 18.5% dicalcium phosphate (DCP) were used. A practical layer diet was used in which each
test mineral source was evaluated at both high (2.5%) and low (1.5%) levels in the diet.
At both levels tested, the production rate for the deflourinated phosphate sources signif icantlyoutperformed dicalcium phosphate; while the DCP had a slightly, but not significantly, higher pelletdurability index. That would indicate that a physical change - thicker die or reduced feed rate - couldbe made to improve pellet quality without a substantial loss of system throughput. Behnke (ibid), Verner (1988), and McEllhiney and Zarr (1983) reported similar results comparing phosphorus sourcesin a variety of pelleted feeds produced under many conditions.
Those studies are cited, not to encourage or discourage the use of any mineral source or any otheringredient - that's the nutritionist's decision - but to indicate that those sources and ingredients canaffect pellet quality and production rate and should be considered in the quest for improved pellet quality.
Particle SizeOptimum particle size for best pelleting results has been a matter of controversy for almost as longas feeds have been pelleted. Young (1960) found no significant differences in pellet durability whenhe experimented with feed rations containing 40, 60, and 70 percent ground corn or grain sorghumwhen the grain portions were ground coarse, medium, and fine.
Martin (1984) compared pelleting efficiencies and durabilities using a hammermill and a roller mill to grindthe corn portion (59.5%) of a pelleted feed. He did not find any differences (P<.05) among the varioustreatments. The average particle size of the hammer milled corn (3.2mm and 6.4mm screens) rangedfrom 595 to 876 microns, and the roller milled corn (fine and coarse) ranged from 916 to 1460 microns.
Stevens (1987) conducted similar experiments in which No. 2 yellow corn was used as the grain portion
of the typical swine formula. The corn was ground with a hammermill through three screen sizes:1/16"(1.6mm) (fine); 1/8"(3.2mm) (medium) and 1/4"(6.4mm) (coarse). He then measured the effect of the ground grain particle size on the pelleting production rate, electrical efficiency, and pellet durability.
There were no significant (P<.05) differences in the pellet ing production rate or PDI values fromdifferent particle sizes of corn mixed into the swine ration; although, the total electricity required togrind the corn and pellet the mash was significantly greater for the fine ground corn.
When ground wheat was used as the grain portion of the swine ration, pellet production rates andPDIs improved as the grain was ground finer; but the finer ground wheat also required substantiallymore electrical energy.
While the research cited may seem to provide conflicting results, there is overwhelming evidence thatthe average particle size of the ground grain portion of a ration or of the total ration (mash) affectsthe pelleting process - throughput and/or pellet quality. The effects, simply, are not the same underall conditions or for all rations. The operators must conduct their own research under their ownoperating conditions and on the feeds that they produce.
It is common that some portion of a plant's product mix is often in mash or meal form and thatgrinding the grains more finely in a pre-grind system or the whole mix in a post-grind system causeshandling problems in those mash feeds. There are two solutions to that dilemma - either provide twoground grain bins over the mixing system or find a grind (particle size) in the middle somewhere thatwill produce the better quality pellet and still provide the flowability or angle of repose that is neededfor mash feeds. The first option is, of course, the better one but may not be possible, or too expensive,in a given grinding/mixing system situation.
Grind as fine as you must for best pellet quality in your operation and with your operation and withyour feed rations, but don't over grind. That is wasteful of energy, reduces production rates, addsto manufacturing costs, and may do more harm than good to the consuming animal.
8/20/2019 Asa Tr Ftech
http://slidepdf.com/reader/full/asa-tr-ftech 10/84
The Art (Science) Of Pelleting
8
f e e d T e c h n o l o g y
Mash Conditioning
This is a subject unto itself and will not be addressed in total detail in this paper. Many researchersand practitioners have proven over and over again that pellet durability and pelleting efficiency can besubstantially improved by the proper steam conditioning of mash. Steam brings to the surface of pelletmash particles the natural oils which are common to most grains and provides lubrication of the pelletdie reducing wear on the die and roller assembly and increasing production rates (Behnke, 1990).
In some instances, thorough conditioning may be counter productive from the standpoint of pelletdurability. If the material slips through the die too easily, dwell time in the die hole is reduced causingthe pellet to be less durable, and the starch gelatinization caused by the heat and friction in the diemay be reduced.
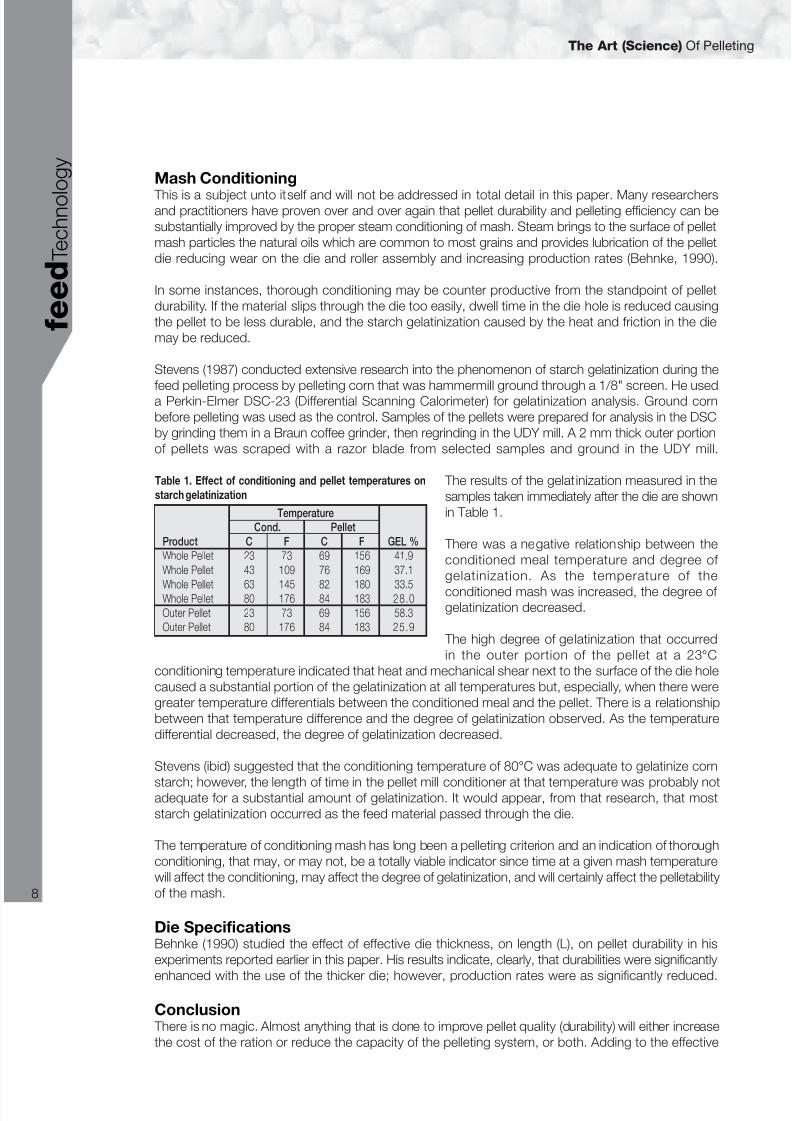
Stevens (1987) conducted extensive research into the phenomenon of starch gelatinization during thefeed pelleting process by pelleting corn that was hammermill ground through a 1/8" screen. He useda Perkin-Elmer DSC-23 (Differential Scanning Calorimeter) for gelatinization analysis. Ground cornbefore pelleting was used as the control. Samples of the pellets were prepared for analysis in the DSCby grinding them in a Braun coffee grinder, then regrinding in the UDY mill. A 2 mm thick outer portionof pellets was scraped with a razor blade from selected samples and ground in the UDY mill.
The results of the gelatinization measured in thesamples taken immediately after the die are shownin Table 1.
There was a negative relationship between theconditioned meal temperature and degree of gelatinization. As the temperature of the
conditioned mash was increased, the degree of gelatinization decreased.
The high degree of gelatinization that occurredin the outer portion of the pellet at a 23°C
conditioning temperature indicated that heat and mechanical shear next to the surface of the die holecaused a substantial portion of the gelatinization at all temperatures but, especially, when there weregreater temperature differentials between the conditioned meal and the pellet. There is a relationshipbetween that temperature difference and the degree of gelatinization observed. As the temperaturedifferential decreased, the degree of gelatinization decreased.
Stevens (ibid) suggested that the conditioning temperature of 80°C was adequate to gelatinize corn
starch; however, the length of time in the pellet mill conditioner at that temperature was probably notadequate for a substantial amount of gelatinization. It would appear, from that research, that moststarch gelatinization occurred as the feed material passed through the die.
The temperature of conditioning mash has long been a pelleting criterion and an indication of thoroughconditioning, that may, or may not, be a totally viable indicator since time at a given mash temperaturewill affect the conditioning, may affect the degree of gelatinization, and will certainly affect the pelletabilityof the mash.
Die SpecificationsBehnke (1990) studied the effect of effective die thickness, on length (L), on pellet durability in hisexperiments reported earlier in this paper. His results indicate, clearly, that durabilities were significantly
enhanced with the use of the thicker die; however, production rates were as significantly reduced.
Conclusion There is no magic. Almost anything that is done to improve pellet quality (durability) will either increasethe cost of the ration or reduce the capacity of the pelleting system, or both. Adding to the effective
Table 1. Effect of conditioning and pellet temperatures on
starch gelatinization
Temperature
Cond. Pellet
Product C F C F GEL %
Whole Pellet 23 73 69 156 41.9
Whole Pellet 43 109 76 169 37.1
Whole Pellet 63 145 82 180 33.5Whole Pellet 80 176 84 183 28.0
Outer Pellet 23 73 69 156 58.3
Outer Pellet 80 176 84 183 25.9
8/20/2019 Asa Tr Ftech
http://slidepdf.com/reader/full/asa-tr-ftech 11/84
The Art (Science) Of Pelleting
f e
e d T e c h n ol o g y
9
thickness of the die is a perfect example of the sort of trade off that can be expected, and must be
recognized, in the search for improved pellet quality.
One of the primary objectives of all commercial feed manufacturers is to economically produce thebest pellet quality possible. This is not only important from a customer satisfaction standpoint, butit is becoming apparent that animal performance can be affected by poor quality pellets. Dairy cattleused to consuming pellets, readily reject fines. Even the U.S. broiler integrators are recognizing thatpoor pellet quality can reduce bird performance.
There are numerous factors that affect pellet quality and many are inter-related. It takes a great dealof effort to determine what changes to make and how other aspects of the system or operation mightbe affected.
Factors not addressed in this paper but that are currently being investigated include: double pelleting,optimum cooling, automation of the pelleting system, gentler handling of pellets and new binders. This paper has not dealt with issues of water stability of pellet aquatic diets, but that topic is gaininggreat importance around the world.
As can be seen, pelleting is a very complex issue and one that deserves a good deal of thought andinvestigation.
References ASAE, 2003, ASAE Standard: ASAE S 269.3, Wafers Crumbles, and Crumbles - Definitions and
Methods for Determining Density, Durability, and Moisture Content, ASAE Standards 2003, TheSociety of Engineering in Agriculture, St. Joseph, Michigan: 70-72.
Bartikoski, R.G., 1962, The Effect of Steam on Pellet Durability, Cost Reductions Through In-Plant
Production Controls, Midwest Feed Manufacturers' Association, Kansas City, Missouri: 42-47.Behnke, K.C., 1981, Pellet Mill Performance as Affected by Mineral Source, Feedstuffs, Vol. 32, No.
12, Miller Publishing Company, Minneapolis, Minnesota: 34-36.Behnke, K.C., 1990, (Unpublished) An Evaluation of Wheat as a Pellet Quality Enhancer, Kansas State
University, Manhattan, Kansas.MacBain, R., 1966, Pelleting Animal Feed, American Feed Manufacturers Association, Arlington,
Virginia.Martin, S.A., 1984, Comparison of Hammermill and Roller mill Grinding and the Effect of Particle Size
Reduction on Mixing and Pelleting, A Master's Thesis, Kansas State University, Manhattan, Kansas.McEllhiney, R.R. and R.K. Zarr, 1983, (Unpublished) Results of Fish meal Analog Trials, Kansas State
University, Manhattan, Kansas.Stevens, C.A., 1987, Starch Gelatinization and the Influence of Particle Size, Steam Pressure and
Die Speed on the Pelleting Process, A Doctor's Dissertation, Kansas State University, Manhattan,Kansas.
Sutton, L., 1979, (Unpublished), Bordon, Inc., Smith Douglas Div., Elgin, Illinois. Verner, W.A., 1988, Best Cost vs. Least Cost, Feed Management, Vol. 39, No. 4, Watt Publishing
Company, Mount Morris, Illinois: 36, 58. Young, L.R., 1960, Mechanical Durability of Feed Pellets, A Master's Thesis, Kansas State University,
Manhattan, Kansas.

8/20/2019 Asa Tr Ftech
http://slidepdf.com/reader/full/asa-tr-ftech 12/84
10
f e e d T e c h n o l o g y
Post-Pelleting Liquid Application:
A Practical Guide
Doug Decksheimer
Comco Systems Inc.
Canada
Introduction And BackgroundIn most cases, post-heat liquid application treatment has been limited to fat additions of 1-10 percent.Equipment to apply fat is present in many mills and in some cases can be adapted to apply other liquidingredients. In the past five years, several hundred pellet lines globally have been retrofitted to dispense
enzymes. This increasing trend in Asia has been mostly in high capacity integrated operations. However,today, benefits can be realized in most mills as technology has changed to offer more cost effective solutions.
When determining equipment needs for heat-sensitive liquid ingredients such as enzymes, everyeffort should be made to ensure that these products are applied with precision and accuracy. Systemsto apply liquids post-heat treatment work in a continuous flow setting in most instances. The aim isto apply the liquid after the fines are returned and before the feed goes to the feed truck.
Parameters must be defined to monitor the equipment's efficiency. The installation of a liquid additionsystem can add a number of requirements to the feed process and existing equipment. These willbe discussed in this paper.
The accuracy of a liquid application system should be determined by its ability to consistently deliverprecise amounts at the feedmill. It should not be measured by animal or bird performance afterconsumption of the finished feed.
The ProblemHigh temperatures are used to satisfy requirements of quality feed and hygiene. Most pelleting millsoperate at temperatures between 70 - 80°C. Health issues, such as salmonella have created theneed for pelleting temperatures in excess of 90°C. Thermal treatment provides the following advantages:
• Gelatization of starch• Enhancing the pellet quality• Enhancing digestibility• Hygiene treatment
Typically, the pelleting process involves conditioning, pressing and then cooling. Those mills utilizingexpanders, process at higher temperatures and pressure. Heat, moisture, pressure and friction,reduction and oxidation reactions and light are stress factors which can negatively influence additives(Schwartz, 1998; Putnam and Taylor, 1997; Perry, 1997; Blair, 1996) Therefore, heat sensitive feedstuffs such as enzymes, vitamins, amino acids, probiotics and antibiotics, may require optionalprocessing equipment.
Getting Started The application of well-defined feed additives is becoming an indispensable tool for feed producers. There is a constant drive to produce low cost feed with maximum nutritional availability. In fact, post-pelleting application can increase profitability.
As mentioned previously, post-pelleting application is not entirely new to the industry. However,enzymes and other heat-sensitive concentrates have changed the paradigm for post-pelleting addition.Inclusion rates of 40 to 250 grams per ton of finished feed have created the need for precisionequipment and have raised some notable concern within the feed industry.
8/20/2019 Asa Tr Ftech
http://slidepdf.com/reader/full/asa-tr-ftech 13/84
Post-Pelleting Liquid Application: A Practical Guide
f e
e d T e c h n ol o g y
11
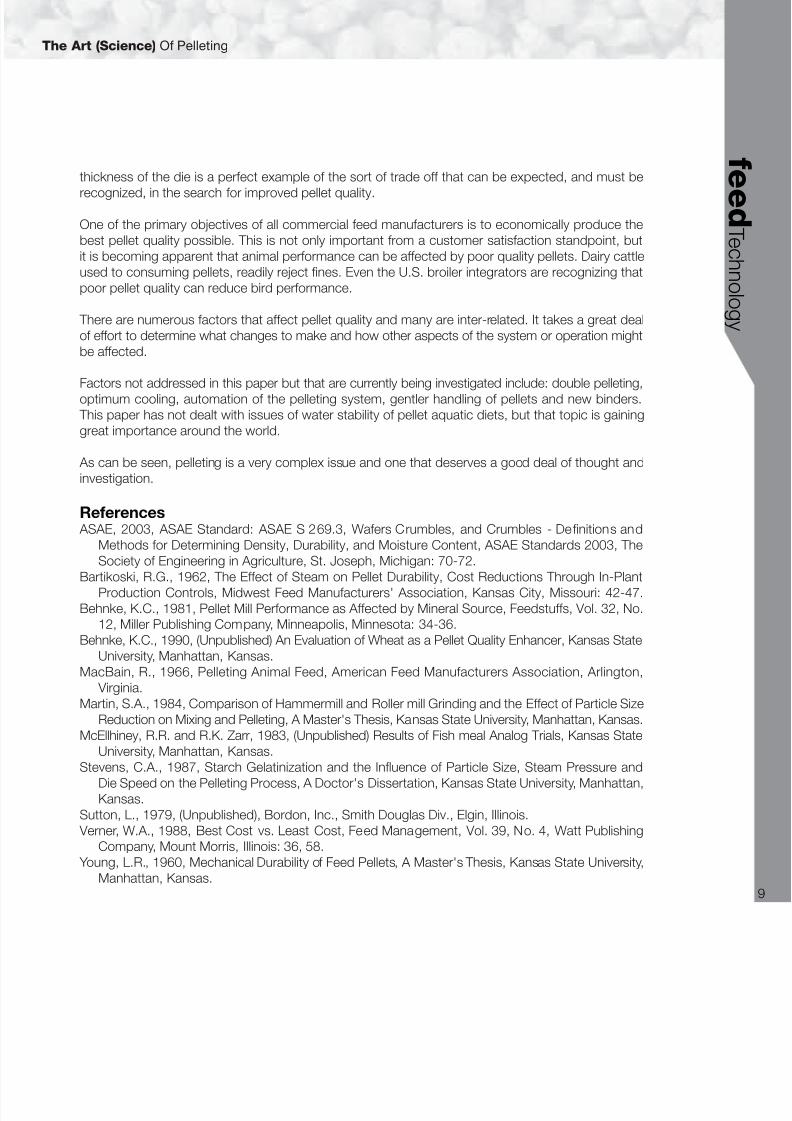
Following are some factors that influence the success of any post-pelleting application system:
1. Coefficient of Variation - the additive must be presented with uniformity to pellets2. Accuracy - over-dosing or under-dosing is undesirable3. Precision - the system must provide consistent and repeatable dosing
The answers to the following questions will provide some basic information to consider when makingequipment changes and adapting new processes to the mill. The answers will also assist in successfullyachieving the above points.
Determining Questions:
1. Where is it possible to add liquid ingredients in the feed process?Heat-sensitive ingredients must be added after cooling/sieving and prior to load-out.
2. Where is it possible to measure or calculate the flow of feed pellets or crumbles?In order to accurately dose precise amounts of liquids, the rate of dry flow must be accuratelydetermined.
3. How much automation is needed to meet quality control requirements? To ensure repeatability and guarantee the application, a means of implementing both robusthardware and controls/software is necessary.
Some Useful Resources in Helping to Evaluate Equipment Needs:
1. The liquid supplier may have feed engineers or technicians available2. The liquid equipment supplier will have varied experience3. Consulting or engineering firms may help assess mill needs
Equipment suppliers in conjunction with nutritionists, mill managers and maintenance personnel canall provide input to creating a well-defined system. In short, if you do your homework, your applicationwill be successful.
The Application
Dry Flow Measuring Achieving the desired accuracy is greatly dependent upon the level of accuracy obtained from thedry-flow measuring device. In general, the steadier the dry flow, the more accurate the liquid can beapplied. (Aicher, 1998).
Several options are available for measuring and controlling the dry flow of pellets or crumbles. It isrelatively safe to say that the more money spent on dry flow monitoring, the more accurate the systemshould be, however, one must consider serviceability and ease of calibration within that equation.
For many mills where bulk density of the finished feed is consistent, volumetric measuring (Figure 1)is a proven solution. This cost-effective method uses a surge or buffer hopper with a low and highlevel switch; the system is calibrated by determining the decreasing amount of pellets over a specifiedamount of time. Once product reaches the low level switch, a screw auger stops, allowing the binto fill until product reaches the high level switch and the process then repeats itself.
Several systems employ weigh belts. This method uses a surge bin directly above a belt or mixingscrew, which is suspended by a load cell. Weigh belts are not affected by changes in bulk densityand can easily be retrofitted into existing mills. They do however, require a high level control systemfor calibration. Most weight systems are marketed as a package and require a large footprint.
Impact Scales - involve calculating weight by the force of pellets hitting a plate. This method hasbeen widely used in many feedmilling applications. These devices are compact. Impact scales should

8/20/2019 Asa Tr Ftech
http://slidepdf.com/reader/full/asa-tr-ftech 14/84
Post-Pelleting Liquid Application: A Practical Guide
12
f e e d T e c h n o l o g y
only be installed in constant flow applications or inconsistency will occur. Bulk density changes may
impact the calibration.
Newer yet, is a technology that uses a curved chute resting on a sensing element or load cell. Thesystem determines flow by measuring the sum of forces necessary to re-direct the incoming flow of material from near vertical to near horizontal. Hence, a momentum measurement. Realized accuracyof 99.5% or better is achievable.
In essence, dry flow measuring is the heart of the application, and inaccuracies are compoundedthrough the remainder of the process. Each of the above methods of monitoring pellet flow will work successfully provided the application of the equipment is correct. It is important to ask questions andprovide equipment manufacturers with all the relevant data necessary to design an appropriatesystem.
Liquid Monitoring And Delivery Currently, there are three methods employed for monitoring the liquid ingredient: measurement canbe volumetrically, loss-in-weigh or by flow meter. There are advantages and disadvantages to all;
Volumetric (Figure 2) is by far the most cost effective. This system uses a positive displacement pumpto dispense precise amount by two methods;a. time base by calculating the amount of liquid delivered over a specific time and relating that amount
in a given minute or hour.b. Pulse emulation where each stroke of the pump is proportioned to deliver a given amount. The
control system then reads the pulses and records the flow rate.
Because volumetric systems do not have true flow knowledge, it is important that these systemshave low level detection and in-line no flow monitors or switches to alarm the operator. Volumetricsystems installed correctly can provide superior accuracy with a low cost.
Loss-in-weigh is a weight-based system using a positive displacement pump to dispense the preciseamount from a day tank. Some advantages of this method are:
Figure 1. Volumetric dry flow control

8/20/2019 Asa Tr Ftech
http://slidepdf.com/reader/full/asa-tr-ftech 15/84
Post-Pelleting Liquid Application: A Practical Guide
f e
e d T e c h n ol o g y
13
• Liquid densities do not effect the system• Real-time weight processing• Inventory is easier to reconcile by weight
The scale offers further benefits by allowing low level monitoring and re-filling set points.
Flow Meters are the traditional means of monitoring liquid flow. Reliability and accuracy can beproportional to the money spent on the flow meter.
In flow-meter type systems, a positive displacement pump forces liquid into the flow meter producingan electrical out-put to flow. Flow meter based systems require limited space. It is advisable to usea mass flow meter with critical ingredients and those liquids that are subject to density changes withtemperature.
Because of the low inclusion (40 - 250 grams per ton) of critical ingredients, it seems logical to diluteadditives with water or oil. This will also increase the number of droplets, which will have a positiveeffect on distribution (Van der Poel and Engelen 1998).
In practice, dilution is simply used to increase the accuracy of the installation. Although the objectiveis a minimum level of water inclusion, an amount of 500 - 1,000 grams per ton add rate has beenproven effective. When it is necessary to mix heat-liable liquids with water, the application systemmust meet the following criteria:
1. Mixing should take place as close to the spray application as possible.2. The system should be purged if extended mix times exist
3. A mechanical static mixer should be used
It is possible to spray one or more liquids together in a post-pelleting installation. Compatibility mustbe determined. Due to contamination and stability concerns, it is recommended that liquids be dosedindependently if from varying suppliers.
Figure 2. Typical volumetric liquid delivery general overview for illustration only.

8/20/2019 Asa Tr Ftech
http://slidepdf.com/reader/full/asa-tr-ftech 16/84
Post-Pelleting Liquid Application: A Practical Guide
14
f e e d T e c h n o l o g y
At times, addition of enzyme or other heat-liable ingredients wil l take place just before or just after
coating the feed pellets with fat. Even if the pellets are coated with fat first, the low levels of enzymeadded may be absorbed (Figure 3). The small amount of water added with the enzyme does not alterthe humidity of the pellets significantly, primarily because addition rates are well below one litre/ton(Perry, 1997).
Further, information on the effects and interaction with fat can also be seen in Figure 3. The recoveryof Xylan LC® was shown to be sufficient irrespective of the fat temperature or the fat level. (Annonieret al., 1998).
It is practical to apply the critical ingredients prior or in conjunction with the fat or oil. This applicationwill provide a sealed pellet of the ingredient and reduce the need for penetration if applied after fator oil coating.
Spraying And MixingIn practice, it is not feasible to disperse the liquid additive over all the pellets. Homogenous distributionis achievable but only considering the following:
1. Fines must be minimized. Sieving of the fines prior to application increases accuracy2. Post mixing after application increases distribution lowering the co-efficient of variation3. The droplets of liquids must be maximized
Liquid droplets are created by using force and properly selected nozzles. Nozzle sizing is very specializedand many factors must be considered. Nozzles that are not sized correctly can produce over or underspraying and negatively impact the installation. A "one size" fits all approach will not work.
Some systems typically used for fat application use a high speed disc which produces a fine atomizedmist. This is also an effective method of application and dispersion.
Fines present challenges in post-pelleting systems, particularly in crumb feeds. The wide particle sizerange and the presence of substantial amounts of fines make the occurrence of segregation practicallyunavoidable (Barendse,1995). Fine particles that have comparatively large surface/weight ratios willabsorb a relatively high percentage of the additive.
Further, fines created or contained in the feed, reduce mixability. In consideration of this, post-pelletingsystems should be engineered to minimize pellet degradation during and after spraying.
Table 3.1 Effect of spraying position and time on the recovery of a liquid enzyme.
Dieta Enzyme Recoveryb
Control Enzyme sprayed Enzyme sprayed Enzyme sprayed 30
Before fat spraying immediately after fat spraying min. after fat spraying
Starter - 100 90 99Grower - 100 104 99
a 50% barley based b 2 litres Xylan LC® per tonne of feed
Reference: Annonier et al., 1998.
Table 3.2 Effect of fat level and fat temperature on the recovery of a liquid enzyme.
Fat temperature [°C] Enzyme recovery [%] in feed with fat level [%]ab
1.5 3.0
64 114 118
80 110 117
88 105 117 a 50% barley based b 2 litres Xylan LC® per tonne of feed
Reference: Annonier et al., 1998.
The recovery of Xylan LC® was shown to be sufficient irrespective of the fat temperature or the fat level. Irrespective of the spraying order, feed efficiency was significantly improved
by the enzyme in the starting as well as the finishing period: -9 and -4.6% in feed efficiency ratio, respectively. (Annonier et al., 1998)

8/20/2019 Asa Tr Ftech
http://slidepdf.com/reader/full/asa-tr-ftech 17/84
Post-Pelleting Liquid Application: A Practical Guide
f e
e d T e c h n ol o g y
15
When spraying or applying liquids, four methods are often used:
1. Mixing Screws - can be retrofitted to allow feed to drop in a flat curtain. A ribbon flight with mixingbars welded at every pitch at 90 degrees apart can produce the needed curtain. A benchmark of 20 seconds retention time will produce excellent mixability.
2. A Spray Chamber - is created by use of cones or baffles in a closed compartment. Feed is thinnedto a curtain. For areas with limited space, this may be the only option. Care should be taken toavoid overspraying. The chamber should be accessible for regular cleaning.
3. Roto Coater type systems have been developed primarily for the application of fat. The designof these features two discs. Pellets land on the top of a low speed rotating disc which providesa 360 degree curtain around a second disc. Liquid droplets landing on a second high speedrotating disc cause a fine atomized mist, which is forced on to the pellets. Several manufacturersprovide similar type systems.
4. Batch mixing - has been used successfully in Europe for adding liquid post-pelleting. The needfor a pre-hopper is required and this creates space problems. These mixers are typically paddletype and the weighing of liquid and mixing is completed over a short period. The advantage of this type of system is that it allows for the flexibility of adding both liquid and powder ingredients.
Post mixing after spraying improves uniformity in all application systems. Although some mixing occursduring transportation of the feed, it is expected that the homogeneity will be better when a completemixing is performed. The object is to have the liquid contact a maximum number of pellets (Aicher,1998). Sufficient retention time and agitation are necessary to accomplish the desired result (Figure 4).
Quality Assurance & AutomationQuality control issues are of the utmost importance. The application must tie together into a robustautomated system. The control system must fit into the automation objectives of the feed mill.
Today many mills face the challenge of adopting HACCP and “Good Manufacturing Practices” totheir day-to-day milling operations. The liquid addition system should fit into this process with routinechecks and balances in place. Some high attention detailing includes:
- Recharging of the enzyme day tanks and proper labeling of the tanks itself - Lot number recording- Balance the inventory of the liquid sprayed to the feed produced- Periodic spot calibration- Periodic finished feed sample taking proving the consistency of the application- General maintenance of the equipment
Figure 4. Effect of spraying accuracy on the coefficient of variation.

8/20/2019 Asa Tr Ftech
http://slidepdf.com/reader/full/asa-tr-ftech 18/84
Post-Pelleting Liquid Application: A Practical Guide
16
f e e d T e c h n o l o g y
No assumptions should be made when applying critical ingredients. Alarms should be included to
alert operators of any possible malfunctions. The control loop should include:
• Low or empty tank levels• Low or no liquid flow
Like all systems, the automation should include the ability to expand enabling the addition of futureliquids. Basic reporting will enable the feed mill to reconcile inventory and prove the application.
In short, to obtain accuracy and homogeneity, the flow of liquid and feed must be in close harmony. The use of a process control system to run dependable software is the only way to achieve this goal.
Summary
Liquid application of feed additives may give a solution, in many cases, to making the ready productassortment more flexible. This will cause an extra capital investment that can be earned back bybetter efficiency and a larger product assortment (Copps, 1997).
Post-pelleting systems can be dependable. In principle, there is a choice between an advancedsystem that guarantees high accuracy and a cheaper, simpler system, which may always lack accuracyand uniformity. There is a wide range to choose from, and in most cases the best system will be acompromise between the two extremes.
The performance of any post-pelleting system should be judged on the uniformity and accuracy of liquid application, reliability, frequency of maintenance and ease of use (Chemgen, 1999). Somesuppliers have underestimated this task, while others have met the demands of today's feed industry.
The use of heat sensitive liquid ingredients in feed manufacturing will continue to increase as moreingredients become available in liquid forms. The challenge will be to successfully and economicallyadapt application of these liquids to bypass the excessive temperatures of pellet mill conditions andexpanders.
References Aicher, E., 1998. Post Pelleting Liquid System for Enzymes. KC9814. Keeping Current. Annonier, C., P.A. Geraert, A. Sabatier and T. Julia. 1998. Proceedings 4th Kahl Symposium, Hamburg,
Germany.Barendse, R.C.M., 1995. Technological Aspects of Enzyme Usage. Victam '95 Symposium: From
Feed to Food, Utrecht, The Netherlands.Blair, M., 1996. Liquid or Dry? A Question of Practicalities. Feed Milling International, Nr. Oct. p.13-14.
Coops, M.G., 1997. Bulk Blenders, Mini-symposium Cebeco Ingenieurbureau de Molonaar., Vol 100.p 2-4.
Field Service Group, Chemgen Corp., 1998. Feed & Grain. Oct/Nov, p 16-22.Putnam, M. and A. Taylor, 1997. Vitamins in Feeds - The Critical Factors. Feed Tech. Vol. 1, Nr. 1.Document-number 108107, p 39-41, 43.Schwarz, G., 1998a. Liquid Feed Additives - An Alternative in Modern Animal Nutrition? (Part 1). Feed
Management/Kraftfutter, Nr. 10, p. 438-443.

8/20/2019 Asa Tr Ftech
http://slidepdf.com/reader/full/asa-tr-ftech 19/84
f e
e d T e c h n ol o g y
17
Troubleshooting The Pelleting Process
John D. Payne
Borregaard Ligno Tech
United Kingdom
Introduction The benefits of producing good quality pellets are well documented and accepted. This paper willdeal specifically with production matters and pelleting technique to position the nutritionist and millmanager to meet the ever increasing demand from livestock producers for supply of consistentlygood quality pellets.
The “Troubleshooting” strategy will be to investigate the major factors which influence pellet quality andproduction efficiency, i.e., feed formulation, specific power consumption (pellet press) and conditioning,which also includes grinding, as grinding is the first stage of conditioning. In so doing, we will discussthe variability of raw materials, their effect on pellet quality, and learn how to calculate “Feed QualityFactors” such that “Pelletability” of feed formulations can be predicted prior to production. This, togetherwith specific knowledge of your process plant and application of lignin technology, will enable pelletingtechniques to be developed so that pellet quality, production rate and profitability can be maximized.
What Is A Pellet Quality/Production Rate Problem? A pellet quality problem is that which occurs when pellet durability falls below your level of acceptability. A production rate problem is that which occurs when it falls below your level of acceptability relativeto pellet quality and design capacity. Level of acceptability varies from country to country, region to
region, depending on a number of factors, e.g., technical production ability, feed raw materials andmarket pressures. However, “Better pellet quality… better overall efficiency” is widely accepted,particularly by integrated feed producers, but on a practical basis, it will probably be the market placewhich dictates the level of pellet quality for non-integrated companies. Thus, you must first establishyour company’s level of pellet quality acceptability and aim to maintain it within a close tolerance.
Development Of Pellet Quality In response to demand for better qualitypellets, engineering process technology hasresponded by applying greater amounts of electrical energy per ton of pelleted feed --more so for ruminant and pig than for poultry.
Graph 1 and 2/3 show, over a 20 year period,how pellet quality has improved in relation toelectrical energy input at the pelleting plant(excluding steam, cooler and conveyors). Thus, we can see that pellet quality is relativeto energy input and we can use this criteriawhen trouble shooting.
Fundamental Requirements For
Good Pellet Quality And
Production Rate There are just two! That is , assuming
adequate grinding and conditioning.
1. A good feed formulation.2. Sufficient Specific Energy (kWh/ton) used
by the pellet press motor.
Graph 2/3. Electrical energy input.
Graph 1. Relationship between energy input & pellet quality (ruminant
feed: 6mm pellets)

8/20/2019 Asa Tr Ftech
http://slidepdf.com/reader/full/asa-tr-ftech 20/84
Troubleshooting the Pelleting Process
18
f e e d T e c h n o l o g y
These are the first two stages of investigation used that are recommended to investigate when
troubleshooting either Pellet Quality or Production Rate problems.
Stage 1
Determination Of The Formulation’s “Feed
Pellet Quality Factor” (FPQF) The first step to take when trouble shooting isto calculate FPQF. If it is higher than your levelof acceptability, then you know the problem isin the feedmill. If it is lower, then discuss it withyour nutritionist or feed formulator.
Determination of FPQF can be used: A. as a formulating tool to predict pellet quality!B. as a production tool to maximize production rate!
A. Let us first take a look at feed raw materialsand their influence on physical pellet quality.Knowing that some raw materials pellet well,wheat for example, and some are very difficulte.g., grain screenings, it should be possiblefrom experience to given each raw material aPellet Quality Factor; 0 for bad, 10 for good. Isay from experience because pelleting eachraw material as a “straight” and ascribing avalue to it in order to calculate the pelletabilityof a mixture, does not always work out correctly. There is, without doubt, a synergy between rawmaterials which we do not yet fully understand.
The values listed for various raw materials aregiven in the table on page 40 of “The PelletingHandbook”, published by Borregaard Ligno Tech. Clearly, if a feed formulation can beidentified as potentially difficult before it getsinto production, then a great deal of time andmoney can be saved. However, it should be
stressed that the results from calculationsshould only be used as guidelines.
As an example, Tables 1, 2, 3 and 4, showthe FPQF calculation of a ruminant, pig, duck and Tilapia feed formulation, respectively. Theprocess of calculating the Feed Pellet QualityFactor (FPQF) for any given formulation isstraightforward. List the raw materials usedin the formulation with their respective %inclusion and Pellet Quality Factor (taken from The Pelleting Handbook or your own modified
version). Then, multiply the PQF by the %inclusion of the raw material e.g., Wheat meal:PQF 8: Inclusion 30%. Therefore, itscontribution to the overall FPQF = 8 x 30% = 2.4. Add all the FPQF’s together and their totalrepresents the Feed Pellet Quality Factor for that particular feed formulation.
Calculation of feed pellet quality factor
Table 1. Dairy feed
% PQF FPQF
Gluton 13 3.00 0.39
Citrus 22.5 7.00 1.57
distillers 6 3.50 0.21
Barley 20 5.00 1.00
Palm Kernal 10 6.00 0.60
oo-Rape 6 6.00 0.36
Tallow -40.00
Minerals 2.5 2.00 0.05
Wheat 20 8.00 1.60Beet Pulp 7.00
Total FPQF 5.78
Table 2. Pig feed
% PQF FPQF
Barley 23 5.00 1.15
Oat Meal 37.2 2.00 0.74
Wheat Meal 13 8.00 1.04
Tallow 2 -40.00 -0.80
Fish Meal 3 4.00 0.12
Meat Meal 6 5.00 0.30
Grass Meal 1.6 7.00 0.11
Mins on carrier 7 2.00 0.28
Vitamins 2.2 3.00 0.07
Returns 5 5.00 0.25
Total FPQF 3.26
Table 3. Duck feed
% PQF FPQF
Maize Meal 16 5.00 0.80
Rice Broken 35 5.00 1.75
Soya 30 4.00 1.20
Oil 0.5 -40.00 -0.20
Fish Meal 3.5 4.00 0.20
Mins + Vits 10 2.00 0.07
Rice Bran 2.00 0.20
Wheat 8.00Total FPQF 4.02
Table 4: Tilapia feed
% PQF FPQF
Feather Meal 3 4.00 0.12
Fish Meal 2 4.00 0.08
Distillers grain 1.9 3.00 1.20
Oil 1.15 -40.00 0.06
Minerals 2.51 2.00 0.13
Rape Meal 5 6.00 0.30
Wheat Pollard 15 5.00 0.75
Wheat 27 8.00 2.16
Soya 25.6 4.00 1.02
Sunflower Meal 16.84 6.00 1.00
Total FPQF 6.82

8/20/2019 Asa Tr Ftech
http://slidepdf.com/reader/full/asa-tr-ftech 21/84
Troubleshooting the Pelleting Process
f e
e d T e c h n ol o g y
19
When using a conventional pelleting line with no expander, if the result is below 5, there could be
a pellet quality problem, if it is below 4.7, then the probability of a problem is very high. Thetolerance between 4.7 and 5 takes into account the effectiveness and pelleting technique of thefeed mill, some mills need to be “5” or over to make good pellets, while others could tolerate alower level. It is suggested, therefore, that producers of pelleted feeds set their own FPQF levelbased on nutritional production circumstances and raw materials in relation to the level of pelletquality acceptability. When using an Expander, lower FPQF’s can be tolerated.
B. Calculating FPQF also provides a means of deciding production strategy. If FPQF is 5 or over, itgenerally indicates that the formulation will be easy to condition, therefore more steam can beadded. It also indicates that Pellet Quality should be good, therefore, production rate can bemaximized.
Stage 2
Determination Of Specific Energy (kWh/T Pellet Press Motor)If good quality pellets are to be produced, then the pellet press has to impart a given quantity of energy. Graphs 1 and 2 show the amount required -- all things being equal, higher pellet qualityrequires greater energy input. To produce poultry, pig and ruminant pellets of acceptable durabilityat an acceptable production rate, then at least 10, 12/15 and 20/25 kWh/T, respectively must beused by the pellet press motor. For fin fish and shrimp feed, around 12 kWh/T is required.
The second stage, therefore, in a trouble shooting effort to solve a pellet quality/production rateproblem is to determine the kWh/T of the feed formulation in question. But first check the die toensure that the holes are not blocked or rolled over. If the kWh/T value is found to be lower than thatrequired, it suggests that the die is not working hard enough. Possibly, it is worn out or simply that
its compression length is insufficient. If the value is equal to, or higher than that required, then thefault must lay somewhere else in the plant, such as grinding or conditioning.
To determine kWh/T (units of electrical energy used by the pellet press motor to produce one toneof pellets) the production rate in ton/hour must be known as well as voltage and the average amperageused by the pellet press. To calculate production rate, determine the amount of time it takes toproduce a given quantity of feed and calculate tons/hour. Then apply the following formula to calculatepower (kW) being taken by the pellet press motor.
kW = Average pellet press motor amperage x Voltage x 1.73 x Power Factor1000
Assume a Power factor of 0.93 unless known.
Specific Energy Consumption (kWh/T) = kW T/h
Relationship Between Pellet Press Motor
Amperage, Specific Energy Consumption
And Pellet Quality Based on the actual pelleting trial, Graphs 4 to7 inclusive present an illustrative account of theactual and potential production performance of a pellet press. This scenario is relevant for many
pellet presses and different types of feed,particularly so in South East Asia. Graph 4illustrates how, by controlling production rate,pellet quality, in this case a ruminant feed, canbe maintained at a required level of acceptability(92 Holmen). However, with an available motor
Graph 4.

8/20/2019 Asa Tr Ftech
http://slidepdf.com/reader/full/asa-tr-ftech 22/84
Troubleshooting the Pelleting Process
20
f e e d T e c h n o l o g y
amperage of over 400, this pellet press, in this
example, was working well below its potential --as are many pellet presses. It indicates that athicker die could be used in order to increaseproduction rate (see Graph 5). In reality, the sameincrease in production rate was obtained by addinga Lignin Performance Enhancer (LPE), but as canbe seen from Graph 6, the difference in specificenergy consumption (kWh/T) is substantial i.e.,16.3 compared to 21 in favor of the LPE. Graph7 shows how the total potential of the pellet presscan be obtained i.e., by combination of a thickerdie and the addition of LPE. Without the additionof a LPE, at 13.5 T/h the pellet press motor wouldhave far exceededits maximum permissible amperage.
So if the feed formulation and specific energy input are found to be adequate, according to yourstandards, then it will be necessary to move on to stage 3.
Stage 3
Check ConditioningGrinding: “Conditioning” starts with grinding the feed raw materials. Grinding finer produces betterquality pellets. Measure the “Meal spectrum of particle size” of the meal mixture which is to be pelletedand compare it with the following suggested spectrum:
Graph 4.
Graph 5.

8/20/2019 Asa Tr Ftech
http://slidepdf.com/reader/full/asa-tr-ftech 23/84
Troubleshooting the Pelleting Process
f e
e d T e c h n ol o g y
21
Meal particles on a 3.00mm sieve up to 1%
“ “ on a 2.00mm sieve up to 5%“ “ on a 1.00mm sieve around 20%“ “ on a .50mm sieve around 30%“ “ on a .25mm sieve around 24%
Throughs (flour) Not less than 20%
The sieve analysis not only indicates if the meal is too coarse, it also identifies grinding problems e.g.,punctured or badly worn grinder screens. If your meal is much coarser than that suggested or is notas well balanced, the only solution is to fit grinder with screens having smaller perforations or acombination of screen sizes to improve balance. Check meal spectrum of particle size regularly andavoid fitting new beaters and screens together.
Conditioning: Steam/moisture is the critical factor, but if the mixer conditioner is not working effectively,the benefit from producing good quality steam will be wasted. Therefore, ensure that the conditioneris running as full as possible by adjusting the angle of its beaters or possibly reducing the speed. Theobjective is for the meal, liquids and steam to rub together -- they must be persuaded, not beaten.It is essential that heat and moisture is transferred from steam to meal as fast and as evenly aspossible. The factors which influence this are:
1. Quality steam2. Steam velocity entering the conditioner3. Location of the steam pipe entering the conditioner4. Volume of meal in the conditioner
Steam should be “dry” at entry to the conditioner i.e., no water droplets. These should have been
taken out by the separator. The pressure of steam should be set to suit requirements -- generallyaround 4 Bar pressure for ruminant and other fibrous feeds, and around 1 to 2 bar for starchy typeof feeds. However, the writer suggests setting your pressure to suit your circumstances dependingon the moisture content of your meal prior to conditioning. If your meal is predominantly dry, thenuse low pressure steam for all types of feed, but ensure the diameter of the steam pipe, after reducingthe valve, is big enough to carry the volume at low velocity (20 m/sec) required to optimize mealtemperature and moisture. Best results are obtained when steam enters the conditioner via its endplate through a manifold. The steam reducing valve should be at least six meters upstream from entryto the conditioner.
So, if you are satisfied that everything so far meets with requirements, then the last stage has toreveal the problem.
Stage 4
Check out the following main problem areas:1. Fines return are large pieces or whole pellets returned to the pellet press -- possible hole in sifter
screen, See amperage trace Fig. 3 -- recorded in an Israel feedmill.2. Are you allowing any raw materials to by-pass the grinder e.g., soy or pelleted products? (Sieve
analysis will reveal this).
Figure 3.

8/20/2019 Asa Tr Ftech
http://slidepdf.com/reader/full/asa-tr-ftech 24/84
Troubleshooting the Pelleting Process
22
f e e d T e c h n o l o g y
3. Analyze finished product for oil and protein -- if out of spec., check feed raw materials and storage
silos. Possible carry over of one raw material into another.4. Check temperature and moisture of pellets leaving cooler. These should be at a level which youknow the product can be stored without risk of deterioration.
5. Are you adding water? Water doe not disperse well. It creates wet-spots which cause pellets todegrade during storage.
6. Are you adding other liquids e.g., fat, molasses? Check to ensure these are dispersed evenly.7. Ensure that both (all) rollers in the pelleting machine are positioned correctly and the plough/s are
not badly worn/fitted. Uneven pellet length is an indication that something is wrong. Check againto ensure the holes are not rolled over.
Maximizing Pellet Quality/Production Rate The addition of binders can help solve pellet quality problems or simply lift your pellet quality to a
higher plane. Lignin technology has advanced rapidly over the past few years so much so thatcollectively Lignins have become known as “Lignin Performance Enhancers.” Some have beendeveloped to maximize pellet quality, while others to maximize production of the pellet press withoutcompromising pellet quality.
When used to maximize pellet quality (as well as improving production rate) the glue-like propertiesof lignin maximize the grip between rollers, meal and die making the action of pelleting more positivei.e., reducing roller slip. As the pellets lose moisture in the cooler, the lignin structure within themtoughens and strengthens, resulting in pellets of higher durability.
On the other hand, lignins have been developed to maximize production rate (as well as improvingpellet quality) by creating “internal body lubrication” which allows the meal particles to mold togethermore easily, thereby forming pellets with improved structure. Moreover, lubrication extends to the die
allowing for higher production rate without losing pellet quality.
Lignin is a cost effective tool which can be usedto overcome production and pellet qualityproblems or as a means to improve overallefficiency. Fig. 1 and Fig. 2 show a pellet pressamperage trace recording when producing acommercial poultry feed. During a three hourproduction run, the pellet press operatorencountered 12 complete chokes and 13interruptions until a 0.5% addition of a specificallyformulated lignin production performance enhancer
was made. Amperage was immediately reducedand production ran smoothly from then on.Moreover, production rate increased from 13.2to 16.1 tons/hour, specific energy consumptionwas reduced from 11.36 to 10 kWh/T and pelletdurability increased from 52 to 62 Holmen. Theextra tonnage improved the profitability of thismill by $50 per hour.
Table 5/Fig 3 show a similar effect when producing 4 mm Tilapia.
Measurement Of Physical Pellet Quality
“Hardness”, “Durability “ and “Appearance” are the main factors associated with the term pellet quality.
Hardness is usually measure by a spring type tester. It is advisable to take the average of severalreadings because of the variability in results.
Pelleting Trial: commercial broiler feed (corn/soya type)
8/20/2019 Asa Tr Ftech
http://slidepdf.com/reader/full/asa-tr-ftech 25/84
Troubleshooting the Pelleting Process
f e
e d T e c h n ol o g y
23
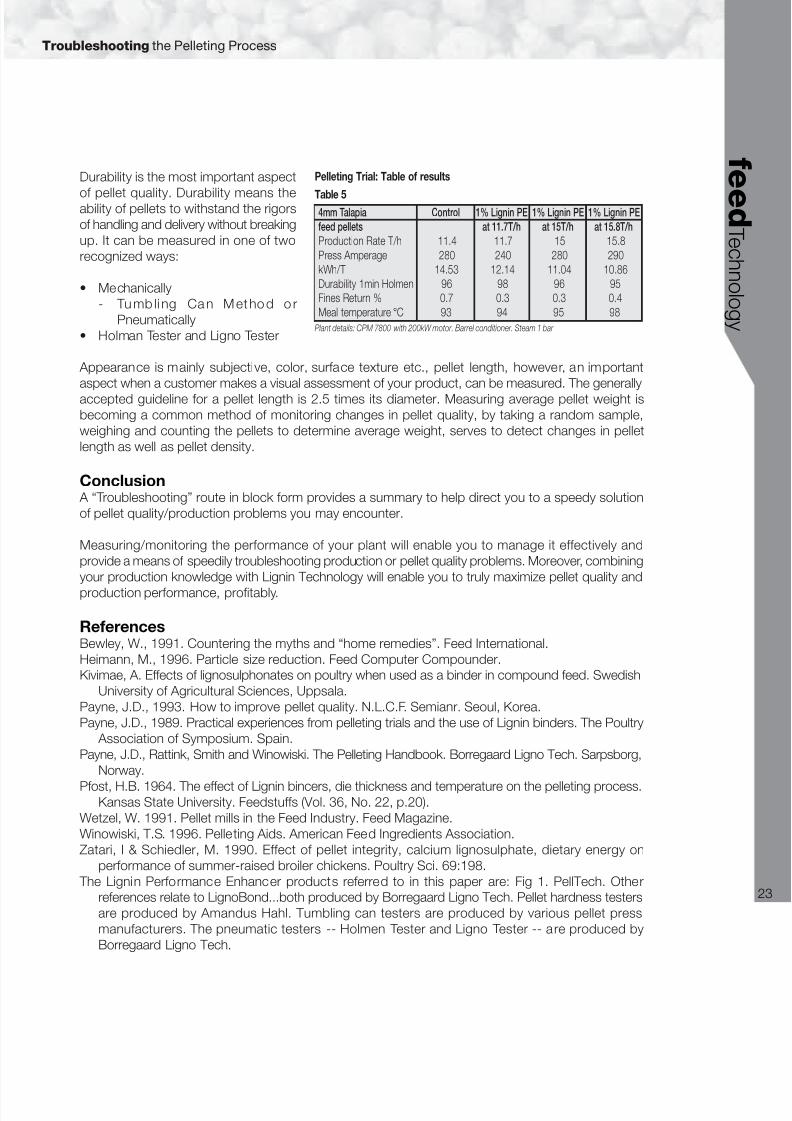
Durability is the most important aspect
of pellet quality. Durability means theability of pellets to withstand the rigorsof handling and delivery without breakingup. It can be measured in one of tworecognized ways:
• Mechanically- Tumb li ng Can Method o r
Pneumatically• Holman Tester and Ligno Tester
Appearance is mainly subjective, color, surface texture etc., pellet length, however, an importantaspect when a customer makes a visual assessment of your product, can be measured. The generallyaccepted guideline for a pellet length is 2.5 times its diameter. Measuring average pellet weight isbecoming a common method of monitoring changes in pellet quality, by taking a random sample,weighing and counting the pellets to determine average weight, serves to detect changes in pelletlength as well as pellet density.
Conclusion A “Troubleshooting” route in block form provides a summary to help direct you to a speedy solutionof pellet quality/production problems you may encounter.
Measuring/monitoring the performance of your plant will enable you to manage it effectively andprovide a means of speedily troubleshooting production or pellet quality problems. Moreover, combiningyour production knowledge with Lignin Technology will enable you to truly maximize pellet quality and
production performance, profitably.
ReferencesBewley, W., 1991. Countering the myths and “home remedies”. Feed International.Heimann, M., 1996. Particle size reduction. Feed Computer Compounder.Kivimae, A. Effects of lignosulphonates on poultry when used as a binder in compound feed. Swedish
University of Agricultural Sciences, Uppsala.Payne, J.D., 1993. How to improve pellet quality. N.L.C.F. Semianr. Seoul, Korea.Payne, J.D., 1989. Practical experiences from pelleting trials and the use of Lignin binders. The Poultry
Association of Symposium. Spain.Payne, J.D., Rattink, Smith and Winowiski. The Pelleting Handbook. Borregaard Ligno Tech. Sarpsborg,
Norway.
Pfost, H.B. 1964. The effect of Lignin bincers, die thickness and temperature on the pelleting process.Kansas State University. Feedstuffs (Vol. 36, No. 22, p.20).
Wetzel, W. 1991. Pellet mills in the Feed Industry. Feed Magazine.Winowiski, T.S. 1996. Pelleting Aids. American Feed Ingredients Association.Zatari, I & Schiedler, M. 1990. Effect of pellet integrity, calcium lignosulphate, dietary energy on
performance of summer-raised broiler chickens. Poultry Sci. 69:198. The Lignin Performance Enhancer products referred to in this paper are: Fig 1. PellTech. Other
references relate to LignoBond...both produced by Borregaard Ligno Tech. Pellet hardness testersare produced by Amandus Hahl. Tumbling can testers are produced by various pellet pressmanufacturers. The pneumatic testers -- Holmen Tester and Ligno Tester -- are produced byBorregaard Ligno Tech.
Pelleting Trial: Table of results
Table 54mm Talapia Control 1% Lignin PE 1% Lignin PE 1% Lignin PE
feed pellets at 11.7T/h at 15T/h at 15.8T/h
Production Rate T/h 11.4 11.7 15 15.8
Press Amperage 280 240 280 290
kWh/T 14.53 12.14 11.04 10.86
Durability 1min Holmen 96 98 96 95
Fines Return % 0.7 0.3 0.3 0.4
Meal temperature °C 93 94 95 98
Plant details: CPM 7800 with 200kW motor. Barrel conditioner. Steam 1 bar
8/20/2019 Asa Tr Ftech
http://slidepdf.com/reader/full/asa-tr-ftech 26/84
24
f e e d T e c h n o l o g y
Particle Size Reduction For Animal Feeds
Doug Reuscher
Roskamp Champion
USA
In the feed manufacturing industry, particle size reduction (grinding) is second only to extrusionprocesses (pelleting, expanders, extruders) in terms of total energy consumption. Any discussion of grinding then must first deal with the question, “Why grind?”
Why process at all? Of course the answer is ultimately feed efficiency, producing the most milk, eggs,meat, or fiber at the lowest possible cost. This first step in the feed manufacturing process works
towards the goal of improved feed efficiency by increasing the surface area of the materials beingprocessed. This increases the amount of materials exposed to the animals digestive system, andultimately leads to more complete digestion, thus better feed efficiency.
Because animal needs vary considerably, the degree of processing for various diets also must vary.Cattle and sheep have rather long, complex digestive tracts and so require a less processed feedmaterial. Swine have a fairly short, simple digestive system (very much like humans) and thereforebenefit from a more highly processed feed. Poultry have a short but rather complex digestive system,and depending on the make up of the diet can efficiently utilize feedstuffs less highly processed thanswine. The size and age of the animals also affects the dietary requirements so far as particle sizeis concerned. Generally speaking, younger animals require a finer, more highly processed feed thando older, more developed livestock.
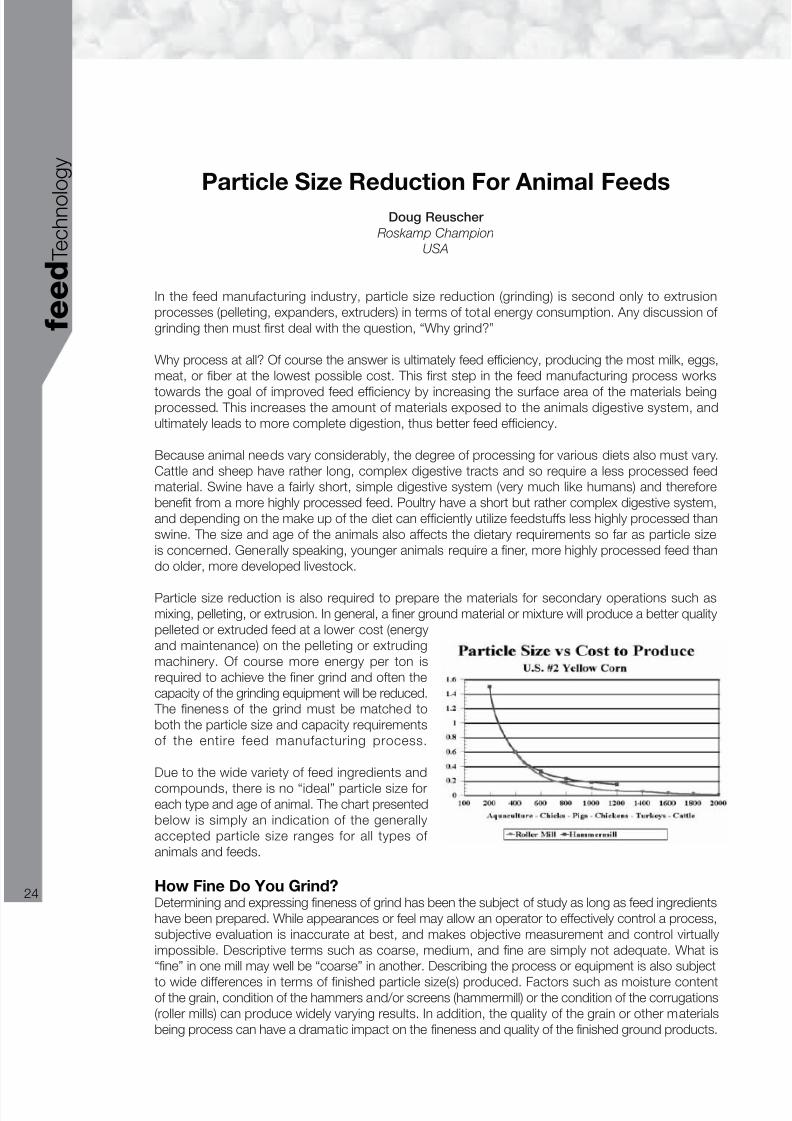
Particle size reduction is also required to prepare the materials for secondary operations such asmixing, pelleting, or extrusion. In general, a finer ground material or mixture will produce a better qualitypelleted or extruded feed at a lower cost (energyand maintenance) on the pelleting or extrudingmachinery. Of course more energy per ton isrequired to achieve the finer grind and often thecapacity of the grinding equipment will be reduced. The fineness of the grind must be matched toboth the particle size and capacity requirementsof the entire feed manufacturing process.
Due to the wide variety of feed ingredients and
compounds, there is no “ideal” particle size foreach type and age of animal. The chart presentedbelow is simply an indication of the generallyaccepted particle size ranges for all types of animals and feeds.
How Fine Do You Grind?Determining and expressing fineness of grind has been the subject of study as long as feed ingredientshave been prepared. While appearances or feel may allow an operator to effectively control a process,subjective evaluation is inaccurate at best, and makes objective measurement and control virtuallyimpossible. Descriptive terms such as coarse, medium, and fine are simply not adequate. What is“fine” in one mill may well be “coarse” in another. Describing the process or equipment is also subject
to wide differences in terms of finished particle size(s) produced. Factors such as moisture contentof the grain, condition of the hammers and/or screens (hammermill) or the condition of the corrugations(roller mills) can produce widely varying results. In addition, the quality of the grain or other materialsbeing process can have a dramatic impact on the fineness and quality of the finished ground products.

8/20/2019 Asa Tr Ftech
http://slidepdf.com/reader/full/asa-tr-ftech 27/84
Particle Size Reduction for Animal Feeds
f e
e d T e c h n ol o g y
25
The best measurement of finished particle sizing will be some form of a sieve analysis, expressed in
terms of mean particle size, or percentage (ranges) on or passing various test sieves. A completesieve analysis will not only describe the average particle size, but will also indicate peculiarities in thedistribution such as excessive levels of fine or coarse particles, etc. Typical descriptions that lendthemselves to objective measurement and control might be: corn ground to 750 Microns, not lessthan 50% passing 20 mesh, and 85% -10/+40 mesh.
Grinding EquipmentBoth roller mills and hammermills have been applied to the task of particle size reduction or grindingin feed milling applications. Hammermills have traditionally been used to produce the finer grindscommonly used for pelleting, and for many mash (meal or non pelleted) feed applications as well. The hammermill is a relatively simple machineand requires a fairly low degree of skill in regards
to both the operation and maintenance.
However, recent significant changes in the industryhave caused many to reassess their approachto particle size reduction. Increasing energy costs,increasing customer awareness of feed quality,and environmental concerns all challenge thevalidity of the hammermill as the only alternativefor particle size reduction (grinding) applications.In the following discussions, both roller mills andhammermills will discussed in terms of equipmentselection, operating conditions and parameters,and relative costs to acquire and to operate.
Roller Mill GrindingIn recent years, more attention has been given to the roller mill set up to function as a grinder. Severalimportant factors have contributed to this including energy costs, product quality concerns, andenvironmental issues. Each of these will be reviewed in turn below.
Energy costs have escalated dramatically in the last 20 years, and at the same time margins in feedmanufacturing have decreased. As a result, cost savings of $0.10 to $0.40 per ton for grinding canmean a significant difference in the bottom line of a feed manufacturing operation. Because of anefficient reduction action, roller mill grinders will produce 15 to 40% more tons/hour at a givenhorsepower than traditional "full circle" hammermills when producing the same finished particle size.Roller mill energy savings advantages will be even greater when compared to older half screen
hammermills with direct connected fans. In many instances the energy savings potential of a rollermill grinder will justify the capital expenditure.
Product quality concerns have always been a partof feed manufacturing, and there are manyquantitative methods for measuring feed quality.Nonetheless, the physical traits (appearance, feel,handling characteristics) will always influence thefeed buying customer. Because the grindproduced by a roller mill is very uniform, thefinished product(s) have an excellent physicalappearance. The low level of fines and lack of
oversize particles make a feedstuff with excellentflow and mixing characteristics. This is especiallyimportant for mash or meal type feeds where theflow from bins and feeders can be difficult toregulate, and where segregation and separation

8/20/2019 Asa Tr Ftech
http://slidepdf.com/reader/full/asa-tr-ftech 28/84
Particle Size Reduction for Animal Feeds
26
f e e d T e c h n o l o g y
may occur in shipping and handling. Because the product is not heated significantly in the grinding
process, less moisture is driven off and the finished product is not prone to hanging up in bins, spoilingin storage, and other maladies related to heat and moisture.
Environmental issues of concern to the feed manufacturer today include particulate emission, employeeexposure to noise, and the risk of fire and explosion. Because roller mill grinders create fewer fines,less material is likely to be lost to the atmosphere. Additionally, high efficiency hammermill installationsrequire air assist to achieve the rated performance. Cyclones and bag filters are not 100% effectivein removing the particulates from the air streams and so some emissions will occur. Whether or notthese emissions are a problem will depend on widely varying local conditions and regulations. Becauseroller mill grinders operate at lower speeds and with a different kind of reduction action, less noiseis generated in the grinding process. In many cases this reduction in noise means a roller mill grinderwill not require a separate enclosure to limit employee exposure to high noise levels. Lower operatingspeeds in roller mill grinders mean less frictional heating and less inertial energy (such as thrownhammers) in a hammermill. This reduction in ignition sources combined with less dust in the productstream greatly reduces the risk of fire in the grinding operation.
The Roller Mill GrinderNot every make or style of roller mill can be appliedto the task of grinding. Essentially, a roller millgrinder will utilize rolls from 9 to 12 inches indiameter operating at differential speeds. Rollspeeds will be higher for roller mill grinders thanfor cracking/crimping and flaking mills. Typicalperipheral speeds range from 1,500 feet/minuteto more than 3,000 feet/minute for 12" diameterrolls. Due to higher speeds and greater loads,the bearings and shafts of a roller mill grinderexperience far more demanding conditions thancracking or crimping mills.
Differential ratios vary from about 1.2:1 up to 2:1for typical feed milling operations. Lower differentialratios do not permit adequate reduction, whilehigher ratios can lead to excessive roll wear. Itis essential that the roll speed differential bemaintained when operating at full motor loadsin order to achieve the desired grinding results.
Inter roll drives may utilize spur gears, roller chains and sprockets, double sided V belts, toothed belts(timing belts), or shaft mounted gear reducers to achieve this differential action. Each type of drivehas its merits and limitations. Generally speaking, the simplest drive that is suitable for the maximumhorsepower applied will be the best.
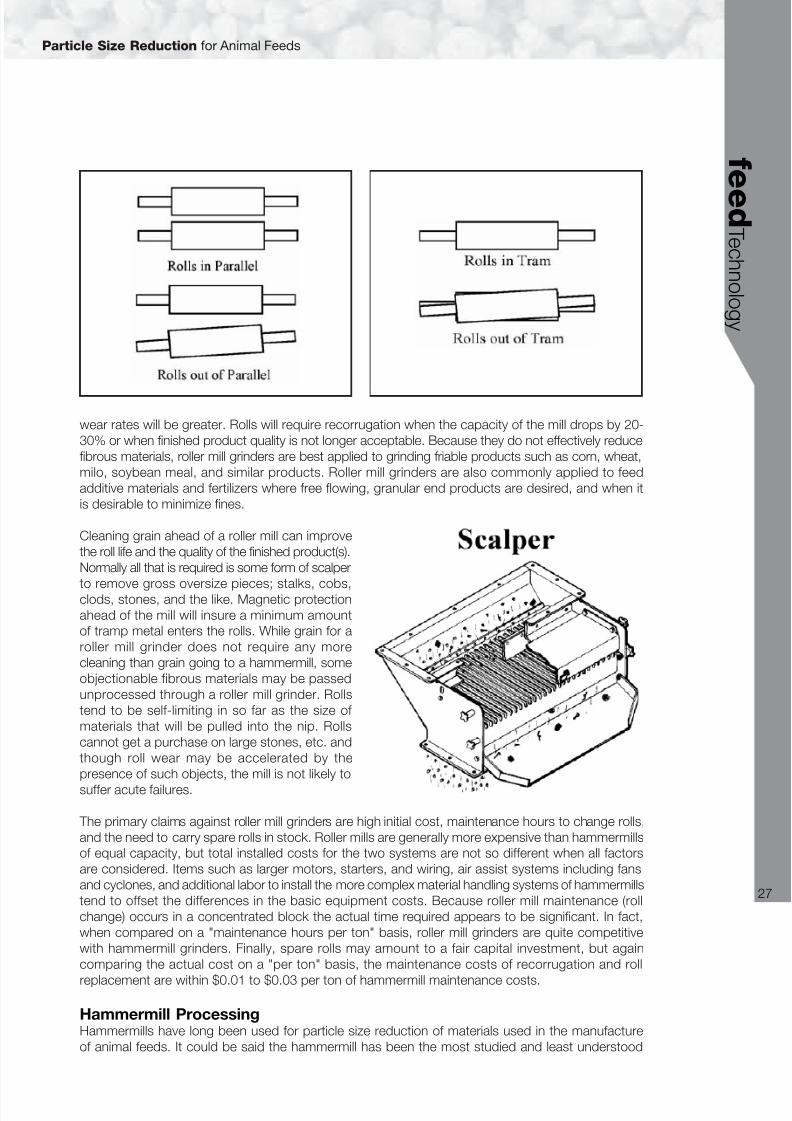
Because the roll clearances need to be maintained under demanding conditions, the mill housingand roll adjustment mechanism of the roller mill grinder must be more robust than for cracking andcrimping mills. More precise roll position adjustments must be made, and better control over thefeeding is necessary in order to achieve the full benefits of the roller mill grinder through its range of capabilities. Rolls must be operated in parallel and in tram to reliably produce quality finished products.For these reasons, many of the existing cracking and crimping mills cannot be made to functioneffectively as a roller mill grinder. The figures below depict roll conditions of parallel and tram.
A roll type feeder is generally preferred for a roller mill grinder to insure a uniform feed across the fulllength of the rolls. While other types of feeders can work, including simple slide gates or more complexvibratory feeders, the roll type feeder covers a wide range of applications very efficiently. Becauseroller mill grinders do more work and use more horsepower than cracking and crimping mills, roll
8/20/2019 Asa Tr Ftech
http://slidepdf.com/reader/full/asa-tr-ftech 29/84
Particle Size Reduction for Animal Feeds
f e
e d T e c h n ol o g y
27
wear rates will be greater. Rolls will require recorrugation when the capacity of the mill drops by 20-30% or when finished product quality is not longer acceptable. Because they do not effectively reducefibrous materials, roller mill grinders are best applied to grinding friable products such as corn, wheat,milo, soybean meal, and similar products. Roller mill grinders are also commonly applied to feedadditive materials and fertilizers where free flowing, granular end products are desired, and when itis desirable to minimize fines.
Cleaning grain ahead of a roller mill can improvethe roll life and the quality of the finished product(s).Normally all that is required is some form of scalper
to remove gross oversize pieces; stalks, cobs,clods, stones, and the like. Magnetic protectionahead of the mill will insure a minimum amountof tramp metal enters the rolls. While grain for aroller mill grinder does not require any morecleaning than grain going to a hammermill, someobjectionable fibrous materials may be passedunprocessed through a roller mill grinder. Rollstend to be self-limiting in so far as the size of materials that will be pulled into the nip. Rollscannot get a purchase on large stones, etc. andthough roll wear may be accelerated by thepresence of such objects, the mill is not likely to
suffer acute failures.
The primary claims against roller mill grinders are high initial cost, maintenance hours to change rolls,and the need to carry spare rolls in stock. Roller mills are generally more expensive than hammermillsof equal capacity, but total installed costs for the two systems are not so different when all factorsare considered. Items such as larger motors, starters, and wiring, air assist systems including fansand cyclones, and additional labor to install the more complex material handling systems of hammermillstend to offset the differences in the basic equipment costs. Because roller mill maintenance (rollchange) occurs in a concentrated block the actual time required appears to be significant. In fact,when compared on a "maintenance hours per ton" basis, roller mill grinders are quite competitivewith hammermill grinders. Finally, spare rolls may amount to a fair capital investment, but againcomparing the actual cost on a "per ton" basis, the maintenance costs of recorrugation and roll
replacement are within $0.01 to $0.03 per ton of hammermill maintenance costs.
Hammermill ProcessingHammermills have long been used for particle size reduction of materials used in the manufactureof animal feeds. It could be said the hammermill has been the most studied and least understood

8/20/2019 Asa Tr Ftech
http://slidepdf.com/reader/full/asa-tr-ftech 30/84
Particle Size Reduction for Animal Feeds
28
f e e d T e c h n o l o g y
piece of equipment in the feed manufacturing
plant. Much of this confusion has come aboutover the years as a result of hit or miss problemsolving and by treating symptoms rather thanaddressing the root causes when treatingoperational problems.
A well-designed hammermill grinding system willoffer good long-term performance and requirea minimum amount of attention if a few basicconsiderations are made at the time the equipmentis selected. The following discussion will explorethe basic theory of hammermill operation andoffer some principles on which systems may besuccessfully designed.
Equipment Description A hammermill consists of a rotor assembly, consistingof two or more rotor plates fixed to a main shaft,enclosed in some form of grinding chamber. The actualworking mechanisms are the hammers and the screenor grinding plates that encircle the rotor. The rotor maybe supported from one end only (overhung) orsupported on both ends by the shaft and bearings.For modern, high capacity machines in widths of 12”up to 48”, the rotor is normally supported on both
ends. This provides a more stable running mill, andreduces the tendency for a rotor shaft to “wind up”or run out under load. The hammers are simply flatmetal bars with a hole at one or both ends and usuallyhave some for of hardface treatment on the workingend(s). The hammers may be fixed, fastened rigidly to the rotor assembly but much more commonis the swinging hammers where the hammers float on pins or rods. This swinging hammer designgreatly facilitates changing hammers when the working edges are worn.
Reduction in a hammermill is primarily a result of impact between the rapidly moving hammer andthe incoming material. There is some attrition (gradual reduction by particles rubbing) between theparticles, and between the hammers and the screen.
The efficiency of the grinding operation will depend on a number of variables including but not limitedto: screen area / horsepower ratio, screen (hole) size and open area, tip speed, hammer pattern (numberof hammers), hammer position (coarse or fine), uniform feed distribution, and air assist. In addition, thenature and quality of the material(s) being processed will affect the performance of the hammermill.
Basic Machine CharacteristicsHammermills used in feed processing have some common characteristics but equipment manufacturersdiffer significantly in how they achieve those same characteristics. For the purpose of the discussion,here a number of basic design principles will be reviewed as they apply to maximizing the performanceand minimizing the cost of operating a hammermill system.
Full Width Top Feed - the modern hammermill design must include a full width top feed in order toachieve maximum efficiency and minimize the cost of operation. A full width feed insures the entirescreen area can be utilized, and that the work being accomplished will be evenly distributed acrossthe full hammer pattern. The top feed permits the direction of rotation to be changed, allowing twocorners of the hammer to be utilized before a physical change of the hammer is required.

8/20/2019 Asa Tr Ftech
http://slidepdf.com/reader/full/asa-tr-ftech 31/84
Particle Size Reduction for Animal Feeds
f e
e d T e c h n ol o g y
29
Tear Shaped Grinding Chamber - a tear shaped grinding chamber is necessary to prevent material
from circulating within the grinding chamber. Most well designed modern hammermills have somesort of flow director in the top of the hammermill to properly feed the hammermill and to stop anymaterials that are circulating within the grinding chamber.
Split Screen / Regrind Chamber - the screen should be split in two pieces, with some device at thebottom of the mill to disrupt the flow of materials within the grinding chamber. This device must belarge enough to take products out of rotation but should not be so large as to subtract from thescreen area available for grinding. The application of a split screen design will permit the user to adjustthe screen sizing on the down side and up side to maximize productivity and product quality.
Outboard Supported Rotor – As noted earlier, the rotor should be supported at each end, preferablywith standard bearings and bearing housings. This will provide a degree of rigidity not available withan “overhung” rotor design and reduce any problems with rotor shaft “wind up” even if the milloperates with an out of balance rotor. Adequate support for the rotor is particularly important withtoday’s increased capacity demands requiring wider machines..
Rigid Rotor Support - in order to maintain the relative position of the rotor to the grinding chamberthe foundation of the mill must be extremely rigid. A rigid structure positively maintains the clearancesbetween the hammer tips and the screen through the full rotation for consistent, efficient processing. This must be accomplished without sacrificing the accessibility to the grinding chamber, as routinemaintenance of the hammers and screens will be required.
Replaceable Wear Items - one final rule for a good hammer design is if it can wear, it should bereplaceable. Beyond the hammers, screens, and pins, every component within the hammermill willbe subject to wear. Accordingly, these components should be fabricated from wear resistant materials,
heavy enough to provide good service life, and ultimately should be reasonably simple to replace.
Basic Operational ConceptsParticle size reduction in a hammermill occurs as a resultof the impact between a rapidly moving hammer and arelatively slow moving particle. The particle breaks andis accelerated towards the screen. Depending on theparticle size and angle of approach, it either passesthrough the screen or rebounds from the screen into therapidly moving hammers again. As materials move throughthe grinding chamber they tend to approach hammer tipspeed. Since reduction only occurs when a significant
energy is transferred from the hammer to the particle(large difference in velocities), less grinding takes placewhen the particles approach hammer tip speed. Manymanufacturers incorporate devices within their mills tointerrupt this product flow, allowing impact and reductionto continue. Tear circle hammermills have a more positive,natural redirection of product at the inlet than "full circle"design machines.
While the basic operational concepts are the same for all hammermills, the actual unit operatingconditions change rather dramatically depending on the materials being processed. Grains such ascorn, wheat, and sorghum and various soft stocks like soybean meal tend to be friable and easy togrind. Fibrous, oily, or high moisture products like screenings, animal proteins, and grains like oatsand barley on the other hand, are very tough and require much more energy to reduce. Consequently,the hammermill set up that works well for one will not necessarily work well for the other. The followingdiscussion covers such factors as tip speeds, hammer patterns and position, horsepower ratios (tohammer and screen area), and air assist systems.

8/20/2019 Asa Tr Ftech
http://slidepdf.com/reader/full/asa-tr-ftech 32/84
Particle Size Reduction for Animal Feeds
30
f e e d T e c h n o l o g y
Tip Speed
Tip speed, in addition to screen size has asignificant influence on finished particle sizing.High tip speeds (>18,000 Ft/Min) will always grindfiner and produce more fines than lower tipspeeds. Low tip speeds (<13,000 Ft/Min), on theother hand, produce a coarser granulation withfewer fines. As a rule smaller screen hole sizesshould be used with higher tip speeds, and largerscreen hole sizes with lower tip speeds.
Tip speed is simply a factor of mill diameter andmotor RPM and is not easily changed on directcoupled machines. There are a few V-belt drivehammermills on the market today.
Tip Speed -Friable ProductsFor producing a uniform granulation with few fineson friable products like corn, wheat, grain sorghum,pelleted ingredients, and solvent extracted mealsan intermediate tip speed is normally desirable.Hammermills with a tip speed of 13,000-18,000Ft/Min will produce a high quality finished productwith excellent capacity and efficiency. 38" diametermills with 1800 RPM motors (17,800 Ft/Min) and44" mills with 1200 or 1500 RPM motors (13,500
or 17,250 Ft/Min) are both used extensively inthe processing of all kinds of feed ingredients.
Tip Speed - Fine Grinding And Tough To Grind MaterialsFor fine grinding friable products and tough to grind materials like soybean hulls, mill feed, and mixtureswith animal protein products, a higher tip speed is indicated. Because more energy is required togrind these kinds of materials a higher tip speed is beneficial. Normal tip speeds for fine grinding andfibrous materials are obtained on 42" and 44" mills operating at 1800 RPM (19,500 and 20,000Ft/Min), or 28" mills operating at 3000 RPM and 54" mills operating at 1500 RPM (21,000 Ft/Min).Recent developments in hammermill grinding have included the use of 54” diameter mills operatingat 1800 RPM. This very high tip speed (>25,000 Ft/Min) is particularly well suited to fine grinding athigh capacities and high efficiency. Because a larger screen (hole) sizes can be used while maintaining
the fineness of the grind, operating costs are reduced as well.
Hammers There is an unlimited number of hammer styles available from manysuppliers around the world. At the same time, there are distinctly differenttypes of hammers used in different regions of the world. European feedprocessors tend to favor a plain two-holed hammer, with no hardfacingor edge treatment. North and South American feed millers tend to favora hammer with a flared hardface end (or ends). Each market tends tofind a hammer type that best suits their particular needs.
Hammer patterns and positions have a profound effect on the
performance of any hammermill. Because different materials grinddifferently, the ideal number of hammers and clearance to the screenwill need to be adjusted according to each application. At the sametime, it is important to make sure the hammer pattern covers theworking screen, without having hammers in line.

8/20/2019 Asa Tr Ftech
http://slidepdf.com/reader/full/asa-tr-ftech 33/84
Particle Size Reduction for Animal Feeds
f e
e d T e c h n ol o g y
31
In most cases, the hammer pattern should include double
hammers on the outside rolls of at least two opposing pins.Because the material in the grinding chamber near the sidesof the mill moves more slowly (dragging on the sides), theoutside rows of hammers must do more work and are subjectto more wear. Some manufacturers use thicker or longerhammers on the outside rows.
There is also a relationship between the HP/hammer and thewear on the hammer. Too much HP/hammer will tend to "rock"the hammer each time the hammer swings through a bed of material on the screen, leading to rapid wear of the hammerhole and hammer mounting pin. In extreme cases, the bed mayb e s odeep that
the hammer wears above the hardfacing. If thishappens the correct solution is not to use a hammerwith more hardfacing extending up the hammer,but to reduce the H.P., increase the number of hammers, or reduce the feed rate to the mill. Toolittle HP/hammer dramatically reduces hammermillefficiency by consuming motor horsepower simplyto turn the rotor with its load of hammers. Too littleHP/hammer also tends to wear the hammers righton the corner and does not effectively use all theworking surface of the hammer.
ScreensMore time, effort, and dollars are invested and lost in hammermill processing due to screen applicationfailures than would ever be thought possible. Excessive horsepower per In2 of screen and poorscreen configurations steal precious process energy and maintenance dollars. In simplest terms, thebest screen for any job is the thinnest material with the most open area. Naturally, some sacrifice inefficiency must be made for the sake of endurance, yet the general rule applies.
It is easy to see how new screens improve capacityand grinding efficiency. While thicker screens willlast longer, they significantly reduce the tons/hourthat a mill can process. When maintenance costs
are typically $0.02-$0.10/ton and electrical costsrange from about $0.25/ton, to more than $1.00per ton, saving money by not changing screensis truly false economy.
Another screen consideration is the amount of open area a particular screen offers. Factorseffecting open area include hole size, stagger,angle of stagger, and hole spacing. Screens withfewer holes have less open area, are easier toproduce, and generally cost less. Screens withlittle open area may wear a long time, but theactual grinding cost per ton is greatly exaggeratedbecause of the increased energy cost.
Two rules of thumb apply to hammermill screens in relation to applied horsepower:1. Never have less than 14 In2 of screen per horsepower (more is always better)2. Never have less than 4 In2 of open area per horsepower

8/20/2019 Asa Tr Ftech
http://slidepdf.com/reader/full/asa-tr-ftech 34/84
Particle Size Reduction for Animal Feeds
32
f e e d T e c h n o l o g y
One very simple way of increasing hammermill capacity without affecting the finished grind or adding
expense to the grinding system would be to replace the "up" wide screen with perforations that are2/64" to 6/64" larger than the "down" side screen. This may add 10-15% to the hammermill capacityand produce no noticeable difference in the finished products. Remember that the screens must beswitched when the hammermill rotation is changed to use both corners of the hammer.
FeedersProper feeding of a hammermill is absolutely essential if the system is to operate at maximum grindingefficiency, and with the lowest possible cost per ton. Uneven or inconsistent feeding can lead tosurges in the motor load. Because the load is constantly changing, the motor cannot operate at peak efficiency and so increases the grinding costs. An additional liability that is often “hidden” is the factthat surges in the feed tend to accelerate wear on the hammers and pins by causing the hammersto “rock” on the pin.
Uneven feeding across the face of the hammermill obviously increases the wear on the workingcomponents in the areas of heaviest feeding. Because a part of the mill is being overworked, the restof the mill is not being fully loaded and grinding efficiency is reduced. Uneven feeding also tends tocause a hammermill to go out of balance more quickly due to uneven wear. This adds to the operatingcost of the mill be causing premature replacement of the wear items like hammer and pins.
Rotary Pocket Feeder - as the name indicates, rotary pocket feeders utilize a rotor mechanism muchlike a rotary air lock to evenly distribute the feed to the hammermill. In most cases, the rotor issegmented and the pockets are staggered to improve the distribution of the feed, and to reducesurges in the feed rate. Because the rotary pocket type feeders relies on a free flowing material tofill the pockets, they are best suited to granular materials with a density of 35#/Ft3 or more. Typicalapplications would be whole grains and coarsely ground meals.
Screw Feeder - screw type feeders are used when processing materials that have poor flowcharacteristics, or contain large bits of material that would not flow properly with a rotary pocketfeeder. Screw feeders impart a surge to the feed, and so have limited applications in high capacity / high efficiency grinding situations. In the past, screw feeders were selected when rotary pocket typefeeders lacked sufficient capacity to load a hammermill motor. With the advent of today’s 10” and12” diameter rotor sections, this is no longer a problem.
Air Assist The final application topic to be considered is the use of aspiration air to improve mill efficiency andperformance. The air assist system controls the environment of the grinding chamber in the hammermilland aids in moving product from the grinding chamber through the screen perforations. A properly
designed air assist allows a hammermill to grind more efficiently, producing a more uniform finishedproduct with less heating and controls dustingaround the mill. Although hammermill capacitywill vary with the type of machine and operationalparameters, air assisted grinding systems will outproduce non-assisted systems by 15-40%.
A good rule of thumb for the amount of air requiredto assist product and control dusting is 1.25-1.50CFM/In2 of screen area. Pressure drop acrossthe mill may range from 2-5" W.C., dependingon system operating conditions. In order to make
an air assist system work, several items must beconsidered including the air flow into the mill,paths for the air and product out of the mill,separating the product from the air stream, andcontrolling the path of the air in the system.
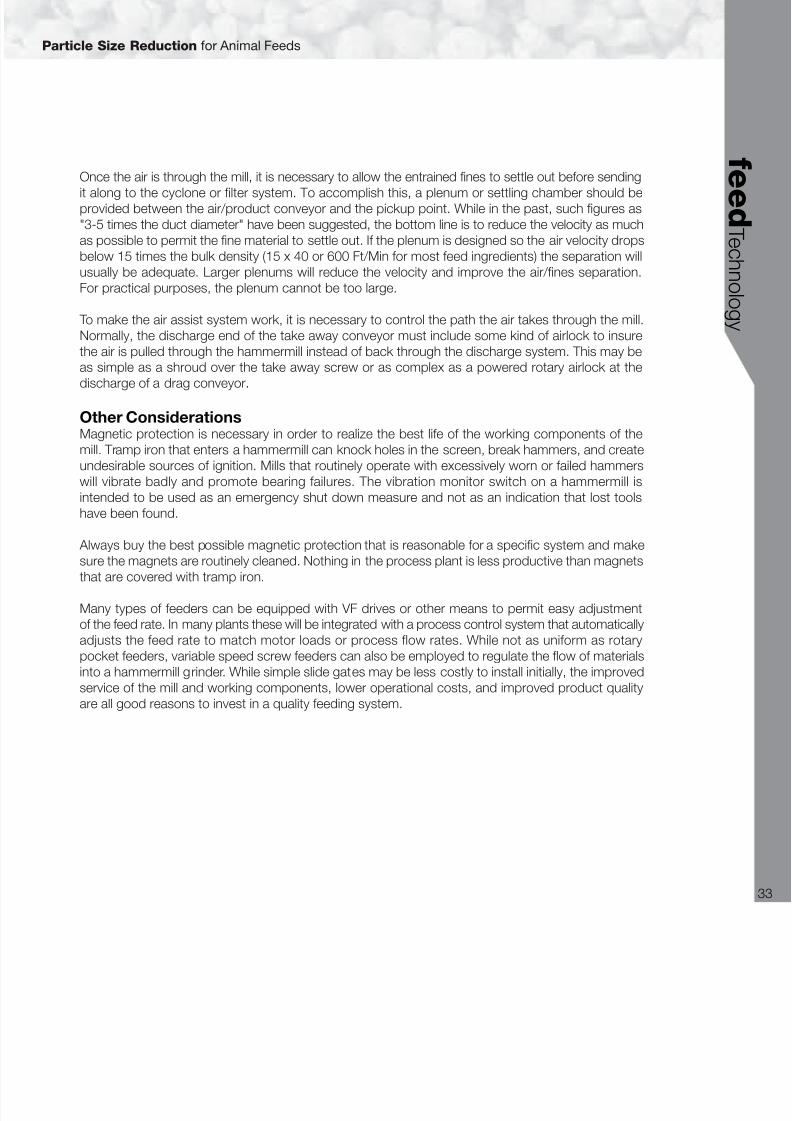
8/20/2019 Asa Tr Ftech
http://slidepdf.com/reader/full/asa-tr-ftech 35/84
Particle Size Reduction for Animal Feeds
f e
e d T e c h n ol o g y
33
Once the air is through the mill, it is necessary to allow the entrained fines to settle out before sending
it along to the cyclone or filter system. To accomplish this, a plenum or settling chamber should beprovided between the air/product conveyor and the pickup point. While in the past, such figures as"3-5 times the duct diameter" have been suggested, the bottom line is to reduce the velocity as muchas possible to permit the fine material to settle out. If the plenum is designed so the air velocity dropsbelow 15 times the bulk density (15 x 40 or 600 Ft/Min for most feed ingredients) the separation willusually be adequate. Larger plenums will reduce the velocity and improve the air/fines separation.For practical purposes, the plenum cannot be too large.
To make the air assist system work, it is necessary to control the path the air takes through the mill.Normally, the discharge end of the take away conveyor must include some kind of airlock to insurethe air is pulled through the hammermill instead of back through the discharge system. This may beas simple as a shroud over the take away screw or as complex as a powered rotary airlock at thedischarge of a drag conveyor.
Other ConsiderationsMagnetic protection is necessary in order to realize the best life of the working components of themill. Tramp iron that enters a hammermill can knock holes in the screen, break hammers, and createundesirable sources of ignition. Mills that routinely operate with excessively worn or failed hammerswill vibrate badly and promote bearing failures. The vibration monitor switch on a hammermill isintended to be used as an emergency shut down measure and not as an indication that lost toolshave been found.
Always buy the best possible magnetic protection that is reasonable for a specific system and makesure the magnets are routinely cleaned. Nothing in the process plant is less productive than magnetsthat are covered with tramp iron.
Many types of feeders can be equipped with VF drives or other means to permit easy adjustmentof the feed rate. In many plants these will be integrated with a process control system that automaticallyadjusts the feed rate to match motor loads or process flow rates. While not as uniform as rotarypocket feeders, variable speed screw feeders can also be employed to regulate the flow of materialsinto a hammermill grinder. While simple slide gates may be less costly to install initially, the improvedservice of the mill and working components, lower operational costs, and improved product qualityare all good reasons to invest in a quality feeding system.
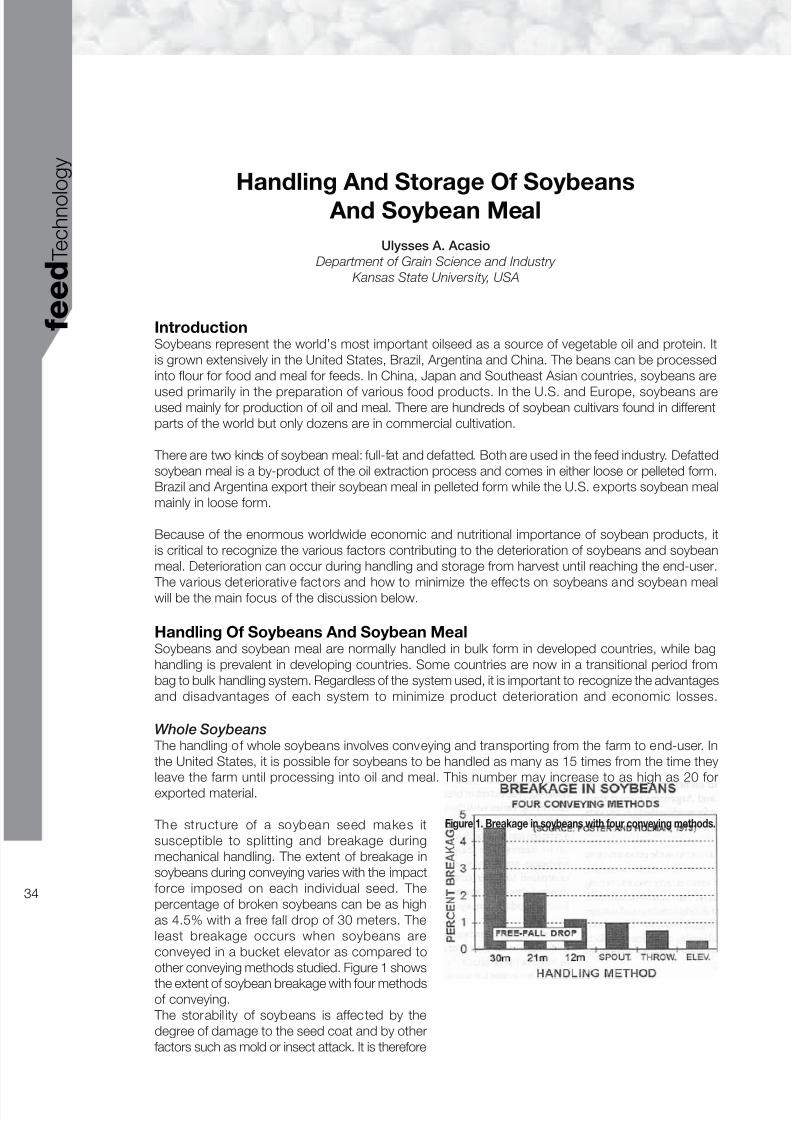
8/20/2019 Asa Tr Ftech
http://slidepdf.com/reader/full/asa-tr-ftech 36/84
34
f e e d T e c h n o l o g y
Handling And Storage Of Soybeans
And Soybean Meal
Ulysses A. Acasio
Department of Grain Science and Industry
Kansas State University, USA
IntroductionSoybeans represent the world’s most important oilseed as a source of vegetable oil and protein. Itis grown extensively in the United States, Brazil, Argentina and China. The beans can be processedinto flour for food and meal for feeds. In China, Japan and Southeast Asian countries, soybeans are
used primarily in the preparation of various food products. In the U.S. and Europe, soybeans areused mainly for production of oil and meal. There are hundreds of soybean cultivars found in differentparts of the world but only dozens are in commercial cultivation.
There are two kinds of soybean meal: full-fat and defatted. Both are used in the feed industry. Defattedsoybean meal is a by-product of the oil extraction process and comes in either loose or pelleted form.Brazil and Argentina export their soybean meal in pelleted form while the U.S. exports soybean mealmainly in loose form.
Because of the enormous worldwide economic and nutritional importance of soybean products, itis critical to recognize the various factors contributing to the deterioration of soybeans and soybeanmeal. Deterioration can occur during handling and storage from harvest until reaching the end-user. The various deteriorative factors and how to minimize the effects on soybeans and soybean mealwill be the main focus of the discussion below.
Handling Of Soybeans And Soybean MealSoybeans and soybean meal are normally handled in bulk form in developed countries, while baghandling is prevalent in developing countries. Some countries are now in a transitional period frombag to bulk handling system. Regardless of the system used, it is important to recognize the advantagesand disadvantages of each system to minimize product deterioration and economic losses.
Whole Soybeans The handling of whole soybeans involves conveying and transporting from the farm to end-user. Inthe United States, it is possible for soybeans to be handled as many as 15 times from the time theyleave the farm until processing into oil and meal. This number may increase to as high as 20 forexported material.
The structure of a soybean seed makes itsusceptible to splitting and breakage duringmechanical handling. The extent of breakage insoybeans during conveying varies with the impactforce imposed on each individual seed. Thepercentage of broken soybeans can be as highas 4.5% with a free fall drop of 30 meters. Theleast breakage occurs when soybeans areconveyed in a bucket elevator as compared toother conveying methods studied. Figure 1 shows
the extent of soybean breakage with four methodsof conveying. The storabil ity of soybeans is affected by thedegree of damage to the seed coat and by otherfactors such as mold or insect attack. It is therefore
Figure 1. Breakage in soybeans with four conveying methods.

8/20/2019 Asa Tr Ftech
http://slidepdf.com/reader/full/asa-tr-ftech 37/84
Handling and Storage of Soybeans and Soybean Meal
f e
e d T e c h n ol o g y
35
important to inspect soybeans for mechanical and other forms of damage prior to storage. If the
amount of broken or split soybeans is very high, it may be prudent to separate the broken or splitgrains by sieving. This material can then be used first as opposed to long-term storage with theoriginal stock.
Soybean Meal Soybean meal is difficult to handle because of poor flow ability and bridging characteristics. Soybeanmeal tends to settle or consolidate over time. This phenomenon occurs in most granular materials andbecomes more severe with increased moisture, time and small particle size. Because of this, bulk soybean meal is best stored in flat storage buildings instead of vertical silos. Standard conveyors canbe used for loading into the building and front-end loadings tractor can be used in combination withstandard conveyors for reclamation. New sweep auger designs are now available that effectively reclaimmeal products from silos. Various models and capacities are available. One model is designed toreclaim meal products from flat- bottom silos andanother for hopper-bottom silos. However, becauseof their very high initial cost, they have not becomea standard equipment yet in the industry.
Addition of calcium carbonate, calcium bentonite,or sodium bentonite at a level between 0.25%to 0.5% is effective in improving the flowabilityof soybean meal of the additive, and the mixingprocess may outweigh the potential advantagegained in improving its flowability. Other innovationssuch as electric vibrators and compressed air tofluidize the meal are available to improve discharge
of soybean meal from storage bins.
The flow characteristics of bulk materials aredependent on individual particle shape, density,frictional property, and moisture content. Forgranular materials like grains, typical flow patternsduring discharge from hopper bottom bins areillustrated in Figure 2. Drawing (A) shows a normaldischarge pattern. The bridging and funnelingproblems depicted in drawings (B) and (C) occurin grains containing high content of foreign materialor moisture.
Typical flow problems of meal products dischargedfrom storage silos are shown in Figure 3. Theseare usually due to a combination of factors suchpoor hopper design, high moisture content andstorage time.
Factors Affecting Safe Product Storage The three major factors affecting the storability of soybean and soybean meal are moisture content,temperature, and duration of storage. The general condition of the product and amount of foreignmaterials also affect their storability.
Moisture Content Moisture is perhaps the most important single factor affecting storage of soybeans and soybeanmeal. Soybeans contain moisture ranging from 12% to 15% (wet basis) at harvest time. Soybeanswith moisture above 13% should be dried to reduce the risk of deterioration due to seed respiration,mold attack, spontaneous heating and reduced germination. It is widely recognized that there aretwo forms of moisture in cereal grains and oilseeds:
Figure 2. Typical flow pattern and problem with bulk granular
materials such as grains.
Figure 3. Typical bulk flow problems with meal products during
discharge from hopper-bottom silos.

8/20/2019 Asa Tr Ftech
http://slidepdf.com/reader/full/asa-tr-ftech 38/84
Handling and Storage of Soybeans and Soybean Meal
36
f e e d T e c h n o l o g y
a. free moisture is in vapor form and is removed during drying
b. bound moisture remains “locked” in the molecular structure of the grain and cannot be removedby drying
In general, soybeans can be kept for a given period of time with no appreciable degree of deteriorationif the moisture content is relatively low. The safe moisture content of soybeans is presented in Table 1.
Soybeans and soybean meal are hygroscopicmaterials and will either lose (desorb) or gain(adsorb) moisture from the surrounding air. Themoisture level reached by a product at a givenconstant temperature and equilibrium relativehumidity (ERH) is its equilibrium moisture content(EMC). The EMC and ERH of soybean meal areillustrated in Tables 2 and 3. The equilibriummoisture content of soybeans by desorption atvarious temperatures and relative humidities arepresented in Figure 4.
The EMC values for soybeans are based from thewidely accepted modified Chung-Pfost equationused for determining EMC and ERH for variousgrains. The desorption and adsorption EMC curvesfor soybeans and soybean meal at 25°C (77°F)are shown in Figure 5.
The EMC of soybeans and soybean meal bydesorption are higher than that by adsorptionunder the same set of conditions. Thisphenomenon is known as hysteresis. It occursin most agricultural products such as cereal grains,oilseeds, leathers, meats and even vegetables.However, the hysteresis effect in grain diminishesafter repeated adsorption and desorption cycles.In soybeans and soybean meal, hysteresis is lesspronounced compared with that of cereal grains.
Furthermore, the ERH of the meal is lower than
that of whole soybeans at all moisture levels
Table 1. Safe storage periods for soybeans at some moisture
levels.
Moisture content, Safe Storage Period
% wet basis Market Stock Seed Stock
10-11 4 years 1 year
10-12.5 1 - 3 years 6 months
13-14 6 - 9 months poor germination
14-15 6 months poor germinationSource: Barre, 1976
Table 2. Equilibrium moisture content of soybeans (desorption).
Temperature Relative Humidity, %
°C °F 10 20 30 40 50 60 70 80 90
5 41 5.2 6.3 6.9 7.7 8.6 10.4 12.9 16.9 22.4
15 59 4.3 5.7 6.5 7.2 8.1 10.1 12.4 16.1 21.9
25 77 3.8 5.3 6.1 6.9 7.8 9.7 12.1 15.8 21.3
35 95 3.5 4.8 5.7 6.4 7.6 9.3 11.7 15.4 20.6
45 113 2.9 4.0 5.0 6.0 7.1 8.7 11.1 14.9 -
55 131 2.7 3.6 4.2 5.4 6.5 8.0 10.6 - -
Source: 1993 American Soc. of Agri. Engineers Standards
Table 3. Equilibrium moisture content of soybean meal.
Desorption Adsorption
Moisture Moisture
content,% content,%
wet basis 15°C 25°C 35°C wet basis 15°C 25°C 35°C
ERH, % ERH, %
35.2 93.5 95.9 93.9 23.5 85.8 86.6 86.9
25.3 88.0 88.9 90.2 17.6 79.0 80.0 80.2
18.2 79.4 79.2 78.6 12.5 66.5 68.1 68.1
7.8 37.2 40.9 44.7 8.9 49.5 51.6 53.1
5.9 18.3 20.0 22.4 6.9 29.9 33.7 36.3
Source: Pixton and Warburton, 1975
Figure 4. The equilibrium moisture content of soybeans by
desorption based on the modified Chung-Pfost equation for
various grain (Source: ASAE 1993 Standards).
Figure 5. The desorption and absorption equilibrium moisture
content of soybeans and soybean meal at 25°C (77°F).

8/20/2019 Asa Tr Ftech
http://slidepdf.com/reader/full/asa-tr-ftech 39/84
Handling and Storage of Soybeans and Soybean Meal
f e
e d T e c h n ol o g y
37
because of its lower oil content. This means that under the same air relative humidity, soybean meal
will have higher EMC than whole soybeans.
The rate of moisture adsorption or desorption is directly related to the manner by which a productis exposed to the atmosphere. For example soybeans kept in jute sacks tend to gain or lose moisturemore readily than soybeans in bulk form. Hence, bag storage has as self-ventilating and coolingcharacteristic that makes it the preferred method over bulk system in many developing countries.However, bulk storage of soybeans allows the use of aeration or cooling techniques to maintain itsdesirable quality in a controlled manner. Aerating soybeans in bags is also possible but is not practicalbecause of the uneven airflow patterns resulting in non-uniform grain temperature.
Temperature Temperature is another very important factorinfluencing soybean storage. Growth of fungi andchemical changes such as oxidation increasedwith temperature in both meal and whole beans.Insects develop and reproduce best between 27and 35°C (80 to 95°F). Below 16°C (60°F) insectsbecome inactive and die of starvation. Exposureto temperature greater than 600C (140°F) killsmost insect species in 10 minutes.
Soybeans with a moisture contents of 14 - 14.3%and maintained at 5- 8°C (41- 46°F) can be storedfor over two years without mold damage whilesoybeans kept at 300C (860F) can be invaded
by molds in a few weeks and severely damagedin six months. Recent studies indicate thatsoybeans can be stored at 10.5% moisture at anytemperature without the danger of mold attack (Figure 6). However, at this moisture content, insectinfestation may develop unless its temperatureis maintained below 20°C (68°F). This is equivalentto a seed wet-bulb temperature of 15°C (59°F)or corresponding relative humidity of 60%.
Temperature also influences moisture migration. The driving force in moisture migration in a grain
mass is temperature gradient. This conditioncauses very small air movements and water vaportranslocation in the grain mass. It has beenestimated that a grain mass temperature gradientof about 16.7°C (30°F) can induce an inter-seedairflow of 0.06 m / min (0.2 ft / min). Thus, grainsstored at moisture contents considered safe, mayspoil because of moisture migration associatedwith inter-seed air currents. The general movementof air in a grain bulk under two climatic conditionscharacterized by warmer outside air and colderoutside air are shown graphically in Figure 7. Theair movements in the grain bin is influenced bythe outside air temperature that createstemperature gradients in the entire grain mass. This phenomenon affects all types of storage siloswhether it is made of concrete or metal. Theyvary only on the magnitude of air movement.
Figure 6. The relationship between soybean moisture content,
mild growth, and insect development as affected by the seed
we-bulb temperature.
Figure 7. Natural convection currents in stored grain due to
temperature gradients.

8/20/2019 Asa Tr Ftech
http://slidepdf.com/reader/full/asa-tr-ftech 40/84
Handling and Storage of Soybeans and Soybean Meal
38
f e e d T e c h n o l o g y
Because of the insulating property of grains, the effect of diurnal temperature changes on the stored
grain is minimal but is cumulative. It takes a long time of relatively constant high temperature gradientsto initiate the air movements shown in the diagrams to occur. However, experience indicates thatunder hot and humid tropical conditions, grains stored in metal bins exhibit “sweating” next to thewall. This can be attributed to extreme high temperatures reached at the inner surface of the metalsilo on a hot day. At night, rapid cooling of the metal results in moisture condensation as the dewpoint is reached. Caking and charring in metal silos can be attributed to this phenomenon.
Duration Of StorageDeterioration of soybeans and soybean meal in storage is a combined function of its moisture content,temperature, and duration of storage. Therefore, for safe storage, a combination of the three factorsproviding unfavorable conditions for mold development, such as low product moisture, low temperature,and short storage period are desirable.
Foreign Material Present Foreign material in soybeans is defined in U.S.Standards as all materials that pass through a3.2 mm (8 /64-inch) round-hole sieve and allmaterials other than soybeans remaining on thesieve. Fine foreign materials tend to segregateduring bin loading and occupy void spaces in thecentral region of the grain mass. Meanwhile, thelarge and lighter materials will accumulate closeto the walls of the silo. The process of materialsegregation inside a storage silo is illustrated inFigure 8.
During aeration, the air will flow around spots withhigher concentration of fine foreign materials andthrough pockets of high concentration of largeforeign materials. This condition will create a non-uniform flow of air during aeration, thus, makingit an ineffective operation.
Consequently, the non-aerated pockets in the grain mass are potential sites for hot spots that willprovide ideal environment for insects to grow and multiply. Hence, cleaning soybeans prior to storagewill minimize the risk of spoilage and economic loss. This should be part of an integrated approachto any quality maintenance program of grain processing companies.
Product Condition And History Sound soybean kernels will store better than kernels damaged by freezing, cracking, splitting, andstorage fungi. Split kernels are more susceptible to attack by stored product insects and fungi thanwhole kernels. It is generally recognized that a sound seed coat provides some degree of protectionagainst insect and fungal attack. For this reason, it is preferred to have a grain handling system thatminimizes cracking and splitting of soybeans. Belt conveyors are recommended as they handle graingently and efficiently. Belt conveyors can also move grains for great distances without damage. It isvery common for soybeans to be conveyed as many as 15 to 19 times between harvest processingor export. The amount of broken and split kernels increases with every handling and conveyingoperation. In terms of insect attack, soybean meal is far more susceptible to moth and red flour beetleinfestation than whole soybeans. Weevils deposit their eggs on whole soybeans where the larva willhatch and feed on the bean.
Figure 8. Schematic diagram of how light and heavy foreign
materials segregate when grain is loaded into a storage silo.

8/20/2019 Asa Tr Ftech
http://slidepdf.com/reader/full/asa-tr-ftech 41/84
Handling and Storage of Soybeans and Soybean Meal
f e
e d T e c h n ol o g y
39
Deterioration Indicators
HeatingHeating is the most common indicator of a problem in stored grains and oilseeds. High graintemperatures normally indicate either microbial or insect activity. If left unchecked, this may lead toheat-damaged or charred grains due to the phenomenon of stack burning. Heating in cereal grainspeaks at about 58°C (135°F) then declines to ambient temperature. At the peak temperature, insectsand molds are killed, thus making the process self-limiting. In soybeans, is also initiated by microbialand insect activity. However, as heating progresses above 50°C (120°F), the oxidation of oil in soybeansbecomes a self-sustaining process. Temperatures above 150°C (300°F) may occur. At this extremetemperature, charring will definitely occur and spontaneous combustion or fire becomes a distinctpossibility, if sufficient oxygen is present at the hot spot. Because of this danger, hot spots in storedsoybeans must be cooled or dissipated before they reach the critical level. If no action is taken when
heating in soybeans occurs, either the product will be lost by stack burning (charring) or at worst,the entire facility will be lost through fire. Aerating soybeans when fire has already started makes thesituation worse. A temperature monitoring system in soybean storage silos is essential. Immediatecorrective measures for heating cannot be over-emphasized.
Change In Color And General AppearanceIn general, sound soybeans are plump with bright uniform tan and not green color and free fromunusual spots and shrivelled appearance. Discolored soybeans usually indicate inferior quality andlower market value. The change in color is usually associated with mold invasion accompanied bymicrobial respiration and subsequent heating. This deterioration process can be detected by periodicdrawing of samples from the stored soybeans as part of an integrated approach to quality maintenance.Once detected, appropriate measures can then be taken such as cooling the grain either by aerationor use of a portable cooling unit. Another corrective measure is to transfer the grain to another silothus breaking any hot spots present and cooling the soybeans during the conveying process. However,this should be done only as a last resort since it is costly and will increase the amount of broken orsplit soybeans.
Mustiness And Off-odor ConditionMusty odor usually indicates an advanced stage of insect or mold infestation and should be dealtwith immediately. If this is detected, the soybeans should be aerated to remove the bad odor andcool the material. Beans should then be used at the earliest opportunity. The grain should be fumigatedimmediately if insects are present. A sharp odor may indicate rancidity due to chemical changes inthe oil component.
Presence Of Storage Insects The presence of large population of weevils and small moths usually indicate an advanced stage of infestation. Sitophilus granarium (granary weevil) may infest whole soybeans but not soybean mealwhile Tribolium castaneum (red flour beetle) and Trogoderma granarium (khapra beetle) will infestsoybean meal at relative humidities above 75% and temperatures above 30°C (86°F). Ephestia cautela(almond moth) can develop even at 8.8% moisture (wet basis) and temperature of 25°C (77°F) .
Lumping And CakingLumping and caking indicate a very advanced stage of fungi invasion in soybeans and soybean meal.In metal bins, caking usually occurs on the bin walls as a result of “sweating” or moisture condensingon the inner surface of the cold bin wall. The condensing moisture is absorbed by the adjacent grainsresulting in either sprouting or mold growth. Lumping may also occur in spots where the grain moistureincreased due to a leaky roof or moisture migration or translocation by natural convection (see Figure
7). In a bag system of storage, caking of soybeans and soybean meal may also occur as a result of increased moisture content adsorbed from the atmosphere, leaky roof, or due to capillary moisturefrom the floor. Capillary moisture can be eliminated by putting the bags on pallets. Concrete floorscan be made water-proof during construction by installing plastic sheets as moisture barriers beforepouring in the floor slab.

8/20/2019 Asa Tr Ftech
http://slidepdf.com/reader/full/asa-tr-ftech 42/84
Handling and Storage of Soybeans and Soybean Meal
40
f e e d T e c h n o l o g y
Chemical Changes In StorageStored soybeans may undergo physical,physiological and chemical changes even underideal storage conditions. Some of the changesmay or may not have a negative effect on the finaluse of soybeans and soybean meal dependingon the degree of change. One common indicatorof chemical change in stored soybean is the levelof free fatty acid (FFA) present. An increase of FFA above 1% may translate into lower qualityof its oil content. The effect of temperature andmoisture on FFA content in soybeans is shownin Figures 9, 10 and 11. Other important changesinclude decline in soybean seed viability, changein the grain color, increase or decrease in itsmoisture, decomposition of phospholipid, andthe denaturation of it protein. Soybean grain is
more resistant to deterioration during storage thansoybean meal. Full-fat soybean meal deterioratesmore rapidly than defatted meal because of itshigher oil content. The graphs clearly show that high storage temperatures and soybean moisture contents above 10.5%results in increased FFA content of oil above acceptable levels of less than 1%. These findings indicatethe need to keep the temperature and moisture content of stored soybeans as low as possible anduse it before the FFA content in its oil exceeds acceptable levels.
These conditions agree with the storage requirements that limit growth of insects and molds in storedsoybeans (see the mold envelope and seed wet-bulb temperatures in Figure 6). At a moisture levelof 10.5% or less, soybeans can be stored at any ambient temperature without molding problem.
However, insects may still grow and multiply at relative humidities above 60%.
Maintenance Of Quality Once soybeans reach maturity and are harvested, their inherent quality is fixed and can only bemaintained by proper drying, cleaning, and conditioning. Quality maintenance involves variousoperations that will provide environmental conditions that minimize the combined deteriorative effects
Figure 11. The effect of soybean moisture content and time
on the free fatty acid content of oil from soybeans stored at
14.6%.
Figure 10. The effect of time and temperature on the free fatty
acid content of oil from soybeans stored at 21°C.
Figure 9. The effect of time and temperature on the amount
of free fatty acid in the oil of soybeans stored at 37.8°C.

8/20/2019 Asa Tr Ftech
http://slidepdf.com/reader/full/asa-tr-ftech 43/84
Handling and Storage of Soybeans and Soybean Meal
f e
e d T e c h n ol o g y
41
of ambient temperature and moisture on both soybeans and soybean meal. It involves slowing down
undesirable chemical changes from occurring, inhibiting mold and insect activity. The major elementsin achieving this goal consist of a reliable temperature monitoring system, periodic drawing of productsamples and accurately testing them, and having a reliable cooling or aeration system.
Temperature Monitoring The most convenient property of stored grains to measure is temperature. In small farm storage silos,one can use temperature probes to monitor grain temperature and can draw representative samplessimultaneously. However, in large commercial silos, the use of thermocouple wires and multi-pointpotentiometer for remote temperature sensing is standard and essential. Modern grain storage silosare all equipped with temperature monitoringsystem. Without a remote temperature monitoringsystem, a storage manager will have to rely ongrain probes to measure grain temperatures atvarious points. This is a very inefficient andcumbersome system that often discourages manystorage managers from doing it on a regular basis,and stand the risk of incurring economic loss.
Product Sampling, Inspection, And Testing The sy stematic monit or ing of bo th theenvironmental and product condition is anotheressential element in maintaining the quality of stored soybean and soybean meal. This may beaccomplished by regularly taking samples of thestored products and analyzing them in the
laboratory for signs of deterioration. Signs of deterioration include off-odors, moldy condition,heating, discoloration, and presence of live insects.During the sampling operation, one also shouldinspect the storage facilities for signs of moistureaccumulation or roof leaks and other physicaldamages to the storage facilities.
Cooling By Aeration The primary purpose of aeration is to make thetemperature of the grain bulk uniform. Thisprevents moisture migration in the grain mass
due to natural convection currents induced bytemperature gradients. Aeration may also be usedto hold partially dried soybeans for a few daysto prevent spoilage before proper drying. It shouldbe noted that aeration is not intended to dry grainsbut a small degree of drying may occur when theambient air relative humidity is 40% or much lower. Aerating soybeans in silos can be done either bypushing the air (positive pressure) or pulling it(negative pressure) through the grain mass. Eachsystem has its inherent advantages anddisadvantages over the other. For example, apositive pressure system may result in moisturecondensation on the underside surface of the siloroof unless sufficient vents are provided. On theother hand, a negative aeration system may initiallybe pulling hot air from the open space beneatha hot metal roof during the day, thus adding more
Figure 12. Three systems of aerating grains stored in silos,
namely; (a) positive pressure, (b) negative, and (c) negative
pressure, cross-flow system.
Figure 13. A chart used to determine the fan horsepower
required in aerating soybeans at different airflow rates and
grain depths (Source: US Department of Agriculture, 1960).

8/20/2019 Asa Tr Ftech
http://slidepdf.com/reader/full/asa-tr-ftech 44/84
Handling and Storage of Soybeans and Soybean Meal
42
f e e d T e c h n o l o g y
heat to the grain. A compromise method of
aerating soybeans in tall silos would be to use across-flow air distribution system. This systemeliminates the two problems mentioned abovewhile reducing the aeration time and less fanpower requirement. The schematic diagrams inFigure 12 illustrate the three systems of aerationdiscussed above. An effective aeration systemshould be able to cool the bulk grain with minimumamount of airflow at the shortest possible time. This can be achieved by selecting the right kind and size of fan, air distribution system, direction of the air, and airflow rate. The relationship between airflow rate, grain depth, horsepower requirementand air pressure are shown graphically in Figure 13.
For example, soybeans stored at a depth of 12.2 m (40 feet) with an airflow rate of 80 liters/min/m3
(1/10 ft3/min or CFM per bushel) will require a fan horsepower of 0.04 per 35.32 m3 (1,000 bushels)of soybeans at a static pressure of 3 cm (1.1 inches) of water. If the same soybeans are aerated at40 liters/min/m3 (1/20 CFM per bushel), the fan horsepower will be 0.013 per 35.32 m3 (1,000 bushels)at a static pressure of 1.85 cm (0.73 inch) of water. This illustrates that reducing the airflow rate byhalf will result in the reduction of fan horsepower to 1/3 of previous condition.
A general guide in selecting the aeration rate of stored soybeans under warm and temperate climatesis given in Table 4.
Summary The success in the storage and handling of soybeans and soybean meal is dependent upon the
understanding of the combined effects of the three most important factors causing spoilage, namely:1. temperature2. moisture3. time
High ambient temperatures and relative humidities above 65% favor both fungi and insect developmentin stored products. An effective program of monitoring the condition of the stored products andmeans of maintaining uniform product moisture and temperature, such as by aeration, cooling (chilling)or by proper ventilation are indispensable elements in the successful maintenance of the quality of soybean and soybean meal.
It should be remembered that the original quality of the soybeans and soybean meal cannot be
improved upon and that the quality will decline with time. However, deterioration can be reduced toan acceptable level by keeping the products cool and dry during the storage period. This will ensurethe availability of good quality product when needed for processing or marketing.
ReferencesFoster, G. H. and L. E. Holman. Grain breakage caused by commercial handling methods. Marketing
Res. Report No. 968. Agri. Res. Service, USDA.Hall, C. W. 1980. Drying and Storage of Agricultural Crops. The AVI Publishing Company, Inc. Westport,
CT.Kaufmann, H. H. 1976. Commercial storage and handling of soybeans. P 731-733 in: Hill, L. D., ed.
Proc. World Soybean Res. Conf. The Interstate Printers & Publishers, Inc. Danville, Illinois.Marketing Research Report No. 178. 1960. Aeration of Grain in Commercial Storage. U.S.D.A.
McNeal, X. 1966. Conditioning and storage of soybeans. Agri. Expt. Sta. Bul. No. 714University of Arkansas, Fayetville, Arkansas.Milner, M. and W. F. Geddes. 1945. Grain storage studies I. Influence of localized heating of soybeans
on interseed air movements. Cereal Chem. 22(6):477-483. Amer. Asso. of Cereal Chemists.Lancaster, PA.
Nakayama, Y., K. Saio, and M. Kito. 1981. Decomposition of phospholipids in soybeans during
Table 4. Aeration rates for stored grains.
Airflow rate liter/min. /m3
of grain(ft3 /min./bushel of grain)
Type of Storage Northern States Southern States
Flat structure 40 to 80 80 to 160
(1/20 to 1/10) (1/10 to 1/5)
Upright structure 20 to 40 27 to 80
(1/40 to 1/20) (1/30 to 1/10)
Source: USDA, 1960

8/20/2019 Asa Tr Ftech
http://slidepdf.com/reader/full/asa-tr-ftech 45/84
Handling and Storage of Soybeans and Soybean Meal
f e
e d T e c h n ol o g y
43
storage. Cereal Chemistry 58(4):260-264. AACC, Inc.
Nicholson, C. J. and M. E. Whitten. 1980. Transportation and handling factors in relation to qualityin exporting soybeans. Marketing Res. Report No.1109. USDA.Pedersen, R. J., R. B. Mills, G. J. Partida, D. A. Wilbur. 1974.Manual of Grain & Cereal Product Insects
and their Control. Dept. of Grain Science & Industry, Kansas State University, Manhattan, Kansas.Pixton, S.W. and S. Warburton. 1975. The moisture content/equilibrium relative humidity relationship
of soya meal. J. of Stored Products Res. 11(3/4):249-251. Pergamon Press. Great Britain.Saio, K., K. Kobayakawa, and M. Kito. 1982. Protein denaturation during model storage studies of
soybeans and meals. Cereal Chem. 59(5):408-412.Scott, W. O. and S. R. Aldrich. 1970. Modern Soybean Production. S. & A. Publications. Champaign,
Illinois.Sirisingh, S. and M. Kogan. 1982. Insect affecting soybeans in storage. P 77-82 in: Sinclair, J.B. and
J.A. Jackobs, eds. Proc. Soybean Seed Quality and Stand Establishment Conf. Int. SoybeanProgram. Univ. of Illinois, Urbana, Illinois.
Stevens, C.,W. Appel, and J. Zhenyu. 1987. Response of soybean meal flowability to selectedadditives. Kansas Agr.Expt. Sta.Contribution No. 87-72-J. Kansas State U. Manhattan, KS.
Wilson, S. G. and J. M. Desmarchelier. 1993. Aeration according to seed wet-bulb temperature. J.Stored Prod. Res. 30 (1):45-60. Pergamon Press. U.K.

8/20/2019 Asa Tr Ftech
http://slidepdf.com/reader/full/asa-tr-ftech 46/84
44
f e e d T e c h n o l o g y
Grain Storage:
Considerations To Maintain Quality
Mark A. Myers
Brock Manufacturing
USA
Introduction The primary tools used to manage grain in bulk storage are Grain Temperature Detection Systems,and Aeration. A temperature detection system is an electronic reading device that is attached to specialcables, suspended from the roof of the grain storage. A storage structure may have one, or many
cables, depending on the structure diameter. The cables contain temperature sensors at approximatelytwo-meter vertical intervals. Grain temperatures change relatively slowly, and are normally read andrecorded once per week. Variations in grain temperature across the grain mass, or localized risingtemperatures, can be indications of grain spoilage and the need for managers to take action. But sincegrain temperature detection is another complete presentation, we will not focus on it today. Moreimportantly, we will focus on Aeration, the process of making changes within a grain mass.
Grain aeration basic principles are divided into four subjects: 1) What is aeration; 2) Why do youaerate grain; 3) When do you aerate grain; and 4) How do you aerate grain. An understanding of these four principles will significantly improve your ability to successfully store grain for an extendedperiod of time.
What Is Aeration? Aeration is the process of passing large volumes of ambient air through a grain mass, using a fandesigned for that purpose, and an air delivery system. There are many designs on the air deliverysystems. Most are designed into the concrete foundation of a grain storage structure, using a tunneland a steel cover perforated with many small holes. Air is forced into the tunnel, through the perforatedsteel floor, and into the grain. The shape of an aeration system can take many forms, some of whichare illustrated here – a double “H”, a “four ‘F’ system, or two rectangular pads. Aeration fans outsideare connected to the aeration system inside. The type of system is not as important as the skill andexperience of the designer, and the reputation of the manufacturer. Most are designed by the providerof the grain storage system, and meet critical design standards. Each system must be designed toprovide adequate volumes and pressures of air for the quantity and depth of the stored grain. Thesize and type of aeration fan is also critical to successful performance of the system.Why Do You Aerate Grain?
Grain has enemies, including insects, mold and fungi, heat and moisture. Insects eat and breed ingrain, creating damaged grain that will spoil and decay. Mold and fungi create heat and decay. Heatand decay nourish more mold and fungi. Moisture creates spoilage and decay, which creates moreheat, spoilage and decay.
The purpose of aeration is to condition dry grain. It is not for the purpose of drying grain, as airvolumes are too low to dry. Aerated, conditioned grain will decrease mold and fungi growth, decreaseinsect activity, equalize moisture deposits, and equalize heat distribution within the grain mass. Properlymanaged, aeration will improve your chances of successful storage.
Grain quality and condition can never be improved – it can only be maintained. If spoiled grain is
placed in storage, it cannot be retrieved or removed from storage in better condition. It is criticallyimportant that only grain in good condition be placed in storage. With good management, goodquality grain can be retrieved from storage processing and used.
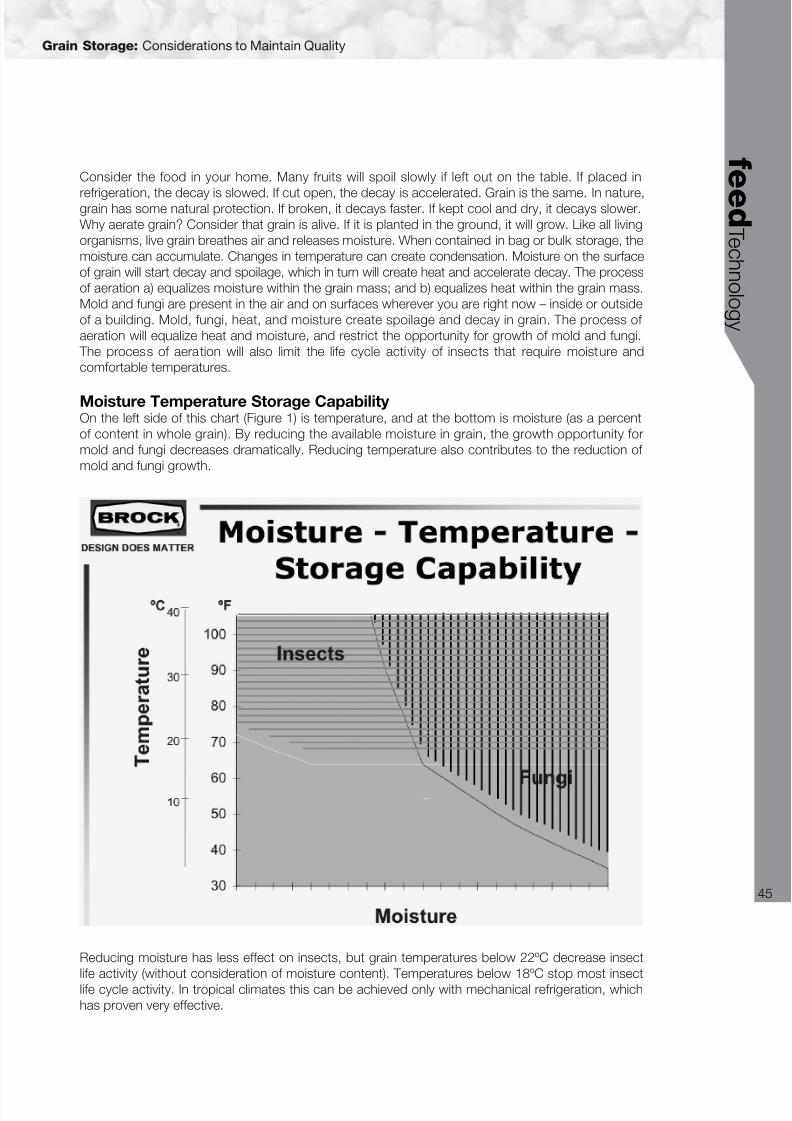
8/20/2019 Asa Tr Ftech
http://slidepdf.com/reader/full/asa-tr-ftech 47/84
Grain Storage: Considerations to Maintain Quality
f e
e d T e c h n ol o g y
45
Consider the food in your home. Many fruits will spoil slowly if left out on the table. If placed in
refrigeration, the decay is slowed. If cut open, the decay is accelerated. Grain is the same. In nature,grain has some natural protection. If broken, it decays faster. If kept cool and dry, it decays slower.Why aerate grain? Consider that grain is alive. If it is planted in the ground, it will grow. Like all livingorganisms, live grain breathes air and releases moisture. When contained in bag or bulk storage, themoisture can accumulate. Changes in temperature can create condensation. Moisture on the surfaceof grain will start decay and spoilage, which in turn will create heat and accelerate decay. The processof aeration a) equalizes moisture within the grain mass; and b) equalizes heat within the grain mass.Mold and fungi are present in the air and on surfaces wherever you are right now – inside or outsideof a building. Mold, fungi, heat, and moisture create spoilage and decay in grain. The process of aeration will equalize heat and moisture, and restrict the opportunity for growth of mold and fungi. The process of aeration will also limit the life cycle activity of insects that require moisture andcomfortable temperatures.
Moisture Temperature Storage Capability On the left side of this chart (Figure 1) is temperature, and at the bottom is moisture (as a percentof content in whole grain). By reducing the available moisture in grain, the growth opportunity formold and fungi decreases dramatically. Reducing temperature also contributes to the reduction of mold and fungi growth.
Reducing moisture has less effect on insects, but grain temperatures below 22ºC decrease insectlife activity (without consideration of moisture content). Temperatures below 18ºC stop most insectlife cycle activity. In tropical climates this can be achieved only with mechanical refrigeration, whichhas proven very effective.

8/20/2019 Asa Tr Ftech
http://slidepdf.com/reader/full/asa-tr-ftech 48/84
Grain Storage: Considerations to Maintain Quality
46
f e e d T e c h n o l o g y
Safe Storage Period (Days – Corn/Maize)
Moisture content and temperature within a stored grain mass have a direct impact upon the numberof days that grain can be stored. The worst-case example on this table, grain with a temperature of 27ºC and 30% moisture content can only be stored for 2.6 days before the grain is spoiled. By reducingthe moisture content to15%, the total number of possible storage days increases to 87 at 27ºC. Atthe same time if the temperature were reduced to16ºC. the available storage days will rise to 250.
The day count begins at the time of harvest – not the day that the grain is placed in storage. Lostavailable storage days can never be recovered. If half of the storage life of grain is lost while the grainis at high temperature or high moisture, those days cannot be restored. Therefore it is important toreduce grain moisture content and temperature as quickly as possible after harvesting.
Safe Storage Period (Days) Temperature & Moisture (Corn)
By examining the safe storage day information in a graph, it becomes apparent how critical thereduction of moisture and temperature become. Notice that grain stored at 13% moisture can bestored in excess of 4000 days at a temperature of 4ºC. On the next slide, we will examine in greaterdetail the Safe Storage Days in the more common range of 16° to 27°C. and moisture content of 13% to 20%.
By reducing the moisture content to 15%, Safe Storage Days increases to between 100 and 250days depending upon the temperature of the grain. Managers must determine how dry the grainshould be, by deciding how long the grain will be stored before use. Remember that the number of days the grain has been stored before you purchase it will affect the total Safe Storage Days.
When To Aerate Grain?Because moisture and heat can accumulate in hot spots within the grain mass, aeration should beinitiated to distribute or remove concentrations of heat and moisture. Accumulations of moisturecannot be detected, but the rise of temperature associated with moisture and spoilage can bedetected with temperature detection systems.
Aeration should be initiated on a regular schedule of preventative maintenance in order to equalizethe moisture and temperature within the grain mass. The temperature of the grain mass should bemaintained equal to the temperature of the outside air. Because temperature differences greater than9ºC between the air and the grain mass can create condensation and moisture in the grain, aerationshould only begin when the difference between the grain and the outside temperature is less than 9ºC. A regular schedule of aeration maintenance will keep the grain close to the average outside temperature.
The aeration objective is to maintain the grain at a uniform temperature of +/- 2 degrees of the average
30-day daily temperature.
Aeration RatesHow much air is needed to aerate grain in storage? The most common measurement of air is incubic-feet-per-minute. Typical ratios of air to grain range between 0.05 to 0.20 cubic-feet-per-minuteper bushel of grain. This would be the equivalent of 0.054 to 0.222 cubic meters of air per minutefor each metric ton of grain. It is most common to design for 0.10 to 0.14 CFM/Bu (0.114 to 0.162m3 /min/ton). If you receive a proposal for an aeration system designed to Imperial measurements,look for air volumes close to 0.10 (1/10) CFM/BU or higher. Each system manufacturer will try todetermine the most efficient system, taking into consideration available equipment, the volume anddepth of the grain, and the most cost efficient system to purchase and operate.
How To Aerate Grain The amount of time required to aeration a grain mass will depend upon the volume of air and thevolume of grain. Given 0.10 (1/10) CFM/Bu of grain, the time required to aerate the grain mass is100 hours. In this time, the temperature of the grain mass will rise or fall to the same temperatureas the outside air.

8/20/2019 Asa Tr Ftech
http://slidepdf.com/reader/full/asa-tr-ftech 49/84
Grain Storage: Considerations to Maintain Quality
f e
e d T e c h n ol o g y
47
If the volume of air is reduced by one-half to 0-.05 (1/20) CFM/Bu., the time required will double to
200 hours. If the ratio of air to grain remains constant, the size of the grain mass is not important –the amount of time is relatively fixed.
Aeration FrontUnderstanding how the air moves through a grain mass is important to understanding how aerationworks. Typically, air is pushed into the bottom of the grain mass, and exits the top of the grain mass. As the air moves, it creates a “front”. Grain temperature below the front is equal to the outside air. The front collects temperature and moisture for transport through the grain mass. When the frontcompletely passes through the grain mass, aeration is complete.
Aeration Problems And Solutions1. Aeration Problems - A common problem that can occur during aeration is a front that stops. If
someone stops the aeration fan midway through the aeration process, the moisture and heat-laden front will stall. When the front stalls, it despots the carried moisture and heat in the grain.When aeration is started the second time, the front will again begin at the bottom of the bin, whilethe heat and moisture deposited above begin to spoil the grain. If the new front does not reachthe old front in time spoilage in the old front will create a crust that prevents the movement of air,preventing any additional aeration. The grain must be removed from the storage structure.
Aeration Solution - After beginning an aeration cycle, do not stop the aeration fan(s) initial theaeration cycle is completed.
2. Aeration Problem - Center Fines or Foreign Material (FM). FM is anything that is not whole grain.FM can be broken grain, other organic parts of the grain plant, or weed seeds. Generally, FM hasless weight than whole grain. While filling the grain storage structure, the FM will fall into the centerof the structure and the heavy good grain will roll or slide to the outside of the structure. The FMin the center of the storage structure can form a column through which air will not pass. Thiscolumn will spoil very quickly, spreading to the good grain. When the storage structure is unloadedthrough the bottom, the column will prevent grain from flowing out.
• Aeration Solution #1 – During and after filling the storage structure, you should remove aportion of the grain. This will extract the center core. The extracted grain can be processedby cleaning, or by grinding immediately for feed.
• Aeration Solution #2 – During filling, you can use a mechanical spreader to distribute the FMin a wider area, preventing the buildup of a center core. The FM will remain in the grain, andcan continue to contribute to premature spoilage of the grain.
• Aeration Solution #3 – Clean the grain before filling the storage structure. This requires amechanical cleaner or mechanical screener that will separate good, whole grain from any formof FM. This is the best solution for long-term storage. Whole grain stores much better thanFM, and permits easier aeration of better quality.
3. Aeration Problem – An obstructed aeration air delivery system will prevent good aeration. Evenwith the fan running, air cannot pass a dirty obstructed tunnel or perforated floor. Vents that areplugged will prevent air from exiting the storage structure, stopping all aeration.
Aeration Solution – Before filling the storage structure, inspect in the tunnels under the aerationfloor for an accumulation of broken, spoiled grains that obstruct air movement in the tunnels. If
necessary, clean and remove all FM. This will also remove insects, insect eggs, and their habitat. Also inspect roof vents for any obstructions, and clean if necessary.
4. Aeration Problem – Over filling the storage structure, and grain too close to the roof or touchingthe roof. When too much grain is put into a storage structure, two problems are created. 1) Not

8/20/2019 Asa Tr Ftech
http://slidepdf.com/reader/full/asa-tr-ftech 50/84
Grain Storage: Considerations to Maintain Quality
48
f e e d T e c h n o l o g y
enough space remains for the movement of air to the exhaust vents during aeration; 2) Grain
comes in contact with the roof, where condensation can occur. Condensed moisture will collectat the edge of the roof, and saturate the outside of the grain mass. Spoilage will occur in this area.
Aeration Solution – Do not overfill the storage structure.
5. Aeration Problems – Examples of aeration problems. This storage structure has been over filled.Grain has blown out of the vent onto the roof of the silo and spoiled; grain remains stuck in thevent and is obstructing airflow; grain has spoiled and stuck to the walls of the storage structure. The spoiled grain will be difficult to remove, and can affect the new grain when the storage structureis filled again.
Aeration Conclusions
a. Grain should be aerated to
i. Maintain uniform temperature in the grain mass.
ii. +/- 2ºC Average Daily Ambient Temperature (day and night).
iii. Regularly – every 30 days recommended.
iv. When the difference between the grain temperature and the outside are do not exceed 9º'bcC.
b. When you start an aeration cycle, do not stop the aeration fans until the aeration front passesentirely through the air mass.
i. You may use the temperature detection system to determine when the aeration cycle iscomplete.
ii. Only if necessary, you can aerate by time if you are confidant that you know the aeration rate(0.10 CFM or 1/10 CFM per bushel) and that your aeration system is performing efficiently.

8/20/2019 Asa Tr Ftech
http://slidepdf.com/reader/full/asa-tr-ftech 51/84
f e
e d T e c h n ol o g y
49
Oilseed Processing
Modernization Opportunities
Dan Anderson
Crown Iron Works Co
USA
This paper focusses on some of the basic and also advanced opportunities available to a typicaloilseed crusher, primarily on a soybean processor, although many of the concepts discussed areapplicable to others in the feed and grains processing industry.
The objectives are to examine some of the cost-reduction opportunities for an existing crushing andrefining operation. As the products of these plants are generally sold in the commodity markets,processing plants are generally price-takers as opposed to a price-setter. It is assumed that anymodern processor will produce a product of nearly identical quality and quantifiable characteristics,which is the nature of a commodity-based operation. Hence, we will focus on primarily on opportunitiesto reduce operational costs, although no discussion would be complete without some emphasis onnew value-added opportunities. In addition, this paper will touch on some new technologies andmarket trends that are either already in place or expected to come into force soon.
Opportunities for Cost ReductionSteam and Process Leaks - as we begin the discussion, we should emphasize the fact that manybasic cost-reduction opportunities can be undertaken with little cost. Steam and process leaks areeasily identified and in most cases corrected with little effort. For example, while I was recently visitinga major Asian processor, the chief engineer was interested in investing in the latest energy efficientmeal desolventizer. This was certainly a good thing and an easily justifiable use of capital. However,when walking through the plant, I noticed several easily correctable problems, including steam leaks,cyclones emitting meal dust, and spilled meal being washed down the drain. Eliminating these losseswould have provided as much savings as investing in new equipment, but correcting these maintenanceproblems was not as fun as considering a new project, so these were neglected. Just a 2 mm steamleak wastes over $1,500 USD per year, and having several of these quickly adds up. Steam trapfailures are not as obvious as a leak, but are just as significant in terms of wasting money.
Boiler Efficiency – broilers deserve special mention as opportunities for cost reduction. If the boileris not operating at least 85% efficiency, a lot of your energy cost is wasted. Recovering heat fromblowdown and deaerators, and maximizing the amount of condensate recovery are a few more ways
to reduce the operating costs. One of the most significant invoices a company receives is the billfrom the electric company, and power factor correction and peak load shedding are ways to maximizeefficiencies. There are other electrical demand isssues to be aware of, such as sizing a motor closerto the actual job demand. As a typical example, a conveyor with a 6 kw actual load may be suppliedwith an 11 kw motor. While there is no doubt the extra reserve power is nice, and may be justifiedin certain cases. However, during normal operations, this motor will now be loaded at about 50%of its rated capacity, resulting in a lowered efficiency and power factor, and will consume substantiallymore electricity than a properly sized motor.
Insulation – this is another quick-payback opportunity that never seems to become a priority. Considerassigning a young engineering intern to identify heat losses and if the maintenance department doesn’thave time, consider selecting an outside contractor to perform the job. Although this does represent
a substantial cash outlay, this is a better option than waiting-payback of insulating of hot equipmentusually pays itself back in a matter of months.
Tight control – tight control over process variables is another opportunity for the commodity processor.Products are generally sold on trading rule guidelines-of moisture, fiber, protein, fat, and other
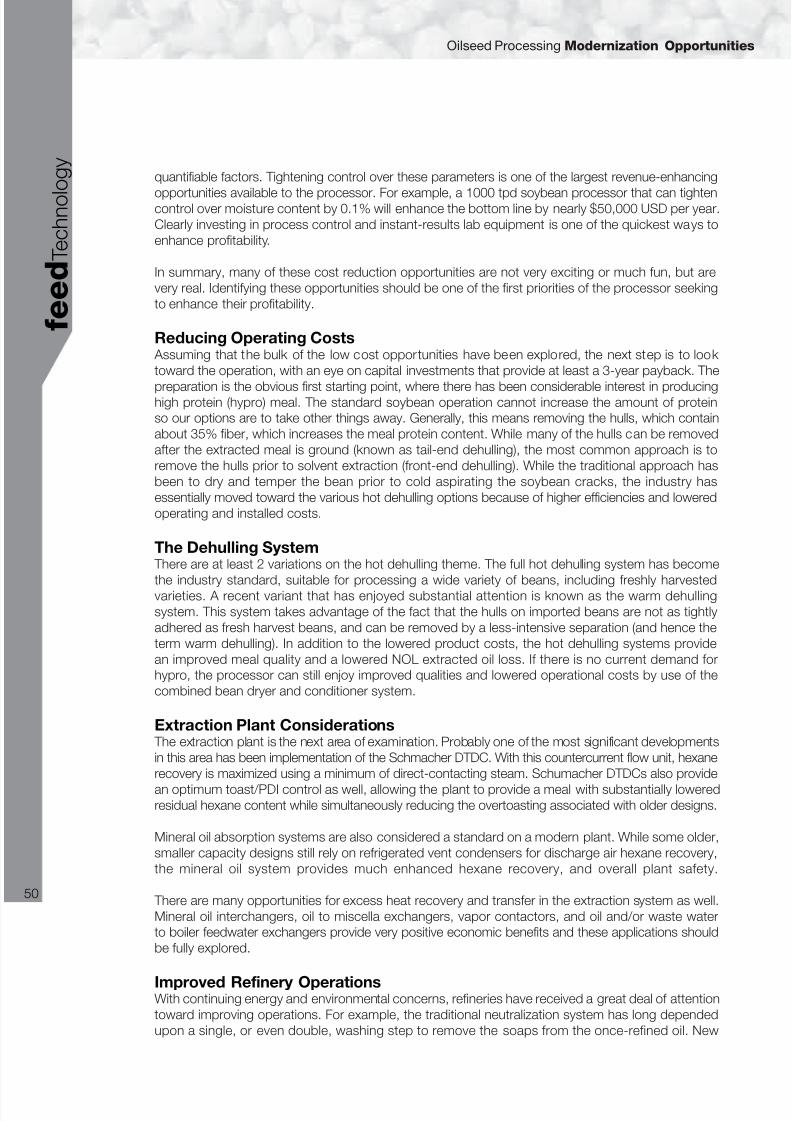
8/20/2019 Asa Tr Ftech
http://slidepdf.com/reader/full/asa-tr-ftech 52/84
Oilseed Processing Modernization Opportunities
50
f e e d T e c h n o l o g y
quantifiable factors. Tightening control over these parameters is one of the largest revenue-enhancing
opportunities available to the processor. For example, a 1000 tpd soybean processor that can tightencontrol over moisture content by 0.1% will enhance the bottom line by nearly $50,000 USD per year.Clearly investing in process control and instant-results lab equipment is one of the quickest ways toenhance profitability.
In summary, many of these cost reduction opportunities are not very exciting or much fun, but arevery real. Identifying these opportunities should be one of the first priorities of the processor seekingto enhance their profitability.
Reducing Operating Costs Assuming that the bulk of the low cost opportunities have been explored, the next step is to look toward the operation, with an eye on capital investments that provide at least a 3-year payback. The
preparation is the obvious first starting point, where there has been considerable interest in producinghigh protein (hypro) meal. The standard soybean operation cannot increase the amount of proteinso our options are to take other things away. Generally, this means removing the hulls, which containabout 35% fiber, which increases the meal protein content. While many of the hulls can be removedafter the extracted meal is ground (known as tail-end dehulling), the most common approach is toremove the hulls prior to solvent extraction (front-end dehulling). While the traditional approach hasbeen to dry and temper the bean prior to cold aspirating the soybean cracks, the industry hasessentially moved toward the various hot dehulling options because of higher efficiencies and loweredoperating and installed costs.
The Dehulling System There are at least 2 variations on the hot dehulling theme. The full hot dehulling system has becomethe industry standard, suitable for processing a wide variety of beans, including freshly harvestedvarieties. A recent variant that has enjoyed substantial attention is known as the warm dehullingsystem. This system takes advantage of the fact that the hulls on imported beans are not as tightlyadhered as fresh harvest beans, and can be removed by a less-intensive separation (and hence theterm warm dehulling). In addition to the lowered product costs, the hot dehulling systems providean improved meal quality and a lowered NOL extracted oil loss. If there is no current demand forhypro, the processor can still enjoy improved qualities and lowered operational costs by use of thecombined bean dryer and conditioner system.
Extraction Plant Considerations The extraction plant is the next area of examination. Probably one of the most significant developmentsin this area has been implementation of the Schmacher DTDC. With this countercurrent flow unit, hexanerecovery is maximized using a minimum of direct-contacting steam. Schumacher DTDCs also provide
an optimum toast/PDI control as well, allowing the plant to provide a meal with substantially loweredresidual hexane content while simultaneously reducing the overtoasting associated with older designs.
Mineral oil absorption systems are also considered a standard on a modern plant. While some older,smaller capacity designs still rely on refrigerated vent condensers for discharge air hexane recovery,the mineral oil system provides much enhanced hexane recovery, and overall plant safety.
There are many opportunities for excess heat recovery and transfer in the extraction system as well.Mineral oil interchangers, oil to miscella exchangers, vapor contactors, and oil and/or waste waterto boiler feedwater exchangers provide very positive economic benefits and these applications shouldbe fully explored.
Improved Refinery OperationsWith continuing energy and environmental concerns, refineries have received a great deal of attentiontoward improving operations. For example, the traditional neutralization system has long dependedupon a single, or even double, washing step to remove the soaps from the once-refined oil. New

8/20/2019 Asa Tr Ftech
http://slidepdf.com/reader/full/asa-tr-ftech 53/84
Oilseed Processing Modernization Opportunities
f e
e d T e c h n ol o g y
51
technology has been introduced to eliminate the washing step eliminating oil loss, capital and operating
costs of the washing system, and the costs associated with wash water treatment and disposal. Thetraditional 2-filter bleaching system has been enhanced by addition of a 3rd, pre-bleaching filter,reducing the amount of clay used (and oil lost) by about 30%. The deodorizer, which is one of themost energy intensive operations of the entire crushing system, has enjoyed enhanced heat recoveryoptions. New generations of vacuum systems, which traditionally require 8 kg of steam for every 1kg of stripping steam are now used extensively to reduce not only energy costs, but also reduce theamount of effluent “dirty” water that the typical refinery must deal with.
Deodorizer SystemOne of the most significant advancements to the deodorizer system has been development of thevarious generations of packed column systems. These units generally consist of a high temperature,low residence time packed column stripping section where the volatiles are flashed in a matter of
seconds followed by a somewhat lowered temperature heat bleaching section to allow for effectiveheat bleaching. This design provides an excellent quality finished product while minimizing utility costsand oil losses. As the high temperature exposure time is limited, packed column units minimize theamount of trans-fatty acids generated during processing. Recent packed column designs are equippedwith a double shell, eliminating air contact and fire concerns.
Packed column strippers also lend themselves well when retrofitting existing tray type deodorizers.In a typical application, a stripping section is added, with the existing tray unit converted to a heatbleacher. In addition to providing a superior quality oil and reduced operating cost, this approach alsoallows for a substantial system capacity increase-often exceeding 50% of the original design.
Recent Technological DevelopmentsNow that we’ve examined some of the “basic” technology improvements that have generally beenwell integrated into many plants, the next step would be to look toward some of the recent developmentsthat early adaptors have integrated into their operations. We begin with the extraction system, where3 relatively new systems have experienced substantial success. The first is the zero effluent discharge,or ZED system. In a typical extraction plant, about 50-100 lpm of high BOD wastewater is dischargedto a waste treatment system. The ZED system eliminates about 90% of this discharge, with theremaining 10% introduced into the meal, providing a closed-loop evaporation/condensing systemfor this otherwise wastewater. In addition to essentially eliminating the water discharge, this systemalso reduces the amount of makeup water that is provided to the plant.
Another innovation is the vapor/solvent interchanger, which replaces the traditional vapor contactor.With this unit, fresh hexane is heated by waste gasses, reducing the load on the solvent/waterseparator tank and providing a more effective manner for maximizing heat recovery. The third
development of great interest is the vapor solvent recovery, or VSR, tray, which is integrated into theDTDC, located immediately under the live steam sparging tray. This system recovers otherwise loststeam vapors and traces of hexane, and can reduce the overall extraction plant steam requirementsby as much as 15%.
Recovery SystemRefineries have also benefited by some new developments as well. One very interesting developinghas been the fatty acid recovery systems developed for seed oils refining operations. During normalprocessing a low value “acid oil” product is produced, which is sold mostly as technical grade fat. This system is capable of separating out and distill ing the high value fatty acids, which typicallyrepresent about half of the acid oil volume, leaving the low value “black oil” available for sale as feedfat. Dual temperature deodorizing systems are also of substantial interest. The distillate generated
as a co-product of deodorizing contains valuable tocopherols and sterols, and rather than producea single relatively low value blended product, these systems are capable of removing the higher valuematerials as a separate product. Bleaching clay oil recovery is another example of new technologyto cure an old problem. Spent clay has been historically treated as a troublesome waste, often

8/20/2019 Asa Tr Ftech
http://slidepdf.com/reader/full/asa-tr-ftech 54/84
Oilseed Processing Modernization Opportunities
52
f e e d T e c h n o l o g y
classified as a hazardous material because of its tendency for spontaneous combustion. By separating
and recovering the neutral oil, the clay can be treated as an inert material, and sometimes reusedfor certain oils.
Value-added AlternativesCompanies such as Crown are continually developing new value-added alternatives, and there areseveral new innovations out on the horizon. Biodiesel is certainly a growth opportunity and is seenas one of the developing markets for soybean and rapeseed oil. However, economics do not favorproduction of biodiesel at this time, and the industry is dependent upon government mandates andsubsidies, which can change at any time. Edible soy products are growing in popularity especiallyin Asia, and the prospects for soy protein concentrate (SPC) and soy protein isolate (SPI) are becomingincreasingly attractive. One exciting development, with the first commercial operating just now beingbuilt in the US, is the use of supercritical fluids (especially carbon dioxide) to extract oil from soybeans.
This technology holds several promises, including an all-natural and efficient extraction process,extremely high quality oil produced, and very limited denaturing of the soybean protein. While theeconomics will probably never allow complete replacement of solvent extraction, this technology willshine for edible and organic soy product markets.
Conclusion The nature of our business is generally that of a price taker, so the goal is to become the most costeffective producer of quality commodity products. To that end, first take a critical look at existingoperations to discover low cost opportunities for reducing costs. The next logical step is to considerthe “basic” plant improvements, such as efficient DTDCs, deodorizers, etc. After these have beenfully considered, investigate the more cutting edge options, such as the VSR tray and fatty acidsystems that early adaptors are currently utilizing. Finally, stay current in the industry as new value-added and evolving technologies are introduced.

8/20/2019 Asa Tr Ftech
http://slidepdf.com/reader/full/asa-tr-ftech 55/84
f e
e d T e c h n ol o g y
53
Step Grinding For Improved Efficiency
Of Grain And Meal Products
Mark Heimann
Roskamp Champion
USA
In many parts of the world attention is being focused again on a concept known as “Step Grinding”.What is “Step Grinding”, why is there such interest returning, and is this a concept that may hold abenefit for you?
Step grinding in the simplest terms, is size reduction accomplished in steps or stages, usuallyincorporating two grinding machines (hammermills, roller mills, pulverizers, or some combinationthereof). The primary objective of step grinding is to reduce the cost to produce a ton of fine groundfinished product. Additional benefits may include improved control of the particle size distribution(more uniform grind with less oversize and fewer fines), reduced product heating and subsequentmoisture loss, a reduction in the maintenance cost per ton of ground material, finer finished products,and greater flexibility in the grinding circuit.
As no ted above, step gr ind ing may beaccomplished in circuits utilizing two machines,though it is certainly possible to “step grind” usinga single machine, or more than two machines.With a single machine, a step grind circuit willeither involve batch processing (grind a batchcoarse, readjust the grinding machine finer andprocess again) or a continuous operation with ascreening stage returning oversize materials forreprocessing (circulation grinding). The potentialbenefits of circulation grinding were explored inthe March 1994 edition of Feed Management inan article authored by William L. Ritchie titledIncreasing the efficiency of particle reduction. Thistype of system does offer the same potential of reducing energy and improving particle size control,but does not significantly add to the flexibility of
the grinding system (Figure 1).
A second approach, and one that is employed in a number of U.S. feed manufacturing plant is theutilization of two grinders in “series”, one performing a pre-break, and the second grinding the totalmixed feed ration. This type of system is commonly referred to as a “post mixer” grinding system,or perhaps just “post grind” system but differs from the European “post grind” concept of batchingdirectly to the grinder.
The advantages of this kind of circuit include lower grinding costs, finer finished products, moreuniform particle sizing, more uniform finished product mix (lower C.V.), and greater grinding systemcapacity. The primary disadvantages of this kind of system are the potential for the destruction of some micro ingredients and vitamins, and the higher capital costs to install the system. In most cases,
the cost of additional capital equipment is offset in 6 to 12 months in the energy savings of the grindingcircuit alone. Additional benefits such as increased (pellet mill) die and roller or (extruder) die life andincreased pelleting or extrusion efficiency are bonuses on top of the energy savings.
This two grinder system may employ two hammermills, one roller mill and one hammermill, or tworoller mills. Additionally, sieving between breaks may be added to further enhance the energy efficiency
Figure 1. Circulation Grinding System.
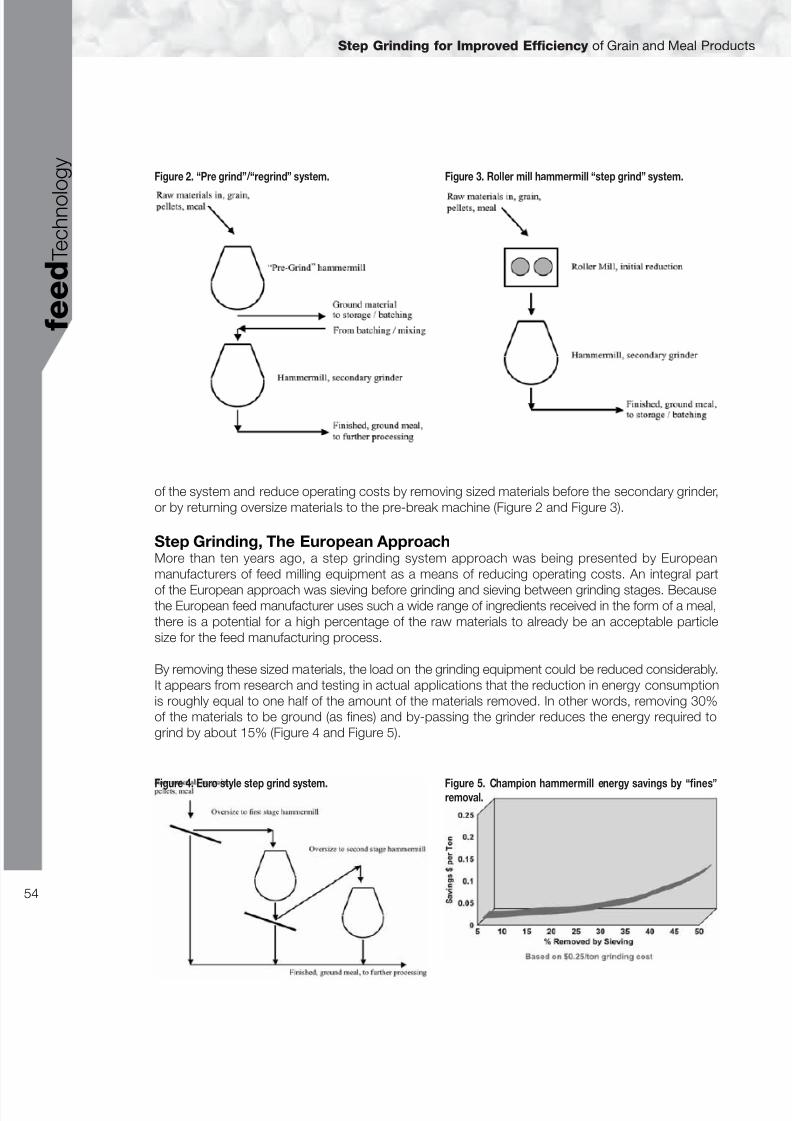
8/20/2019 Asa Tr Ftech
http://slidepdf.com/reader/full/asa-tr-ftech 56/84
Step Grinding for Improved Efficiency of Grain and Meal Products
54
f e e d T e c h n o l o g y
of the system and reduce operating costs by removing sized materials before the secondary grinder,or by returning oversize materials to the pre-break machine (Figure 2 and Figure 3).
Step Grinding, The European ApproachMore than ten years ago, a step grinding system approach was being presented by Europeanmanufacturers of feed milling equipment as a means of reducing operating costs. An integral part
of the European approach was sieving before grinding and sieving between grinding stages. Becausethe European feed manufacturer uses such a wide range of ingredients received in the form of a meal,there is a potential for a high percentage of the raw materials to already be an acceptable particlesize for the feed manufacturing process.
By removing these sized materials, the load on the grinding equipment could be reduced considerably.It appears from research and testing in actual applications that the reduction in energy consumptionis roughly equal to one half of the amount of the materials removed. In other words, removing 30%of the materials to be ground (as fines) and by-passing the grinder reduces the energy required togrind by about 15% (Figure 4 and Figure 5).
Figure 2. “Pre grind” / “regrind” system. Figure 3. Roller mill hammermill “step grind” system.
Figure 4. Euro style step grind system. Figure 5. Champion hammermill energy savings by“fines
”
removal.

8/20/2019 Asa Tr Ftech
http://slidepdf.com/reader/full/asa-tr-ftech 57/84
Step Grind For Efficiency in the U.S.
Since corn, wheat, sorghum and barley are the basis for most complete feeds in the U.S., the primaryeconomic benefit of step grinding is an actual reduction in the specific energy required to grind feedmaterials rather than efficiency gains from sifting. As a rule of thumb for a two shift operation, onehorsepower costs approximately $1.00 per day. An energy reduction of 50 horsepower will saveabout $50.00 per day in energy expenditures. Where does this savings come from? Power consumptioncan be expressed in terms of work accomplished over time.
WORK POWER =
TIME
The step grind approach yields this energy reduction (less power required) since the materials are
reduced more gradually, through a slightly longer period of time. By doing the same amount of work (grinding) over a longer period of time (two or three gradual reductions instead of one instantaneousreduction) the total power requirement is reduced.
Because the roller mill offers such significant energy savings over a hammermill when processinggrain in the coarser particle size ranges, the use of the roller mill as a pre-break device can offersubstantial savings in a typical grain grinding circuit. By substituting a single pair roller mill in placeof the conventional hammermill rotary feeder, the feed rate can be accurately controlled and asignificant increase in hammermill capacity can be realized. Because the materials are reduced insize prior to being introduced to the hammermill grinder, larger screens may be employed with nosignificant increase in finished particle sizing.
This combination of finer feed, increased hammermill efficiency, and the possible use of larger screensnot only reduces the energy cost when grinding, but reduces other operating costs (maintenance,parts) as well. Since a rotary feeder is not required the cost of a roller mill for use as a feeder issubstantially offset in new installations. In other cases where existing hammermills require a boostin capacity, the application of a roller mill as a feeder can boost hammermill capacity by as much as40 to 50% with no loss in the fineness of the grind.
Equipment/System Screen Size Particle Size Efficiency* Capacity
Hammermill 3 Mm 650 Microns 5.8 – 5.1 13.5 Mth
Roller Mill/ Na 3000 Microns Rm – 0.55
Hammermill 4 Mm 650 Microns Hm – 2.7 20 Mth
In this example, the potential capacity increase is roughly 46% by utilizing a roller mill as a pre-break/feeder
* Efficiency expressed in terms of kWh/T (kWh per Ton)
f e
e d T e c h n ol o g y
55
Step Grinding for Improved Efficiency of Grain and Meal Products

8/20/2019 Asa Tr Ftech
http://slidepdf.com/reader/full/asa-tr-ftech 58/84
56
f e e d T e c h n o l o g y
A Perspective On Mixing And Mix Uniformity
Keith C. Behnke
Kansas State University
USA
The basic premise used by all nutr itionists when formulating rations is that each aliquot (mouthful)of the diet is balanced with respect to the known nutrient requirement of the target animal. The dietmust contain the necessary nutrients to support maintenance, growth, production, and health. Feedadditives should be present to provide the appropriate level of protection from disease and othermaladies. In all cases, the levels must be controlled so as to be neither deficient nor toxic. The questionthat must be addressed is how well do current feed manufacturing techniques provide that level of
nutrient uniformity assumed by the nutritionist?
The basic objective of any feed mixing operation is to obtain a uniform, random mixture of the solidand liquid ingredients in the formula. The equipment used is, at least in theory, designed to accomplishthat objective without nutrient destruction in a minimum amount of time. A uniform random mixturecan only be obtained if there is no favored direction of movement by individual particles and if thereare no selective forces (i.e. centrifugal forces) that come into play. In bulk solids mixing, it is logicalthat motion must be introduced so that particles are displaced relative to one another. That is acomplex way of saying that if solids are layered one on top of another and no motion takes place,mixing will not occur. However, if the container is rolled, shaken, or vibrated, particle displacementwill occur and random uniformity will eventually be obtained.
There are obviously many factors that influence mixing and feed uniformity. They can be divided intoingredient characteristics and machine characteristics. For the time being, only bulk solids will bediscussed – liquids present special circumstances. The purpose of this paper is to provide a discussionof the current situation and provide guidance as to how feed uniformity can be measured.
Current SituationMixing is one of the most important operations in the process of feed manufacturing, yet it is frequentlygiven little or no consideration. The objective in mixing is to create a completely homogeneous blend.In other words, every sample taken should be identical in nutrient (attribute) content to any othersample. Needless to say we seldom achieve that goal, however, we do try to manufacture feed thatis as uniform as possible.
Too many times too little emphasis is placed on the mixer we use. When we manufacture a feed, weformulate the diet to provide certain nutrients; in fact, we guarantee that many or all of these nutrientsare there in the amounts specified. Many thousands of dollars are spent to gather, process, and storeingredients in semi- or fully-automated proportioning systems to feed exact amounts of ingredientsto the scale. Yet, if these varied ingredients are not properly mixed, the quality control system priorto that point will lose a great deal of effectiveness.
Value Of Feed Uniformity Intuitively, the concept of feed uniformity is important and people associated with livestock productionrealize that if feed ingredients, particularly micro-ingredients such as vitamins, amino acids, traceelements, and drugs, are not properly blended, animal performance will be reduced. Conversely, itis possible to create a toxic situation if some ingredients are not properly incorporated. A recentexperience involving urea toxicity comes to mind in which 24 of 25 cattle died because urea segregated
from an otherwise safe feed. Most feed additives will fail to provide protection if not properly blendedin the feed. Logically, the value of uniformity is greater for the very young animal and animals with ashort digestive tract versus older animals that consume large meals less often.

8/20/2019 Asa Tr Ftech
http://slidepdf.com/reader/full/asa-tr-ftech 59/84
For example, a day-old chick has depleted essentially all nutrient reserves prior to hatching. During
his first day on feed, he will consume about ten (10) grams of feed. It is critical that all required nutrientsbe in that first day’s ration. As an interesting exercise, one can calculate how many 10 gram aliquotsare in a three ton batch of starter feed and then contemplate the probability of each being preciselyright. Conversely feed uniformity is not likely to be as critical to a finishing steer that is consuming12 Kg of feed and has a 24 to 48 hour retention time in his GI tract.
Regardless of the target animal, good manufacturing practices dictate that we strive to produce asuniform of feed as is possible. To that end, equipment should be selected based upon knowncompatibility. Operational protocols should be set to insure that maximum uniformity is obtained.Personnel should be trained and educated on the concept of uniformity and appropriate testingshould be conducted to ensure that uniformity objectives are met.
Equipment Properties The range of equipment used to mix feed is at least as diverse as the ingredients. There have beenmany attempts to reduce mixing concepts to a series of engineering equations thus facilitatingequipment design from a theoretical approach. The fact is most contemporary mixing equipment,including horizontal ribbon mixers, vertical screw mixers, and drum mixers, have simply evolved fromhistorically successful designs without benefit of mixing theory input. For example, most horizontalmixers have a length approximately three times their diameter and have a rotational speed of 75-100meters/minute regardless of the diameter. The inside ribbon is usually 2.5 times the thickness of theoutside ribbon to balance the directional forces applied due to ribbon diameter.
Given this discussion, it is easy to appreciate the complexity of the mixing operation in a productionfacility. Yet, this seems to be an area of little concern to most feed manufacturers – commercial orprivate. As regulatory pressures for additive uniformity increases and as the need for providing uniform
nutrient density to genetically superior livestock becomes necessary, it will be in the best interest of feed manufacturers to ensure uniformity through testing.
Current and Future Aspects To focus on the regulatory aspect of uniformity, the following excerpt is taken from the 1990 FDA Regulatory Guidelines (FDA, 1990):
Equipment (225.30) – All equipment used in the manufacture of medicated feed shall have thecapacity and capability to produce a homogeneous medicated feed of the intended potency. Thecapability of the mixing equipment should be demonstrated upon installation and periodically asneeded to ensure proper adjustments during operation. Written documentation of the adequacyof the equipment should be available for FDA review.
In January of 1990, the Degussa Corporation introduced a program to monitor uniformity of feedsmanufactured by customers using their amino acid and other products (Wicker and Poole, 1991). Their results would indicate that only about half of the feeds tested would be of satisfactory uniformity(C.V. < 10%). About 30% had a C.V. of 10-20% and the remaining 20% of the feed samples had aC.V. of > 30%. It is not known precisely at what level of uniformity animal performance will be affected,but one can certainly assume that at a C.V. of greater than 20%, performance would be decreased.
The samples tested in this study were generally from large, centrally controlled feed mills. To gain aperspective on how well on-farm feed manufacturers do, Stark et al. (1991) conducted a study similarto that of Wicker and Poole except using salt as the tracer rather than synthetic amino acids. Theresults tended to parallel the Degussa report with about 42% of the samples having a C.V. of < 10%,
46% between a C.V. of 10% and 20%, and 12% having a C.V. of > 20%.
It is apparent that, at least in a significant portion of feed produced, nutrient uniformity criteria is notbeing met. As regulatory authorities move toward required equipment validation, it is imperative thatthe feed and livestock industries come to agreement as to what levels of nutrient uniformity is needed
A Perspective On Mixing And Mix Uniformity
f e
e d T e c h n ol o g y
57

8/20/2019 Asa Tr Ftech
http://slidepdf.com/reader/full/asa-tr-ftech 60/84
A Perspective On Mixing And Mix Uniformity
58
f e e d T e c h n o l o g y
and how that uniformity is to be measured. There currently exists a standard (ASAE Standards, 1990)
for testing solids-mixing equipment for animal feeds; however, the procedure is complicated and agreat deal of the data required is meaningless to either regulators or animal performance.
Mixer Testing The objectives of mixer testing can be many. The most common reason for testing a mixer is todetermine the mixing time at which an adequate or satisfactory blend is obtained. The proceduresare relatively simple and involve taking samples at specific time intervals. The assay used and statisticaltreatment is relatively straightforward.
Result Interpretation And Statistical Evaluation Of Mixing Tests The standard deviation and coefficient of variation can be used to measure the results of a mixingtest. In very simple terms, they help measure the distribution of values and express the value as one
number. In order to interpret the results of a test, the variation of the procedure itself should be known.For instance, the coefficient of variation of the Quantab7 method is about 10%; therefore, if the resultof the mixer analysis is 10% or less, we assume that a Agood@ mix has been achieved. The samesituation applies for other procedures.
One can also use these procedures to isolate points of segregation in the feed mill. If one has a C.V.of 8% at the mixer and a C.V. of 18% after a transfer conveyor, there is a problem between the mixerand that point.
Assay SelectionNumerous assay methods have been used for mixer evaluation. One criteria for selection should beto assay for an ingredient, nutrient, or chemical that comes from a single source. Salt, therefore, is
a good selection while protein or nitrogen would be a poor selection.
Sampling is also very important to any mixer evaluation. At least 10 samples should be taken, eitherfrom several locations in the mixer or at timed intervals during the mixer discharge. Enough of eachsample should be taken each time (approximately 2 lb) to allow for a good test sample. In order to helpclarify the requirements for a test procedure to be used for uniformity, the following criteria are offered:
1. The assay principle should be based upon a common ingredient or nutrient that is usually in theformula or can be added without risk.
2. The cost for each assay should be minimal (< $2.00 each).3. The assay procedure should be simple, fast, accurate, precise, and able to be done on-site.4. The assay should present no safety hazard to personnel or animals.5. The assay principle should be supplied from a single source.
6. Sample size required should be reasonable but large enough to reduce or eliminate sampling error.7. The target mix uniformity (C.V.) should be approximately two (2) times the proven analytical variation
for the assay selected but in no case exceed 10%.8. The statistical procedures required should be easily understood and performed.
As the reader can imagine, there is no "perfect" procedure available.
Mixing Equipment There are three basic types of mixers used in the feed blending operation: horizontal batch, verticalbatch, and continuous. The horizontal batch mixer is by far the most common piece of blendingequipment used. The vertical screw mixer is sometimes found in smaller feed mills and is quitefrequently used on farms. They are generally slower than a comparably sized horizontal blender.
The continuous blenders vary widely in design and capacity. They are often used to blend liquids intoa base mix as well as in the steam conditioning of a pellet mash. Additionally, the continuous mixersare found in plants where continuous rather than batch proportioning is used to arrive at a finalhomogeneous blend of ingredients.

8/20/2019 Asa Tr Ftech
http://slidepdf.com/reader/full/asa-tr-ftech 61/84
A Perspective On Mixing And Mix Uniformity
f e
e d T e c h n ol o g y
59
Horizontal Batch Mixer
This blender is generally equipped with right and left hand ribbon flights which convey material from oneend to the other while it is tumbling in the mixer. Other designs include batch paddle mixers in which plowsor paddles replace the ribbons. By using paddles, an even higher percentage of liquids may be addedat the mixer. The plows are adjustable so that pitch can be set to obtain the desired blending operation.
Horizontal mixers are frequently equipped with multiple discharge openings or with a bottom, whichopens along the entire length to facilitate rapid and complete cleanout. They may also be equippedwith a surge bin beneath the mixer to reduce emptying and cycle time.
The major advantages of the horizontal mixer over the vertical mixer are the shorter mixing time andthe fact that higher percentages of liquid may be added to the blend.
Short-Cycle Mixer The current generation of mixers are often referred to as Ashort-cycle@ mixers because they are soeffective at mixing that a 1.0 minute mixing cycle or less can be obtained. These mixers generallyhave twin mixing rotors or twin shafts with paddles. Studies conducted at Kansas State on such amixer (Forberg) found that a simple ration had a CV of less than 5% after only 15 seconds of mixtime. A more complex formula with up to 5% liquid addition will mix in less than one minute.
If a short cycle mixer is to be retrofitted into an existing feed mill, caution should be taken to ensurethat the batching system is capable of a cycle time less than the anticipated mixing cycle.
These mixers are more expensive than the more typical ribbon mixers but have attributes that areattractive in many situations.
Problem Ingredients The physical properties of ingredients can affect mixing. If all of the physical properties are relativelythe same, then mixing becomes fairly simple. As the physical characteristics of ingredients begin tovary widely, blending and segregation problems are compounded. Some of these factors are:1. Particle size2. Particle shape3. Density, or specific weight4. Hygroscopicity5. Static charge6. Adhesiveness
Of those listed, particle size, shape, and density are the most important. Large and small particles
do not mix well. They will mix better if there are particles of varying size in between. High densityparticles, such as minerals, tend to segregate and go to the bottom of the bin. An illustration wouldbe the blending of cracked corn and fine mixing salt. The corn may have a particle size of 1200-1500microns (m) and a density of 1.35 g/cc while the salt might have a particle size in the range of 200m with a density of 2.6 g/cc. While it is not altogether impossible to obtain and maintain a satisfactoryblend of these two ingredients, it is difficult.
Hygroscopicity refers to the ability to attract or take-up water. A very hygroscopic material, such asurea, may absorb enough water from the atmosphere to cause caking. Some ingredients, particularlyvitamins and drugs, may possess a large static charge making them tend to stick to bin walls andsides of mixers. As the number of ingredients and variations increases, a greater appreciation of thecomplexity of the mixing operation is formed.
One of the places we can control ingredient variation is ahead of the mixing operation. Are the grinders,either roller mill or hammermill, producing the desired particle sizes? Is the particle size from thegrinders ever measured? We may also need to measure the particle size of ingredients that arenormally utilized as received. In some cases they may be contributing to poor mixing.
8/20/2019 Asa Tr Ftech
http://slidepdf.com/reader/full/asa-tr-ftech 62/84
A Perspective On Mixing And Mix Uniformity
60
f e e d T e c h n o l o g y
Discharge And Cleanout Of Mixers
There are obvious advantages to the drop-bottom type horizontal mixer in terms of discharge andcleanout. Discharge is nearly instantaneous with the lighter material being discharged within twoseconds of the heavier material. There is essentially no carryover from one batch to the next, especiallyif equipped with air sweep systems.
Liquid Addition The incorporation of fats, oils, molasses, and other liquids into the vertical mixer is being done today.Many fats and oils are hand-dumped along with the feed ingredients into the dump-in hopper at thebase of these mixers. A better way to introduce fats and oils would be through a spray bar installedin the top of the mixer and the liquid metered thereto. The mixes incorporating liquids should bemixed longer than the dry feeds to ensure uniformity and to break up fat or molasses balls that form. To facilitate better mixing and breaking up, a high speed paddle type mixer can be installed in one
of the discharge parts and the feed re-elevated to the top of the mixer.
The incorporation of molasses into a vertical mixer is not recommended above 3% if only one mixeris used for all feeds. Even this percentage will require more cleanup maintenance. This requires theinstallation of access panels in the tub and into the elevating tube to permit cleaning. Molasses buildsup on the interior of the tub as well as on the mixing flights and will seriously reduce mixer efficiency.If not kept clean, rejections by the state feed inspection authorities and customer complaints willoccur. Teflon lining of the tub and stainless steel screws will reduce maintenance when molasses isbeing added to the feed mix.
When higher percentages of molasses (3-8%) are going to be mixed continuously in a mixer, thentwo mixers should be used; one for feed requiring molasses addition and the other for dry feeds.
Liquid addition is best accomplished at the custom mix plant by working on the batch principle.Metering devices can be preset for automatically delivering exact quantities to the mix. The mixersshould then operate long enough to properly incorporate or blend the total batch. Attempts to usea continuous, auxiliary mixer for molasses while discharging from the batch mixer can result inheadaches. This procedure must be planned very carefully for good results and conditions must beideal. Getting those conditions ideal is difficult and, for a quantity of molasses (ordered by a customer),the feed man may experience variations in the percentages of molasses applied to the feed as wellas a shortage of molasses at the beginning and at the end of the run. If his customers are in the habitof specifying a certain amount, then the feed man should be aware of the continuous system or hemay lose customers or give molasses away, thus cutting into his operating profits.
Liquids can be handled equally well in drop-bottom or nondrop-bottom horizontal mixers. About 10%
of added liquids are normally considered in the top range of practical use. More than this amount beginsto add problems in other areas such as your materials handling equipment. Adding liquids at the batchmixer is a common practice in many feed manufacturing operations. Adding liquids at this point canadd to the contamination problem whether they be a drop-bottom or standard discharge type mixer. The addition of liquids (other than molasses) slightly increases horsepower requirements. Regulatoryrequirements may create a new concept in importance of where and when to add liquids. Whereconflicting drug additives follow each other in mixing sequences, contamination is a major problem.
ComplianceFeed manufacturers should not have difficulty meeting requirements established by the regulatoryagencies if they adhere to rigid cleaning and operational procedures. When micro-ingredients andpremixes are being added, dust collection systems or other air suction systems should be carefully
balanced such that a minimum of air is drawn from the mixer. Fortunately, regulations have, in thepast, provided a broad range of concentrations in between which the feed manufacturer may operate.However, in light of today’s improved detection techniques and consumer concern and awarenessof potentially harmful drug residue problems, such allowable variations are being reduced. Most feedproducers will not be satisfied with producing a feed having as broad a range as was once permitted.

8/20/2019 Asa Tr Ftech
http://slidepdf.com/reader/full/asa-tr-ftech 63/84
A Perspective On Mixing And Mix Uniformity
f e
e d T e c h n ol o g y
61
The mixer should, of course, have good mixing efficiency, and allowing for sufficient time to thoroughly
blend the feed is an absolute MUST.
When using antibiotics and other micro-ingredients in mixes which are prepared intermittently forpoultry, swine, sheep, and cattle, the manufacturer should be sure:
1. That the mixer internals are clean and that it is cleaned out thoroughly between the mixing of thedifferent rations. This means stopping the mixer and removing excess materials in filler tubes andcut-in hoppers.
2. That the mixer is grounded to bleed off static electricity.3. That regulatory requirements are followed for:
a. Cleanout of accessory equipmentb. Labelingc. Recheck of ingredient weight and inclusiond. Sampling, etc
Operational Comparison Of Standard Horizontal Batch Mixers And Drop-
Bottom Horizontal Batch MixersOperational procedures of the drop-bottom unit is very much like the operation of a normal singleor multiple discharge mixer, but it has an added advantage in that it discharges most rapidly; as fastas ten seconds for opening, discharging, and closing of doors. The mixer is completely emptied andclean with very little possibility of contamination. This rapid discharge feature reduces the total mixingcycle time, and, since the feed mill capacity is based largely on mixing capacity, can possibly increaseplant capacity through savings in discharge time.
Sequence Of Ingredient Addition To Drop-bottom MixersWe know that there is a decided advantage in following a particular sequence when chargingingredients into the mixer. With the drop-bottom feature you do not have discharge pockets that canpossibly catch a few pounds of the first ingredient that is put into the mixer and hold it unmixed. There are no pockets, but a smoothly contoured bottom formed to the contour of the ribbon itself. This further reduces the possibility of segregation and “dead spots”.
Cleaning And Maintenance RequirementsPeriodic cleaning of the drop-bottom mixer is no more difficult than the normal periodic cleaning of a standard single or multiple discharge mixer. This can be accomplished through the top or by installingaccess panels in the side of the catch hopper below the mixer and cleaning it from the bottom withthe doors swinging open. Normal cleaning of this unit in dry feed mixing consists of removal of stringsthat might catch on the ribbon assembly. The only other additional maintenance that would be requiredwould be on the air cylinders themselves and, with proper installation of air supplies with traps andfilters, this should be no problem at all.
Noncontamination Feature The self-cleaning non-contamination feature is a basic point in favor of this particular type of unit. The possibility of contamination must always be considered when using drugs, and we know thereare many places in the feed plant where contamination can occur. By eliminating the problem here,one contamination worry is removed.
I might mention, going a bit further, that if you are using bucket elevators to elevate your mixed feed,you can eliminate another source of contamination by equipping your elevator legs with automaticboot cleanout units. These, too, can be integrated into your semi- or fully- automatic batching system
to cycle between each batch if desired. Another way to reduce contamination is to use a gravity flowsystem wherever possible.

8/20/2019 Asa Tr Ftech
http://slidepdf.com/reader/full/asa-tr-ftech 64/84
A Perspective On Mixing And Mix Uniformity
62
f e e d T e c h n o l o g y
With today’s high energy specialized feeds, with the necessity for feed mill efficiency, and with
contamination being the problem it is, we feel that the drop-bottom mixer will prove more and moreimportant in modern feed manufacturing operations.
Summary Nutrient uniformity is the common objective of every feed manufacturer. A great deal of emphasis isplaced on uniformity because of regulatory compliance, animal performance, and the satisfactionobtained in producing quality feeds. It is surprising how few mixers are actually tested in any manner,let alone on a routine basis. It is hoped that mixer testing will become more commonplace and willbe a part of the quality control procedures of every feed producer.
Further research is needed in the design of mixing equipment and additional animal experiments thatwill result in a better understanding of the value of uniformity and the cost of non-uniformity in livestock
production.
References AAFCO,2004. Analytical Variation (AV) Based on AAFCO Chick Sample Program. Assoc. of Am. Feed
Control Officials, Barbara Simms, Treasurer, Texas A.M. Univ., College Station, TX. ASAE, 1990. Test Procedure for Solids-Mixing Equipment. Standard ASAE S303.2 American Soc.
of Agric. Engineers, St. Joseph, MI.FDA, 1990. Compliance Program Guidance Manual--Medicated Feeds Program No. 7371004.
FDA/CVM, Rockville, MD.Stark, C.R., K.C. Behnke, R.D. Goodband, and J.A. Hansen, 1991. On-Farm Feed Uniformity Survey.
Swine Day Report of Progress No. 641, AES, Kansas State University, Manhattan, KS.Wicker, D.L. and D.R. Poole, 1991. How is Your Mixer Performing? Feed Management, 42(9):40, 43.

8/20/2019 Asa Tr Ftech
http://slidepdf.com/reader/full/asa-tr-ftech 65/84
f e
e d T e c h n ol o g y
63
Ensuring Optimum Mixability
In Feed Manufacturing
Chin Sou Fei
Novus International Pte Ltd
Singapore
Introduction The daily ration of nutrients that an animal receives from a feed may vary from time to time due to anumber of reasons. The sources of variation will probably cause variation in the day-to-day level of nutrition received by an individual animal. Certain nutrients are guaranteed to be present at minimum
levels and regulatory officials will be concerned, if guarantees are not met. Certain ingredients maybe toxic at very high levels. The nutrient variation in feeds is most likely to occur for the followingreasons (Wilcox and Balding, 1976):
a. Variation in the composition or quality of ingredients from batch to batch or from time to timeb. Poor mixing or segregation after mixingc. Errors during weighing or proportioning
In most cases, a sound quality control program can insure optimum feed preparation. Routineinspection of the mixer, proper mixer “tuning”, maintenance of all liquid systems and close attentionto ingredient inventories will go a long way to ensure that the nutrient specifications prescribed bythe nutritionist, actually reach the bird.
The consequences of nutrient level variation are varied. However, the major disadvantage of variationis normally the effect on animal performance.
Mixing is one of the most essential and critical operations in the process of feed manufacturing, yetit is frequently given little consideration. The objective in mixing is to create a completely homogeneousblend. In other words, every sample taken should be identical in nutrient content. A functional definitionof uniform mixing can be summarized in one sentence. “All nutrients will be present in sufficientquantity in the daily feed intake of the target animal to meet its minimum growth requirements’’.
The literature is filled with classic examples of the impact of inadequate vitamin and mineral consumptionon animal performance. However, field examples are rarely “classic” in nature, and are therefore, verydifficult to diagnose. Unfortunately, in most cases the effect of inadequately/ improperly mixed feed
manifests itself as marginally depressed performance. Typically, birds exhibit slight reductions ingrowth, feed conversion, feathering and other performance parameters. As a result, the technicalstaff of a commercial company may incorrectly diagnose a decease condition, and never resolve theunderlying problem in the mill.
Effect Of Mixing Uniformity On
Animals PerformanceUneven ingredient dispersion feeds may lead toreduced bird performance. In order for birds toreach their genetic potential for growth and meatyield, levels of protein, energy vitamins and mineralsmust be provided in their proper ratio. Duncan
(1989) reported that as protein variation increasedin feeds, growth rate and feed conversion were depressed (Table 1). A 10% variation in the feed qualitysignificantly reduced both weight gain and increased feed conversion. When the coefficient of variation(CV) of the feed was increased to 20%, another significant increase was observed in feed/gain (F/G).
Table 1. Chick response to dietary protein variation from 0 to
28 days of age 1, 2
Treatment Gain (gm) F/G
Control 773a 1.74a
10 % CV 716a 1.82b
20% CV 703b 1.86c
1 Duncan (1989) 2 Adjacent means within a row with no common superscript differ significantly (P<.05)

8/20/2019 Asa Tr Ftech
http://slidepdf.com/reader/full/asa-tr-ftech 66/84
Ensuring Optimum Mixability In Feed Manufacturing
64
f e e d T e c h n o l o g y
A recent study on the effect of mixing uniformity
on day one old broilers was conducted by McCoyet al. (1994). Feed was formulated to meet orexceed NRC requirements for all nutrients forbroiler chicks from 0 to 3 week of age. However,in experiment 2, feeds were formulated to 80%of NRC recommendations for crude protein (CP),lysine, methionine, Ca, and P. The purpose of using deficient diet in this study was to accentuateany difference in growth performance that mightresult from diet nonuniformity.
In experiment 1, feeds were collected from mixerafter 20, 40 and 80 revolutions of mixing (20 =highly non-uniformity mixing, 40 = moderate non-uniformity mixing and 80 = uniform mixing). Variability of feed decreased sharply between 20and 40 revolutions and no further reductionoccured between 40 and 80 revolutions (Table2). The CV values from analyses of saltconcentrations were 43, 11 and 13% for 20, 40and 80 revolutions, respectively. No differenceoccured among treatment for average daily gain(ADG), average daily feed intake (ADFI), bonestrength, bone ash, carcass crude protein, carcassfat, or carcass ash. However, there was a trend
for a linear increase in gain:feed (G/F) ratio whenmixer revolutions were increased.
In experiment 2, feeds were collected after 5, 20,and 80 revolutions. The salt test CV % decreasedfrom 40.5% to 12.1% when mixing was increasedfrom 5 to 20 revolutions, but there was no furtherreduction of CV % from 20 to 80 revolutions (Table3). ADG, ADFI and G/F improved when CV %decreased from 40.5 to 12.1%. However, mortalitywas not affected by treatment.
The effect of poorly mixed feed on pig performanceswas reported by Traylor at el. (1994). In thisexperiment the effect of mix time on diet uniformityand growth performance was evaluated in nurseryand finishing pigs on a double-ribbon mixer.
For the nursery experiment, increasing mix timefrom 0 to 0.5 min decreased the CV % from 106.5to 28.4% (Table 4). Increasing mix time to 4 minreduced CV value to 12.3%. ADG, F/G and ADFIwas increased by 49, 19 and 20 %, respectivelyas the CV for marker concentration decreased
from 106.5 to 12.3%.
For the finishing experiment, increasing mix timereduced the CV for diet uniformity from 54 to lessthan 10 % (Table 5). The mix time had no statistically
Table 2. Effect of mixing time on diet uniformity and
performance, carcass composition, and bone measurementsin broiler chicks, experiment 1 1,2
RevolutionsItem 20 40 80 SESalt CV, % 43.0a 10.8b 13.1b 3.7Red particle CV, % 50.0a 14.8b 17.1b 4.2Blue particle CV, % 47.6a 12.0b 14.6b 4.2Chromium CV, % 49.7a 15.3b 16.7b 4.1 Average daily gain, g 31.5 33.4 33.1 1.1 Average daily feed intake, g 47.5 49.0 48.3 1.2Gain:feed, g:g .663 .682 .685 .010Bone breaking strength, 19.0 19.5 17.6 1.2 kg of forceBone ask, % 41.8 41.2 39.4 1.1Carcass CP, % 53.8 54.4 55.0 .6
Carcass fat, % 29.5 29.3 29.1 .9Carcass ask, % 7.8 7.7 7.3 .3
1 Modified from McCoy et al. (1994) 2 Adjacent means within a row with no common superscript differ significantly (P<.05)
Table 3. Effect of mixing time on diet uniformity and
performance in broiler chicks, experiment 2 1,2
RevolutionsItem 5 20 80 SESalt CV, %2 40.5a 12.1b 9.7b 3.4Red particle CV, % 53.4a 16.6b 11.3b 4.0Blue particle CV, % 53.9a 17.0b 10.6b 3.5Sodium CV, % 44.5a 23.2b 22.8b 3.1
Average daily gain, g 23.6a
30.0b
30.3b
1.7 Average daily feed intake, g 43.1 51.5 52.7 2.9Gain:feed, g:g .548a .583b .575b .018Mortality, % 12.0 0 0 5.8
1 Modified from McCoy et al. (1994) 2 Adjacent means within a row with no common superscript differ significantly (P<.05)
Table 4. Effects of mix time on diet uniformity and growth
performance of nursery pigs 1
Mix time, minItem 0 .5 2 4 CVCV for Cr, % 106.5 28.4 16.1 12.3 N/A ADG, lb2 .59 .83 .84 .88 12.0 ADFI, lb3 1.32 1.57 1.55 1.59 7.9F/G4 2.24 1.89 1.85 1.81 9.1
1 Modified from Traylor et al. (1994) 2 Quadratic and cubic effect (P<.02)3 Quadratic and cubic effect (P<.08)4 Quadratic and cubic effect (P<.03)
Table 5. Effects of mix time on diet uniformity and growth
performance of finishing pigs 1
Mix time, minItem 0 .5 2 4 CVCV for Cr, % 53.8 14.8 12.5 9.6 N/A ADG, lb 1.71 1.78 1.75 1.73 3.7 ADFI, lb 6.49 6.40 6.36 6.35 3.7F/G 3.80 3.60 3.63 3.67 3.5Dressing percentage 73.7 73.3 73.1 73.0 .6Last rib fat thickness, in 1.20 1.09 1.14 1.18 3.3Bone breaking strength, 230 236 239 218 16.9 strength, kg of peak force
1 Modified from Traylor et al. (1994)

8/20/2019 Asa Tr Ftech
http://slidepdf.com/reader/full/asa-tr-ftech 67/84
Ensuring Optimum Mixability In Feed Manufacturing
f e
e d T e c h n ol o g y
65
significant effects on ADG, ADFI, F/G and bone strength. However, rate and efficiency of gain had
numerical increases of 4 and 5 %, respectively, as mix time increased from 0 to 0.5 min.
They concluded that that increased mix time improved diet uniformity and performance of nursery pigs.Finishing pigs were less sensitive to diet nonuniformity, with growth performance being affected onlyslightly as mix time was increased from 0 to 4 min. The finishing pigs were quite tolerant of CVs of atleast 15% and even up to 54%. However, caution is warranted when using a medicated feed article.
Factors That Affect Mixer
Performance Although insufficient mixing time and filling themixer beyond the rated capacity are oftenimplicated as common sources of variation in
finish feed. Other factors such as particle size andshape of the ingredients, ingredient density, staticcharge, sequence of ingredient addition, worn,altered, or broken equipment, improper mixeradjustment, poor mixer designed, and cleanlinesscan affect the mixer performance (Wilcox andBalding, 1986; Wicker and Poole, 1991).
The mixing time necessary to produce ahomogenous distribution of feed ingredients shouldbe measured for each mixer. Mixing time is afunction of mixer design and the rotational speedof the ribbon, paddle, or auger. Each mixer shouldbe “tuned” to its proper Revolutions Per Minute(RPM) for optimum ingredient dispersion. Differenttypes of ingredients may have a different flowpattern within a mixer at similar RPM’s. Generally,(Wilcox and Unruh, 1986), the higher the RPM,the faster the more efficient the pattern of dispersion (Figure 1). However, optimum RPMcan change over the life of the mixer resultingfrom normal wear, ingredient buildup or structurebasis to allow the mill operator to make theadjustments needed to achieve a high level of operational performance.
The size uniformity of the various ingredients thatcomprise the finished feed can directly impactfinal ingredient dispersion (Herrman and Behnke,1994). If all the physical properties are relativelythe same, then mixing becomes fairly simple. Asthe physical characteristics of ingredients beginto vary widely, blending and segregation problemsare compounded. Large and small particles donot mix well and subject to directional influencein nearly any type of mechanical mixer. Forexample, ground grain with a particle size of
1,200-1,500 microns reduced the likelihood of uniform incorporation of microingredientscompared to grain ground to an average particlesize of 700 microns (Herrman and Behnke, 1994).
Figure1. Effect of paddle/screw RPM on CV in a 2-ton horizontal
mixer.
Figure 3. Effect of worn outer ribbon in a 2-ton horizontal
ribbon mixer.
Figure 2. Effect of liquid buildup in a 2-ton horizontal paddle
mixer.

8/20/2019 Asa Tr Ftech
http://slidepdf.com/reader/full/asa-tr-ftech 68/84
Ensuring Optimum Mixability In Feed Manufacturing
66
f e e d T e c h n o l o g y
The sequence of ingredient addition also determines ingredient dispersion in the mixing process (Herrman
and Behnke, 1994). Mixers may have dead spots, where small amounts of ingredients may not bereadily incorporated into the feed. This situation is exasperated when mixing ribbons, augers, or paddlesbecome worn. Ground grain or soybean meal should be the first ingredient added into a horizontalmixer. It has been determined that for the quickest distribution of the microingredients within the massof major ingredients, the microingredients should enter the horizontal mixer early in the dumping order,no later than 10 seconds after the first of the major ingredients begins its entry (Lanz, 1992).
Overfilling or under-filling a mixer can lead to inadequate mixing (Wilcox and Balding, 1976). Overfillinga mixer can inhibit the mixing action of ingredients in horizontal mixers at the top of the mixer. Fillinga mixer below 50% of its rated capacity may reduce mixing action and is not recommended.
The incorporation of liquid ingredients (fats, oils, molasses, liquid chlorine chloride, Alimet and otherliquids) into the mixer is a common practice in many milling operations. The best way to introduceliquid ingredients are through a spray bar installed at the top of the mixer. Dry ingredients should beadequately mixed prior to the introduction of liquids into the system. Premature liquid addition tendsto impede the transport of micronutrients and may even agglomerate the fine particles into “snowballs”.
Most engineers agree that multiple points of application (4-8) are necessary to insure adequatedispersion (Lanz, 1992). The preferred location is such that the manifolds are parallel and locatedon the “up-turning” side of the rotor. Pressure-loaded check valves and air-purged manifolds helpminimize the post-spray dripping that can foul the mixer’s rotor.
Mixer TestingRoutine mixer testing should be an integral part of the quality assurance program and should beconducted quarterly. Procedures for mixer testing are relatively simple and involve taking samples
at specific time intervals. The assay used and statistical treatment are relatively straightforward.
SamplingGood sampling is essential for a mixability study to be worthwhile. An analysis is only as good as thesample. The intent of good sampling is to obtain a small portion of a feed that is representative of the whole. One cannot take only the fines or only large particles and expect to obtain an accurateanalysis. The eight factors summarized here are important in order to obtain good samples. Theseapply to all samples and not just to those taken for mixability studies.
Important factors to obtaining good samples
1. Planning2. Location
3. Quantity4. Timing5. Tools used for sampling6. Containers7. Proper labeling8. Sampling preservative
The number of samples to be taken depends on the accuracy of the results desired. Herrman andBehnke (1994) suggested that 10 samples per batch per mixing time would yield sufficient satisfactorycoefficient of variance. Eisenberg and Eisenberg (1992) indicate that the number of samples assayeddepends mainly upon the laboratory time and costs.
Ideally, samples should be taken within the mixer either at spaced intervals during the mix or oncompletion of the mix. Sampling within a mixer may be particularly desirable under these conditions:1. When a mixer design is being studied, an attempt is made to determine where certain
ingredients may concentrate.2. When the effect of time of mixing is being studied, it is not desirable to discharge the mixer
frequently or before mixing is complete.

8/20/2019 Asa Tr Ftech
http://slidepdf.com/reader/full/asa-tr-ftech 69/84
Ensuring Optimum Mixability In Feed Manufacturing
f e
e d T e c h n ol o g y
67
If one cannot take samples from the mixer, then take them as near the mixer in the production system
as possible. Frequently if a mixer discharge is being sampled, it is necessary to sample as rapidlyas possible at almost uniform time intervals, which may mean taking samples at 5 to 10 secondintervals. If poor mixer or segregation is indicated after preliminary trials, it may be desirable to makea special effort to sample from particular locations or at particular times to locate trouble spots.
Recommended Procedure For Sampling Feeds From The Mixer 1. Decide and make arrangements for the analytical work. Obtain equipment and containers for
sampling. The suggested size is 100 to 200 gram and sufficient enough for the planned analyses.Mark sample containers for sample identification.
2. Select a suitable location for taking samples preferably as close to the mixer discharge as possible. The site and sampling procedure should not pose a safety hazard to the person involved in takingthe samples.
3. Timing the mixer discharge at 8 to 10 samples per batch are recommended, beginning with initialdischarge and ending with samples of the tailings at the final discharge. In between samples willbe taken at evenly spaced time intervals between the initial and final discharge.
4. Begin sampling sequence when the mixer is ready to discharge. Record the mixing time; mixing timebegins when the last ingredient is added to the mixer and ends when the mixer begins to discharge.
Assay SelectionNumerous assay methods have been used for mixer evaluation. However, there is no “perfect”procedure available. The criteria for the assay selection should be as follows:
1. The assay principals should be based upon a common ingredient, nutrient, or chemical that comesfrom a single source. Salt, therefore, is a good selection while protein or nitrogen would be a poorselection.
2. The cost of the assay in terms of labor, chemicals, and time should be minimal.3. The assay procedure should be relatively simple, fast, accurate, precise and should be able to
perform in the mill or laboratory, and not require expensive equipment or highly qualified personnel.4. The assay principle should be supplied from a single source.5. The sample size required should be reasonable but large enough to reduce or eliminate sampling error.6. The target mix uniformity (CV values of the tracer) should be about 2 times the proven analytical
variation for the assay selected but in no case should it exceed 10%.
Common Mixer TestsSalt (NaCl) is a common component of most livestock and poultry rations. Therefore, sodium (Na)or chlorine (Cl-) ions are often used as mixer test markers. Assaying samples for salt content maybe performed using several techniques.
1. Omnion Sodium Analysis (Omnion, Inc., Rockland, Massachusetts): Use a sodium ion electrodeto determine the concentration of Na+ in the samples. The percentage of salt can be calculatedfrom these values. The technique appears to be quite accurate and reliable.
2. Quantab® (Environmental Test Systems, Elkart, Indiana): This method determines the chlorideion concentration of a solution. Salt from the feed samples is extracted in hot water. The titratorsconsist of a thin strip laminated with a capillary column, impregnated with silver dichromate. Thecolumn is a reddish-brown color. When the strips are placed in an aqueous salt solution, the fluidwill rise in the column. The indicator across the top turns blue, the reaction is completed. Chlorideion concentration is calculated and variation from the expected concentration is used to determinemixer performance.
Color-coded TracersMicrotracer™ Rotary detector (Micro Tracers, Inc., San Francisco, CA 94124): Inclusion and subsequentanalysis for tracer particles is another method for mixer testing. A sufficient amount of iron filings,colored with a water-soluble die, is added to the mix to result in sixteen counts (particles) per sample,with the sample size ranging between 50 to 100 grams. The iron particles are demagnetized and

8/20/2019 Asa Tr Ftech
http://slidepdf.com/reader/full/asa-tr-ftech 70/84
Ensuring Optimum Mixability In Feed Manufacturing
68
f e e d T e c h n o l o g y
sprinkled onto a large filter paper. The filter paper is then moistened with ethanol. When spots begin
to develop, the paper is transferred to a preheated hot plate or oven and dried. All particles of thesame color are counted, noting the total. Variation from the expected number is calculated to determinemixer performance.
As an interim check, other ingredients such as lysine and liquid Alimet feed supplement can be utilizedto help determine if the mixer is functioning within an acceptable range of variation. Feed mills routinelyassay for Alimet to evaluate mixability due to its relatively low assay CV (3-5%), and the simplicity of the method which uses High Pressure Liquid Chromatography (HPLC).
Data Analysis The average marker concentration (mean) and variations between samples (standard deviation) arecalculated to arrive at a single value described as the coefficient of variation (CV).
Example: A formula calls for 0.175% Alimet.Determine if a good mix has been obtained.
The mean and standard deviation values can becalculated with an inexpensive calculator with thestatistical functions. We conclude from this datathat the blend was uniform with a CV value of 2.21%.
Interpreting the Results A CV of less than 10% has somewhat arbitrarilybeen used as the “cut-off” point for accepting a
batch of feed as being properly mixed. The industrystandard is a maximum CV of 10% for a feed tobe considered adequately mixed. Thus, a desirableCV for a well-mixed feed, using the salt assaymethod, should be at or below 10%. However,
variation in the salt assay procedure may be as high as 5 to 6%, indicating that the actual variationdue to mixing is about 5%. Furthermore, when using a limited number of samples (10 - 12), it canbe expected that occasionally a CV of more than 10% will occur, which may/may not identify anunderlying problem in the mixing process. Thus, these figures may be revised to fit individual millstandards and quality control policy.
Interpretation of mixer tests
% Coefficient of Variation Rating Corrective Action
< 10% Excellent None
10 - 15% Good inspection of mixer
15 - 20 % Fair Increase mixing time, look for worn equipment, overfilling,
or sequence of ingredient addition
> 20 % Poor Possible combination of all the above and consult feed
equipment manufacturer
Source: Feed Manufacturing - testing mixer performance. Bulletin MF-1172 Revised, Kansas State University Cooperative Extension Service, Manhattan, KS MF-1172
SAMPLE ID Alimet Concentrations
(by HPLC analysis)
Feed sample 1 0.174
Feed sample 2 0.174
Feed sample 3 0.180
Feed sample 4 0.180
Feed sample 5 0.179
Feed sample 6 0.184
Feed sample 7 0.173
Feed sample 8 0.175
Mean = 0.177
Standard Deviation = 0.004
CV % = 2.21
Equation to calculate CV %:
CV % = Standard deviation / Mean x 100

8/20/2019 Asa Tr Ftech
http://slidepdf.com/reader/full/asa-tr-ftech 71/84
Ensuring Optimum Mixability In Feed Manufacturing
f e
e d T e c h n ol o g y
69
Conclusion
Feed costs comprise the single most expensive component in producing poultry or other types of meat animals. As a result, effort to reduce nutrient variability within feeds will yield a significant returnto commercial operations. Proper ingredient processing and storage, adequate maintenance of millequipment and routine testing of the final feed are essential to insure optimum animal response tofeed nutrients, while controlling feed costs. Nutritionists and feedmill operators should work togetherto closely monitor feed preparation, and final feed specifications. The bottom-line result will be areduction in the cost to produce a unit of meat or eggs.
ReferencesDuncan, M.S. 1989. Strategies to deal with nutrient variability In: Recent Advances in Animal Protein
Production. Monsanto Latin America Technical Symposium Proceedings. pp. 31-40.Eisenberg, S and D. Eisenberg, 1992. Markers in mixer testing: closer to perfection. Feed Management.
Nov pp 8-20.Herrman, T. and K. Behnke. 1994. Feed Manufacturing - Testing mixer performance. Bulletin MF-1172 Revised, Kansas State University Cooperative Extension Service, Manhattan, KS.
Lanz, G. T. (1992) Composition of mixing systems. Novus Nutrition Update Vol 2 (1).McCoy, R.A., K.C. Behnke, J.D. Hancock and R.R. McEllhiney. 1994. Effect of mixing uniformity on
broiler chick performance. Poul Sci 73:443. Traylor, S.L., J.D. Hancock, K.C. Behnke, C.R. Stark, and R.H. Hines. 1994. Mix time affects diet
uniformity and growth performance of nursery and finishing pigs. Kansas State Univ. Swine Day1994, pp 171-175.
Wicker, D.L. and D.R. Poole, 1991. How is your mixer performing? Feed Manage. 42(9):40-44.Wilcox, R.A. and J.L. Balding, 1976. Feed manufacturing problems - incomplete mixing and segregation.
Bulletin C-555 Revised, Kansas State University Cooperative Extension Service, Manhattan, KS.Wilcox, R. A. and D.L. Unruh. 1986. Feed manufacturing problems - Feed mixing times and feed
mixers. Bulletin MF- 829 , Kansas State University Cooperative Extension Service, Manhattan, KS.

8/20/2019 Asa Tr Ftech
http://slidepdf.com/reader/full/asa-tr-ftech 72/84
70
f e e d T e c h n o l o g y
High Speed Hammermills For Fine Grinding
Mark Heimann
Roskamp Champion
USA
Hammermills are commonly used for grinding a broad range of materials including those used in theproduction of pet foods and aquaculture feeds. Since most pets and species of fish, crustaceans,and shellfish have a very short digestive tract, they require a finely ground, highly processed feed inorder to realize good feed utilization. Hammermills and air swept pulverizers are the two most commonmachines used to grind the materials to the fine particle size used in the production of extruded petfoods and aquaculture feeds.
Hammermills vs. Air Swept Pulverizers Compared to most air swept pulverizers hammermills offerhigh efficiency, low heating, and reduced aspiration requirements. Maintenance costs for hammermillsequipped with conventional hardfaced hammers and round hole screens are typically $0.02-$0.10/tonand electrical costs range from about $0.25/ton, to more than $1.00 per ton depending on the feedformulation and fineness of grind. By comparison, air swept pulverizers often consume $2.00 to$4.00 /ton or more for energy, and wear parts costs can exceed $0.25/ton in many instances.
Because there is less heating of the product and lower air flow through a hammermill compared toan air swept pulverizer, materials ground through a hammermill will have less moisture loss thanmaterials ground through air swept pulverizers. Typical moisture loss through a hammermill when finegrinding for aquaculture feeds is 1 / 2 to 2%. Hammermills are generally less expensive to install andoperate than pulverizers, typically costing between $250 and $350 per HP for a complete systemincluding the hammermill, feeder, and appropriate air assist system.
Hammermills are somewhat limited in the finished particle size that can be conveniently achieved. Typical finished ground product from a conventional hammermill set up will be in the range of 90 to95% less than 30 mesh (0.5 mm) with a mean particle diameter of 200µ to 300µ. Specially equippedhammermills are capable of grinding aquaculture rations as fine as 90 to 95% less than 60 mesh(0.25 mm) with a mean particle diameter of 100µ to 175µ. Air swept pulverizers with built in classifierscan recirculate oversize particles and achieve finished products in the range of 95 to 99% less than100 mesh (0.15 mm) and a mean particle diameter between 40 and 75µ.
In many instances, “double grinding” systems are employed to obtain the fine finished productsneeded for efficient aquaculture feed production. Double grinding may be accomplished with a single
hammermill, processing the entire batch through the hammermill then with a screen change to improvethe fineness of grind, rerunning the same batch back through the same hammermill. A secondapproach is to use two hammermills in series, grinding through a larger screen first (typically 1 to 3mm) then regrinding the entire batch through a second hammermill with smaller screens (typically0.4 to 1 mm). A third double grinding system uses a hammermill for the preliminary grind, and thenthrough an air swept pulverizer for the finished particle sizing. Whatever the system may be, doublegrinding offers improved efficiency over single grinding operations with a finer, more uniform finishedground product.
Equipment Description A hammermill consists of a rotor assembly with two or more rotor plates fixed to a main shaft, enclosedin some form of grinding chamber. The actual working mechanisms are the hammers and the screen
or grinding plates that encircle the rotor. The hammers are simply flat metal bars with a hole at oneor both ends and usually have some for of hardface treatment on the working end(s). The hammersmay be fixed, fastened rigidly to the rotor assembly but much more common are swinging hammerswhere the hammers float on pins or rods. This swinging hammer design greatly facilitates changinghammers when the working edges are worn.

8/20/2019 Asa Tr Ftech
http://slidepdf.com/reader/full/asa-tr-ftech 73/84
High Speed Hammermills For Fine Grinding
f e
e d T e c h n ol o g y
71
Particle size reduction in a hammermill is primarily a result of impact between the rapidly moving
hammers and the incoming material. There is some attrition of the particles (gradual reduction byfriction) between the hammers and the screen and as the particles impact the internal componentsof the hammermill as they are being driven around the machine by the rapidly turning hammers.
The efficiency of the grinding operation will depend on a number of variables including but not limitedto: tip speed, screen (hole) size and open area, screen area / horsepower ratio, hammer pattern (numberof hammers), hammer position (coarse or fine), uniform feed distribution, and air assist. In addition, thenature and quality of the material(s) being processed will affect the performance of the hammermill.
Basic Machine CharacteristicsHammermills used in aquaculture feed processing have many common characteristics. Here are afew basic design principles as they apply to maximizing the performance and minimizing the cost
of operating a hammermill system.
Full Width Top Feed The modern hammermill design must include a full width top feed in order toachieve maximum efficiency and minimize the cost of operation. A full width feed insures the entirescreen area can be used effectively, and that the work being accomplished will be evenly distributedacross the full hammer pattern. The top feed permits the direction of rotation to be changed, allowingtwo corners of the hammer and both “edges” of the screen to be utilized before a physical changeof the hammer is required.
Tear Shaped Grinding Chamber A tear shaped grinding chamber is necessary to prevent materialfrom circulating within the grinding chamber. Most well designed modern hammermills have somesort of flow director in the top of the hammermill to properly feed incoming materials into the hammerpath, and to stop any materials that are circulating within the grinding chamber.
Split Screen / Regrind Chamber Hammermill screens are commonly split in two pieces, with somedevice at the bottom of the mill to disrupt the flow of materials within the grinding chamber. Theapplication of a split screen design will permit the user to adjust the screen sizing on the down sideand up side to maximize productivity and product quality. A “Regrind Chamber” at the bottom of themill introduces enough turbulence to swirl materials back into the hammer path at the 6:00 position. This regrind chamber must be large enough to take product out of rotation as the hammermill operates,but should not be so large as to reduce the available screen area significantly.
Robust Rotor Support In order to maintain the relative position of the rotor to the grinding chamberthe foundation of the mill must be extremely robust. A solid, substantial structure positively maintainsthe clearances between the hammer tips and the screen through the full rotation for consistent,
efficient processing. This stout design must be accomplished without sacrificing the accessibility tothe grinding chamber, as routine maintenance of the hammers and screens will be required.
Replaceable Wear Items One final rule for a good hammerdesign is if it can wear, it should be replaceable. Beyond thehammers, screens, and pins, every component within thehammermill will be subject to wear. Accordingly, thesecomponents should be fabricated from wear resistant materials,heavy enough to provide good service life, and ultimately shouldbe reasonably simple to replace.
Basic Operational Concepts
As noted, particle size reduction in a hammermill occurs as aresult of the impact between a rapidly moving hammer and arelatively slow moving particle. The particle breaks and isaccelerated towards the screen; depending on the particle sizeand angle of approach, it either passes through the screen or
Figure 1.
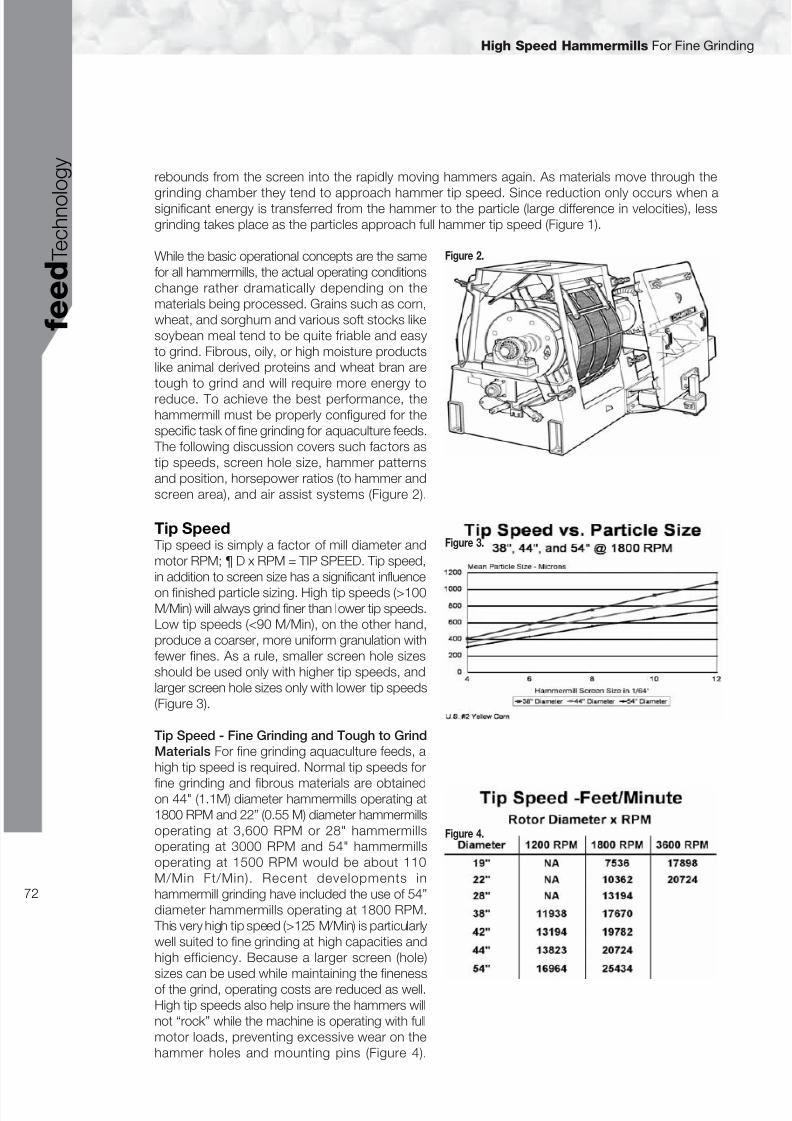
8/20/2019 Asa Tr Ftech
http://slidepdf.com/reader/full/asa-tr-ftech 74/84
High Speed Hammermills For Fine Grinding
72
f e e d T e c h n o l o g y
rebounds from the screen into the rapidly moving hammers again. As materials move through the
grinding chamber they tend to approach hammer tip speed. Since reduction only occurs when asignificant energy is transferred from the hammer to the particle (large difference in velocities), lessgrinding takes place as the particles approach full hammer tip speed (Figure 1).
While the basic operational concepts are the samefor all hammermills, the actual operating conditionschange rather dramatically depending on thematerials being processed. Grains such as corn,wheat, and sorghum and various soft stocks likesoybean meal tend to be quite friable and easyto grind. Fibrous, oily, or high moisture productslike animal derived proteins and wheat bran aretough to grind and will require more energy toreduce. To achieve the best performance, thehammermill must be properly configured for thespecific task of fine grinding for aquaculture feeds. The following discussion covers such factors astip speeds, screen hole size, hammer patternsand position, horsepower ratios (to hammer andscreen area), and air assist systems (Figure 2).
Tip Speed Tip speed is simply a factor of mill diameter andmotor RPM; ¶ D x RPM = TIP SPEED. Tip speed,in addition to screen size has a significant influence
on finished particle sizing. High tip speeds (>100M/Min) will always grind finer than lower tip speeds.Low tip speeds (<90 M/Min), on the other hand,produce a coarser, more uniform granulation withfewer fines. As a rule, smaller screen hole sizesshould be used only with higher tip speeds, andlarger screen hole sizes only with lower tip speeds(Figure 3).
Tip Speed - Fine Grinding and Tough to Grind
Materials For fine grinding aquaculture feeds, ahigh tip speed is required. Normal tip speeds for
fine grinding and fibrous materials are obtainedon 44" (1.1M) diameter hammermills operating at1800 RPM and 22” (0.55 M) diameter hammermillsoperating at 3,600 RPM or 28" hammermillsoperating at 3000 RPM and 54" hammermillsoperating at 1500 RPM would be about 110M/Min Ft/Min). Recent developments inhammermill grinding have included the use of 54”diameter hammermills operating at 1800 RPM. This very high tip speed (>125 M/Min) is particularlywell suited to fine grinding at high capacities andhigh efficiency. Because a larger screen (hole)sizes can be used while maintaining the finenessof the grind, operating costs are reduced as well.High tip speeds also help insure the hammers willnot “rock” while the machine is operating with fullmotor loads, preventing excessive wear on thehammer holes and mounting pins (Figure 4).
Figure 2.
Figure 3.
Figure 4.

8/20/2019 Asa Tr Ftech
http://slidepdf.com/reader/full/asa-tr-ftech 75/84
High Speed Hammermills For Fine Grinding
f e
e d T e c h n ol o g y
73
Hammers
There are an unlimited number of hammer stylesavailable from many suppliers around the world. At the same time, there are distinctly differenttypes of hammers used in different regions of theworld for a variety of hammermill grinding tasks.For longest hammer life and most efficientoperation, a hammer with a flared hardface end(or ends) is preferred. Hammers may be one hole,with one working end (two corners) or two holed,with four corners available for grinding. One holehammers are generally preferred to maintainbalance of the rotor and minimize the potentialfor catastrophic hammer failure (Figure 5).
Hammer patterns (the number and distribution of the hammers on the rotor) and positions (settingthe hammer closer to or further from the screen)have a profound effect on the performance of anyhammermill. Because different materials grinddifferently, the ideal number of hammers andclearance to the screen will need to be adjustedaccording to each application.
It is important to make sure the hammer patterncovers the working screen, without having
hammers trailing hammers in line. In most cases,the hammer pattern should include doublehammers on the outside rolls of at least twoopposing pins. This is because the material in thegrinding chamber near the sides of the mill movesmore slowly than material in the middle of the milldue to friction on the sides, consequently theoutside rows of hammers must do more work and are subject to more wear (Figure 6).
Most general application hammermills today areequipped with a rotor designed for a 4 pin hammer
pattern or a 6 pin hammer pattern. Since therotors are normally drilled for two hammer positions(coarse and fine) the rotors are actually fit with 8or 12 sets of hammer pins. For fine grindingapplications it is often necessary to use an extraheavy hammer pattern to achieve the very finefinished products desired: in many cases, therotor will be equipped with hammers on all 8 orall 12 sets of hammer pins. This way the totalnumber of hammers is increased significantly,without putting an excessive number of hammerson any individual pin(s), which could lead to highstress and the possible failure of the pins or rotorplates (Figures 7 and 8).
To insure the motor can start a machine with ahigh inertial load, an electronic soft start may berequired.
Figure 5.
Figure 6.
Figure 8. Hammermill Considerations
12 Pin All Fine Rotor
puts more hammers close to
screen for finer grinding
Extra Heavy Pattern
HP/hammer ratio is nearly 1:1
for more hammer contact
High Strength Rotor Rotor plate material resists
elongation and tear out
Forged Rotor Shaft
Alloy steel rotor shaft withstands
high loads without deflection
Figure 7. Horsepower/Hammer Ratios
Hammer Size Easy to Grind Tough to Grind
6-8” 1 to 1.5 .5 to 1H.P./Hammer H.P./Hammer
8-10” 2.5 to 3.5 1 to 2
H.P./Hammer H.P./Hammer

8/20/2019 Asa Tr Ftech
http://slidepdf.com/reader/full/asa-tr-ftech 76/84
High Speed Hammermills For Fine Grinding
74
f e e d T e c h n o l o g y
Screens
In terms of hammermill capacity and efficiency,the best screen for any job is the thinnest materialwith the most open area. Naturally, some sacrificein efficiency must be made for the sake of endurance, yet the general rule applies. On theother hand, for many aquaculture applicationsthere is a benefit to using screens with limitedopen area to promote a finer finished product.Indeed, many hammermills grinding in aquacultureapplications are equipped with extended wearliners at the inlet of the machine to increase theimpact and grinding that occurs when the productis first struck by the hammers. Some users goso far as to “blank off” a portion of the down sidescreen by placing a solid sheet metal plate behind the screen to prevent material from passing throughthe screen openings. This promotes finer finished products, although the production rate will benegatively impacted (Figure 9).
Factors effecting open area include hole size, stagger, angle of stagger, and hole spacing. There area few specialty screens being used in aquaculture applications to improve the grinding performance.One type of screen material is known as the “Conidur” with the holes punched is such a way thatthe surface is upset, almost like small louvers or the surface of a cheese grater. This type of screencan work effectively, but is very expensive to purchase and will reduce the machine capacity. Onereason the “Conidur” type screen produces a finer finished product is the fact the open area is verylow when compared to a conventional round hole screen with a similar opening diameter.
Sealing at the edges of the screen is particularly important when fine grinding for aquaculture feeds. The fit of the screen carriage and the wear l iner must be precise to prevent any oversize particlesfrom bypassing around the edges of the screen. At the same time, the screen must be adequatelysupported, as fine screens do not have the mechanical strength of thicker, heavier screen material.Regular inspections of the screens must be made to monitor the condition of the screens and tocatch any worn or failing screens before they fail completely.
FeedersProper feeding of a hammermill is absolutely essential if the system is to operate at maximum grindingefficiency, and with the lowest possible cost per ton. Uneven or inconsistent feeding can lead tosurges in the motor load. Because the load is constantly changing, the motor cannot operate at peak
efficiency and so increases the grinding costs. An additional liability that is often “hidden” is the factthat surges in the feed may tend to accelerate wear on the hammers and pins by causing the hammersto “rock” on the pin.
Uneven feeding across the face of the hammermill obviouslyincreases the wear on the working components in the areas of heaviest feeding. Because a part of the mill is being overworked,the rest of the mill is not being fully loaded and grinding efficiencyis reduced. Uneven feeding also tends to cause a hammermillto go out of balance more quickly due to uneven wear. This addsto the operating cost of the mill by causing premature replacementof the wear items like hammer and pins.
Rotary Pocket Feeder As the name indicates, rotary pocketfeeders utilize a rotor mechanism much like a rotary air lock toevenly distribute the feed to the hammermill. In most cases, therotor is segmented and the pockets are staggered to improve
Figure 9. Acceleration Zone
Figure 10. HRF Rotary Feeder.

8/20/2019 Asa Tr Ftech
http://slidepdf.com/reader/full/asa-tr-ftech 77/84
High Speed Hammermills For Fine Grinding
f e
e d T e c h n ol o g y
75
the distribution of the feed, and to reduce surges in the feed rate. Because the rotary pocket type
feeders relies on a free flowing material to fill the pockets, they are best suited to granular materialswith a density of 30#/Ft3 or more. Typical applications would be whole grains and coarsely groundmixed rations (Figure 10).
Screw Feeder Screw type feeders are used when processing materials that have poor flowcharacteristics, or contain large bits of material that would not flow properly with a rotary pocketfeeder. Screw feeders may impart a surge to the feed, and so have limited applications in high capacity / high efficiency grinding situations. A properly designed screw feeder with multiple screws and doubleflighting at the discharge end will overcome many of the negative tendencies of screw feeders.
Air Assist The final application topic to be considered is the use of
aspiration air to improve mill efficiency and performance. Theair assist system controls the environment of the grindingchamber in the hammermill and aids in moving product fromthe grinding chamber through the screen perforations. A properly designed air assist allows a hammermill to grindmore efficiently, producing a more uniform finished productwith less heating and controls dusting around the mill. Althoughhammermill capacity will vary with the type of machine andoperational parameters, air assisted grinding systems will outproduce non-assisted systems by 15-40% (Figure 11).
A good rule of thumb for the amount of air required to assist product and control dusting is 1.25-1.50 CFM/In2 of screen area. Pressure drop across the mill may range from 2-5" W.C., depending
on system operating conditions. In order to make an air assist system work, several items must beconsidered including the air flow into the mill, paths for the air and product out of the mill, separatingthe product from the air stream, and controlling the path of the air in the system.
Once the air is through the mill, it is necessary to allow the entrained fines to settle out before sendingit along to the cyclone or filter system. To accomplish this, a plenum or settling chamber should beprovided between the air/product conveyor and the pickup point. The plenum must be designed toreduce the velocity as much as possible to permit the fine material to settle out, and with the air pick up point away from any swirling, turbulent fines material. If the plenum is designed so the air velocitydrops below 15 times the bulk density (15 x 35 or 525 Ft/Min for most feed ingredients) the separationwill usually be adequate. Larger plenums will reduce the velocity and improve the air/fines separation.For practical purposes, the plenum cannot be too large.
To make the air assist system work, it is necessary to control the path the air takes through the mill.Normally, the discharge end of the take away conveyor must include some kind of air seal to insurethe air is pulled through the hammermill instead of back through the discharge system. This may beas simple as a shroud over the take away screw or as complex as a powered rotary airlock at thedischarge of a drag conveyor.
Other ConsiderationsMagnetic protection is necessary in order to realize the best life of the working components of themill. Tramp iron that enters a hammermill can knock holes in the screen, break hammers, and createundesirable sources of ignition. Mills that routinely operate with excessively worn or failed hammerswill vibrate badly and promote bearing failures. The vibration monitor switch on a hammermill is
intended to be used as an emergency shut down measure in case of a failure within the hammermill.
Always buy the best possible magnetic protection that is reasonable for a specific system and make surethe magnets are routinely cleaned. Magnets are relatively cheap insurance against damage due to foreignobjects, but must be cleaned regularly to insure they continue to operate at maximum performance levels.
Figure 11.
8/20/2019 Asa Tr Ftech
http://slidepdf.com/reader/full/asa-tr-ftech 78/84
76
f e e d T e c h n o l o g y
Extrusion Equipment Design And Selection
Keith C. Behnke
Kansas State University
USA
The process of extrusion has been around for nearly a century, beginning in the rubber industry toproduce items such as hoses and belting. Extrusion has been used nearly that long in the productionof pasta by means of a batch extrusion concept. The use of continuous extrusion in food found itsfirst application in the 1940’s to produce puffed cereals and snacks from corn meal or grits and pastafrom semolina.
Extrusion processing of dietary ingredients and finished feeds for animals began in the 1950’s toproduce foods for dogs. That industry has grown to nearly a $13 billion industry in the US alone andnearly that large in Europe.
Today, the extrusion process is considered a high-temperature, short time “bioreactor” that cantransform any number of raw materials into intermediate or finished products that have high consumerappeal. Food examples of items include an infinite variety of snacks, pasta, textured vegetable protein,breakfast cereals and the like. In terms of tonnage, there is little doubt that pet food reigns at the top.Extrusion allows the continuous cooking of the starch fraction of a formula necessary for the digestiverequirements of companion animals and gives the processor the ability to create nearly any shapethat might appeal to the pet owner.
A significant application of the extrusion process to animal feeds is in the production of aquafeeds.In some cases, it is desirable or necessary to produce a floating feed to accommodate the feedinghabits of the target species. In other cases, extrusion provides a method of agglomerating a varietyof ingredients into a sinking food that is water stable and is able to stay in the water column for severalhours without disintegrating.
A third widely used application of extrusion to animal feed ingredients is in the processing of raw soybeans into full-fat soybean meal that can be used in non-ruminant feeds without causing digestiveupset and that is easily digested. The application of the extrusion to processing raw soybeansexpanded dramatically with the availability of low-cost equipment that could adequately heat groundraw soybeans to denature trypsin inhibitors and other anti-nutritional factors. The conditions necessaryto warrant the use of extruded soybeans in non-ruminant feeds were reviewed by Hancock (1992),Hancock, (1989) and Hancock, et al (1991). Hancock, et al (1991) demonstrated improved soybean
protein utilization in nursery pigs when dry-roasting of the soybeans was replaced by extrusionprocessing.
Extrusion EquipmentExtrusion equipment used today to process animal feeds generally fall into two categories: Singlescrew extruders and twin-screw extruders (Harper, 1989).
Single-Screw ExtrudersFrom an engineering point of view, an extruder is simply a pump that provides the pressure necessaryto force the process mash through a restrictive die. During the transport through the barrel, it iscommon that massive amounts of heat are added to the mash through friction generated betweenthe mash and stationary and rotating components of an extruder. Therefore, an extruder is often
considered a “heat exchanger”. The pressure and temperature profiles experienced by the processmash can, within limits, be chosen and controlled by variations in screw design and operationalconditions. Due to the pressure applied to the barrel, the shape of the final product can be easilycontrolled through die selection and design.

8/20/2019 Asa Tr Ftech
http://slidepdf.com/reader/full/asa-tr-ftech 79/84
Extrusion Equipment Design And Selection
f e
e d T e c h n ol o g y
77
The major features of the single-screw extruder are shown in Figure 1. In most cases, a preconditioneris used in conjunction with the extruder to increase moisture and heat absorption into the processmash, reduce mechanical power requirements and increase capacity. The conditioner normallyoperates at atmospheric pressure and provides a means in which either water or steam or both areuniformly incorporated into the process mash. In addition, additives such as vitamins, flavors, colorsand even meat slurries may be incorporated. The conditioner provides retention time necessary forthe mash to absorb the heat and moisture needed before entering the extrusion barrel.
Conceptually, the barrel of a single screw extruder can be divided into three separate zones dependingon what is happening to the process mash in that zone. In the feed zone, the conditioned mash issimply received from the conditioner and transported forward in the barrel to a point where the cross-section of the barrel is completely full and an elastic plug is formed. The “transition” zone of the barrel
is identified by the fact that the mash changes, rheologically, from a powder to an elastic dough. Inthe “metering” zone, sometimes referred to as the “cooking zone”, extreme pressure is applied tothe mash and high levels of heat are induced by friction causing the temperature of the dough toincrease to well above 100°C. From a thermodynamic point of view, 75% or more of the work donein the extruder barrel is done in the metering zone. This is easily seen in maintenance records of anyextruder that will show that the final screw and barrel sections require replacement much more oftenthan any other component.
Depending upon the specific design if the extruder, various manufacturers use different screwconfigurations to create elevated compression in the transition and metering zones. In many cases,either decreasing flight height or decreasing screw diameters are used to create compression rationsin the range of 1:2 to 1:5. As compression on the extrudate is increased, the mechanical energycreated by the screw turning is dissipated as heat into the extrudate.
In many designs, the surface of the barrel is grooved, either in a spiral or straight, so that the barrel“grips” the extrudate so that the rotating screw can force the material forward toward the die.
Figure 1. Common Components of an Extrusion System.
(Courtesy of J.P. Kerns, Wenger International, Inc., Sabetha, KS. USA)

8/20/2019 Asa Tr Ftech
http://slidepdf.com/reader/full/asa-tr-ftech 80/84
Extrusion Equipment Design And Selection
78
f e e d T e c h n o l o g y
Mixing of ingredients within the extruder barrel is limited by laminar flow within the flight channel. To
increase mixing potential, it is sometimes advisable to modify the screw profile to include cut-flightsections that allow backward flow of extrudate.
Single screw operations depend on the pressure requirements of the die, the slip at the barrel-extrudate interface and the degree to which the void volume in the barrel id filled. Feed rate, Screwspeed and design and the characteristics of the extrudate dictate screw fill. The interaction of allthese variables creates the limits in the operating range and flexibility of a single screw extruder.
Twin-Screw ExtrudersIn order to create a design with greater operating flexibility and with greater operational control, twin-screw machines were developed. Twin-screw extruders can be co-rotating, counter-rotating,intermeshing or non-intermeshing in terms of basic designs. Co-rotating, intermeshing screw designs
have dominated that scene as far as these extruders are concerned. This is because of relative easeof design and manufacture compared to counter-rotating designs.
The screw design of twin-screw extruders can dramatically affect operating efficiency and machinecapability. Screw components in the feed section of the barrel can be single, double or even tripleflight arrangements. With more flights intertwined on the shaft, the conveying capacity of the screwis reduced but the residence time distribution (RTD) is lower. This promotes a first-in, first-out movementof the extrudate. However, double- and triple flighted screws produce more shear across the screwchannel and therefore, improved processing uniformity.
Single- verses Twin-Screw Comparison There is no doubt that twin-screw extruders allow the development and production of a greater arrayof products but at a significant cost. Twin-screw machines are 1.5 to 2.0 times the cost of a single-screw machine of the same relative cost. The extra expense is due to the relative complexity of thescrew design; the complicated drive components and the required heat transfer jackets. This maybe somewhat offset by the ability of the twin-screw machine to process drier product thus requiringlower energy for drying. In addition, simply being able to produce a product that is impossible toproduce on a single-screw design may justify the additional cost.
A very unique characteristic of a twin-screw machine is the ability to configure a single machine toperform two distinct tasks or functions at the same time. By configuring the first half or so of themachine as a high-shear, high-compression, cooking extruder, providing a vent into the barrel and,then, configuring the last half or the barrel as a low compression, low shear forming extruder, a twinscrew can be used to produce high density, cooked products like pre-cooked pasta, sinking aquafeedsor pellets for flaked breakfast cereal. In doing this, a single machine is able to accomplish the functions
of two separate single-screw machines producing the same product.
Low-Cost Extruders As is often the case, entrepreneurs find a way reduce the cost of expensive technology and producean item (in this case an extruder) that is much lower in cost, has much less flexibility in terms of application but that is capable of producing an acceptable final product. Such is the case with low-cost extruders.
These machines are very simple in design, are constructed of cast, rather than machined, componentsand perform a specific function reasonably well. In this instance, the application is in the productionof full-fat soybean meal. Most of these machines use a simple, interrupted flight arrangement withbreaker bolts to create the shear and pressure necessary to heat-denature the anti nutritional factors
associated with the use of soybeans in non-ruminant feeds. A manual variable orifice die is used thatcan be set close to- or away from the end of the screw to increase or decrease operating pressureand process temperature.
8/20/2019 Asa Tr Ftech
http://slidepdf.com/reader/full/asa-tr-ftech 81/84
Extrusion Equipment Design And Selection
f e
e d T e c h n ol o g y
79
While these machine designs usually produce acceptable FFS, they often fail when used to produce
other extruded products, such as floating aquafeeds or pet foods, without significant mechanical andsystem modification. In most cases, a preconditioner is not needed when processing FFS, however,when attempting to produce pet- or aquafeeds, a preconditioner is necessary to precook and hydratethe starch and protein in the formula for successful production. Because of the relative poor fit(tolerance) between the screw sections and the barrel, much higher back flow tends to occur andproduction efficiency, product quality and nutrient survival tend to be low. However, there is no doubtthat low cost extrusion equipment has a place in the feed industry and provides a feasible way toproduce products that otherwise would no be cost effective.
Summary Extrusion has become a common process in the feed industry and allows the production of feedtypes that simply are not possible with pelleting or any other process we have available. In general,
single screw extruders provide adequate operating ranges and are more economical to operate thantwin-screw extruders. With the availability of low cost extrusion equipment, processing of oilseedssuch as soybeans is feasible. There is no doubt that the application of extrusion to the developmentof new and novel feed products will continue and will result in increased usage of the technology inthe future of the feed industry.
Literature CitedHancock, J.D. 1989. Using soybean products in Swing Diets. Proc. 22nd Virginia Pork Industry
Conference, Williamsburg, VA. Jan 17-18.Hancock, J.D., R.H. Hines, G.E. Fitzner and T. L. Gugle 1991. Effects of extrusion processing on the
nutritional value of sorghum and soybeans for finishing pigs. Proc 17th Biennial Grain SorghumUtilization Conf. March 5-7, Lubbock, TX.
Hancock, J.D. 1992. Extrusion Cooking of Dietary Ingredients for Animal Feeds. Proc. Of the DistillersFeed Conference Vol 47:pp33-49. Cincinnati, OH. USA.
Harper, J.M. 1989. Food Extruders and Their Application. In: Extrusion Cooking, Mercier, C., P. Linco,J.M.Harper-editors. Am. Assoc. of Cereal Chemist. St. Paul, MN. Pp 1-15.

8/20/2019 Asa Tr Ftech
http://slidepdf.com/reader/full/asa-tr-ftech 82/84
Notes
80
f e e d T e c h n o l o g y

8/20/2019 Asa Tr Ftech
http://slidepdf.com/reader/full/asa-tr-ftech 83/84

8/20/2019 Asa Tr Ftech
http://slidepdf.com/reader/full/asa-tr-ftech 84/84