Embed Size (px)
Citation preview
Asahi Kasei Report 2019
Asahi K
asei Rep
ort 2019
Creating for
Tomorrow

We, the Asahi Kasei Group,
contribute to life and living
for people around the world.
Group Vision
Providing new value to society by enabling “living in health and comfort”
and “harmony with the natural environment.”
Group Values
Sincerity—Being sincere with everyone.
Challenge—Boldly taking challenges, continuously seeking change.
Creativity—Creating new value through unity and synergy.
Group Slogan
Creating for Tomorrow
Group Mission
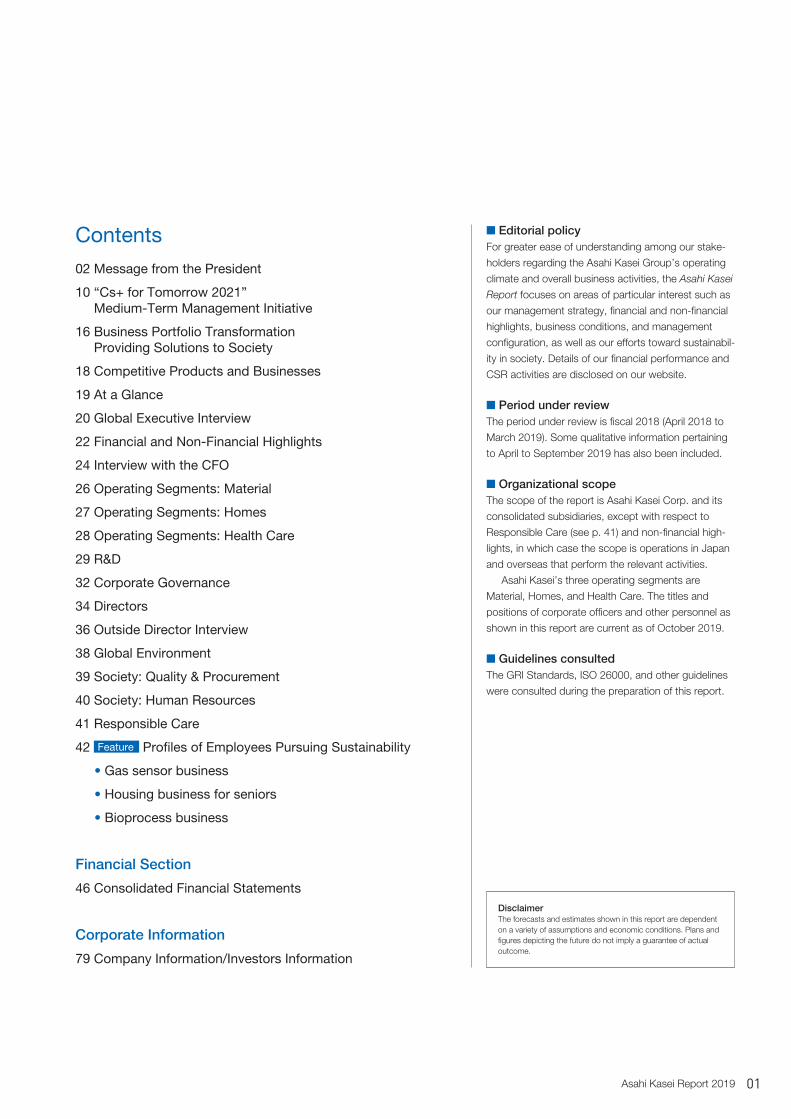
■ Editorial policyFor greater ease of understanding among our stake-
holders regarding the Asahi Kasei Group’s operating
climate and overall business activities, the Asahi Kasei
Report focuses on areas of particular interest such as
our management strategy, financial and non-financial
highlights, business conditions, and management
configuration, as well as our efforts toward sustainabil-
ity in society. Details of our financial performance and
CSR activities are disclosed on our website.
■ Period under reviewThe period under review is fiscal 2018 (April 2018 to
March 2019). Some qualitative information pertaining
to April to September 2019 has also been included.
■ Organizational scopeThe scope of the report is Asahi Kasei Corp. and its
consolidated subsidiaries, except with respect to
Responsible Care (see p. 41) and non-financial high-
lights, in which case the scope is operations in Japan
and overseas that perform the relevant activities.
Asahi Kasei’s three operating segments are
Material, Homes, and Health Care. The titles and
positions of corporate officers and other personnel as
shown in this report are current as of October 2019.
■ Guidelines consultedThe GRI Standards, ISO 26000, and other guidelines
were consulted during the preparation of this report.
DisclaimerThe forecasts and estimates shown in this report are dependent on a variety of assumptions and economic conditions. Plans and figures depicting the future do not imply a guarantee of actual outcome.
Contents
02 Message from the President
10 “Cs+ for Tomorrow 2021” Medium-Term Management Initiative
16 Business Portfolio Transformation Providing Solutions to Society
18 Competitive Products and Businesses
19 At a Glance
20 Global Executive Interview
22 Financial and Non-Financial Highlights
24 Interview with the CFO
26 Operating Segments: Material
27 Operating Segments: Homes
28 Operating Segments: Health Care
29 R&D
32 Corporate Governance
34 Directors
36 Outside Director Interview
38 Global Environment
39 Society: Quality & Procurement
40 Society: Human Resources
41 Responsible Care
42 Feature Profiles of Employees Pursuing Sustainability
• Gas sensor business
• Housing business for seniors
• Bioprocess business
Financial Section
46 Consolidated Financial Statements
Corporate Information
79 Company Information/Investors Information
01Asahi Kasei Report 2019

Message from the President
Our new management initiative Cs+ for Tomorrow 2021 for the 3-year period from fiscal 2019 is focused on two mutually reinforcing aspects of sustainability—contributing to the sustainability of society through our business operations, and the sustainable increase in our corporate value.
Hideki KoboriPresident
Asahi Kasei Report 201902

Review of Cs for Tomorrow 2018
Overview of Cs+ for Tomorrow 2021
During our previous management initiative from fiscal 2016 to 2018, we enjoyed relatively favorable
operating conditions such as exchange rates and feedstock prices. With firm business perfor-
mance overall, we achieved our financial targets. Net sales and operating income in fiscal 2018
each reached new record highs, and both profitability and capital efficiency exceeded our targets.
Regarding shareholder returns, we decided to perform our first share buyback in 17 years, and
our total return ratio for fiscal 2018 reached 39%, above the 35% we had targeted.
Long-term investments for future growth were a particular focus, and we adopted decisions on
some ¥670 billion over the 3-year period. We also worked to reinforce our operating foundations
with thorough compliance, development of human resources, and digital transformation, and we
will continue to expand and extend these efforts.
At the same time, we see new challenges ahead. We need to accelerate our efforts to provide
solutions to the world’s challenges. In the midst of dramatic changes in society and technological
advancement, our pace of new business creation and portfolio transformation needs to rise
commensurately.
Throughout the world, issues of sustainability are the subject of increasing concern, as evidenced
by the SDGs1 and ESG2. Under the new management initiative, Asahi Kasei expresses its stance
for contribution to sustainability as “Care for People, Care for Earth.” With this new “C” in addition
to the four “Cs” from the previous initiative, we adopted “Cs+” in the name.
1 The Sustainable Development Goals adopted by the United Nations in 2015.2 Environmental, social, and governance aspects of corporate management.
Care for People, Care for EarthNew “C”
ComplianceCommunication
Challenge
Connect“Cs” inprevious initiative
03Asahi Kasei Report 2019

This initiative reaffirms Asahi Kasei’s commitment to contribute to society by providing solutions
to social issues through our businesses. This has always been our path of growth, stated by our
founder Shitagau Noguchi, and enduring today in our Group Mission.
Our financial targets include operating income of ¥240 billion and an operating margin of 10%
in fiscal 2021. While our previous outlook for operating income in fiscal 2025 was ¥280 billion, this
was raised to ¥300 billion based on recent firm performance.
Other key performance indicators include
ROIC3 indicating investment efficiency, ROE indi-
cating capital efficiency, and EBITDA4 indicating
cash-flow generation.
To maintain a proactive pace of investments
for growth, we are planning a total of ¥800 billion
in long-term investments over the 3-year period.
While many businesses are very keen to invest,
we are selecting new investments by carefully
studying their potential returns to ensure that
they will contribute to increased corporate value.
The diversity of our businesses means that
a single standard doesn’t apply. Instead, we
prioritize based on a comprehensive judgment
of the risks, competitive environment, growth
strategy, and growth stage of each business,
and adopt investment decisions accordingly.
For shareholder returns, we intend to
maintain stable dividends while aiming to
continuously raise dividends through sustained earnings growth. Our basic standard is for a payout
ratio of 30–40%.
In addition to our financial targets, we have declared a new target for reduction of GHG
emissions relative to net sales. We aim to reduce this by 35% from the fiscal 2013 level by fiscal
2030. Aside from this target for the reduction of our own emissions, we will continue to proactively
advance businesses which contribute to reduced emissions around the world.
When we mapped our materiality in fiscal 2018, we identified the highest priority areas for
contributing to solutions for society through our businesses. Under the new management initiative
we specified 5 priority fields for provision of value, and are executing our growth strategies
accordingly.
In the Material business sector we are flexibly allocating management resources to the priority
fields of Environment & Energy to reduce environmental burdens, Mobility for safety and comfort,
3 (Operating income − income taxes) / average annual invested capital4 Operating income, depreciation, and amortization (tangible, intangible, and goodwill)
Providing solutions to society’s challenges through our businesses in all three sectors
Vision of our founder Shitagau Noguchi
As industrialists, we must always remember that our ultimate mission is to improve people’s standard of living by supplying an abundance of the highest-quality daily necessities at the lowest prices.
—1933
Message from the President
04 Asahi Kasei Report 2019

and Life Material for comfortable daily life. In the Homes business sector we are supporting
fulfilment and contentment in the priority field of Home & Living. In the Health Care business sector
we are contributing to healthy longevity in the eponymous priority field of Health Care.
By providing new value toward a sustainable society in all three sectors, we aim to achieve
sustainable growth in corporate value.
■ Greenhouse gas■ Wastewater■ Industrial waste
■ Biodiversity■ Social contribution
■ Global environment■ Health and longevity■ Comfortable life
■ Supply chain management■ Communication with stakeholders
■ Human resources■ Diversity■ Risk management
Highest priority for mapping above
■ Governance ■ Human rights
■ Compliance/sincerity■ Safety/quality
Businesscontribution to
■ Harmony with the environment ■ Living in health and comfort ■ Basic activity
Imp
orta
nce
for
stak
ehol
der
s
Importance for the Asahi Kasei GroupImportant
Extremelyimportant
Extremelyimportant
Materiality of the Asahi Kasei Group
Asahi Kasei Group’s priority fields for provision of value
Life Material Home &Living
Health CareMobilityEnvironment& Energy
Material Homes Health Care
05Asahi Kasei Report 2019

Ever since our founding, we have always discerned the needs of society in each age, and continu-
ously transformed our business portfolio focused on solutions that meet emerging changes. Asahi
Kasei’s strengths are our diversity and our capability to change. The diverse human resources,
businesses, and technologies we have today are the result of decades of tackling the world’s
challenges.
Now, in today’s fast-changing world, we need to pick up our pace and change more dynami-
cally than before. Otherwise we risk being left behind. Digital technology is no longer simply a tool
for performing tasks. The utilization of an ample amount of high-quality data can not only create
new business models but also transform the industrial structure.
In such an age of uncertainty, our portfolio in three business sectors with diverse human
resources and diverse technologies is a great strength as we execute our new growth strategy. It
will be vital for us to leverage our wide range of business fields to gain information across a broad
swath of industries and customer segments, and to combine our various technologies in new ways
as we exert the combined strength of the Asahi Kasei Group.
Asahi Kasei has created many unique products and technologies by combining various
know-how and technologies. We provide the venue for R&D personnel from throughout the group
to gather together for open-minded discussions among specialists in a wide variety of fields.
Such mutually stimulating exchanges lead to the creation of new value. In addition to information
exchange and collaboration, we transfer personnel across different sectors to gain synergy in many
different ways.
Creating new value through “diversity” and “capability to change”
Contributing tosustainable society
Grasping social needs,dynamic portfolio transformation,developing business that makes life better
Social need:
Establishment oflivelihood base
Social need:
Abundance of goods
Social need:
Comfort andconvenience
Social need:
Higher standard of livingin developing countries
1920s 1950s 1970s 2000s
Accelerationof globalization
Const. mat./homesHealthcareElectronic devices/materials
Petrochemicals/synthetic �bers
Chemical fertilizer/regenerated �ber/explosives
Diversity&
Capabilityto
change
Message from the President
06 Asahi Kasei Report 2019

Several concrete measures under the new management initiative will accelerate our pace of
change. We established Marketing & Innovation as a new organization to foster new business
creation from new perspectives straddling across different fields, without limitation based on our
existing technologies. At the same time, we reorganized our Material sector into fewer and larger
units to facilitate prioritized allocation of management resources.
We are also advancing digital transformation to dramatically raise productivity and speed. In
fiscal 2019 we established an Informatics Initiative within Corporate Research & Development, and
by March 2022 we plan to increase digital professional personnel to over 150 people.
To strengthen overseas operations, we are promoting the employment and development of
local management personnel while advancing business strategies in accordance with the charac-
teristics of each region.
We adopted “high profitability,” “high market growth,” “priority fields,” and “sustainability” as
four key perspectives to ensure that our ongoing business portfolio transformation generates
higher added value. Allocation of human resources and capital will be prioritized based on these
perspectives.
Taking stock of our core technologies and current R&D projects, we refined our focus. Efforts
for new business development are not only in-house—we are expanding corporate venture capital
(CVC) activities mainly on the US, while flexibly forming alliances with other companies, universities,
and governmental bodies, to advance quickly with a broad outlook.
M&A is also a crucially effective means to achieve strategic growth and to exit struggling fields.
We will continue to study and proactively execute opportunities.
By further leveraging connections both inside and outside the company, we will accelerate our
portfolio transformation and new business creation to achieve a portfolio of high-profitability and
high value-added businesses.
Demonstration facility for green hydrogen production in Herten, North Rhine-Westphalia, Germany
New business creation and business portfolio transformation
07Asahi Kasei Report 2019

In a rapidly changing world, we must be watchful of new risks emerging. We constantly review
changes as they develop to identify any risks.
Climate change risks are the subject of particular attention around the world. In May 2019 we
announced our support for the recommendations of the Task Force on Climate-related Financial
Disclosures (TFCD). We are currently analyzing our climate-related risks, and studying future
scenarios and what measures we should implement. Meanwhile we are intensifying our search
for more opportunities to apply our products and technologies to reduce the impact of climate
change.
We are also closely following changes in the situation of international commerce, such as trade
friction between the US and China, and the British withdrawal from the EU. While our overseas
We continue to enhance our corporate governance. Among the 9 members of our Board of
Directors, 3 are Independent Outside Directors. The Outside Directors actively take part in man-
agement by offering their opinions and suggestions from an objective external perspective based
on their experience and knowledge. They attend various briefings and events to deepen their
understanding of Asahi Kasei, and are given detailed explanation of items in the Board of Directors
agenda in advance.
Other than me, the Directors from inside the company include 2 with executive responsibility to
oversee technology functions and business management functions, and 3 with executive responsi-
bility to oversee each of the business sectors, respectively.
We have frank and unreserved discussions at Board of Directors meetings regarding each
business, and determine where to concentrate resources for expansion in accordance with
circumstances. Rather than the current optimum or even the overall optimum, we aim for the future
optimum for the Asahi Kasei Group as a whole.
With regard to succession planning, we have delineated attributes required of future leaders.
These include not only management ability and personal traits, but also the ability to make judg-
ments about the whole Asahi Kasei Group, not only their own field of business, which is essential
to a company like ours that has a wide variety of businesses. In order for such promising personnel
to better understand different businesses, we give them experience in various fields.
We now have non-Japanese members among our Executive Officers, including those who
joined the Asahi Kasei Group through acquisition. They offer opinions from a different perspective,
yet profoundly understand our corporate philosophy and strategic outlook. The Chairman of ZOLL,
for instance, is now also responsible for joint oversight of our whole Health Care sector.
Moving forward we will need to further leverage our global human resources, while promoting
more women and younger personnel. Such efforts to build a management team that can guide
our wide-ranging businesses through a period of dramatic change and pass the baton to the next
group are an essential facet of sustainably raising corporate value.
Strengthening management foundations to swiftly respond to risks
Corporate governance to tie diverse businesses together
Message from the President
08 Asahi Kasei Report 2019

During the 3-year period of our current management initiative, we can expect that changes
around the world will only accelerate. Asahi Kasei is changing as well, concentrating management
resources on businesses that contribute to the sustainability of society, with a clear awareness of
“Care for People, Care for Earth.” We will continue to advance connections inside and outside the
company as a vital source of strength through communication.
I truly believe that human resources are the most important key to success. No matter how
good a strategy is, success depends on the people who execute it. What sets Asahi Kasei apart
is our on-site strength based on our Group Values of Sincerity, Challenge, and Creativity. In each
business, and at each site, our employees take the initiative. By continuously taking challenges
to provide solutions to issues in society, by leveraging our diversity and our capability to change,
our people are driving the transformation to a portfolio of high-profitability and high value-added
businesses. This is how we will contribute to sustainable society for the benefit of all stakeholders.
Human resources as the most important key
operations have expanded through acquisitions and opening new sites, we are establishing a
flexible configuration for global operations considering various aspects of trade policy, supply chain
changes, and business continuity planning.
Digital transformation is a game changer. It’s an extremely fast field, and we need to take
appropriate steps to stay in front. Depending on how we handle information and build alliances
with other companies, it has the potential to open vast business opportunities.
Risk Management & Compliance serves as our organization for unified management of
individual business risks. Our strengths of quality and safety can also be risks. On-site compliance
and communication are the surest ways to nip risks in the bud. We will continue to further reinforce
our foundations for compliance and communication across the company.
09Asahi Kasei Report 2019

Contributing to sustainable societyProviding solutions to the world’s challenges
Sincerity, Challenge, Creativity
Internal and externalconnections/dialogue
High profitabilityReturn to
stakeholders
Businessdevelopment;
Innovation
Sustainable growth of corporate value
2 mutually reinforcing aspects of sustainability
Asahi Kasei’s Growth Strategy
New medium-term management initiative “Cs+ for Tomorrow 2021”
■ Vision and goals
10 Asahi Kasei Report 2019

Contributing to sustainable society
Contributing to life and living for people around the worldGroup Mission
Life Material Home &Living Health CareMobilityEnvironment
& Energy
Material
Reduced burden Safety andcomfort
Comfort andconvenience
Security andfulfillment
Healthylongevity
Homes Health Care
Priority fieldsfor provisionof value
Strengths
Care for People, Care for EarthNew “C”
Employee action principles
“Cs” inprevious initiative
ComplianceCommunication
Challenge
Creating new value
Connect
Diversity & Capability to change
New perspective: “Care for People, Care for Earth”
Asahi Kasei has advanced in accordance with its Group Mission of contributing to life and living for people around the world. As the world faces many challenges for a sustainable society, we will continue to provide new value by leveraging our strengths of “diversity” and “capability to change.”
■ Value creation concept
11Asahi Kasei Report 2019

Sustainable profit growth exceeding global GDP growth
“Portfolio of high-profitability and high value-added businesses”
2015 (FY)
(¥ billion) (¥ billion)
Operating cash flow
3-year total
¥600 to ¥700 billion
Capital expenditure
3-year total
≈¥800 billion(decision-adopted basis, including M&A)
Shareholder returns
Grow dividends per shareas earnings expand
payout ratio around30 to 40%
0
100
200
300
400
500
2016 2017 2018
165.2
Operating income Net sales
159.2
198.5209.6
2021target
Operating income
¥240 billion
2025outlook
≥¥300 billion
1,200
1,800
2,400
3,000
New target
Operating margin
10%
EBITDA margin
15%
Next stage
Operating margin
≥10%
EBITDA margin
≥16%
Note: Exchange rate assumptions are ¥110/$ and ¥130/€
0
600
Ope
ratin
g in
com
e
Net sales
New medium-term management initiative “Cs+ for Tomorrow 2021”
■ Financial objectives
(¥ billion, unless otherwise specified)
FY2015 FY2018 FY2021 target18–21 annual growth
FY2025 outlook
Net sales 1,940.9 2,170.4 2,400.0 3,000.0
Profitability
Operating income 165.2 209.6 240.0 4.6% ≥300.0
Operating margin 8.5% 9.7% 10.0% ≥10.0%
EBITDA1 274.8 313.6 370.0 5.7% ≥480.0
EBITDA margin 14.2% 14.5% 15.4% ≥16.0%
Net income attributable to owners of the parent 91.8 147.5 180.0
EPS (¥) 66 106 130 7.2%
Capital efficiency
ROIC2 7.9% 8.8% 9.0%
Net income per shareholders’ equity (ROE) 8.6% 11.1% 11.1%
Financial health
D/E ratio 0.43 0.31 ≈0.5
Exchange rate (¥/$) 120 111 110
1 Operating income, depreciation, and amortization (tangible, intangible, and goodwill)2 (Operating income − income taxes) / average annual invested capital
Aiming for FY2021 level or above
12 Asahi Kasei Report 2019

(2013=100)
0
25
50
75
100
2013 2018 2030 (FY)
(index)
35% reduction
Portfolio of high-profitability and high value-added businesses
Business portfolio transformation & new business creation
4 perspectivesof judgement
Creating for Tomorrow
High profitability
Priority fields
Highmarket growth
Sustainability
Various coretechnologies
Marketingfunctions
Connections
Toward a sustainable society
Reducing our own GHG emissions
• Further reduction in GHG emissionsInstalling lower-emission equipment, optimizing plant operation
• Businesses that contribute to energy conservation and reduced GHG emissions
Battery separators, lightweighting resins,net zero energy houses, CO2 sensors, etc.
• Technology development/commercialization for clean environmental energy
Green hydrogen production, CO2 chemistry, etc.
• Greater use of low-carbon energyIncreasing renewables and LNG
• R&D for further GHG reduction
Contributing to reduce the world’s GHG emissions
■ Company-wide actions and building the base
GHG emissions/net sales
13Asahi Kasei Report 2019

Increase digital professional personnel to over 150 peopleby March 2022 to accelerate digital transformation
Heightening by digital transformation Strengthening global operations
EU
India ASEAN
China US
Leading region of environmentaland automotive trends
Enormous market
Potential growth marketPotential growth market
Major production sites
Source of new business models
Leading region of health care
FY18 FY25Average annual sales growth rate +11%
Strengthen the IT infrastructure(data platform, tools, human resources)
MaterialsInformatics▼
Dramatically improvingdevelopment speed
ProductionTechnology Innovation▼
Enhancing productivityby IoT
IP Landscape
▼Formulating strategies
based on IP
DigitalMarketing▼
Establishing an effectiveand efficient strategy
(¥ billion)
FY2018 FY2021target
FY2025outlook
FY2018 FY2021target
FY2025outlook
FY2018 FY2021target
FY2025outlook
Material
200(figures are approximate)
100
0
Expansion of high value-added businesses
* Fibers, synthetic rubber, engineering plastics, coating materials, ion-exchange membranes, electronic materials, consumables, battery separators, electronic devices, etc.
Commodity businesses(earnings base)
High value-addedbusinesses*
80 105
135
Environment & Energy
Life MaterialMobility
Clean energy
Battery separators
Alkaline water electrolysis systemto produce green hydrogen
Energy conservation/environmental improvement
CO2 sensors
Water filtration modules
Ion-exchange membranes
Low-carbon society
Next-generation CO2 chemistry
New CO2 separation/recovery system
Care for Earth
Safety and security
Airbag material
Alcohol sensor
Contactless pulse sensing
Comfortable space
LamousTM artificial suede
Low-VOC* material
A/C CO2 sensors
Fuel economy
S-SBR for tires
Lightweighting materials
Lead-acid battery separator
EV/HEVLIB separator
LIB-related material
Care for People Care for Earth
Comfort/convenience
Disposable diaper material
5G-related (glass fabric, etc.)
Regenerated cellulose fiber
Health
Pharmaceutical/food additives
UVC LEDs for disinfection
Reducing food loss/reduced environmental burden
Saran WrapTM
ZiplocTM
Water-washable printing plates
Care for People Care for Earth
* Volatile organic compounds
Homes
Health Care
New businesses
(¥ billion)100
50
0
Profit growth in overseas markets
(¥ billion)100
(figures are approximate)
(figures are approximate)
50
0
New businesses and servicesto drive growth
17 27
Health Care
Care for People
TreatmentAcute conditions (critical care, circulatory)
RecomodulinTM, ThermogardTM, therapeutic apheresis, defibrillators,LifeVestTM, acute myocardial infarction, stroke
Chronic conditions (orthopedics, dialysis)
TeriboneTM, ReclastTM, KevzaraTM, dialysis,autoimmune disease, pain relief
BiosafetySupporting the safety ofbiotherapeutics
Virus removal filters
Bioprocess equipment
Home & Living
Safety/security
60-year long-life homes
Disaster-resistance
Long-term retention of asset value
Comfort/health
Living in a good thermal environment
Diverse modes of residence
Environment
Net zero energy houses/photovoltaic power
High-performance insulation
Care for People Care for Earth
Blue indicates under development
RemodelingRental managementBrokerage
OverseasSeniorsMedium-rise
Critical careBioprocessNew areas
44
Services
Overseas
Order-built/condominiums
Construction Materials
35
44
65
Japan
FY18 FY25Average annual sales growth rate +6%
FY18 FY25Average annual sales growth rate +10%
Ope
ratin
g in
com
e
Ope
ratin
g in
com
eO
pera
ting
inco
me
New medium-term management initiative “Cs+ for Tomorrow 2021”
■ Strategy by sector
14 Asahi Kasei Report 2019

Increase digital professional personnel to over 150 peopleby March 2022 to accelerate digital transformation
Heightening by digital transformation Strengthening global operations
EU
India ASEAN
China US
Leading region of environmentaland automotive trends
Enormous market
Potential growth marketPotential growth market
Major production sites
Source of new business models
Leading region of health care
FY18 FY25Average annual sales growth rate +11%
Strengthen the IT infrastructure(data platform, tools, human resources)
MaterialsInformatics▼
Dramatically improvingdevelopment speed
ProductionTechnology Innovation▼
Enhancing productivityby IoT
IP Landscape
▼Formulating strategies
based on IP
DigitalMarketing▼
Establishing an effectiveand efficient strategy
(¥ billion)
FY2018 FY2021target
FY2025outlook
FY2018 FY2021target
FY2025outlook
FY2018 FY2021target
FY2025outlook
Material
200(figures are approximate)
100
0
Expansion of high value-added businesses
* Fibers, synthetic rubber, engineering plastics, coating materials, ion-exchange membranes, electronic materials, consumables, battery separators, electronic devices, etc.
Commodity businesses(earnings base)
High value-addedbusinesses*
80 105
135
Environment & Energy
Life MaterialMobility
Clean energy
Battery separators
Alkaline water electrolysis systemto produce green hydrogen
Energy conservation/environmental improvement
CO2 sensors
Water filtration modules
Ion-exchange membranes
Low-carbon society
Next-generation CO2 chemistry
New CO2 separation/recovery system
Care for Earth
Safety and security
Airbag material
Alcohol sensor
Contactless pulse sensing
Comfortable space
LamousTM artificial suede
Low-VOC* material
A/C CO2 sensors
Fuel economy
S-SBR for tires
Lightweighting materials
Lead-acid battery separator
EV/HEVLIB separator
LIB-related material
Care for People Care for Earth
Comfort/convenience
Disposable diaper material
5G-related (glass fabric, etc.)
Regenerated cellulose fiber
Health
Pharmaceutical/food additives
UVC LEDs for disinfection
Reducing food loss/reduced environmental burden
Saran WrapTM
ZiplocTM
Water-washable printing plates
Care for People Care for Earth
* Volatile organic compounds
Homes
Health Care
New businesses
(¥ billion)100
50
0
Profit growth in overseas markets
(¥ billion)100
(figures are approximate)
(figures are approximate)
50
0
New businesses and servicesto drive growth
17 27
Health Care
Care for People
TreatmentAcute conditions (critical care, circulatory)
RecomodulinTM, ThermogardTM, therapeutic apheresis, defibrillators,LifeVestTM, acute myocardial infarction, stroke
Chronic conditions (orthopedics, dialysis)
TeriboneTM, ReclastTM, KevzaraTM, dialysis,autoimmune disease, pain relief
BiosafetySupporting the safety ofbiotherapeutics
Virus removal filters
Bioprocess equipment
Home & Living
Safety/security
60-year long-life homes
Disaster-resistance
Long-term retention of asset value
Comfort/health
Living in a good thermal environment
Diverse modes of residence
Environment
Net zero energy houses/photovoltaic power
High-performance insulation
Care for People Care for Earth
Blue indicates under development
RemodelingRental managementBrokerage
OverseasSeniorsMedium-rise
Critical careBioprocessNew areas
44
Services
Overseas
Order-built/condominiums
Construction Materials
35
44
65
Japan
FY18 FY25Average annual sales growth rate +6%
FY18 FY25Average annual sales growth rate +10%
Ope
ratin
g in
com
e
Ope
ratin
g in
com
eO
pera
ting
inco
me
15Asahi Kasei Report 2019

From 1922Shitagau Noguchi, the founder of Asahi Kasei, succeeded in Japan’s first industrial production of ammonia by chemical synthesis in Nobeoka, Miyazaki, in 1923 using technology licensed from Italy. The ammonia was used in the production of Bemberg™ cupro fiber, part of a diverse range of business operations that included chemical fertilizer and viscose rayon. As industry modernized and the economy of Japan achieved self-sustainable growth, our operations made important contribu-tions to the stability of people’s lives.
Part of the ammonia plant completed in 1923 (Nobeoka, Miyazaki, Japan)
Saran Wrap™ launched in Japan in 1960
The first Hebel Haus™ (Kamata model home park)
The Bemberg™ plant which started operation in 1931 (Nobeoka, Miyazaki, Japan)
Founder:Shitagau Noguchi
Naphtha cracker (Kurashiki, Okayama, Japan)
Hollow-fiber membrane artificial kidneys
LSIs
From 1950In 1957 we began production of polysty-rene, and in 1959 entered the synthetic fiber business. These were followed by the three new businesses of nylon fiber, synthetic rubber, and construction mate-rials. In 1968 we began construction of a petrochemical complex in the Mizushima area of Kurashiki, Okayama, Japan, paving the way for our full-scale develop-ment of petrochemical operations. Our products during this period supported improvements in the quality of life during Japan’s high-growth period.
From 1970In 1972 we entered the homes business with the launch of the Hebel Haus™, and in 1974 we entered the medical device business with hollow-fiber membrane artificial kidneys. Our entry into the elec-tronics business began with our launch of Hall elements (magnetic sensors) in 1980 and start of LSI manufacture in 1987. Our products continued to help make life more comfortable and convenient as society’s needs diversified.
Portfolio transformation
Establishing the basis for modern life
Sufficiency of daily necessities, improvement in quality of homes, development of public infrastructure
Fiscal 1940
Net sales
¥56 million
Fiscal 1960
Net sales
¥44.9 billion
FibersChemicals
Foods
Fiscal 1980
Net sales
¥800.1 billion
Fibers
Chemicals
Homes
ConstructionMaterials
Foods andFermentation Chemistry
Others
● Development of chemical industry and modern agriculture
● Interbellum economic downturn and World War II
● Post-war recovery and modernization of industry
● Period of high economic growth
● Stable economic growth● Economic bubble
Business Portfolio Transformation Providing Solutions to SocietyThe Asahi Kasei Group has consistently grown through proactive transformation of its business portfolio to meet the evolving needs of every age. We have constantly provided products and services that form solutions to various environmental and social challenges. As society undergoes further changes, we will continue to contribute to life and living for people around the world by Creating for Tomorrow.
16 Asahi Kasei Report 2019

Pharmaceuticals just after the Toyo Jozo merger
The LifeVest™ wearable defibrillator of ZOLL Dinamica™ automotive interior material of Sage (made with Lamous™ artificial suede)
Asahi Kasei Electronics Materials (Suzhou) Co., Ltd., a major manufacturing base for photosensitive dry film
Celgard™ Li-ion battery separator of Polypore
From 1990In 1992 we acquired Toyo Jozo Co., Ltd. to reinforce pharmaceutical operations. From 1999, we executed a program to heighten selectivity and focus in operations, divesting our food business and closing some fiber businesses, achieving selective diversification. From 2000 onward, we also established many overseas operations, mainly in Asia, laying the foundation for global management.
From 2010Major overseas acquisitions drove the proactive expansion of our operations. We acquired ZOLL Medical Corporation, US manufacturer of medical devices for acute critical care, in 2012; Polypore International LP, US manufacturer of battery separators, in 2015; and Sage Automotive Interiors, Inc., US manufac-turer of automotive interior materials, in 2018. Our Cs+ for Tomorrow 2021 medium-term management initiative launched in fiscal 2019 focuses on “sus-tainability” by contributing to sustainable society while achieving sustainable growth of corporate value.
Increased comfort and convenience Heightened environmental consciousness, evolution of ICT
We are Creating for Tomorrow, providing new value to society by enabling living in health and comfort
and harmony with the natural environment
Fiscal 2000
Net sales
¥1,269.4 billion
Fibers
Electronics
Health Care
Others
ConstructionMaterials
Homes Chemicals
Fibers
Homes
ConstructionMaterials
Electronics
Health Care
Critical CareOthers
Chemicals
Fiscal 2018
Net sales
¥2,170.4 billion
● Two decades of meager growth after collapse of bubble
● Effect of global economic crisis
● Reduced dependence on fossil fuels, greater use of renewables● The fourth industrial revolution by IoT, AI, Big Data, etc.
17Asahi Kasei Report 2019

Catalysis/inorganicsynthesis
Compoundsemiconductors
Softwarealgorithms
Foam insulation
Anti-quake/construction
methods/anti-fire/durability
Biopharmaceuticals
Biologicalinformationprocessing
Virus removal/blood purification
Phase separation/electrochemistry
Polymerization/spinning/cellulose
Functionalpolymer
Polymer design/polymerization/
processing
Chemicalprocess
Accumulated andacquired technologies
Health Care
Material Compound Semiconductors & LSIs
Catalysts & Processes
Polymers & Processing
Fibers & Textiles
Membranes & Separation
Homes & Construction Materials
Electronic compass
Homes
Global No. 1
Magnetic sensor
Global No. 1
Condominiums
No. 1 for condominiumredevelopment in Japan1
Hebel™ autoclaved aeratedconcrete (AAC)
No. 1 sales volume in Japan2
Planova™ virus removal filters
世界 No.1
Wearable defibrillator
Global No. 1
Professional defibrillator
Global No. 1
Ion-exchange membranes
Global No. 1
Bemberg™ cupro fiber
Global No. 1
Synthetic rubber forfuel-efficient tires
Global No. 1
Acrylonitrile
Global No. 2
Daramic™lead-acid battery separator
Global No. 1
Hipore™ & Celgard™Li-ion battery separator
Global No. 1
1 As of April 11, 2018, based on number of reconstruction association permits issued in accordance with Japan’s Act on Facilitation of Reconstruction of Condominiums, according to research by Industrial Marketing Consultants Co., Ltd.
2 Thick panels and thin panels in total, according to internal research.
Health Care
Competitive Products and BusinessesAdvancing various businesses to meet the needs of the world, we have accumulated and acquired a wide range of competitive technologies, products, and businesses.
18 Asahi Kasei Report 2019

Catalysis/inorganicsynthesis
Compoundsemiconductors
Softwarealgorithms
Foam insulation
Anti-quake/construction
methods/anti-fire/durability
Biopharmaceuticals
Biologicalinformationprocessing
Virus removal/blood purification
Phase separation/electrochemistry
Polymerization/spinning/cellulose
Functionalpolymer
Polymer design/polymerization/
processing
Chemicalprocess
Accumulated andacquired technologies
Health Care
Material Compound Semiconductors & LSIs
Catalysts & Processes
Polymers & Processing
Fibers & Textiles
Membranes & Separation
Homes & Construction Materials
Electronic compass
Homes
Global No. 1
Magnetic sensor
Global No. 1
Condominiums
No. 1 for condominiumredevelopment in Japan1
Hebel™ autoclaved aeratedconcrete (AAC)
No. 1 sales volume in Japan2
Planova™ virus removal filters
世界 No.1
Wearable defibrillator
Global No. 1
Professional defibrillator
Global No. 1
Ion-exchange membranes
Global No. 1
Bemberg™ cupro fiber
Global No. 1
Synthetic rubber forfuel-efficient tires
Global No. 1
Acrylonitrile
Global No. 2
Daramic™lead-acid battery separator
Global No. 1
Hipore™ & Celgard™Li-ion battery separator
Global No. 1
1 As of April 11, 2018, based on number of reconstruction association permits issued in accordance with Japan’s Act on Facilitation of Reconstruction of Condominiums, according to research by Industrial Marketing Consultants Co., Ltd.
2 Thick panels and thin panels in total, according to internal research.
Health Care
FY2018Net sales
¥2,170.4 billion
Material54.7%
Health Care14.7%
Homes30.7%
FY2018Operating income
¥209.6 billion
Material54.1%
Health Care17.5%
Homes28.5%
At a GlanceThe Asahi Kasei Group operates business in the three sectors of Material, Homes, and Health Care. The “Cs for Tomorrow 2018” medium-term management initiative focused on raising corporate value through optimal allocation of management resources across the three sectors. The new initiative for the three-year period from April 2019, “Cs+ for Tomorrow 2021” focuses on contributing to a sustainable society while achieving sustainable growth of corporate value. (see p. 10 for more)
■ Fiscal 2018 net sales and operating income
New record highs in both net sales and operating income
Percentages shown exclude “Others” category and “corporate expenses and eliminations”
19Asahi Kasei Report 2019

Global Executive Interview
What do you see as Asahi Kasei’s strengths, and where do you see further potential?
One of the many strengths of Asahi Kasei is how we develop our top people; we give them the opportunity to gain respon-sibilities in completely different areas than what they are used to. Talented personnel will experience various jobs within the company; for example, we have someone who worked in R&D for construction materials for a long time, and now he’s doing a great job as the CEO of an overseas subsidiary in a totally different field. Very few Western companies would do that. Asahi Kasei has the vision to say, “Hey! This person has a lot of capability, let's go see what they can do.” Sometimes the top leaders are able to expand their own boundaries. You couldn’t do that in the US, where the job structure is like Tetris, with all the pieces fitting nicely together. At Asahi Kasei, it’s more like an ameba, where the boundaries and responsibilities of your job can merge together. For people who are top performers, I am happy to say we offer almost unlimited potential to grow. I myself spent 24
John Moyer, Senior Executive Officer of Asahi Kasei Corp. and Chairman/CEO of Asahi Kasei Plastics North America, Inc., shares his view on the strengths of Asahi Kasei and describes group-wide initiatives in North America.
years in manufacturing at the Dow Chemical Company before joining Asahi Kasei Plastics as President in 2005. It was an extraordinary opportunity for me. That said, Asahi Kasei has even more potential to grow if they continue to focus on the following: utilizing more of the talent we have in women, letting younger people have more authority to make decisions earlier in their careers, and giving local employees at overseas sites more responsibility— especially in Europe and Asia. I know Asahi Kasei’s management is aware of this, and it’s changing. I’ve seen it change a lot in my 14 years here, but we need to press further. That would make us a better global company.
What kind of group-wide initiatives are being implemented to generate synergies across Asahi Kasei operations in North America?
We’ve grown to about 7,000 employees and about $2 billion revenue in North America, so now we have a critical mass. This growth is mostly from M&A and the growth of the companies Asahi Kasei purchased. For example, ZOLL which has tripled in size since Asahi Kasei purchased it.
John W. MoyerSenior Executive OfficerAsahi Kasei Corp.Chairman/CEOAsahi Kasei Plastics North America, Inc.
20 Asahi Kasei Report 2019

Asahi Kasei’s style is to let each company align with the business unit in Japan—not by region. Each company is independent in North America so creating synergy among us is a big challenge. We, however, see great advantages in working together as a team under the Group, to integrate various functions, learn each other’s excellent know-how, and so on. Those initiatives have been bearing fruit in such areas as human resources, finance, insurance, IT systems, procurement, and logistics. We are now setting up teams for Maintenance and EHS (Environment, Health, and Safety). These synergies are voluntary, but I think we have shown a lot of value. These days we are also doing more and more to build positive growth, such as marketing activity in the automotive field combining Sage, Celgard, Daramic, Asahi Kasei Plastics North America, Crystal IS, and even some venture companies from CVC (Corporate Venture Capital). We also want to give people the chance to gain experi-ence by moving around different Asahi Kasei companies in North America. All of these initiatives are only possible through a network of leaders who know one another and understand the different businesses. This year, we had a gathering with President Kobori and North American leaders in a larger, more diverse group than ever. We had a total of 95 people gather for a 1 ½ day summit from 14 different Asahi Kasei North American companies and executives coming from Japan. Each company made a presentation on its strategies, goals and challenges. We also had group discussions on several business themes. The meeting really helped to develop relationships that will drive further synergies as Team Asahi Kasei.
What is your view of Asahi Kasei’s management as an Executive Officer of the company and CEO of a US subsidiary?
Asahi Kasei takes a long-term perspective when it makes business decisions, which is a very good thing. When you make a decision, there are several discussions along with detailed examinations. It may take time, but when it comes to implementation, it goes fast because everybody understands its purpose and value. However, it sometimes seems to me that simpler decisions which could be made faster end up following the same process, too. In the US, we deliberate on complicated issues but overall we make a decision faster than a traditional Japanese com-pany. Sometimes the downside is when we move fast and the rest of the people in the company do not understand it nor are ready to change, so implementation can take longer. If we could design “hybrid” business culture in Asahi Kasei that takes the positive attributes of both Japanese and Western business styles, this would give us a great advan-tage. If some decisions could be pushed down to a lower level, you would be able to make simple decisions faster. It is not easy to make a good balance, but I believe we can find a way by understanding positive and negative sides of both styles and applying them according to the situation.
I’ve seen Asahi Kasei change tremendously compared to 14 years ago when I joined. We are much more focused on growth and aggressively advancing strategies through large M&A and capital expenditure. The company is aware of the need to further open up to different cultures and diversify its leadership. I look forward to seeing this happen.Team AK Meeting held in the US
21Asahi Kasei Report 2019

Financial and Non-Financial Highlights
The highest ever net sales and operating income were recorded in fiscal 2018, with operating income growth mainly in the Material sector. The operating margin is gradually increasing. Overseas sales reached approximately 40% of total net sales in fiscal 2018 with expansion of overseas business, including through M&A.
0
500
1,000
1,500
2,000
2,500
0
60
120
180
240
300
Domestic sales
Overseas sales
(¥ billion) (¥ billion) (%)
Operatingincome
Operatingmargin
2014 2015 2016 2017 2018
1,986.4
8.0 8.5 8.59.7
157.9
0
5
10
15
20
25
9.7
1,940.9
165.2
1,883.0
159.2
2,042.2
198.5
2,170.4
209.6
(FY)
Net sales (domestic & overseas), operating income, operating margin
Although fiscal 2018 net income attributable to owners of the parent decreased from the record-high level of fiscal 2017, this was largely attributable to the US tax reform which temporarily reduced income tax expenses in fiscal 2017, and the fiscal 2018 result was maintained at a high level. Increased ROE is pursued by raising profitability.
Net income attributable to owners of the parent ROE(¥ billion) (%)
0
50
100
150
200
2014 2015 2016 2017 20180
5
10
15
20
105.7
10.691.8
8.6
115.0
10.5
170.2
14.0
11.1
147.5
(FY)
Net income attributable to owners of the parent, ROE
* Operating income, depreciation, and amortization (tangible, intangible, and goodwill)
The amount of depreciation and amortization is increasing with proactive capital expenditures and M&A activity. EBITDA is regarded as a key performance indicator (KPI) signifying the generation of cash flow. The decrease in depreciation and amortization in fiscal 2018 resulted from a change in the method of depreciation of property, plant and equipment from the declining-balance method to the straight-line method.
0
100
200
300
400
EBITDA Depreciation and amortization (tangible, intangible, and goodwill) EBITDA margin(¥ billion) (%)
2014 2015 2016 2017 20180
5
10
15
20
253.3
12.814.2
95.4
274.8
14.3
109.6
268.415.3
109.2
311.9
113.5
14.5
313.6
104.0
(FY)
EBITDA*, depreciation and amortization (tangible, intangible, and goodwill), and EBITDA margin
Both total assets and the book value of goodwill are increasing with large-scale acquisitions such as Polypore International, LP in fiscal 2015 and Sage Automotive Interiors, Inc. in fiscal 2018.
0
1,000
2,000
3,000Total assets Book value of goodwill(¥ billion)
2014 2015 2016 2017 2018
2,014.5
153.8
2,211.7
305.1
2,254.5
285.6
2,307.2
252.7
2,575.2
319.9
(FY)
Total assets, book value of goodwill
While interest-bearing debt increased in fiscal 2015 and fiscal 2018 to fund acquisitions, the D/E ratio of 0.31 at the end of fiscal 2018 is considered to indicate a sound financial condition.
Interest-bearing debt D/E ratio (¥ billion)
0
100
200
300
400
500
2014 2015 2016 2017 20180.00
0.10
0.20
0.30
0.40
0.50
269.00.25
449.70.43 402.8
0.35301.7
0.23
424.9
0.31
(FY)
Interest-bearing debt, D/E ratio
Proactive investments are focused on growth fields in each segment, such as capital expenditure to expand production capacity in Material and R&D in Health Care.
0
50
100
150Capital expenditure R&D expenses(¥ billion)
2014 2015 2016 2017 2018
89.1
75.5
99.0
81.190.6
79.6
101.3
85.7
136.2
90.1
(FY)
Capital expenditure, R&D expenses
■ Financial ■ Non-Financial
22 Asahi Kasei Report 2019

* Data for Asahi Kasei Group companies in Japan and overseas performing the Responsible Care program (see page 41).
Management resources are proactively invested for the global envi-ronment, operational safety, workplace safety, hygiene, and health as preeminent management tasks.
Environmental investment Safety investment(¥ billion)
0
2
4
6
8
10
2014 2015 2016 2017 2018
2.78
2.42
5.25
2.63
3.35
2.03
3.30
2.98
6.71
5.20
7.88
5.38
6.28
9.52
2.81
(FY)
Environmental and safety investment*
* Results for personnel employed by Asahi Kasei Corp., Asahi Kasei Microdevices Corp., Asahi Kasei Homes Corp., Asahi Kasei Construction Materials Corp., Asahi Kasei Pharma Corp., and Asahi Kasei Medical Co., Ltd. (Asahi Kasei Chemicals Corp., Asahi Kasei Fibers Corp., and Asahi Kasei E-materials Corp. included in FY2014 and FY2015).
Parental leave is made available through the fiscal year in which the child turns three years old. Over 40% of the qualified male employees have taken parental leave for four consecutive years since fiscal 2015.
Women Men
0
100
200
300
400
500
600
700
2014 2015 2016 2017 2018
231
226
316
240
316
266
346
236
392457
556582 582
631
239
(FY)
Employees using parental leave*
* Results as of June 30 each year for personnel employed by Asahi Kasei Corp., Asahi Kasei Microdevices Corp., Asahi Kasei Homes Corp., Asahi Kasei Construction Materials Corp., Asahi Kasei Pharma Corp., and Asahi Kasei Medical Co., Ltd. (Asahi Kasei Chemicals Corp., Asahi Kasei Fibers Corp., and Asahi Kasei E-materials Corp. included in FY2015).
A workplace environment that allows people from diverse backgrounds to work positively and energetically is considered to be essential for sustainable business growth. For this purpose, various measures are advanced to nurture and promote female personnel to positions of organizational management.
0
100
200
300
400
500
600
700
2015/6 2016/6 2017/6 2018/6 2019/6
454500
534575
622
Number of women working as managers*
* Indexed to GHG emissions from production processes (tons-CO2 equivalent)/net sales (¥ billion) in FY2013 as 100. Data for Asahi Kasei Group companies in Japan and overseas performing the Responsible Care program (see page 41).
Under the new medium-term management initiative, Asahi Kasei is targeting a 35% decrease in the index of GHG emissions/net sales from the fiscal 2013 level. Various efforts to further reduce emissions are being applied to achieve this target.
(Index)
0
20
40
60
80
100
2014 2015 2016 2017 2018
9692
85
7772
(FY)
Greenhouse gas (GHG) emissions/net sales*
* Average for applicable Group companies in each fiscal year.
Asahi Kasei Ability Corp. was established as a special subsidiary for the employment of persons with disabilities. Recruitment activities also continue to increase the employment of persons with disabilities at Group companies other than Asahi Kasei Ability.
Asahi Kasei Ability Corp.
Other than Asahi Kasei Ability Corp.
Rate of employment
(%)Legal minimum
0
100
200
300
400
500
600
2014 2015 2016 2017 20180.00
1.80
1.90
2.00
2.10
2.20
2.30
2.06
489
179
310
2.06
511
190
321
2.21
548
211
337
2.24
560
224
335
2.23
574
195
379
(FY)
Employment of persons with disabilities*
Net cash flow provided by operating activities decreased in fiscal 2018 with higher income taxes paid and an increase in operating funds accompanying strong business performance. Net cash flow used in investing activities increased with greater capital expenditure and the acquisition of Sage Automotive Interiors, Inc.
–300
–200
–100
0
100
200
300Operating cash �ow Investing cash �ow Free cash �ow(¥ billion)
2014 2015 2016 2017 2018
137.6
–100.5
37.1
216.2
–285.3
–69.1
169.0
–89.9
79.0
249.9
–110.3
139.6
212.1
–198.9
13.1
(FY)
Operating cash flow, investing cash flow, free cash flow
23Asahi Kasei Report 2019

Interview with the CFO
The Asahi Kasei Group has grown through dynamic expansion into peripheral businesses and creation of new businesses by identifying business opportunities presented by changes in society’s issues and market needs. We will celebrate our centenary in 2022, and throughout our history we have continuously shifted financial and human resources from mature markets and businesses to markets with new needs. This proactive shifting of resources is the source of the Asahi Kasei Group’s sustainable growth. When entering
a new field, we don’t only look at the market scale and rate of growth. We analyze the market and the competition to find our own unique ability to provide added value, focusing on fields where we can succeed. By repeating this process, we have continuously grown as a company having a unique portfolio of high value-added businesses. Our people and management know-how to effect such change, and the distinctive diversity of our operations, are the strengths that support our growth and the fount of our value.
During the 3-year period of our previous management initiative, we adopted decisions on a total of some ¥670 billion in long-term investments, mainly to expand competitive businesses and to enter new growth markets. Notable investments were to expand capacity for lithium-ion battery
separators and to perform a large-scale acquisition of Sage Automotive Interiors of the US. This acquisition will enhance our ability to capture growth opportunities from the transfor-mation of automotive markets referred to as CASE*. In our new management initiative “Cs+ for Tomorrow
Framework for capital allocation (FY2019–FY2021 3-year period)Financing for growth
(while maintaining financial discipline)Pursuing returns above cost of capital
Share buybacks performed flexiblyaccording to circumstances
Operating cash flow
3-year total
¥600 to ¥700 billion
Borrowing capacity
D/E ratio around 0.5Increase in interest-bearing debt
¥200 to ¥400 billion
Capital expenditure
3-year total
≈¥800 billion(Decision-adopted basis, including M&A)
Shareholder returnsGrow dividends per share
as earnings expand
Payout ratio around 30 to 40%
■ Asahi Kasei Group’s source of growth
■ Financial strategy for sustainable growth
Yutaka ShibataDirector, Vice-Presidential Executive Officer
Leveraging our strengths of “diversity” and “capability to change” we are investing for growth to raise corporate value and increase dividends.
24 Asahi Kasei Report 2019

Our results in fiscal 2018 exceeded our May 2018 forecast, and considering the state of our cash flow we decided to perform our first share buyback in 17 years. Our total return ratio in fiscal 2018 was 39%, above the 35% targeted in the previous initiative. For shareholder returns we will mainly focus on dividends, with our policy of aiming for stable dividends and continuous dividend increases unchanged. We will continue to consider share buybacks based on the state of our financial perfor-mance and cash flow. We intend to further enhance share-holder returns by achieving sustainable business growth, increased earnings, and continuous dividend increases.
2021” we will continue to proactively invest in selected fields. Many of our businesses continue to be eager to invest, and we will continue to study M&A opportunities for further growth. Although uncertainty in the global economic outlook due to US-China trade friction and the slowdown in Chinese economic growth pose investment risks, we still see many growth opportunities in our targeted markets and fields. We must continue to invest in order to securely capture these growth opportunities. My responsibility as CFO is to ensure that our financial structure enables such long-term investments to support the Asahi Kasei Group’s sustainable growth. While reinforcing competitive businesses to increase our cash flow, we seek optimum allocation of resources. We expect operating cash flow over the 3-year period of the new management
initiative to total ¥600 to ¥700 billion, providing resources to invest for growth. In addition, by borrowing within a range that maintains our healthy balance sheet, we are positioned to make some ¥800 billion of long-term investments over the 3-year period, including M&A. We strictly evaluate each potential investment in terms of ROIC and other measures, while judging whether they contribute to sustainable growth. We also adopted a new target for EBITDA. Asahi Kasei follows Japanese accounting standards, so goodwill from acquisitions is amortized. Because we plan to continue to use M&A as a means of further growth, the EBITDA target was adopted to enable appropriate evaluation of our perfor-mance unaffected by amortization of goodwill.
* Connected, Autonomous, Shared, Electric
FY2014 FY2015 FY2016 FY2017 FY2018
EBITDA1 (¥ billion) 253.3 274.8 268.4 311.9 313.6
Net cash provided by operating activities (¥ billion) 137.6 216.2 169.0 249.9 212.1
Net cash used in investing activities (¥ billion) (100.5) (285.3) (89.9) (110.3) (198.9)
Free cash flows (¥ billion) 37.1 (69.1) 79.0 139.6 13.1
Net income per share (EPS) ¥75.62 ¥65.69 ¥82.34 ¥121.93 ¥105.66
Net income per total assets (ROA) 5.4% 4.3% 5.1% 7.5% 6.0%
Net income per shareholders’ equity (ROE) 10.6% 8.6% 10.5% 14.0% 11.1%
Net income per net sales (ROS) 5.3% 4.7% 6.1% 8.3% 6.8%
Total asset turnover ratio 1.01 0.92 0.84 0.90 0.89
Financial leverage 2.0 2.0 2.0 1.9 1.8
Net income per shareholders’ equity and interest-bearing debt (ROIC)2 8.3% 7.9% 7.8% 9.7% 8.8%
D/E ratio 0.25 0.43 0.35 0.23 0.311 Operating income, depreciation, and amortization (tangible, intangible, and goodwill)2 (Operating income − income taxes) / average annual invested capital
Primary financial metrics
Dividends per share and payout ratio
■ Policy for shareholder returns
Dividends per share Payout ratio(¥)
(FY)
(%)
0
10
20
30
40
2014 2015 2016 2017 2018
10
20
30
40
19 20
30.4
24
29.1
27.9
32.2
34 34
25.1
0
25Asahi Kasei Report 2019

Sales composition
54.7% Net sales & operating income Operating income composition
54.1%
Fiscal 2018
Not including “Others” category andcorporate expenses and eliminations. 0
300
600
900
1,200
0
50
100
150
Net sales Operating income(¥ billion) (¥ billion)
2018 2019 (forecast)
1,176.2
129.6
1,197.0
121.0
(FY)
Fiscal 2017
Capacity expansion for S-SBR (solution-polymerized styrene-butadiene rubber) for fuel-efficient tires in SingaporeNew plant to manufacture plastic compounds in ChinaCapacity expansion for Lamous™ artificial suede in JapanCapacity expansion for Leona™ nylon 66 filament in JapanCapacity expansion for Hipore™ LIB separator in JapanCapacity expansion for Celgard™ LIB separator in the USAcquisition of Senseair AB, Swedish manufacturer of gas sensor modules
Fiscal 2018
Acquisition of Sage Automotive Interiors, Inc., US manufacturer of automotive interior materialCapacity expansion for spunbond nonwovens in ThailandCapacity expansion for Hipore™ LIB separator in JapanCapacity expansion for Celgard™ LIB separator in the US
Operating Segments
With basic chemicals as feedstock for resins, etc., unique fiber materials, environmentally friendly performance materials, consumables such as Saran Wrap™ cling film, battery separators, and electronic devices such as LSIs and sensors, our high value-added product portfolio is expanding on a global scale, contributing to a better future through unrivaled technologies.
In September 2018, we acquired Sage Automotive Interiors, Inc., South Carolina–based manufacturer of automotive interior material, for a cash transac-tion price of approximately $700 million1. Various innovations such as CASE2 are emerging in the automotive industry. We will expand our business in the field of mobility leveraging Sage’s brand and ability to provide proposals to vehicle manufacturers and parts suppliers.
Material
Hiroshi YoshidaExecutive Officer for Material business sectorDirector, Vice-Presidential Executive Officer, Asahi Kasei Corp.
Main products
■ Acrylonitrile (AN)
■ Styrene
■ Polyethylene (PE)
■ Bemberg™ cupro fiber
■ Roica™ premium stretch fiber
■ Spunbond nonwovens
■ Bemliese™ continuous-filament cellulose nonwoven
■ Lamous™ artificial suede
■ Leona™ nylon 66 filament
■ Engineering plastics
■ Synthetic rubber
■ Saran Wrap™ cling film
■ Ceolus™ microcrystalline cellulose
■ Microza™ hollow-fiber filtration membranes
■ Ion-exchange membranes
■ Sunfort™ photosensitive dry film
■ Hipore™ and Celgard™ Li-ion battery separators
■ Daramic™ lead-acid battery separator
■ Mixed-signal LSIs
■ Hall elements
Sage has been supplying car interior material made with Asahi Kasei’s Lamous™ artificial suede
1 Total acquisition price of $1.06 billion including Sage’s net interest-bearing debt. 2 Connected, Autonomous, Shared, and Electric
Acquisition of Sage Automotive Interiors
Recent major investments for growth in the Material segment(decisions adopted FY2017–2018)
Highlights
26 Asahi Kasei Report 2019

30.7% 28.5%
0
200
400
600
800
0
25
50
75
100
659.8
68.2
727.0
72.5
Sales composition Net sales & operating incomeOperating income composition
Fiscal 2018
Not including “Others” category andcorporate expenses and eliminations.
Net sales Operating income(¥ billion) (¥ billion)
2018 2019 (forecast) (FY)
0
200
400
600
800
2017201620152014 2018 (FY) (FY)
Order-built homes Real estate RemodelingOther housing-related, etc. Construction Materials
Order-built homes Real estate RemodelingOther housing-related, etc. Construction Materials(¥ billion) (¥ billion)
0
20
40
60
80
2017201620152014 2018
Our homes business is focusing on homes for seniors as a new area of growth. Hebel Village™ apartments for seniors are designed for residents who are self-dependent whether healthy or frail. The apartments feature various senior-friendly services such as regular visits by social workers, health monitoring, on-call health services, and cooperative arrangements with nearby medical facilities.
We set the stage for a rich and fulfilling lifestyle with our homes business that provides high-quality products and services for Long Life Homes which earn high customer satisfaction that lasts for more than half a century, and with our construction materials business that provides innovative and original high value-added products and services.
Homes
Fumitoshi KawabataExecutive Officer for Homes business sectorDirector, Primary Executive Officer, Asahi Kasei Corp.President & Representative Director, Asahi Kasei Homes Corp.Director, Asahi Kasei Construction Materials Corp.
Main products
■ Hebel Haus™ unit homes
■ Hebel Maison™ apartment buildings
■ Atlas™ condominiums
■ Hebel Maison™ apartment rental network
■ Remodeling
■ Hebel™ AAC panels
■ Neoma Foam™ and Neoma Zeus™ phenolic foam insulation panels
■ Foundation systems
■ Structural systems and components
Net sales & operating income breakdown
Hebel Village™ apartments for seniors
Hebel Village™ orders received
Net sales Operating income
Cumulative orders received as of March 31, 2019
0
20
40
60
80
100
201720162015
7buildings(79 units)
12buildings
(141 units)
27buildings
(412 units)
37buildings
(458 units)
46buildings
(600 units)
100buildings
(1,200 units)
20252019target target
2018 (FY)
Highlights
27Asahi Kasei Report 2019
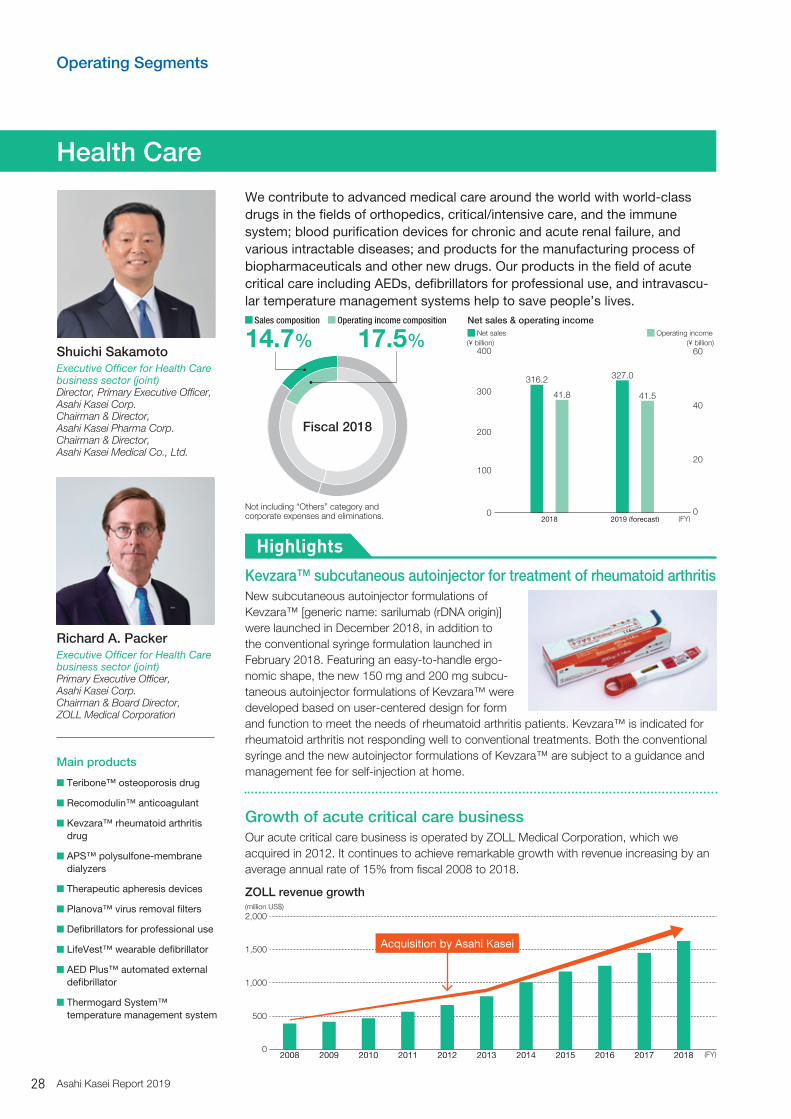
14.7%
17.5%
0
100
200
300
400
0
20
40
60
316.2
41.8
327.0
41.5
Sales composition Net sales & operating incomeOperating income composition
Not including “Others” category andcorporate expenses and eliminations.
Net sales Operating income(¥ billion) (¥ billion)
2018 2019 (forecast) (FY)
Fiscal 2018
Operating Segments
We contribute to advanced medical care around the world with world-class drugs in the fields of orthopedics, critical/intensive care, and the immune system; blood purification devices for chronic and acute renal failure, and various intractable diseases; and products for the manufacturing process of biopharmaceuticals and other new drugs. Our products in the field of acute critical care including AEDs, defibrillators for professional use, and intravascu-lar temperature management systems help to save people’s lives.
Health Care
0
500
1,000
1,500
2,000
2017201620152014201320122011201020092008 2018 (FY)
(million US$)
Acquisition by Asahi Kasei
ZOLL revenue growth
Shuichi SakamotoExecutive Officer for Health Care business sector (joint)Director, Primary Executive Officer, Asahi Kasei Corp.Chairman & Director, Asahi Kasei Pharma Corp.Chairman & Director, Asahi Kasei Medical Co., Ltd.
Richard A. PackerExecutive Officer for Health Care business sector (joint)Primary Executive Officer, Asahi Kasei Corp.Chairman & Board Director, ZOLL Medical Corporation
Main products
■ Teribone™ osteoporosis drug
■ Recomodulin™ anticoagulant
■ Kevzara™ rheumatoid arthritis drug
■ APS™ polysulfone-membrane dialyzers
■ Therapeutic apheresis devices
■ Planova™ virus removal filters
■ Defibrillators for professional use
■ LifeVest™ wearable defibrillator
■ AED Plus™ automated external defibrillator
■ Thermogard System™ temperature management system
Highlights
New subcutaneous autoinjector formulations of Kevzara™ [generic name: sarilumab (rDNA origin)] were launched in December 2018, in addition to the conventional syringe formulation launched in February 2018. Featuring an easy-to-handle ergo-nomic shape, the new 150 mg and 200 mg subcu-taneous autoinjector formulations of Kevzara™ were developed based on user-centered design for form and function to meet the needs of rheumatoid arthritis patients. Kevzara™ is indicated for rheumatoid arthritis not responding well to conventional treatments. Both the conventional syringe and the new autoinjector formulations of Kevzara™ are subject to a guidance and management fee for self-injection at home.
Our acute critical care business is operated by ZOLL Medical Corporation, which we acquired in 2012. It continues to achieve remarkable growth with revenue increasing by an average annual rate of 15% from fiscal 2008 to 2018.
Kevzara™ subcutaneous autoinjector for treatment of rheumatoid arthritis
Growth of acute critical care business
28 Asahi Kasei Report 2019

R&D
We are creating new businesses and advancing business activities by leveraging various core technologies, enhanced marketing functions, and both internal and external connections while utilizing digital technologies.
Shigeki TakayamaRepresentative DirectorVice-Presidential Executive Officer Executive Officer for Technology Functions
■ Our R&D objectives
“Creating for Tomorrow” is the commitment of the Asahi Kasei Group. R&D plays a key role in meeting unsolved global needs. Innovation would be stifled if we just carry on with the conventional ways. We are working to take maximum advantage of the diversity of our operations while building connections as we further hone our core technologies. Our R&D is not only to create new businesses, but also to heighten the earnings, advance the development, and strengthen the foundations of established businesses.
■ Concept of new business creation
In the past, there was reluctance to launch a business in so-called “white space” because of the absence of any direct link to existing businesses. Today, however, as the boundaries between businesses are in flux, it is essential to commercialize white space. We have two criteria for discern-ing what white space to target. One is consistency with the Asahi Kasei Group Mission. The other is certainty of future growth. Evaluating these two criteria requires comprehensive judgement including objective assessment of business conditions, attributes needed for human resources, and the surrounding environment. This judgement cannot be made
from a short-term perspective. Consider our development of the alkaline water electrolysis system for hydrogen produc-tion. We are still in the technology demonstration stage, and commercialization will take more time considering the cost aspects. But we have high expectations for this business because of the appeal of hydrogen energy, its future poten-tial, and ecological performance. In the case of moving into white space through M&A, the business platform of the acquired company, as well as its technology, is a vital consideration. The acquired business platform would form the core for launching a new business, so strict criteria are applied to M&A in a white space. If the targeted company’s business platform is below our expected level, we wait until the company develops its platform sufficiently before conducting M&A. There are always various difficulties when entering a new field, but we understand that it’s necessary to take challenges when tackling issues for the world.
Our R&D Efforts
29Asahi Kasei Report 2019

R&D
Development of separators for lead-acid batteries used with ISSWe are the world’s No. 1 supplier of separators for lead-acid batteries, and currently we have next-generation separators for lead-acid batteries used with idling stop systems (ISS), which require frequent charging and discharging that tends to degrade the electrolyte. In order to increase battery life and to decrease the amount of lead required, we developed new separator rib configurations and coating techniques.
Development of high-strength dry-process LIB separatorsAlthough dry-process LIB separators have some advantages over wet-process LIB separators, their low mechanical strength needs to be raised to obtain higher performance for automotive LIBs.
Development of cutting-edge electrolytesWith better ion conductivity and durability of the LIB elec-trolyte, we aim to increase driving range, shorten charging time, and improve low-temperature performance. Selecting the best additives is a key factor, and by leveraging materials informatics (MI) we hope LIBs can replace lead-acid batteries over the long term.
Development of cutting-edge materials for solid-state batteriesWe are developing solid electrolyte material to enable rapid charging, high-temperature durability, and downsizing of solid-state LIBs. By using a thin film of solid electrolyte sup-ported on a carrier, we aim to achieve high battery capacity.
Development of innovative lithium ion capacitorsThe lithium ion capacitor (LIC) features better cycle life and power output characteristics than the LIB. We are developing pre-doping technology to intercalate lithium ions in the anode material in advance for lower cost. While working to raise LIC performance, we are studying various applications that can make the most of the LIC.
When developing these materials, we also need to have cell assembly and evaluation technology. We believe it is import-ant to actually assemble cells and evaluate their performance in addition to evaluating materials, in order to deepen our understanding of our clients’ needs and their final products.
We are the world’s leading manufacturer, developer, and supplier of separators for lithium-ion batteries (LIB) and lead-acid batteries, and Asahi Kasei Honorary Fellow Dr. Akira Yoshino is the inventor of the LIB. Leveraging our know-how and core technologies, we continue to develop various materials for cells and batteries.
■ Notable R&D efforts
Developing materials for cells and batteries
Technology strategy for automotive cells and batteries
(W/kg)
(Wh/kg) 103
102
10
010 102 103 104 105 Red underline indicates
development by Asahi Kasei
Electric double-layercapacitor (EDLC)
NiMH
Fuel cell
LIC
Capacitors
LIB withcutting-edgeelectrolyte
Solid- state battery
InnovativeLIC
Materials
High-strength dry-processLIB separator LIB
(for EV)
Separator for ISS Lead-acid battery (for HEV)
Achieving solid-state LIB(rapid charging, high-temperature durability, and downsizing)
Longer service life,reduced lead requirement
Improved safety
High-output cell to revolutionize HV/PHV(high ef�ciency, LIB substitute)
Revolutionary EV-LIB with cutting-edge electrolyte(driving range, charging time, low-temperature performance)
Possibility of replacing 12V lead-acid batteries
Substitution
Cell
Ene
rgy
den
sity
(lon
ger
driv
ing
rang
e)
Power density (quick charge, high power, ef�ciency)
30 Asahi Kasei Report 2019

Accelerating product developmentMI is utilized to formulate compounds of engineering resins, which are used in various fields such as automotive parts, household electrical appliances, and office equipment. Thus, our clients have diverse needs for properties such as impact strength, flame retardancy, and stiffness. To meet their needs, we compound glass fibers and flame retardants into engineering polymers to obtain the needed performance characteristics. In the past, we relied on the skill of experienced engineers to find the best composition. Currently with the help of MI, the best composition can be found more quickly and with lower cost. Development time can be shortened to one-third of the previously required time. MI also enables us to share in-house know-how and skills, preserving technology for the next generation. We also use MI in the development of catalysts for petrochemicals, which has shortened development times by 80–90%. Currently we are applying MI to R&D projects for new businesses such as battery materials.
Prompt response to various clients’ needsIn the mobility field, clients’ needs are changing dramatically with the emergence of trends such as CASE (connected, autonomous, shared, electric) and MaaS (Mobility as a Service). Even more dynamic and complex changes are expected as service providers and IT companies enter the field of mobility in addition to automobile manufacturers. In order to swiftly meet changing needs in these circumstances, product development utilizing MI is essential. We have begun using MI tools in sales departments as well as R&D to enable quick and precise grade proposals on the spot by leveraging our accumulated information on clients’ needs. MI originates from informatics, which has the potential to transform industrial structures and create completely new businesses by breaking down barriers between different fields and facilitating collaboration among them. Informatics can also be effective for the creation and nurturing of a new business, for example when scaling up the business of a small-sized venture company which is acquired. While we currently focus on strengthening our existing businesses, we are also looking for ways to leverage informatics in new businesses, and have begun discussions with Asahi Kasei Homes regarding a data business with the house as a platform.
Utilizing materials informatics (MI)
Developing resin compounds
Developing resins with various characteristics that meet clients’ needs
Adjusting composition to add functions and obtain required properties
Resin compounds Applications
· Polyamide· Polyacetal· Polyolefin· Polyphenylene ether
· Polystyreneetc.
· Home electronics· Office equipment· Automotive components
· Daily goods· Packaging material
etc.
Molding/processing
ProcessingPolymer + other polymer + glass fiber + flame retardant + other additives
Demand characteristics: market needs
Impact strength, flame retardancy, stiffness, flowability, dimensional precision, etc.
31Asahi Kasei Report 2019

Corporate Governance
The Group Vision of Asahi Kasei is to provide new value to society and solve social issues by enabling “living in health and comfort” and “harmony with the natural environment” under the Group Mission of “contributing to life and living for people around the world.” With this as a base, we aim to contribute to society, achieve sustainable growth, and
enhance corporate value over the longer term by promoting innovation and creating synergy through integration of various businesses. We continue to pursue the optimal corporate governance as a framework to make transparent, fair, timely, and resolute decisions in accordance with changes in the business environment.
• 1/3 of Directors are independent
• 1 female Director
• Directors have diverse backgrounds
• 3/5 of Corporate Auditors are independent
• Corporate Auditors Office to support Corporate Auditors
• Internal Audit Department reports to both the President and the Board of Directors
• Performance-linked remuneration ➝ commitment to results
• Stock-based remuneration ➝ perspective of shareholders
(Outside Directors receive fixed base remuneration only)
Basic Views on Corporate Governance
Incentives for Directors (fiscal 2018)
Meetings of Board of Directors, Advisory Committees, and Board of Corporate Auditors (fiscal 2018)
Corporate Governance Configuration
No. of meetings held Average attendance Main subjects of agenda
Board of Directors 1598.6%
(Directors and Corporate Auditors)
• Business investment• Medium-term management initiative• Risk management and compliance
Nomination Advisory Committee* 3 100%
(all members)
• Optimum composition and size of Board of Directors• Policy for nomination of candidates to be Directors and
Corporate Auditors• Standards for judging independence of Outside Directors and
Corporate Auditors
Remuneration Advisory Committee* 2 100%
(all members)
• Policy and system for remuneration of Directors• Studying remuneration of Directors based on individual
performance evaluation
Board of Corporate Auditors 17 97.7%
(Corporate Auditors)
• Auditing state of performance of Directors’ duties• Auditing state of operations and financial affairs• Evaluation of Independent Auditors
* Beginning in June 2019, the Nomination Advisory Committee and Remuneration Advisory Committee are comprised of the 3 Outside Directors and Representative Directors Hideki Kobori and Shigeki Takayama as members, with the Nomination Advisory Committee chaired by Hideki Kobori and the Remuneration Advisory Committee chaired by Outside Director Tsuyoshi Okamoto.
Fixed base remuneration Performance-linked remuneration
Stock-based remuneration
50% 39% 11%(percentages shown for Directors who have executive responsibilities)
Shareholders Meeting
Audit
Board of Corporate Auditors(5 Corporate Auditors, including
3 Independent Outside Corporate Auditors)
Execution ofoperations
Management Council
Oversight
Board of Directors(9 Directors, including
3 Independent Outside Directors)
Independent Auditors
Nomination Advisory Committee
Remuneration Advisory Committee
President
Internal Audit Department
Election
Audit
Report
CooperationCooperation
Election
Cooperation
Audit
Key points
32 Asahi Kasei Report 2019

The effectiveness of our Board of Directors is regularly evaluated after each fiscal year, and results of evaluation are disclosed.
Composition of Board of Directors (beginning in June 2019)
Evaluation of Effectiveness of Board of Directors
Measures implemented in fiscal 2018
The Board of Directors implemented the following measures in
fiscal 2018 based on evaluation of the previous fiscal year.
1. Enhanced provision of information to Outside Directors and
Outside Corporate Auditors
2. Sharing information on IR activities and opinions of investors
3. Preparations for the new medium-term management initiative
Moving forward
Based on deliberations of the effectiveness of the Board of Directors
during fiscal 2018, we will continue and expand the aforementioned
efforts in the future. Further, for enriched deliberation by the Board
of Directors, we will work to further improve the operation of Board
of Directors meetings by reviewing standards for agenda items,
improving the format of materials, and securing ample deliberation
time. In addition, we will continue to study the further enrichment of
the effective operation of the Nomination and Remuneration Advisory
Committees, and the optimum size and composition of the Board of
Directors, on an ongoing basis.
The 6 Directors within the company respectively have responsibility for overall management, technology functions, business management functions, and the Material, Homes, and Health Care business sectors, while the 3 Outside Directors have a diverse range of backgrounds.
Masumi ShiraishiOutside Director
Economics and society
Shigeki TakayamaVice-Presidential Executive Officer
Technology functions
Yutaka ShibataVice-Presidential Executive Officer
Business management functions
Tsuyoshi OkamotoOutside Director
Corporate management
Hideki KoboriPresidential Executive Officer
Overall management
Hiroshi YoshidaVice-Presidential Executive Officer
Material business sector
Fumitoshi KawabataPrimary Executive Officer
Homes business sector
Shuichi SakamotoPrimary Executive Officer
Health Care business sector
Tsuneyoshi TatsuokaOutside Director
Industrial and economic policy
33Asahi Kasei Report 2019

Directors
1978 Joined Asahi Kasei2008 Asahi Kasei Microdevices Director,
Senior Executive Officer 2009 Asahi Kasei Microdevices Director,
Primary Executive Officer 2010 Asahi Kasei Microdevices President & Representative
Director, Presidential Executive Officer 2012 Asahi Kasei Senior Executive Officer, Director* 2014 Asahi Kasei Representative Director*,
Primary Executive Officer2016 Asahi Kasei President and Director*,
Presidential Executive Officer*
1. President & Representative Director
Presidential Executive Officer
Hideki Kobori
1979 Joined Asahi Kasei2008 Asahi Kasei Executive Officer 2009 Asahi Kasei Lead Executive Officer 2011 Asahi Kasei Kuraray Medical President & Representative
Director, Presidential Executive Officer Asahi Kasei Medical President & Representative Director, Presidential Executive Officer Asahi Kasei Pharma Director
2016 Asahi Kasei Primary Executive Officer 2017 Asahi Kasei Pharma President & Representative Director,
Presidential Executive Officer Asahi Kasei Medical Director
2018 Asahi Kasei Director* 2019 Asahi Kasei Vice-Presidential Executive Officer*
3. Director Vice-Presidential
Executive Officer
Yutaka Shibata
1980 Joined Asahi Kasei2009 Asahi Kasei E-materials Executive Officer 2010 Asahi Kasei E-materials Director 2012 Asahi Kasei E-materials Senior Executive Officer 2013 Asahi Kasei E-materials President & Representative
Director, Presidential Executive Officer 2015 Polypore International President & CEO 2016 Asahi Kasei Senior Executive Officer,
President of Separators SBU 2018 Asahi Kasei Primary Executive Officer 2019 Asahi Kasei Vice-Presidential Executive Officer*,
Director*, Representative Director*
2. Representative Director Vice-Presidential
Executive Officer
Shigeki Takayama
1979 Joined Asahi Kasei2012 Asahi Kasei Chemicals Executive Officer 2014 Asahi Kasei Chemicals Director, Senior Executive Officer 2016 Asahi Kasei Lead Executive Officer,
President of Performance Polymers SBU 2017 Asahi Kasei Senior Executive Officer 2018 Asahi Kasei Primary Executive Officer 2019 Asahi Kasei Vice-Presidential Executive Officer*,
Director*
4. Director Vice-Presidential
Executive Officer
Hiroshi Yoshida
34 Asahi Kasei Report 2019

1981 Joined Asahi Kasei2011 Asahi Kasei Chemicals Executive Officer 2014 Asahi Kasei Chemicals Director, Senior Executive Officer
Asahi Kasei Lead Executive Officer, Corporate Strategy General Manager
2016 Asahi Kasei Senior Executive Officer, Director* 2018 Asahi Kasei Pharma Director and Chairman*
Asahi Kasei Medical Director and Chairman* 2019 Asahi Kasei Primary Executive Officer*
5. Director Primary Executive
Officer
Shuichi Sakamoto
1970 Joined Tokyo Gas Co., Ltd. 2002 Tokyo Gas Co., Ltd. Executive Officer 2004 Tokyo Gas Co., Ltd. Senior Executive Officer, Director 2007 Tokyo Gas Co., Ltd. Representative Director,
Executive Vice President 2010 Tokyo Gas Co., Ltd. Representative Director, President 2014 Tokyo Gas Co., Ltd. Director, Chairman 2018 Tokyo Gas Co., Ltd. Director, Senior Corporate Advisor
Asahi Kasei Director* Tokyo Gas Co., Ltd. Senior Corporate Advisor*
9. Outside Director
Tsuyoshi Okamoto
1989 Joined NLI Research Institute 2001 Head Researcher, NLI Research Institute 2002 Assistant Professor, Department of Economics,
Toyo University 2006 Professor, Department of Economics,
Toyo University 2007 Professor, Faculty of Policy Studies,
Kansai University* 2013 Asahi Kasei Director*
7. Outside Director
Masumi Shiraishi
1982 Joined Asahi Kasei2012 Asahi Kasei Homes Executive Officer 2013 Asahi Kasei Homes Director*, Senior Executive Officer 2014 Asahi Kasei Homes Marketing Division General Manager 2016 Asahi Kasei Homes Chubu Sales Division General Manager 2017 Asahi Kasei Senior Executive Officer
Asahi Kasei Homes President & Representative Director*, Presidential Executive Officer* Asahi Kasei Construction Materials Director*
2019 Asahi Kasei Primary Executive Officer*, Director*
6. Director Primary Executive
Officer
Fumitoshi Kawabata
1980 Joined Ministry of International Trade and Industry 2010 Councilor, Cabinet Secretariat 2011 Deputy Vice-Minister of Economy, Trade and Industry 2013 Vice-Minister of Economy, Trade and Industry 2015 Retired from Ministry of Economy, Trade and Industry 2016 Asahi Kasei Director*
8. Outside Director
Tsuneyoshi Tatsuoka
18 27
5
36 49
* Position held at present.
35Asahi Kasei Report 2019

Responsibility as Outside DirectorThe most important thing expected of an Outside Director is objectivity. At Board of Directors meetings, I objectively evaluate the operation of the company, raise questions as necessary, and offer my opinions. I feel that my responsibility is to convey my thoughts based on objective assessment of whether an appropriate overall balance is being achieved among Asahi Kasei’s 3 sectors, and whether the objectives of the strategic management initiative are being met.
Evaluating the corporate governance systemI judge Asahi Kasei’s governance system to be appropriate as a company having a Board of Corporate Auditors. I also find the composition of the Board of Directors to be appro-priate, including the number of Outside Directors, and I think it is particularly outstanding that people with responsibility for each of the 3 business sectors have been installed as Directors. The voluntarily established Nomination and Remuneration Advisory Committees are functioning suitably.
Asahi Kasei’s governance system to heighten management effectivenessTsuyoshi Okamoto, Outside Director since June 2018, shares his view on the effectiveness of Asahi Kasei’s corporate governance system.
Tsuyoshi OkamotoOutside Director
Profile
April 1970 Joined Tokyo Gas Co., Ltd.
June 2002 Tokyo Gas Co., Ltd. Executive Officer
April 2004 Tokyo Gas Co., Ltd. Senior Executive Officer
June 2004 Tokyo Gas Co., Ltd. Director
April 2007 Tokyo Gas Co., Ltd. Representative Director, Executive Vice President
April 2010 Tokyo Gas Co., Ltd. Representative Director, President
April 2014 Tokyo Gas Co., Ltd. Director, Chairman
April 2018 Tokyo Gas Co., Ltd. Director, Senior Corporate Advisor
June 2018 Asahi Kasei Corp. Outside Director*
June 2018 Tokyo Gas Co., Ltd. Senior Corporate Advisor*
* Position held at present
Outside Director Interview
36 Asahi Kasei Report 2019

The concept of “diversity” is critical for corporate governance. For the Board of Directors as well, it’s essential to maintain a diversity of perspectives and opinions. To me, that’s more important than having numerical targets for diversity by gender, nationality, or age, for instance. Asahi Kasei is conscious of the need for diverse perspectives in the management team and the Board of Directors to ensure appropriate response to changes in the external environment. The company strives to ensure that its governance system reflects this.
An effective Board of Directors supports effective managementFrank and lively discussions are held at Board of Directors meetings. The opinions and advice of Outside Directors are given sincere consideration, and incorporated into decisions and policy formulations. Through tours of operating sites and detailed explanations by business managers, ample information is provided to Outside Directors. The agenda of the Board of Directors includes more and more large-scale investment and acquisition proposals in recent years. I always ask for explanations about the risks. While there is no such thing as a risk-free business, the key is to clearly foresee the potential risks and understand how they can be mitigated if they materialize. The most important part of risk management is to be able to explain how the company will cope in the case of risks emerging.
Asahi Kasei’s strengths and potential for growthAsahi Kasei’s 3 business sectors are each highly autono-mous, and there isn’t necessarily firm mutual linkage among them. I see this as a strength. Having highly independent businesses means that even if an individual business slips into a low-growth phase, the company’s overall foundations remain unshaken. This is not only a risk hedge for manage-ment, it’s also a huge structural strength. I also sense that the corporate philosophy is effectively leveraged as a source of strength. With a Group Mission of “contributing to life and living for people around the world,” the company has set forth “Care for People, Care for Earth” as the key message of its new medium-term initiative. This enables employees to perform their duties with pride, in the knowledge that their work provides value to the world. I think this is particularly meaningful for personnel working behind the scenes. In contrast to the front-line people in sales or new business development, those working in fields like accounting, maintenance, and call centers are required to swiftly execute their tasks without garnering attention. But the company would not function without them—they are the
unsung heroes. Awareness of the company’s mission and strategic concepts can greatly reinforce the engagement of such employees performing such essential but often thankless tasks. To me, one of the most important tasks for management is to disseminate corporate philosophy and management concepts throughout the company’s ranks. I have long felt that the heart and soul of a company lie in its on-site people. It’s vital to keep them motivated.
Fostering leaders for the futureDiscussions at Board of Directors meetings are always premised on the importance of succession planning and fostering leadership personnel. I think the best way to foster future leaders is to let people make decisions. If the supervi-sor says, “I’ll take the responsibility, you go ahead and make the decision,” good results are sure to follow. At the same time, those being groomed to be leaders must consider their supervisor’s position. They should ask themselves, “If I were the supervisor, what would I do in this case?” The way of evaluating people is another key issue. In my experience, I’ve found it best to perform evaluation based on 4 different perspectives: The person’s supervisor, the person’s subordinates, the human resources department, and finally an outsider such as a lecturer or specialist enlisted for training sessions. Having evaluation based on multiple perspectives is the best way to ensure unbiased objectivity.
My expectationsI’ve seen that Asahi Kasei’s employees go about their work with pride, confidence, and a sense of responsibility. They can feel proud to work at a company with an admirable corporate philosophy, they are confident in their ability to accomplish their goals, and they are committed to fulfilling their responsibilities to the end. With employees like these, I expect that a bright future awaits for the Asahi Kasei Group.
37Asahi Kasei Report 2019
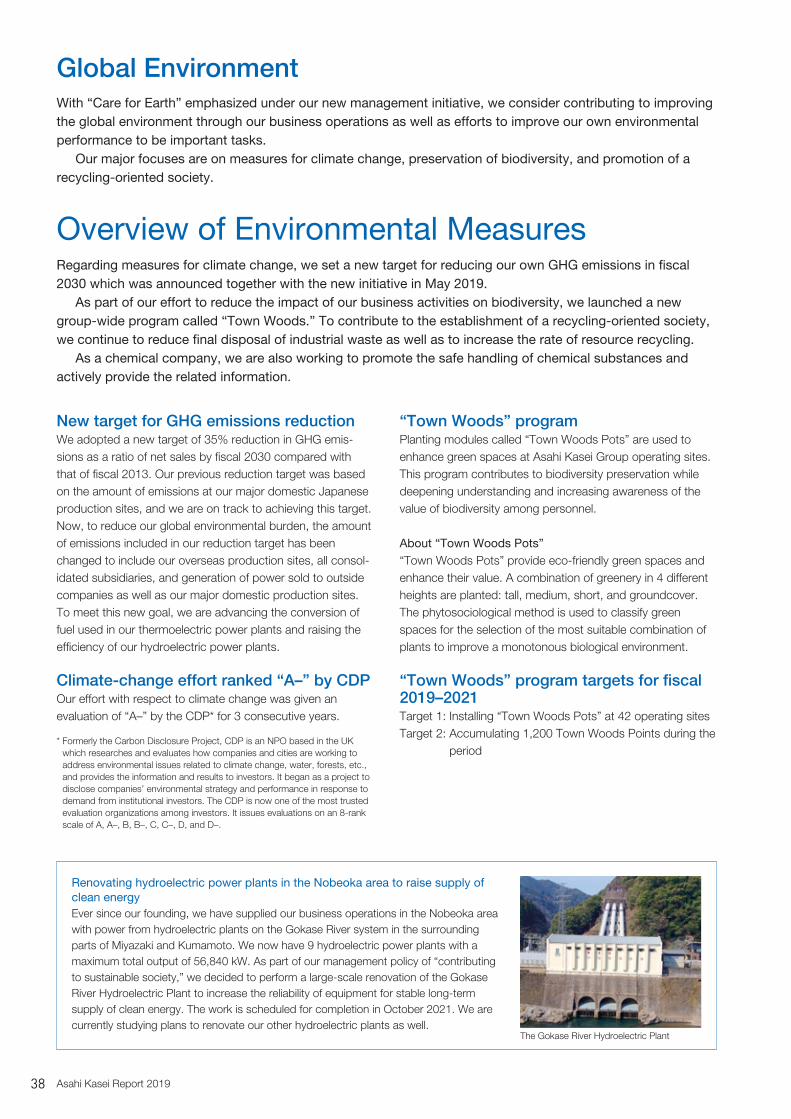
Global Environment
Regarding measures for climate change, we set a new target for reducing our own GHG emissions in fiscal 2030 which was announced together with the new initiative in May 2019. As part of our effort to reduce the impact of our business activities on biodiversity, we launched a new group-wide program called “Town Woods.” To contribute to the establishment of a recycling-oriented society, we continue to reduce final disposal of industrial waste as well as to increase the rate of resource recycling. As a chemical company, we are also working to promote the safe handling of chemical substances and actively provide the related information.
With “Care for Earth” emphasized under our new management initiative, we consider contributing to improving the global environment through our business operations as well as efforts to improve our own environmental performance to be important tasks. Our major focuses are on measures for climate change, preservation of biodiversity, and promotion of a recycling-oriented society.
Overview of Environmental Measures
New target for GHG emissions reductionWe adopted a new target of 35% reduction in GHG emis-sions as a ratio of net sales by fiscal 2030 compared with that of fiscal 2013. Our previous reduction target was based on the amount of emissions at our major domestic Japanese production sites, and we are on track to achieving this target. Now, to reduce our global environmental burden, the amount of emissions included in our reduction target has been changed to include our overseas production sites, all consol-idated subsidiaries, and generation of power sold to outside companies as well as our major domestic production sites. To meet this new goal, we are advancing the conversion of fuel used in our thermoelectric power plants and raising the efficiency of our hydroelectric power plants.
Climate-change effort ranked “A–” by CDPOur effort with respect to climate change was given an evaluation of “A–” by the CDP* for 3 consecutive years.
* Formerly the Carbon Disclosure Project, CDP is an NPO based in the UK which researches and evaluates how companies and cities are working to address environmental issues related to climate change, water, forests, etc., and provides the information and results to investors. It began as a project to disclose companies’ environmental strategy and performance in response to demand from institutional investors. The CDP is now one of the most trusted evaluation organizations among investors. It issues evaluations on an 8-rank scale of A, A–, B, B–, C, C–, D, and D–.
“Town Woods” programPlanting modules called “Town Woods Pots” are used to enhance green spaces at Asahi Kasei Group operating sites. This program contributes to biodiversity preservation while deepening understanding and increasing awareness of the value of biodiversity among personnel.
About “Town Woods Pots”“Town Woods Pots” provide eco-friendly green spaces and enhance their value. A combination of greenery in 4 different heights are planted: tall, medium, short, and groundcover. The phytosociological method is used to classify green spaces for the selection of the most suitable combination of plants to improve a monotonous biological environment.
“Town Woods” program targets for fiscal 2019–2021Target 1: Installing “Town Woods Pots” at 42 operating sitesTarget 2: Accumulating 1,200 Town Woods Points during the
period
Renovating hydroelectric power plants in the Nobeoka area to raise supply of clean energyEver since our founding, we have supplied our business operations in the Nobeoka area with power from hydroelectric plants on the Gokase River system in the surrounding parts of Miyazaki and Kumamoto. We now have 9 hydroelectric power plants with a maximum total output of 56,840 kW. As part of our management policy of “contributing to sustainable society,” we decided to perform a large-scale renovation of the Gokase River Hydroelectric Plant to increase the reliability of equipment for stable long-term supply of clean energy. The work is scheduled for completion in October 2021. We are currently studying plans to renovate our other hydroelectric plants as well.
The Gokase River Hydroelectric Plant
38 Asahi Kasei Report 2019

Society: Quality & ProcurementWith “Care for People” as an important focus of our new management initiative, we prioritize contributing to solutions to social issues through our businesses while emphasizing responsibility to our stakeholders.
Quality & Procurement
Corporate Quality Ensurance was established as an inde-pendent organization with a Quality Ensurance Group and Chemicals Management Group as subordinate organizations in July 2018 in a reorganization from the prior Corporate ESH & QA. In April 2019, an Executive Officer of Quality Assurance was assigned while the prior Regulatory Affairs & Reliability Assurance Dept. in Corporate Research & Development was moved to Corporate Quality Ensurance. The reorganization is to strengthen and maintain a higher level of quality assurance to coordinate the reinforcement of quality assurance activities throughout the Asahi Kasei Group, ensuring the provision of safe and reliable products to our customers. In addition to its role as the central hub for the provision and sharing of QA-related information throughout all operations, the Quality Assurance Group holds QA Forums with lectures by eminent professors in the field of quality control to augment the training of QA personnel. In fiscal 2018, we once again met our target of no serious product safety incidents.
Effort to maintain zero serious product safety incidentsAs part of the effort to prevent serious product safety incidents and to secure and strengthen product safety, we established new quality assurance bylaws that stipulate quality assurance activities for RC Administrators of strategic business units and core operating companies to perform. Quality Assurance Managers of each organization, whose central role in activities to enhance quality assurance is defined in the bylaws, are appointed and perform their activities accordingly. Our product safety guidelines are applied in concert with the bylaws by all business units of the Asahi Kasei Group to assure the quality of products and services.
Purchasing departments throughout the Asahi Kasei Group regard suppliers as important partners and work to build relationships with them based on sincerity in accordance with our Group Philosophy, revised in 2011. To this end, we are placing greater emphasis on CSR in accordance with our Procurement Policy. Accordingly, we consider suppliers from environmental aspects including energy use, climate change, biodiversity, pollution, waste management, and resource use, and social aspects including discrimination, equal opportunity, freedom of association, and compliance with local laws concerning working hours, wages, health, and safety. A relationship of mutual trust with our suppliers is fostered through fair and transparent purchasing practices based on regulatory com-pliance and respect for the environment and human rights. Our purchasing departments conduct a CSR survey every year in order to better understand our suppliers' efforts to promote CSR, and identify any areas where improvement may be requested. It is a global trend that more and more countries are banning the procurement of minerals from inhumane armed groups, particularly in the Democratic Republic of the Congo and neighboring countries. In the US, this is required by the Dodd-Frank Act of 2010. The Asahi Kasei Group considers conflict minerals to be a serious issue, and our policy is to ensure transparency in our supply chains and to procure minerals responsibly. We do not obtain, procure, or utilize minerals from armed groups, and avoid supporting conflict and inhumane activities.
Quality Assurance CSR Procurement Effort with Suppliers
Asahi Kasei Group Quality Policy
The Asahi Kasei Group creates and provides products and services with the quality to meet the needs of
customers and society and ensure safety and security.
39Asahi Kasei Report 2019

Human Resources
The effort to prevent workplace accidents is integrated in a comprehensive OHSMS* program that combines conventional safety initiatives—such as tidiness/orderliness/cleanliness, reporting of near-accidents and potential hazards, hazard prediction analysis, safety patrols, and case studies—with risk assessments and a prevention-oriented plan-do-check-act (PDCA) system.
* Occupational Health and Safety Management System. A standardized system used to confirm that continuous improvement is being applied to measures to minimize the risks of workplace injuries and to prevent the emergence of future risks.
We continue to hire university graduates of foreign nation-ality every year, and the overall makeup of our personnel is becoming more global. We are also strengthening our ties to universities both in Japan and overseas, through career brief-ing sessions and student internships, as part of an ongoing effort to attract talent. In April 2019, 471 new graduates were hired: 373 men and 98 women. In addition, 253 persons were hired in mid-career between April 2018 and March 2019.
Workplace Safety and Hygiene
Integration of workplace safety initiatives
OHSMS
Conventional safetyinitiatives Risk assessments PDCA
management system
Incidence of lost-workdayinjury by event category,
FY2018 in Japan
Total 23 cases
Incidence of lost-workdayinjury by event category,FY2008–2017 in Japan
Total 130 cases
Fall on same level ......................... 44%Kickback/overexertion .................. 18%Contact with high temperaturesubstance/object.......................... 17%Collision........................................ 13%Caught in/between machinery ........ 4%Hit by flying/falling object ................ 4%
Fall on same level ......................... 26%Traffic accident ............................. 23%Kickback/overexertion .................. 12%Fall from height............................. 10%Caught in/between machinery ........ 9%Contact with high temperaturesubstance/object............................ 6%Caught in something else ............... 3%Hit by flying/falling object ................ 2%Collision.......................................... 2%Contact with harmful substance ..... 2%Others ............................................ 5%
Occurrence of workplace injuries
Society
Group Masters The Asahi Kasei Group employs a “Group Masters” program to recognize employees who have developed and exercised extraordinary expertise and skills that hold universal value, and to facilitate their application throughout the Group. As of October 2018, 180 Group Masters are designated, those whose rank and remuneration are commensurate with Senior General Manager, General Manager, and Section Manager, respectively number 15, 62, and 103. The program is focused on reinforcing the specialized technical abilities of such personnel who will drive the creation of new businesses and the enhancement of established businesses.
Development of global human resourcesTo accelerate the expansion of world-leading businesses in accordance with the medium-term management initiative “Cs+ for Tomorrow 2021” from the perspective of human resources, we are implementing measures such as internship programs for young personnel, and holding training sessions for personnel at overseas subsidiaries on subjects such as dissemination of corporate philosophy, intercultural commu-nication, and management training.
Basic policyThe Asahi Kasei Group strives to ensure that there will be no discrimination and to maintain a lively workplace culture which enables personnel to perform at their best. To prevent any harassment or discrimination, we implement training on corporate ethics to employees at each level—new hires, assistant managers, and managers. Ethics training is also implemented by business unit and by geographical area, and we disseminate a corporate policy of not condoning harassment in any form. In fiscal 2018 and 2019 we held workshops across the Asahi Kasei Group focused on foster-ing a workplace culture free of power harassment.
HiringThe Asahi Kasei Group is working to create new value for society by enabling living in health and comfort and harmony with the natural environment. We strive to hire motivated and capable personnel who will successfully execute our strategy on a global scale.
Human Resources Development
Valuing Human Rights and Diversity
40 Asahi Kasei Report 2019
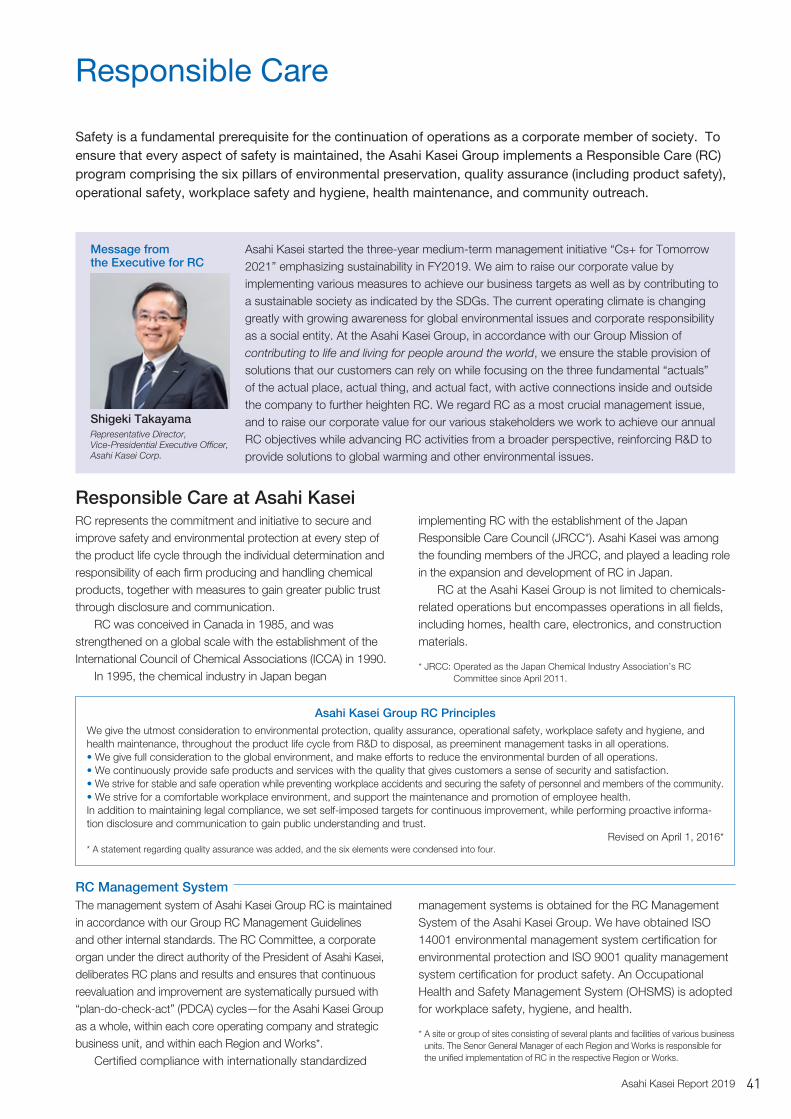
Safety is a fundamental prerequisite for the continuation of operations as a corporate member of society. To ensure that every aspect of safety is maintained, the Asahi Kasei Group implements a Responsible Care (RC) program comprising the six pillars of environmental preservation, quality assurance (including product safety), operational safety, workplace safety and hygiene, health maintenance, and community outreach.
Responsible Care
RC represents the commitment and initiative to secure and improve safety and environmental protection at every step of the product life cycle through the individual determination and responsibility of each firm producing and handling chemical products, together with measures to gain greater public trust through disclosure and communication. RC was conceived in Canada in 1985, and was strengthened on a global scale with the establishment of the International Council of Chemical Associations (ICCA) in 1990. In 1995, the chemical industry in Japan began
implementing RC with the establishment of the Japan Responsible Care Council (JRCC*). Asahi Kasei was among the founding members of the JRCC, and played a leading role in the expansion and development of RC in Japan. RC at the Asahi Kasei Group is not limited to chemicals- related operations but encompasses operations in all fields, including homes, health care, electronics, and construction materials.
* JRCC: Operated as the Japan Chemical Industry Association’s RC Committee since April 2011.
The management system of Asahi Kasei Group RC is maintained in accordance with our Group RC Management Guidelines and other internal standards. The RC Committee, a corporate organ under the direct authority of the President of Asahi Kasei, deliberates RC plans and results and ensures that continuous reevaluation and improvement are systematically pursued with “plan-do-check-act” (PDCA) cycles—for the Asahi Kasei Group as a whole, within each core operating company and strategic business unit, and within each Region and Works*. Certified compliance with internationally standardized
management systems is obtained for the RC Management System of the Asahi Kasei Group. We have obtained ISO 14001 environmental management system certification for environmental protection and ISO 9001 quality management system certification for product safety. An Occupational Health and Safety Management System (OHSMS) is adopted for workplace safety, hygiene, and health.
* A site or group of sites consisting of several plants and facilities of various business units. The Senor General Manager of each Region and Works is responsible for the unified implementation of RC in the respective Region or Works.
Responsible Care at Asahi Kasei
Asahi Kasei started the three-year medium-term management initiative “Cs+ for Tomorrow 2021” emphasizing sustainability in FY2019. We aim to raise our corporate value by implementing various measures to achieve our business targets as well as by contributing to a sustainable society as indicated by the SDGs. The current operating climate is changing greatly with growing awareness for global environmental issues and corporate responsibility as a social entity. At the Asahi Kasei Group, in accordance with our Group Mission of contributing to life and living for people around the world, we ensure the stable provision of solutions that our customers can rely on while focusing on the three fundamental “actuals” of the actual place, actual thing, and actual fact, with active connections inside and outside the company to further heighten RC. We regard RC as a most crucial management issue, and to raise our corporate value for our various stakeholders we work to achieve our annual RC objectives while advancing RC activities from a broader perspective, reinforcing R&D to provide solutions to global warming and other environmental issues.
Message from the Executive for RC
Shigeki TakayamaRepresentative Director, Vice-Presidential Executive Officer, Asahi Kasei Corp.
Asahi Kasei Group RC PrinciplesWe give the utmost consideration to environmental protection, quality assurance, operational safety, workplace safety and hygiene, and health maintenance, throughout the product life cycle from R&D to disposal, as preeminent management tasks in all operations.• We give full consideration to the global environment, and make efforts to reduce the environmental burden of all operations. • We continuously provide safe products and services with the quality that gives customers a sense of security and satisfaction.• We strive for stable and safe operation while preventing workplace accidents and securing the safety of personnel and members of the community.• We strive for a comfortable workplace environment, and support the maintenance and promotion of employee health.In addition to maintaining legal compliance, we set self-imposed targets for continuous improvement, while performing proactive informa-tion disclosure and communication to gain public understanding and trust. Revised on April 1, 2016** A statement regarding quality assurance was added, and the six elements were condensed into four.
RC Management System
41Asahi Kasei Report 2019

Profiles of Employees Pursuing Sustainability
A physics major in college, Nishida was recommended to work for Asahi Kasei during a visit to the SPring-8 synchro-tron radiation facility. He was attracted by the simple phrase, “People at Asahi Kasei are so bright and cheerful.” Having also admired Ichiro Shibasaki, a developer of Hall elements and former Asahi Kasei Fellow, Nishida decided to join Asahi Kasei. After entering the company, he was engaged in product planning for compound semiconductor devices such as magnetic sensors and infrared sensors at Asahi Kasei Microdevices (AKM). Nishida is currently involved in marketing gas sensor modules made with AKM’s infrared sensors, together with Senseair AB, a Swedish manufacturer of NDIR1 gas sensor modules acquired by AKM in 2018. He has two targets in sight. One is CO2 sensors for air conditioning systems and the other is automotive alcohol detection sensors. Energy is a serious subject of concern these days, and CO2 sensors can raise the efficiency of air conditioning systems. When heating or cooling homes and automobiles, efficiency is drastically improved by controlling the intake of air from outside. By measuring the CO2 concentration of the inside air, the sensors enable optimum ventilation to minimize the amount of energy needed to maintain a comfortable environment.
■ Gas sensor business
Under the new medium-term management initiative “Cs+ for Tomorrow 2021,” Asahi Kasei expresses its commitment to sustainability as “Care for People, Care for Earth.” Here we profile three employees who are deeply involved in various aspects of sustainability through their work.
Solving energy problems and eliminating drunken driving
The market for automotive alcohol detection may be even bigger. Drunk driving claims thousands of lives every year in the US alone. A public-private partnership called the DADSS2 program is evaluating Senseair’s alcohol sensor as a prom-ising technology to prevent vehicles from being operated by drunk drivers. Nishida is determined to make this a reality. “Since the cost is high, we can only target high-end mod-els in both applications for now,” notes Nishida. But what if we could develop high value-added and low-cost products with mass-production by combining the technology of Senseair and AKM? That’s Nishida’s dream, and the object of his passion. “AKM’s compound semiconductor technology and Senseair’s gas sensor technology are the best in the world.” His voice sounds bright and cheerful—he belongs to Asahi Kasei now.
1 Nondispersive Infrared (NDIR) sensors use nondispersive emission to irradiate specimen samples and measure the change of infrared intensity for a certain wavelength.
2 Driver Alcohol Detection System for Safety
Sosuke NishidaSolution Development Dept. 4Marketing & Sales Center Asahi Kasei MicrodevicesHired in 2004
Alcohol sensor
Feature
42 Asahi Kasei Report 2019

Am I sincere to my customers? Masaki asks himself as he recollects the sales representative when his parents rebuilt their house. He admired the sincerity of that sales rep who earned the trust of his parents, and decided to enter the hous-ing industry himself. Something as consequential as a house cannot be sold without trust. Working in sales at Asahi Kasei Homes (AKH), Masaki strives to keep learning every day. Currently Masaki is working to expand the rental housing business for seniors, a strategic area of growth for AKH. As people get older, they tend to become more frail. Many will
■ Housing business for seniors
Housing for seniors that seamlessly meets changing needsgo on to need a living environment where care services are provided. AKH provides homes that seamlessly meet these changing needs. While constructing more Hebel Village apartments for frail seniors, it is launching its first Village Riche serviced housing complex for residents requiring care. AKH began its housing business for seniors by focusing on healthy active seniors who do not require care. There is currently a short supply of housing designed for active seniors who can enjoy living at their own pace. Hebel Village apartments for seniors are a solution to meet this social need. As the population of Japan continues to age, the number of active seniors is increasing. This means more good tenants for this type of housing. While other companies focused on apartments with care services and nursing homes, AKH discerned an unmet need ahead of the competition. Now that other companies have begun to imitate this successful model, Masaki spends his days working to maintain AKH’s lead. His dream is to establish a brand for housing that enables people to stay healthy for longer. He constantly tries to learn more, meeting people in the nursing care industry and reading specialist publications. Masaki feels a deep respon-sibility, knowing that the knowledge he gains will become the knowledge of AKH. October 2019 marks the launch of AKH’s first Village Riche residential development providing care services. Over the past few years, Masaki was busy negotiating with care service contractors regarding the location and contract conditions. At times it seemed that there was no hope of reaching agreement. But he persistently explained his position, taking pains to earn his counterparties’ trust. Masaki’s sincere attitude eventually won them over. “If you say so, Masaki-san, we accept.” He continues to pursue the ideal of the sales rep that inspired him.
You MasakiHomes for Seniors & Medium-Rise Buildings Business DivisionAsahi Kasei HomesHired in 1995
Care dependencyHealthy Frail Care needed
Low High
Hebel Haus™unit homes
Hebel Villageapartments for seniors
Village Richeapartments with care services provided
October 2019 launch
43Asahi Kasei Report 2019

Shang learned of Asahi Kasei at graduate school in Japan. She was studying hollow-fiber membranes, and her professor was doing joint research with the company. Intrigued by Asahi Kasei’s history of fiber and membrane technology, she felt that it would allow her to apply her specialist knowledge, and joined the company in 2004. Her first assignment was as a technical sales represen-tative for Microza™ hollow-fiber membranes used in water purification and wastewater treatment. She was pleased to be involved in the water treatment business in China, as her work contributed to improving the environment of her mother country. In 2012 Shang was transferred to Asahi Kasei Medical. Though it still involved hollow-fiber membranes, the product was totally different. Planova™ is a virus removal filter used during the manufacturing process of biotherapeutics such as plasma derivatives and biopharmaceuticals. She has served as a technical sales representative in this field since then.
■ Bioprocess business
Heightening biotherapeutics safety and contributing to the dissemination of high-quality drugs
For Shang, the important thing is not which field of business to work in. She simply finds it rewarding to be able to contribute to society by utilizing her knowledge of cutting-edge hollow-fiber membrane technology. “Our job is more than just supplying products.” She has thorough discussions with customers in order to fully understand their concerns and propose solutions. For example, when a cus-tomer needs to conduct a virus validation test* for regulatory approval, there can be no mistakes. To ensure a successful test, she joins consultations with the authorities, and organizes seminars on Planova™ technology. Shang’s huge contribution to improving the reliability of blood products with Planova™ in China was recognized with an Asahi Kasei Medical President’s Award. Planova™ still has potential for sales growth in other Asian markets. Now Shang is working to get Planova™ adopted by biotherapeutic manufacturers in Asia, for the provision of safe biotherapeutics to more patients. “We’re fortunate to have you as our contact.” Such words of appreciation from a customer inspire Shang to keep pressing forward every day, helping improve people’s lives around the world.
* Viruses are intentionally added in a laboratory replicating actual manufacturing conditions, and the rate of decrease after the virus removal process is measured.
Mengxian Shang, Ph.D.Global Sales & Customer Services Dept.Bioprocess DivisionAsahi Kasei MedicalHired in 2004, specialist of hollow-fiber membrane
PlanovaTM virus removal filters
Profiles of Employees Pursuing Sustainability
44 Asahi Kasei Report 2019

46 Consolidated Financial Statements46 Consolidated Balance Sheets48 Consolidated Statements of Income49 Consolidated Statements of Comprehensive Income50 Consolidated Statements of Changes in Net Assets51 Consolidated Statements of Cash Flows52 Notes to Consolidated Financial Statements
52 1. Major policies for preparing the consolidated financial statements52 2. Significant accounting policies53 3. Changes in significant accounting policies54 4. Notes to Consolidated Balance Sheets55 5. Notes to Consolidated Statements of Income56 6. Notes to Consolidated Statements of Comprehensive Income57 7. Notes to Consolidated Statements of Changes in Net Assets58 8. Notes to Consolidated Statements of Cash Flows59 9. Leases60 10. Financial instruments63 11. Marketable securities and investment securities64 12. Derivative financial instruments67 13. Provision for retirement benefits69 14. Taxes69 15. Business combinations72 16. Business segment information75 17. Information on related parties75 18. Per share information76 19. Subsequent events77 20. Borrowings77 21. Supplementary schedule of asset retirement obligations77 22. Others
78 Independent Auditor’s Report
Contents
Financial Section
45Asahi Kasei Report 2019

Millions of yenThousands of
U.S. dollars (Note 1)
ASSETS 2019 2018 2019Current assets:
Cash and deposits (Notes 8 and 10) ¥ 193,893 ¥ 156,318 $ 1,746,784
Notes and accounts receivable—trade (Note 4 (e)) 350,716 341,396 3,159,604
Merchandise and finished goods 201,699 169,948 1,817,108
Work in process 131,686 109,486 1,186,360
Raw materials and supplies 93,961 80,253 846,495
Other 82,900 83,956 746,847
Allowance for doubtful accounts (3,461) (2,411) (31,180)
Total current assets 1,051,393 938,947 9,472,009
Noncurrent assets:
Property, plant and equipment:
Buildings and structures (Note 4 (d)) 547,422 517,562 4,931,730
Accumulated depreciation (294,536) (285,760) (2,653,477)
Buildings and structures, net 252,886 231,802 2,278,252
Machinery, equipment and vehicles (Note 4 (d)) 1,439,166 1,399,081 12,965,459
Accumulated depreciation (1,222,201) (1,200,504) (11,010,820)
Machinery, equipment and vehicles, net 216,966 198,577 1,954,649
Land (Note 4 (d)) 63,889 62,938 575,577
Lease assets (Note 9) 10,159 11,698 91,523
Accumulated depreciation (9,423) (10,901) (84,892)
Lease assets, net 736 798 6,631
Construction in progress 64,188 50,502 578,270
Other (Note 4 (d)) 160,631 153,002 1,447,126
Accumulated depreciation (137,930) (135,571) (1,242,613)
Other, net 22,701 17,431 204,514
Subtotal 621,366 562,048 5,597,892
Intangible assets:
Goodwill 319,898 252,724 2,881,964
Other 210,080 161,898 1,892,613
Subtotal 529,978 414,621 4,774,577
Investments and other assets:
Investment securities (Notes 4 (a), (b), 10 and 11) 296,330 314,830 2,669,640
Long-term loans receivable (Note 10) 19,993 27,793 180,117
Deferred tax assets (Note 14) 27,508 17,775 247,820
Other 29,052 31,406 261,730
Allowance for doubtful accounts (418) (266) (3,766)
Subtotal 372,465 391,538 3,355,541
Total noncurrent assets 1,523,810 1,368,207 13,728,018
Total assets ¥ 2,575,203 ¥ 2,307,154 $ 23,200,027
The accompanying notes are an integral part of these statements.
Consolidated Financial Statements
Consolidated Balance SheetsAsahi Kasei Corporation and Consolidated SubsidiariesMarch 31, 2019 and 2018
46 Asahi Kasei Report 2019

Millions of yenThousands of
U.S. dollars (Note 1)
LIABILITIES AND NET ASSETS 2019 2018 2019Liabilities:
Current liabilities:
Notes and accounts payable—trade (Notes 4 (e) and 10) ¥ 180,429 ¥ 171,413 $ 1,625,486Short-term loans payable (Notes 10 and 20) 97,579 118,018 879,090Commercial paper (Notes 10 and 20) 77,000 20,000 693,694Current portion of bonds payable (Notes 10 and 20) 20,000 — 180,180Lease obligations (Notes 9, 10 and 20) 164 199 1,477Accrued expenses 113,221 105,787 1,020,009Income taxes payable (Note 10) 24,971 29,714 224,964Advances received 75,836 70,142 683,207Provision for grant of shares 82 28 739Provision for periodic repairs 5,342 3,185 48,126Provision for product warranties 3,102 2,730 27,946Provision for removal cost of property, plant and equipment 2,251 2,425 20,279Other 81,877 65,505 737,631Total current liabilities 681,853 589,146 6,142,820
Noncurrent liabilities:
Bonds payable (Notes 10 and 20) 20,000 20,000 180,180Long-term loans payable (Notes 10 and 20) 209,878 143,176 1,890,793Lease obligations (Notes 9, 10 and 20) 253 352 2,279Deferred tax liabilities (Note 14) 48,299 36,639 435,126Provision for grant of shares 289 172 2,604Provision for periodic repairs 2,929 3,263 26,387Provision for removal cost of property, plant and equipment 3,018 2,699 27,189Net defined benefit liability (Note 13) 168,685 170,634 1,519,685Long-term guarantee deposits (Note 10) 21,143 20,658 190,477Other 16,145 15,198 145,450Total noncurrent liabilities 490,639 412,793 4,420,171
Total liabilities 1,172,493 1,001,939 10,563,000Net assets:
Shareholders’ equity:
Capital stock
Authorized—4,000,000,000 shares
Issued and outstanding—1,402,616,332 shares 103,389 103,389 931,432Capital surplus 79,708 79,440 718,090Retained earnings (Note 7 (b) (ii)) 1,077,586 981,934 9,707,982Treasury stock (3,936) (3,930) (35,459)(2019—6,491,383 shares, 2018—6,491,617 shares)
Total shareholders’ equity 1,256,747 1,160,833 11,322,045Accumulated other comprehensive income:
Net unrealized gain on other securities 101,971 121,128 918,658Deferred gains or losses on hedges (40) 92 (360)Foreign currency translation adjustment 42,020 28,676 378,559Remeasurements of defined benefit plans (19,213) (23,343) (173,090)Total accumulated other comprehensive income 124,738 126,553 1,123,766
Non-controlling interests 21,225 17,827 191,216Total net assets 1,402,710 1,305,214 12,637,027
Commitments and contingent liabilities (Notes 4 (c) and 9)
Total liabilities and net assets ¥2,575,203 ¥2,307,154 $23,200,027
The accompanying notes are an integral part of these statements.
47Asahi Kasei Report 2019
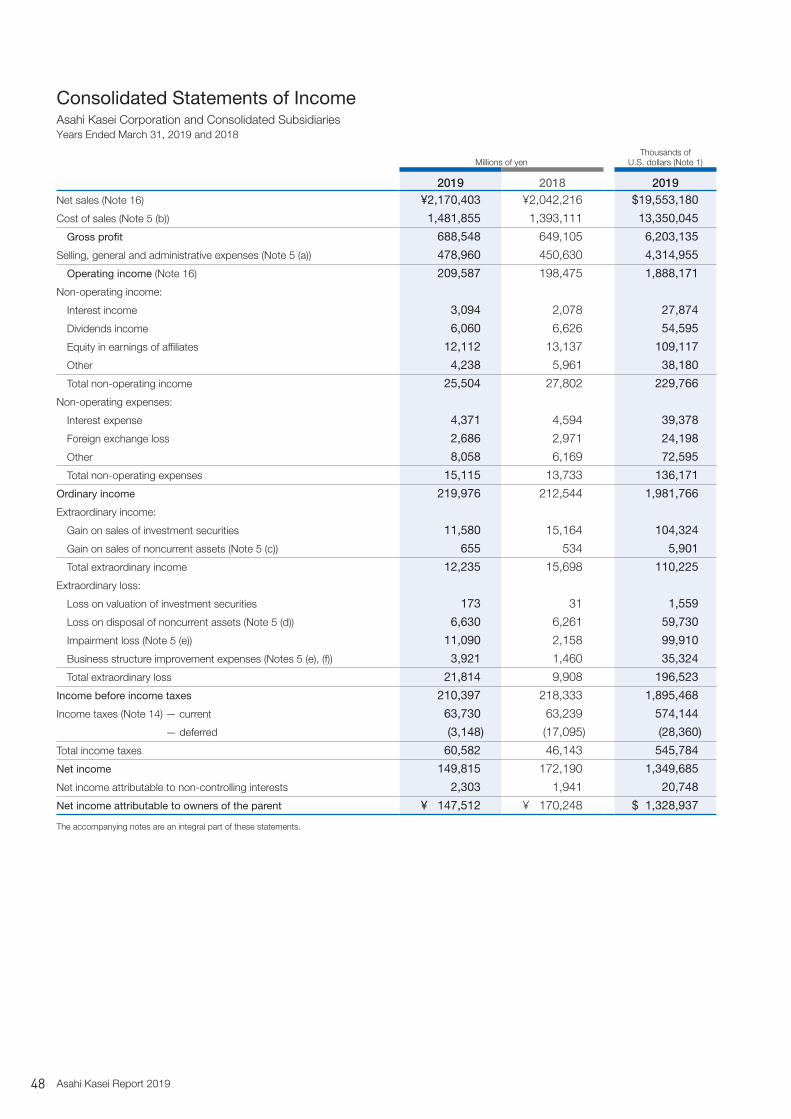
Millions of yenThousands of
U.S. dollars (Note 1)
2019 2018 2019Net sales (Note 16) ¥2,170,403 ¥2,042,216 $19,553,180
Cost of sales (Note 5 (b)) 1,481,855 1,393,111 13,350,045
Gross profit 688,548 649,105 6,203,135
Selling, general and administrative expenses (Note 5 (a)) 478,960 450,630 4,314,955
Operating income (Note 16) 209,587 198,475 1,888,171
Non-operating income:
Interest income 3,094 2,078 27,874
Dividends income 6,060 6,626 54,595
Equity in earnings of affiliates 12,112 13,137 109,117
Other 4,238 5,961 38,180
Total non-operating income 25,504 27,802 229,766
Non-operating expenses:
Interest expense 4,371 4,594 39,378
Foreign exchange loss 2,686 2,971 24,198
Other 8,058 6,169 72,595
Total non-operating expenses 15,115 13,733 136,171
Ordinary income 219,976 212,544 1,981,766
Extraordinary income:
Gain on sales of investment securities 11,580 15,164 104,324
Gain on sales of noncurrent assets (Note 5 (c)) 655 534 5,901
Total extraordinary income 12,235 15,698 110,225
Extraordinary loss:
Loss on valuation of investment securities 173 31 1,559
Loss on disposal of noncurrent assets (Note 5 (d)) 6,630 6,261 59,730
Impairment loss (Note 5 (e)) 11,090 2,158 99,910
Business structure improvement expenses (Notes 5 (e), (f)) 3,921 1,460 35,324
Total extraordinary loss 21,814 9,908 196,523
Income before income taxes 210,397 218,333 1,895,468
Income taxes (Note 14) — current 63,730 63,239 574,144
— deferred (3,148) (17,095) (28,360)
Total income taxes 60,582 46,143 545,784
Net income 149,815 172,190 1,349,685
Net income attributable to non-controlling interests 2,303 1,941 20,748
Net income attributable to owners of the parent ¥ 147,512 ¥ 170,248 $ 1,328,937
The accompanying notes are an integral part of these statements.
Consolidated Statements of IncomeAsahi Kasei Corporation and Consolidated SubsidiariesYears Ended March 31, 2019 and 2018
48 Asahi Kasei Report 2019

Millions of yenThousands of
U.S. dollars (Note 1)
2019 2018 2019Net income ¥149,815 ¥172,190 $1,349,685
Other comprehensive income:
Net (decrease) increase in unrealized gain on other securities (19,058) 7,651 (171,694)
Deferred gains or losses on hedges (132) 37 (1,189)
Foreign currency translation adjustment 12,464 (12,252) 112,288
Remeasurements of defined benefit plans 4,311 9,735 38,838Share of other comprehensive income of affiliates accounted for using equity method 1,297 356 11,685
Total other comprehensive income (Note 6) (1,119) 5,528 (10,081)
Comprehensive income ¥148,696 ¥177,717 $1,339,604
Comprehensive income attributable to:
Owners of the parent ¥146,339 ¥175,557 $1,318,369
Non-controlling interests 2,357 2,160 21,234
The accompanying notes are an integral part of these statements.
Consolidated Statements of Comprehensive IncomeAsahi Kasei Corporation and Consolidated SubsidiariesYears Ended March 31, 2019 and 2018
49Asahi Kasei Report 2019

Millions of yen
Shareholders’ equity Accumulated other comprehensive income
Capital stock
Capital surplus
Retained earnings
(Note 7 (b))Treasury
stock
Total shareholders’
equity
Net unrealized
gain on other securities
Deferred gains or
losses on hedges
Foreign currency
translation adjustment
Remeasure-ments of defined
benefit plans
Total accumulated
other comprehensive
income
Non- controlling interests
Total net assets
Balance at March 31, 2018 ¥103,389 ¥79,440 ¥ 981,934 ¥(3,930) ¥1,160,833 ¥121,128 ¥ 92 ¥28,676 ¥(23,343) ¥126,553 ¥17,827 ¥1,305,214Changes during the fiscal year:
Dividends from surplus (51,674) (51,674) (51,674)Net income attributable
to owners of the parent 147,512 147,512 147,512Purchase of treasury stock (40) (40) (40)Disposal of treasury stock 6 34 40 40Change of scope of consolidation (187) (187) (187)Capital increase of
consolidated subsidiaries 262 262 262Net changes of items other than
shareholders’ equity (19,157) (132) 13,344 4,130 (1,815) 3,398 1,582Total changes of items
during the period — 268 95,652 (6) 95,914 (19,157) (132) 13,344 4,130 (1,815) 3,398 97,496Balance at March 31, 2019 ¥103,389 ¥79,708 ¥1,077,586 ¥(3,936) ¥1,256,747 ¥101,971 ¥ (40) ¥42,020 ¥(19,213) ¥124,738 ¥21,225 ¥1,402,710
Millions of yen
Shareholders’ equity Accumulated other comprehensive income
Capital stock
Capital surplus
Retained earnings
(Note 7 (b))Treasury
stock
Total shareholders’
equity
Net unrealized
gain on other securities
Deferred gains or
losses on hedges
Foreign currency
translation adjustment
Remeasure-ments of defined
benefit plans
Total accumulated
other comprehensive
income
Non- controlling interests
Total net assets
Balance at March 31, 2017 ¥103,389 ¥79,443 ¥850,532 ¥(3,242) ¥1,030,122 ¥113,475 ¥55 ¥ 40,831 ¥(33,140) ¥121,222 ¥16,771 ¥1,168,115Changes during the fiscal year:
Dividends from surplus (39,106) (39,106) (39,106)Net income attributable
to owners of the parent 170,248 170,248 170,248Purchase of treasury stock (688) (688) (688)Disposal of treasury stock 1 1 2 2Change of scope of consolidation 259 259 259Capital increase of
consolidated subsidiaries (4) (4) (4)Net changes of items other than
shareholders’ equity 7,653 37 (12,155) 9,797 5,331 1,057 6,388Total changes of items
during the period — (3) 131,402 (687) 130,712 7,653 37 (12,155) 9,797 5,331 1,057 137,100Balance at March 31, 2018 ¥103,389 ¥79,440 ¥981,934 ¥(3,930) ¥1,160,833 ¥121,128 ¥92 ¥ 28,676 ¥(23,343) ¥126,553 ¥17,827 ¥1,305,214
Thousands of U.S. dollars (Note 1)
Shareholders’ equity Accumulated other comprehensive income
Capital stock
Capital surplus
Retained earnings
(Note 7 (b))Treasury
stock
Total shareholders’
equity
Net unrealized
gain on other securities
Deferred gains or
losses on hedges
Foreign currency
translation adjustment
Remeasure-ments of defined
benefit plans
Total accumulated
other comprehensive
income
Non- controlling interests
Total net assets
Balance at March 31, 2018 $931,432 $715,676 $8,846,252 $(35,405) $10,457,955 $1,091,243 $ 829 $258,342 $(210,297) $1,140,117 $160,604 $11,758,685 Changes during the fiscal year:
Dividends from surplus (465,532) (465,532) (465,532)Net income attributable
to owners of the parent 1,328,937 1,328,937 1,328,937 Purchase of treasury stock (360) (360) (360)Disposal of treasury stock 54 306 360 360 Change of scope of consolidation (1,685) (1,685) (1,685)Capital increase of
consolidated subsidiaries 2,360 2,360 2,360 Net changes of items other than
shareholders’ equity (172,586) (1,189) 120,216 37,207 (16,351) 30,613 14,252 Total changes of items
during the period — 2,414 861,730 (54) 864,090 (172,586) (1,189) 120,216 37,207 (16,351) 30,613 878,342 Balance at March 31, 2019 $931,432 $718,090 $9,707,982 $(35,459) $11,322,045 $ 918,658 $ (360) $378,559 $(173,090) $1,123,766 $191,216 $12,637,027
The accompanying notes are an integral part of these statements.
Consolidated Statements of Changes in Net AssetsAsahi Kasei Corporation and Consolidated SubsidiariesYears Ended March 31, 2019 and 2018
50 Asahi Kasei Report 2019

Millions of yenThousands of
U.S. dollars (Note 1)
2019 2018 2019Cash flows from operating activities:
Income before income taxes ¥ 210,397 ¥ 218,333 $ 1,895,468Depreciation and amortization 84,556 95,415 761,766Impairment loss 11,090 2,158 99,910Amortization of goodwill 19,490 18,048 175,586Amortization of negative goodwill (159) (159) (1,432)Increase in provision for grant of shares 170 200 1,532Increase in provision for periodic repairs 1,823 1,280 16,423Increase in provision for product warranties 364 280 3,279Increase (decrease) in provision for removal cost of property, plant and equipment 145 (1,066) 1,306Decrease in provision for loss on litigation — (2,137) —Decrease in net defined benefit liability (4,287) (4,875) (38,622)Interest and dividend income (9,154) (8,704) (82,468)Interest expense 4,371 4,594 39,378Equity in earnings of affiliates (12,112) (13,137) (109,117)Gain on sales of investment securities (11,580) (15,164) (104,324)Loss on valuation of investment securities 173 31 1,559Gain on sale of property, plant and equipment (655) (534) (5,901)Loss on disposal of noncurrent assets 6,630 6,261 59,730Decrease (increase) in notes and accounts receivable—trade 3,942 (38,986) 35,514Increase in inventories (57,968) (11,815) (522,234)(Decrease) increase in notes and accounts payable—trade (776) 23,020 (6,991)Increase in accrued expenses 5,859 6,014 52,784Increase (decrease) in advances received 5,266 (2,463) 47,441Other, net 15,328 17,259 138,090
Subtotal 272,914 293,851 2,458,685Interest and dividend income received 11,247 10,267 101,324Interest expense paid (4,412) (4,736) (39,748)Income taxes paid (67,687) (49,492) (609,793)
Net cash provided by operating activities 212,062 249,891 1,910,468Cash flows from investing activities:
Payments into time deposits (13,812) (9,508) (124,432)Proceeds from withdrawal of time deposits 7,880 3,012 70,991Purchase of property, plant and equipment (114,718) (82,909) (1,033,495)Proceeds from sales of property, plant and equipment 652 1,601 5,874Purchase of intangible assets (10,136) (13,363) (91,315)Purchase of investment securities (2,624) (11,564) (23,640)Proceeds from sales of investment securities 17,030 17,774 153,423Purchase of shares in subsidiaries resulting in change in scope of consolidation (93,487) — (842,225)Payments for transfer of business (2,764) — (24,901)Payments of loans receivable (5,092) (45,261) (45,874)Collection of loans receivable 18,813 30,568 169,486Other, net (659) (645) (5,937)
Net cash used in investing activities (198,917) (110,294) (1,792,045)Cash flows from financing activities:
Net decrease in short-term loans payable (36,840) (28,935) (331,892)Increase (decrease) in commercial paper 57,000 (36,000) 513,514Proceeds from long-term loans payable 85,492 15,395 770,198Repayment of long-term loans payable (53,833) (23,532) (484,982)Proceeds from issuance of bonds payable 20,000 — 180,180Redemption of bonds — (20,000) —Repayments of lease obligations (237) (389) (2,135)Purchase of treasury stock (40) (688) (360)Proceeds from disposal of treasury stock 40 2 360Cash dividends paid (51,674) (39,106) (465,532)Cash dividends paid to non-controlling interests (1,155) (1,141) (10,405)Payments from changes in ownership interests in subsidiaries that do not result in change in scope of consolidation (1,148) — (10,342)
Other, net (217) (18) (1,955)Net cash provided by (used in) financing activities 17,388 (134,412) 156,649
Effect of exchange rate change on cash and cash equivalents 543 (937) 4,892Net increase in cash and cash equivalents 31,077 4,247 279,973Cash and cash equivalents at beginning of year 148,596 144,077 1,338,703Increase in cash and cash equivalents resulting from changes in scope of consolidation 846 272 7,622
Cash and cash equivalents at end of year (Note 8) ¥ 180,520 ¥ 148,596 $ 1,626,306
The accompanying notes are an integral part of these statements.
Consolidated Statements of Cash FlowsAsahi Kasei Corporation and Consolidated SubsidiariesYears Ended March 31, 2019 and 2018
51Asahi Kasei Report 2019

1. Major policies for preparing the consolidated financial statementsThe consolidated financial statements, which are filed with the prime minister of Japan as required by the Financial Instruments and Exchange Act in Japan, are prepared in accordance with account-ing principles generally accepted in Japan, which are different in certain respects from the application and disclosure requirements of International Financial Reporting Standards. The accompanying consolidated financial statements are a translation of those filed with the prime minister of Japan and incorporate certain modifications to enhance foreign readers’ understanding of the consolidated financial statements. In addition, the notes to the consolidated financial statements include certain financial information which is not required under the disclosure regulations in Japan, but is presented herein as additional information.
The U.S. dollar amounts presented in the consolidated financial statements are included solely for the convenience of readers. These translations should not be construed as representations that the Japanese yen amounts actually represent, have been, or could be converted into U.S. dollars. As the amounts shown in U.S. dollars are for convenience only, and are not intended to be computed in accordance with generally accepted translation procedures, the approximate current exchange rate of ¥111.00 = US$1 prevailing on March 31, 2019, has been used.
Consolidation and investments in affiliated companiesThe consolidated financial statements consist of the accounts of the parent company and 203 subsidiaries (171 subsidiaries at March 31, 2018, hereinafter collectively referred to as the “Company”) which,
with minor exceptions due to immateriality, are all majority or wholly owned companies, including 6 core operating companies (Asahi Kasei Homes Corp., Asahi Kasei Construction Materials Corp., Asahi Kasei Microdevices Corp., Asahi Kasei Pharma Corp., Asahi Kasei Medical Co., Ltd., and ZOLL Medical Corporation). Material inter-company transactions and accounts have been eliminated.
Investments in unconsolidated subsidiaries and 20% to 50% owned companies in which the Company exercises significant influence are accounted for, with minor exceptions due to immaterial-ity, using the equity method of accounting. There were 53 such unconsolidated subsidiaries and 20% to 50% owned companies to which the equity method is applied at March 31, 2019 (54 at March 31, 2018), including Asahi Kasei EIC Solutions Corp. and Asahi Yukizai Corporation.
Certain subsidiaries’ results are reported in the consolidated financial statements using a fiscal year ending December 31. Material differences in inter-company transactions and accounts arising from the use of different fiscal year-ends are appropriately adjusted for through consolidation procedures.
All assets and liabilities of acquired companies are measured at their fair value and any difference between the net assets and the cost of investment is recognized as goodwill or negative goodwill. Goodwill, and negative goodwill incurred through business combina-tions which took place before April 1, 2010, are amortized using the straight-line method over a reasonable period during which their effects would last, with the exception of minor amounts which are charged to income as incurred.
2. Significant accounting policies
(a) Cash and cash equivalentsFor cash flow statement purposes, cash and cash equivalents include all highly liquid investments, generally with original maturities of three months or less, which are readily convertible to known amounts of cash, and therefore present an insignificant risk of changes in value due to changes in interest rates.
(b) InventoriesInventories held for sale in the ordinary course of business are stated at the lower of cost or net realizable value. Residential lots and dwell-ings for sale are stated at specifically identified costs.
(c) Noncurrent assets and depreciation/amortizationProperty, plant and equipment (except for lease assets) are stated at cost. Significant renewals and improvements are capitalized at cost, while maintenance and repairs are charged to income as incurred. Depreciation is provided for under the straight-line method, at rates based on estimated useful lives of the assets, principally ranging from 7 to 60 years for buildings and from 2 to 22 years for machinery and equipment and vehicles.
Intangible fixed assets (except for lease assets), including software for internal use, are mainly amortized using the straight-line method over the estimated useful lives of the assets. The estimated useful life of software for internal use is mainly 5 years.
Lease assets (financing lease transactions without title transfer) are depreciated/amortized on a straight-line basis over the period of the lease with no residual value.
(d) Significant allowances
i) Allowance for doubtful accountsEstimates of the unrecoverable portion of receivables, generally based on historical rates and for specific receivables of particular concern based on individual estimates of recoverability, are recog-nized as allowance for doubtful accounts.
ii) Provision for periodic repairsThe portion of foreseeable periodic repair expenses deemed to correspond to normal wear and tear of plant and equipment as of the
closing date of the fiscal year is recognized as provision for periodic repairs.
iii) Provision for product warrantiesEstimates of product warranty expenses based on historical rates are recognized as provision for product warranties.
iv) Provision for removal cost of property, plant and equipmentProvision for removal cost of property, plant and equipment is recorded based on estimated future removal cost of property, plant and equipment at the end of each fiscal year.
v) Provision for grant of shares To record the grant of shares to Directors, etc., in accordance with Share Grant Regulations, the provision for grant of shares is recorded based on an estimate of grant of shares liabilities as of the closing date of the fiscal year.
(e) Accounting for retirement benefits
i) Method of attributing expected retirement benefits to each period
In calculating retirement benefit obligations, the Company applies a method of attributing expected retirement benefits to each period based on a benefit formula basis.
ii) Accounting for actuarial gains/losses and prior service costsActuarial gains/losses are amortized using the straight-line method from the fiscal year following their accrual over a certain period (mainly 10 years) within the average remaining service period of employees at the time of accrual. Prior service costs are amortized using the straight-line method over a certain period (mainly 10 years) within the average remaining service period of employees at the time of accrual.
iii) Adoption of the simplified methodIn calculating expected defined benefit liability and periodic retirement benefit expenses, certain consolidated subsidiaries have adopted the simplified method. Under this method, the expected defined benefit liability is recorded at the severance payment amount to be required should all employees retire voluntarily at fiscal year end.
Notes to Consolidated Financial StatementsAsahi Kasei Corporation and Consolidated Subsidiaries
52 Asahi Kasei Report 2019

(f) Significant revenue and expense recognition
i) Construction activities that are realizable as of fiscal year endThe percentage-of-completion method (progress of work is esti-mated using the percentage of costs incurred to the total projected costs) is applied.
ii) Other construction activitiesThe completed-contract method is used.
(g) Financial instruments
i) SecuritiesSecurities are classified into four categories: trading securities, held-to-maturity debt securities, equity securities of unconsolidated subsidiaries and affiliates, and other securities. At March 31, 2019 and 2018, the Company did not have trading securities or held-to-maturity debt securities.
Equity securities of unconsolidated subsidiaries and affiliates are accounted for, with minor exceptions due to immateriality, using the equity method of accounting.
Other securities whose fair values are readily determinable are carried at fair value with net unrealized gains or losses, net of income taxes, being included as a component of net assets. Other securities whose fair values are not readily determinable are stated at cost. In cases where any significant decline in the realizable value is assessed to be other than temporary, the cost of other securities is devalued by the impaired amount and is charged to income. Realized gains and losses are determined using the average cost method and are reflected in the consolidated income statements.
ii) Derivative financial instrumentsAll derivatives are stated at fair value. Gains or losses arising from changes in fair value are recognized in the period in which they arise,
except for derivatives that are designated as hedging instruments. Gains or losses arising from changes in fair value of these qualifying hedges are deferred as “Deferred gains or losses on hedges” until being offset against gains or losses of the underlying hedged assets and liabilities.
(h) TaxesAccrued income taxes are stated at the estimated amount of payables for corporation, enterprise, and inhabitant taxes. The asset and liability approach is used to recognize deferred tax assets and liabilities for the expected future tax consequences of temporary dif-ferences between the carrying amounts and the tax bases of assets and liabilities.
The Company has elected to file its return under the consolidated tax filing system in Japan. Transactions subject to consumption taxes are recorded at amounts net of consumption taxes.
(i) Translation of foreign currenciesForeign currency receivables and payables are translated into Japanese yen at the exchange rates prevailing at the balance sheet date. Resulting gains and losses are charged to income for the period.
Assets and liabilities of foreign subsidiaries are translated into Japanese yen at fiscal year-end exchange rates, and income and expenses of same are translated into Japanese yen at the average exchange rate for the fiscal year. Shareholders’ equity of foreign subsidiaries is translated into Japanese yen at the historical exchange rates. The translation differences in Japanese yen amounts arising from the use of different rates are recognized as foreign currency translation adjustments in the consolidated balance sheets. A portion of the foreign currency translation adjustment is allocated to non-controlling interests and the Company’s portion is presented as a separate component of net assets in the consolidated balance sheets.
3. Changes in significant accounting policies
(a) Accounting Standards issued but not yet applied
i) Accounting Standard for Business Combinations and Guidance on Accounting Standard for Business Combinations and Accounting Standard for Business Divestitures
The Accounting Standards Board of Japan (ASBJ) issued ASBJ Guidance No. 21 “Accounting Standard for Business Combinations” and ASBJ Guidance No. 10 “Guidance on Accounting Standard for Business Combinations and Accounting Standard for Business Divestitures.” The accounting treatment of contingent returnable considerations was clarified. The Company will apply the standard and guidance for business combinations performed after the begin-ning of the fiscal year ending March 31, 2020. The effects on the consolidated financial statements are currently being assessed.
ii) Accounting Standard for Revenue Recognition and Implementation Guidance on Accounting Standard for Revenue Recognition
The ASBJ issued ASBJ Statement No. 29 “Accounting Standard for Revenue Recognition” and ASBJ Guidance No. 30 “Implementation Guidance on Accounting Standard for Revenue Recognition.” This is a comprehensive standard related to revenue recognition, with the following five steps to be applied for recognition of revenue:
Step 1: Identify the contract with customersStep 2: Identify the separate performance obligationsStep 3: Determine the transaction price of the contractStep 4: Allocate the transaction price to each of the separate
performance obligationsStep 5: Recognize the revenue as each performance obligation is
satisfiedThe Company will apply the standard and guidance from the
beginning of the fiscal year ending March 31, 2022. At the time of the preparation of the consolidated financial statements, the effects are being assessed.
(b) Changes in accounting policy difficult to distinguish from changes in accounting estimates
Change in method of depreciation of property, plant and equipmentWhere Asahi Kasei and its subsidiaries in Japan previously had primar-ily applied the declining-balance method for depreciation of property, plant and equipment (except for lease assets), this was changed to the straight-line method from the fiscal year ended March 31, 2019.
The Asahi Kasei Group has continued to acquire overseas companies in recent years, and since overseas subsidiaries apply the straight-line method for depreciation of property, plant and equip-ment, there is an increase in the proportion of property, plant and equipment depreciated by the straight-line method.
Furthermore, the Asahi Kasei Group is currently advancing investments to expand businesses with competitive superiority, as well as investments for modification and rationalization, based on the “Cs for Tomorrow 2018” three-year strategic management initiative. Large-scale investments in domestic manufacturing plants were implemented, especially in the Material sector, during the fiscal year ended March 31, 2019, the final fiscal year of the three-year period. As such expansions of manufacturing plants are successively starting operations beginning from the fiscal year ended March 31, 2019, the situation of domestic capital expenditure is changing.
This changing situation surrounding property, plant and equipment presented an opportunity to reconsider the method of depreciation.
Long-term and stable operation of the property, plant and equipment of Asahi Kasei and its subsidiaries in Japan is expected to contribute to the achievement of stable earnings for Asahi Kasei and its subsidiaries in Japan. Therefore, it was determined that adoption of the straight-line method of depreciation of property, plant and equipment in Japan as well would not only be a cost allocation method more accurately reflecting the state of use of property, plant and equipment, but also more appropriate for performance manage-ment of the Asahi Kasei Group.
53Asahi Kasei Report 2019

As a result, operating income increased by ¥9,727 million (US$87,631 thousand), and ordinary income and income before income taxes increased respectively by ¥9,760 million (US$87,928 thousand) in the fiscal year ended March 31, 2019.
(c) Changes in presentation
i) Application of Partial Amendments to Accounting Standard for Tax Effect Accounting
“Partial Amendments to Accounting Standard for Tax Effect Accounting” (ASBJ Statement No. 28) issued by the Accounting Standards Board of Japan is applied from the fiscal year ended March 31, 2019. Accordingly, all deferred tax assets are shown under investments and other assets, and all deferred tax liabilities are shown under noncurrent liabilities.
For the consolidated balance sheets for the fiscal year ended March 31, 2018, deferred tax assets of ¥20,032 million under current
assets and deferred tax liabilities of ¥8,983 million under noncurrent liabilities are included in the ¥17,775 million shown as deferred tax assets under investments and other assets, while deferred tax liabilities are shown as ¥36,639 million.
ii) Consolidated balance sheetsAsset retirement obligations, which were reported separately under current liabilities and noncurrent liabilities for the fiscal year ended March 31, 2018, are included in other from the fiscal year ended March 31, 2019, due to diminished materiality. Consolidated balance sheets for the fiscal year ended March 31, 2018, are restated to reflect this change. The consolidated balance sheets for the fiscal year ended March 31, 2018 have been reclassified accordingly, resulting in asset retirement obligations of ¥557 million under current liabilities being included in other under current liabilities, and asset retirement obligations of ¥3,282 million under noncurrent liabilities being included in other under noncurrent liabilities.
4. Notes to Consolidated Balance Sheets
(a) Investment securitiesAmong investment securities, shares of unconsolidated subsidiaries and affiliates as of March 31, 2019 and 2018, amounted to ¥98,357 million (US$886,099 thousand) and ¥83,487 million, respectively. Included in those amounts are investments in joint ventures of ¥52,095 million (US$469,324 thousand) and ¥43,168 million, respectively.
(b) Pledged assets and secured debtInvestment securities pledged to suppliers as transaction guarantees at March 31, 2019 and 2018, were ¥65 million (US$586 thousand) and ¥72 million, respectively.
(c) Contingent liabilitiesContingent liabilities at March 31, 2019 and 2018, arising in the ordinary course of business were as follows:
Millions of yen Thousands of U.S. dollars
2019 2018 2019
Loans guaranteed ¥38,736 ¥39,457 $348,973
Total ¥38,736 ¥39,457 $348,973
(d) Deferred gain on property, plant and equipment deducted for tax purposesThe accumulated reduced-value entries, which are directly deducted from property, plant and equipment, as of March 31, 2019 and 2018, were ¥9,792 million (US$88,216 thousand) and ¥9,999 million, respectively. The breakdown of reduced-value entries as of March 31, 2019 and 2018, was as follows:
Millions of yen Thousands of U.S. dollars
2019 2018 2019
Buildings and structures ¥3,324 ¥3,320 $29,946
Machinery, equipment and vehicles 6,156 6,366 55,459
Land 167 167 1,505
Other 145 146 1,306
Total ¥9,792 ¥9,999 $88,216
(e) Notes maturing on March 31, 2019Although financial institutions in Japan were closed on March 31, 2019, and notes maturing on that date were actually settled on the following business day, April 1, 2019, those were accounted for as if settled on March 31, 2019.
The breakdown of those notes at March 31, 2019 was as follows:Millions of yen Thousands of U.S. dollars
2019 2018 2019
Notes and accounts receivable—trade ¥2,799 ¥2,501 $25,216
Notes and accounts payable—trade 1,273 1,301 11,468
54 Asahi Kasei Report 2019

5. Notes to Consolidated Statements of Income
(a) Selling, general and administrative expensesMajor components of selling, general and administrative expenses for the years ended March 31, 2019 and 2018, were as follows:
Millions of yen Thousands of U.S. dollars
2019 2018 2019
Salaries and benefits ¥186,552 ¥174,659 $1,680,649
Research and development* 62,924 61,998 566,883
Freight and storage 41,353 38,568 372,550* The aggregate amounts of research and development expenses included in manufacturing costs and selling, general and administrative expenses for the years ended March 31, 2019 and
2018, were ¥90,124 million (US$811,928 thousand) and ¥85,695 million, respectively.
(b) Gain or loss on valuation of inventoriesInventories held for sale in the ordinary course of business are stated at the lower of cost or net realizable value. (Gain) loss on valuation of inventories for the years ended March 31, 2019 and 2018, were as follows:
Millions of yen Thousands of U.S. dollars
2019 2018 2019
¥535 ¥(224) $4,820
(c) Gain on sales of noncurrent assetsMajor components of gain on sales of noncurrent assets for the years ended March 31, 2019 and 2018, were as follows:
Millions of yen Thousands of U.S. dollars
2019 2018 2019
Land ¥497 ¥466 $4,477
Machinery 8 48 72
Other 150 20 1,351
(d) Loss on disposal of noncurrent assetsLoss on disposal of noncurrent assets for the years ended March 31, 2019 and 2018, was primarily loss on abandonment and sale of buildings, machinery and equipment, etc. The abandonment and sale of buildings, machinery and equipment, etc. were performed under a single, all-inclusive contract for each facility.
(e) Impairment lossMajor components of impairment losses for the years ended March 31, 2019 and 2018, were as follows:
Millions of yenThousands of U.S. dollars
Use Asset class Location 2019 2018 2019Item on the Consolidated
Statements of Income
Goodwill related to new electronic device business Goodwill — ¥ — ¥997 $ — Impairment loss
Facility for storage of waste Buildings, etc.Kawasaki Ward Kawasaki, Kanagawa, etc.
— 557 — Impairment loss
Equipment for dry-heat treatment of nonwovens Buildings, etc. Nobeoka, Miyazaki,
etc. — 284 — Impairment loss
Others Buildings, etc. Moriyama, Shiga, etc. — 381 — Impairment loss and business structure improvement expenses
Production facility for pharmaceuticals business
Goodwill and Other Intangible assets
— 6,657 — 59,973 Impairment loss
Production facility for battery materials
Machinery and equipment, etc. Cheongju, Korea 2,966 — 26,721 Impairment loss
Production facility for synthetic fibers
Machinery and equipment, etc.
Nordrhein-Westfalen, Federal Republic of Germany
947 — 8,532 Impairment loss
Production facility for synthetic resin Buildings, etc. Kawasaki Ward
Kawasaki, Kanagawa 468 — 4,216 Business structure improvement expenses
Production facility for artificial kidneys and therapeutic apheresis devices
Machinery and equipment, etc. Nobeoka, Miyazaki 170 — 1,532 Impairment loss
Others Construction in progress, etc. Fuji, Shizuoka, etc. 381 — 3,432 Impairment loss and business
structure improvement expenses
55Asahi Kasei Report 2019
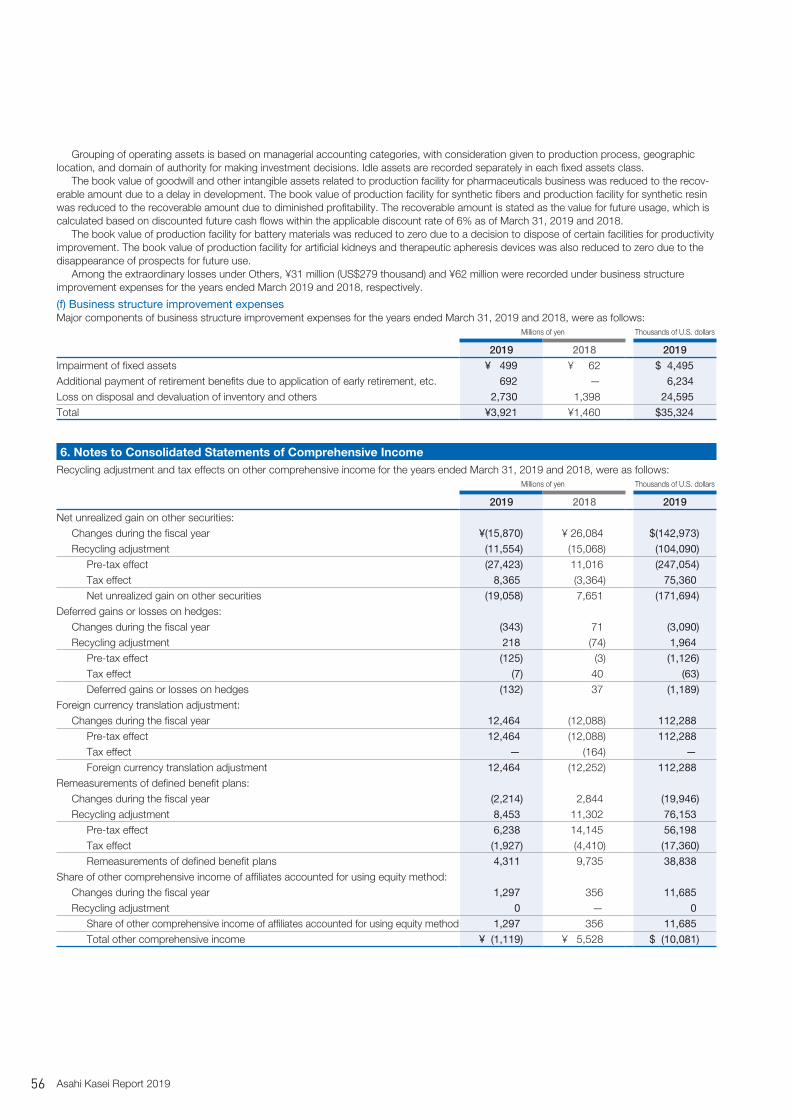
Grouping of operating assets is based on managerial accounting categories, with consideration given to production process, geographic location, and domain of authority for making investment decisions. Idle assets are recorded separately in each fixed assets class.
The book value of goodwill and other intangible assets related to production facility for pharmaceuticals business was reduced to the recov-erable amount due to a delay in development. The book value of production facility for synthetic fibers and production facility for synthetic resin was reduced to the recoverable amount due to diminished profitability. The recoverable amount is stated as the value for future usage, which is calculated based on discounted future cash flows within the applicable discount rate of 6% as of March 31, 2019 and 2018.
The book value of production facility for battery materials was reduced to zero due to a decision to dispose of certain facilities for productivity improvement. The book value of production facility for artificial kidneys and therapeutic apheresis devices was also reduced to zero due to the disappearance of prospects for future use.
Among the extraordinary losses under Others, ¥31 million (US$279 thousand) and ¥62 million were recorded under business structure improvement expenses for the years ended March 2019 and 2018, respectively.
(f) Business structure improvement expensesMajor components of business structure improvement expenses for the years ended March 31, 2019 and 2018, were as follows:
Millions of yen Thousands of U.S. dollars
2019 2018 2019
Impairment of fixed assets ¥ 499 ¥ 62 $ 4,495
Additional payment of retirement benefits due to application of early retirement, etc. 692 — 6,234
Loss on disposal and devaluation of inventory and others 2,730 1,398 24,595
Total ¥3,921 ¥1,460 $35,324
6. Notes to Consolidated Statements of Comprehensive IncomeRecycling adjustment and tax effects on other comprehensive income for the years ended March 31, 2019 and 2018, were as follows:
Millions of yen Thousands of U.S. dollars
2019 2018 2019
Net unrealized gain on other securities:Changes during the fiscal year ¥(15,870) ¥ 26,084 $(142,973)
Recycling adjustment (11,554) (15,068) (104,090)
Pre-tax effect (27,423) 11,016 (247,054)
Tax effect 8,365 (3,364) 75,360
Net unrealized gain on other securities (19,058) 7,651 (171,694)
Deferred gains or losses on hedges:Changes during the fiscal year (343) 71 (3,090)
Recycling adjustment 218 (74) 1,964
Pre-tax effect (125) (3) (1,126)
Tax effect (7) 40 (63)
Deferred gains or losses on hedges (132) 37 (1,189)
Foreign currency translation adjustment:Changes during the fiscal year 12,464 (12,088) 112,288
Pre-tax effect 12,464 (12,088) 112,288
Tax effect — (164) —
Foreign currency translation adjustment 12,464 (12,252) 112,288
Remeasurements of defined benefit plans:Changes during the fiscal year (2,214) 2,844 (19,946)
Recycling adjustment 8,453 11,302 76,153
Pre-tax effect 6,238 14,145 56,198
Tax effect (1,927) (4,410) (17,360)
Remeasurements of defined benefit plans 4,311 9,735 38,838
Share of other comprehensive income of affiliates accounted for using equity method:Changes during the fiscal year 1,297 356 11,685
Recycling adjustment 0 — 0
Share of other comprehensive income of affiliates accounted for using equity method 1,297 356 11,685
Total other comprehensive income ¥ (1,119) ¥ 5,528 $ (10,081)
56 Asahi Kasei Report 2019

7. Notes to Consolidated Statements of Changes in Net Assets
For the year ended March 31, 2019
(a) Class and total number of issued and outstanding shares and treasury stockThousands of shares
Number of shares as of March 31, 2018
Increase in number of shares during the fiscal year
Decrease in number of shares during the fiscal year
Number of shares as of March 31, 2019
Issued and outstanding sharesCommon stock 1,402,616 — — 1,402,616Total 1,402,616 — — 1,402,616
Treasury stockCommon stock (Notes 1, 2 and 3) 6,492 31 32 6,491Total 6,492 31 32 6,491
Notes: 1. The increase of 31 thousand shares in common stock of treasury stock was due to the purchase of shares in quantities of less than one share unit. 2. The decrease of 32 thousand shares in common stock of treasury stock was primarily attributable to the disposal of 22 thousand shares by the trust for granting shares to Directors,
etc., and the sale of 10 thousand shares in quantities of less than one share unit. 3. The number of shares of treasury stock as of March 31, 2019, includes 442 thousand shares held by the trust for granting shares to Directors, etc.
(b) Dividends
i) Cash dividends paid
1) The following was resolved by the Board of Directors on May 11, 2018.Dividends for common stock
Total dividends ¥27,932 million (US$251,640 thousand)Dividend per share ¥20.00 (US$0.18)Date of record March 31, 2018Payment date June 5, 2018
Note: Total dividends includes ¥9 million (US$81 thousand) for shares held by the trust for granting shares to Directors, etc.
2) The following was resolved by the Board of Directors on November 2, 2018.Dividends for common stock
Total dividends ¥23,742 million (US$213,892 thousand)Dividend per share ¥17.00 (US$0.15)Date of record September 30, 2018Payment date December 3, 2018
Note: Total dividends includes ¥8 million (US$72 thousand) for shares held by the trust for granting shares to Directors, etc.
ii) Dividends for which the date of record falls within the fiscal year under review but the payment date occurs in the following fiscal year
The following was resolved by the Board of Directors on May 10, 2019.Dividends for common stock
Total dividends ¥23,742 million (US$213,892 thousand)Source of dividends Retained earningsDividend per share ¥17.00 (US$0.15)Date of record March 31, 2019Payment date June 4, 2019
Note: Total dividends includes ¥8 million (US$72 thousand) for shares held by the trust for granting shares to Directors, etc.
57Asahi Kasei Report 2019

For the year ended March 31, 2018
(a) Class and total number of issued and outstanding shares and treasury stockThousands of shares
Number of shares as of March 31, 2017
Increase in number of shares during the fiscal year
Decrease in number of shares during the fiscal year
Number of shares as of March 31, 2018
Issued and outstanding sharesCommon stock 1,402,616 — — 1,402,616Total 1,402,616 — — 1,402,616
Treasury stockCommon stock (Notes 1, 2 and 3) 5,959 534 1 6,492Total 5,959 534 1 6,492
Notes: 1. The increase of 534 thousand shares in common stock of treasury stock was primarily attributable to the purchase of 464 thousand shares by the trust for granting shares to Directors, etc., and the purchase of 70 thousand shares in quantities of less than one share unit.
2. The decrease of 1 thousand shares in common stock of treasury stock was due to the sale of shares in quantities of less than one share unit. 3. The number of shares of treasury stock as of March 31, 2018, includes 464 thousand shares held by the trust for granting shares to Directors, etc.
(b) Dividends
i) Cash dividends paid
1) The following was resolved by the Board of Directors on May 11, 2017.Dividends for common stock
Total dividends ¥19,553 millionDividend per share ¥14.00Date of record March 31, 2017Payment date June 6, 2017
2) The following was resolved by the Board of Directors on November 7, 2017.Dividends for common stock
Total dividends ¥19,552 millionDividend per share ¥14.00Date of record September 30, 2017Payment date December 1, 2017
Note: Total dividends includes ¥6 million for shares held by the trust for granting shares to Directors, etc.
ii) Dividends for which the date of record falls within the fiscal year under review but the payment date occurs in the following fiscal year
The following was resolved by the Board of Directors on May 11, 2018.Dividends for common stock
Total dividends ¥27,932 millionSource of dividends Retained earningsDividend per share ¥20.00Date of record March 31, 2018Payment date June 5, 2018
Note: Total dividends includes ¥9 million for shares held by the trust for granting shares to Directors, etc.
8. Notes to Consolidated Statements of Cash Flows
(a) Cash and cash equivalentsReconciliation of cash and cash equivalents on the consolidated statements of cash flows to the amounts disclosed on the consolidated bal-ance sheets at March 31, 2019 and 2018, was as follows:
Millions of yen Thousands of U.S. dollars
2019 2018 2019
Cash and deposits ¥193,893 ¥156,318 $1,746,784
Time deposits with deposit term of over 3 months (13,374) (7,722) (120,486)
Cash and cash equivalents ¥180,520 ¥148,596 $1,626,306
58 Asahi Kasei Report 2019
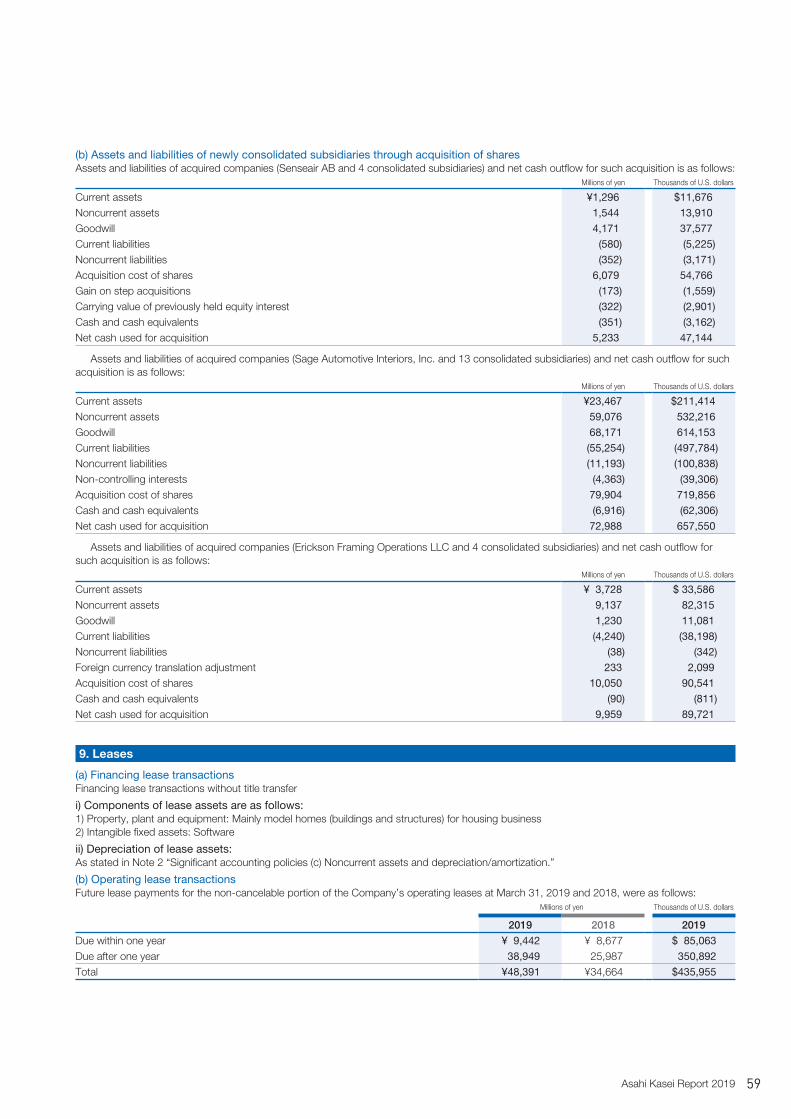
(b) Assets and liabilities of newly consolidated subsidiaries through acquisition of sharesAssets and liabilities of acquired companies (Senseair AB and 4 consolidated subsidiaries) and net cash outflow for such acquisition is as follows:
Millions of yen Thousands of U.S. dollars
Current assets ¥1,296 $11,676
Noncurrent assets 1,544 13,910
Goodwill 4,171 37,577
Current liabilities (580) (5,225)
Noncurrent liabilities (352) (3,171)
Acquisition cost of shares 6,079 54,766
Gain on step acquisitions (173) (1,559)
Carrying value of previously held equity interest (322) (2,901)
Cash and cash equivalents (351) (3,162)
Net cash used for acquisition 5,233 47,144
Assets and liabilities of acquired companies (Sage Automotive Interiors, Inc. and 13 consolidated subsidiaries) and net cash outflow for such acquisition is as follows:
Millions of yen Thousands of U.S. dollars
Current assets ¥23,467 $211,414
Noncurrent assets 59,076 532,216
Goodwill 68,171 614,153
Current liabilities (55,254) (497,784)
Noncurrent liabilities (11,193) (100,838)
Non-controlling interests (4,363) (39,306)
Acquisition cost of shares 79,904 719,856
Cash and cash equivalents (6,916) (62,306)
Net cash used for acquisition 72,988 657,550
Assets and liabilities of acquired companies (Erickson Framing Operations LLC and 4 consolidated subsidiaries) and net cash outflow for such acquisition is as follows:
Millions of yen Thousands of U.S. dollars
Current assets ¥ 3,728 $ 33,586
Noncurrent assets 9,137 82,315
Goodwill 1,230 11,081
Current liabilities (4,240) (38,198)
Noncurrent liabilities (38) (342)
Foreign currency translation adjustment 233 2,099
Acquisition cost of shares 10,050 90,541
Cash and cash equivalents (90) (811)
Net cash used for acquisition 9,959 89,721
9. Leases
(a) Financing lease transactionsFinancing lease transactions without title transfer
i) Components of lease assets are as follows:1) Property, plant and equipment: Mainly model homes (buildings and structures) for housing business2) Intangible fixed assets: Software
ii) Depreciation of lease assets:As stated in Note 2 “Significant accounting policies (c) Noncurrent assets and depreciation/amortization.”
(b) Operating lease transactionsFuture lease payments for the non-cancelable portion of the Company’s operating leases at March 31, 2019 and 2018, were as follows:
Millions of yen Thousands of U.S. dollars
2019 2018 2019
Due within one year ¥ 9,442 ¥ 8,677 $ 85,063
Due after one year 38,949 25,987 350,892
Total ¥48,391 ¥34,664 $435,955
59Asahi Kasei Report 2019
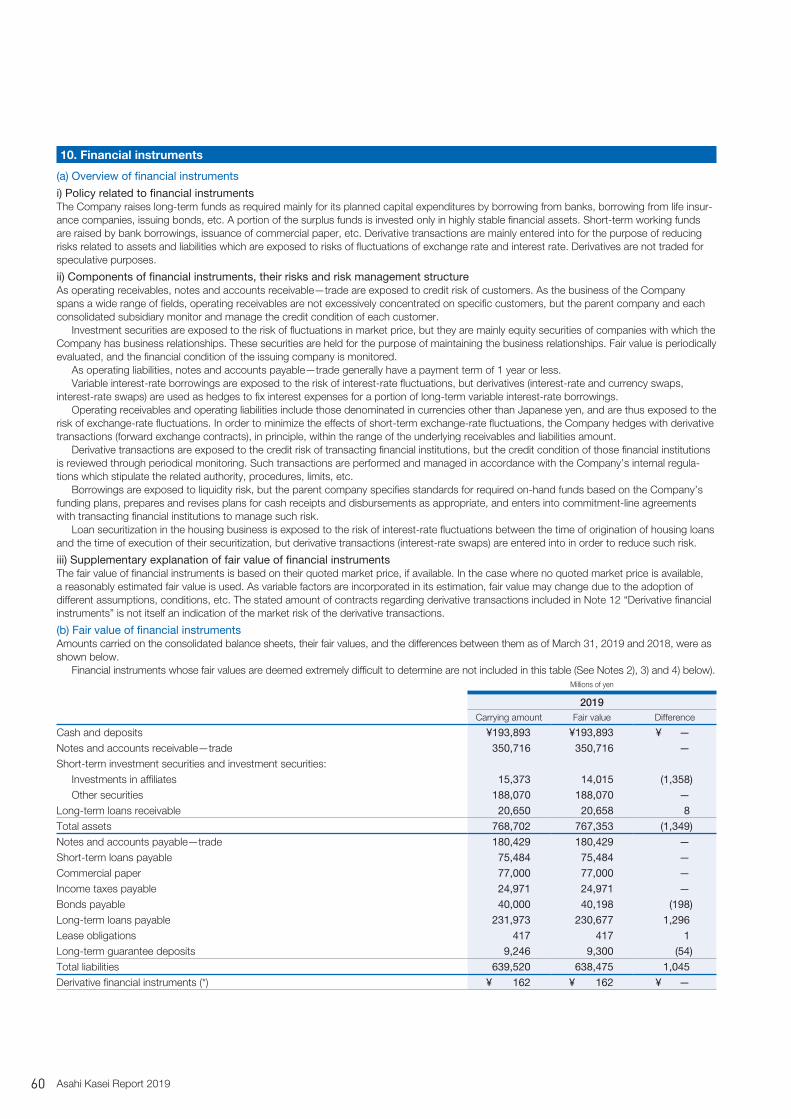
10. Financial instruments
(a) Overview of financial instruments
i) Policy related to financial instrumentsThe Company raises long-term funds as required mainly for its planned capital expenditures by borrowing from banks, borrowing from life insur-ance companies, issuing bonds, etc. A portion of the surplus funds is invested only in highly stable financial assets. Short-term working funds are raised by bank borrowings, issuance of commercial paper, etc. Derivative transactions are mainly entered into for the purpose of reducing risks related to assets and liabilities which are exposed to risks of fluctuations of exchange rate and interest rate. Derivatives are not traded for speculative purposes.
ii) Components of financial instruments, their risks and risk management structureAs operating receivables, notes and accounts receivable—trade are exposed to credit risk of customers. As the business of the Company spans a wide range of fields, operating receivables are not excessively concentrated on specific customers, but the parent company and each consolidated subsidiary monitor and manage the credit condition of each customer.
Investment securities are exposed to the risk of fluctuations in market price, but they are mainly equity securities of companies with which the Company has business relationships. These securities are held for the purpose of maintaining the business relationships. Fair value is periodically evaluated, and the financial condition of the issuing company is monitored.
As operating liabilities, notes and accounts payable—trade generally have a payment term of 1 year or less.Variable interest-rate borrowings are exposed to the risk of interest-rate fluctuations, but derivatives (interest-rate and currency swaps,
interest-rate swaps) are used as hedges to fix interest expenses for a portion of long-term variable interest-rate borrowings.Operating receivables and operating liabilities include those denominated in currencies other than Japanese yen, and are thus exposed to the
risk of exchange-rate fluctuations. In order to minimize the effects of short-term exchange-rate fluctuations, the Company hedges with derivative transactions (forward exchange contracts), in principle, within the range of the underlying receivables and liabilities amount.
Derivative transactions are exposed to the credit risk of transacting financial institutions, but the credit condition of those financial institutions is reviewed through periodical monitoring. Such transactions are performed and managed in accordance with the Company’s internal regula-tions which stipulate the related authority, procedures, limits, etc.
Borrowings are exposed to liquidity risk, but the parent company specifies standards for required on-hand funds based on the Company’s funding plans, prepares and revises plans for cash receipts and disbursements as appropriate, and enters into commitment-line agreements with transacting financial institutions to manage such risk.
Loan securitization in the housing business is exposed to the risk of interest-rate fluctuations between the time of origination of housing loans and the time of execution of their securitization, but derivative transactions (interest-rate swaps) are entered into in order to reduce such risk.
iii) Supplementary explanation of fair value of financial instrumentsThe fair value of financial instruments is based on their quoted market price, if available. In the case where no quoted market price is available, a reasonably estimated fair value is used. As variable factors are incorporated in its estimation, fair value may change due to the adoption of different assumptions, conditions, etc. The stated amount of contracts regarding derivative transactions included in Note 12 “Derivative financial instruments” is not itself an indication of the market risk of the derivative transactions.
(b) Fair value of financial instrumentsAmounts carried on the consolidated balance sheets, their fair values, and the differences between them as of March 31, 2019 and 2018, were as shown below.
Financial instruments whose fair values are deemed extremely difficult to determine are not included in this table (See Notes 2), 3) and 4) below).Millions of yen
2019Carrying amount Fair value Difference
Cash and deposits ¥193,893 ¥193,893 ¥ —
Notes and accounts receivable—trade 350,716 350,716 —
Short-term investment securities and investment securities:Investments in affiliates 15,373 14,015 (1,358)
Other securities 188,070 188,070 —
Long-term loans receivable 20,650 20,658 8
Total assets 768,702 767,353 (1,349)
Notes and accounts payable—trade 180,429 180,429 —
Short-term loans payable 75,484 75,484 —
Commercial paper 77,000 77,000 —
Income taxes payable 24,971 24,971 —
Bonds payable 40,000 40,198 (198)
Long-term loans payable 231,973 230,677 1,296
Lease obligations 417 417 1
Long-term guarantee deposits 9,246 9,300 (54)
Total liabilities 639,520 638,475 1,045
Derivative financial instruments (*) ¥ 162 ¥ 162 ¥ —
60 Asahi Kasei Report 2019

Millions of yen
2018Carrying amount Fair value Difference
Cash and deposits ¥156,318 ¥156,318 ¥ —Notes and accounts receivable—trade 341,396 341,396 —Short-term investment securities and investment securities:
Investments in affiliates 15,353 16,471 1,118Other securities 221,708 221,708 —
Long-term loans receivable 28,442 28,445 3Total assets 763,217 764,338 1,121Notes and accounts payable—trade 171,413 171,413 —Short-term loans payable 58,898 58,898 —Commercial paper 20,000 20,000 —Income taxes payable 29,714 29,714 —Bonds payable 20,000 20,420 (420)Long-term loans payable 202,296 199,485 2,811Lease obligations 551 551 (0)Long-term guarantee deposits 8,696 8,726 (30)Total liabilities 511,568 509,207 2,361Derivative financial instruments (*) ¥ 1,257 ¥ 1,257 ¥ —
Thousands of U.S. dollars
2019Carrying amount Fair value Difference
Cash and deposits $1,746,784 $1,746,784 $ —
Notes and accounts receivable—trade 3,159,604 3,159,604 —
Short-term investment securities and investment securities:Investment in affiliates 138,495 126,261 (12,234)
Other securities 1,694,324 1,694,324 —
Long-term loans receivable 186,036 186,108 72
Total assets 6,925,243 6,913,090 (12,153)
Notes and accounts payable—trade 1,625,486 1,625,486 —
Short-term loans payable 680,036 680,036 —
Commercial paper 693,694 693,694 —
Income taxes payable 224,964 224,964 —
Bonds payable 360,360 362,144 (1,784)
Long-term loans payable 2,089,847 2,078,171 11,676
Lease obligations 3,757 3,757 0
Long-term guarantee deposits 83,297 83,784 (486)
Total liabilities 5,761,441 5,752,027 9,414
Derivative financial instruments (*) $ 1,459 $ 1,459 $ —
(*) The amounts represent net amount of assets and liabilities resulting from derivative transactions. In the case of a net liability, the amount is shown in parentheses.
Note 1) Method to determine the estimated fair value of financial instruments; securities and derivative financial instruments
i) Assets1) Cash and deposits, notes and accounts receivable—trade
As their fair value approximates book value due to their short maturity, the corresponding book value amount is used as fair value.
2) Short-term investment securities and investment securitiesThe stock exchange prices are used to determine fair value of traded stocks. Refer to Note 11 “Marketable securities and investment securities” for information on securities classified by holding purpose.
3) Long-term loans receivableThe carrying amounts shown include long-term loans receivable scheduled for repayment within one year. Their fair values are determined based on the present value of principal and interest, discounted using current assumed rates for similar long-term loans receiv-able. For long-term loans receivable bearing variable interest rates, as they are deemed to reflect market interest rates within a short term, book values are used as fair value.
ii) Liabilities1) Notes and accounts payable—trade; short-term loans payable; commercial paper;
income taxes payableAs their fair values approximate book value due to their short maturity, the corresponding book value amounts are used as fair value.
2) Bonds payableFair value of the bonds payable issued by the parent company is based on the quoted market price if available. For those without a quoted market price that are subject to spe-cial treatment for interest-rate swaps, fair value is based on the present value by totaling the amount of principal and interest, together with related interest-rate swaps, discounted by the interest rate that would apply if equivalent bonds were newly issued.
3) Long-term loans payableThe carrying amounts shown include long-term loans payable that are scheduled for repayment within one year of March 31, 2019 and 2018, amounting to ¥22,095 million (US$199,054 thousand) and ¥59,120 million, respectively. Their fair values are based on present value of principal and interest discounted using the current assumed rates for similar long-term loans payable. For long-term loans payable bearing variable interest rates, fair value of those subject to special treatment of interest rate-swaps is based on present value by totaling the amount of principal and interest, together with related interest-rate swaps, discounted by the interest rate that would apply if equivalent long-term loans were newly entered. For other long-term loans payable, book value is used as fair value as they are deemed to reflect market interest rates within a short term.
4) Lease obligationsThe carrying amounts shown are the total amount of lease obligations under current liabilities and lease obligations under noncurrent liabilities. Present value, calculated by discounting the total amount of principal and interest using the presumed interest rate that would apply if lease transactions were newly made, is used as the fair value.
5) Long-term guarantee depositsIn cases where the deposit period can be estimated, the fair value of long-term guarantee deposits is determined using a discounted cash flow over that period.
61Asahi Kasei Report 2019

iii) Derivative transactionsRefer to Note 12 “Derivative financial instruments.”Note 2) For equity investments in nonpublic companies, with a carrying amount as of March
31, 2019 and 2018, amounting to ¥89,661 million (US$807,757 thousand) and ¥74,668 million, respectively, fair value is not included in short-term investment securities and investment securities, as no quoted market price is available and it is deemed extremely difficult to determine fair value due to the impossibility of estimating future cash flows.
Note 3) For investment securities, with a carrying amount as of March 31, 2019 and 2018,
amounting to ¥3,226 million (US$29,063 thousand) and ¥3,101 million, respectively, fair value is not included in short-term investment securities and investment securi-ties, as no quoted market price is available and it is deemed extremely difficult to determine fair value due to the impossibility of estimating future cash flows.
Note 4) For long-term guarantee deposits, the fair value of a portion having a carrying amount as of March 31, 2019 and 2018, amounting to ¥11,897 million (US$107,180 thousand) and ¥11,962 million, respectively, is not included as no quoted market price is available and it is deemed extremely difficult to determine fair value due to the impossibility of estimating future cash flows.
Note 5) For monetary credits and securities with maturity, the amounts scheduled for redemption subsequent to the closing date are as follows:
Millions of yen
2019
Due within one yearDue after one year,
within five yearsDue after five years,
within ten yearsDue after more than
ten years
Cash and deposits ¥193,893 ¥ — ¥ — ¥—
Notes and accounts receivable—trade 350,716 — — —
Long-term loans receivable 4,542 15,848 260 —
Total ¥549,151 ¥15,848 ¥260 ¥—
Millions of yen
2018
Due within one yearDue after one year,
within five yearsDue after five years,
within ten yearsDue after more than
ten years
Cash and deposits ¥156,318 ¥ — ¥ — ¥—Notes and accounts receivable—trade 341,396 — — —Long-term loans receivable 5,431 22,676 335 —Total ¥503,145 ¥22,676 ¥335 ¥—
Thousands of U.S. dollars
2019
Due within one yearDue after one year,
within five yearsDue after five years,
within ten yearsDue after more than
ten years
Cash and deposits $1,746,784 $ — $ — $—
Notes and accounts receivable—trade 3,159,604 — — —
Long-term loans receivable 40,919 142,775 2,342 —
Total $4,947,306 $142,775 $2,342 $—
Note 6) For bonds payable, long-term loans payable, lease obligations, and other interest-bearing debt, the amounts scheduled for repayment subsequent to the closing date are as follows:
Millions of yen
2019
Year ending March 31Short-term loans
payable Commercial paper Bonds payableLong-term loans
payable Lease obligations Total
2020 ¥75,484 ¥77,000 ¥20,000 ¥22,095 ¥164 ¥194,743
2021 — — — 24,951 141 25,092
2022 — — — 55,334 71 55,405
2023 — — — 70,668 30 70,698
2024 — — 20,000 25,785 10 45,795
2025 and thereafter — — — 33,140 — 33,140
Millions of yen
2018
Year ending March 31Short-term loans
payable Commercial paper Bonds payableLong-term loans
payable Lease obligations Total
2019 ¥58,898 ¥20,000 ¥ — ¥59,120 ¥199 ¥138,2172020 — — 20,000 21,794 162 41,9562021 — — — 23,371 128 23,4992022 — — — 28,981 54 29,0342023 — — — 28,043 8 28,0512024 and thereafter — — — 40,988 — 40,988
62 Asahi Kasei Report 2019

Thousands of U.S. dollars
2019
Year ending March 31Short-term loans
payable Commercial paper Bonds payableLong-term loans
payable Lease obligations Total
2020 $680,036 $693,694 $180,180 $199,054 $1,477 $1,754,441
2021 — — — 224,784 1,270 226,054
2022 — — — 498,505 640 499,144
2023 — — — 636,649 270 636,919
2024 — — 180,180 232,297 90 412,568
2025 and thereafter — — — 298,559 — 298,559
11. Marketable securities and investment securities
(a) Other securities with available fair valueThe aggregate cost, carrying amount which was identical to fair value, and gross unrealized gains and losses of debt and equity securities clas-sified as other securities for which fair values were available at March 31, 2019 and 2018, were as follows:
Millions of yen
2019Carrying amount Cost
Unrealized gains (losses)
Securities with unrealized gains:Equity securities ¥177,464 ¥29,367 ¥148,097
Subtotal 177,464 29,367 148,097
Securities with unrealized losses:Equity securities 10,607 12,563 (1,956)
Subtotal 10,607 12,563 (1,956)
Total ¥188,070 ¥41,930 ¥146,140
Millions of yen
2018Carrying amount Cost
Unrealized gains (losses)
Securities with unrealized gains:Equity securities ¥209,576 ¥35,703 ¥173,872Subtotal 209,576 35,703 173,872
Securities with unrealized losses:Equity securities 12,133 13,240 (1,108)Subtotal 12,133 13,240 (1,108)
Total ¥221,708 ¥48,943 ¥172,765
Thousands of U.S. dollars
2019Carrying amount Cost
Unrealized gains (losses)
Securities with unrealized gains:Equity securities $1,598,775 $264,568 $1,334,207
Subtotal 1,598,775 264,568 1,334,207
Securities with unrealized losses:Equity securities 95,559 113,180 (17,622)
Subtotal 95,559 113,180 (17,622)
Total $1,694,324 $377,748 $1,316,577
63Asahi Kasei Report 2019

(b) Realized gains and losses on the sale of other securitiesThe realized gains and losses on the sale of other securities during the years ended March 31, 2019 and 2018, were as follows:
Millions of yen Thousands of U.S. dollars
2019 2018 2019
Selling amount ¥16,176 ¥18,088 $145,730
Gain on sales of securities 11,580 15,164 104,324
Loss on sales of securities — — —
(c) Loss on other devaluation of investment securities whose fair values are readily determinableLoss on other devaluation of investment securities whose fair values are readily determinable for the year ended March 31, 2019, was ¥173 million (US$1,559 thousand), which is for other securities, and for the year ended March 31, 2018, ¥31 million, which is the sum of ¥28 million for equity securities of unconsolidated subsidiaries and affiliates and ¥3 million for other securities.
12. Derivative financial instruments
(a) Derivative financial instruments for which hedge accounting is not applied
i) Foreign exchange forward contractsMillions of yen
2019
Classification Items Amount of contractAmount of contract
over 1 year Fair value (*)Profit (loss) from
valuation
Off-market transactions Foreign exchange forward contracts:Selling:
U.S. dollar ¥40,157 ¥— ¥ (9) ¥ (9)
Euro 11,379 — 88 88
Thai baht 2,306 — 39 39
British pound 45 — 0 0
Chinese yuan 5 — (0) (0)
Australian dollar 8 — 0 0
Buying:U.S. dollar 4,373 — (20) (20)
Euro 14 — (0) (0)
Thai baht 4 — 0 0
Total ¥58,291 ¥— ¥ 98 ¥ 98
Millions of yen
2018
Classification Items Amount of contractAmount of contract
over 1 year Fair value (*)Profit (loss) from
valuation
Off-market transactions Foreign exchange forward contracts:Selling:
U.S. dollar ¥ 52,155 ¥— ¥1,514 ¥1,514Euro 9,720 — 158 158Thai baht 1,867 — 4 4British pound 27 — 0 0Chinese yuan — — — —Australian dollar — — — —
Buying:U.S. dollar 5,438 — (84) (84)Euro 50,269 — (335) (335)Thai baht 5 — (0) (0)
Total ¥119,481 ¥— ¥1,257 ¥1,257
64 Asahi Kasei Report 2019

Thousands of U.S. dollars
2019
Classification Items Amount of contractAmount of contract
over 1 year Fair value (*)Profit (loss) from
valuation
Off-market transactions Foreign exchange forward contracts:Selling:
U.S. dollar $361,775 $— $ (81) $ (81)
Euro 102,514 — 793 793
Thai baht 20,775 — 351 351
British pound 405 — 0 0
Chinese yuan 45 — (0) (0)
Australian dollar 72 — 0 0
Buying:U.S. dollar 39,396 — (180) (180)
Euro 126 — (0) (0)
Thai baht 36 — 0 0
Total $525,144 $— $ 883 $ 883(*) The fair value is provided by counterparty financial institutions.
(b) Derivative financial instruments for which hedge accounting is applied
i) Foreign exchange forward contractsMillions of yen
2019
Classification Items Hedged assets/liabilities Amount of contractAmount of contract
over 1 year Fair value (*)
Principle-based accounting
Foreign exchange forward contracts:
Selling:U.S. dollar Accounts receivable—trade ¥4,601 ¥44 ¥56
Euro Accounts receivable—trade 687 — 10
Buying:U.S. dollar Accounts payable—trade 382 — (1)
Euro Accounts payable—trade 23 — (1)
Thai baht Accounts payable—trade — — —
Swedish krona Investment securities — — —
Total ¥5,694 ¥44 ¥64
Millions of yen
2018
Classification Items Hedged assets/liabilities Amount of contractAmount of contract
over 1 year Fair value (*)
Principle-based accounting
Foreign exchange forward contracts:
Selling:U.S. dollar Accounts receivable—trade ¥ 5,966 ¥— ¥ 180Euro Accounts receivable—trade 721 — 17
Buying:U.S. dollar Accounts payable—trade 359 — (10)Euro Accounts payable—trade — — —Thai baht Accounts payable—trade 3 — 0Swedish krona Investment securities 5,198 — (186)
Total ¥12,246 ¥— ¥ 0
65Asahi Kasei Report 2019

Thousands of U.S. dollars
2019
Classification Items Hedged assets/liabilities Amount of contractAmount of contract
over 1 year Fair value (*)
Principle-based accounting
Foreign exchange forward contracts:
Selling:U.S. dollar Accounts receivable—trade $41,450 $396 $505
Euro Accounts receivable—trade 6,189 — 90
Buying:U.S. dollar Accounts payable—trade 3,441 — (9)
Euro Accounts payable—trade 207 — (9)
Thai baht Accounts payable—trade — — —
Swedish krona Investment securities — — —
Total $51,297 $396 $577(*) The fair value is provided by counterparty financial institutions.
ii) Interest-rate swaps, and interest-rate and currency swapsMillions of yen
2019
Classification Items Hedged assets/liabilities Amount of contractAmount of contract
over 1 year Fair value
Special treatment for interest-rate swaps
Interest-rate swapsLong-term loans payablePay fixed/receive floating ¥98,712 ¥78,605 (*)
Special treatment for interest-rate and currency swaps
Interest-rate and currency swaps
Long-term loans payableU.S. dollar receive floating/ Thai baht pay fixed — — (*)
Total ¥98,712 ¥78,605 ¥—
Millions of yen
2018
Classification Items Hedged assets/liabilities Amount of contractAmount of contract
over 1 year Fair value
Special treatment for interest-rate swaps
Interest-rate swapsLong-term loans payablePay fixed/receive floating ¥139,261 ¥93,633 (*)
Special treatment for interest-rate and currency swaps
Interest-rate and currency swaps
Long-term loans payableU.S. dollar receive floating/ Thai baht pay fixed 170 — (*)
Total ¥139,431 ¥93,633 ¥—
Thousands of U.S. dollars
2019
Classification Items Hedged assets/liabilities Amount of contractAmount of contract
over 1 year Fair value
Special treatment for interest-rate swaps
Interest-rate swapsLong-term loans payablePay fixed/receive floating $889,297 $708,153 (*)
Special treatment for interest-rate and currency swaps
Interest-rate and currency swaps
Long-term loans payableU.S. dollar receive floating/ Thai baht pay fixed — — (*)
Total $889,297 $708,153 $—(*) Fair value of interest-rate swaps and interest-rate and currency swaps, for which special treatment is applied, is included in fair value of the corresponding long-term loans payable for which
hedge accounting is applied.
66 Asahi Kasei Report 2019

13. Provision for retirement benefitsUpon terminating employment, employees of the parent company and its subsidiaries are entitled, under most circumstances, to lump-sum severance indemnities and/or pension payments determined by reference mainly to their current basic rate of pay and length of service and/or defined contribution plans. Additional benefits may be granted to employees depending on the conditions under which termination of employ-ment occurs. Certain consolidated subsidiaries adopt the simplified method in calculating expected defined benefit liability.
Reconciliations of beginning and ending balances of projected benefit obligations for the fiscal years ended March 31, 2019 and 2018, were as follows:
Millions of yen Thousands of U.S. dollars
2019 2018 2019
Beginning balance of the projected benefit obligations ¥400,855 ¥398,132 $3,611,306
Service cost 15,466 14,922 139,333
Interest cost 728 695 6,559
Actuarial gains/losses 2,061 1,213 18,568
Payment of retirement benefits (16,451) (14,620) (148,207)
Other (198) 513 (1,784)
Ending balance of the projected benefit obligations ¥402,461 ¥400,855 $3,625,775
Reconciliations of beginning and ending balances of plan assets for the fiscal years ended March 31, 2019 and 2018, were as follows:Millions of yen Thousands of U.S. dollars
2019 2018 2019
Beginning balance of plan assets ¥230,220 ¥219,765 $2,074,054
Expected return 5,737 5,461 51,685
Actuarial gains/losses (387) 4,064 (3,486)
Contributions 7,408 9,513 66,739
Payment of retirement benefits (9,206) (8,571) (82,937)
Other 4 (11) 36
Ending balance of plan assets ¥233,776 ¥230,220 $2,106,090
Reconciliations of ending balance of projected benefit obligations and the plan assets, and of net defined benefit liability and net defined benefit asset, as recorded in the consolidated balance sheet at March 31, 2019 and 2018, were as follows:
Millions of yen Thousands of U.S. dollars
2019 2018 2019
Projected benefit obligations of funded plans ¥ 258,381 ¥ 257,710 $ 2,327,757
Plan assets (233,776) (230,220) (2,106,090)
Subtotal 24,605 27,489 221,667
Projected benefit obligations of unfunded plans 144,080 143,145 1,298,018
Net of liability and asset that have been recorded in the consolidated balance sheets ¥ 168,685 ¥ 170,634 $ 1,519,685
Net defined benefit liability ¥ 168,685 ¥ 170,634 $ 1,519,685
Net of liability and asset that have been recorded in the consolidated balance sheets ¥ 168,685 ¥ 170,634 $ 1,519,685
Periodic retirement benefit expenses for employees and the breakdown of items for the years ended March 31, 2019 and 2018, were as follows:Millions of yen Thousands of U.S. dollars
2019 2018 2019
Service cost (net of employee contributions) ¥13,829 ¥13,301 $124,586
Interest cost 728 695 6,559
Expected return on plan assets (5,737) (5,461) (51,685)
Amortization of actuarial gains/losses 8,407 11,196 75,739
Amortization of prior service costs 82 141 739
Additional retirement benefits and other 1,327 636 11,955
Retirement benefit expenses of defined benefit plans ¥18,636 ¥20,509 $167,892
67Asahi Kasei Report 2019
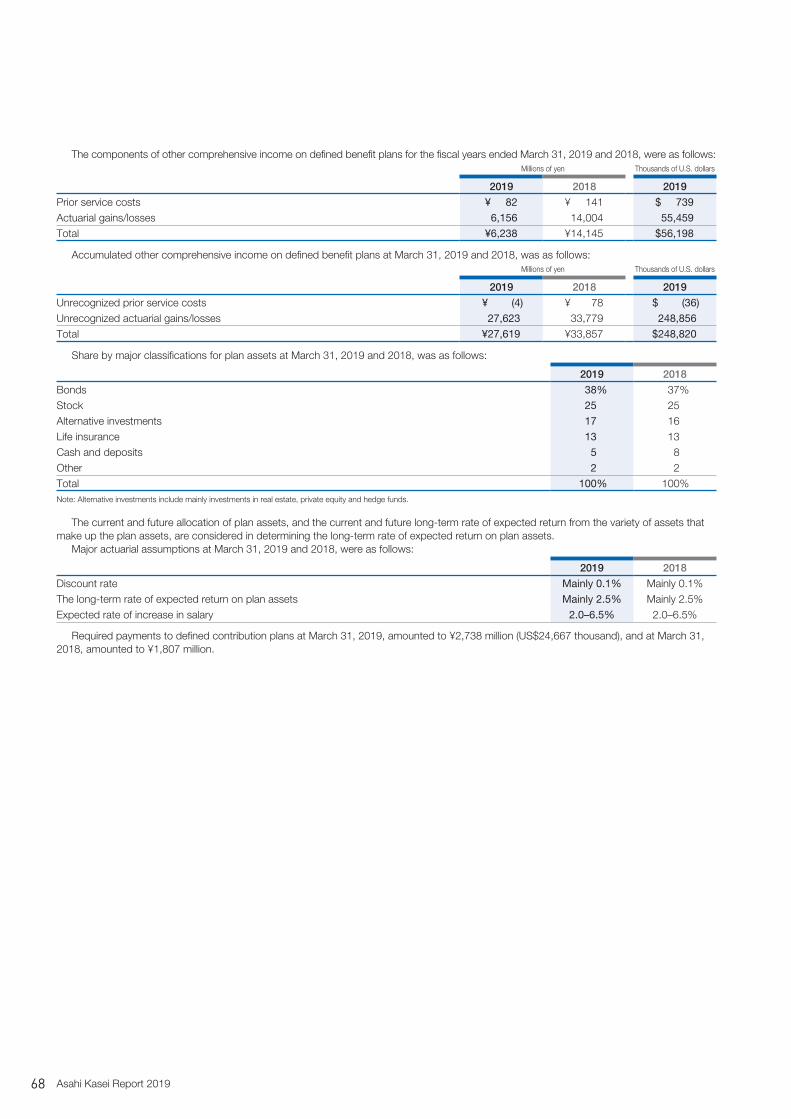
The components of other comprehensive income on defined benefit plans for the fiscal years ended March 31, 2019 and 2018, were as follows:Millions of yen Thousands of U.S. dollars
2019 2018 2019
Prior service costs ¥ 82 ¥ 141 $ 739
Actuarial gains/losses 6,156 14,004 55,459
Total ¥6,238 ¥14,145 $56,198
Accumulated other comprehensive income on defined benefit plans at March 31, 2019 and 2018, was as follows:Millions of yen Thousands of U.S. dollars
2019 2018 2019
Unrecognized prior service costs ¥ (4) ¥ 78 $ (36)
Unrecognized actuarial gains/losses 27,623 33,779 248,856
Total ¥27,619 ¥33,857 $248,820
Share by major classifications for plan assets at March 31, 2019 and 2018, was as follows:
2019 2018
Bonds 38% 37%Stock 25 25Alternative investments 17 16Life insurance 13 13Cash and deposits 5 8Other 2 2Total 100% 100%Note: Alternative investments include mainly investments in real estate, private equity and hedge funds.
The current and future allocation of plan assets, and the current and future long-term rate of expected return from the variety of assets that make up the plan assets, are considered in determining the long-term rate of expected return on plan assets.
Major actuarial assumptions at March 31, 2019 and 2018, were as follows:
2019 2018
Discount rate Mainly 0.1% Mainly 0.1%The long-term rate of expected return on plan assets Mainly 2.5% Mainly 2.5%Expected rate of increase in salary 2.0–6.5% 2.0–6.5%
Required payments to defined contribution plans at March 31, 2019, amounted to ¥2,738 million (US$24,667 thousand), and at March 31, 2018, amounted to ¥1,807 million.
68 Asahi Kasei Report 2019

14. TaxesIncome taxes applicable to the parent company and subsidiaries in Japan include (1) corporation tax, (2) enterprise tax, and (3) inhabitants tax.
Significant components of deferred tax assets and liabilities at March 31, 2019 and 2018, were as follows:Millions of yen Thousands of U.S. dollars
2019 2018 2019
Deferred tax assets:Net defined benefit liability ¥ 51,489 ¥ 52,147 $ 463,865
Accrued bonuses 7,857 7,734 70,784
Foreign tax credit carry forwards 6,990 6,069 62,973
Unrealized gain on noncurrent assets and others 4,368 3,931 39,351
Impairment losses 3,171 3,414 28,568
Loss on disposal of noncurrent assets 3,143 3,268 28,315
Other 25,371 22,951 228,568
Subtotal deferred tax assets 102,390 99,515 922,432
Less: Valuation allowance (13,218) (10,865) (119,081)
Total deferred tax assets 89,172 88,651 803,351
Deferred tax liabilities: Unrealized gain on other securities (44,241) (54,229) (398,568)
Identified intangible assets during business combination (37,071) (29,925) (333,973)
Deferred gain on property, plant and equipment (8,305) (8,383) (74,820)
Depreciation—overseas subsidiaries (8,958) (8,077) (80,703)
Other (11,387) (6,899) (102,586)
Total deferred tax liabilities (109,963) (107,514) (990,658)
Net deferred tax assets (liabilities) ¥ (20,791) ¥ (18,864) $(187,306)
Reconciliation of the differences between the statutory tax rate and the effective income tax rate for the years ended March 31, 2019 and 2018, was as follows:
2019 2018
Statutory tax rate 30.6% 30.9%Increase (reduction) in taxes resulting from:
Non-deductible expenses and non-taxable income 1.0 0.3R&D expenses deductible from income taxes (2.8) (2.9)Amortization of goodwill and negative goodwill 2.8 2.5Equity in (losses) earnings of unconsolidated subsidiaries and affiliates (1.8) (1.9)Undistributed earnings (losses) of foreign subsidiaries 0.6 0.4Difference of tax rates for foreign subsidiaries (1.7) (0.4)Items related to U.S. tax reform — (7.9)Other (0.0) 0.1
Effective income tax rate 28.8% 21.1%
15. Business combinationsBusiness combinations accounted for by the purchase method were as follows:
(a) Acquisition of Senseair AB
i) Outline of business combination1) Name and nature of the businesses of counterpartyName of counterparty: Senseair ABNature of the businesses: Manufacture and sale of NDIR gas sensor modules2) Main reasons for the acquisitionIn addition to joint development through which Senseair’s optical path design technology and manufacturing know-how for gas sensors is combined with the small, high-quality IR light emitting elements and detectors based on the core technology for compound semiconductors of consolidated subsidiary Asahi Kasei Microdevices Corp., the acquisition will make it possible for the two companies to more deeply integrate their technological knowledge and market networks, enabling an expansion of business activities in the market for air, gas, and alcohol sensors, where rapid growth is forecasted.3) The acquisition dateApril 4, 20184) Statutory form of business combinationStock purchase for cash as consideration5) Name of company after transactionSenseair AB
69Asahi Kasei Report 2019

6) Acquired voting rightVoting right before the acquisition: 8.1%Additional voting right acquired as of the acquisition date: 91.9%Voting right after the acquisition: 100%7) Basic means of materializing the acquisitionStock purchase for cash as consideration by a consolidated subsidiary
ii) The period of acquiree’s results included in the consolidated financial statements From April 4, 2018, to March 31, 2019
iii) Cost of acquisition and detailsMillions of yen Thousands of U.S. dollars
Stock purchase price ¥6,079 $54,766
Purchase price ¥6,079 $54,766
All stocks held as of the acquisition date are remeasured to their fair value at acquisition date.
iv) Major acquisition related costsAdvisory fees and others: ¥295 million (US$2,658 thousand)
v) Difference between cost of acquisition and total of individual transactions leading to the acquisition¥173 million (US$1,559 thousand)
vi) Amount of goodwill, measurement principle, amortization method, and useful life1) Amount of goodwill¥4,171 million (US$37,577 thousand)2) Measurement principleGoodwill is measured as the excess of the purchase price over the fair value of identifiable assets acquired and liabilities assumed.3) Amortization method and useful lifeStraight-line method over 20 years
vii) Details of assets acquired and liabilities assumed as of the acquisition dateMillions of yen Thousands of U.S. dollars
Current assets ¥1,296 $11,676
Noncurrent assets 1,544 13,910
Total assets ¥2,840 $25,586
Current liabilities ¥ 580 $ 5,225
Noncurrent liabilities 352 3,171
Total liabilities ¥ 932 $ 8,396
viii) Amount of identifiable intangible assets other than goodwill, its details and major weighted average useful life1) Purchase price allocated to intangible assets and its major items
Millions of yen Thousands of U.S. dollars
Customer-related assets ¥693 $6,243
Technology-related assets 681 6,135
2) Major weighted average useful life
Customer-related assets 20 years
Technology-related assets 10 years
Total 15 years
ix) Pro forma effects on the consolidated statements of income assuming the business combination had occurred at the beginning of the fiscal year, and its measurement
Information is omitted due to immateriality. This note is not audited.
(b) Acquisition of Sage Automotive Interiors, Inc.
i) Outline of business combination1) Name and nature of the businesses of counterpartyName of counterparty: Sage Automotive Interiors, Inc.Nature of the businesses: Development, manufacture, and sale of fabrics as automotive interior material2) Main reasons for the acquisition• Enhanced access to vehicle manufacturers and Tier-1 suppliers in order to swiftly and accurately ascertain trends and needs in the automotive
industry• Proposal and provision of comprehensive vehicle interior designs and solutions leveraging Sage’s design and marketing capabilities in combi-
nation with various Asahi Kasei products and technologies such as fibers, plastics, and sensors• Utilizing Sage’s sales, manufacturing, and marketing bases as management infrastructure and resources for the global expansion of Asahi
Kasei’s operations3) The acquisition dateSeptember 27, 20184) Statutory form of business combinationStock purchase for cash as consideration
70 Asahi Kasei Report 2019
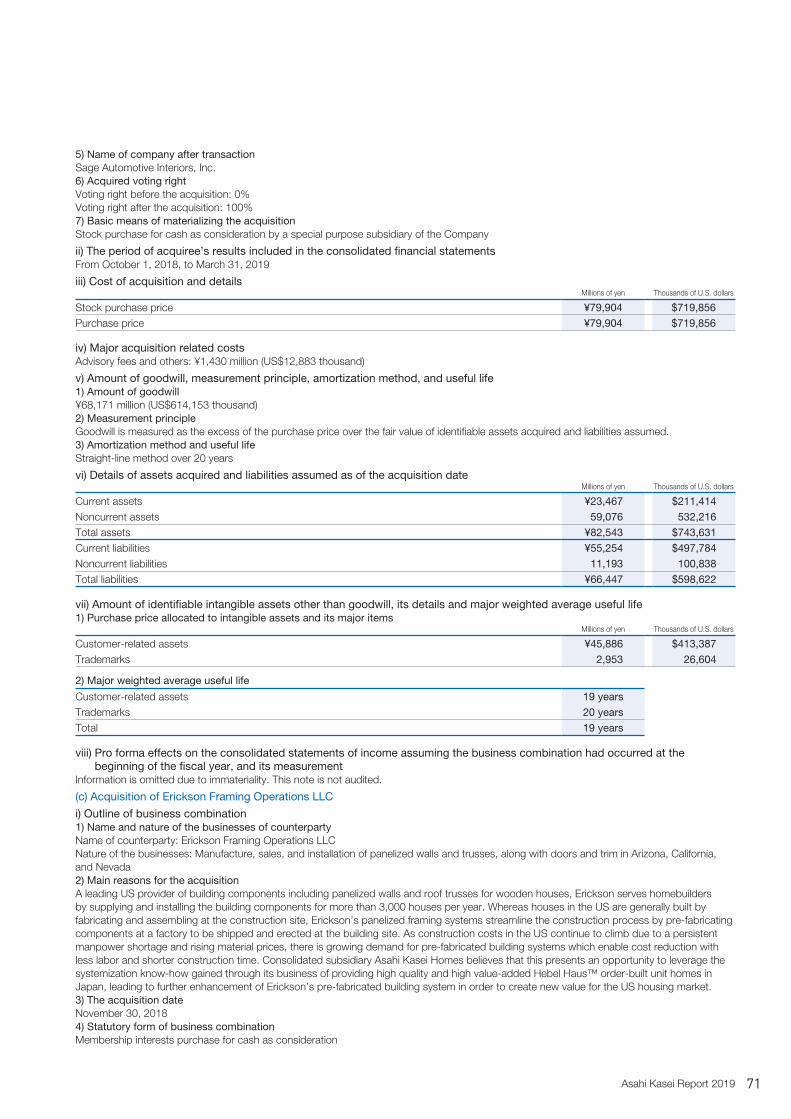
5) Name of company after transactionSage Automotive Interiors, Inc.6) Acquired voting rightVoting right before the acquisition: 0%Voting right after the acquisition: 100%7) Basic means of materializing the acquisitionStock purchase for cash as consideration by a special purpose subsidiary of the Company
ii) The period of acquiree’s results included in the consolidated financial statements From October 1, 2018, to March 31, 2019
iii) Cost of acquisition and detailsMillions of yen Thousands of U.S. dollars
Stock purchase price ¥79,904 $719,856
Purchase price ¥79,904 $719,856
iv) Major acquisition related costsAdvisory fees and others: ¥1,430 million (US$12,883 thousand)
v) Amount of goodwill, measurement principle, amortization method, and useful life1) Amount of goodwill¥68,171 million (US$614,153 thousand)2) Measurement principleGoodwill is measured as the excess of the purchase price over the fair value of identifiable assets acquired and liabilities assumed.3) Amortization method and useful lifeStraight-line method over 20 years
vi) Details of assets acquired and liabilities assumed as of the acquisition dateMillions of yen Thousands of U.S. dollars
Current assets ¥23,467 $211,414
Noncurrent assets 59,076 532,216
Total assets ¥82,543 $743,631
Current liabilities ¥55,254 $497,784
Noncurrent liabilities 11,193 100,838
Total liabilities ¥66,447 $598,622
vii) Amount of identifiable intangible assets other than goodwill, its details and major weighted average useful life1) Purchase price allocated to intangible assets and its major items
Millions of yen Thousands of U.S. dollars
Customer-related assets ¥45,886 $413,387
Trademarks 2,953 26,604
2) Major weighted average useful life
Customer-related assets 19 years
Trademarks 20 years
Total 19 years
viii) Pro forma effects on the consolidated statements of income assuming the business combination had occurred at the beginning of the fiscal year, and its measurement
Information is omitted due to immateriality. This note is not audited.
(c) Acquisition of Erickson Framing Operations LLC
i) Outline of business combination1) Name and nature of the businesses of counterpartyName of counterparty: Erickson Framing Operations LLC Nature of the businesses: Manufacture, sales, and installation of panelized walls and trusses, along with doors and trim in Arizona, California, and Nevada2) Main reasons for the acquisitionA leading US provider of building components including panelized walls and roof trusses for wooden houses, Erickson serves homebuilders by supplying and installing the building components for more than 3,000 houses per year. Whereas houses in the US are generally built by fabricating and assembling at the construction site, Erickson’s panelized framing systems streamline the construction process by pre-fabricating components at a factory to be shipped and erected at the building site. As construction costs in the US continue to climb due to a persistent manpower shortage and rising material prices, there is growing demand for pre-fabricated building systems which enable cost reduction with less labor and shorter construction time. Consolidated subsidiary Asahi Kasei Homes believes that this presents an opportunity to leverage the systemization know-how gained through its business of providing high quality and high value-added Hebel Haus™ order-built unit homes in Japan, leading to further enhancement of Erickson’s pre-fabricated building system in order to create new value for the US housing market.3) The acquisition dateNovember 30, 20184) Statutory form of business combinationMembership interests purchase for cash as consideration
71Asahi Kasei Report 2019

5) Name of company after transactionErickson Framing Operations LLC6) Acquired voting right Voting right before the acquisition: 0%Voting right after the acquisition: 100%7) Basic means of materializing the acquisitionMembership interests purchase for cash as consideration by a consolidated subsidiary
ii) The period of acquiree’s results included in the consolidated financial statements From January 1, 2019, to March 31, 2019
iii) Cost of acquisition and detailsMillions of yen Thousands of U.S. dollars
Membership interests purchase price ¥10,050 $90,541
Purchase price ¥10,050 $90,541
iv) Major acquisition related costsAdvisory fees and others: ¥281 million (US$2,532 thousand)
v) Amount of goodwill, measurement principle, amortization method, and useful life1) Amount of goodwill¥1,230 million (US$11,081 thousand)2) Measurement principleGoodwill is measured as the excess of the purchase price over the fair value of identifiable assets acquired and liabilities assumed.3) Amortization method and useful lifeStraight-line method over 20 years
vi) Details of assets acquired and liabilities assumed as of the acquisition dateMillions of yen Thousands of U.S. dollars
Current assets ¥ 3,728 $ 33,586
Noncurrent assets 9,137 82,315
Total assets ¥12,864 $115,892
Current liabilities ¥ 4,240 $ 38,198
Noncurrent liabilities 38 342
Total liabilities ¥ 4,278 $ 38,541
vii) Amount of identifiable intangible assets other than goodwill, its details and major weighted average useful life1) Purchase price allocated to intangible assets and its major items
Millions of yen Thousands of U.S. dollars
Customer-related assets ¥6,779 $61,072
Order backlog 1,138 10,252
2) Major weighted average useful life
Customer-related assets 19 years
Order backlog 4 years
Total 17 years
viii) Pro forma effects on the consolidated statements of income assuming the business combination had occurred at the beginning of the fiscal year, and its measurement
Information is omitted due to immateriality. This note is not audited.
16. Business segment information
(a) Overview of reportable segmentsThe Company’s business segments are based on organizational units for which separate financial information is available, and the Board of Directors carries out periodic review to allocate manage-ment resources and evaluate business performance.
The Company is organized under an operating holding company configuration with the operating holding company and core operating companies performing operations in three business sectors. The operating holding company and each core operating company lays out strategy and develops business activities in Japan and abroad.
Main products of the three reportable segments are as follows:
Material segmentFibers businessThe Company manufactures, processes, and sells elastic polyure-thane filament, cupro fiber, nonwoven fabrics, and nylon 66 filament.
Chemicals businessThe Company manufactures, processes, and sells petrochemical products (such as styrene, acrylonitrile, polyethylene, and polysty-rene), performance polymer products (such as synthetic rubber and engineering plastics), and performance material and consumable products (such as coating materials, microcrystalline cellulose, explosives, explosion-bonded metal clad, hollow-fiber filtration membranes, ion-exchange membranes, electronic materials, food wrapping film, and plastic films, sheets, and foams).Electronics businessThe Company manufactures, processes, and sells battery separator products (such as lithium-ion battery separator and lead-acid battery separator) and electronic devices (such as mixed-signal LSIs and Hall elements).
72 Asahi Kasei Report 2019
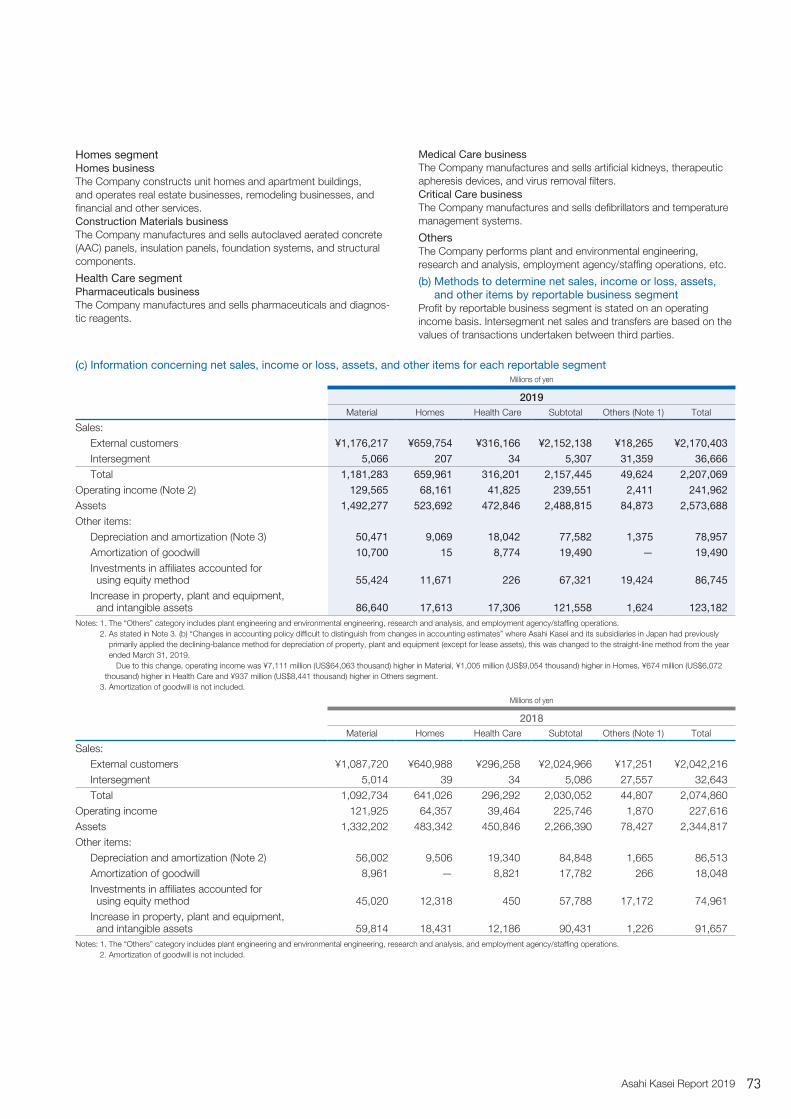
Homes segmentHomes businessThe Company constructs unit homes and apartment buildings, and operates real estate businesses, remodeling businesses, and financial and other services.Construction Materials businessThe Company manufactures and sells autoclaved aerated concrete (AAC) panels, insulation panels, foundation systems, and structural components.
Health Care segmentPharmaceuticals businessThe Company manufactures and sells pharmaceuticals and diagnos-tic reagents.
Medical Care businessThe Company manufactures and sells artificial kidneys, therapeutic apheresis devices, and virus removal filters.Critical Care businessThe Company manufactures and sells defibrillators and temperature management systems.
OthersThe Company performs plant and environmental engineering, research and analysis, employment agency/staffing operations, etc.
(b) Methods to determine net sales, income or loss, assets, and other items by reportable business segment
Profit by reportable business segment is stated on an operating income basis. Intersegment net sales and transfers are based on the values of transactions undertaken between third parties.
(c) Information concerning net sales, income or loss, assets, and other items for each reportable segmentMillions of yen
2019Material Homes Health Care Subtotal Others (Note 1) Total
Sales:External customers ¥1,176,217 ¥659,754 ¥316,166 ¥2,152,138 ¥18,265 ¥2,170,403
Intersegment 5,066 207 34 5,307 31,359 36,666
Total 1,181,283 659,961 316,201 2,157,445 49,624 2,207,069
Operating income (Note 2) 129,565 68,161 41,825 239,551 2,411 241,962
Assets 1,492,277 523,692 472,846 2,488,815 84,873 2,573,688
Other items:Depreciation and amortization (Note 3) 50,471 9,069 18,042 77,582 1,375 78,957
Amortization of goodwill 10,700 15 8,774 19,490 — 19,490
Investments in affiliates accounted for using equity method 55,424 11,671 226 67,321 19,424 86,745
Increase in property, plant and equipment, and intangible assets 86,640 17,613 17,306 121,558 1,624 123,182
Notes: 1. The “Others” category includes plant engineering and environmental engineering, research and analysis, and employment agency/staffing operations. 2. As stated in Note 3. (b) “Changes in accounting policy difficult to distinguish from changes in accounting estimates” where Asahi Kasei and its subsidiaries in Japan had previously
primarily applied the declining-balance method for depreciation of property, plant and equipment (except for lease assets), this was changed to the straight-line method from the year ended March 31, 2019.
Due to this change, operating income was ¥7,111 million (US$64,063 thousand) higher in Material, ¥1,005 million (US$9,054 thousand) higher in Homes, ¥674 million (US$6,072 thousand) higher in Health Care and ¥937 million (US$8,441 thousand) higher in Others segment.
3. Amortization of goodwill is not included.
Millions of yen
2018Material Homes Health Care Subtotal Others (Note 1) Total
Sales:External customers ¥1,087,720 ¥640,988 ¥296,258 ¥2,024,966 ¥17,251 ¥2,042,216Intersegment 5,014 39 34 5,086 27,557 32,643Total 1,092,734 641,026 296,292 2,030,052 44,807 2,074,860
Operating income 121,925 64,357 39,464 225,746 1,870 227,616Assets 1,332,202 483,342 450,846 2,266,390 78,427 2,344,817Other items:
Depreciation and amortization (Note 2) 56,002 9,506 19,340 84,848 1,665 86,513Amortization of goodwill 8,961 — 8,821 17,782 266 18,048Investments in affiliates accounted for using equity method 45,020 12,318 450 57,788 17,172 74,961Increase in property, plant and equipment, and intangible assets 59,814 18,431 12,186 90,431 1,226 91,657
Notes: 1. The “Others” category includes plant engineering and environmental engineering, research and analysis, and employment agency/staffing operations. 2. Amortization of goodwill is not included.
73Asahi Kasei Report 2019

Thousands of U.S. dollars
2019Material Homes Health Care Subtotal Others (Note 1) Total
Sales:External customers $10,596,550 $5,943,730 $2,848,342 $19,388,631 $164,550 $19,553,180
Intersegment 45,640 1,865 306 47,811 282,514 330,324
Total 10,642,189 5,945,595 2,848,658 19,436,441 447,063 19,883,505
Operating income (Note 2) 1,167,252 614,063 376,802 2,158,117 21,721 2,179,838
Assets 13,443,937 4,717,946 4,259,874 22,421,757 764,622 23,186,378
Other items:Depreciation and amortization (Note 3) 454,694 81,703 162,541 698,937 12,387 711,324
Amortization of goodwill 96,396 135 79,045 175,586 — 175,586
Investments in affiliates accounted for using equity method 499,315 105,144 2,036 606,495 174,991 781,486
Increase in property, plant and equipment, and intangible assets 780,541 158,676 155,910 1,095,117 14,631 1,109,748
Notes: 1. The “Others” category includes plant engineering and environmental engineering, research and analysis, and employment agency/staffing operations. 2. As stated in Note 3. (b) “Changes in accounting policy difficult to distinguish from changes in accounting estimates” where Asahi Kasei and its subsidiaries in Japan had previously
primarily applied the declining-balance method for depreciation of property, plant and equipment (except for lease assets), this was changed to the straight-line method from the year ended March 31, 2019.
Due to this change, operating income was ¥7,111 million (US$64,063 thousand) higher in Material, ¥1,005 million (US$9,054 thousand) higher in Homes, ¥674 million (US$6,072 thousand) higher in Health Care and ¥937 million (US$8,441 thousand) higher in Others segment.
3. Amortization of goodwill is not included.
(d) Reconciliation of differences between total amounts of reportable segments and amounts appearing in the consolidated financial statements (adjustment of difference)
Millions of yen Thousands of U.S. dollars
Sales 2019 2018 2019
Total of reporting segments ¥2,157,445 ¥2,030,052 $19,436,441
Net sales in “Others” category 49,624 44,807 447,063
Elimination of intersegment transactions (36,666) (32,643) (330,324)
Net sales on consolidated statements of income ¥2,170,403 ¥2,042,216 $19,553,180
Millions of yen Thousands of U.S. dollars
Operating income 2019 2018 2019
Total of reporting segments ¥239,551 ¥225,746 $2,158,117
Operating income in “Others” category 2,411 1,870 21,721
Elimination of intersegment transactions (133) 381 (1,198)
Corporate expenses, etc.* (32,241) (29,522) (290,459)
Operating income on consolidated statements of income ¥209,587 ¥198,475 $1,888,171* Corporate expenses, etc. include corporate revenue, basic research expense, and group management expense, etc. which are not allocated to reporting segments.
Millions of yen Thousands of U.S. dollars
Assets 2019 2018 2019
Total of reporting segments ¥2,488,815 ¥2,266,390 $22,421,757
Assets in “Others” category 84,873 78,427 764,622
Elimination of intersegment transactions (425,141) (512,163) (3,830,099)
Corporate assets* 426,656 474,499 3,843,748
Total assets on consolidated balance sheets ¥2,575,203 ¥2,307,154 $23,200,027* Corporate assets include assets of the parent company—surplus operating funds (cash and deposits), long-term investment capital (investment securities, etc.), and land, etc.
Total of reportable segments Others Adjustments (Note 1)Amounts from consolidated
financial statements
Millions of yenThousands of U.S. dollars Millions of yen
Thousands of U.S. dollars Millions of yen
Thousands of U.S. dollars Millions of yen
Thousands of U.S. dollars
Other items 2019 2018 2019 2019 2018 2019 2019 2018 2019 2019 2018 2019
Depreciation and amortization (Note 2) ¥ 77,582 ¥84,848 $ 698,937 ¥ 1,375 ¥ 1,665 $ 12,387 ¥ 5,599 ¥8,901 $ 50,441 ¥ 84,556 ¥ 95,415 $ 761,766
Amortization of goodwill 19,490 17,782 175,586 — 266 — — — — 19,490 18,048 175,586
Investments in affiliates accounted for using equity method 67,321 57,788 606,495 19,424 17,172 174,991 — — — 86,745 74,961 781,486
Increase in property, plant and equipment, and intangible assets 121,558 90,431 1,095,117 1,624 1,226 14,631 13,024 9,673 117,333 136,206 101,331 1,227,081 Notes: 1. Adjustments include elimination of intersegment transactions and corporate expenses, etc. 2. Amortization of goodwill is not included.
74 Asahi Kasei Report 2019

(e) Related Information
i) Information on products and servicesPlease refer to (c) Information concerning net sales, income or loss, assets, and other items for each reportable segment.
ii) Geographic information
1) Net salesMillions of yen Thousands of U.S. dollars
2019 2018 2019
JapanUnited States China
Other regions Total Japan
United States China
Other regions Total Japan
United States China
Other regions Total
¥1,311,136 ¥227,993 ¥211,504 ¥419,770 ¥2,170,403¥1,274,548 ¥191,765 ¥183,425 ¥392,477 ¥2,042,216 $11,812,036 $2,053,991 $1,905,441 $3,781,712 $19,553,180
2) Property, plant and equipmentMillions of yen Thousands of U.S. dollars
2019 2018 2019
JapanUnited States
Other regions Total Japan
United States
Other regions Total Japan
United States
Other regions Total
¥428,900 ¥104,413 ¥88,053 ¥621,366 ¥384,076 ¥85,003 ¥92,969 ¥562,048 $3,863,964 $940,658 $793,270 $5,597,892
3) Information by major customerInformation by major customer is not shown because no customer accounts for 10% or more of net sales on the consolidated statements of income.
17. Information on related partiesFor the year ended March 31, 2019: NoneFor the year ended March 31, 2018: None
18. Per share informationBasic and diluted net assets per share and net income per share for the years ended March 31, 2019 and 2018, were as follows:
Yen U.S. dollars
2019 2018 2019
Basic net assets per share ¥989.51 ¥922.11 $8.91
Basic net income per share 105.66 121.93 0.95Note: As the Company had no dilutive securities at March 31, 2019 and 2018, the Company does not disclose diluted net income per share for the years ended March 31, 2019 and 2018.
(a) Basis for calculation of net assets per shareMillions of yen Thousands of U.S. dollars
2019 2018 2019
Total net assets ¥1,402,710 ¥1,305,214 $12,637,027
Amount deducted from total net assets 21,225 17,827 191,216
of which, non-controlling interests (21,225) (17,827) (191,216)
Net assets allocated to capital stock ¥1,381,485 ¥1,287,387 $12,445,811
Number of shares of capital stock outstanding at fiscal year end used in calculation of net assets per share (thousand) 1,396,125 1,396,125 1,396,125Note: Shares held by the trust for granting shares to Directors, etc., numbering 442 thousand at March 31, 2019, and 464 thousand at March 31, 2018, are excluded from the number of
shares of capital stock outstanding at fiscal year end used in calculation of net assets per share.
(b) Basis for calculation of net income per shareMillions of yen Thousands of U.S. dollars
2019 2018 2019
Net income attributable to owners of the parent ¥ 147,512 ¥ 170,248 $1,328,937
Amount not attributable to common stock shareholders — — —
Net income attributable to common stock owners of the parent ¥ 147,512 ¥ 170,248 $1,328,937
Weighted-average number of shares of capital stock (thousand) 1,396,130 1,396,322 1,396,130Note: Shares held by the trust for granting shares to Directors, etc., numbering 450 thousand during the year ended March 31, 2019, and 290 thousand during the year ended March 31, 2018,
are excluded from the weighted-average number of shares of capital stock used in calculation of net income per share.
75Asahi Kasei Report 2019

19. Subsequent events
(a) Repurchase of sharesOn May 10, 2019, the Board of Directors of Asahi Kasei adopted a resolution for a repurchase of the company’s shares pursuant to Article 459, Paragraph 1, of the Companies Act of Japan as well as Article 37 of the company’s Articles of Incorporation.
i) Reason for repurchasing sharesTo enhance shareholder returns and improve capital efficiency
ii) Details of the repurchase1) Type of shares to be repurchased: Common stock of Asahi Kasei Corporation2) Number of shares to be repurchased: 12 million shares (maximum) (0.86% of the number of issued shares excluding treasury stock) 3) Total value of shares to be repurchased: ¥10.0 billion (maximum)4) Repurchase period: From May 30, 2019 to September 30, 20195) Methods of repurchase:• Purchase through the Tokyo Stock Exchange Trading Network
System ToSTNeT-3• Purchase on the Tokyo Stock Exchange based on discretionary
trading contracts6) Other: In accordance with the above resolution of the Board of Directors, Asahi Kasei implemented and completed the repurchase of 8,684,300 shares of common stock for ¥10.0 billion on May 31, 2019.
(b) Cancellation of shares of treasury stockOn May 10, 2019, the Board of Directors of Asahi Kasei adopted a resolution for the cancellation of shares of treasury stock pursuant to Article 178 of the Companies Act, to be implemented as follows. On October 11, 2019, the company implemented and completed the cancellation in accordance with the resolution.
i) Reason for cancellationTo enhance shareholder returns and improve capital efficiency
ii) Details of the cancellation1) Type of shares to be cancelled: Common stock of Asahi Kasei Corporation2) Number of shares to be canceled: 8,684,300 shares (0.62% of issued shares prior to cancellation)3) Date of cancellation: October 11, 2019
(c) Acquisition of Cardiac Science Corporation
i) Outline of business combination1) Name and nature of businesses of counterpartyName of counterparty: Cardiac Science CorporationNature of businesses: Manufacturing, sale, and development of automated external defibrillators (AEDs)2) Main reasons for the acquisitionThis acquisition would allow ZOLL Medical Corporation to broaden its lineup of AED products offering customers more choices and a stronger AED program management infrastructure.3) The acquisition dateAugust 26, 20194) Statutory form of business combinationStock purchase for cash as consideration5) Name of company after transactionCardiac Science Corporation6) Acquired voting rightVoting right before the acquisition: 0%Voting right after the acquisition: 100%7) Basic means of materializing the acquisitionStock purchase for cash as consideration by a consolidated subsidiary
ii) Cost of acquisition and detailsMillions of yen Thousands of U.S. dollars
Stock purchase price ¥29,063 $261,829
Purchase price ¥29,063 $261,829
iii) Amount of goodwill, measurement principle, amortization method, and useful life
1) Amount of goodwill¥17,366 million (US$156,450 thousand)** Based on provisional calculation
2) Measurement principleGoodwill is measured as the excess of the purchase price over the fair value of identifiable assets acquired and liabilities assumed.3) Amortization method and useful lifeNot determined at present
(d) Issuance of unsecured straight bonds
i) On August 30, 2019, Asahi Kasei determined the terms of the eleventh series unsecured straight bonds (with inter-bond pari passu clause) as follows.
1. Total amount of issue: ¥20 billion 2. Interest rate: 0.070% per annum 3. Issue price: ¥100 per face value of ¥100 4. Redemption price: ¥100 per face value of ¥100 5. Maturity date: September 6, 2024 6. Redemption: Bullet 7. Retirement by purchase: The bonds may be repurchased at
any time from the day following the payment date except as otherwise specified by the book-entry transfer institution.
8. Interest payment dates: March 6 and September 6 of each year 9. Offering period: August 30, 201910. Payment date: September 6, 201911. Collateral and guarantee: The bonds are not secured by any col-
lateral or guarantee, and there are no particular assets reserved for the payment of these bonds.
12. Fiscal covenants: Negative pledge clause is attached.
ii) On August 30, 2019, Asahi Kasei determined the terms of the twelfth series unsecured straight bonds (with inter-bond pari passu clause) as follows.
1. Total amount of issue: ¥20 billion 2. Interest rate: 0.210% per annum 3. Issue price: ¥100 per face value of ¥100 4. Redemption price: ¥100 per face value of ¥100 5. Maturity date: September 6, 2029 6. Redemption: Bullet 7. Retirement by purchase: The bonds may be repurchased at
any time from the day following the payment date except as otherwise specified by the book-entry transfer institution.
8. Interest payment dates: March 6 and September 6 of each year 9. Offering period: August 30, 201910. Payment date: September 6, 201911. Collateral and guarantee: The bonds are not secured by any col-
lateral or guarantee, and there are no particular assets reserved for the payment of these bonds.
12. Fiscal covenants: Negative pledge clause is attached.
76 Asahi Kasei Report 2019
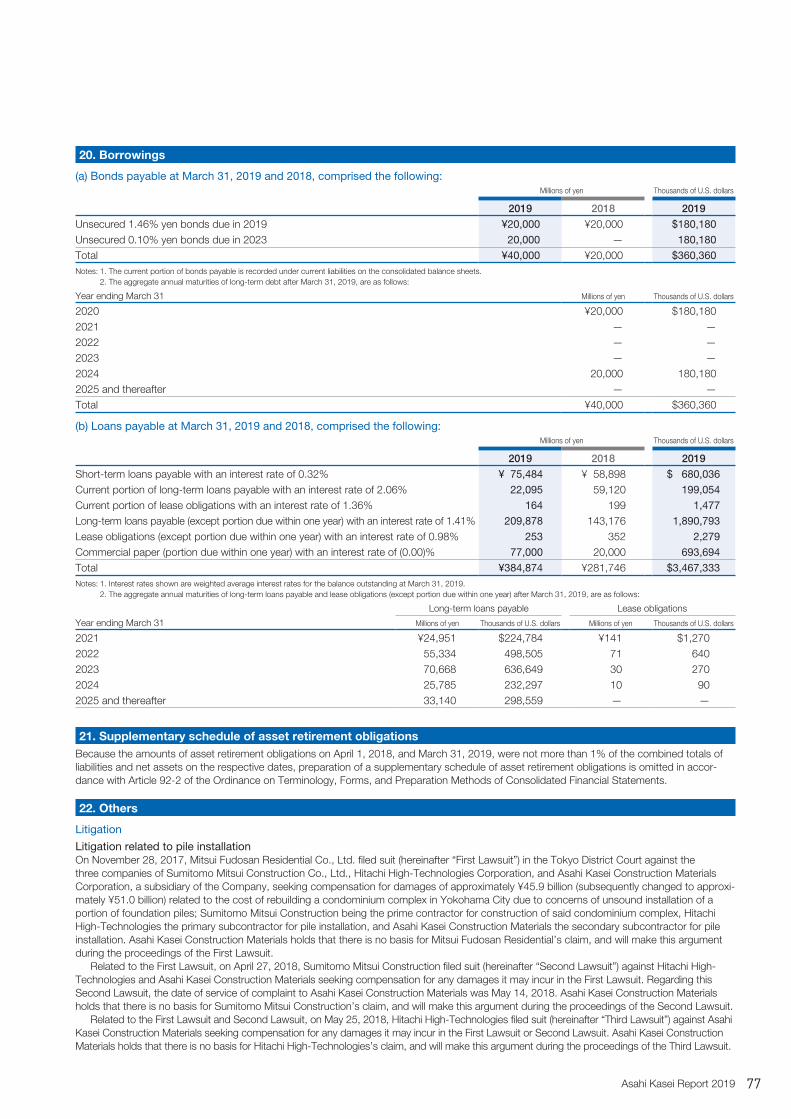
20. Borrowings
(a) Bonds payable at March 31, 2019 and 2018, comprised the following:Millions of yen Thousands of U.S. dollars
2019 2018 2019
Unsecured 1.46% yen bonds due in 2019 ¥20,000 ¥20,000 $180,180
Unsecured 0.10% yen bonds due in 2023 20,000 — 180,180
Total ¥40,000 ¥20,000 $360,360Notes: 1. The current portion of bonds payable is recorded under current liabilities on the consolidated balance sheets. 2. The aggregate annual maturities of long-term debt after March 31, 2019, are as follows:
Year ending March 31 Millions of yen Thousands of U.S. dollars
2020 ¥20,000 $180,1802021 — —2022 — —2023 — —2024 20,000 180,1802025 and thereafter — —Total ¥40,000 $360,360
(b) Loans payable at March 31, 2019 and 2018, comprised the following:Millions of yen Thousands of U.S. dollars
2019 2018 2019
Short-term loans payable with an interest rate of 0.32% ¥ 75,484 ¥ 58,898 $ 680,036
Current portion of long-term loans payable with an interest rate of 2.06% 22,095 59,120 199,054
Current portion of lease obligations with an interest rate of 1.36% 164 199 1,477
Long-term loans payable (except portion due within one year) with an interest rate of 1.41% 209,878 143,176 1,890,793
Lease obligations (except portion due within one year) with an interest rate of 0.98% 253 352 2,279
Commercial paper (portion due within one year) with an interest rate of (0.00)% 77,000 20,000 693,694
Total ¥384,874 ¥281,746 $3,467,333Notes: 1. Interest rates shown are weighted average interest rates for the balance outstanding at March 31, 2019. 2. The aggregate annual maturities of long-term loans payable and lease obligations (except portion due within one year) after March 31, 2019, are as follows:
Long-term loans payable Lease obligations
Year ending March 31 Millions of yen Thousands of U.S. dollars Millions of yen Thousands of U.S. dollars
2021 ¥24,951 $224,784 ¥141 $1,2702022 55,334 498,505 71 6402023 70,668 636,649 30 2702024 25,785 232,297 10 902025 and thereafter 33,140 298,559 — —
21. Supplementary schedule of asset retirement obligationsBecause the amounts of asset retirement obligations on April 1, 2018, and March 31, 2019, were not more than 1% of the combined totals of liabilities and net assets on the respective dates, preparation of a supplementary schedule of asset retirement obligations is omitted in accor-dance with Article 92-2 of the Ordinance on Terminology, Forms, and Preparation Methods of Consolidated Financial Statements.
22. Others
Litigation
Litigation related to pile installationOn November 28, 2017, Mitsui Fudosan Residential Co., Ltd. filed suit (hereinafter “First Lawsuit”) in the Tokyo District Court against the three companies of Sumitomo Mitsui Construction Co., Ltd., Hitachi High-Technologies Corporation, and Asahi Kasei Construction Materials Corporation, a subsidiary of the Company, seeking compensation for damages of approximately ¥45.9 billion (subsequently changed to approxi-mately ¥51.0 billion) related to the cost of rebuilding a condominium complex in Yokohama City due to concerns of unsound installation of a portion of foundation piles; Sumitomo Mitsui Construction being the prime contractor for construction of said condominium complex, Hitachi High-Technologies the primary subcontractor for pile installation, and Asahi Kasei Construction Materials the secondary subcontractor for pile installation. Asahi Kasei Construction Materials holds that there is no basis for Mitsui Fudosan Residential’s claim, and will make this argument during the proceedings of the First Lawsuit.
Related to the First Lawsuit, on April 27, 2018, Sumitomo Mitsui Construction filed suit (hereinafter “Second Lawsuit”) against Hitachi High-Technologies and Asahi Kasei Construction Materials seeking compensation for any damages it may incur in the First Lawsuit. Regarding this Second Lawsuit, the date of service of complaint to Asahi Kasei Construction Materials was May 14, 2018. Asahi Kasei Construction Materials holds that there is no basis for Sumitomo Mitsui Construction’s claim, and will make this argument during the proceedings of the Second Lawsuit.
Related to the First Lawsuit and Second Lawsuit, on May 25, 2018, Hitachi High-Technologies filed suit (hereinafter “Third Lawsuit”) against Asahi Kasei Construction Materials seeking compensation for any damages it may incur in the First Lawsuit or Second Lawsuit. Asahi Kasei Construction Materials holds that there is no basis for Hitachi High-Technologies’s claim, and will make this argument during the proceedings of the Third Lawsuit.
77Asahi Kasei Report 2019

78 Asahi Kasei Report 2019

Company Information/Investors Information(as of March 31, 2019)
■ Corporate Profile
Company Name Asahi Kasei Corporation
Date of Establishment May 21, 1931
Paid-in Capital ¥103,389 million
Employees 39,283 (consolidated)
7,864 (non-consolidated)
■ Asahi Kasei Group Offices (as of March 31, 2019)
Asahi Kasei CorporationTokyo Head Office
Hibiya Mitsui Tower1-1-2 Yurakucho, Chiyoda-ku, Tokyo 100-0006 JapanPhone: +81-(0)3-6699-3000 Fax: +81-(0)3-6699-3161
Asahi Kasei (China) Co., Ltd.
8/F, One ICC, Shanghai International Commerce CentreNo. 999 Huai Hai Zhong Road, Shanghai 200031 ChinaPhone: +86-21-6391-6111 Fax: +86-21-6391-6686
Beijing Office
Room 1407 New China Insurance TowerNo. 12 Jian Guo Men Wai Avenue Chao Yang District, Beijing 100022 China Phone: +86-10-6569-3939 Fax: +86-10-6569-3938
Asahi Kasei America, Inc.
800 Third Avenue, 30th Floor, New York, NY 10022 USAPhone: +1-212-371-9900 Fax: +1-212-371-9050
Asahi Kasei Europe GmbH
Am Seestern 4, 40547 Düsseldorf, GermanyPhone: +49-211-8822-030 Fax: +49-211-8822-0333
Asahi Kasei India Pvt. Ltd.
The Capital 1502B, Plot C-70, G-Block,Bandra Kurla Complex, Bandra (East), Mumbai 400051 IndiaPhone: +91-22-6710-3962
Core Operating CompaniesAsahi Kasei Microdevices
Hibiya Mitsui Tower1-1-2 Yurakucho, Chiyoda-ku, Tokyo 100-0006 JapanPhone: +81-(0)3-6699-3933
Asahi Kasei Homes
1-105 Kanda Jinbocho, Chiyoda-ku, Tokyo 101-8101 JapanPhone: +81-(0)3-6899-3000
Asahi Kasei Construction Materials
1-105 Kanda Jinbocho, Chiyoda-ku, Tokyo 101-8101 JapanPhone: +81-(0)3-3296-3500
Asahi Kasei Pharma
Hibiya Mitsui Tower1-1-2 Yurakucho, Chiyoda-ku, Tokyo 100-0006 JapanPhone: +81-(0)3-6699-3600
Asahi Kasei Medical
Hibiya Mitsui Tower1-1-2 Yurakucho, Chiyoda-ku, Tokyo 100-0006 JapanPhone: +81-(0)3-6699-3750
ZOLL Medical Corporation
269 Mill Rd., Chelmsford, MA 01824-4105 USAPhone: +1-978-421-9655
■ Investors Information
Stock Listing TokyoStock Code 3407Authorized Shares 4,000,000,000Outstanding Shares 1,402,616,332Transfer Agent Sumitomo Mitsui Trust Bank, Ltd.Independent Auditors PricewaterhouseCoopers Aarata LLCNumber of Shareholders 88,768
Largest Shareholders % of equity*
JP Morgan Chase Bank 380055 10.32
The Master Trust Bank of Japan, Ltd. (trust account) 6.88
Japan Trustee Services Bank, Ltd. (trust account) 4.81
Nippon Life Insurance Company 4.18
Sumitomo Mitsui Banking Corp. 2.54
Asahi Kasei Group Employee Stockholding Assn. 2.32
SSBTC Client Omnibus Account 2.07
Japan Trustee Services Bank, Ltd. (trust account 5) 1.96
Japan Trustee Services Bank, Ltd. (trust account 7) 1.62
State Street Bank West Client – Treaty 505234 1.50* Percentage of equity ownership after exclusion of treasury stock.
Asahi Kasei’s financial results and other materials for investors are available in our IR website.www.asahi-kasei.co.jp/asahi/en/ir
Asahi Kasei IR Website
79Asahi Kasei Report 2019

Printed in Japan2019.11
Asahi K
asei Rep
ort 2019
Hibiya Mitsui Tower1-1-2 Yurakucho, Chiyoda-ku, Tokyo 100-0006 Japanwww.asahi-kasei.co.jp/asahi/en/
Corporate CommunicationsTel: +81-(0)3-6699-3008, Fax: +81-(0)3-6699-3187


![AK2345 - AKM - Asahi Kasei Microdevices - Mixed Signal ... KASEI [AK2345] C0041-J-03 2006/09 - 3 - ブロック図 7 DREF 8 AMP4 Programmable OSC 22 23 RXIN DEM RXINO Splatter TSQLIM](https://img.pdfslide.tips/doc/110x75/5ab1cf797f8b9ad9788cbe24/ak2345-akm-asahi-kasei-microdevices-mixed-signal-kasei-ak2345-c0041-j-03.jpg)


![Johann Sebastian Bach BACH COLLEGIUM JAPAN …BIS-SACD1891].pdf · Sehet/ Komm, schaue doch ... thorough grounding in music; as a poet he exhibited an exceptional linguistic and formal](https://img.pdfslide.tips/doc/110x75/5b5d46b97f8b9ad21d8ddb09/johann-sebastian-bach-bach-collegium-japan-bis-sacd1891pdf-sehet-komm-schaue.jpg)