Embed Size (px)
Citation preview
GUIDELINES
Asian-Pacific Association for the Study of the Liver (APASL)consensus guidelines on invasive and non-invasive assessmentof hepatic fibrosis: a 2016 update
Gamal Shiha1,2 • Alaa Ibrahim3• Ahmed Helmy6 • Shiv Kumar Sarin4 • Masao Omata5 • Ashish Kumar7 •
David Bernstien8 • Hitushi Maruyama9 • Vivek Saraswat10 • Yogesh Chawla11 • Saeed Hamid12 • Zaigham Abbas13 •
Pierre Bedossa14 • Puja Sakhuja15 • Mamun Elmahatab16 • Seng Gee Lim17• Laurentius Lesmana18 • Jose Sollano19 •
Ji-Dong Jia20 • Bahaa Abbas21 • Ashraf Omar22 • Barjesh Sharma23 • Diana Payawal24 • Ahmed Abdallah25 •
Abdelhamid Serwah26 • Abdelkhalek Hamed27 • Aly Elsayed28 • Amany AbdelMaqsod29 • Tarek Hassanein30 •
Ahmed Ihab31 • Hamsik GHaziuan32 • Nizar Zein33 • Manoj Kumar4
Received: 2 April 2016 / Accepted: 13 August 2016 / Published online: 6 October 2016
� Asian Pacific Association for the Study of the Liver 2016
Abstract Hepatic fibrosis is a common pathway leading to
liver cirrhosis, which is the end result of any injury to the
liver. Accurate assessment of the degree of fibrosis is
important clinically, especially when treatments aimed at
reversing fibrosis are being evolved. Despite the fact that
liver biopsy (LB) has been considered the ‘‘gold standard’’
of assessment of hepatic fibrosis, LB is not favored by
patients or physicians owing to its invasiveness, limita-
tions, sampling errors, etc. Therefore, many alternative
approaches to assess liver fibrosis are gaining more popu-
larity and have assumed great importance, and many data
on such approaches are being generated. The Asian Pacific
Association for the Study of the Liver (APASL) set up a
working party on liver fibrosis in 2007, with a mandate to
develop consensus guidelines on various aspects of liver
fibrosis relevant to disease patterns and clinical practice in
the Asia-Pacific region. The first consensus guidelines of
the APASL recommendations on hepatic fibrosis were
& Gamal Shiha
1 Internal Medicine Department, El-Mansoura Faculty of
Medicine, Mansoura University, Mansoura, Egypt
2 Egyptian Liver Research Institute And Hospital (ELRIAH),
Mansoura, Egypt
3 Department of Internal medicine, University of Benha,
Benha, Egypt
4 Department of Hepatology, Institute of Liver and Biliary
Sciences (ILBS), New Delhi, India
5 Department of Gastroenterology, University of Tokyo,
Tokyo, Japan
6 Department of Tropical Medicine & Gastroenterology,
Faculty of Medicine, Assiut University, Assiut, Egypt
7 Department of Gastroenterology & Hepatology, Ganga Ram
Institute for Postgraduate Medical Education & Research of
Sir Ganga Ram Hospital, New Delhi, India
8 Division of Hepatology, North Shore University Hospital and
Long Island Jewish Medical Center, New Hyde Park,
New York, USA
9 Department of Gastroenterology, Chiba University Graduate
School of Medicine, Chiba, Chiba Prefecture, Japan
10 Department of Gastroenterology, Sanjay Gandhi
Postgraduate Institute of Medical Sciences, Lucknow,
Uttar Pradesh, India
11 Post Graduate Institute of Medial Education & Research,
Chandigarh, India
12 Department of Medicine, The Aga Khan University &
Hospital, Stadium Road, Karachi, Pakistan
13 Department of Hepatogastroenterology, Sindh Institute of
Urology and Transplantation, Karachi, Pakistan
14 Department of Pathology, Physiology and Imaging,
University Paris Diderot, Paris, France
15 Govind Ballabh Pant Hospital, Maulana Azad Medical
College, New Delhi, India
16 Department of Hepatology, Bangabandhu Sheikh Mujib
Medical University, Dhaka, Bangladesh
17 Department of Medicine, Yong Loo Lin School of Medicine,
National University of Singapore, Singapore, Singapore
18 Department of Medicine, University of Indonesia, Depok,
Indonesia
19 University of Santo Tomas, Espana Blvd, Manila, Philippines
20 Liver Research Centre at the Beijing Friendship Hospital,
Capital University in Beijing, Beijing, China
123
Hepatol Int (2017) 11:1–30
DOI 10.1007/s12072-016-9760-3
published in 2009. Due to advances in the field, we present
herein the APASL 2016 updated version on invasive and
non-invasive assessment of hepatic fibrosis. The process
for the development of these consensus guidelines involved
review of all available published literature by a core group
of experts who subsequently proposed consensus state-
ments followed by discussion of the contentious issues and
unanimous approval of the consensus statements. The
Oxford System of the evidence-based approach was
adopted for developing the consensus statements using the
level of evidence from one (highest) to five (lowest) and
grade of recommendation from A (strongest) to D (weak-
est). The topics covered in the guidelines include invasive
methods (LB and hepatic venous pressure gradient mea-
surements), blood tests, conventional radiological methods,
elastography techniques and cost-effectiveness of hepatic
fibrosis assessment methods, in addition to fibrosis
assessment in special and rare situations.
Keywords Liver fibrosis � Invasive assessment, non-
invasive assessment � Cirrhosis � Hepatitis C � Hepatitis B �Chronic liver disease � Non-alcoholic steatohepatitis � Graftfibrosis
Abbreviations
AASLD American Association for the Study of Liver
Diseases
ADC Apparent diffusion
APASL Asian Pacific Association for the Study of Liver
APRI AST platelet ratio index
aPTT Activated partial thromboplastin time
ARFI Acoustic radiation force impulse
AUROC Area under the receiver-operator characteristic
BIPED Burden of disease, investigative, prognostic,
efficacy of intervention and diagnostic
CDS Cirrhosis discriminant score
CDUS Color Doppler US
CEUS Contrast-enhanced ultrasound
CHC Chronic hepatitis
CI Confidence interval
CPA Collagen proportionate area
C/RL Caudate lobe width to the right lobe width
CT Computed tomography
CPTs Child-Pugh-Turcotte score
DWMRI Diffusion-weighted magnetic resonance
imaging
ECM Extracellular matrix
ELF Enhanced liver fibrosis
FHVP Free hepatic venous pressure
Fib-4 Fibrosis 4
FT Fibrotest
GRADE Grading of recommendations assessment
development and evaluation
HA Hyaluronic acid
HAI Histological activity index
HAP Hepatic arterial phase
HCC Hepatocellular carcinoma
HBV Hepatitis B virus
HCV Hepatitis C virus
HSCs Hepatic stellate cells
HVPG Hepatic venous pressure gradient
INR International normalized ratio
kPa Kilopascals
LB Liver biopsy
LR Likelihood ratio
LSM Liver stiffness measurement
MELD Model for end-stage liver disease
miR-29 Micro-RNA-29
MMPs Matrix metalloproteinase
MRE Magnetic resonance elastography
MRI Magnetic resonance imaging
MRS Magnetic resonance spectroscopy
21 Department of Internal Medicine, Military Medical
Academy, Cairo, Egypt
22 Tropical Medicine Department, Cairo Medical School, Cairo,
Egypt
23 Department of Gastroenterology, GB Pant Hospital,
New Delhi, India
24 Section of Gastroenterology, Cardinal Santos Medical
Center, San Juan City, Metro Manila, Philippines
25 Pediatric Hospital, Mansoura University, Mansoura, Egypt
26 College of Medicine, Taif University, Taif, Kingdom of
Saudi Arabia
27 Hepatology and Diabetes Unit, Military Medical Academy,
Cairo, Egypt
28 Hepatology & GIT Department, AHF Center Abu Dhabi,
Abu Dhabi, United Arab Emirates
29 Internal Medicine Department, Faculty of Medicine Cairo
University, Liver Transplant Unit Manial Hospital and Liver
ICU French Hospital, Cairo University, Cairo, Egypt
30 Chula Vista Medical Center, Chula Vista, CA, USA
31 Molecular Pathology Unit & Research Group, German
University in Cairo, Cairo, Egypt
32 Department of Hepatology, Nork Clinical Hospital of
Infectious Diseases, Yerevan, Armenia
33 Department of Gastroenterology and Hepatology, Cleveland
Clinic, Cleveland, USA
2 Hepatol Int (2017) 11:1–30
123
NAFLD Non-alcoholic fatty liver disease
NASH Non-alcoholic steatohepatitis
NOTES Natural orifice transluminal endoscopic surgery
PDUS Power Doppler ultrasound
PIIINP Amino-terminal propeptide of procollagen type
III
PSC Primary sclerosing cholangitis
PT Prothrombin time
PVP Portal venous phase
RFP Rapid fibrosis progression
RN Regenerating nodules
ROIs Regions of interest
RR Relative risk
SH-PPF Schistosomal hepatic periportal fibrosis
SIR Society of interventional radiology
SNR Signal-to-noise ratio
SPIOs Superparamagnetic iron
SSI Supersonic shear imaging
SWE Shear wave elastography
TE Transient elastography
TEG Thromboelastography
TIMP Tissue inhibitors of metalloproteinases
TJLB Transjugular liver biopsy
TPO Thrombopiotein
US Ultrasound
WHVP Wedged hepatic venous pressure
Introduction
The degree of liver fibrosis is one of the most important
diagnostic and prognostic assessments in chronic liver
disease. Clinical manifestations of liver disease and liver
dysfunction accompany architectural changes of the liver
parenchyma that are a result of advanced stages of liver
fibrosis. Globally, among the etiologies of hepatic fibrosis,
viral infections (chronic hepatitis B and C) and alcohol-
induced liver damage are the most common. Also the rising
obesity rates worldwide have increased the risk of liver
injury because of nonalcoholic fatty liver disease (NAFLD)
and nonalcoholic steatohepatitis (NASH). Other etiologies
of chronic liver injury include drug-induced toxicity, other
liver infections (e.g., schistosomiasis), immune-mediated
liver diseases (e.g., autoimmune hepatitis), metabolic dis-
orders (e.g., lipid, glycogen or metal storage disorders) and
cholestatic liver diseases.
Often regarded as the gold standard for fibrosis assess-
ment, liver biopsy (LB) is invasive in nature with associ-
ated risks. Moreover, LB has its own limitations owing to
inter- and intra-observer variability and the small amount
of tissue that is typically obtained with this procedure.
Advances in the development of serologic tests and con-
ventional and newer imaging techniques have been shown
to reduce the need for LB for diagnosing hepatic fibrosis.
Once cirrhosis develops, complications may develop
including ascites, portal hypertension, encephalopathy,
liver failure and an increased risk of hepatocellular carci-
noma (HCC). At present, the only curative treatment for
end-stage cirrhosis is liver transplantation. Previously, it
was thought that liver fibrosis and end-stage liver disease
(cirrhosis) were irreversible. Recent work suggests that
liver fibrosis may be modified by treatment. Thus, new
medical therapies to decrease or halt the progression of
fibrosis or reverse the fibrosis are urgently needed. The
discovery of the cells involved in liver fibrosis and evi-
dence that fibrosis is a dynamic and even reversible process
have led to continuous research in uncovering of the
molecular mechanisms of fibrosis in order to discover new
therapeutic strategies. Several advances have and are being
made in this area including cell isolation and culture
techniques for hepatic stellate cells (HSCs) from rodents
and humans; the development of animal models of liver
injury due to hepatic toxins (e.g., carbon tetrachloride,
thioacetamide, dimethylnitrosamine), bile duct ligation
and/or immune injury; genetic models of liver disease and
micro-RNA-29 (miRNA-29) in human and murine liver
fibrosis. As these pathways of fibrogenesis are further
clarified, the opportunity to develop new diagnostic tools
and therapeutic strategies will accelerate.
Methodology of the guideline development
These APASL clinical practice guidelines represent an
update of the last APASL guidelines published in 2009 [1].
The 2015 guidelines were developed by a panel of experts’
chosen by the APASL Governing Board, peer-reviewed by
the experts and approved by the APASL Governing Board.
The clinical practice guidelines are based on evidence from
existing publications, and, if evidence was unavailable, on
the experts’ personal experience and opinion. Manuscripts
and abstracts of important meetings published till March
2014 have been evaluated. The evidence and recommen-
dations in these guidelines have been graded according to
the Grading of Recommendations Assessment Develop-
ment and Evaluation (GRADE) system [2, 3] (Table 1).
Invasive and non-invasive markersfor the diagnosis of liver fibrosis
Investigations and ‘‘routine’’ scanning methods are unable
to determine whether cirrhosis or fibrosis is present [4].
The gold standard to diagnosis liver fibrosis or cirrhosis has
been LB, but this has been associated with significant
morbidity even though mortality rates are very low. The
Hepatol Int (2017) 11:1–30 3
123
invasive nature makes it unacceptable to many patients;
consequently, non-invasive methods have evolved over the
last decade. Progress in understanding of the mechanisms
of fibrosis has led to the identification of many potential
markers of fibrosis, which appear capable of identifying
early and advanced hepatic fibrosis. Standard cross-sec-
tional imaging studies will only identify or exclude
advanced fibrosis. Novel technologies such as transient
elastography (TE) and magnetic resonance elastography
(MRE) show promise as non-invasive methods of testing
for hepatic fibrosis.
Methodologies and statistical considerations
The best discriminants of non-invasive tests of liver fibrosis
are those tests that show a prognostic link and are inde-
pendently validated [5]. This strategy, however, has not
been widely accepted as yet. Any non-invasive marker that
quantitatively estimates liver fibrosis needs evaluation of
its diagnostic accuracy, which is done using the LRs and
the area under the receiver-operator characteristic
(AUROC) curve. AUROC combines the sensitivity and
specificity of a given quantitative marker for the diagnosis
of a specific definition of fibrosis. Sensitivity is usually
assessed in patients with advanced fibrosis (i.e., stages F2,
F3 and F4 in the METAVIR scoring system) and specificity
in non-advanced fibrosis (i.e., stages F0, F1). Any new
method of assessing liver fibrosis needs to be compared
with LB. Relatively high misclassification rates of the gold
standard, i.e., the LB, make it impossible to achieve a
perfect concordance (AUROC *1). When errors in a
diagnostic test and gold standard are independent, the
observed sensitivity and specificity of the diagnostic test
are underestimated. When examining diagnostic studies,
we need to be cognizant of the measures being evaluated
and their significance. The typical test spectrum includes
sensitivity and specificity, which can guide decisions on
which test to select, while positive and negative predictive
values are aimed to rule in or rule out disease. This is
affected by the prevalence of the disease in question and
hence cannot be broadly applied. To overcome this prob-
lem, likelihood ratios (LRs) and AUROC curve graphs
have been utilized. AUROC graphs may not be able to
discriminate different tests when the differences are rela-
tively minor. Hence, the LRs may be better able to deter-
mine a difference [6]. A proposed method was to utilize a
clinical utility model in which predetermined thresholds for
sensitivity and specificity are chosen and the test perfor-
mance classified as correct, incorrect or indeterminate [6].
While this is a potentially practical method, there is not yet
agreement on what these thresholds would be. In addition,
performance of diagnostic tests may vary according to the
severity and clinical presentation of the disease, called
spectrum bias [7]. One method of reducing spectrum bias is
to use a statistical correction to account for the differences
in prevalence of severe fibrosis within the study population
called dynamic actor network analysis (DANA) [8]. This is
an adjusted AUROC = observed AUROC ? [0.1056 (2.5-
observed DANA)] to account for the differences in
prevalence of severe fibrosis in the population.
Based on the limitations of LB, a large variety of non-
invasive investigations have been tested to evaluate their
diagnostic potential in liver fibrosis. These can broadly be
divided into blood biomarkers, imaging methods and
elastography methods. An alternative method has been to
use an algorithm-based approach.
LB for assessment of liver fibrosis
LB serves as an important tool for diagnosis, prognosis and
treatment of liver diseases. In 1958, Menghini [9] pub-
lished the first description of LB as it pertained to the study
of fibrosis. Since then LB has been considered to be the
Table 1 Grading of evidence and recommendations (adapted from the GRADE system) [2]
Notes Symbol
Grading of evidence
High quality Further research is very unlikely to change our confidence in the estimate of effect A
Moderate quality Further research is likely to have an important impact on our confidence in the estimate
of effect and may change the estimate
B
Low or very low quality Further research is very likely to have an important impact on our confidence in the
estimate of effect and is likely to change the estimate. Any estimate of effect is
uncertain
C
Grading of recommendation
Strong recommendation warranted Factors influencing the strength of the recommendation included the quality of the
evidence, presumed patient-important outcomes and cost
1
Weaker recommendation Variability in preferences and values, or more uncertainty: more likely a weak
recommendation is warranted. Recommendation is made with less certainty; higher
cost or resource consumption
2
4 Hepatol Int (2017) 11:1–30
123
procedure of choice to assess the amount of fibrosis in the
tissue. LB techniques over the years have undergone many
improvements and changes, and it is still considered to be
the gold standard, even in this era of serologic markers,
better imaging techniques and advanced molecular tech-
niques for diagnosis and quantification of hepatitis viruses
[10].
Consensus statement
• LB is considered as the gold standard for diagnosing
liver fibrosis, but sampling errors and both intra- and
inter-observer agreement on biopsy samples may lead
to poor reproducibility for many liver biopsies, and the
procedure is invasive and expensive (A1).
Techniques of LB
Several techniques may be used to obtain liver tissue.
While percutaneous LB remains the most common prac-
tice, LB can also be performed via the transvenous route,
during surgery or by laparoscopy, especially in patients
with contraindications to a percutaneous approach.
Percutaneous LB
Preparation for percutaneous LB
Prior to performance of LB, patients should be educated
about their liver disease and about the biopsy procedure
(including alternatives to LB, risks, benefits and limitations
of LB). A complete history and physical examination, a
review of medications and measurement of clotting
parameters should be done prior to the procedure. A light
meal 2–4 h before the procedure may facilitate gallbladder
emptying and reduce the risk of gallbladder puncture and
also help avoid a vasovagal response during or shortly after
the procedure. Percutaneous LB has traditionally been
avoided in patients with a prothrombin time (PT)[4 s over
control, an international normalized ratio (INR)[1.5 or a
platelet counts \60,000/ll. Patients with the above
derangements should undergo transjugular liver biopsy
(TJLB) and receive fresh frozen plasma and/or platelet
transfusions before the procedure.
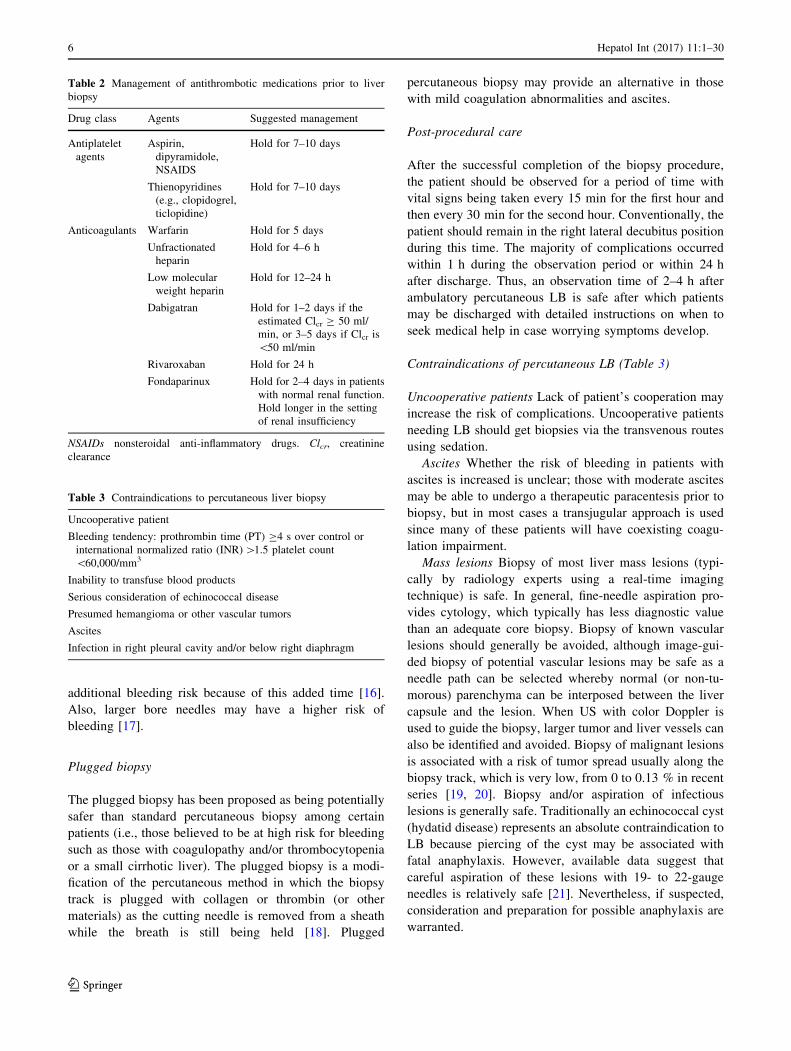
Few data are available with which to guide management
about the timing of discontinuation of anticoagulants and/
or antiplatelet agents prior to LB. A list of different drugs
and their recommended stopping time is shown in Table 2.
Anticoagulation should be resumed when safely possible;
in the absence of immediate bleeding or adverse events,
unfractionated heparin should be reinitiated 2–6 h after LB.
Timing of restarting anticoagulants is greatly debated.
However, since delayed bleeding has been reported in
patients on oral anticoagulants, oral anticoagulation should
not be restarted immediately, but can be resumed 48–72 h
after the biopsy [11].
Management of specific drugs should be handled on a
case-by-case basis, and in all patients, the risk of discon-
tinuing these medications must be weighed against the
(potential) risk of bleeding during/after LB. Written con-
sent documenting the discussion about the procedure and
any potential complications, with the patient and/or a
proxy, should be obtained.
Technique and process of percutaneous LB
If patients are feeling anxious, intravenous fentanyl and
midazolam can alleviate apprehension, facilitate the pro-
cedure, provide some post-procedure relief of pain and
achieve some degree of amnesia.
Use of imaging for percutaneous LB
Ultrasound (US) can be used to either ‘‘mark’’ the biopsy
site or the US can be used in real time by the operator.
Image guidance for LB (either marking or in real time)
should be considered in patients with known specific mass
lesions and in those with previous intra-abdominal surgery
who may have adhesions, allowing avoidance of other
structures in the latter situation. It may be especially useful
in specific situations, including: (1) patients with small
livers that are difficult to percuss, (2) obese patients or (3)
patients with clinically demonstrable ascites. Use of
ultrasonography has resulted in better outcomes, is cost
effective and already widely utilized; however, it is not
obligatory [12].
Devices used for percutaneous LB
Needles used to perform percutaneous LB are broadly
categorized as aspiration needles (Menghini, Klatskin and
Jamshidi needles) and cutting needles (Vim Silverman and
‘Tru-Cut’ needles and spring-loaded needles with trigger-
ing mechanisms). Comparisons of Menghini aspiration and
‘Tru-Cut’ needles have shown increased rates of tissue
sample fragmentation with the aspiration needles compared
with the cutting-type needles, especially in the presence of
cirrhosis [13, 14]. Tru-Cut biopsies are significantly longer
(12 versus 8 mm; p\ 0.001) and contain a greater number
of portal tracts (16 versus 6; p\ 0.001) than aspiration-
type needles [13]. Among the cutting type devices, it has
been reported that the automated needles acquire slightly
longer tissue samples (1.7 versus 1.5 mm; p = 0.05) [15].
Non-automated cutting needles remain in the liver for a
modestly longer time during the biopsy and may pose
Hepatol Int (2017) 11:1–30 5
123
additional bleeding risk because of this added time [16].
Also, larger bore needles may have a higher risk of
bleeding [17].
Plugged biopsy
The plugged biopsy has been proposed as being potentially
safer than standard percutaneous biopsy among certain
patients (i.e., those believed to be at high risk for bleeding
such as those with coagulopathy and/or thrombocytopenia
or a small cirrhotic liver). The plugged biopsy is a modi-
fication of the percutaneous method in which the biopsy
track is plugged with collagen or thrombin (or other
materials) as the cutting needle is removed from a sheath
while the breath is still being held [18]. Plugged
percutaneous biopsy may provide an alternative in those
with mild coagulation abnormalities and ascites.
Post-procedural care
After the successful completion of the biopsy procedure,
the patient should be observed for a period of time with
vital signs being taken every 15 min for the first hour and
then every 30 min for the second hour. Conventionally, the
patient should remain in the right lateral decubitus position
during this time. The majority of complications occurred
within 1 h during the observation period or within 24 h
after discharge. Thus, an observation time of 2–4 h after
ambulatory percutaneous LB is safe after which patients
may be discharged with detailed instructions on when to
seek medical help in case worrying symptoms develop.
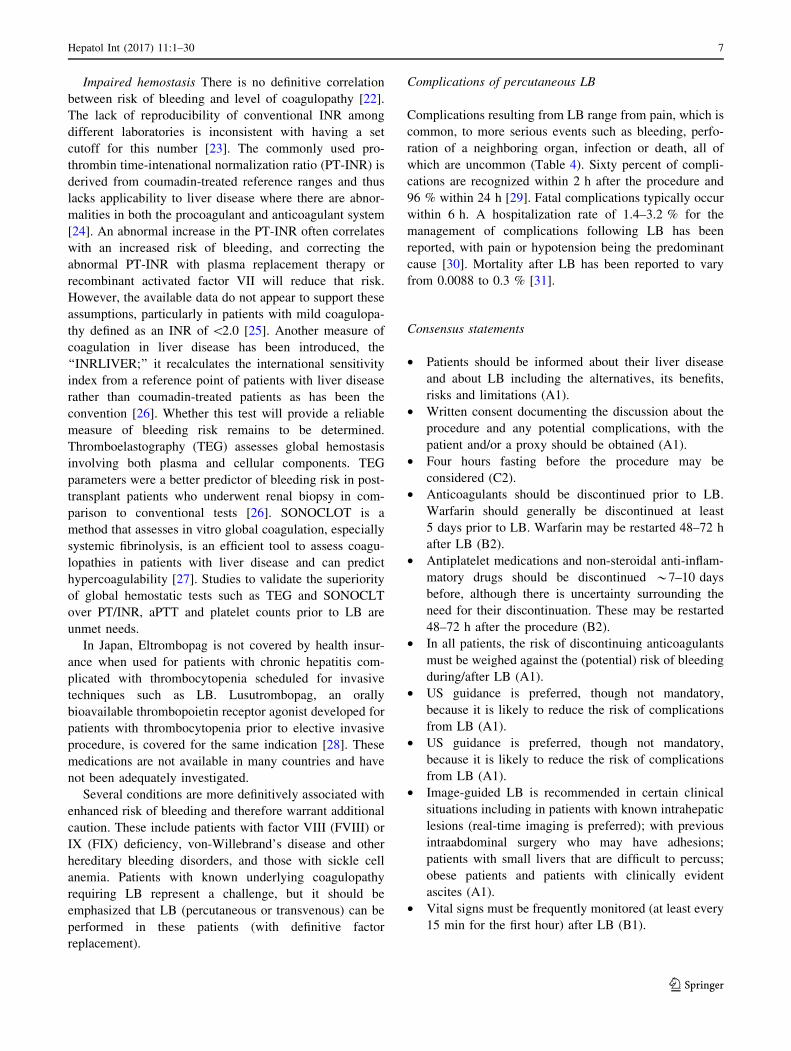
Contraindications of percutaneous LB (Table 3)
Uncooperative patients Lack of patient’s cooperation may
increase the risk of complications. Uncooperative patients
needing LB should get biopsies via the transvenous routes
using sedation.
Ascites Whether the risk of bleeding in patients with
ascites is increased is unclear; those with moderate ascites
may be able to undergo a therapeutic paracentesis prior to
biopsy, but in most cases a transjugular approach is used
since many of these patients will have coexisting coagu-
lation impairment.
Mass lesions Biopsy of most liver mass lesions (typi-
cally by radiology experts using a real-time imaging
technique) is safe. In general, fine-needle aspiration pro-
vides cytology, which typically has less diagnostic value
than an adequate core biopsy. Biopsy of known vascular
lesions should generally be avoided, although image-gui-
ded biopsy of potential vascular lesions may be safe as a
needle path can be selected whereby normal (or non-tu-
morous) parenchyma can be interposed between the liver
capsule and the lesion. When US with color Doppler is
used to guide the biopsy, larger tumor and liver vessels can
also be identified and avoided. Biopsy of malignant lesions
is associated with a risk of tumor spread usually along the
biopsy track, which is very low, from 0 to 0.13 % in recent
series [19, 20]. Biopsy and/or aspiration of infectious
lesions is generally safe. Traditionally an echinococcal cyst
(hydatid disease) represents an absolute contraindication to
LB because piercing of the cyst may be associated with
fatal anaphylaxis. However, available data suggest that
careful aspiration of these lesions with 19- to 22-gauge
needles is relatively safe [21]. Nevertheless, if suspected,
consideration and preparation for possible anaphylaxis are
warranted.
Table 2 Management of antithrombotic medications prior to liver
biopsy
Drug class Agents Suggested management
Antiplatelet
agents
Aspirin,
dipyramidole,
NSAIDS
Hold for 7–10 days
Thienopyridines
(e.g., clopidogrel,
ticlopidine)
Hold for 7–10 days
Anticoagulants Warfarin Hold for 5 days
Unfractionated
heparin
Hold for 4–6 h
Low molecular
weight heparin
Hold for 12–24 h
Dabigatran Hold for 1–2 days if the
estimated Clcr C 50 ml/
min, or 3–5 days if Clcr is
\50 ml/min
Rivaroxaban Hold for 24 h
Fondaparinux Hold for 2–4 days in patients
with normal renal function.
Hold longer in the setting
of renal insufficiency
NSAIDs nonsteroidal anti-inflammatory drugs. Clcr, creatinine
clearance
Table 3 Contraindications to percutaneous liver biopsy
Uncooperative patient
Bleeding tendency: prothrombin time (PT) C4 s over control or
international normalized ratio (INR)[1.5 platelet count
\60,000/mm3
Inability to transfuse blood products
Serious consideration of echinococcal disease
Presumed hemangioma or other vascular tumors
Ascites
Infection in right pleural cavity and/or below right diaphragm
6 Hepatol Int (2017) 11:1–30
123
Impaired hemostasis There is no definitive correlation
between risk of bleeding and level of coagulopathy [22].
The lack of reproducibility of conventional INR among
different laboratories is inconsistent with having a set
cutoff for this number [23]. The commonly used pro-
thrombin time-intenational normalization ratio (PT-INR) is
derived from coumadin-treated reference ranges and thus
lacks applicability to liver disease where there are abnor-
malities in both the procoagulant and anticoagulant system
[24]. An abnormal increase in the PT-INR often correlates
with an increased risk of bleeding, and correcting the
abnormal PT-INR with plasma replacement therapy or
recombinant activated factor VII will reduce that risk.
However, the available data do not appear to support these
assumptions, particularly in patients with mild coagulopa-
thy defined as an INR of\2.0 [25]. Another measure of
coagulation in liver disease has been introduced, the
‘‘INRLIVER;’’ it recalculates the international sensitivity
index from a reference point of patients with liver disease
rather than coumadin-treated patients as has been the
convention [26]. Whether this test will provide a reliable
measure of bleeding risk remains to be determined.
Thromboelastography (TEG) assesses global hemostasis
involving both plasma and cellular components. TEG
parameters were a better predictor of bleeding risk in post-
transplant patients who underwent renal biopsy in com-
parison to conventional tests [26]. SONOCLOT is a
method that assesses in vitro global coagulation, especially
systemic fibrinolysis, is an efficient tool to assess coagu-
lopathies in patients with liver disease and can predict
hypercoagulability [27]. Studies to validate the superiority
of global hemostatic tests such as TEG and SONOCLT
over PT/INR, aPTT and platelet counts prior to LB are
unmet needs.
In Japan, Eltrombopag is not covered by health insur-
ance when used for patients with chronic hepatitis com-
plicated with thrombocytopenia scheduled for invasive
techniques such as LB. Lusutrombopag, an orally
bioavailable thrombopoietin receptor agonist developed for
patients with thrombocytopenia prior to elective invasive
procedure, is covered for the same indication [28]. These
medications are not available in many countries and have
not been adequately investigated.
Several conditions are more definitively associated with
enhanced risk of bleeding and therefore warrant additional
caution. These include patients with factor VIII (FVIII) or
IX (FIX) deficiency, von-Willebrand’s disease and other
hereditary bleeding disorders, and those with sickle cell
anemia. Patients with known underlying coagulopathy
requiring LB represent a challenge, but it should be
emphasized that LB (percutaneous or transvenous) can be
performed in these patients (with definitive factor
replacement).
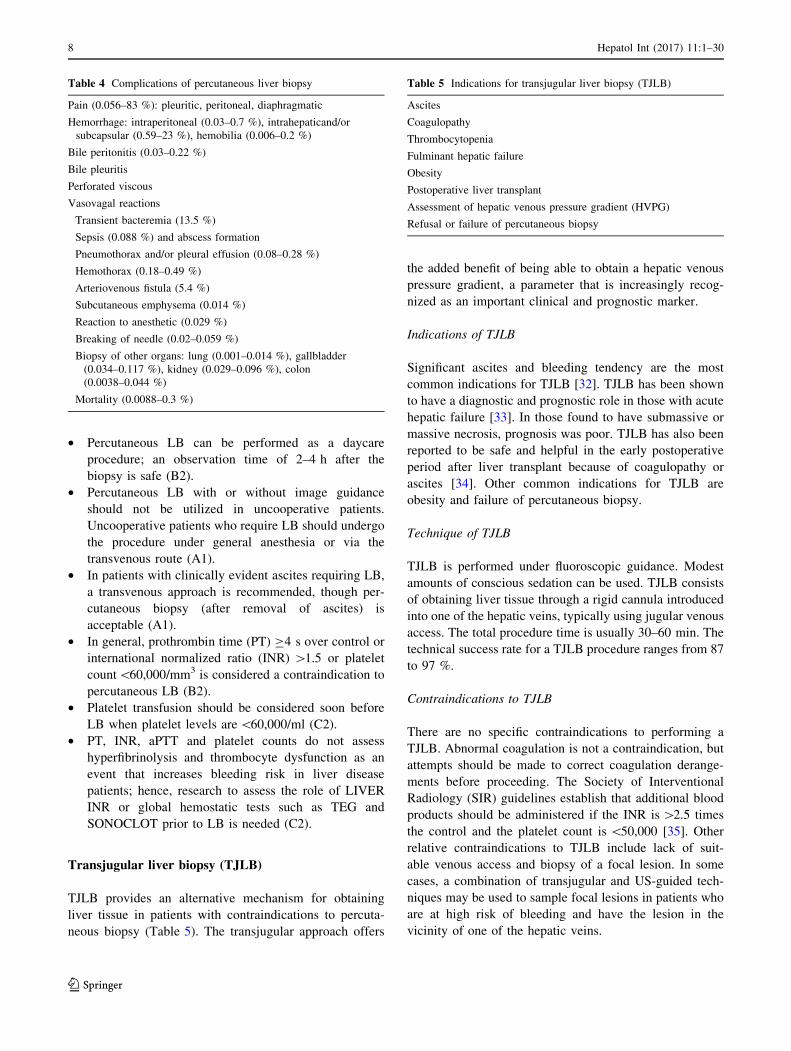
Complications of percutaneous LB
Complications resulting from LB range from pain, which is
common, to more serious events such as bleeding, perfo-
ration of a neighboring organ, infection or death, all of
which are uncommon (Table 4). Sixty percent of compli-
cations are recognized within 2 h after the procedure and
96 % within 24 h [29]. Fatal complications typically occur
within 6 h. A hospitalization rate of 1.4–3.2 % for the
management of complications following LB has been
reported, with pain or hypotension being the predominant
cause [30]. Mortality after LB has been reported to vary
from 0.0088 to 0.3 % [31].
Consensus statements
• Patients should be informed about their liver disease
and about LB including the alternatives, its benefits,
risks and limitations (A1).
• Written consent documenting the discussion about the
procedure and any potential complications, with the
patient and/or a proxy should be obtained (A1).
• Four hours fasting before the procedure may be
considered (C2).
• Anticoagulants should be discontinued prior to LB.
Warfarin should generally be discontinued at least
5 days prior to LB. Warfarin may be restarted 48–72 h
after LB (B2).
• Antiplatelet medications and non-steroidal anti-inflam-
matory drugs should be discontinued *7–10 days
before, although there is uncertainty surrounding the
need for their discontinuation. These may be restarted
48–72 h after the procedure (B2).
• In all patients, the risk of discontinuing anticoagulants
must be weighed against the (potential) risk of bleeding
during/after LB (A1).
• US guidance is preferred, though not mandatory,
because it is likely to reduce the risk of complications
from LB (A1).
• US guidance is preferred, though not mandatory,
because it is likely to reduce the risk of complications
from LB (A1).
• Image-guided LB is recommended in certain clinical
situations including in patients with known intrahepatic
lesions (real-time imaging is preferred); with previous
intraabdominal surgery who may have adhesions;
patients with small livers that are difficult to percuss;
obese patients and patients with clinically evident
ascites (A1).
• Vital signs must be frequently monitored (at least every
15 min for the first hour) after LB (B1).
Hepatol Int (2017) 11:1–30 7
123
• Percutaneous LB can be performed as a daycare
procedure; an observation time of 2–4 h after the
biopsy is safe (B2).
• Percutaneous LB with or without image guidance
should not be utilized in uncooperative patients.
Uncooperative patients who require LB should undergo
the procedure under general anesthesia or via the
transvenous route (A1).
• In patients with clinically evident ascites requiring LB,
a transvenous approach is recommended, though per-
cutaneous biopsy (after removal of ascites) is
acceptable (A1).
• In general, prothrombin time (PT) C4 s over control or
international normalized ratio (INR) [1.5 or platelet
count\60,000/mm3 is considered a contraindication to
percutaneous LB (B2).
• Platelet transfusion should be considered soon before
LB when platelet levels are\60,000/ml (C2).
• PT, INR, aPTT and platelet counts do not assess
hyperfibrinolysis and thrombocyte dysfunction as an
event that increases bleeding risk in liver disease
patients; hence, research to assess the role of LIVER
INR or global hemostatic tests such as TEG and
SONOCLOT prior to LB is needed (C2).
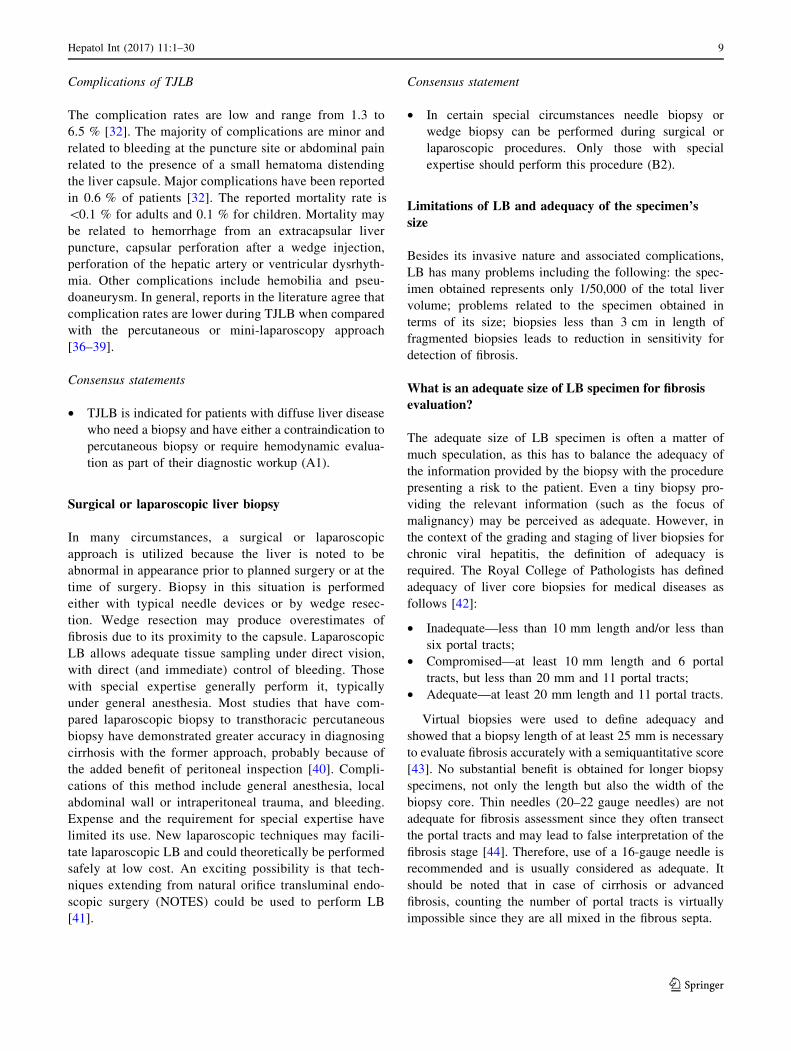
Transjugular liver biopsy (TJLB)
TJLB provides an alternative mechanism for obtaining
liver tissue in patients with contraindications to percuta-
neous biopsy (Table 5). The transjugular approach offers
the added benefit of being able to obtain a hepatic venous
pressure gradient, a parameter that is increasingly recog-
nized as an important clinical and prognostic marker.
Indications of TJLB
Significant ascites and bleeding tendency are the most
common indications for TJLB [32]. TJLB has been shown
to have a diagnostic and prognostic role in those with acute
hepatic failure [33]. In those found to have submassive or
massive necrosis, prognosis was poor. TJLB has also been
reported to be safe and helpful in the early postoperative
period after liver transplant because of coagulopathy or
ascites [34]. Other common indications for TJLB are
obesity and failure of percutaneous biopsy.
Technique of TJLB
TJLB is performed under fluoroscopic guidance. Modest
amounts of conscious sedation can be used. TJLB consists
of obtaining liver tissue through a rigid cannula introduced
into one of the hepatic veins, typically using jugular venous
access. The total procedure time is usually 30–60 min. The
technical success rate for a TJLB procedure ranges from 87
to 97 %.
Contraindications to TJLB
There are no specific contraindications to performing a
TJLB. Abnormal coagulation is not a contraindication, but
attempts should be made to correct coagulation derange-
ments before proceeding. The Society of Interventional
Radiology (SIR) guidelines establish that additional blood
products should be administered if the INR is[2.5 times
the control and the platelet count is\50,000 [35]. Other
relative contraindications to TJLB include lack of suit-
able venous access and biopsy of a focal lesion. In some
cases, a combination of transjugular and US-guided tech-
niques may be used to sample focal lesions in patients who
are at high risk of bleeding and have the lesion in the
vicinity of one of the hepatic veins.
Table 4 Complications of percutaneous liver biopsy
Pain (0.056–83 %): pleuritic, peritoneal, diaphragmatic
Hemorrhage: intraperitoneal (0.03–0.7 %), intrahepaticand/or
subcapsular (0.59–23 %), hemobilia (0.006–0.2 %)
Bile peritonitis (0.03–0.22 %)
Bile pleuritis
Perforated viscous
Vasovagal reactions
Transient bacteremia (13.5 %)
Sepsis (0.088 %) and abscess formation
Pneumothorax and/or pleural effusion (0.08–0.28 %)
Hemothorax (0.18–0.49 %)
Arteriovenous fistula (5.4 %)
Subcutaneous emphysema (0.014 %)
Reaction to anesthetic (0.029 %)
Breaking of needle (0.02–0.059 %)
Biopsy of other organs: lung (0.001–0.014 %), gallbladder
(0.034–0.117 %), kidney (0.029–0.096 %), colon
(0.0038–0.044 %)
Mortality (0.0088–0.3 %)
Table 5 Indications for transjugular liver biopsy (TJLB)
Ascites
Coagulopathy
Thrombocytopenia
Fulminant hepatic failure
Obesity
Postoperative liver transplant
Assessment of hepatic venous pressure gradient (HVPG)
Refusal or failure of percutaneous biopsy
8 Hepatol Int (2017) 11:1–30
123
Complications of TJLB
The complication rates are low and range from 1.3 to
6.5 % [32]. The majority of complications are minor and
related to bleeding at the puncture site or abdominal pain
related to the presence of a small hematoma distending
the liver capsule. Major complications have been reported
in 0.6 % of patients [32]. The reported mortality rate is
\0.1 % for adults and 0.1 % for children. Mortality may
be related to hemorrhage from an extracapsular liver
puncture, capsular perforation after a wedge injection,
perforation of the hepatic artery or ventricular dysrhyth-
mia. Other complications include hemobilia and pseu-
doaneurysm. In general, reports in the literature agree that
complication rates are lower during TJLB when compared
with the percutaneous or mini-laparoscopy approach
[36–39].
Consensus statements
• TJLB is indicated for patients with diffuse liver disease
who need a biopsy and have either a contraindication to
percutaneous biopsy or require hemodynamic evalua-
tion as part of their diagnostic workup (A1).
Surgical or laparoscopic liver biopsy
In many circumstances, a surgical or laparoscopic
approach is utilized because the liver is noted to be
abnormal in appearance prior to planned surgery or at the
time of surgery. Biopsy in this situation is performed
either with typical needle devices or by wedge resec-
tion. Wedge resection may produce overestimates of
fibrosis due to its proximity to the capsule. Laparoscopic
LB allows adequate tissue sampling under direct vision,
with direct (and immediate) control of bleeding. Those
with special expertise generally perform it, typically
under general anesthesia. Most studies that have com-
pared laparoscopic biopsy to transthoracic percutaneous
biopsy have demonstrated greater accuracy in diagnosing
cirrhosis with the former approach, probably because of
the added benefit of peritoneal inspection [40]. Compli-
cations of this method include general anesthesia, local
abdominal wall or intraperitoneal trauma, and bleeding.
Expense and the requirement for special expertise have
limited its use. New laparoscopic techniques may facili-
tate laparoscopic LB and could theoretically be performed
safely at low cost. An exciting possibility is that tech-
niques extending from natural orifice transluminal endo-
scopic surgery (NOTES) could be used to perform LB
[41].
Consensus statement
• In certain special circumstances needle biopsy or
wedge biopsy can be performed during surgical or
laparoscopic procedures. Only those with special
expertise should perform this procedure (B2).
Limitations of LB and adequacy of the specimen’s
size
Besides its invasive nature and associated complications,
LB has many problems including the following: the spec-
imen obtained represents only 1/50,000 of the total liver
volume; problems related to the specimen obtained in
terms of its size; biopsies less than 3 cm in length of
fragmented biopsies leads to reduction in sensitivity for
detection of fibrosis.
What is an adequate size of LB specimen for fibrosis
evaluation?
The adequate size of LB specimen is often a matter of
much speculation, as this has to balance the adequacy of
the information provided by the biopsy with the procedure
presenting a risk to the patient. Even a tiny biopsy pro-
viding the relevant information (such as the focus of
malignancy) may be perceived as adequate. However, in
the context of the grading and staging of liver biopsies for
chronic viral hepatitis, the definition of adequacy is
required. The Royal College of Pathologists has defined
adequacy of liver core biopsies for medical diseases as
follows [42]:
• Inadequate—less than 10 mm length and/or less than
six portal tracts;
• Compromised—at least 10 mm length and 6 portal
tracts, but less than 20 mm and 11 portal tracts;
• Adequate—at least 20 mm length and 11 portal tracts.
Virtual biopsies were used to define adequacy and
showed that a biopsy length of at least 25 mm is necessary
to evaluate fibrosis accurately with a semiquantitative score
[43]. No substantial benefit is obtained for longer biopsy
specimens, not only the length but also the width of the
biopsy core. Thin needles (20–22 gauge needles) are not
adequate for fibrosis assessment since they often transect
the portal tracts and may lead to false interpretation of the
fibrosis stage [44]. Therefore, use of a 16-gauge needle is
recommended and is usually considered as adequate. It
should be noted that in case of cirrhosis or advanced
fibrosis, counting the number of portal tracts is virtually
impossible since they are all mixed in the fibrous septa.
Hepatol Int (2017) 11:1–30 9
123
The TJLB has been proposed as a useful method to
obtain ‘‘adequate’’ samples as it allows for more than one
pass without any significant risk of bleeding. TJLB with
three passes produces optimal biopsies for diagnostic pur-
poses, which are adequate for staging and grading in 38 %
(biopsy length C25 mm) or 25 % (C11 portal tracts) of
cases. [45, 46]. Another factor that needs consideration is
the effect of processing on biopsy length. The core length
is significantly shorter in the cartridge (23 %) compared to
when removing it out on the tray, and it shrinks (7 %)
again when subjected to formalin fixation and paraffin
embedding [47]. Issues of smaller sample size and frag-
mentation problems have been overcome since aspiration
techniques have given way to ‘Tru-Cut’ TJLB methods
[48]. Although TJLB specimens yield decreased number of
portal tracts, when contrasted with the risk of percutaneous
biopsy in those with contraindications, TJLB provides a
valuable alternative for assessment of liver histology.
Consideration should be given to performing four passes if
an assessment of disease severity is the goal.
There has been increasing interest in quantitative
estimation of liver fibrosis, unlike the routine semiquan-
titative scores/staging systems used. Using techniques
such as digital image analysis to assess the amount of
collagen as a proportion of the total liver core, the col-
lagen proportionate area (CPA) is calculated. The size of
LB that is adequate for such quantitative estimations was
recently assessed by Hall et al. [49]. They observed that
increasing sample size increases the reliability of CPA
results. Because an adequate LB only represents approx-
imately 1/50,000th of the liver tissue, sampling variability
can never be completely eliminated. In order to minimize
its effect, large cohorts of patients and biopsies should be
assessed in trials [50]. This will reduce the variation,
which will then be random and multidirectional, and of a
lesser consequence.
In order to minimize false differences in the scoring of
paired biopsies, those of comparable size should be used in
trials studying fibrosis progression or the effect of antiviral
therapy. Clinical trials should also specify the minimum
sample size considered adequate for inclusion. The his-
tology report for LB gives a statement about the adequacy
of the specimen in the form of the length and number of
portal tracts included [51]. If the biopsy adequacy is
questionable, the clinician should be made aware of this.
Consensus statements
• Biopsy length of \10 mm and/or \6 portal tracts
should be considered inadequate for fibrosis staging
(B1).
• Biopsies of C20 mm or C11 portal tracts should be
considered ideal (B1).
• Final judgement on the adequacy of a sample for
staging is based on the judgement of an experienced
pathologist (C2).
• All histology reports should mention the sample size
and the number of complete portal tracts included and
comment on the adequacy of the sample, with the
exception of cases with cirrhosis or advanced fibrosis
(B1).
• Clinical trials should specify minimum sample size as
an inclusion criterion (B1).
Training for liver biopsy
All LB techniques require specific training so as to ensure
appropriate-sized specimen retrieval and the lowest rate of
complications. The number of biopsies needing to be per-
formed to become adequately trained is unknown. The
AASLD’s Training and Workforce Committee has rec-
ommended that the minimum number of procedures
required to achieve training proficiency in standard
transthoracic percutaneous LB is 40 (supervised) biopsies
[12]. The number to become an expert will vary depending
on the skill of the operator, the educator and specifics of the
training setting. Training in US should also be developed as
part of the required training for percutaneous LB to be able
to do US-guided biopsy.
Consensus statements
• Specific training for LB is essential (A1).
• Although the required number of biopsies performed to
become adequately trained is unknown, it is recom-
mended that operators perform at least 40 biopsies
(C2).
• Training in US should be a part of the required training
for percutaneous LB (C2).
Morphological evaluation of liver fibrosis: Current
methods and scoring systems
Descriptive reporting is often used when assessing diag-
nostic biopsies from an individual patient. However, in the
trial and research setting, evaluation of biopsies is carried
out using semiquantitative scoring systems that produce
shorthand values for various categories of inflammation
(grade) and fibrosis and architectural disruption (stage).
The Ishak or ‘‘revised Knodell’’ system attempts to correct
the criticism of numerical discontinuity by reintroducing
the number 2 [52–54]. In other words, the Knodell system
classified fibrosis into stages 0, ‘‘no fibrosis;’’ 1, ‘‘portal
fibrosis;’’ 3, ‘‘bridging fibrosis;’’ 4 ‘‘cirrhosis’’ with the
absence of stage 2, which describes ‘‘portal fibrosis with
10 Hepatol Int (2017) 11:1–30
123
septae outside the portal area.’’ This stage 2 was included
in the revised system. The Ishak system assesses fibrosis in
seven categories, ranging from normal to cirrhosis, and so
has potentially more discriminant descriptive power. The
French METAVIR Cooperative Study Group proposed a
five-tier scoring system for hepatic fibrosis (from F0 to F4)
and activity (from A0 to A4), which is less accurate than
the Ishak score, but more reproducible between patholo-
gists [55].
All scoring systems use the same principles to record
liver disease stage. It is obvious that the ‘‘stage’’ or ‘‘fi-
brosis’’ score is composed of a mixture of features (fibrosis
amount, location of fibrosis, architectural distorsion), none
of which specifically depends on the amount of fibrous
tissue in a LB sample. Computer-assisted image analysis of
histochemically stained sections is a method for measuring
fibrosis morphologically. It does not hinder other necessary
diagnostic evaluations, and collagenous structures irrele-
vant to the disease process (which contribute to the vari-
ability between samples) can be excluded [56].
Considering any scoring system, the experience of the
histopathologist is an important variable that must be
considered and optimized [57].
Future evolving techniques of morphological
evaluation of liver fibrosis
To reduce the potential inaccuracies in the processing and
evaluation of biopsy specimens, several innovations have
been made, which include incorporation of digital image
analysis, genetic investigations and immunohistochemistry
for functionally important molecules such as cytokines, cell
cycle markers and viral life cycle markers into everyday
practice.
Virtual microscopy
The virtual microscopy can be performed in two different
ways. Interactive virtual microscopy by whole-slide
imaging leaves the conclusion in the hands of pathologist.
It significantly changes the working tools from optical
microscopy and subjective decisions to computer screens
and objective measurements. The automated virtual
microscopy is even more exciting as computer systems
evaluate the diagnoses. In liver pathology, the software has
been developed for assessment of steatosis, fibrosis,
necroinflammatory changes and hepatocyte volume.
Broadly speaking, image analysis of fibrosis assessment
uses segmentation of digital images to measure the area of
collagen and the area of tissue, producing a fibrosis ratio or
CPA [58, 59]. To quantify hepatic collagen histologically,
it is necessary first to stain it specifically. Sirius red has an
affinity for most hepatic collagens, including types I and III
(the major components of liver collagen). Thus, Sirius red
staining is the preferred histochemical method when
quantifying liver fibrosis. However, some investigators
have used reticulin or trichrome stains or immunohisto-
chemistry, but due to variability in staining and difficulty in
accurate thresholding, these techniques can suffer from
poor reproducibility.
Image analysis studies have looked at fibrosis in many
conditions, producing overall similar results ranging from 1
to 4 % fibrous tissue in normal liver to 15–35 % fibrous
tissue in cirrhosis [60]. CPA correlates well with late stages
of fibrosis, but is highly sensitive to sample size [43].
Problems with virtual microscopy include inter-observer
differences and poor correlation of the fibrosis area with
staging scores [61]. In addition, the digital data do not
allow differentiation between low stages of fibrosis [62].
Clinical applicability of CPA is still being critically
evaluated.
Another method called qFibrosis for LB assessment
has been described, based on the strategy of combining
pathology-relevant collagen architectural features with
automated computer-aided tools. With input of imaging
data from a liver sample, qFibrosis can automatically
compute the fully quantitative fibrosis scores based on the
respective collagen architectural features. qFibrosis can
reliably stage liver fibrosis with reduced variability of
sampling error and inter- and intra-observer bias in the
assessment of both animal samples and CHB core biop-
sies. In addition, qFibrosis can differentiate late fibrosis
stages on the Ishak scoring system, which suggests a
potential to aid the monitoring of intra-stage cirrhosis
changes. qFibrosis has demonstrated superior performance
to CPA [63].
Functional liver tissue analysis in LB
The diagnostic evaluation of LB is mostly based on a panel
of histochemical stains. These techniques may be com-
plemented by various ‘‘- omic’’ tools to gain more data on
the function of liver cells [64]. The cytokines, inflamma-
tory mediators, viral proteins, cell cycle proteins and
apoptosis markers and metabolic pathways can be
investigated.
• Cytokine expression can be analyzed, e.g., TGF, EGFR,
IL-6 and others. Due to the complex nature of cytokine
action, a wide spectrum of different molecules and their
receptors must be analyzed in detail to avoid insignif-
icant or contradictory results. This needs virtual
microscopy and digital image analysis.
• Proteomic studies including immunohistochemistry in
LB have targeted cell structure-associated proteins
(e.g., actin, tropomyosin, transgelin and human
Hepatol Int (2017) 11:1–30 11
123
microfibril-associated protein 4) in order to identify
biomarkers of liver cirrhosis [65].
• Cell cycle analysis can add valuable information, and
viral antigens including hepatitis C antigen can be
detected in liver tissue by immunohistochemistry
[66, 67].
• DNA microarray technology has enabled genome-wide
analysis of gene transcript levels. This technology has
been applied in order to compare gene expression
profiles at different stages of CHC [68], chronic
hepatitis and autoimmune liver disease [69].
• Transcriptome analysis has shown prognostic value,
e.g., in order to predict the severity of fibrosis
progression after liver transplantation in patients with
recurrent HCV infection [70]. Metabolic pathways and
inflammatory cells can also be studied [71].
Consensus statement
• The combination of semiquantitative and morphometric
assessment of fibrosis in LB should be considered for
research purposes (B2).
Blood tests for liver fibrosis assessment
Mechanisms of liver fibrosis and potential targets
of fibrosis blood biomarker research
Fibrogenesis is a complex process, usually triggered by an
insult to the liver that leads to replacement of liver tissue
by scar tissue. The process can take many years although
acceleration of the process can occur if there is massive
liver injury. Cell death can be caused by a variety of insults
including viral, autoimmune, ischemic, toxic or metabolic.
Each disease has different pathways to liver damage [72].
These processes trigger myofibroblasts, the effector cells of
fibrogenesis, to secrete extracellular matrix. Excessive
fibrogenesis is the result of an imbalance between the
degradation and formation of extracellular matrix (ECM)
components. These ECM macromolecules are mainly
fibrous proteins with structural and adhesive functions,
such as collagens and proteoglycans. During fibrogenesis,
type I and III collagen levels increase up to eight times
with a significantly higher increase of type I collagen than
of type III collagen, changing the I/III ratio from 1:1 in the
healthy liver to 2:1 in the cirrhotic liver. The liver also
contains other collagen types, all of which may be involved
in the excessive fibrogenesis during fibrosis, leading to the
end result of cirrhosis with a total of up to six times more
collagen than in the normal liver [73]. In the normal liver,
the net amount of proteoglycans is low, whereas the level
of several proteoglycans (decorin, biglycan, perlecan and
syndecan) is increased during liver fibrosis [74]. An
increase in collagen and proteoglycan can result from
increased protein production, impaired protein degradation,
diminished matrix degradation or a combination of these
mechanisms. In the extracellular space, matrix degradation
occurs predominantly as a consequence of the action of
matrix metalloproteinases (MMPs). MMPs are secreted
from cells into the extracellular space as proenzymes,
which are then activated by a number of specific, usually
cell surface-associated, cleavage mechanisms. The active
enzymes are in turn inhibited by a family of tissue inhi-
bitors of metalloproteinases (TIMP) [75]. By this combi-
nation of mechanisms, ECM degradation is closely
regulated, which prevents inadvertent tissue damage. As a
consequence, excessive matrix deposition may be the
consequence of either increased formation or decreased
degradation of connective tissue components or both. The
stages of fibrogenesis can be arbitrarily divided into three
stages—initiation, perpetuation and resolution. All these
processes and variables are closely related. The ECM plays
a critical role as in the cytokine milieu in which the central
agent is TGFß. Consequently, this heterogeneity in the type
of insult, stage of fibrogenesis, extent of fibrogenesis and
type of immune response makes identifying biomarkers to
stage fibrosis challenging.
Classification of liver fibrosis blood biomarkers:
an overview
Gressner et al. separated biomarkers into class I and class II
and published the most comprehensive classification of
fibrosis biomarkers. [76]. Class I biomarkers are those
intended to reflect ECM turnover and/or fibrogenic cell
changes. Class II involves indirect serum biomarkers based
on algorithmic evaluations of commonly observed func-
tional alterations of the liver that do not necessarily reflect
ECM turnover and/or fibrogenic cell changes. Class I
biomarkers, in particular, originating from different lines of
basic research and their changes, might be very difficult to
interpret from a clinical or pathophysiological perspective.
The BIPED (burden of disease, investigative, prognos-
tic, efficacy of intervention and diagnostic) classification
categorizes biomarkers according to key parameters that
are needed for assessment of clinical trials in research and
development. Several classes have been defined:
1. Biomarkers that describe the progression of disease
and correlate with known clinical parameters (burden
of disease—B).
2. Biomarkers that capture the effect of an intervention in
both known and unknown biological mechanisms
associated with clinical outcome and that can act as a
12 Hepatol Int (2017) 11:1–30
123
surrogate marker, i.e., changes in these biomarkers can
predict the clinical outcome (efficacy—E).
3. Diagnostic biomarkers enabling identification of patients
within the population and identification of subgroups
within the diseased population (diagnostic—D).
4. Biomarkers that identify subjects with high risk of
progression (prognostic—P)
5. Biomarkers not fully validated in a study population
and therefore can be used solely for scientific inves-
tigations (investigatory—I).
Classification by the BIPED system may enable
researchers from different backgrounds to communicate in
a robust assessment framework, with a special focus on
diagnostic, prognostic and possible burden of disease
evaluations [77].
Serum markers for diagnosis of liver fibrosis
Class I biomarkers
Individual tests in general are too insensitive to be used,
and hence class I biomarkers are often tested in panels.
Only two test panels that underwent significant clinical
evaluation. The first is MP3, which comprises amino-ter-
minal propeptide of procollagen type III (PIIINP), a marker
of fibrogenesis, and MMP-1. However, few studies have
utilized this MP3 test and are limited to patients with
chronic HCV infection [78]. The second is the enhanced
liver fibrosis (ELF) test, which has been extensively tested
in a variety of liver diseases. The ELF test comprises
hyaluronic acid (HA), a component of the ECM, TIMP-1
and PIIINP reflecting collagen synthesis at the site of dis-
ease. A meta-analysis of its performance is summarized in
Table 6 [79, 80]. Recently, real-time measurement of
Wisteria floribunda agglutinin positive human Mac-2-
binding protein [WFA(?) -M2BP] and monitoring of time-
course changes in its level can identify patients at high risk
of HCC development and can predict hepatic fibrosis
[81, 82]. However, this is not available for wide use in
many countries and warrants further studies in comparison
to other non-invasive modalities.
Class II biomarkers
These can be divided into simple panels, which are derived
from routine laboratory tests or patented panels, which are
commercial kits of a large panel of tests. Meta-analyses of
studies were limited, and a search found two studies
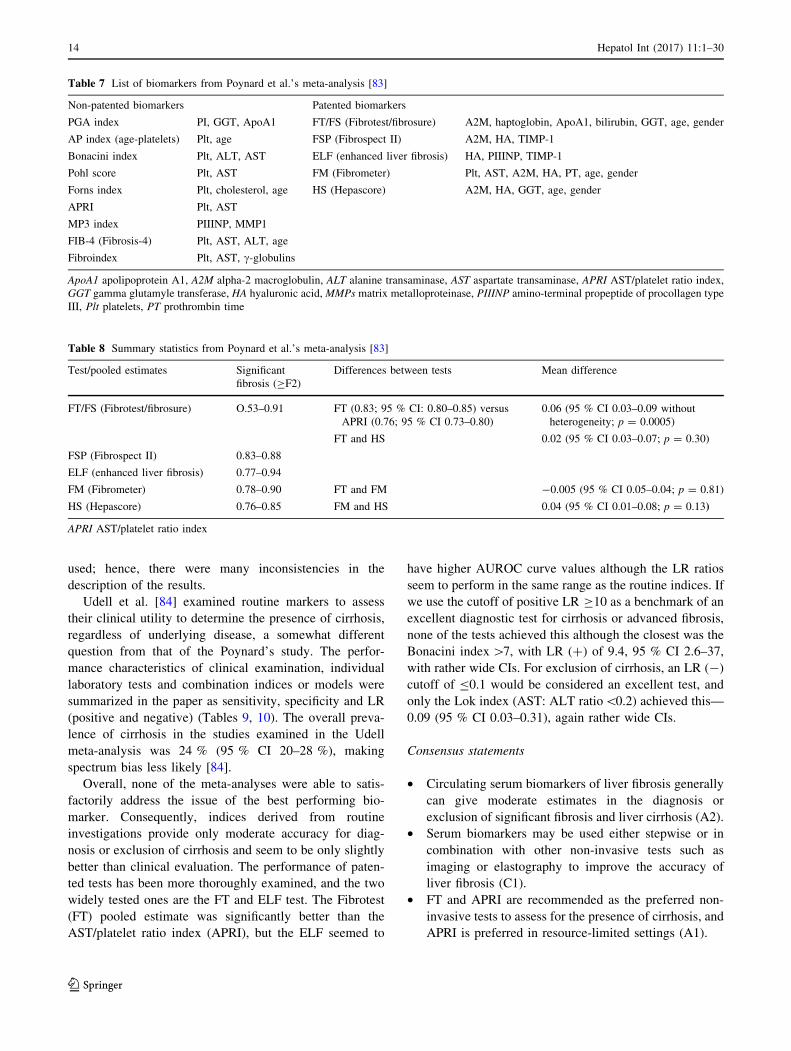
[83, 84]. Poynard et al. examined biomarkers of liver
fibrosis, and his main objective was to examine the diag-
nostic utility of the biomarker for advanced fibrosis defined
as CF2 (METAVIR system) based entirely on the AUROC
curve [83]. The study also adjusted for spectrum bias by
using DANA analysis. There were 62 quality measures,
and validation was based on the number of studies and
number of patients. Among 2237 studies, 14 biomarkers
were found to be validated, 9 were not patented, and 5 were
patented (Tables 7 and 8). FibroTest (FT) was the most
studied test with 33 different populations including 6549
patients and 925 controls. The mean diagnostic value for
the diagnosis of advanced fibrosis (CF3) assessed using
AUROC curves was 0.84 [95 % confidence interval (CI),
0.83–0.86], without significant difference between the
causes of CLD, hepatitis C, hepatitis B, alcoholic or
NAFLD. High-risk profiles of false-negative/-positive of
FT were present in 3 % of populations (mainly those with
Gilbert syndrome, hemolysis and acute inflammation). FT
had higher accuracy than the most used nonpatented test,
APRI. No significant difference has been observed among
the five patented tests [83].
Health authorities in some countries have already
approved the use of validated biomarkers as the first-line
procedure for the staging of liver fibrosis. This overview of
evidence-based data suggests that biomarkers could be
used as an alternative to LB for the assessment of fibrosis
stage in the above four liver diseases, and neither
biomarkers nor LBs are sufficient alone to make a defini-
tive decision in a given patient, and all the clinical and
biological data must be taken into account [83]. An
examination of the Poynard et al. [83] meta-analysis finds
that this is not a typical meta-analysis and the methodology
is not clearly described. Data were not pooled for many of
the tests, and when comparisons were made, pooling was
Table 6 Performance of the enhanced liver fibrosis (ELF) test in liver disease
Test/pooled estimates Significant fibrosis (CF2) Severe fibrosis (CF3) Cirrhosis
Sensitivity 83 % (95 % CI 0.8–0.86) 78 % (95 % CI 0.74–0.81) 80 % (95 % CI 0.75–0.85)
Specificity 73 % (95 % CI 0.69–0.77) 76 % (95 % CI 0.73–0.78) 71 % (95 % CI 0.68–0.74)
LR (?) 4.00 (95 % CI 2.03–6.39) 4.39 (95 % CI 2.76–6.97) 3.13 (95 % CI 2.01–4.87
LR (-) 0.24 (95 % CI 0.17–0.34) 0.27 (95 % CI 0.16–0.46) 0.29 (95 % CI 0.19–0.44)
Diagnostic OR 16.10 (95 % CI 8.27–31.34) 16.01 (95 % CI 7.15–35.82) 14.09 (95 % CI 5.43–36.59)
AUROC 0.8813 0.8696 0.8770
OR odds ratio, LR likelihood ratio, CI confidence interval, AUROC area under the receiver-operator characteristic curve
Hepatol Int (2017) 11:1–30 13
123
used; hence, there were many inconsistencies in the
description of the results.
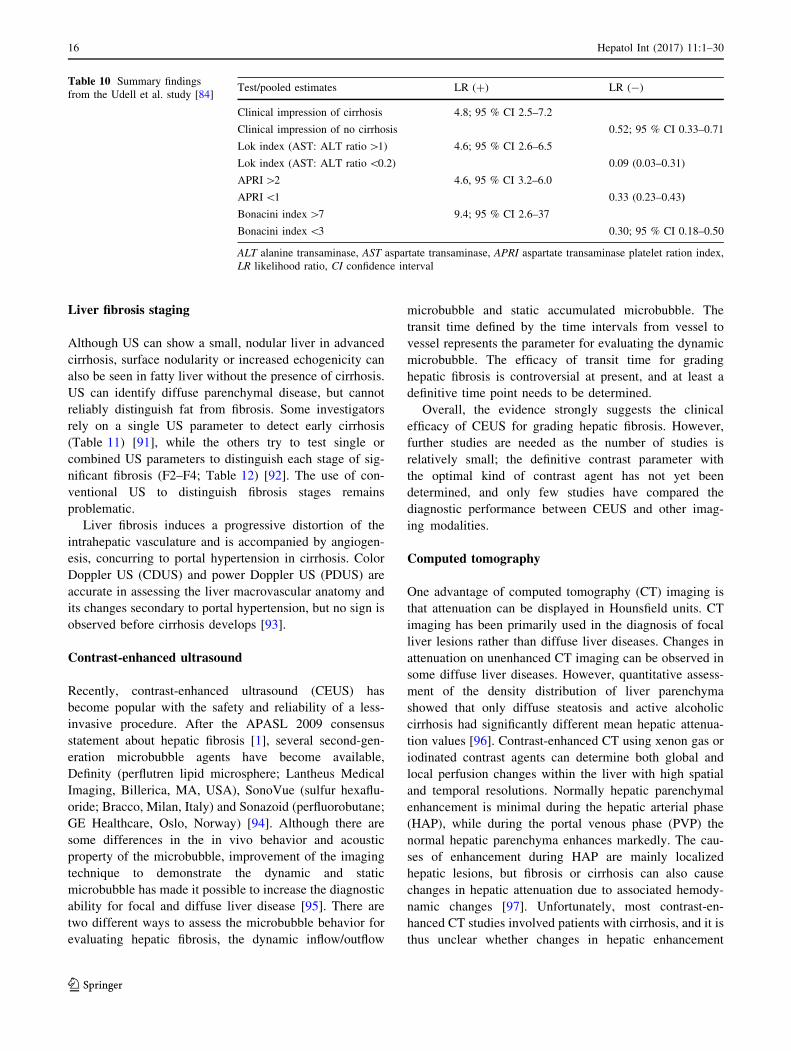
Udell et al. [84] examined routine markers to assess
their clinical utility to determine the presence of cirrhosis,
regardless of underlying disease, a somewhat different
question from that of the Poynard’s study. The perfor-
mance characteristics of clinical examination, individual
laboratory tests and combination indices or models were
summarized in the paper as sensitivity, specificity and LR
(positive and negative) (Tables 9, 10). The overall preva-
lence of cirrhosis in the studies examined in the Udell
meta-analysis was 24 % (95 % CI 20–28 %), making
spectrum bias less likely [84].
Overall, none of the meta-analyses were able to satis-
factorily address the issue of the best performing bio-
marker. Consequently, indices derived from routine
investigations provide only moderate accuracy for diag-
nosis or exclusion of cirrhosis and seem to be only slightly
better than clinical evaluation. The performance of paten-
ted tests has been more thoroughly examined, and the two
widely tested ones are the FT and ELF test. The Fibrotest
(FT) pooled estimate was significantly better than the
AST/platelet ratio index (APRI), but the ELF seemed to
have higher AUROC curve values although the LR ratios
seem to perform in the same range as the routine indices. If
we use the cutoff of positive LR C10 as a benchmark of an
excellent diagnostic test for cirrhosis or advanced fibrosis,
none of the tests achieved this although the closest was the
Bonacini index[7, with LR (?) of 9.4, 95 % CI 2.6–37,
with rather wide CIs. For exclusion of cirrhosis, an LR (-)
cutoff of B0.1 would be considered an excellent test, and
only the Lok index (AST: ALT ratio\0.2) achieved this—
0.09 (95 % CI 0.03–0.31), again rather wide CIs.
Consensus statements
• Circulating serum biomarkers of liver fibrosis generally
can give moderate estimates in the diagnosis or
exclusion of significant fibrosis and liver cirrhosis (A2).
• Serum biomarkers may be used either stepwise or in
combination with other non-invasive tests such as
imaging or elastography to improve the accuracy of
liver fibrosis (C1).
• FT and APRI are recommended as the preferred non-
invasive tests to assess for the presence of cirrhosis, and
APRI is preferred in resource-limited settings (A1).
Table 7 List of biomarkers from Poynard et al.’s meta-analysis [83]
Non-patented biomarkers Patented biomarkers
PGA index PI, GGT, ApoA1 FT/FS (Fibrotest/fibrosure) A2M, haptoglobin, ApoA1, bilirubin, GGT, age, gender
AP index (age-platelets) Plt, age FSP (Fibrospect II) A2M, HA, TIMP-1
Bonacini index Plt, ALT, AST ELF (enhanced liver fibrosis) HA, PIIINP, TIMP-1
Pohl score Plt, AST FM (Fibrometer) Plt, AST, A2M, HA, PT, age, gender
Forns index Plt, cholesterol, age HS (Hepascore) A2M, HA, GGT, age, gender
APRI Plt, AST
MP3 index PIIINP, MMP1
FIB-4 (Fibrosis-4) Plt, AST, ALT, age
Fibroindex Plt, AST, c-globulins
ApoA1 apolipoprotein A1, A2M alpha-2 macroglobulin, ALT alanine transaminase, AST aspartate transaminase, APRI AST/platelet ratio index,
GGT gamma glutamyle transferase, HA hyaluronic acid, MMPs matrix metalloproteinase, PIIINP amino-terminal propeptide of procollagen type
III, Plt platelets, PT prothrombin time
Table 8 Summary statistics from Poynard et al.’s meta-analysis [83]
Test/pooled estimates Significant
fibrosis (CF2)
Differences between tests Mean difference
FT/FS (Fibrotest/fibrosure) O.53–0.91 FT (0.83; 95 % CI: 0.80–0.85) versus
APRI (0.76; 95 % CI 0.73–0.80)
0.06 (95 % CI 0.03–0.09 without
heterogeneity; p = 0.0005)
FT and HS 0.02 (95 % CI 0.03–0.07; p = 0.30)
FSP (Fibrospect II) 0.83–0.88
ELF (enhanced liver fibrosis) 0.77–0.94
FM (Fibrometer) 0.78–0.90 FT and FM -0.005 (95 % CI 0.05–0.04; p = 0.81)
HS (Hepascore) 0.76–0.85 FM and HS 0.04 (95 % CI 0.01–0.08; p = 0.13)
APRI AST/platelet ratio index
14 Hepatol Int (2017) 11:1–30
123
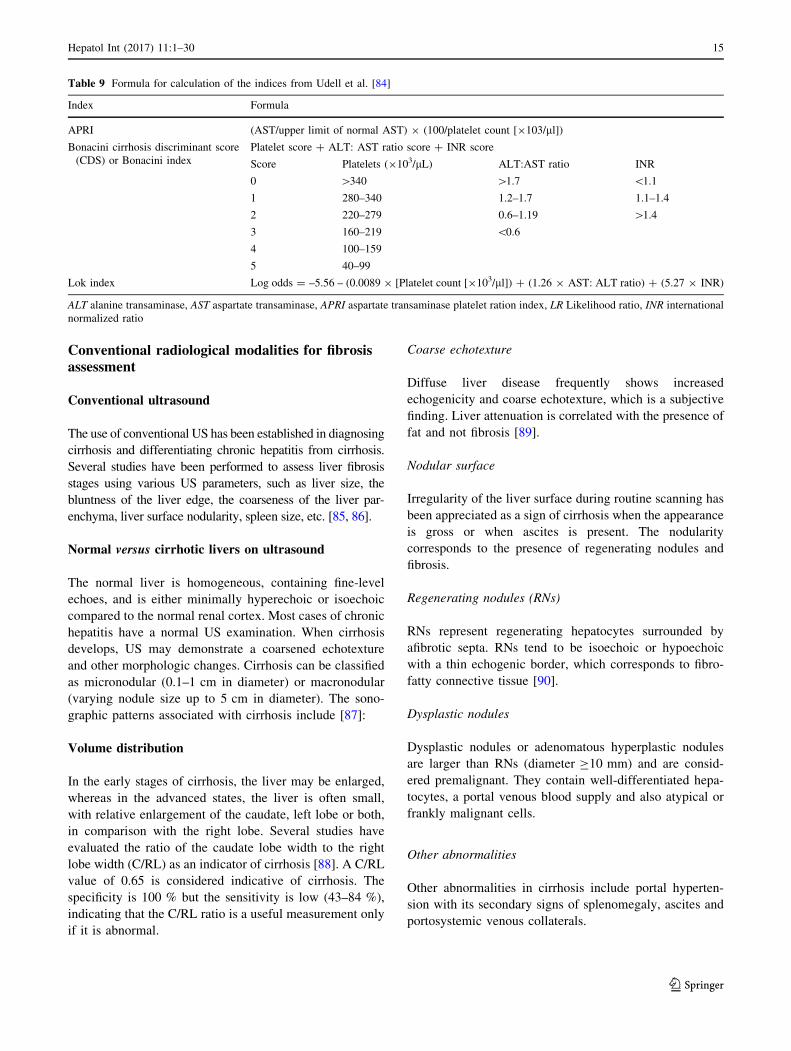
Conventional radiological modalities for fibrosisassessment
Conventional ultrasound
The use of conventional US has been established in diagnosing
cirrhosis and differentiating chronic hepatitis from cirrhosis.
Several studies have been performed to assess liver fibrosis
stages using various US parameters, such as liver size, the
bluntness of the liver edge, the coarseness of the liver par-
enchyma, liver surface nodularity, spleen size, etc. [85, 86].
Normal versus cirrhotic livers on ultrasound
The normal liver is homogeneous, containing fine-level
echoes, and is either minimally hyperechoic or isoechoic
compared to the normal renal cortex. Most cases of chronic
hepatitis have a normal US examination. When cirrhosis
develops, US may demonstrate a coarsened echotexture
and other morphologic changes. Cirrhosis can be classified
as micronodular (0.1–1 cm in diameter) or macronodular
(varying nodule size up to 5 cm in diameter). The sono-
graphic patterns associated with cirrhosis include [87]:
Volume distribution
In the early stages of cirrhosis, the liver may be enlarged,
whereas in the advanced states, the liver is often small,
with relative enlargement of the caudate, left lobe or both,
in comparison with the right lobe. Several studies have
evaluated the ratio of the caudate lobe width to the right
lobe width (C/RL) as an indicator of cirrhosis [88]. A C/RL
value of 0.65 is considered indicative of cirrhosis. The
specificity is 100 % but the sensitivity is low (43–84 %),
indicating that the C/RL ratio is a useful measurement only
if it is abnormal.
Coarse echotexture
Diffuse liver disease frequently shows increased
echogenicity and coarse echotexture, which is a subjective
finding. Liver attenuation is correlated with the presence of
fat and not fibrosis [89].
Nodular surface
Irregularity of the liver surface during routine scanning has
been appreciated as a sign of cirrhosis when the appearance
is gross or when ascites is present. The nodularity
corresponds to the presence of regenerating nodules and
fibrosis.
Regenerating nodules (RNs)
RNs represent regenerating hepatocytes surrounded by
afibrotic septa. RNs tend to be isoechoic or hypoechoic
with a thin echogenic border, which corresponds to fibro-
fatty connective tissue [90].
Dysplastic nodules
Dysplastic nodules or adenomatous hyperplastic nodules
are larger than RNs (diameter C10 mm) and are consid-
ered premalignant. They contain well-differentiated hepa-
tocytes, a portal venous blood supply and also atypical or
frankly malignant cells.
Other abnormalities
Other abnormalities in cirrhosis include portal hyperten-
sion with its secondary signs of splenomegaly, ascites and
portosystemic venous collaterals.
Table 9 Formula for calculation of the indices from Udell et al. [84]
Index Formula
APRI (AST/upper limit of normal AST) 9 (100/platelet count [9103/ll])
Bonacini cirrhosis discriminant score
(CDS) or Bonacini index
Platelet score ? ALT: AST ratio score ? INR score
Score Platelets (9103/lL) ALT:AST ratio INR
0 [340 [1.7 \1.1
1 280–340 1.2–1.7 1.1–1.4
2 220–279 0.6–1.19 [1.4
3 160–219 \0.6
4 100–159
5 40–99
Lok index Log odds = –5.56 – (0.0089 9 [Platelet count [9103/ll]) ? (1.26 9 AST: ALT ratio) ? (5.27 9 INR)
ALT alanine transaminase, AST aspartate transaminase, APRI aspartate transaminase platelet ration index, LR Likelihood ratio, INR international
normalized ratio
Hepatol Int (2017) 11:1–30 15
123
Liver fibrosis staging
Although US can show a small, nodular liver in advanced
cirrhosis, surface nodularity or increased echogenicity can
also be seen in fatty liver without the presence of cirrhosis.
US can identify diffuse parenchymal disease, but cannot
reliably distinguish fat from fibrosis. Some investigators
rely on a single US parameter to detect early cirrhosis
(Table 11) [91], while the others try to test single or
combined US parameters to distinguish each stage of sig-
nificant fibrosis (F2–F4; Table 12) [92]. The use of con-
ventional US to distinguish fibrosis stages remains
problematic.
Liver fibrosis induces a progressive distortion of the
intrahepatic vasculature and is accompanied by angiogen-
esis, concurring to portal hypertension in cirrhosis. Color
Doppler US (CDUS) and power Doppler US (PDUS) are
accurate in assessing the liver macrovascular anatomy and
its changes secondary to portal hypertension, but no sign is
observed before cirrhosis develops [93].
Contrast-enhanced ultrasound
Recently, contrast-enhanced ultrasound (CEUS) has
become popular with the safety and reliability of a less-
invasive procedure. After the APASL 2009 consensus
statement about hepatic fibrosis [1], several second-gen-
eration microbubble agents have become available,
Definity (perflutren lipid microsphere; Lantheus Medical
Imaging, Billerica, MA, USA), SonoVue (sulfur hexaflu-
oride; Bracco, Milan, Italy) and Sonazoid (perfluorobutane;
GE Healthcare, Oslo, Norway) [94]. Although there are
some differences in the in vivo behavior and acoustic
property of the microbubble, improvement of the imaging
technique to demonstrate the dynamic and static
microbubble has made it possible to increase the diagnostic
ability for focal and diffuse liver disease [95]. There are
two different ways to assess the microbubble behavior for
evaluating hepatic fibrosis, the dynamic inflow/outflow
microbubble and static accumulated microbubble. The
transit time defined by the time intervals from vessel to
vessel represents the parameter for evaluating the dynamic
microbubble. The efficacy of transit time for grading
hepatic fibrosis is controversial at present, and at least a
definitive time point needs to be determined.
Overall, the evidence strongly suggests the clinical
efficacy of CEUS for grading hepatic fibrosis. However,
further studies are needed as the number of studies is
relatively small; the definitive contrast parameter with
the optimal kind of contrast agent has not yet been
determined, and only few studies have compared the
diagnostic performance between CEUS and other imag-
ing modalities.
Computed tomography
One advantage of computed tomography (CT) imaging is
that attenuation can be displayed in Hounsfield units. CT
imaging has been primarily used in the diagnosis of focal
liver lesions rather than diffuse liver diseases. Changes in
attenuation on unenhanced CT imaging can be observed in
some diffuse liver diseases. However, quantitative assess-
ment of the density distribution of liver parenchyma
showed that only diffuse steatosis and active alcoholic
cirrhosis had significantly different mean hepatic attenua-
tion values [96]. Contrast-enhanced CT using xenon gas or
iodinated contrast agents can determine both global and
local perfusion changes within the liver with high spatial
and temporal resolutions. Normally hepatic parenchymal
enhancement is minimal during the hepatic arterial phase
(HAP), while during the portal venous phase (PVP) the
normal hepatic parenchyma enhances markedly. The cau-
ses of enhancement during HAP are mainly localized
hepatic lesions, but fibrosis or cirrhosis can also cause
changes in hepatic attenuation due to associated hemody-
namic changes [97]. Unfortunately, most contrast-en-
hanced CT studies involved patients with cirrhosis, and it is
thus unclear whether changes in hepatic enhancement
Table 10 Summary findings
from the Udell et al. study [84]Test/pooled estimates LR (?) LR (-)
Clinical impression of cirrhosis 4.8; 95 % CI 2.5–7.2
Clinical impression of no cirrhosis 0.52; 95 % CI 0.33–0.71
Lok index (AST: ALT ratio[1) 4.6; 95 % CI 2.6–6.5
Lok index (AST: ALT ratio\0.2) 0.09 (0.03–0.31)
APRI[2 4.6, 95 % CI 3.2–6.0
APRI\1 0.33 (0.23–0.43)
Bonacini index[7 9.4; 95 % CI 2.6–37
Bonacini index\3 0.30; 95 % CI 0.18–0.50
ALT alanine transaminase, AST aspartate transaminase, APRI aspartate transaminase platelet ration index,
LR likelihood ratio, CI confidence interval
16 Hepatol Int (2017) 11:1–30
123
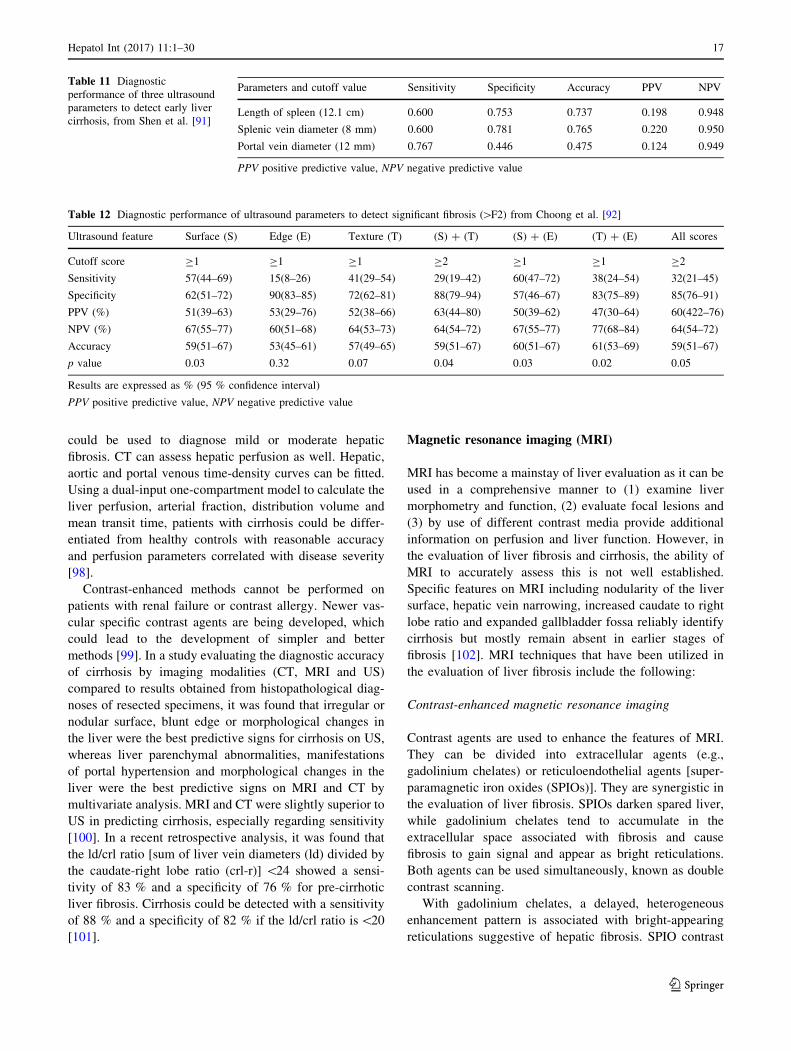
could be used to diagnose mild or moderate hepatic
fibrosis. CT can assess hepatic perfusion as well. Hepatic,
aortic and portal venous time-density curves can be fitted.
Using a dual-input one-compartment model to calculate the
liver perfusion, arterial fraction, distribution volume and
mean transit time, patients with cirrhosis could be differ-
entiated from healthy controls with reasonable accuracy
and perfusion parameters correlated with disease severity
[98].
Contrast-enhanced methods cannot be performed on
patients with renal failure or contrast allergy. Newer vas-
cular specific contrast agents are being developed, which
could lead to the development of simpler and better
methods [99]. In a study evaluating the diagnostic accuracy
of cirrhosis by imaging modalities (CT, MRI and US)
compared to results obtained from histopathological diag-
noses of resected specimens, it was found that irregular or
nodular surface, blunt edge or morphological changes in
the liver were the best predictive signs for cirrhosis on US,
whereas liver parenchymal abnormalities, manifestations
of portal hypertension and morphological changes in the
liver were the best predictive signs on MRI and CT by
multivariate analysis. MRI and CT were slightly superior to
US in predicting cirrhosis, especially regarding sensitivity
[100]. In a recent retrospective analysis, it was found that
the ld/crl ratio [sum of liver vein diameters (ld) divided by
the caudate-right lobe ratio (crl-r)] \24 showed a sensi-
tivity of 83 % and a specificity of 76 % for pre-cirrhotic
liver fibrosis. Cirrhosis could be detected with a sensitivity
of 88 % and a specificity of 82 % if the ld/crl ratio is\20
[101].
Magnetic resonance imaging (MRI)
MRI has become a mainstay of liver evaluation as it can be
used in a comprehensive manner to (1) examine liver
morphometry and function, (2) evaluate focal lesions and
(3) by use of different contrast media provide additional
information on perfusion and liver function. However, in
the evaluation of liver fibrosis and cirrhosis, the ability of
MRI to accurately assess this is not well established.
Specific features on MRI including nodularity of the liver
surface, hepatic vein narrowing, increased caudate to right
lobe ratio and expanded gallbladder fossa reliably identify
cirrhosis but mostly remain absent in earlier stages of
fibrosis [102]. MRI techniques that have been utilized in
the evaluation of liver fibrosis include the following:
Contrast-enhanced magnetic resonance imaging
Contrast agents are used to enhance the features of MRI.
They can be divided into extracellular agents (e.g.,
gadolinium chelates) or reticuloendothelial agents [super-
paramagnetic iron oxides (SPIOs)]. They are synergistic in
the evaluation of liver fibrosis. SPIOs darken spared liver,
while gadolinium chelates tend to accumulate in the
extracellular space associated with fibrosis and cause
fibrosis to gain signal and appear as bright reticulations.
Both agents can be used simultaneously, known as double
contrast scanning.
With gadolinium chelates, a delayed, heterogeneous
enhancement pattern is associated with bright-appearing
reticulations suggestive of hepatic fibrosis. SPIO contrast
Table 11 Diagnostic
performance of three ultrasound
parameters to detect early liver
cirrhosis, from Shen et al. [91]
Parameters and cutoff value Sensitivity Specificity Accuracy PPV NPV
Length of spleen (12.1 cm) 0.600 0.753 0.737 0.198 0.948
Splenic vein diameter (8 mm) 0.600 0.781 0.765 0.220 0.950
Portal vein diameter (12 mm) 0.767 0.446 0.475 0.124 0.949
PPV positive predictive value, NPV negative predictive value
Table 12 Diagnostic performance of ultrasound parameters to detect significant fibrosis ([F2) from Choong et al. [92]
Ultrasound feature Surface (S) Edge (E) Texture (T) (S) ? (T) (S) ? (E) (T) ? (E) All scores
Cutoff score C1 C1 C1 C2 C1 C1 C2
Sensitivity 57(44–69) 15(8–26) 41(29–54) 29(19–42) 60(47–72) 38(24–54) 32(21–45)
Specificity 62(51–72) 90(83–85) 72(62–81) 88(79–94) 57(46–67) 83(75–89) 85(76–91)
PPV (%) 51(39–63) 53(29–76) 52(38–66) 63(44–80) 50(39–62) 47(30–64) 60(422–76)
NPV (%) 67(55–77) 60(51–68) 64(53–73) 64(54–72) 67(55–77) 77(68–84) 64(54–72)
Accuracy 59(51–67) 53(45–61) 57(49–65) 59(51–67) 60(51–67) 61(53–69) 59(51–67)
p value 0.03 0.32 0.07 0.04 0.03 0.02 0.05
Results are expressed as % (95 % confidence interval)
PPV positive predictive value, NPV negative predictive value
Hepatol Int (2017) 11:1–30 17
123
agents lead to a reduced signal-to-noise ratio (SNR) in
cirrhosis. SPIO contrast agents create hypointensity within
the liver parenchyma based on its accumulation in reticu-
loendothelial cells and lead to accuracy of 85 % in
detecting liver fibrosis compared with histology. The
sequential administration of gadolinium followed by SPIO
contrast media yielded even greater accuracy (93 %)
overall based on double-enhanced image scores to distin-
guish between mild and advanced fibrosis [103].
There is considerable variation in MRI of liver tech-
niques, with few high-quality studies to be certain of their
utility in the diagnosis of liver fibrosis. In addition, the use
of these new contrast agents is expensive and time for
scanning prolonged with breath-hold requirements that
may not be suitable for elderly and unfit patients, making
this not an optimal choice for evaluation of liver fibrosis.
Diffusion-weighted magnetic resonance imaging
The principle of diffusion-weighted magnetic resonance
imaging (DWMRI) is that the observed signal intensity of
tissue varies inversely with the freedom of water proton
diffusion. With DWMRI, tissues with reduced water proton
diffusion will be brighter than those with normal water
proton diffusion. The sensitivity of the sequence for dif-
fusion can be varied using various parameters, and this is
known as the diffusion weighting to the ‘‘b’’ value. The
apparent diffusion coefficient (ADC) of water protons in
tissues is determined by the slope of the log intensity
versus the b value. As fibrosis increases, one expects that
the ADC will decrease as the diffusion is reduced. Con-
sequently, the ADC can be used as a quantitative measure
of the extent of fibrosis. A number of studies have exam-
ined ADC as a measure of liver fibrosis compared to liver
histology, but the best study is a high-quality meta-analysis
evaluated with quality assessment for studies of diagnostic
accuracy (QUADAS) comparing DWMRI and magnetic
resonance elastography (MRE) to liver histology [104].
The pooled estimates inform us that DWMRI has a mod-
erate accuracy, with relatively low sensitivity (below 0.8)
for detection of CF2 fibrosis and CF3 fibrosis. DWMRI is
limited in the assessment of liver fibrosis in the presence of
fat and iron because of a reduction in the signal of the liver.
Also the presence of fatty change is thought to affect dif-
fusion; therefore, DWMRI may be limited in the assess-
ment of fibrosis in NASH.
Magnetic resonance spectroscopy
Currently magnetic resonance spectroscopy (MRS) can be
performed by analyzing signals from either hydrogen (1H-
MRS) or phosphorus (31P-MRS) atoms. 1H-MRS provides
insights into metabolism, as phosphorus is associated with
molecules involved in various metabolic processes.
Although not specific for liver, anatomically the concen-
tration of highly active metabolic cells makes it ideal for31P-MRS. This technology does not measure fibrosis but
rather metabolism. Consequently, alterations in cell meta-
bolism are an indirect measurement of liver fibrosis.
In vivo MRS examining liver fibrosis has used 31P-MRS.
After a standard MR imaging for localization, special MR
pulse sequences are applied to generate spectroscopic data
within the appropriate anatomical location and volume; a
typical examination takes 45–60 min. To date, only small
studies with heterogeneous populations have been studied
[102–105]. Consequently, the role of MRS in diagnosis of
liver fibrosis/cirrhosis remains undefined.
Consensus statements
• Conventional ultrasound cannot be used for the diag-
nosis of hepatic fibrosis (B2).
• Conventional ultrasound for diagnosis of early cirrhosis
should be confirmed by additional studies (C1).
• Contrast-enhanced ultrasound with a second-generation
microbubble agent is useful for staging hepatic fibrosis
(C2).
• Conventional CT and MRI have higher specificity and
sensitivity than conventional ultrasound for the diag-
nosis of cirrhosis (A1).
Liver elastography techniques
Liver elastography is one of the non-invasive methods for
the evaluation of the severe hepatic fibrosis. Elastographic
methods of the liver can be done using US waves or MRI.
Ultrasound-based elastography
Elastographic methods using US waves for the evaluation
of liver fibrosis can be divided into:
1. Strain elastography (or quasi-static elastography):
2. Shear waves elastography (SWE):
(a) Transient elastography (TE; FibroScan)
(b) Point shear wave elastography (SWE) using acoustic
radiation force impulse (ARFI) quantification includ-
ing virtual touch quantification (VTQ) from Siemens
and ElastPQ from Philips.
(c) 2D real-time shear wave elastography—supersonic
shear imaging (SSI), the Aixplorer system and SSI,
but also more recently the systems from General
Electric and Toshiba.
18 Hepatol Int (2017) 11:1–30
123
Shear wave elastography (SWE)
SWE calculates the tissue deformation or strain induced by
a stress. The stress may be applied with a slight free hand
compression, using the transducer, or may derive from
endogenous movements, such as those generated by the
heart or very large arteries during each cardiac cycle. The
extent of the deformability of the tissue (strain) is related to
its stiffness. The elastic ratio is the ratio of strain distri-
bution in two selected regions of interest (ROIs). SWE is
divided into the following three methods:
Transient elastography (TE; FibroScan�)
TE or FibroScan� measures liver stiffness using a section
of liver that is approximately 1 cm in diameter and 5 cm
long, which is 100 times greater in size than a standard LB,
and thus may be more representative of the entire hepatic
parenchyma [106].
Multiple studies have described test characteristics of
US-based TE. At least three meta-analyses have been
published [107–109]. The most recent (which included 50
studies) estimated test characteristics by reporting the
AUROC curve [106]. The mean AUROC curves for the
diagnosis of significant fibrosis, severe fibrosis and cir-
rhosis were 0.84, 0.89 and 0.94, respectively (with a value
of 1 corresponding to a perfect test). Estimates for the
diagnosis of significant fibrosis were influenced by the type
of underlying liver disease and the cutoff level for diag-
nosing cirrhosis. The appropriate cutoff levels may vary by
the cause of the liver disease. The most consistent findings
were in patients with CHC. An earlier meta-analysis of
nine studies provided summary estimates in terms of sen-
sitivity and specificity [107]. For diagnosing cirrhosis, the
sensitivity was 87 % and the specificity was 91 %. For
diagnosing significant (F2–4) fibrosis, the sensitivity was
70 % and the specificity was 84 %.
Factors influencing LSM using FibroScan
The factors that may reduce the accuracy of US-based TE
include ascites, elevated central venous pressure (as in heart
failure) and obesity because fluid and adipose tissue attenuate
the elastic wave [110, 111]. A probe has been developed
(FibroScan XL probe) in an attempt to improve accuracy in
obese patients. Studies suggest that it is able to accurately
assess the degree of fibrosis, but that it may not be superior to
the standard M probe in obese patients [112–114]. Liver
inflammation may also reduce the accuracy of the test [115].
Other factors that may influence the test results are sex (men
have higher liver stiffness values than women), metabolic
syndrome and operator experience [116]. It is not clear whe-
ther hepatic steatosis has an effect on accuracy [117–119].
Liver stiffness values may be associated with prognosis.
In a meta-analysis of 17 studies with 7058 patients with
chronic liver disease, baseline liver stiffness was associated
with the risk of hepatic decompensation [relative risk (RR)
1.07, 95 % CI 1.03–1.11], HCC development (RR 1.11,
95 % CI 1.05–1.18) and death (RR 1.22, 95 % CI
1.05–1.43) [120]. A study of patients undergoing hepate-
ctomy for HCC [121] showed that liver stiffness[15.7 kPa
was a risk factor for postoperative liver failure (sensitivity
96 % and specificity 69 %). Also, the use of FibroScan
compared to LB has been evaluated in a meta-analysis with
8 published studies including 801 patients revealing higher
liver stiffness cutoff with the use of FibroScan [122].
Liver stiffness measurement assessed by FibroScan is a
reliable marker of severe liver fibrosis in primary scleros-
ing cholangitis (PSC). Stiffness increases significantly and
exponentially over time. Liver stiffness and its progression
rate are two major prognostic factors in PSC [123].
The limitations regarding FibroScan are related to its
cost, its infeasibility in patients with ascites, its affection by
elevated aminotransferase levels, the need for an increased
number of unreliable measurements in patients with high
BMI and its inability to distinguish patients without fibrosis
or with mild fibrosis from those with mild or moderate
fibrosis, respectively.
Acoustic radiation force impulse imaging (ARFI)
ARFI is a form of tissue elastography that is integrated into
a conventional high-end ultrasound machine (Siemens
S2000, Siemens, Erlangen, Germany) and ElastPQ from
Philips. ARFI has the advantage of being a feature existing
on an ultrasonography machine. This allows for the con-
venience of assessing for structural abnormalities, steatosis
as well as fibrosis, in a single sitting. Two meta-analyses by
the same group evaluated the performance of ARFI in
staging liver fibrosis compared to LB and revealed good
diagnostic accuracy of the ARFI imaging for the staging of
F C2 (AUROC = 87 %) and F C3 (AUROC
curve = 91 %) and excellent diagnostic accuracy for
F = 4 (AUROC curve = 93 %) [124, 125]. Another
prospective study on 70 patients with different etiologies
published in 2013 by Yap and colleagues showed that
ARFI has strong correlation with higher fibrosis scores
compared to lower, and when compared to a the above
pooled meta-analysis cutoff values, the sensitivity and
specificity for detecting true F C3 are higher than those of
F C2 [126]. ARFI elastography had a very good positive
predictive value (93.2 %) for predicting the presence of
significant fibrosis and excellent negative predictive value
(97.8 %) for excluding the presence of compensated liver
cirrhosis [127], although the accuracy was less in staging
hepatic fibrosis in patients with NAFLD as shown by
Hepatol Int (2017) 11:1–30 19
123
another meta-analysis [128]. When compared to TE, ARFI
has been shown in another two meta-analyses to have a
similar predictive value for significant fibrosis and cirrho-
sis, and both had better accuracy than real-time elastogra-
phy (RTE) in predicting cirrhosis [129, 130].
Supersonic shear imaging (SSI)
SSI is a simple, accurate, reliable, non-invasive method of
assessing liver fibrosis [131]. The mean ± SD LS as
measured by SSI in patients without known liver pathology
was found to be 6 ± 1.4, slightly higher in men, and is not
affected by BMI [132]. Many studies have shown that SSI
and TE using an XL probe accurately quantified liver
stiffness and fibrosis stage in obese chronic liver disease
patients, including those with chronic HCV infection,
compared with histologic analyses and ARFI [133–137].
However, SSI was shown to be a poor predictor of disease
activity and steatosis level [136].
A recent study has assessed the clinical use of LSM
evaluated by SSI, TE and ARFI in a cohort of NAFLD
patients who underwent LB. The AUROCs for SSI,
FibroScan and ARFI were 0.86, 0.82 and 0.77 for diag-
noses of CF2; 0.89, 0.86 and 0.84 for CF3; and 0.88, 0.87
and 0.84 for F4, respectively. SSI had a higher accuracy
than ARFI for diagnoses of significant fibrosis (CF2)
(p = 0.004) [138].
Accuracy for diagnosing F C3 and F4 was 89.6–94.7 %
and 87.7–96.0 %, respectively, in NAFLD subjects. The
negative predictive values for diagnosing F C3 and F4
were 94.2–96.6 and 100 %, respectively. Only portal
fibrosis significantly correlated with an increased hepatic
elastic ratio measured by real-time tissue elastography. The
AUROC curve of the elastic ratio correlated better than
serum fibrosis markers in both early and advanced fibrosis
stages [116]. In patients with CHC, SWE has been found to
be of better [133] or similar accuracy as TE [139]. In
another study, SSI with ARFI had higher accuracy than
FibroScan for the diagnosis of severe fibrosis (CF3;
p = 0.0016) and higher accuracy than ARFI for the diag-
nosis of significant fibrosis (CF2; p = 0.0003), but no
significant difference was observed for the diagnosis of
mild fibrosis and cirrhosis [140].
Consensus statements
• TE is an established technique and is recommended as
the initial assessment for significant liver fibrosis and
cirrhosis (A1).
• TE helps to predict complications of cirrhosis and its
prognosis (A2).
• The interpretation of results should be carefully
weighted in the presence of limiting factors (A1).
• TE is a highly reproducible and user-friendly technique
for assessing liver fibrosis in patients with CLD.
However, because TE reproducibility is significantly
reduced (p\ 0.05) in patients with steatosis, increased
BMI, lower degrees of hepatic fibrosis and narrow
intercostal spaces, caution could be warranted in the
clinical use of TE as surrogate for LB (A1).
• SSI is an accurate measure in predicting fibrosis stage
and is as accurate as TE and ARFI in this respect (B2).
Magnetic resonance elastography (MRE)
MRE provides one of the more robust methods to measure
liver stiffness. However, although it requires special soft-
ware and equipment, it can be easily implemented on
existing MR scanners with suitable alterations [141, 142].
MRE has been compared to TE [143] as well as other non-
invasive markers of fibrosis [144]. To evaluate the diag-
nostic capabilities of MRE, two high-quality meta-analyses
have been performed comparing MRE with histology as
the gold standard and had clearly defined inclusion and
exclusion criteria, both using QUADAS scoring to evaluate
quality [104, 145] (Table 13).
Wang et al. [104] examined differences based on the
following groupings using a 2 9 2 table: F0 versus F1–F4
(score G1), F0 and F1 versus F2–F4 (score G2), F0–F2
versus F3 and F4 (score G3) and F0–F3 versus F4 (score
G4). All the point estimates were over 90 % for the key
comparisons, and the AUROC was 0.98 and 0.99 for group
Table 13 Pooled estimates of diagnostic parameters for magnetic resonance elastography from Guo et al. [145]
Test/pooled estimates F1 F2 F3 F4
Sensitivity 0.87 (0.84–0.90) 0.87 (0.84–0.90) 0.87 (0.83–0.90) 0.93 (0.88–0.96)
Specificity 0.93 (0.88-0.97) 0.94 (0.91–0.97 0.92 (0.90–0.94) 0.91 (0.88–0.93)
LR (?) 7.97 (4.68–13.57) 10.83 (6.67–17.58) 10.22 (6.48–16.11) 8.85 (6.00–13.05)
LR (-) 0.16 (0.11–0.23) 0.14 (0.07–0.27) 0.15 (0.11–0.20) 0.06 (0.02–0.18)
Diagnostic OR 56.1 (28.9–108.9) 116.2 (50.4–267.7) 97.7 (50.8–187.7) 184.8 (47.4–720.4)
AUROC 0.94 0.97 0.96 0.97
OR odds ratio, LR likelihood ratio, CI confidence interval, AUROC area under the receiver-operator characteristic curve
20 Hepatol Int (2017) 11:1–30
123
2 and 4, making this test close to ideal. However, MRE
studies did have high statistical heterogeneity and publi-
cation bias ([104]; Table 14). Guo et al. [145] showed that
MRE was found to be more accurate than ARFI with a
higher combination of sensitivity, specificity, LR and
AUROC particularly in diagnosing early stages (F1–2) of
hepatic fibrosis.
MRE as a technique has some significant advantages
[141, 142]. It is generally well tolerated by patients except
those with claustrophobia. It is not affected by fatty change in
the liver, although inflammation (NASH) can affect the
readings. It is not affected by ascites or obesity or bowel
interposition between the liver and anterior abdominal wall.
Furthermore, it can evaluate the entire liver rather than a focal
region as in LB or TE. The main limitations of MRE [141]
are the cost of the procedure, the requirement for high iron
content in the liver as in the cases of hemochromatosis or
hemosiderosis, and the requirement for consistent breath-
holding by the patient. MRE incorporated into routine MRI
could provide a comprehensive evaluation of the liver,
including fatty change, presence of focal lesions and PHT.
As MRE is proving to be an accurate and reliable test,
many single etiology studies with MRE in diseases such as
hepatitis B, hepatitis C, alcoholic liver disease and NASH
have emerged [141, 146–149], and all show high perfor-
mance (accuracy [ 0.90) of MRE in the detection of
fibrosis. Large population studies are still lacking. There
were few studies comparing MRE to TE, but MRE had a
higher technical success rate than TE and a better diag-
nostic accuracy (0.994 for F[ 2; 0.985 for F[ 3; 0.998
for F[ 4) [143].
Consensus statements
• MRE is an emerging modality for accurate assessment
for hepatic fibrosis and is recommended (A1).
• MRE is at least as accurate as ARFI in predicting
hepatic fibrosis in patients with different etiologies
(B2).
Post-liver transplantation fibrosis
Risk factors of post-transplant fibrosis include metabolic
syndrome, post-transplant HCV recurrence with high viral
load, advanced donor age, donor steatosis and prolonged
warm ischemia time. What is unique for post-transplant
patients is that the metabolic syndrome and its components
are prevalent after liver transplantation compared to the
non-transplant population. In this respect, factors related to
the graft (donor’s steatosis and warm ischemia time) and
factors related to the type of immunosuppressive drugs
(steroids and CNI) have been studied. Evidence supports
the role of graft steatosis and older donor’s age as impor-
tant for post-transplant fibrosis progression regardless of
the etiology of transplantation [150, 151], while no clear
large-scale studies supported the role of one immunosup-
pressive over another.
Assessment of fibrosis progression after liver
transplantation
Assessment of graft fibrosis and its progression are
important for graft and patient survival. The rate of pro-
gression will define the need for modifying the type and
dose of immunosuppressive drugs and also the need for
aggressive treatment of factors related to the metabolic
syndrome and/or starting antiviral treatment. Because
many factors (such as rejection and infection) can affect the
post-transplant laboratory tests, evidence did not support
the use of such tests in assessing fibrosis progression in
post-transplant situations. The validity of TE post-trans-
plant is not yet clearly established. This is because the
accuracy of TE readings is significantly reduced in the
context of high transaminase levels, which are common in
post-transplant patients because of associated pathologies
such as acute cellular rejection (ACR), biliary obstruction
or infection. Furthermore, graft steatosis and obesity are
both common post-liver transplantation, and these factors
also affect the accuracy of TE readings [111, 152].
Therefore, further validation of TE in diagnosis of post-
Table 14 Pooled estimates of
diagnostic parameters for
magnetic resonance
elastography (MRE) from Wang
et al. [104]
Test/pooled estimates F0 and F1 versus F2–F4 F0–F3 versus F4
Sensitivity 0.94 (0.808–0.983) 0.985 (0.795–0.999)
Specificity 0.953 (0.872–0.984) 0.939 (0.869–0.972)
LR (?) 20 (7–57) 16 (7–36)
LR (-) 0.06 (0.02–0.22) 0.02 (0.00–0.26)
Diagnostic OR 317 (55–1796) 1006 (36–26,068)
AUROC 0.98 (0.97–0.99) 0.99 (0.97–0.99)
F1–F4 according to the METAVIR score
OR odds ratio, LR likelihood ratio, CI confidence interval, AUROC area under the receiver-operator
characteristic curve
Hepatol Int (2017) 11:1–30 21
123
transplant fibrosis is needed. LB remains the gold standard
in assessment of post-transplant fibrosis and its progres-
sion. The issue is not only to biopsy or not, but also the
time of biopsy and the findings needed to define the rate of
fibrosis progression. Scheduled (protocol) LBs tailored
according to the presence or absence of one or more of the
risk factors are the most accepted modality by many studies
[11, 153].
How best to determine rapid fibrosis progression (RFP)
remains a key area of debate. Progression changes in the
fibrosis stage on consecutive annual biopsies represent
clinically significant fibrosis progression and indicate the
need for intervention [153].
Consensus statements
• LB is the ‘gold standard’ for diagnosis and follow-up of
post-transplant fibrosis. Protocol LB is of utmost
importance in the post-transplant care of these patients
(A1).
• Significant fibrosis progression is defined as the occur-
rence of progression on consecutive annual LBs or the
presence of portal hypertension (A1).
• Significant fibrosis or portal hypertension 1 year after
transplantation predicts rapid progression and graft loss
and indicates urgent intervention (B1).
• Transient elastography for replacing biopsy in the
assessment and diagnosis of post-liver transplantation
fibrosis progression still needs validation through large-
scale clinical studies (C2).
Cost-effectiveness of non-invasive markersfor liver fibrosis
Cost-effectiveness studies comparing methods used
for detecting and grading liver fibrosis
As reported from many studies, non-invasive tests used in
the diagnosis of liver fibrosis are still expensive in many
countries. A decision analytic model was developed in a
hypothetical patient population with CHC genotype 1 to
assess the clinical and economic outcomes of non-invasive
testing strategies in the diagnosis of significant liver
fibrosis compared to LB [154]. The authors of this study
included a testing algorithm using the FibroSure test, a
non-invasive measure of fibrosis, followed by LB for
patients with indeterminate results, FibroSpect II and
FibroScan. From this study, in comparison with LB alone,
there was a cost savings of *$770/person with the
Fibrosure testing algorithm, but a net decrease in accuracy
of 14 %. FibroSpect II and Fibroscan had poorer accuracy
(decreases of 12 and 4 %, respectively) and lower costs
(-$138 and -$357, respectively) compared to the Fibro-
Sure algorithm. In Canada, it was reported that the average
costs for LB, FibroTest (FT) and FibroScan were $1255,
$350 and $131 (US$), respectively [155]. The authors of
this study suggested that, compared to LB, non-invasive
testing algorithms can result in short-term cost savings, but
the consequences of misdiagnosis in terms of health out-
comes and treatment costs may outweigh the short-term
gains in cost and convenience.
The total costs associated with the FT were compared to
LB in patients with CHC [156]. The authors found that the
FT alone strategy for men and women was US $193,979
and US $213,525, respectively. The total costs associated
with the LB alone strategy for men and women were US
$195,169 and US $214,760, respectively. The authors of
this study concluded that in clinical settings where testing
is required prior to treatment, FT alone is more effective
and less costly than LB although the actual cost savings
appear minimal and may have less value because of the
decreased accuracy of FT [146]. The cost-effectiveness of
TE performed annually was found to be better than LB
performed every 7 years in the evaluation of liver fibrosis
in patients with HIV/HCV coinfection [157].
Stevenson et al. [158] have conducted a systematic
review and an economic evaluation of the diagnostic
accuracy, cost-effectiveness and effect on patient outcomes
of four non-invasive tests for liver fibrosis in patients with
suspected alcohol-related liver disease. These tests include
the ELF, FibroTest, FibroMAX and TE. The authors con-
cluded that no conclusive result could be provided on the
most cost-effective strategy until further data are available
[158]. Canavan et al. [159] used a Markov decision ana-
lytic model to simulate a hypothetical cohort of 10,000
patients with chronic HCV initially without fibrosis over
their lifetime and reported the cost-effectiveness of annual
surveillance for cirrhosis in patients with chronic HCV.
The authors reported that an annual definitive FibroScan is
the optimal strategy to diagnose cirrhosis. The study also
showed that annual FibroScan surveillance of 132 patients’
results in the diagnosis of one additional HCC case over a
lifetime. The incremental cost-effectiveness ratio for an
annual definitive FibroScan is £6,557.06/quality-adjusted
life years gained. The authors of this study concluded that
an annual definitive FibroScan may be a cost-effective
surveillance strategy to identify cirrhosis in patients with
chronic HCV, thereby allowing access of these patients to
HCC screening.
From the above-mentioned studies and others, we can
suggest that non-invasive tests seem to be more cost-ef-
fective in the assessment of liver fibrosis in patients with
CHC compared to LB. However, there are several limita-
tions of these studies that should be considered. To avoid
22 Hepatol Int (2017) 11:1–30
123
the reported limitations of the studies, more research on the
cost-effectiveness of non-invasive tests compared to LB in
different areas and settings is needed. In addition, the costs
in most studies are derived from US or European countries,
and the cost-effectiveness may vary largely according to
the cost from individual countries. This needs to be
remembered when interpreting the cost-effectiveness of
invasive and non-invasive tests in other parts of the world.
However, according to the WHO guidelines, APRI is the
most cost-effective non-invasive test to assess hepatic
fibrosis compared to FT and TE.
Consensus statements
• There are many limitations to the economic studies that
assessed the cost-effectiveness of non-invasive tests in
evaluation of liver fibrosis (A1).
• So far, non-invasive tests are more cost-effective in the
assessment of liver fibrosis compared to LB (B2).
• Compared to LB, FibroTest and TE are more cost-
effective (A2).
• In low economic countries, APRI is the most cost-
effective non-invasive test compared to FT and TE
(A2).
• Studies on cost-effectiveness of non-invasive tests
versus LB in different areas and settings are needed
for policy decision makers (A1).
Hepatic venous pressure gradient (hvpg)measurement for assessment of liver fibrosis
HVPG methodology and technique
Hepatic vein catheterization, with measurements of the
HVPG, is the preferred technique to estimate portal pres-
sure and is rapidly becoming a routine test in many hos-
pitals worldwide. It is an indirect method of assessing the
portal pressure gradient in cirrhosis with a predominantly
sinusoidal and/or post-sinusoidal site of resistance. It is
well documented that HVPG measurement correlates well
with direct portal pressure measurement, and the agreement
is sufficiently good to use it as a surrogate measurement.
The normal value of the HVPG is between 1 and 4 mmHg.
HVPG reflects the severity of PHT, with C6 mmHg
defining PHT. Clinically significant PHT is defined by
HVPG at and[10 mmHg, as the development of ascites,
varices and variceal bleeding usually occurs above this
threshold [160].
Several studies have compared WHVP with portal
venous pressure (PVP) in patients with cirrhosis but with
relatively small cohorts and using different techniques for
assessing PVP. Some of these studies found a moderate
degree of correlation between the two measurements,
especially in patients with alcoholic cirrhosis [161–163]
and HCV cirrhosis [164]. Other studies reported the lack of
significant correlation between the two techniques, espe-
cially in patients with non-alcoholic cirrhosis [165, 166].
Reproducibility in measuring WHVP per se has been
questioned by Keiding et al. [167]. In this study, 61 % of
the HVPG measurements in two separate hepatic veins
differed by as much as 4–34 mmHg. Assessment of the
agreement between WHVP and PVP in cirrhotic patients
done by Thalheimer et al. revealed that WHVP measure-
ment correlates well with direct portal pressure measure-
ment, and the agreement is sufficiently good to use this as a
surrogate measurement [168]. Assessment by Thalheimer
et al. showed that the range of difference between WHVP
and PVP was from -8 to 9 mmHg (mean
-0.4 ± 2.67 mmHg, median 0 mmHg), and the coefficient
of determination (r2) was 0.93 [166]. The agreement of
WHVP with PVP in patients with non-alcoholic liver dis-
ease is also well documented in several studies. Assess-
ment by Thalheimer et al. showed that the range of
difference between WHVP and PVP was from -10.5 to
10 mmHg (mean -0.39 ± 3.29 mm Hg, median
0 mmHg), and the coefficient of determination (r2) was
0.83 [169].
Complications of HVPG measurement
Only minor complications such as transient cardiac arrhyth-
mias, local pain or vagal reaction have been reported, and
these occur infrequently (\1 % of patients). HVPG mea-
surements can be performed in 10 min with TJLB through the
same route. Despite its advantages such as safety, feasibility
and reproducibility, the technique is invasive. The HVPG
procedure shows low acceptance rates among patients with
chronic liver disease and requires the technical expertise
typically found at tertiary care centers [170].
HVPG and liver fibrosis
HVPG measurement can be used in the diagnosis of liver
fibrosis, risk stratification, identification of patients with
HCC who are candidates for liver resection, monitoring of
the efficacy of treatment and assessment of progression of
PHT. It has been proposed that serial HVPG measurements
could assess fibrosis or cirrhosis irrespective of etiology. In
the diagnosis of stage 1 compensated cirrhosis, the sensi-
tivity and specificity of HVPG for predicting stage 1
compensated cirrhosis were 78 and 81 % in 6 mmHg of
HVPG, respectively [171].
A positive correlation between the HVPG and fibrosis
score has also been reported among chronically HBV
Hepatol Int (2017) 11:1–30 23
123
infected patients [172]. HVPG predicted clinical decom-
pensation in patients with compensated cirrhosis. Patients
with HVPG\10 mmHg have a 90 % probability of not
developing clinical decompensation in a median follow-up
of 4 years [160]. HVPG (AUROC 0.85; sensitivity: 80 %;
specificity: 77 %) was superior to serologic biomarkers in
predicting advanced fibrosis in chronic viral hepatitis
[173]. In post-liver transplant patients, liver stiffness
measurement (LSM) correlated with HVPG measurements,
and the correlation between LSM and HVPG was excellent
in patients with HVPG values\10–12 mmHg [174]. The
AUROC curve for predicting HVPG 10-12 mmHg ranges
from 0.76 to 0.99 with a cutoff of 13.6–34.9 kPa
[174, 175]. The correlation between portal pressure and
LSM decreases when HVPG values exceed 10-12 mmHg.
HVPG[6 mmHg and HVPG[10 mmHg were predicted
by 8.7 and 21 kPa cutoffs, respectively, among post-LTx
patients with HCV recurrence [176].
Consensus statements
• HVPG should be recommended for the screening of all
cirrhotic patients and assessing the response to therapy
(A2).
• HVPG correlates with the histological stage of fibrosis,
but not beyond HVPG above 10–12 mmHg (A1).
• HVPG correlates with liver stiffness (B2).
• HVPG correlates with post-transplant hepatic fibrosis
(B2).
Assessing hepatic fibrosis in rare cases
There are rare conditions that lead to hepatic fibrosis and
PHT with subsequent variceal bleeding. These include
cystic fibrosis (CF), schistosomiasis, congenital hepatic
fibrosis, etc. Markers of hepatic fibrosis have not been well
utilized in such conditions apart from cases of CF.
Cystic fibrosis
Liver disease is the third leading cause of mortality in
patients with CF and can result in progressive liver failure
and portal hypertension (PHT) in about 30 % of patients.
However, detection of CF-associated liver disease (CFLD)
is challenging. Many studies have been done in the recent
years to assess the role of different non-invasive markers in
assessing liver fibrosis and PHT in patients with CF
[177–182]. A recent study by Sadler et al. showed that the
AUROC curves for FS, APRI and FT for the detection of
CFLD were 0.78 (95 % CI 0.65–0.92), 0.72 (95 % CI
0.56–0.87) and 0.76 (95 % CI 0.62–0.90; p not significant).
At a threshold of [5.2 kPa, the sensitivity, specificity,
positive and negative predictive values of LSM according
to FS for detecting CFLD were 67, 83, 40 and 94 %,
respectively [177]. Also, LSM was the only variable
associated with CFLD (OR 2.74, 95 % CI 1.53–4.89;
p = 0.001) in a study by Kitson et al. [179]. The AUROC
for LSM predicting CFLD was 0.87 (95 % CI 0.77–0.98),
and LSM C6.8 kPa predicted CFLD with 76.0 % sensi-
tivity and 92.0 % specificity. Median LSM was higher in
those with PHT [15.7 kPa (IQR 9.2–17.2) versus 5.4 kPa
(IQR 4.3–6.8); p\ 0.001]. The AUROC curve for LSM
predicting the presence of PHT was 0.96 (95 % CI
0.92–1.00). LSM C6.8 kPa is highly suggestive of CFLD,
and LSM\8.9 kPa reliably excludes PHT [178]. This
indicates that LSM is an accurate and reliable non-invasive
tool in assessing CFLD and PHT. A study by Karlas et al.
[179, 180] utilized the use of TE and ARFI in differenti-
ating between cases of CF with and without cirrhosis
(n = 50) and compared them with a control group with
alcoholic cirrhosis. Their finding showed that patients with
CFLD with liver cirrhosis differed significantly from other
CFLD patients (ARFI: 1.49 versus 1.13 m/s; p = 0.031;
TE 7.95 versus 4.16 kPa; p = 0.020) and had significantly
lower results than individuals with alcoholic liver cirrhosis
(ARFI 1.49 versus 2.99 m/s; p = 0.002). Pediatric patients
(n = 12) with CF-related PHT and esophageal varices
(EV) had higher FibroScan values than those without
varices with median values of 22.4 kPa (14.4–30.4 kPa)
versus 7.9 kPa (4.4–13.7 kPa; p = 0.01). Using a threshold
of 12 kPa, four of six patients without EV would not have
needed endoscopy [181]. Furthermore, TIMP-1 had a high
diagnostic accuracy for CFLD in adults. The diagnostic
sensitivities were increased when TE and the respective
biomarkers were combined for the detection of CFLD and
EV [182].
Schistosomal hepatic periportal fibrosis (SH-PPF)
Schistosoma infection is a frequent cause of PHT and EV
in Middle Eastern countries, Africa, South America and the
Far East. In a study by Wu et al. performed in 55 patients
with advanced Schistosomiasis japonica, utilizing LB as a
gold-standard, HA and INR were reliable markers for dif-
ferentiating significant liver fibrosis in patients with
advanced Schistosomiasis japonica. The authors concluded
that this new simple index can easily predict significant
SHF with a high degree of accuracy [183]. The platelet
count/spleen diameter ratio has been found useful in pre-
dicting the presence of EV in patients with advanced
hepatosplenic schistosomiasis in upper endoscopy [184].
LSM using FibroScan and reference needle-LB was done
in 229 patients with CHC; 29 % of them had positive
serology for schistosomiasis [185]. In this subgroup, the
24 Hepatol Int (2017) 11:1–30
123
sensitivity of FibroScan in detecting fibrosis stages 2–3 was
found to be impaired. However, multivariate logistic
regression showed that fibrosis stages (F0–F1 and F4) were
the most independent factors that were associated with the
agreement between FibroScan and LB (OR 3.4, 7.12 and
p\ 0.001, p\ 0.001, respectively) [185]. The only study
that assessed the role of non-invasive markers and TE in
the detection of SH-PPF in patients with pure schistoso-
miasis (n = 30; 28 of them had splenomegaly and 25 had
EV) showed that the mean ± SD LSM was 9.4 ± 5.5 Kpa
(range 3.5–30 Kpa). By TE, F0–F2 was detected in 22
(73.3 %) cases, and F3–4 was detected in the remaining 8
(26.7 %). In addition, EV and splenomegaly were detected
in 18/25 (81.8 %) and 19/27 (86.4 %) patients with non-
advanced fibrosis and in 7 (87.5 %) and 8 (100 %) patients
with advanced fibrosis, respectively (p = 0.71 and
p = 0.27, respectively) [186]. TE is not useful in the
diagnosis of SH-PPF and EV in patients with pure schis-
tosomiasis. However, these findings need to be confirmed
in a larger group of patients. Interestingly, Shiha and Zalata
have previously shown that the presence of schistosomiasis
does not interfere with the application of the Knodell score
in patients with CHC [187].
Consensus statements
• Elastography should be recommended for all CFLDs
to assess the stage of fibrosis to differentiate between
those with CFLD with and without cirrhosis, to fol-
low its progression and to predict the presence of EV
(A1).
• Larger studies are needed to assess for the role of
various non-invasive tools in assessing periportal
fibrosis in pure cases of schistosomiasis (B1).
• Studying the mechanism(s) underlying the failure of
FibroScan to assess fibrosis in cases with pre-hepatic
portal hypertension is (are) warranted (A1).
Future prospects
LB still remains the gold standard for quantifying liver
fibrosis. Quantitation of fibrosis by LB remains an inexact
science, even with technologies such as morphometric
analysis. LB could soon shift from routine light microscopy
to digital image analysis by virtual microscopy and incor-
poration of numerical measurements in conjunction with
integrated analysis of cell functions at the DNA, RNA,
protein and signaling level.
FibroScan and the currently available serologic tests can
make the differentiation between early and advanced dis-
ease, which means that they could be used to guide
treatment decisions. However, in the future we need proven
applicable methods, which are able to monitor the dynamic
nature of fibrosis progression and regression. This will
require serum markers that are sufficiently sensitive to
measure small changes in the state of the ECM. Unfortu-
nately, none of the current non-invasive methods have this
degree of sensitivity. It is also important to investigate the
prognostic value of non-invasive methods of fibrosis
detection.
Continued progress can be anticipated in unraveling the
molecular regulation of fibrosis and its treatment. Rapid
advances in gene therapy, tissue-specific targeting and
high-throughput small molecule screening of cytokine
inhibitors are likely to benefit the diagnosis of hepatic
fibrosis.
New insights into the regulation of growth, apoptosis
and intracellular signaling by cytokines, adipokines and
hormones could have direct implications for stellate cell
behavior in liver injury. Accelerating progress is certain
once methods of non-invasive diagnosis are established
that enable rapid assessment of fibrosis in clinical trials,
and ultimately in clinical practice
References
1. Shiha G, Sarin SK, Ibrahim AE, Omata M, Kumar A, Lesmana
LA, et al. Liver fibrosis: consensus recommendations of the
Asian Pacific Association for the Study of the Liver (APASL).
Hepatol Int 2009;3:323–333
2. Guyatt GH, Oxman AD, Vist GE, Kunz R, Falck-Ytter Y,
Alonso-Coello P, et al. GRADE: an emerging consensus on
rating quality of evidence and strength of recommendations.
BMJ 2008;336:924–926
3. Schunemann HJ, Oxman AD, Brozek J, Glasziou P, Jaeschke R,
Vist GE, et al. Grading quality of evidence and strength of
recommendations for diagnostic tests and strategies. BMJ
2008;336:1106–1110
4. Mulherin SA, Miller WC. Spectrum bias or spectrum effect?
Subgroup variation in diagnostic test evaluation. Ann Intern
Med 2002;137:598–602
5. Poynard T, Ngo Y, Perazzo H, Munteanu M, Lebray P, Mous-
salli J, et al. Prognostic value of liver fibrosis biomarkers: a
meta-analysis. Gastroenterol Hepatol (NY) 2011;7:445–454
6. Guha IN, Rosenberg WM. Noninvasive assessment of liver
fibrosis: serum markers, imaging, and other modalities. Clin
Liver Dis 2008;12:883–900.
7. Goehring C, Goehring C1, Perrier A, Morabia A. Spectrum bias:
a quantitative and graphical analysis of the variability of medical
diagnostic test performance. Stat Med 2004;23:125–135
8. Poynard T, Halfon P, Castera L, Munteanu M, Imbert-Bismut F,
Ratziu V, et al. Standardization of ROC curve areas for diag-
nostic evaluation of liver fibrosis markers based on prevalences
of fibrosis stages. Clin chem 2007;53:1615–1622
9. Menghini G. One-second needle biopsy of the liver. Gastroen-
terology 1958;35:190–199
10. Grigorescu M. Noninvasive biochemical markers of liver
fibrosis. J Gastrointestin Liver Dis 2006;15:149–159
Hepatol Int (2017) 11:1–30 25
123
11. Scott DA, Netchvolodoff CV, Bacon BR. Delayed subcapsular
hematoma after percutaneous liver biopsy is a manifestation of
warfarin toxicity. Am J Gastroenterol 1991;86:503–505
12. Rockey DC, Caldwell SH, Goodman ZD, Nelson RC, Smith
AD, American Association for the Study of Liver Diseases.
Liver biopsy. Hepatology 2009;49:1017–1044
13. Judmaier G, Prior C, Klimpfinger M, Bernklau E, Vogel W,
Dietze O, et al. Is percutaneous liver biopsy using the ‘Tru-Cut’
‘(Travenol) needle superior to Menghini puncture? Z Gastroen-
terol 1989;27:657–661
14. Colombo M, Del Ninno E, de Franchis R, De Fazio C, Festor-
azzi S, Ronchi G, et al. Ultrasound assisted percutaneous liver
biopsy: superiority of the Tru-Cut over the Menghini needle for
diagnosis of cirrhosis. Gastroenterology 1988;95:487–489
15. Lindor KD, Bru C, Jorgensen RA, Rakela J, Bordas JM, Gross
JB, et al. The role of ultrasonography and automatic-needle
biopsy in outpatient percutaneous liver biopsy. Hepatology
1996;23:1079–1083
16. McGill DB, Rakela J, Zinsmeister AR, Ott BJ. A 21-year
experience with major hemorrhage after percutaneous liver
biopsy. Gastroenterology 1990;99:1396–1400
17. Piccinino F, Sagnelli E, Pasquale G, Giusti G. Complications
following percutaneous liver biopsy. A oumadiner retrospective
study on 68,276 biopsies. J Hepatol 1986;2:165–173
18. Tobin MV, Gilmore IT. Plugged liver biopsy in patients with
impaired coagulation. Dig Dis Sci 1989;34:13–15
19. Bialecki ES, Ezenekwe AM, Brunt EM, Collins BT, Ponder TB,
Bieneman BK, et al. Comparison of liver biopsy and noninva-
sive methods for diagnosis of hepatocellular carcinoma. Clin
Gastroenterol Hepatol 2006;4:361–368
20. Tung WC, Huang YJ, Leung SW, Kuo FY, Tung HD, Wang JH,
et al. Incidence of needle tract seeding and responses of soft
tissue metastasis by hepatocellular carcinoma post-radiotherapy.
Liver Int 2007;27:192–200
21. Khuroo MS, Wani NA, Javid G, Khan BA, Yattoo GN, Shah
AH, et al. Percutaneous drainage compared with surgery for
hepatic hydatid cysts. N Engl J Med 1997;337:881–887
22. Ewe K. Bleeding after liver biopsy does not correlate with
indices of peripheral coagulation. Dig Dis Sci 1981;26:388–393
23. Trotter JF, Olson J, Lefkowitz J, Smith AD, Arjal R, Kenison J.
Changes in international normalised ratio (INR) and model for
end-stage liver disease (MELD) based on selection of clinical
laboratory. Am J Transpl 2007;7:1624–1628
24. Caldwell SH, Hoffman M, Lisman T, Macik BG, Northup PG,
Reddy KR, et al. Coagulation disorders and hemostasis in liver
disease: pathophysiology and critical assessment of current
management. Hepatology 2006;44:1039–1046
25. Abdel-Wahab OI, Healy B, Dzik WH. Effect of fresh-frozen
plasma transfusion on prothrombin time and bleeding in patients
with mild coagulation abnormalities. Transfusion
2006;46:1279–1285
26. Tripodi A, Chantarangkul V, Primignani M, Fabris F, Dell’Era
A, Sei C, et al. The international normalised ratio calibrated for
cirrhosis [INR- (liver)] normalizes prothrombin time results for
model for end-stage liver disease calculation. Hepatology
2007;46:520–527
27. Saxena P, Bihari C, Rastogi A, Agarwal S, Anand L, Sarin SK.
Sonoclot signature analysis in patients with liver disease and its
correlation with conventional coagulation studies. Adv Hematol
2013;2013:237351
28. Kim ES. Lusutrombopag: first global approval. Drugs
2016;76:155–158
29. van Leeuwen DJ, Wilson L, Crowe DR. Liver biopsy in the mid-
1990s: questions and answers. Semin Liver Dis
1995;15:340–359
30. Janes CH, Lindor KD. Outcome of patients hospitalized for
complications after outpatient liver biopsy. Ann Intern Med
1993;118:96–98
31. Van Thiel DH, Gavaler JS, Wright H, Tzakis A. Liver biopsy.
Its safety and complications as seen at a liver transplant center.
Transplantation 1993;55:1087–1090
32. Kalambokis G, Manousou P, Vibhakorn S, Marelli L, Cholon-
gitas E, Senzolo M, et al. Transjugular liver biopsy: indications,
adequacy, quality of specimens, and complications: a systematic
review. J Hepatol 2007;47:284–294
33. Miraglia R, Luca A, Gruttadauria S, Minervini MI, Vizzini G,
Arcadipane A, et al. Contribution of transjugular liver biopsy in
patients with the clinical presentation of acute liver failure.
Cardiovasc Intervent Radiol 2006;29:1008–1010
34. Azoulay D, Raccuia JS, Roche B, Reynes M, Bismuth H. The
value of early transjugular liver biopsy after liver transplanta-
tion. Transplantation 1996;61:406–409
35. Behrens G, Ferral H. Transjugular liver biopsy. Semin Intervent
Radiol 2012;29:111–117
36. Beckmann MG, Bahr MJ, Hadem J, Bredt M, Wedemeyer H,
Schneider AS, et al. Clinical relevance of transjugular liver
biopsy in comparison with Percutaneous and laparoscopic liver
biopsy. Gastroenterol Res Pract 2009;94701428
37. Ble M, Procopet B, Miquel R, Hernandez-Gea V, Garcıa-Pagan
JC. Transjugular liver biopsy. Clin Liver Dis 2014;18:767–778
38. Li FQ, Ko GY, Sung KB, Gwon DI, Ko HK, Kim JW, et al.
Transfemoral liver biopsy using a Quick-Core biopsy needle
system in living donor liver transplantation recipients. Liver
Transpl 2014;20:1178–1184
39. Clark TW, McCann JW, Salsamendi J, Dowd MF, Hajdu CH.
Optimizing needle direction during transjugular liver biopsy
provides superior biopsy specimens. Cardiovasc Intervent
Radiol 2014;37:1540–1545
40. Denzer U, Arnoldy A, Kanzler S, Galle PR, Dienes HP, Lohse
AW. Prospective randomized comparison of mini-laparoscopy
and Percutaneous liver biopsy: diagnosis of cirrhosis and com-
plications. J Clin Gastroenterol 2007;41:103–110
41. Steele K, Schweitzer MA, Lyn-Sue J, Kantsevoy SV. Flexible
transgastric peritoneoscopy and liver biopsy: a feasibility study
in human beings (with videos). Gastrointest Endosc
2008;68:61–66
42. The Royal College of Pathologists. Tissue pathways for liver
biopsies for the investigation of medical disease and for focal
lesions. The Royal College of Pathologists, 2008
43. Bedossa P. Sampling variability of liver fibrosis in chronichepatitis C. Hepatology 2003;38:1449–1457
44. Colloredo G1, Guido M, Sonzogni A, Leandro G. Impact of
liver biopsy size on histological evaluation of chronic viral
hepatitis: the smaller the sample, the milder the disease.
J Hepatol 2003;39:239–244
45. Cholongitas E, Senzolo M, Standish R, Marelli L, Quaglia A,
Patch D, et al. A systematic review of the quality of liver biopsy
specimens. Am J Clin Pathol 2006;125:710–721
46. Cholongitas E, Quaglia A, Samonakis D, Senzolo M, Triantos
C, Patch D, et al. Transjugular liver biopsy: how good is it for
accurate histological interpretation? Gut 2006;55:1789–1794
47. Riley TR 3rd, Ruggiero FM. The effect of processing on liver
biopsy core size. Dig Dis Sci 2008;53:2775–2777
48. Bull HJ, Gilmore IT, Bradley RD, Marigold JH, Thompson RP.
Experience with transjugular liver biopsy. Gut
1983;24:1057–1060
49. Hall AR, Tsochatzis E, Morris R, Burroughs AK, Dhillon AP.
Sample size requirement for digital image analysis of collagen
proportionate area in cirrhotic livers. Histopathology
2013;62:421–430
26 Hepatol Int (2017) 11:1–30
123
50. Scheuer PJ. Liver biopsy size matters in chronic hepatitis: bigger
is better. Hepatology 2003;38:1356–1358
51. Guido M, Mangia A, Faa G; Gruppo Italiano Patologi Apparato
Digerente (GIPAD); Societa Italiana di Anatomia Patologica e
Citopatologia Diagnostica/International Academy of Pathology,
Italian division (SIAPEC/IAP). Chronic viral hepatitis: the his-
tology report. Dig Liver Dis 2011;43(Suppl 4):S331–S343
52. De Groote J, Desmet VJ, Gedigk P, Korb G, Popper H, Poulsen
H, et al. A classification of chronic hepatitis. Lancet
1968;2:626–628
53. Knodell RG, Ishak KG, Black WC, Chen TS, Craig R,
Kaplowitz N, et al. Formulation and application of a numerical
scoring system for assessing histological activity in asymp-
tomatic chronic active hepatitis. Hepatology 1981;1:431–435
54. Ishak K, Baptista A, Bianchi L, Callea F, De Groote J, Gudat F,
et al. Histological grading and staging of chronic hepatitis.
J Hepatol 1995;22:696–699
55. Bedossa P, Poynard T. An algorithm for the grading of activity
in chronic hepatitis C. The METAVIR Cooperative Study
Group. Hepatology 1996;24:289–293
56. Standish RA, Cholongitas E, Dhillon A, Burroughs AK, Dhillon
AP. An appraisal of the histopathological assessment of liver
fibrosis. Gut 2006;55: 569–578
57. Rousselet MC, Michalak S, Dupre F, Croue A, Bedossa P, Saint-
Andre JP, et al. Sources of variability in histological scoring of
chronic viral hepatitis. Hepatology 2005;41:257–264
58. Gailhouste L, Le Grand Y, Odin C, Guyader D, Turlin B, Ezan
F, et al. Fibrillar collagen scoring by second harmonic micro-
scopy: a new tool in the assessment of liver fibrosis. J Hepatol
2010;52:398–406
59. Goodman ZD, Stoddard AM, Bonkovsky HL, Fontana RJ,
Ghany MG, Morgan TR, et al. Fibrosis progression in chronic
hepatitis C: morphometric image analysis in the HALT-C trial.
Hepatology 2009;50:1738–1749
60. O’Brien MJ1, Keating NM, Elderiny S, Cerda S, Keaveny AP,
Afdhal NH, et al. An assessment of digital image analysis to
measure fibrosis in liver biopsy specimens of patients with
chronic hepatitis C. Am J Clin Pathol 2000;114:712–718
61. Maduli E, Andorno S, Rigamonti C, Capelli F, Morelli S,
Colombi S, et al. Evaluation of liver fibrosis in chronic hepatitis
C with a computer-assisted morphometric method. Ann Ital Med
Int 2002;17:242–247
62. Pilette C, Rousselet MC, Bedossa P, Chappard D, Oberti F,
Rifflet H, et al. Histopathological evaluation of liver fibrosis:
quantitative image analysis vs semi-quantitative scores. J Hepa-
tol 1998;28:439–446
63. Xu S, Wang Y, Tai DC, Wang S, Cheng CL, Peng Q, et al.
qFibrosis: a fully-quantitative innovative method incorporating
histological features to facilitate accurate fibrosis scoring in
animal model and chronic hepatitis B patients. J Hepatol
2014;61:260–269
64. Isse K, Grama K, Abbott IM, Lesniak A, Lunz JG, Lee WM,
et al. Adding value to liver (and allograft) biopsy evaluation
using a combination of multiplex quantum dot immunostaining,
high-resolution whole-slide digital imaging, and automated
image analysis. Clin Liver Dis 2010;14:669–685
65. Molleken C, Molleken C, Sitek B, Henkel C, Poschmann G,
Sipos B, et al. Detection of novel biomarkers of liver cirrhosis
by proteomic analysis. Hepatology 2009;49:1257–1266
66. Werling K, Szentirmay Z, Szepesi A, Schaff Z, Szalay F, Szabo
Z, et al. Hepatocyte proliferation and cell cycle phase fractions
in chronic viral hepatitis C by image analysis method. Eur J
Gastroenterol Hepatol 2010;13:489–493
67. Shiha GE, Zalata KR, Abdalla AF, Mohamed MK. Immuno-
histochemical identification of HCV target antigen in paraffin-
embedded liver tissue: reproducibility and staining patterns.
Liver Int 2005;25:254–260
68. Khalid SS, Hamid S, Siddiqui AA, Qureshi A, Qureshi N. Gene
profiling of early and advanced liver disease in chronic hepatitis
C patients. Hepatol Int 2011;5:782–788
69. Furuta K, Sato S, Yamauchi T, Ozawa T, Harada M, Kakumu S.
Intrahepatic gene expression profiles in chronic hepatitis B and
autoimmune liver disease. J Gastroenterol 2008;43:866–874
70. Mas V1, Maluf D, Archer KJ, Potter A, Suh J, Gehrau R, et al.
Transcriptome at the time of hepatitis C virus recurrence may
predict the severity of fibrosis progression after liver trans-
plantation. Liver Transpl 2011;17:824–835
71. Tripodo C, Petta S, Guarnotta C, Pipitone R, Cabibi D, Colombo
MP, et al. Liver follicular helper T-cells predict the achievement
of virological response following interferon-based treatment in
HCV-infected patients. Antivir Ther 2012;17:111–118
72. Xu R, Zhang Z, Wang FS. Liver fibrosis: mechanisms of
immune-mediated liver injury. Cell Mol Immunol
2012;9:296–301
73. Rojkind, Giambrone MA, Biempica L. Collagen types in normal
and cirrhotic liver. Gastroenterology 1979;76:710–719
74. Gressner AM, Krull N, Bachem MG. Bachem, Regulation of
proteoglycan expression in fibrotic liver and cultured fat storing
cells. Pathol Res Pract 1994;190:864–882
75. Arthur MJ. Fibrogenesis II. Metalloproteinases and their inhi-
bitors in liver fibrosis, Am J Physiol Gastrointest Liver Physiol
2000;279:G245–G249
76. Gressner OA, Weiskirchen R, Gressner AM. Biomarkers of liver
fibrosis: clinical translation of molecular pathogenesis or based
on liver-dependent malfunction tests, Clin Chim Acta
2007;38:107–113
77. Veidal SS, Bay-Jensen AC, Tougas G, Karsdal MA, Vainer B.
Serum markers of liver fibrosis: combining the BIPED classifi-
cation and the neo-epitope approach in the development of new
biomarkers. Dis Markers 2010;28:15–28
78. Hayasaka A, Koch J, Schuppan D, Maddrey WC, Hahn EG. The
serum concentrations of the aminoterminal propeptide of pro-
collagen type III and the hepatic content of mRNA for the alpha
1 chain of procollagen type III in carbon tetrachloride-induced
rat liver fibrogenesis. J Hepatol 1991;13:328–338
79. Xie Q, Zhou X, Huang P, Wei J, Wang W, Zheng S. The per-
formance of enhanced liver fibrosis (ELF) test for the staging of
liver fibrosis: ameta-analysis. PLoS One 2014;9:e92772
80. Innes HA, McDonald SA, Dillon JF, Allen S, Hayes PC,
Goldberg D, et al. Towards a more complete understanding
of the association between a hepatitis C sustained viral
response and cause-specific outcomes. Hepatology
2015;62:355–364
81. Tamaki N, Kurosaki M, Kuno A, Korenaga M, Togayachi A,Gotoh M, et al. Wisteria floribunda agglutinin positive human
Mac-2-binding protein as a predictor of hepatocellular carci-
noma development in chronic hepatitis C patients. Hepatol Res
2015;45:E82–E88
82. Tamaki N, Kurosaki M, Izumi N. Noninvasive estimation of
liver fibrosis and hepatocellular carcinoma development using
WFA(?)-M2BP in chronic hepatitis C patients. Rinsho Byori
2015;63:1039–1043
83. Poynard T, Morra R, Ingiliz P, Imbert-Bismut F, Thabut D,
Messous D, et al. Biomarkers of liver fibrosis. Adv Clin chem
2008;46:131–160
84. Udell JA, Wang CS, Tinmouth J, FitzGerald JM, Ayas NT,
Simel DL, et al. Does this patient with liver disease have cir-
rhosis? JAMA 2012;307:832–842
85. Fontana RJ, Lok AS. Noninvasive monitoring of patients with
chronic hepatitis C. Hepatology 2002;36(5 Suppl. 1):S57–S64
Hepatol Int (2017) 11:1–30 27
123
86. Afzal S, Masroor I, Beg M. Evaluation of chronic liver disease:
does ultrasound scoring criteria help? Int J Chronic Dis
2013;2013:326231
87. Wilson SR, Withers CE. The Liver. In Rumack CM, Wilson SR,
Charboneau JW, Johnson JAM (eds). Diagnostic Ultrasound,
3rd Edition. Philadelphia: Mosby, 2005
88. Giorgio A, Amoroso P, Lettieri G, Fico P, de Stefano G, Finelli
L, et al. Cirrhosis: value of caudate to right lobe ratio in diag-
nosis with ultrasound. Radiology 1986;161:443–445
89. Taylor KJ, Riely CA, Hammers L, Flax S, Weltin G, Garcia-
Tsao G, et al. Quantitative ultrasound attenuation in normal liver
and in patients with diffuse liver disease. Importance of fat.
Radiology 1986;160:65–71
90. Murakami T, Kuroda C, Marukawa T, Harada K, Wakasa K,
Sakurai M, et al. Regenerating nodules in hepatic cirrhosis. MR
findings with pathologic correlation. AJR Am J Rontgen
1990;155:1227–1231
91. Shen L, Li JQ, Zeng MD, Lu LG, Fan ST, Bao H. Correlation
between ultrasonographic and pathologic diagnosis of liver
fibrosis due to chronic virus hepatitis. World J Gastroenterol
2006;12:1292–1295
92. Choong CC, Venkatesh SK, Siew EP. Accuracy of routine
clinical ultrasound for staging of liver fibrosis. J Clin Imaging
Sci 2012;2:58
93. Berzigotti A, Piscaglia F, EFSUMB Education and Professional
Standards Committee. Ultrasound in portal hypertension–part 2–
and EFSUMB recommendations for the performance and
reporting of ultrasound Correlation between ultrasonographic
and pathologic diagnosis of liver fibrosis due to chronic virus
hepatitis examinations in portal hypertension. Ultraschall Med
2012;33:8–32
94. Bouakaz A, de Jong N. WFUMB Safety symposium on echo-
contrast agents: nature and types of ultrasound contrast agents.
Ultrasound Med Biol 2007;33:187–196
95. Maruyama H, Ishibashi H, Takahashi M, Imazeki F, Yokosuka
O. Effect of signal intensity from the accumulated microbubbles
in the liver for differentiation of idiopathic portal hypertension
from liver cirrhosis. Radiology 2009;252:587–594
96. Fritz GA, Schoellnast H, Deutschmann HA, Wiltgen M, Brader
P, Berghold A, et al. Density histogram analysis of unenhanced
hepatic computed tomography in patients with diffuse liver
diseases. J Comput Assist Tomogr 2006;30:201–205
97. Colagrande S, Centi N, Galdiero R, Ragozzino A. Transient
hepatic intensity differences: part 2, those not associated with
focal lesions. AJM Am J Roentgenol 2007;188:160–166
98. Van Beers BE, Leconte I, Materne R, Smith AM, Jamart J,
Horsmans Y. Hepatic perfusion parameters in chronic liver
disease: dynamic CT measurements correlated with disease
severity. AJM Am J Roentgenol 2001;176:667–673
99. Kapanen M, Halavaara J, Hakkinen AM. Comparison of liver
perfusion parameters studied with conventional extravascular
and experimental intravascular CT contrast agents. Acad Radiol
2007;14:951–958
100. Kudo M, Zheng RQ, Kim SR, Okabe Y, Osaki Y, Iijima H, et al.
Diagnostic accuracy of imaging for liver cirrhosis compared to
histologically proven liver cirrhosis. A multicenter collaborative
study. Intervirology 2008;51(Suppl 1):17–26
101. Huber A, Ebner L, Montani M, Semmo N, Roy Choudhury K,
Heverhagen J, et al. Computed tomography findings in liver
fibrosis and cirrhosis. Swiss Med Wkly 2014;144:w13923
102. Talwalkar JA, Yin M, Fidler JL, Sanderson SO, Kamath PS,
Ehman RL. Magnetic resonance imaging of hepatic fibrosis:
emerging clinical applications. Hepatology 2008;47:332–342
103. Aguirre DA, Behling CA, Alpert E, Hassanein TI, Sirlin CB.
Liver fibrosis: noninvasive diagnosis with double contrast
material-enhanced MR imaging. Radiology 2006;239:425–437
104. Wang QB, Zhu H, Liu HL, Zhang B. Performance of magnetic
resonance elastography and diffusion-weighted imaging for the
staging of hepatic fibrosis: A meta-analysis. Hepatology
2012;56:239–247
105. Wong VW, Chu WC, Wong GL, Chan RS, Chim AM, Ong A,
et al. Prevalence of non-alcoholic fatty liver disease and
advanced fibrosis in Hong Kong Chinese: a population study
using proton-magnetic resonance spectroscopy and transient
elastography. Gut 2012;61:409–415
106. Ziol M, Handra-Luca A, Kettaneh A, Christidis C, Mal F,
Kazemi F, et al. Noninvasive assessment of liver fibrosis by
measurement of stiffness in patients with chronic hepatitis C.
Hepatology 2005;41:48–54
107. Talwalkar JA, Kurtz DM, Schoenleber SJ, West CP, Montori
VM. Ultrasound-based transient elastography for the detection
of hepatic fibrosis: systematic review and meta-analysis. Clin
Gastroenterol Hepatol 2007;5:1214–1220
108. Friedrich-Rust M, Ong MF, Martens S, Sarrazin C, Bojunga J,
Zeuzem S, et al. Performance of transient elastography for the
staging of liver fibrosis: a meta-analysis. Gastroenterology
2008;134:960–974
109. Adebajo CO, Talwalkar JA, Poterucha JJ, Kim WR, Charlton
MR. Ultrasound-based transient elastography for the detection
of hepatic fibrosis in patients with recurrent hepatitis C virus
after liver transplantation: a systematic review and meta-analy-
sis. Liver Transpl 2012;18:323–331
110. Millonig G, Friedrich S, Adolf S, Fonouni H, Golriz M, Mehrabi
A, et al. Liver stiffness is directly influenced by central venous
pressure. J Hepatol 2010;52:206–210
111. Castera L, Foucher J, Bernard PH, Carvalho F, Allaix D, Mer-
rouche W, et al. Pitfalls of liver stiffness measurement: a 5-year
prospective study of 13,369 examinations. Hepatology
2010;5:828–835
112. Myers RP, Pomier-Layrargues G, Kirsch R, Pollett A, Beaton
M, Levstik M, et al. Discordance in fibrosis staging between
liver biopsy and transient elastography using the FibroScan XL
probe. J Hepatol 2012;56:564–270
113. de Ledinghen V, Wong VW, Vergniol J, Wong GL, Foucher J,
Chu SH, et al. Diagnosis of liver fibrosis and cirrhosis using
liver stiffness measurement: comparison between M and XL
probe of FibroScan�. J Hepatol 2012;56:833–839
114. Wong VW, Vergniol J, Wong GL, Foucher J, Chan AW,
Chermak F, et al. Liver stiffness measurement using XL probe
in patients with nonalcoholic fatty liver disease. Am J Gas-
troenterol 2012;107:1862–1871
115. Tapper EB, Cohen EB, Patel K, Bacon B, Gordon S, Lawitz E,
et al. Levels of alanine aminotransferase confound use of tran-
sient elastography to diagnose fibrosis in patients with chronic
hepatitis C virus infection. Clin Gastroenterol Hepatol
2012;10:932–937
116. Roulot D, Czernichow S, Le Clesiau H, Costes JL, Vergnaud
AC, Beaugrand M, et al. Liver stiffness values in apparently
healthy subjects: influence of gender and metabolic syndrome.
J Hepatol 2008;48:606–613
117. Gaia S, Carenzi S, Barilli AL, Bugianesi E, Smedile A, Brunello
F, et al. Reliability of transient elastography for the detection of
fibrosis in non-alcoholic fatty liver disease and chronic viral
hepatitis. J Hepatol 2011;54:64–71
118. Mueller S, Millonig G, Sarovska L, Friedrich S, Reimann FM,
Pritsch M, et al. Increased liver stiffness in alcoholic liver dis-
ease: differentiating fibrosis from steatohepatitis. World J Gas-
troenterol 2010;16:966–972
119. Ochi H, Hirooka M, Koizumi Y, Miyake T, Tokumoto Y, Soga
Y, et al. Real-time tissue elastography for evaluation of hepatic
fibrosis and portal hypertension in nonalcoholic fatty liver dis-
eases. Hepatology 2012;56:1271–1278
28 Hepatol Int (2017) 11:1–30
123
120. Singh S, Fujii LL, Murad MH, Wang Z, Asrani SK, Ehman RL,
et al. Liver stiffness is associated with risk of decompensation,
liver cancer, and death in patients with chronic liver diseases: a
systematic review and meta-analysis. Clin Gastroenterol Hepa-
tol 2013;11:1573–1584
121. Cescon M, Colecchia A, Cucchetti A, Peri E, Montrone L,
Ercolani G, et al. Value of transient elastography measured with
FibroScan in predicting the outcome of hepatic resection for
hepatocellular carcinoma. Ann Surg 2012;256:706–712
122. Nguyen-Khac E, Nahon P, Boursier J, Moreno C, Starkel P,
Mueller S, et al. Non-invasive diagnosis of liver fibrosis by
fibroscan in patients with alcoholic liver disease: a meta-analysis
with individual data. J Hepatol 2014;60(Suppl. 1):S34
123. Corpechot C, Gaouar A, El Naggar A, Kemgang D, Wendum R,
Poupon F, et al. Liver stiffness assessed by fibroscan is a major
prognostic factor in primary sclerosing cholangitis. J Hepatol
2014;60(Suppl. 1):S34
124. Friedrich-Rust M, Nierhoff J, Lupsor M, Sporea I, Fierbinteanu-
Braticevici C, Strobel D, et al. Performance of acoustic radiation
force impulse imaging for the staging of liver fibrosis: a pooled
meta-analysis. J Viral Hepat 2012;19:e212–219
125. Nierhoff J, Chavez Ortiz AA, Herrmann E, Zeuzem S, Friedrich-
Rust M. The efficiency of acoustic radiation force impulse
imaging for the staging of liver fibrosis: a meta-analysis. Eur
Radiol 2013;23:3040–3053
126. Yap WW, Kirke R, Yoshida EM, Owen D, Harris AC. Non-
invasive assessment of liver fibrosis using ARFI with patho-
logical correlation, a prospective study. Ann Hepatol
2013;12:608–615
127. Bota S, Sporea I, Sirli R, Popescu A, Gradinaru-Tascau O. How
useful are ARFI elastography cut-off values proposed by meta-
analysis for predicting the significant fibrosis and compensated
liver cirrhosis? Med Ultrason 2015;17:200–205
128. Liu H, Fu J, Hong R, Liu L, Li F. Acoustic radiation force
impulse elastography for the non-invasive evaluation of hepatic
fibrosis in non-alcoholic fatty liver disease patients: A system-
atic review & meta-analysis. PLoS One. 2015;10:e0127782
129. Bota S, Herkner H, Sporea I, Salzl P, Sirli R, Neghina AM, et al.
Meta-analysis: ARFI elastography versus transient elastography
for theevaluation of liver fibrosis. Liver Int 2013;33:1138–1147
130. Kobayashi K, Nakao H, Nishiyama T, Lin Y, Kikuchi S,
Kobayashi Y, et al. Diagnostic accuracy of real-time tissue
elastography for the staging of liver fibrosis: a meta-analysis.
Eur Radiol 2015;25:230–238
131. Muller M, Gennisson JL, Deffieux T, Tanter M, Fink M.
Quantitative viscoelasticity mapping of human liver using
supersonic shear imaging: preliminary in vivo feasibility study.
Ultrasound Med Biol 2009;35:219–229
132. Sirli R, Bota S, Sporea I, Jurchis A, Popescu A, Gradinaru-
Tascau O, et al. Liver stiffness measurements by means of
supersonic shear imaging in patients without known liver
pathology. Ultrasound Med Biol 2013;39:1362–137
133. Pinzani M, Pinzani M, Vizzutti F, Arena U, Marra F. Tech-
nology Insight: noninvasive assessment of liver fibrosis by
biochemical scores and elastography. Nat Clin Pract Gastroen-
terol Hepatol 2008;5:95–106
134. Yoneda M, Thomas E, Sclair SN, Grant TT, Schiff ER.
Supersonic shear imaging and transient elastography with the
XL probe accurately detect fibrosis in overweight or obese
patients with chronic liver disease. Clin Gastroenterol Hepatol
2015;13:1502–1509
135. Jiang Y, Li GY, Qian LX, Hu XD, Liu D, Liang S, et al.
Characterization of the nonlinear elastic properties of soft tis-
sues using the supersonic shear imaging (SSI) technique: inverse
method, ex vivo and in vivo experiments. Med Image Anal
2015;20:97–111
136. Deffieux T, Gennisson JL, Bousquet L, Corouge M, Cosconea S,
Amroun D et al. Investigating liver stiffness and viscosity for
fibrosis, steatosis and activity staging using shear wave elas-
tography. J Hepatol 2015;62:317–324
137. Sporea I, Bota S, Jurchis A, Sirli R, Gradinaru-Tascau O,
Popescu A, et al. Acoustic radiation force impulse and super-
sonic shear imaging versus transient elastography for liver
fibrosis assessment. Ultrasound Med Biol 201;39:1933–1941
138. Cassinotto C, Boursier J, de Ledinghen V, Lebigot J, Lapuyade
B, Cales P, et al. Liver stiffness in nonalcoholic fatty liver
disease: a comparison of supersonic shear imaging, FibroScan,
and ARFI with liver biopsy. Hepatology 2016;63:1817–1827
139. Bavu E, Gennisson JL, Couade M, Bercoff J, Mallet V, Fink M,
et al. Noninvasive in vivo liver fibrosis evaluation using
supersonic shear imaging: a clinical study on 113 hepatitis C
virus patients. Ultrasound Med Biol 2011;37:1361–1373
140. Cassinotto C, Lapuyade B, Mouries A, Hiriart JB, Vergniol J,
Gaye D, et al. Noninvasive assessment of liver fibrosis with
impulse elastography: comparison of supersonic shear imaging
with ARFI and FibroScan�. J Hepatol 2014;61:550–557
141. Venkatesh SK, Venkatesh SK, Yin M, Ehman RL. Magnetic
resonance elastography of liver: technique, analysis, and clinical
applications. J Magn Reson Imaging 2013;37:544–555
142. Low G, Kruse SA, Lomas DJ. General review of magnetic
resonance elastography. World J Radiol 2016;8:59–72
143. Huwart L, Sempoux C, Vicaut E, Salameh N, Annet L, Danse E,
et al. Magnetic resonance elastography for the noninvasive
staging of liver fibrosis. Gastroenterology 2008;135:32–40
144. Venkatesh SK, Wang G, Lim SG, Wee A. Magnetic resonance
elastography for the detection and staging of liver fibrosis in
chronic hepatitis B. Eur Radiol 2014;24:70–78
145. Guo Y, Parthasarathy S, Goyal P, McCarthy RJ, Larson AC,
Miller FH. Magnetic resonance elastography and acoustic radi-
ation force impulse for staging hepatic fibrosis: a meta-analysis.
Abdom Imaging 2015;40:818–834
146. Ichikawa S, Motosugi U, Ichikawa T, Sano K, Morisaka H,
Enomoto N, et al. Magnetic resonance elastography for staging
liver fibrosis in chronic hepatitis C. Magn Reson Med Sci
2012;11:291–297
147. Chen J, Talwalkar JA, Yin M, Glaser KJ, Sanderson SO, Ehman
RL et al. Early detection of nonalcoholic steatohepatitis in
patients with nonalcoholic fatty liver disease by using MR
elastography. Radiology 2011;259:749–756
148. Kim D, Kim WR, Talwalkar JA, Kim HJ, Ehman RL. Advanced
fibrosis in nonalcoholic fatty liver disease: noninvasive assess-
ment with MR elastography. Radiology 2013;268:411–419
149. Bensamoun SF, Leclerc GE, Debernard L, Cheng X, Robert L,
Charleux F, et al. Cutoff values for alcoholic liver fibrosis using
magnetic resonance elastography technique. Alcoholism, clini-
cal and experimental research 2013;37:811–817
150. Russo MW, Galanko JA, Zacks SL, Beavers KL, Fried MW,
Shrestha R. Impact of donor age and year of transplant on graft
survival in liver transplant recipients with chronic hepatitis C.
Am J Transplant 2004;4:1133–1138
151. Toniutto P, Fabris C, Avellini C, Minisini R, Bitetto D, Rossi E,
et al. Excess body weight, liver steatosis, and early fibrosis
progression due to hepatitis C recurrence after liver transplan-
tation. World J Gastroenterol 2005;11:5944–5950
152. Lee SH, Joo DJ, Kim SU, Kim MS, Lee AL, Choi GH, et al.
Graft function measured by transient elastography in living
donor liver transplantation: preliminary. Transplant Proc
2013;45:3028–3031
153. Howell JAngus P, Gow P. Hepatitis C recurrence: the Achilles
heel of liver transplantation. Transpl Infect Dis 2014;16:1–16
154. Carlson JJ, Kowdley KV, Sullivan SD, Ramsey SD, Veenstra
DL. An evaluation of the potential cost-effectiveness of non-
Hepatol Int (2017) 11:1–30 29
123
invasive testing strategies in the diagnosis of significant liver
fibrosis. J Gastroenterol Hepatol 2009;24:786–791
155. Agency for Drugs and Techniques in Health (CADTH). Diag-
nosis and monitoring of liver fibrosis in patients with chronic
hepatitis C: a review of the clinical evidence and cost effec-
tiveness. Rapid response report. Summary and Critical Appraisal
March 8, 2012
156. Liu S, Schwarzinger M, Carrat F, Goldhaber-Fiebert JD. Cost
effectiveness of fibrosis assessment prior to treatment for
chronic hepatitis C patients. PLoS One 2011;6(12):e26783
157. Garcıa-Jurado L, Oyaguez I, Casado MA, Tural C, Gonzalez-
Garcıa J, Ortega E, et al. Evaluation of the costs of transient
elastography (FibroScan(�)) in the diagnosis of liver fibrosis in
HIV patients with hepatitis C virus. Enferm Infec Microbiol Clin
2012;30:294–299
158. Stevenson M, Lloyd-Jones M, Morgan MY, Wong R. Non-in-
vasive diagnostic assessment tools for the detection of liver
fibrosis in patients with suspected alcohol-related liver disease: a
systematic review and economic evaluation. Health Technology
Assessment 2012;16:1–174
159. Canavan C, Eisenburg J, Meng L, Corey K, Hur C. Ultrasound
elastography for fibrosis surveillance is cost effective in patients
with chronic hepatitis C virus in the UK. Dig Dis Sci
2013;58:2691–2704
160. Ripoll C, Groszmann R, Garcia-Tsao G, Grace N, Burroughs A,
Planas R, et al. Hepatic venous pressure gradient predicts clin-
ical decompensation in patients with compensated cirrhosis.
Gastroenterology 2007;133:481–488
161. Pomier-Layrargues G, Kusielewicz D, Willems B, Villeneuve
JP, Marleau D, Cote J, et al. Presinusoidal portal hypertension in
nonalcoholic cirrhosis. Hepatology 1985;5:415–418
162. Rector Jr WG. Propranolol for portal hypertension. Evaluation
of therapeutic response by direct measurement of portal vein
pressure. Arch Intern Med 1985;145:648–650
163. Valla D, Bercoff E, Menu Y, Bataille C, Lebrec D. Discrepancy
between wedged hepatic venous pressure and portal venous
pressure after acute propranolol administration in patients with
alcoholic cirrhosis. Gastroenterology 1984;86:1400–1403
164. Perello A, Escorsell A, Bru C, Gilabert R, Moitinho E, Garcıa-
Pagan JC, et al. Wedged hepatic venous pressure adequately
reflects portal pressure in hepatitis C virus-related cirrhosis.
Hepatology 1999;30:1393–1397
165. Deplano A, Migaleddu V, Pischedda A, Garrucciu G, Gregu G,
Multinu C, et al. Portohepatic gradient and portal hemody-
namics in patients with cirrhosis due to hepatitis C virus
infection. Dig Dis Sci 1999;44:155–162
166. Okuda K, Okuda K, Suzuki K, Musha H, Arimuzu N. Percuta-
neous transhepatic catheterization of the portal vein for the study
of portal hemodynamics and shunts: A preliminary report.
Gastroenterology 1977;73:279–284
167. Keiding S, Vilstrup H. Intrahepatic heterogeneity of hepatic
venous pressure gradient in human cirrhosis again. Scand J
Gastroenterol 2002;37:1344
168. Thalheimer U, Leandro G, Samonakis DN, Triantos CK, Patch
D, Burroughs AK. Assessment of the agreement between wedge
hepatic vein pressure and portal vein pressure in cirrhotic
patients. Dig Liver Dis 2005;37:601–608
169. Thalheimer U, Mela M, Patch D, Burroughs AK. Monitoring
target reduction in hepatic venous pressure gradient during
pharmacological therapy of portal hypertension: a close look at
the evidence. Gut 2004;53:143–148
170. Guha IN, Myers RP, Patel K, Talwalkar JA. Biomarkers of liver
fibrosis: what lies beneath the receiver operating characteristic
curve? Hepatology 2011;54:1454–1462
171. Suk KT, Kim DJ, Kim CH, Park SH, Cheong JY, Cho SW, et al.
Diagnostic accuracy of hepatic venous pressure gradient
measurement in the prediction of stage 1 compensated liver
cirrhosis in patients with chronic hepatitis B. Eur J Gastroenterol
Hepatol 2013;25:1170–1176
172. Kumar M, Kumar A, Hissar S, Jain P, Rastogi A, Kumar D,
et al. Hepatic venous pressure gradient as a predictor of fibrosis
in chronic liver disease because of hepatitis B virus. Liver Int
2008;28:690–698
173. Suk KT, Kim DJ, Kim CH, Park SH, Cheong JY, Cho SW, et al.
Diagnostic accuracy of biomarkers measured in the hepatic vein
and peripheral vein in the prediction of advanced fibrosis in
patients with chronic viral hepatitis. Clin Biochem
2012;45:1075–1080
174. Vizzutti F, Arena U, Romanelli RG, Rega L, Foschi M, Cola-
grande S, et al. Liver stiffness measurement predicts severe
portal hypertension in patients with HCV-related cirrhosis.
Hepatology 2007;45:1290–1297
175. Bureau C, Metivier S, Peron JM, Selves J, Robic MA, Gourraud
PA, et al. Transient elastography accurately predicts presence of
significant portal hypertension in patients with chronic liver
disease. Aliment Pharmacol Ther 2008;27:1261–1268
176. Carrion JA, Navasa M, Bosch J, Bruguera M, Gilabert R, Forns
X. Transient elastography for diagnosis of advanced fibrosis and
portal hypertension in patients with hepatitis C recurrence after
liver transplantation. Liver Transpl 2006;12:1791–1798
177. Sadler MD, Crotty P, Fatovich L, Wilson S, Rabin HR, Myers
RP. Noninvasive methods, including transient elastography, for
the detection of liver disease in adults with cystic fibrosis. Can J
Gastroenterol Hepatol 2015;29:139–144
178. Karlas T, Neuschulz M, Oltmanns A, Wirtz H, Keim V, Wie-
gand J. ARFI and transient elastography for characterization of
cystic fibrosis related liver disease: first longitudinal follow-up
data in adult patients. J Cyst Fibros 2013;12:826–827
179. Kitson MT, Kemp WW, Iser DM, Paul E, Wilson JW, Roberts
SK. Utility of transient elastography in the non-invasive evalu-
ation of cystic fibrosis liver disease. Liver Int 2013;33:698–705
180. Karlas T, Neuschulz M, Oltmanns A, Guttler A, Petroff D, Wirtz
H, et al. Non-invasive evaluation of cystic fibrosis related liver
disease in adults with ARFI, transient elastography and different
fibrosis scores. PLoS One 2012;7:e42139
181. Rath T, Menendez KM, Kugler M, Hage L, Wenzel C, Schulz R,
et al. TIMP-1/-2 and transient elastography allow non invasive
diagnosis of cystic fibrosis associated liver disease. Dig Liver
Dis 2012;44:780–787
182. Malbrunot-Wagner AC, Bridoux L, Nousbaum JB, Riou C,
Dirou A, Ginies JL, et al. Transient elastography and portal
hypertension in pediatric patients with cystic fibrosis Transient
elastography and cystic fibrosis. J Cyst Fibros 2011;10:338–342
183. Wu YM, Xu N, Hu JY, Xu XF, Wu WX, Gao SX, et al. A
simple noninvasive index to predict significant liver fibrosis in
patients with advanced schistosomiasis japonica. Parasitol Int
2013;62:283-288
184. Agha A, Abdulhadi MM, Marenco S, Bella A, Alsaudi D, El-
Haddad A, et al. Use of the platelet count/spleen diameter ratio
for the noninvasive diagnosis of esophageal varices in patients
with schistosomiasis. Saudi J Gastroenterol 2011;17:307–311
185. Esmat G, Elsharkawy A, El Akel W, Fouad A, Helal K,
Mohamed MK, et al. Fibroscan of chronic HCV patients coin-
fected with schistosomiasis. Arab J Gastroenterol
2013;14:109–112
186. Shiha G, Samir W, Soliman R, Elbasiony M, Ahmed N, Helmy
A. Transient Elastography (FibroScan) in not useful in the
diagnosis of schistosomal hepatic peri-portal fibrosis. (accepted
as poster presentation in APASL meeting, Japan, 2016)
187. Shiha G, Zalata KR. Does schistosomiasis interfere with appli-
cation of Knodell score for assessment of chronic hepatitis C?
Med Sci Monit 2001;7 Suppl 1:241–245
30 Hepatol Int (2017) 11:1–30
123
![Cloud Object Storage | Store & Retrieve Data Anywhere ... · Bariatric surgery has been shown to reverse NASH [3]. Thus, liver transplant combined with bariatric surgery is the way](https://img.pdfslide.tips/doc/110x75/5f4093406df29965a35f104b/cloud-object-storage-store-retrieve-data-anywhere-bariatric-surgery.jpg)


![Multi-tissue RNA-seq and transcriptome …...where squalamine, a compound discovered in the liver of this shark species with antimicrobial activity [31, 32] has been more recently](https://img.pdfslide.tips/doc/110x75/5e665011985b9a59ee449497/multi-tissue-rna-seq-and-transcriptome-where-squalamine-a-compound-discovered.jpg)