Embed Size (px)
DESCRIPTION
The Association for Library Service to Children (ALSC) charged ALA 2014 Emerging Leader Team E to create a "library value calculator" to demonstrate the value of library youth services, in an effort to support the advocacy efforts of librarians. However, research indicates that the library value calculator’s focus on direct library usage and outputs—rather than outcomes and impacts—makes it an ineffective, inadequate tool. This project provides valuation alternatives from libraries and beyond. We examine existing valuation projects in public libraries, using the contingent valuation method, cost/benefit analysis, and return on Investment; we consider outcome measurements and logic models from museums and non-profits; and we explore the vast world of school library assessment. We conclude with recommendations to ALSC to continue the work of determining and demonstrating value, through research and advocacy.
Citation preview
0
Amber Conger, Kristen Curé,
Hanna Lee, Kara Riley and Soraya
Silverman-Montano
ASK, ASSESS, ADVOCATE:
DEMONSTRATING THE VALUE OF LIBRARY
YOUTH SERVICES
ALA EMERGING LEADERS 2014
TEAM E PROJECT
1
TABLE OF CONTENTS
EXECUTIVE SUMMARY……………....………………………….2
INTRODUCTION………………....…………………………….….3
CURRENT VALUATION RESEARCH METHODOLOGIES IN
PUBLIC LIBRARIES……………....…………………………...8
OUTCOME MEASUREMENTS IN MUSEUMS…………………..12
LOOKING AT THE NONPROFIT SECTOR……………...….……14
LEVERAGING IMPACT STUDIES: LOOKING TO SCHOOL
LIBRARIES………………....……………………………..…..18
CONCLUSION………………....………………...……….….…..22
REFERENCES………………...……………………………..…..25
APPENDIX I: GLOSSARY……………....……………………….27
APPENDIX II: ADDITIONAL RESOURCES………………….….28
2
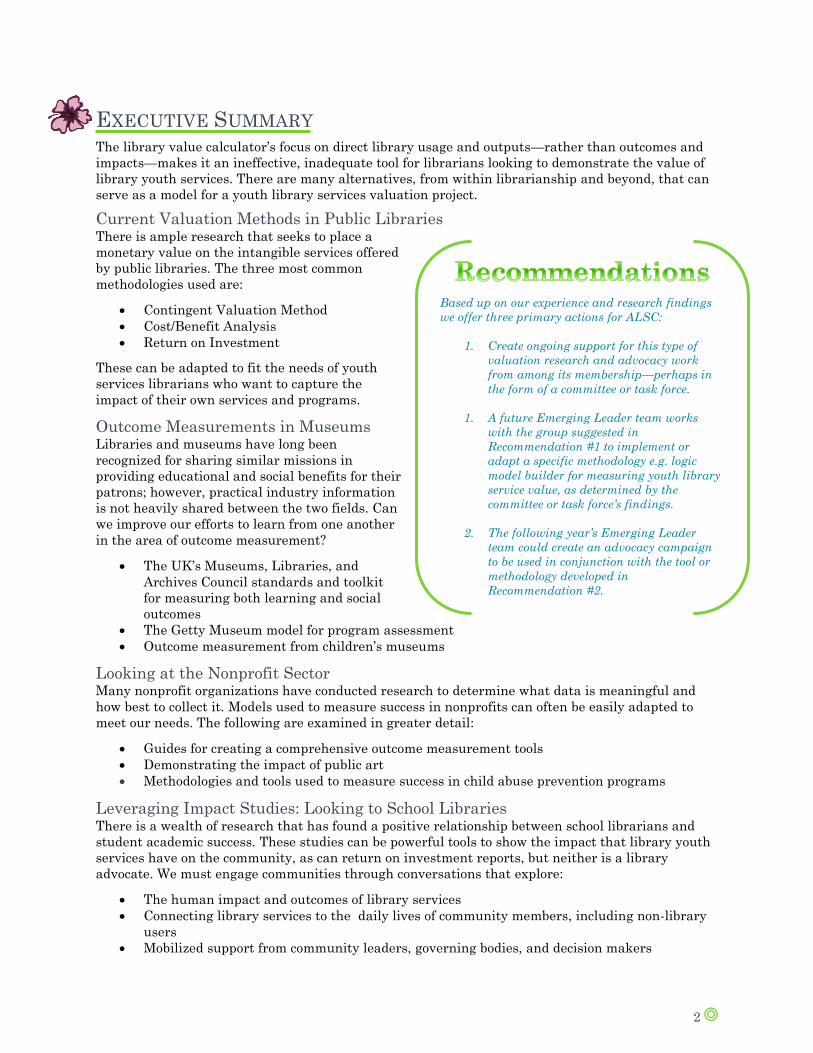
EXECUTIVE SUMMARY The library value calculator’s focus on direct library usage and outputs—rather than outcomes and
impacts—makes it an ineffective, inadequate tool for librarians looking to demonstrate the value of
library youth services. There are many alternatives, from within librarianship and beyond, that can
serve as a model for a youth library services valuation project.
Current Valuation Methods in Public Libraries There is ample research that seeks to place a
monetary value on the intangible services offered
by public libraries. The three most common
methodologies used are:
Contingent Valuation Method
Cost/Benefit Analysis
Return on Investment
These can be adapted to fit the needs of youth
services librarians who want to capture the
impact of their own services and programs.
Outcome Measurements in Museums Libraries and museums have long been
recognized for sharing similar missions in
providing educational and social benefits for their
patrons; however, practical industry information
is not heavily shared between the two fields. Can
we improve our efforts to learn from one another
in the area of outcome measurement?
The UK’s Museums, Libraries, and
Archives Council standards and toolkit
for measuring both learning and social
outcomes
The Getty Museum model for program assessment
Outcome measurement from children’s museums
Looking at the Nonprofit Sector Many nonprofit organizations have conducted research to determine what data is meaningful and
how best to collect it. Models used to measure success in nonprofits can often be easily adapted to
meet our needs. The following are examined in greater detail:
Guides for creating a comprehensive outcome measurement tools
Demonstrating the impact of public art
Methodologies and tools used to measure success in child abuse prevention programs
Leveraging Impact Studies: Looking to School Libraries There is a wealth of research that has found a positive relationship between school librarians and
student academic success. These studies can be powerful tools to show the impact that library youth
services have on the community, as can return on investment reports, but neither is a library
advocate. We must engage communities through conversations that explore:
The human impact and outcomes of library services
Connecting library services to the daily lives of community members, including non-library
users
Mobilized support from community leaders, governing bodies, and decision makers
Based up on our experience and research findings
we offer three primary actions for ALSC:
1. Create ongoing support for this type of
valuation research and advocacy work
from among its membership—perhaps in
the form of a committee or task force.
1. A future Emerging Leader team works
with the group suggested in
Recommendation #1 to implement or
adapt a specific methodology e.g. logic
model builder for measuring youth library
service value, as determined by the
committee or task force’s findings.
2. The following year’s Emerging Leader
team could create an advocacy campaign
to be used in conjunction with the tool or
methodology developed in
Recommendation #2.
3
ASK, ASSESS, ADVOCATE: DEMONSTRATING
THE VALUE OF LIBRARY YOUTH SERVICES
INTRODUCTION Children’s and youth services librarians across the nation, in libraries large and small, work around
the clock to develop outstanding collections and engaging programs, cultivate enthusiastic readers
and lifelong learners, and provide access and advocacy for those who need it most. But what is the
value of these services? And how can we make a case for maintaining and increasing access to these
services, particularly in communities where resources are limited?
In the Ask, Assess, Advocate: Demonstrating the Value of
Library Youth Services project, Emerging Leaders Team
E was charged to “help libraries in underserved
communities make the case for increasing access by
developing a Youth Library Service Calculator.” While
potentially useful for any children’s librarian, this project
will be of particular use for advocacy by library staff that
may not have the time or resources to pursue the type of
research necessary to make a viable argument for
sustained or increased community support of library
services. Our goal, as determined by the Association for
Library Service to Children (ALSC) was to “develop
methodology for online calculator by researching
professional competencies and defining the professional
requirements of youth library service.” While the team was quite eager to create a valuation tool for children’s librarians, we quickly found
that the project was much more complex than it appeared at first glance. In this section, we discuss
the strengths and limitations of a value calculator, as well as the charge to create such a calculator
to evaluate youth services. We consider the questions:
Our findings conclude that a value calculator may not be the most useful tool for ALSC members
looking to measure and present the value of library youth services to their communities. In this
project, we examine existing alternative methods of valuation from both within the library field and
beyond.
“While potentially useful for
any children’s librarian, this
project will be of particular
use for advocacy by library
staff that may not have the
time or resources to pursue
the type of research necessary
to make a viable argument
for sustained or increased
community support of library
services.”
What is a value calculator?
What are the strengths of a value calculator?
What are the limitations of a value calculator?
What are library youth services?
What is value?
4
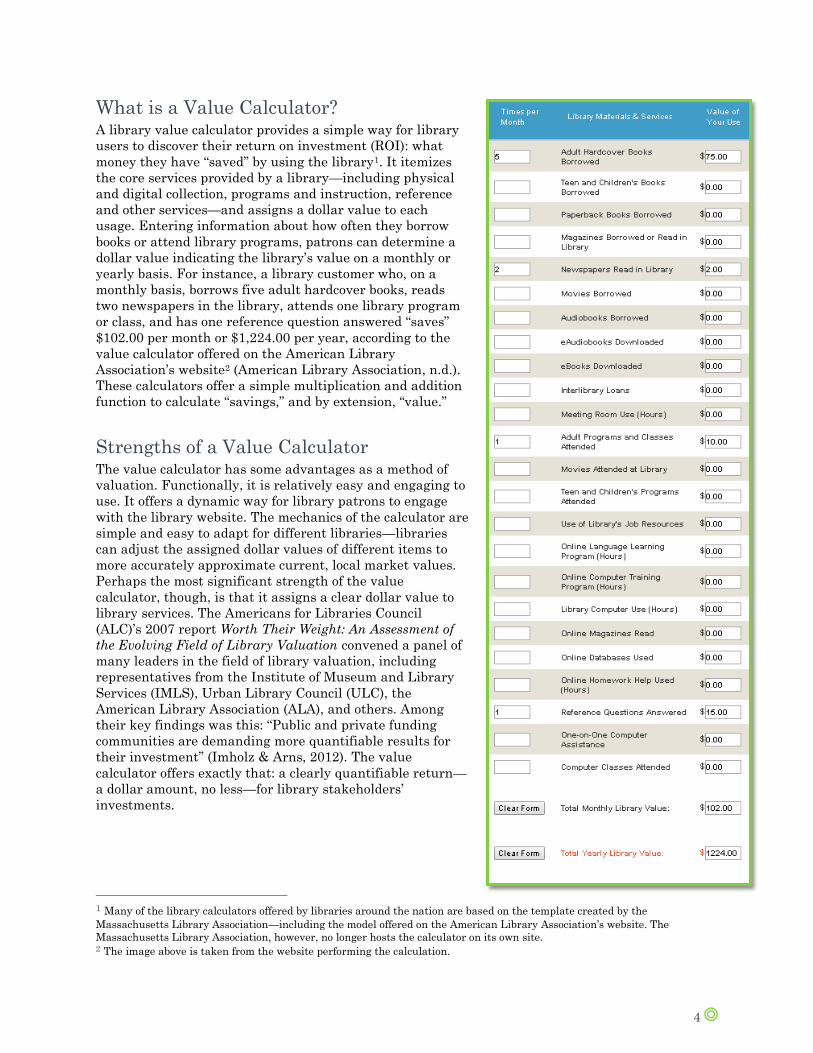
What is a Value Calculator? A library value calculator provides a simple way for library
users to discover their return on investment (ROI): what
money they have “saved” by using the library1. It itemizes
the core services provided by a library—including physical
and digital collection, programs and instruction, reference
and other services—and assigns a dollar value to each
usage. Entering information about how often they borrow
books or attend library programs, patrons can determine a
dollar value indicating the library’s value on a monthly or
yearly basis. For instance, a library customer who, on a
monthly basis, borrows five adult hardcover books, reads
two newspapers in the library, attends one library program
or class, and has one reference question answered “saves”
$102.00 per month or $1,224.00 per year, according to the
value calculator offered on the American Library
Association’s website2 (American Library Association, n.d.).
These calculators offer a simple multiplication and addition
function to calculate “savings,” and by extension, “value.”
Strengths of a Value Calculator The value calculator has some advantages as a method of
valuation. Functionally, it is relatively easy and engaging to
use. It offers a dynamic way for library patrons to engage
with the library website. The mechanics of the calculator are
simple and easy to adapt for different libraries—libraries
can adjust the assigned dollar values of different items to
more accurately approximate current, local market values.
Perhaps the most significant strength of the value
calculator, though, is that it assigns a clear dollar value to
library services. The Americans for Libraries Council
(ALC)’s 2007 report Worth Their Weight: An Assessment of
the Evolving Field of Library Valuation convened a panel of
many leaders in the field of library valuation, including
representatives from the Institute of Museum and Library
Services (IMLS), Urban Library Council (ULC), the
American Library Association (ALA), and others. Among
their key findings was this: “Public and private funding
communities are demanding more quantifiable results for
their investment” (Imholz & Arns, 2012). The value
calculator offers exactly that: a clearly quantifiable return—
a dollar amount, no less—for library stakeholders’
investments.
1 Many of the library calculators offered by libraries around the nation are based on the template created by the
Massachusetts Library Association—including the model offered on the American Library Association’s website. The
Massachusetts Library Association, however, no longer hosts the calculator on its own site.
2 The image above is taken from the website performing the calculation.
5
Limitations of a Value Calculator While the library value calculator has become a familiar sight on library websites, many libraries are
looking for something more nuanced, even the originator of the most prolific value calculator, the
Massachusetts Library Association, no longer features the value calculator on its websites. In
researching value calculators for this project, our team came across a number of limitations
presented by the method of valuation. The value calculator places inordinate emphasis on market value. Some items are easy to evaluate to
determine a dollar value (cost of materials), while others are not (program attendance, reference
services, etc.). The value calculator simply relies on market rates to establish value, and in many of
the calculators that we found, we noticed surprising dollar valuations. For example, on the Maine
State Library’s “Use Value Calculator,” an adult program is valued at $10, while a child’s program is
valued at $6 (Maine State Library, 2011). It is possible that children’s programming generally costs
less than adult programming, but is $6 actually the value of a children’s program? Why is a
children’s program less valuable than an adult program? The value calculator uses the “cost savings method,” which assumes the value is in what patrons
don’t have to spend—and assumes that the patron would pay for all of these services if the library
did not offer them (McIntosh, 2013). This does not offer a comprehensive view of library value. For
instance, another value may be that of “non-use benefit” (Matthews, 2011). Value calculators will
determine that the library is of no value to a resident who does not use library services. However,
even though an individual may not use the library, “non-use benefit” refers to the idea that
community members may still derive some satisfaction or value from the fact that exists. More broadly, we found that value calculators focus unduly on direct library usage and outputs, even
as the library valuation field moves toward examining outcomes and impacts. The impacts of library
services may be wide-ranging and have ongoing ripple
effects in local communities, while the value calculator
only takes a snapshot of market value at a given moment.
To provide an example: according to the Maine State
Library’s calculator, as cited above, a children’s program is
valued at $6—perhaps the cost of a ticket for a similar
program offered commercially. However, program
attendance may also contribute to after school crime
reduction in the community. The impact here may be
directly financial, if, for instance, the community is able to
save money on policing or law enforcement initiatives. It is
also helpful, though, to consider the broader social impacts
that library services can have on a community—what is
referred to in the ALC 2007 report as “Social Return on
Investment” or “SROI” (Imholz & Arns, 2012). The value
calculator is not able to capture these more complex
outcomes and impacts.
What are Library Youth Services? As our research led us to confront some of the limitations of the value calculator, it also raised a
number of other questions. What exactly are youth services? Are they simply the explicit service
items delineated in a value calculator, like providing access to books and programming? Our group
informally surveyed a number of library professionals, and they indicated that the services they offer
on a regular basis span the gamut of professional competencies as enumerated by ALSC. It is
significant to note: services that can be assigned a specific dollar value (access to books, access to
“It is possible that children’s
programming generally
costs less than adult
programming, but is $6
actually the value of a
children’s program? Why is
a children’s program less
valuable than an adult
program?”
6
computers) only make up a portion of that list. Other valuable services listed by library professionals
made reference to the more ephemeral aspects of our profession. For example, in the category of
“Communication,” one person shared that librarians, “[b]uild self-esteem through adult attention,
encouragement, & praise” and readers advisory, with an eye toward creating lifelong learners”
(personal communication, March 10, 2014). In this project, we take this broader view of library youth
services—that libraries offer specific, finite services, but they also offer services that can be more
difficult to evaluate.
What is Value? At its core, the value calculator sets value as the amount of money saved by a library patron by using
a library resource. However, our research leads us to urge ALSC to take a more comprehensive view
of library value, especially when attempting to provide library services in underserved areas. In his
article considering deficits in current library valuation practices, Bonfield (2014) wrote: Even if the library where you work receives no public funding, you still, like those of us in the public
sector, have a moral and fiduciary responsibility to your colleagues, students, or anyone else who
funds your ongoing employment and who relies on you to provide services that have the potential to
make their life better, their studies richer, or their time at work more productive. It’s our job to
complement other public and private services by making experiences and opportunities available
that are more difficult or expensive to access in other ways. It’s our job to improve our constituents’
well-being in ways that make sense economically. Bonfield urges library professionals to find value in improving our constituents’ lives—a significant
charge—and it follows that our methods of valuation should connect directly to that charge. In this
project, we posit that any definitions of
value should include analysis of the
outcomes and impacts of library services,
not just current, existing market valuations
of a given service. Moreover, definitions of value will be most
effective when made in relation to the
community’s already stated values3. When
libraries were able to articulate their
contributions to the community in the language of existing community values (“improving school
education outcomes,” “creating a nation of readers” etc.), they were more successful at obtaining or
maintaining community support for those services. ALSC member and library youth services advocate Kathleen Reif reiterated this idea in an interview
with our team. She noted that library professionals cannot make decisions about how to effectively
advocate for youth services in a vacuum; rather, a library must reflect the community’s values
(personal communication, April 1, 2014). Certainly, financial considerations will be a factor, but
comprehensive, effective library valuation will also take into account the broader social goals that a
community has set for itself, and how the library contributes toward those goals.
Project Overview
As our team learned more about the limitations of the library value calculator and developments in
larger field of assessment and valuation, we became convinced that a youth services value calculator
3 De Jager and Nassimbeni (2012) found this to be true in their article, “Giving Them What They Want and Assessing Impact:
Case Studies of Public Library Services in the Western Cape, South Africa.”
“…we became convinced that a youth
services value calculator would be an
inadequate, outdated tool for today’s
librarian.”
7
would be an inadequate, outdated tool for today’s librarian. We realized that to attempt to place a
dollar value on youth services would be not only impossible, but also ineffective. Rather, any
advocacy project that aims to support libraries must take the breadth of current valuation research
into account to achieve effective, compelling assessment. We wanted to highlight some of these more
robust valuation methods—to create a resource that would more accurately capture the value of a
library to its community and help that library advocate for its services. In the remainder of this project, we offer alternatives to the value calculator, from both within the
realm of library research, and beyond. In “Current Valuation Research Methodologies in Public
Libraries,” we examine case studies of valuation projects in public libraries. Next, we consider
valuation projects in other similar institutions: “Outcome Measurements in Museums” and
“Nonprofit Outcome Measurement” assess existing valuation methods and concepts in the areas of
museums and other nonprofit organizations and identify area of application for this project. Finally,
in “Leveraging Impact Studies: Looking to School Libraries,” we review the wealth of literature
documenting school library impacts, and we contemplate the lessons learned in that specific sub-
category of youth library service.
Clearly, this paper cannot be the end of this project: while we hope that collating these resources is
helpful to ALSC, there is still plenty of work to be done to actually create a valuation tool—or
toolkit— for the youth services librarian looking for advocacy support. In the final section of the
paper, we make recommendations for how ALSC can use our work to move this project forward.
CURRENT VALUATION RESEARCH METHODOLOGIES IN PUBLIC
LIBRARIES In this section, we have selected three different case studies using research methodologies for
determining value in public library services. Many of the most common techniques are explained in
detail, including the Contingent Valuation Method, the Cost-Benefit Analysis, Return on Investment
research, Willing-to-Pay, and Willing-to-Accept scenarios. For every report, there is a project
overview and explanation of the methodology. Also included is short analysis of a report which
outlines seventeen research studies for finding value in public libraries. We have included a large
scale convene of academia dedicated to researching this field and developing strategies for future
implementation.
Minnesota Public Libraries’ Return on Investment
Overview
The authors, Skurla, Jacobson, Jaeschke, and Jacobson, conducted a survey of 557 households using
the Contingent Valuation Method on how the public values the public library and its services
including: children’s, young adult and adult programming; adult, juvenile and other circulation;
public internet computers; and reference transactions (2011). First, they gave each patron some
background knowledge of the services offered, then posed a hypothetical situation asking how much
each person would be willing to voluntarily donate in order to keep these services or to lose them
permanently. The survey concluded that on average, each patron would be willing to give $32 to $38
a year to keep library services. Overall, the study found the public does value library services and
feels that funding for libraries should be either kept as is or increased in order to keep them
available.
8
Methodology
The survey used the Contingent Valuation Method to understand how community members valued
their public library services. The survey authors defined value as how much a good or service is
worth to the individual and price as how much it costs to purchase that good or service in the
market. Willingness to pay was also considered in this survey. Generally, the Contingent Valuation
Method is used by giving those you’re surveying an option to pay a certain amount more in taxes to
keep that good or service running efficiently or to lose that good/service instead. In this case, instead
of asking patrons how much more they would be willing to pay in taxes, because chances are slim
that they know what they are paying
already, they instead asked how much
patrons would be willing to donate to
the library voluntarily to keep the
current library services. All library
services were bundled into one
comprehensive item, and each person
surveyed was asked how much they
would donate to keep these services
available for a year. Background questions were asked to determine the subject’s age, gender, income, county; and
whether they or anyone in their household had used a library service within the last year. If they
answered no, they were asked why they hadn’t frequented the library. If they answered yes, that
person was asked how likely they were to pay a given amount to donate. Then each individual was
given several different ranges of values and asked which range of money they would be willing to pay
for these library services. In all, 557 surveys were administered with a 74% response rate. Using statistical measures
explained in more detail within the report; the results found the average patron would donate
between $32 and $38 each year for continued library services. When expanded out again using
statistical methods, taking the mean and multiplying by the total number of households in
Minnesota, the study concluded that revenue gained from donations would be between $65.4 and
$79.0 million annually. The results of this Contingent Valuation Method survey showed that the
community did value the public library and would be willing to donate a certain amount in order to
keep it running.
The Value of Public Libraries: Norwegian Public Libraries
Overview
In his study, Svanhild Aabo sought to define economic value from the viewpoint of the public in
regards to the services offered by Norwegian Public Libraries (2005). Using the Contingent
Valuation Method in conjunction with a Cost-Benefit Analysis, a survey was developed to determine
what value the community placed on libraries. The results were then compared to the actual cost of
providing library resources. If the perceived cost and benefits outweighed the actual cost, then there
was a concrete economic value of libraries from the public’s perspective. The results of the survey
found that there was a 1:4 cost-benefit ratio from the public’s opinion, that for every $1 spent on
using library services, there was a $4 benefit for using the public library. The public felt library
services were valuable and were willing to pay to continue using them.
Methodology
Since library services do not have a market value because they are not sold or exchanged in a private
market as most goods are, the Contingent Valuation Method was used to pose a hypothetical market
in which library services could be purchased for a concrete monetary value. One of the biggest
“Minnesota Public Libraries found patrons would
donate additional funds, between $32 to $38
annually, to keep library services using the
Contingent Valuation Method. This would result
in $65.4 and $79 million in additional revenue.”

9
problems with this method is that because the situation posed is hypothetical, those surveyed may or
may not give realistic answers because they have nothing to actually gain or lose. To counteract this,
the author aimed to retrieve answers from the public as close to an honest, realistic answer as if they
were actually living in the situation he proposed.
In order to do this, three components
of the survey were carefully and
thoughtfully constructed: a) the
setting used in the hypothetical
situation and the questions to
establish Willingness To Pay (WTP)
or Willingness to Accept (WTA); b)
the method of payment (donation,
taxes, etc.) and the rules used in
order to implement the options
presented in the situation (library
being closed, services being expanded, higher tax collection, etc.); and c) the questions used to
determine socio-economic information about the individual being interviewed (age, income, location,
frequent library user, etc.). The completed survey consisted of two different scenarios. The first determined how much the public
is WTP in order to keep library services. This situation asked the person to choose whether they
were WTP more in local taxes in order to keep the public library running, or keep tax levels where
they were, and close the library down. The second scenario was similar but determined how much
the population was WTA by losing their access to libraries. They would have to purchase similar
resources themselves, but funds they retained by closing the library could then be put towards other
services like education and health. A professional opinion company was used to conduct the survey and contacted 999 individuals over
the age of fifteen. Of those surveyed, 90% felt they had property rights to access the services the
public library had to offer, even though only 60% claimed to use library resources. This demonstrated
that the perceived value of library use was worth more than four times what it cost to operate them.4
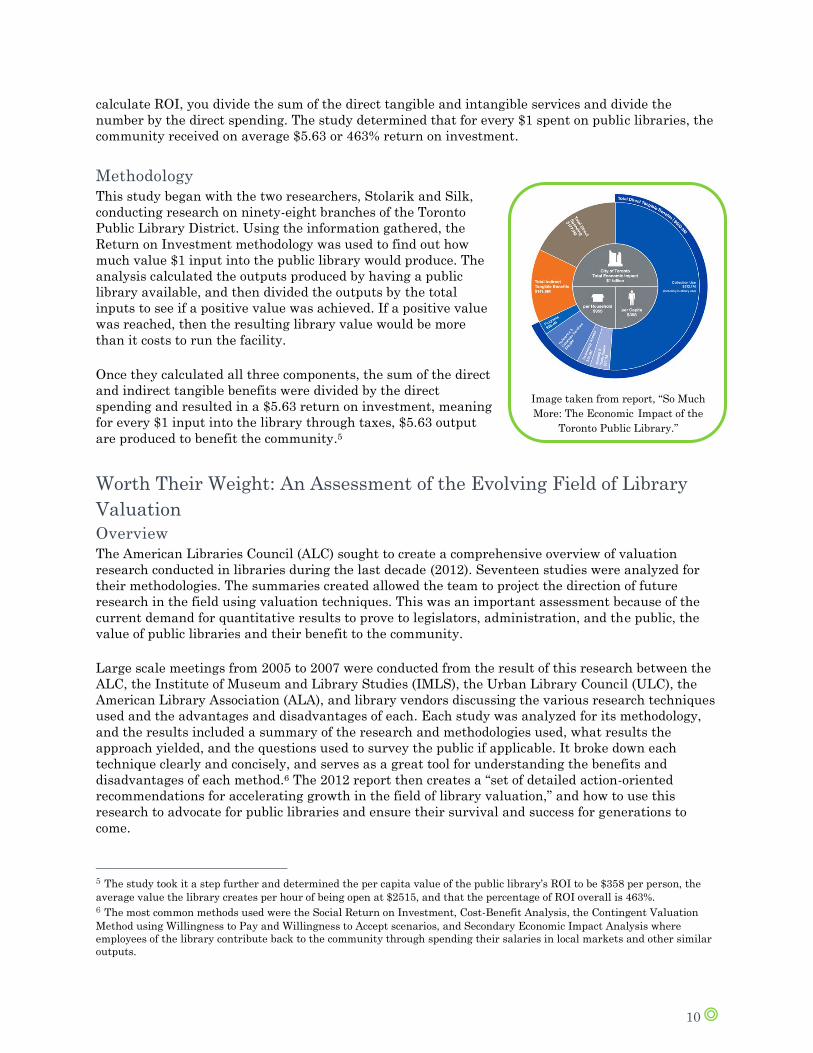
So Much More: The Economic Impact of the Toronto Public Library
Overview
Toronto’s Public Library District partnered with the Martin Prosperity Institute (MPI) to conduct a
study of the city’s 98 branches that utilized Return on Investment (ROI) methodology to determine
the library district’s value (2013). The
study analyzed three key items to
calculate ROI: 1) direct spending (how
much money is spent to run the
libraries as a whole); 2) direct tangible
benefits (worth of library services
determined by comparable services);
and 3) direct intangible benefits ( how
much capital the library gives back to
the city through spending actual
money of materials and services). To
4 Only half of those surveyed were posed the WTP scenario. The other half was given the WTA scenario. Overall the results of
the survey found that there was a 1:4 cost benefit ratio. For every $1 spent to operate the public library and its resources
there was a $4 benefit.
“Using the Cost Benefit Analysis Norwegian Public
Libraries found that for every $1 spent to run a
public library, there was a $4 benefit. Those
surveyed from the public found that libraries were
extremely valuable to their community.”
“Toronto Public Libraries discovered a 463% Return
on Investment from public libraries after thorough
research of how much it costs to run their libraries,
and measuring the direct tangible and intangible
benefits to the community and its users.”
10
calculate ROI, you divide the sum of the direct tangible and intangible services and divide the
number by the direct spending. The study determined that for every $1 spent on public libraries, the
community received on average $5.63 or 463% return on investment.
Methodology
This study began with the two researchers, Stolarik and Silk,
conducting research on ninety-eight branches of the Toronto
Public Library District. Using the information gathered, the
Return on Investment methodology was used to find out how
much value $1 input into the public library would produce. The
analysis calculated the outputs produced by having a public
library available, and then divided the outputs by the total
inputs to see if a positive value was achieved. If a positive value
was reached, then the resulting library value would be more
than it costs to run the facility. Once they calculated all three components, the sum of the direct
and indirect tangible benefits were divided by the direct
spending and resulted in a $5.63 return on investment, meaning
for every $1 input into the library through taxes, $5.63 output
are produced to benefit the community.5
Worth Their Weight: An Assessment of the Evolving Field of Library
Valuation
Overview
The American Libraries Council (ALC) sought to create a comprehensive overview of valuation
research conducted in libraries during the last decade (2012). Seventeen studies were analyzed for
their methodologies. The summaries created allowed the team to project the direction of future
research in the field using valuation techniques. This was an important assessment because of the
current demand for quantitative results to prove to legislators, administration, and the public, the
value of public libraries and their benefit to the community. Large scale meetings from 2005 to 2007 were conducted from the result of this research between the
ALC, the Institute of Museum and Library Studies (IMLS), the Urban Library Council (ULC), the
American Library Association (ALA), and library vendors discussing the various research techniques
used and the advantages and disadvantages of each. Each study was analyzed for its methodology,
and the results included a summary of the research and methodologies used, what results the
approach yielded, and the questions used to survey the public if applicable. It broke down each
technique clearly and concisely, and serves as a great tool for understanding the benefits and
disadvantages of each method.6 The 2012 report then creates a “set of detailed action-oriented
recommendations for accelerating growth in the field of library valuation,” and how to use this
research to advocate for public libraries and ensure their survival and success for generations to
come.
5 The study took it a step further and determined the per capita value of the public library’s ROI to be $358 per person, the
average value the library creates per hour of being open at $2515, and that the percentage of ROI overall is 463%. 6 The most common methods used were the Social Return on Investment, Cost-Benefit Analysis, the Contingent Valuation
Method using Willingness to Pay and Willingness to Accept scenarios, and Secondary Economic Impact Analysis where
employees of the library contribute back to the community through spending their salaries in local markets and other similar
outputs.
Image taken from report, “So Much
More: The Economic Impact of the
Toronto Public Library.”
11
How does this relate to the evaluation of youth library services? Although these research strategies did not make youth services their focus, many of them can be
easily adapted to meet the needs of future valuation research in this area. They supply detailed
outlines and models that can be relatively easy to adapt for youth services, as well as offer
suggestions on formulating surveys including how to structure the premise and environment, what
factors to take into consideration and how to phrase the presentation. Aside from the three specific
studies summarized in our paper, Worth Their Weight includes another seventeen summarized
methodologies and breaks down the pros and cons of each. This guide can provide a helpful overview
of various methodologies to be pursued in further research in youth services.
By examining various research methodologies used to calculate monetary value for public libraries
and their services, librarians are better equipped to decide which techniques would best serve their
needs for conducting new research explicit to youth services. These methodologies can be adapted to
fit the needs of youth services librarians who want to capture the impact of their own services and
programs. Both monetary value and social values can be studied using these methods, and they are
presented here as options to be considered for further research. The paper will now look at other
organizations including museums, nonprofits and school libraries and how they determine value
from their services so that combined with these methodologies the future research we conduct will be
all-encompassing and more accurately reflect the tangible and intangible impact library youth
services has on the community as a whole.
OUTCOME MEASUREMENTS IN MUSEUMS While museums and libraries share a common mission to inspire, inform, and entertain, when
making the case for funding museums also face the challenge of demonstrating their success with
the highly valued but intangible benefits to their patrons and community. Reviewed below are ways
some museums have chosen to address this issue.
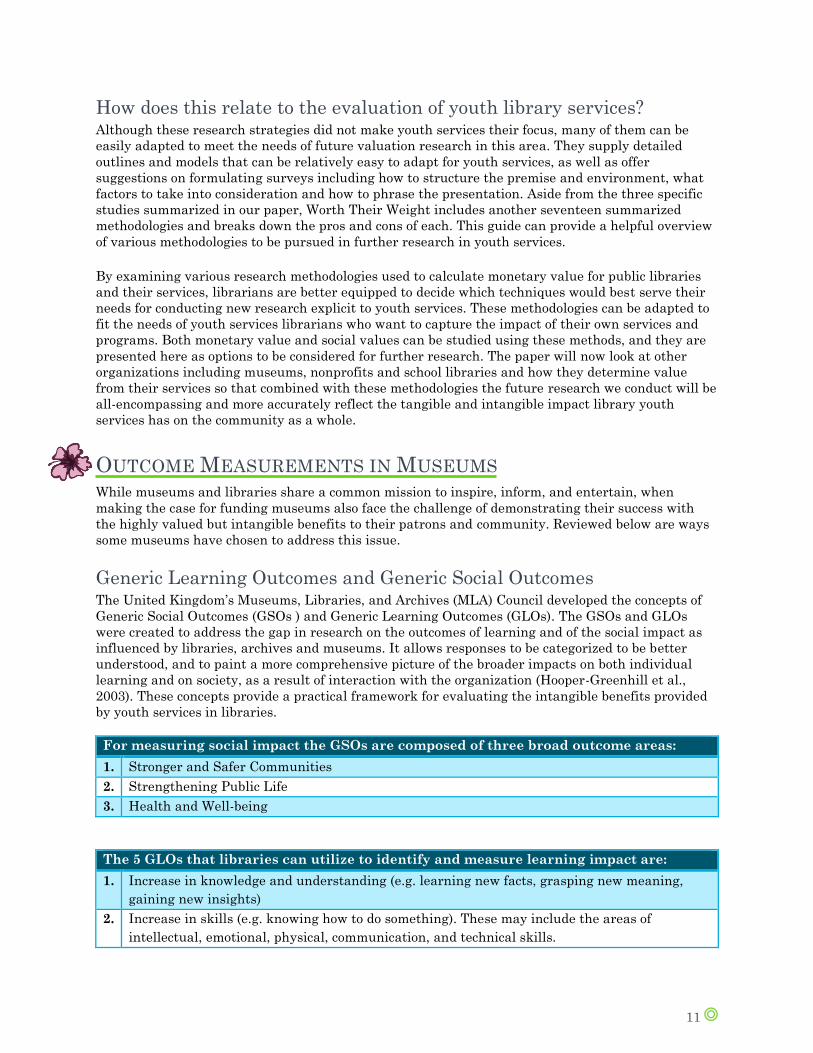
Generic Learning Outcomes and Generic Social Outcomes The United Kingdom’s Museums, Libraries, and Archives (MLA) Council developed the concepts of
Generic Social Outcomes (GSOs ) and Generic Learning Outcomes (GLOs). The GSOs and GLOs
were created to address the gap in research on the outcomes of learning and of the social impact as
influenced by libraries, archives and museums. It allows responses to be categorized to be better
understood, and to paint a more comprehensive picture of the broader impacts on both individual
learning and on society, as a result of interaction with the organization (Hooper-Greenhill et al.,
2003). These concepts provide a practical framework for evaluating the intangible benefits provided
by youth services in libraries.
For measuring social impact the GSOs are composed of three broad outcome areas:
1. Stronger and Safer Communities
2. Strengthening Public Life
3. Health and Well-being
The 5 GLOs that libraries can utilize to identify and measure learning impact are:
1. Increase in knowledge and understanding (e.g. learning new facts, grasping new meaning,
gaining new insights)
2. Increase in skills (e.g. knowing how to do something). These may include the areas of
intellectual, emotional, physical, communication, and technical skills.
12
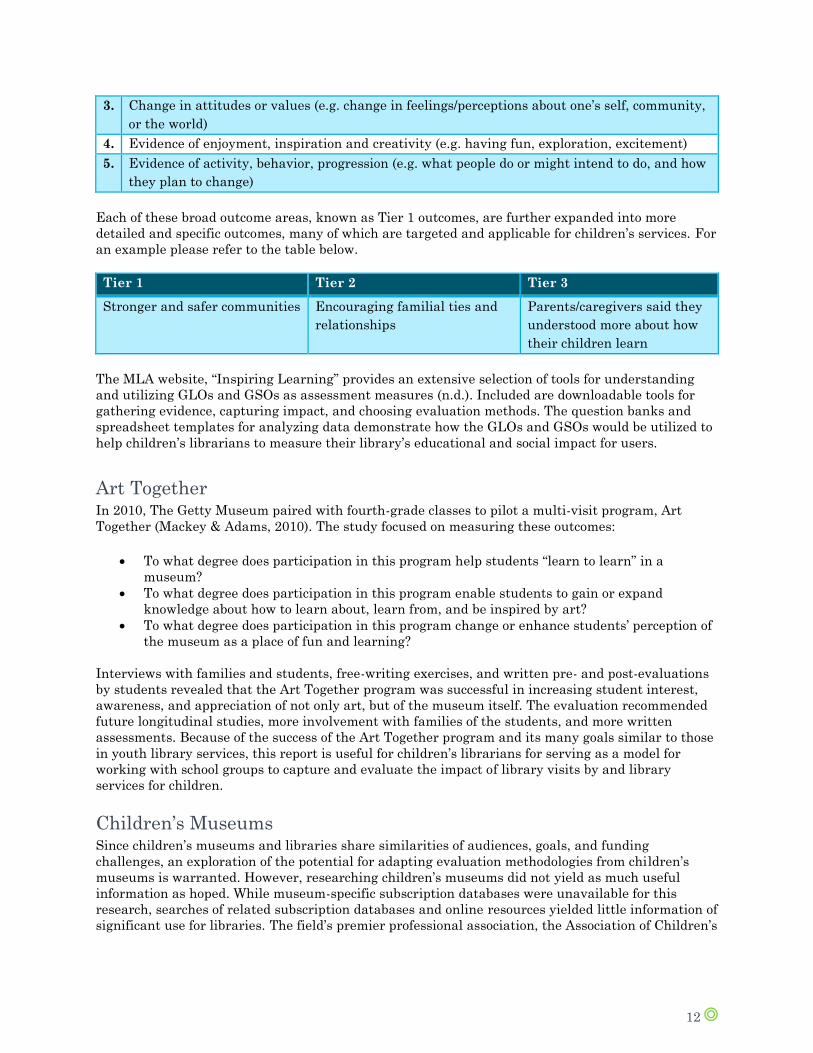
3. Change in attitudes or values (e.g. change in feelings/perceptions about one’s self, community,
or the world)
4. Evidence of enjoyment, inspiration and creativity (e.g. having fun, exploration, excitement)
5. Evidence of activity, behavior, progression (e.g. what people do or might intend to do, and how
they plan to change)
Each of these broad outcome areas, known as Tier 1 outcomes, are further expanded into more
detailed and specific outcomes, many of which are targeted and applicable for children’s services. For
an example please refer to the table below.
Tier 1 Tier 2 Tier 3
Stronger and safer communities Encouraging familial ties and
relationships
Parents/caregivers said they
understood more about how
their children learn
The MLA website, “Inspiring Learning” provides an extensive selection of tools for understanding
and utilizing GLOs and GSOs as assessment measures (n.d.). Included are downloadable tools for
gathering evidence, capturing impact, and choosing evaluation methods. The question banks and
spreadsheet templates for analyzing data demonstrate how the GLOs and GSOs would be utilized to
help children’s librarians to measure their library’s educational and social impact for users.
Art Together In 2010, The Getty Museum paired with fourth-grade classes to pilot a multi-visit program, Art
Together (Mackey & Adams, 2010). The study focused on measuring these outcomes:
To what degree does participation in this program help students “learn to learn” in a
museum?
To what degree does participation in this program enable students to gain or expand
knowledge about how to learn about, learn from, and be inspired by art?
To what degree does participation in this program change or enhance students’ perception of
the museum as a place of fun and learning?
Interviews with families and students, free-writing exercises, and written pre- and post-evaluations
by students revealed that the Art Together program was successful in increasing student interest,
awareness, and appreciation of not only art, but of the museum itself. The evaluation recommended
future longitudinal studies, more involvement with families of the students, and more written
assessments. Because of the success of the Art Together program and its many goals similar to those
in youth library services, this report is useful for children’s librarians for serving as a model for
working with school groups to capture and evaluate the impact of library visits by and library
services for children.
Children’s Museums Since children’s museums and libraries share similarities of audiences, goals, and funding
challenges, an exploration of the potential for adapting evaluation methodologies from children’s
museums is warranted. However, researching children’s museums did not yield as much useful
information as hoped. While museum-specific subscription databases were unavailable for this
research, searches of related subscription databases and online resources yielded little information of
significant use for libraries. The field’s premier professional association, the Association of Children’s
13
Museums, appears to offer some advocacy tools7 and museum data which could be insightful for
libraries.
How does this relate to the evaluation of youth library services? Libraries and museums have long been recognized for sharing similar missions in providing
educational and social benefits for their patrons. However, practical industry information is not
heavily shared and utilized between the two fields. Can we improve our efforts to learn from one
another to apply our ideas and approaches? The Getty Museum provides an example of a proven,
successful learning experience for a group of students. What can children’s librarians gain from
lessons learned from the Getty, as well as from other children’s museums? The MLA’s Generic Learning Outcome and Generic Social Outcome indicators offer a practical
structure for children’s librarians to use for gathering and organizing qualitative information.
Developed by the UK’s “twin” organization to our own IMLS, the concepts of GLOs and GSOs are
accompanied by a well-developed toolkit for application in qualitative data collection and
interpretation. It would be of assistance to children’s librarians for capturing a more holistic picture
of the impact of their services.
LOOKING AT THE NONPROFIT SECTOR The research for measuring outcomes in libraries is still in its early stages, but not-for-profit
agencies have been conducting this kind of research for decades. Due to their funding origins,8 these
organizations have had the burden of demonstrating their effectiveness since their inception. “The
true measures of success for most nonprofits are statistics related to its programs, but such data are
difficult even for management to obtain and understand, much less outsiders.” (Larkin, 2013) Many
nonprofits have conducted research to determine what data is meaningful how best to collect it. This
benefits library practitioners because models used to measure success in nonprofits can often be
easily adapted to meet our needs.
The problem with value calculators and many of
the studies being conducted in the field of library
science is they assume all libraries are the same.
“Unfortunately, these studies do not acknowledge
that individual librarians or even individual
libraries make choices that differ from those
specific ways and lag them in others. They create
a fictional world, where we are all the same,
when we are actually autonomous agencies that
vary a great deal.” (Bonfield, 2014) We must
identify the characteristics that set us apart and
make us unique. It is in measuring these things
that we may find our greatest value. What sets the guides discussed in this section
apart from many of the tools that already exist is
they can be adapted to suit every organization.
They encourage an in-depth assessment of the
organization, the target audience, and desired
outcomes. Then they guide the user in creating a
7 Access is restricted to association members. 8 Most of the funding comes from private contributions and grants.
“What sets the guides discussed in
this section apart from many of the
tools that already exist is they can be
adapted to suit every organization.
They encourage an in-depth
assessment of the organization, the
target audience, and desired
outcomes. Then they guide the user
in creating a meaningful framework
for measuring outcomes.”
14
meaningful framework for measuring outcomes. In this section, we will explore the assessment
methods of several variations of nonprofits including service agencies, public art affiliates, and child
abuse prevention programs.
Creating a Comprehensive Outcome Measurement Tool Specific to Your
Organization In 1996, United Way of America created a manual which still serves as a very detailed guide for
conducting outcome measurement in nonprofit organizations. This 160+ page manual provides a
glossary of key words, instructions for how to develop and implement measurement tools, guidance
for establishing a team who will conduct the measurements, explanations of each of the different
parts of the process, diagrams and models to explain the information, and an appendix with sample
forms and questionnaires. A summary of many of the principles was reprinted in 2009; although it
was a summary, there was only one edit to the information contained in the report. The complete
manual is the document discussed in this section. Despite the age of the document, it is still
referenced in many current outcome measurement studies, and the methodology continues to be
adapted for use in various organizations.
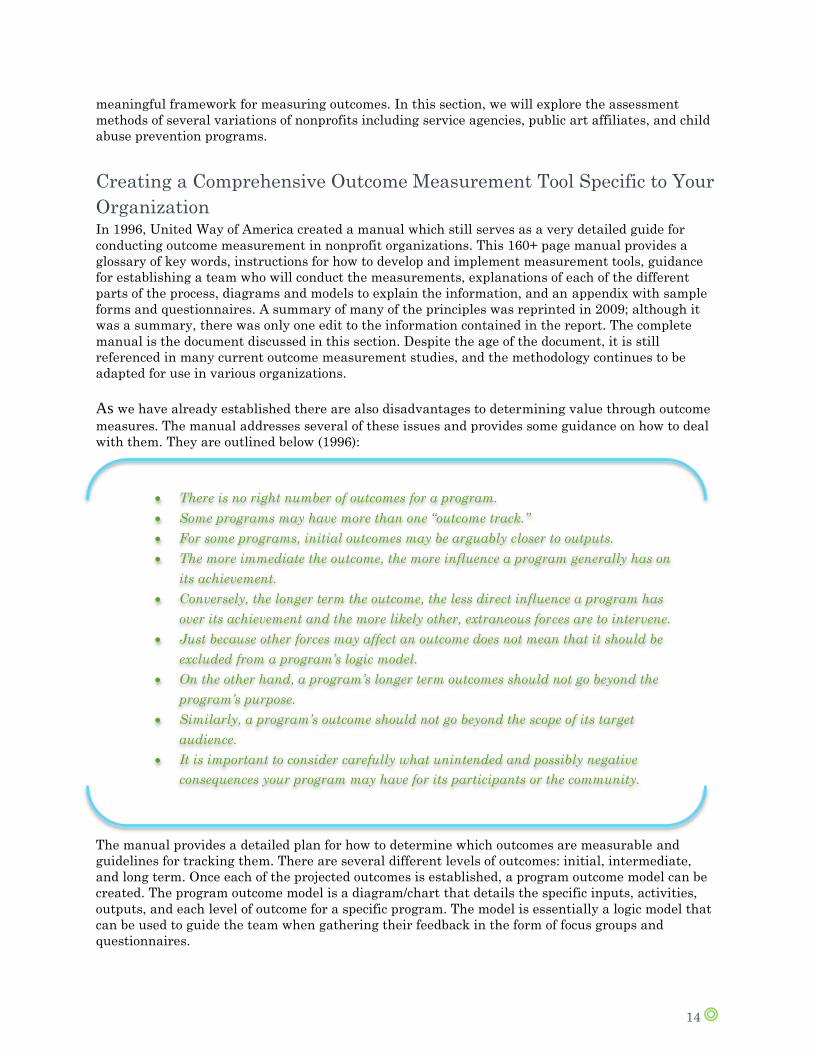
As we have already established there are also disadvantages to determining value through outcome
measures. The manual addresses several of these issues and provides some guidance on how to deal
with them. They are outlined below (1996):
The manual provides a detailed plan for how to determine which outcomes are measurable and
guidelines for tracking them. There are several different levels of outcomes: initial, intermediate,
and long term. Once each of the projected outcomes is established, a program outcome model can be
created. The program outcome model is a diagram/chart that details the specific inputs, activities,
outputs, and each level of outcome for a specific program. The model is essentially a logic model that
can be used to guide the team when gathering their feedback in the form of focus groups and
questionnaires.
There is no right number of outcomes for a program.
Some programs may have more than one “outcome track.”
For some programs, initial outcomes may be arguably closer to outputs.
The more immediate the outcome, the more influence a program generally has on
its achievement.
Conversely, the longer term the outcome, the less direct influence a program has
over its achievement and the more likely other, extraneous forces are to intervene.
Just because other forces may affect an outcome does not mean that it should be
excluded from a program’s logic model.
On the other hand, a program’s longer term outcomes should not go beyond the
program’s purpose.
Similarly, a program’s outcome should not go beyond the scope of its target
audience.
It is important to consider carefully what unintended and possibly negative
consequences your program may have for its participants or the community.
15
The United Way manual also provides guidance on how to determine an outcome by specific
indicators. “The specific observable, measurable characteristic or change that will represent
achievement of the outcome; and the specific statistic(s) (e.g., the number and percent attaining
outcome) the program will calculate to summarize its level of achievement.” The manual can be used
as a comprehensive guide for the planning, development, and execution of an outcome measurement
plan; and its scope makes it a valuable tool for many different kinds of organizations. Another report, developed by The Urban Institute, is useful because it discusses the need for
measuring outcomes and the effectiveness of different models. Building a Common Outcome
Framework to Measure Nonprofit Performance, provides a detailed outcome sequence chart (their
version of a logic model) as a sample of how to organize inputs, activities, outputs, and outcomes it
also can guide an organization in the development of outcome measurement tools. The report
specifically examines which of the outcome indicators are useful, relevant, and feasible (2006). Many
categories are established to guide the user in developing a method that works for their purposes,
but there are three different categories that fall into their nonprofit classification system that could
be adapted to children’s library services and programming: family literacy, youth mentoring, and
youth tutoring.
Similar to the logic model outlined by United Way, a sample framework of outcomes provides a
detailed look into how the desired skills/attributes/qualities are organized, broken down into smaller,
measurable components, and then given direct connections to outcomes9 (The Urban Institute, 2006).
It is affected by outside factors as well, but the measurement of outcomes is still very important
because it can demonstrate the impact you have on your clients and contribute to improved service.
Public Art: What Constitutes Success? Artist Katherine Gressel, who wrote her 2007 master’s thesis on the audience impact of public art,
revisits the subject in 2012’s “Public Art and the Challenge of Evaluation.” Like a library, public art
provides intangible benefits for its community, and depends on the generosity of the community in
order to thrive. Public art requires funding, time, and sacrifice from the artists, financial supporters,
and property owners; however, making the case for additional funding for similar projects can be
even more difficult than for libraries. How do you evaluate public interest in an item placed in an
open space and no visitor counts, how do you rate the impact of artwork when public tastes vary and
are extremely subjective, and how do you deem public art as “valuable” when it does not generate
money or, at the very least, usage statistics? Gressel outlines many additional challenges faced in evaluating public art, such as defining what
should actually be evaluated, building a common framework of indicators with which to measure,
and locating reliable indicators and data collection. She recommends capturing qualitative
information from ancillary sources which are not typically considered for data collection:
Does the artwork provoke any type of discussion, debate or controversy?
How does the community treat the artwork, over time? Does the community take initiative
to repair or maintain it?
What kinds of press coverage does it receive?
Do the artwork’s hosts use it in marketing campaigns or educational programs?
Are there “community-based proxies” who could provide data? For example, could a mural’s
building owner share the extent of comments about the mural?
9 The report also examines how outcome information can never be directly attributable to just one factor (for example the
programming provided by the agency).
16
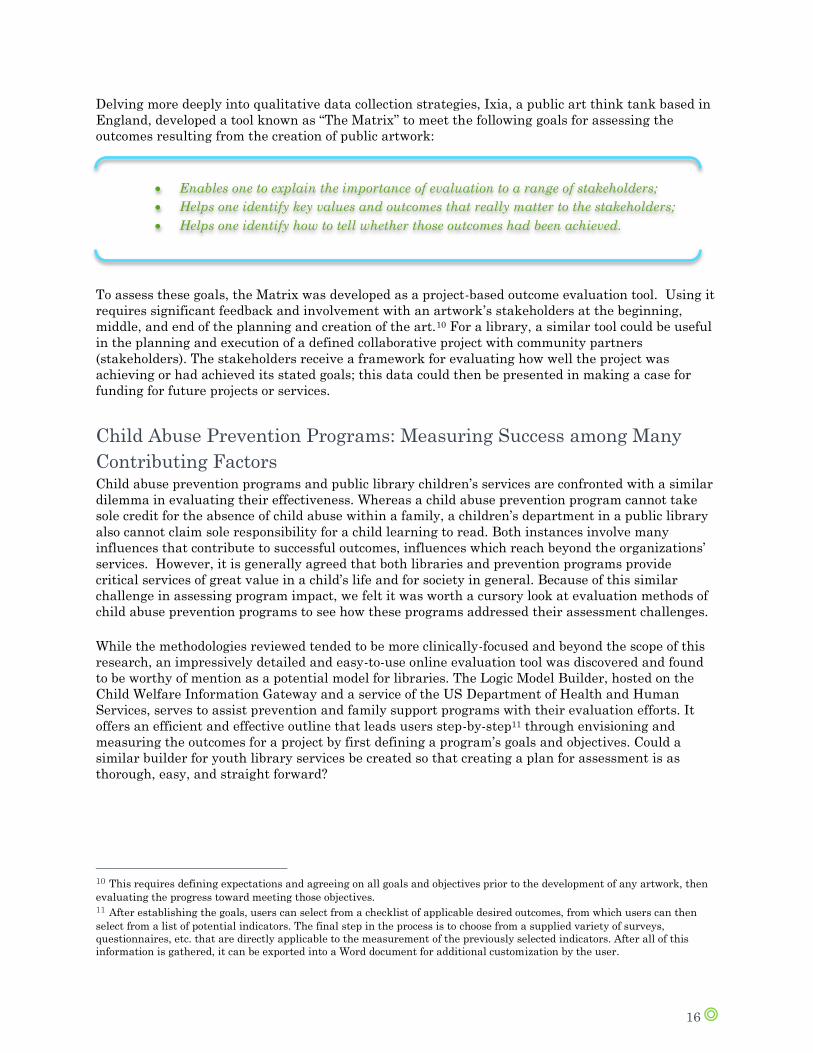
Delving more deeply into qualitative data collection strategies, Ixia, a public art think tank based in
England, developed a tool known as “The Matrix” to meet the following goals for assessing the
outcomes resulting from the creation of public artwork:
To assess these goals, the Matrix was developed as a project-based outcome evaluation tool. Using it
requires significant feedback and involvement with an artwork’s stakeholders at the beginning,
middle, and end of the planning and creation of the art.10 For a library, a similar tool could be useful
in the planning and execution of a defined collaborative project with community partners
(stakeholders). The stakeholders receive a framework for evaluating how well the project was
achieving or had achieved its stated goals; this data could then be presented in making a case for
funding for future projects or services.
Child Abuse Prevention Programs: Measuring Success among Many
Contributing Factors Child abuse prevention programs and public library children’s services are confronted with a similar
dilemma in evaluating their effectiveness. Whereas a child abuse prevention program cannot take
sole credit for the absence of child abuse within a family, a children’s department in a public library
also cannot claim sole responsibility for a child learning to read. Both instances involve many
influences that contribute to successful outcomes, influences which reach beyond the organizations’
services. However, it is generally agreed that both libraries and prevention programs provide
critical services of great value in a child’s life and for society in general. Because of this similar
challenge in assessing program impact, we felt it was worth a cursory look at evaluation methods of
child abuse prevention programs to see how these programs addressed their assessment challenges. While the methodologies reviewed tended to be more clinically-focused and beyond the scope of this
research, an impressively detailed and easy-to-use online evaluation tool was discovered and found
to be worthy of mention as a potential model for libraries. The Logic Model Builder, hosted on the
Child Welfare Information Gateway and a service of the US Department of Health and Human
Services, serves to assist prevention and family support programs with their evaluation efforts. It
offers an efficient and effective outline that leads users step-by-step11 through envisioning and
measuring the outcomes for a project by first defining a program’s goals and objectives. Could a
similar builder for youth library services be created so that creating a plan for assessment is as
thorough, easy, and straight forward?
10 This requires defining expectations and agreeing on all goals and objectives prior to the development of any artwork, then
evaluating the progress toward meeting those objectives. 11 After establishing the goals, users can select from a checklist of applicable desired outcomes, from which users can then
select from a list of potential indicators. The final step in the process is to choose from a supplied variety of surveys,
questionnaires, etc. that are directly applicable to the measurement of the previously selected indicators. After all of this
information is gathered, it can be exported into a Word document for additional customization by the user.
Enables one to explain the importance of evaluation to a range of stakeholders;
Helps one identify key values and outcomes that really matter to the stakeholders;
Helps one identify how to tell whether those outcomes had been achieved.
17
How does this relate to the evaluation of youth library services? Nonprofits have always had the burden of proving to their stakeholders that their work is valuable
so there has been significant research and resources dedicated to determining the best way to
measure their outcomes. Although public library programming for children does not strictly fall into
the same category as nonprofit programs for children, there are still many similarities between the
two branches of service to be found. In a recent blog, Bonfield noted, “The difference between outputs
and outcomes, and the process and value of measuring outcomes, can be easier to appreciate if we
look at other types of agencies” (2014). The resources that exist to measure outcomes for not-for-
profit agencies can be easily adapted to meet the needs of library professional who would like to
begin gathering their own data. Materials like the United Way manual and Child Welfare
Information Gateway’s Logic Model builder are readily available at no cost and provide very detailed
instructions about how to develop, expand, and maintain an outcome driven data measurement plan. The information in the realm of not-for-profits is broad and it points to the same direction that our
research guided us in-- it is very difficult to measure the value of service, but despite the difficulty it
is still a worthwhile pursuit.12 The logic model is the most commonly used form for looking at this
particular data, and although it focuses on outcomes it does not overlook the importance of outputs.
Examining the inputs and activities allows the observer to determine outputs which help to shape
the outcomes. To the world of library services this is very useful because if a librarian can justify the
resources they are putting into a program with real life outcomes they are more likely to receive
sustained funding.
LEVERAGING IMPACT STUDIES: LOOKING TO SCHOOL
LIBRARIES For the past several years, school libraries have been in a well-documented crisis. According to the
American Library Association’s 2013 “State of America’s Libraries Report” between 2007 and 2011
the number of school librarians declined more than other school staff (other than supervisors and
instructional coordinators), new school librarians’ salaries decreased in 2011 and school budget cuts
continued to eliminate support for school library programs and school librarians. School libraries and
school librarians have borne the brunt of difficult economic times and slim budgets more than other
areas of librarianship. At the same time, there has been a wealth of research to show the positive
impact that school libraries and school librarians have on student academic success. The report,
“School Library Research Summarized” directed by Debra Kachel at Mansfield University,
highlights the key findings of this research (2013).13 Over more than ten years, school library impact
studies from 23 states and one Canadian province have come to this basic finding: “students in
schools with well-supported, resourced, and professionally-staffed school libraries achieve high levels
of academic success” (Kachel 2013).
“School Library Research Summarized” is an excellent and concise resource for those who want to
easily browse the details of a vast amount of school library impact studies. In the 2013 report,
Kachel outlines the major findings from the past ten years that show which key components of school
libraries are related to student academic success.
12 By acknowledging the limitations and challenges posed by collecting outcome-driven data, the person conducting the
research can develop a guide for moving forward. The results can be measured. 13 In addition to a summary of some of the most recent research, this report also provides an extensive “School Library Impact
Studies Chart” that lists the key components of school library programs and the states or provinces where they were found to
have a positive association with student achievement.
18
In addition to the links made between the above school library components and student
achievement, several studies from recent years suggest that school libraries impact student
academic success regardless of student socio-economic background while also having the ability to
help close the achievement gap. This is due in part because disadvantaged students gain even more
from strong libraries. What can public and other libraries that serve youth learn from these school
library impact studies? Let us take a look at some of the most compelling recent research.
The Difference is Staffing, Not Overall School Funding In 2011 Ken Haycock published a study conducted in British Columbia, Canada, where public
schools are provided equitable funding but school districts are allowed to determine local funding
priorities. It should not be a surprise that the schools that chose to better fund their libraries had
higher standardized test scores. The association was most likely seen when school libraries were
managed by qualified professional staff and supported by clerical and volunteer staff. School
libraries that had more qualified school librarian hours in addition to more paid technical staff hours
and a larger number of volunteers were most likely associated with higher academic performance by
students (Haycock, 2011). The other relationships observed by the study fall in line with the vast majority of school library
impact studies. In addition to better staffing and management by a librarian, schools with higher
student achievement had libraries that were better funded, well-stocked, heavily used and well-
integrated with teacher-librarians spending more hours each week working with students and
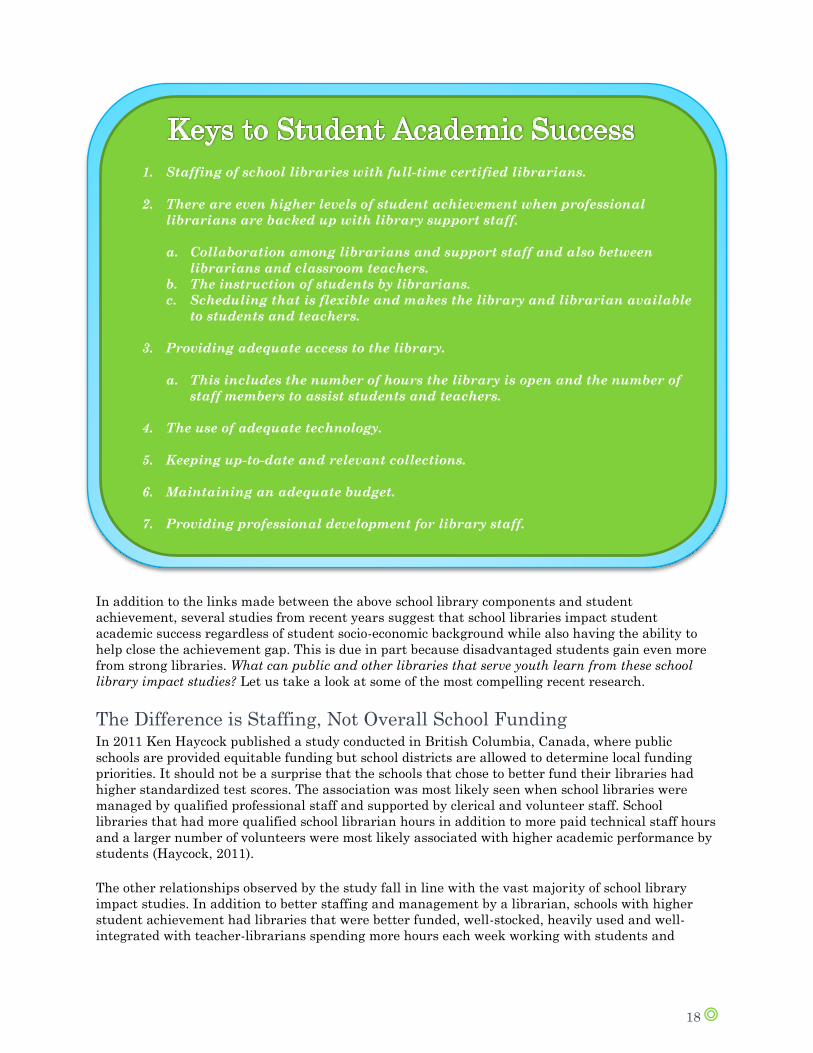
1. Staffing of school libraries with full-time certified librarians.
2. There are even higher levels of student achievement when professional
librarians are backed up with library support staff.
a. Collaboration among librarians and support staff and also between
librarians and classroom teachers.
b. The instruction of students by librarians.
c. Scheduling that is flexible and makes the library and librarian available
to students and teachers.
3. Providing adequate access to the library.
a. This includes the number of hours the library is open and the number of
staff members to assist students and teachers.
4. The use of adequate technology.
5. Keeping up-to-date and relevant collections.
6. Maintaining an adequate budget.
7. Providing professional development for library staff.
19
teachers, which includes reading incentive activities and identifying materials for teachers. As the
study showed, school libraries that have more class visits and higher circulation each week are more
likely to be at higher performing schools:
Schools with high test scores averaged 13.1 information skills group visits each week
compared to low performing schools that averaged only 8.3.
Circulation numbers were 42% higher at the
schools with better test scores (Haycock, 2011).
Librarians Are Linked to High Academic
Performance across Student
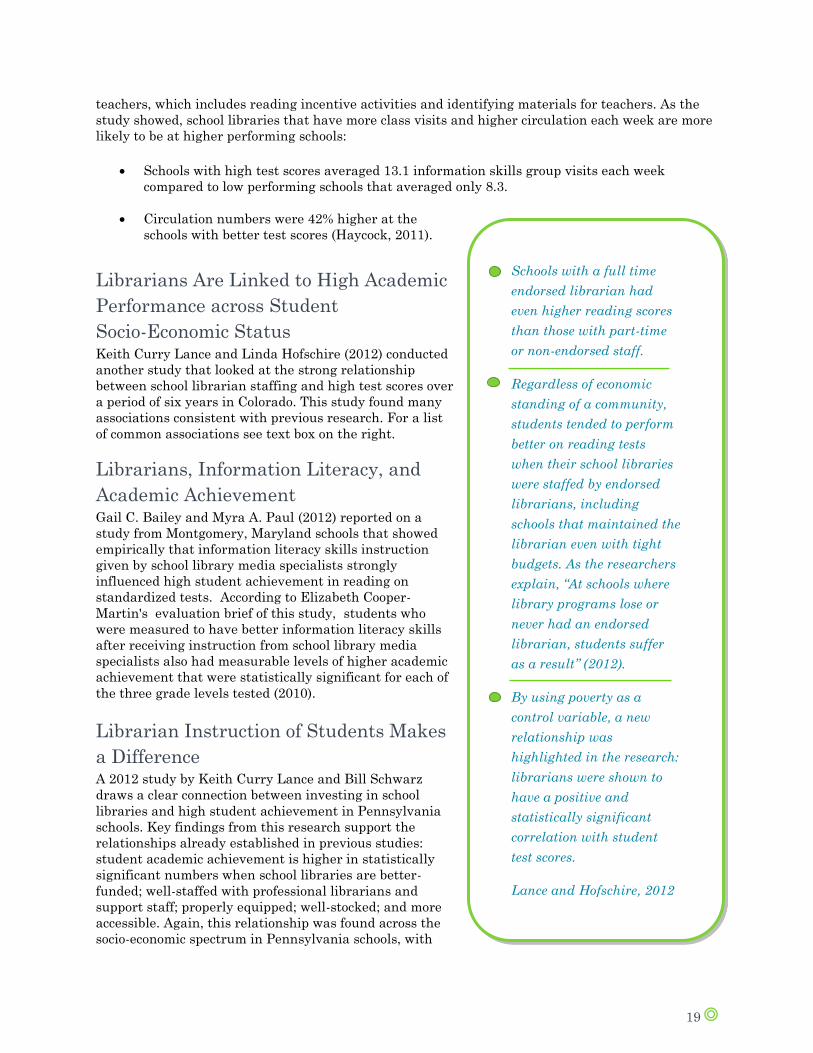
Socio-Economic Status Keith Curry Lance and Linda Hofschire (2012) conducted
another study that looked at the strong relationship
between school librarian staffing and high test scores over
a period of six years in Colorado. This study found many
associations consistent with previous research. For a list
of common associations see text box on the right.
Librarians, Information Literacy, and
Academic Achievement Gail C. Bailey and Myra A. Paul (2012) reported on a
study from Montgomery, Maryland schools that showed
empirically that information literacy skills instruction
given by school library media specialists strongly
influenced high student achievement in reading on
standardized tests. According to Elizabeth Cooper-
Martin's evaluation brief of this study, students who
were measured to have better information literacy skills
after receiving instruction from school library media
specialists also had measurable levels of higher academic
achievement that were statistically significant for each of
the three grade levels tested (2010).
Librarian Instruction of Students Makes
a Difference A 2012 study by Keith Curry Lance and Bill Schwarz
draws a clear connection between investing in school
libraries and high student achievement in Pennsylvania
schools. Key findings from this research support the
relationships already established in previous studies:
student academic achievement is higher in statistically
significant numbers when school libraries are better-
funded; well-staffed with professional librarians and
support staff; properly equipped; well-stocked; and more
accessible. Again, this relationship was found across the
socio-economic spectrum in Pennsylvania schools, with
Schools with a full time
endorsed librarian had
even higher reading scores
than those with part-time
or non-endorsed staff.
Regardless of economic
standing of a community,
students tended to perform
better on reading tests
when their school libraries
were staffed by endorsed
librarians, including
schools that maintained the
librarian even with tight
budgets. As the researchers
explain, “At schools where
library programs lose or
never had an endorsed
librarian, students suffer
as a result” (2012).
By using poverty as a
control variable, a new
relationship was
highlighted in the research:
librarians were shown to
have a positive and
statistically significant
correlation with student
test scores.
Lance and Hofschire, 2012
20
the positive impact of school libraries not being tied to more prosperous communities and often
disadvantaged students demonstrated an even greater academic gain when they had access to strong
school libraries. Like the Montgomery, Maryland study, this study points to librarian instruction as
a key element, but this study points out that the type of librarian instruction that has the largest
impact is instruction that incorporates more than information literacy. All of the relationships
showing librarian impact on academic achievement are linked to a successful incorporation of the
most current educational standards. High student achievement and strong, well-resourced libraries
tended to be found at schools where educators assessed library contributions to teaching 21st
Century Skills as "excellent" and where librarians self-assessed their contributions to teaching
Common Core standards as "excellent." In addition to exploring the relationship between librarian instruction and student achievement, this
study also took the first step in making a link between librarian impact and a school’s return on
investment. The study calculated that the overall cost of having a full-time certified librarian in
every public school as half of one percent of total school expenditures. The study did not place a
dollar value on the services that school librarians provide students, but by calculating the miniscule
overall cost of staffing a library with a professional librarian, this study put the overall positive
impact of school librarians into a monetary context that shows just how powerful and affordable a
tool school libraries can be in our children’s education.
Next Steps: Making the Impact of Youth Library Services Valuable While there have been many public library studies that work to assign a dollar value to actual
library services as a way to illustrate a community’s return on investment or as a way to
communicate a library’s impact in easily relatable terms to community members, stakeholders and
policy makers, school library impact studies have taken a different route. The vast majority of these
studies focus on finding the impact that school libraries and professional librarians have on student
academic success. These studies have found a positive relationship between school librarians and
student achievement in so many schools across North America that even a document such as
Kachel’s “School Library Research Summarized” is a dense sixteen pages long, even when it gives
just a brief outline of the studies’ findings (2013). The emphasis of these studies is on using
standardized test scores to establish school library and school librarian impact on students and on
communities. Even when Curry Lance and Schwarz put this impact into a monetary context to
calculate the miniscule cost to schools of a school librarian, they do not put a dollar value on the
actual services that the librarian provides (2012). Rather, this cost calculation serves as a
comparison that makes the great impact of school librarians even greater in the context of their low
cost.
One challenge to the findings of these school library impact studies is that none of the researchers
test the null hypothesis. All start with the assumption that school libraries and school librarians can
have an impact on student success. As brought up in a discussion at the “ALA Summit on the Future
of Libraries,” measuring the impact of the library on education is complicated because the actual
success of the learner can depend on multiple factors of which the library or librarian may be a part
(Bolt 2014). Regardless of the socio-economic standing of a schools’ community, schools with stronger
school library programs may have more resources in other areas that also impact student success.
Depending on standardized test scores as a data point is just one piece of the story that could show
library impact. In order to be strong tools in demonstrating the value of library services, these
impact studies must be paired with qualitative data that includes pieces that the community can
connect with such as stories about the impact of libraries on individuals.
21
Perhaps what public libraries can learn from school library impact studies is that each individual
library service does not need a price assigned in order to demonstrate its value. Instead, how do we
measure the impacts that our services have on our communities? When these impacts are put into
context of overall costs, our communities may get a richer picture of the value libraries provide.
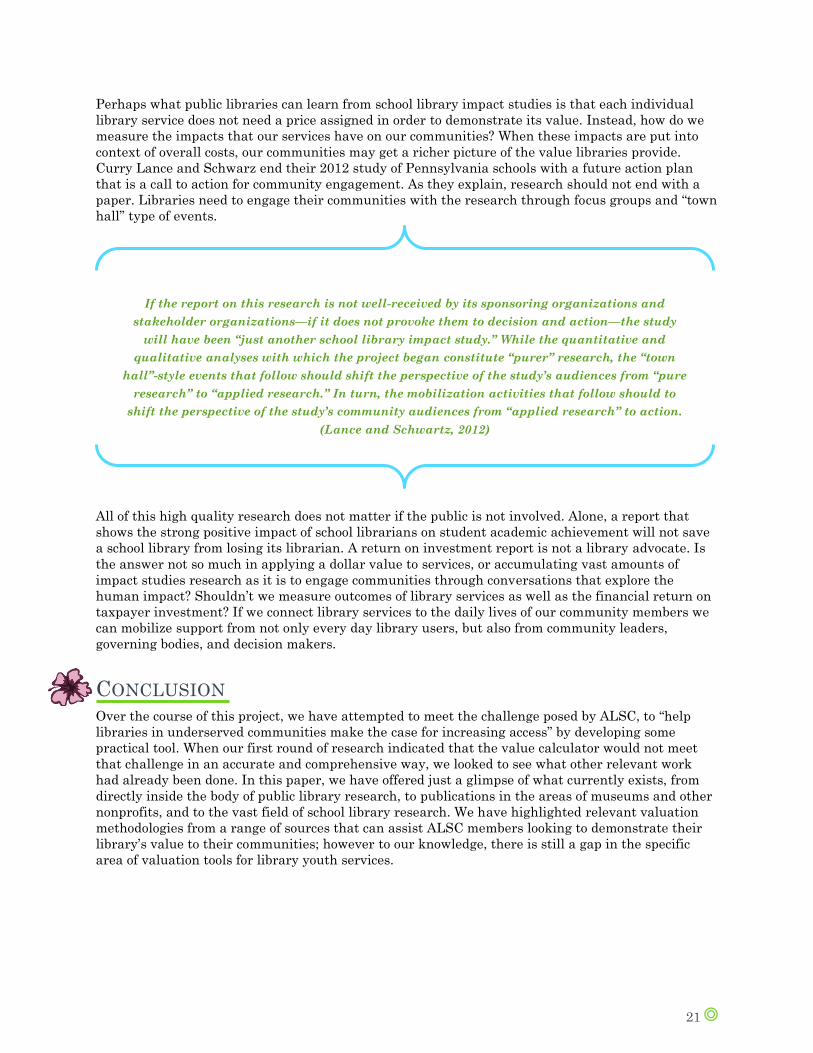
Curry Lance and Schwarz end their 2012 study of Pennsylvania schools with a future action plan
that is a call to action for community engagement. As they explain, research should not end with a
paper. Libraries need to engage their communities with the research through focus groups and “town
hall” type of events.
All of this high quality research does not matter if the public is not involved. Alone, a report that
shows the strong positive impact of school librarians on student academic achievement will not save
a school library from losing its librarian. A return on investment report is not a library advocate. Is
the answer not so much in applying a dollar value to services, or accumulating vast amounts of
impact studies research as it is to engage communities through conversations that explore the
human impact? Shouldn’t we measure outcomes of library services as well as the financial return on
taxpayer investment? If we connect library services to the daily lives of our community members we
can mobilize support from not only every day library users, but also from community leaders,
governing bodies, and decision makers.
CONCLUSION Over the course of this project, we have attempted to meet the challenge posed by ALSC, to “help
libraries in underserved communities make the case for increasing access” by developing some
practical tool. When our first round of research indicated that the value calculator would not meet
that challenge in an accurate and comprehensive way, we looked to see what other relevant work
had already been done. In this paper, we have offered just a glimpse of what currently exists, from
directly inside the body of public library research, to publications in the areas of museums and other
nonprofits, and to the vast field of school library research. We have highlighted relevant valuation
methodologies from a range of sources that can assist ALSC members looking to demonstrate their
library’s value to their communities; however to our knowledge, there is still a gap in the specific
area of valuation tools for library youth services.
If the report on this research is not well-received by its sponsoring organizations and
stakeholder organizations—if it does not provoke them to decision and action—the study
will have been “just another school library impact study.” While the quantitative and
qualitative analyses with which the project began constitute “purer” research, the “town
hall”-style events that follow should shift the perspective of the study’s audiences from “pure
research” to “applied research.” In turn, the mobilization activities that follow should to
shift the perspective of the study’s community audiences from “applied research” to action.
(Lance and Schwartz, 2012)
22
What Next? Based upon our experience and research findings over the course of the project, we offer three
primary recommendations for future action by ALSC:
Ongoing Support The parameters of the Emerging Leader program, a six-month project led by a handful of
professionals relatively new to librarianship and its professional associations, constrain the progress
of this work. While our team was eager to face the challenge posed by ALSC, we were also frequently
reminded of our limitations both personal—as new members of the profession not deeply experienced
or trained in library valuation—and structural—since the Emerging Leader program only spans six
months, from start to finish.
There are some efforts to study and demonstrate the value of library youth service, such as the
ALSC/Public Library Association (PLA) grant “Bringing Home Early Literacy: Determining the
Impact of Library Programming on Parent Behavior” and this Emerging Leaders project, however
we believe that these efforts should have a longer-term home within the division—in the form of a
committee or task force. Such a committee would likely be situated within ALSC’s Priority Group I -
Child Advocacy. Existing committees like the Advocacy and Legislation Committee touch on some of
the topics relevant to library valuation, but we believe that ALSC can play a more active role in
explicitly combining research and advocacy to determine and demonstrate library value.
This type of ongoing work is already occurring in some of the other ALA divisions. The American
Association of School Librarians’ (AASL) Research and Statistics Committee and PLA’s Performance
Measurement Task Force serve similar functions—to coordinate valuation efforts within the
division. Probably the most useful model, though, from among the other divisions, is that of the
Association of College and Research Libraries’ (ACRL) “Value of Academic Libraries” Committee.
According to their website (n.d.), that committee works to “oversee and coordinate ACRL's Value of
Academic Libraries Initiative as described in the strategic plan; work with the ACRL Board and
other ACRL units in creating a comprehensive effort including coalition building, professional
development, publications, research, advocacy, and consultation services and in developing the
ACRL Value website; and monitor and assess the effectiveness of the Value Initiative.” ACRL’s
“Value of Academic Libraries” Committee combines the research, conducted by academic leaders in
the field valuation and assessment, with the advocacy in its efforts to provide accurate, effective
resources for ACRL members looking to identify and demonstrate their value to their communities.
This model is one that ALSC can adapt to its own uses, to support those making a case for youth
services.
2. Create ongoing support for this type of valuation research and advocacy work from
among its membership—perhaps in the form of a committee or task force.
3. A future Emerging Leader team works with the group suggested in Recommendation
#1 to implement or adapt a specific methodology e.g. logic model builder for
measuring youth library service value, as determined by the committee or task force’s
findings.
4. The following year’s Emerging Leader team could create an advocacy campaign to be
used in conjunction with the tool or methodology developed in Recommendation #2.
23
Future Emerging Leader Teams and Valuation A future Emerging Leader team could go in any number of directions to support and implement the
research findings of library valuation. As we have shown, there are many existing methods being
used in other applications that could be adapted to a youth services valuation project. We
recommend that an ALSC committee or task force, as mentioned above, lead the way in determining
which method(s) to adapt, enlisting the services of a future Emerging Leader team to assist with
some discrete portion of that project—to create practical resources for librarians making the case for
library youth service. For instance, an Emerging Leader team could adapt a logic model builder for
evaluating youth services using the template created by United Way of America. Ideally, any
methodology that the Emerging Leader team would employ would be based on the research findings
of a “value of youth services” ALSC committee.
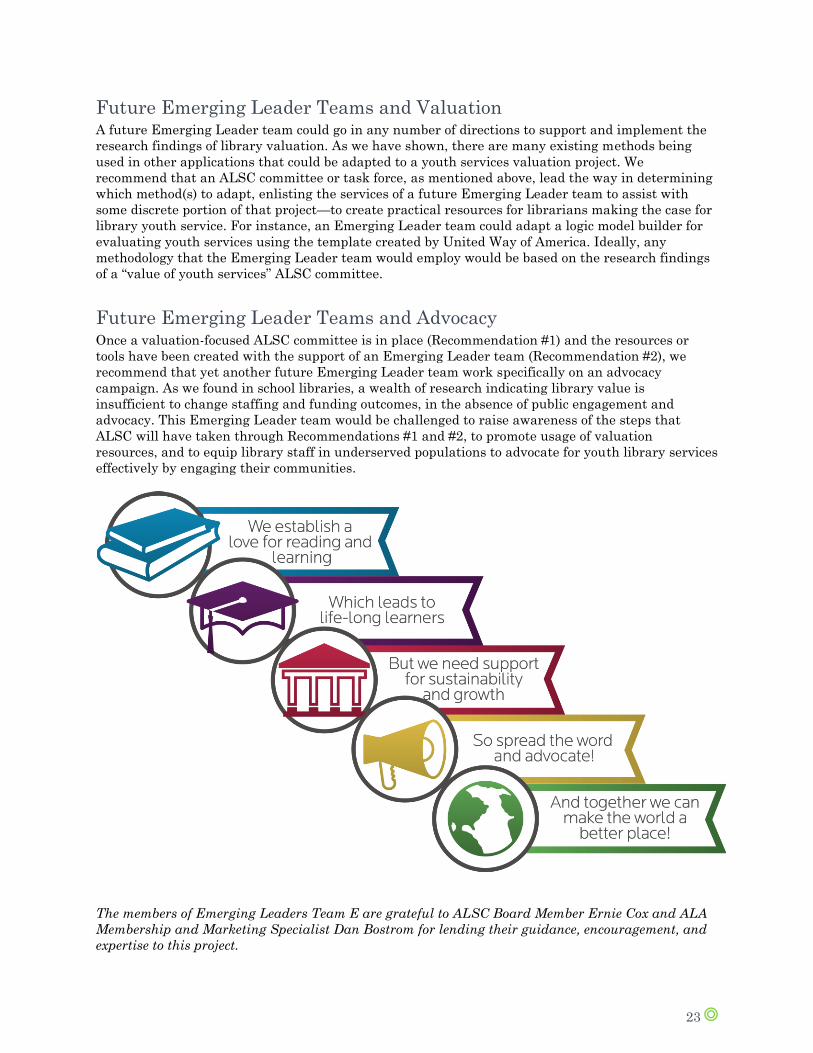
Future Emerging Leader Teams and Advocacy Once a valuation-focused ALSC committee is in place (Recommendation #1) and the resources or
tools have been created with the support of an Emerging Leader team (Recommendation #2), we
recommend that yet another future Emerging Leader team work specifically on an advocacy
campaign. As we found in school libraries, a wealth of research indicating library value is
insufficient to change staffing and funding outcomes, in the absence of public engagement and
advocacy. This Emerging Leader team would be challenged to raise awareness of the steps that
ALSC will have taken through Recommendations #1 and #2, to promote usage of valuation
resources, and to equip library staff in underserved populations to advocate for youth library services
effectively by engaging their communities.
The members of Emerging Leaders Team E are grateful to ALSC Board Member Ernie Cox and ALA
Membership and Marketing Specialist Dan Bostrom for lending their guidance, encouragement, and
expertise to this project.
24
REFERENCES
Aabo, S. (2005, August). The value of public libraries. Presentation delivered at World Library and
Information Congress: 71st IFLA General Conference and Council, Oslo, Norway. Retrieved
from http://www.iasl-online.org/advocacy/ifla/ifla2005-ramirez.doc
ACRL Value of Academic Libraries (n.d.). Association of College and Research Libraries. Retrieved
from http://www.ala.org/acrl/aboutacrl/directoryofleadership/committees/acr-val
American Library Association. (n.d.). Library value calculator. Retrieved from http://www.ala.
org/advocacy/advleg/advocacyuniversity/toolkit/makingthecase/library_calculator
American Library Association (2013). The state of America's libraries: A report from the
American Library Association. American Libraries, Special Issue. Retrieved from
http://www.ala.org/news/sites/ala.org.news/files/content/2013-State-of-Americas-Libraries-
Report.pdf
Bailey, G. & Paul, M. (2012). Report from the field: Outcome evaluation of the library media
program on information literacy skills in Montgomery county public schools, Maryland.
Teacher Librarian 39(5), 46-49.
Bolt, N. (2014). Libraries from now on: Imagining the future of libraries. (Report).
Retrieved from http://connect.ala.org/node/223726
Bonfield, B. (2014, May 07). How well are you doing your job? You don't know. No one does.
[Web log message]. Retrieved from http://www.inthelibrarywiththeleadpipe.org/2014/ how-
well-are-you-doing-your-job-you-dont-know-no-one-does/
Cooper-Martin, E. (2010). Outcome evaluation of library media program. Rockville, MD:
Montgomery County Public Schools, Office of Shared Accountability. Retrieved from
http://montgomeryschoolsmd.org/departments/sharedaccountability/reports/2010/Brief Info
Literacy_09_10.pdf
de Jager, K., & Nassimbeni, M. (2012). Giving them what they want and assessing impact: Case
studies of public library services in the Western Cape, South Africa. African Journal Of
Library, Archives & Information Science, 22(1), 19-30.
Gressel, K. (2012). Public art and the challenge of evaluation. Createquity. Retrieved from
http://createquity.com/2012/01/public-art-and-the-challenge-of-evaluation.html
Hatry, H., van Houten, T., Plantz, M., & Taylor, M. (1996). Measuring program outcomes: A
practical approach. United Way of America. Retrieved from http://www.nrpa.org/uploaded
Files/nrpa.org/Professional_Development/Accreditation/COAPRT/Measuring_Program_Outco
mes-UW.pdf
Haycock, A. (2011). Connecting British Columbia (Canada) school libraries and student
achievement: A comparison of higher and lower performing schools with similar overall
funding. School Libraries Worldwide, 17(1), 37-50.
25
Hooper-Greenhill, E., Dodd, J., Moussouri, T., Jones, C., Pickford, C., Herman, C., . . . Toon,
R. (2003). Measuring the outcomes and impact of learning in museums, archives, and
libraries. Retrieved from http://www2.le.ac.uk/departments/museumstudies/rcmg/
projects/lirp12/LIRP%20end%20of%20project%20paper.pdf
Imholz, S., & Arns, J. (2012). Worth their weight: An assessment of the evolving field of library
evaluation. Public Library Quarterly, 26(3-4), 31-48.
Inspiring learning: An improvement framework for museums, libraries, and archives (n.d.).
Museums, Libraries, and Archives Council. Retrieved from http://www.inspiringlearning
forall.gov.uk/toolstemplates
Ixia, Arts Council England. (2010). Public art: A guide to evaluation. Retrieved from
http://ixia-info.com/files/2010/04/public-art-a-guide-to-evaluationmarch10.pdf
Kachel, R. (2013). School library research summarized: A graduate class project. School of Library
and Information Technologies, University of Mansfield, Mansfield, PA. Retrieved from
http://sl-it.mansfield.edu/upload/MU-LibAdvo Bklt2013.pdf
Lance, K., & Hofschire, L. (2012). Change in school librarian staffing linked with change in
CSAP reading performance, 2005 to 2011. Denver, CO: Colorado State Library, Library
Research Service.
Lance, K., & Schwartz, B. (2012). How Pennsylvania school libraries pay off: Investments in student
achievement and academic standards. Louisville, CO: PA School Library Project. Retrieved
from http://paschoollibraryproject.org
Larkin, R. (2013, July 2). Using outcomes to measure nonprofit success. Nonprofit Quarterly,
Retrieved from https://www.nonprofitquarterly.org/management/22549-using-outcomes -to-
measure-nonprofit-success.html
Logic Model Builder (N.d.). US Department of Health and Human Services & Child Welfare
Information Gateway. Retrieved from https://www.childwelfare.gov/preventing/
evaluating/toolkit.cfm
Maine State Library. (2011, February). Explanation and values for library use value calculator.
Retrieved from http://www.maine.gov/msl/services/calexplantion.htm
Matthews, J. R. (2011). What's the return on ROI? The benefits and challenges of calculating
your library's return on investment. Library Leadership & Management, 25(1), 1-14.
Mackey, E., and Adams, M. (2010). Evaluation of art together: A Getty Museum and school multi-
visit program. Retrieved from http://www.getty.edu/education/museum_educators/
downloads/getty_arttogether_evaluation.pdf
McIntosh, C. (2013). Library return on investment: Defending the contingent valuation
method for public benefits estimation. Library & Information Science Research, 35(2), 117-
126.
Skurla, J., Jacobson, J., Jaeschke, J., & Jacobson, J. (2011). Minnesota public libraries' return on
investment. Duluth: Bureau of Business and Economic Research, Labovitz School of Business
and Economics, University of Minnesota Duluth & Institute of Museum and Library
Services. Retrieved from http://melsa.org/melsa/assets/ File/Library_final.pdf
26
Stolarick, K., & Silk, K. (2013). So much more: The economic impact of the Toronto public
library on the city of Toronto. Toronto: Martin Prosperity Institute. Retrieved from
http://martinprosperity.org/media/TPL%20Economic%20Impact_Dec2013_LR_FINAL.pdf
The Urban Institute & The Center for What Works. (2006). Building a common outcome
framework to measure nonprofit performance. Retrieved from http://www.urban.org/
UploadedPDF/411404_Nonprofit_Performance.pdf
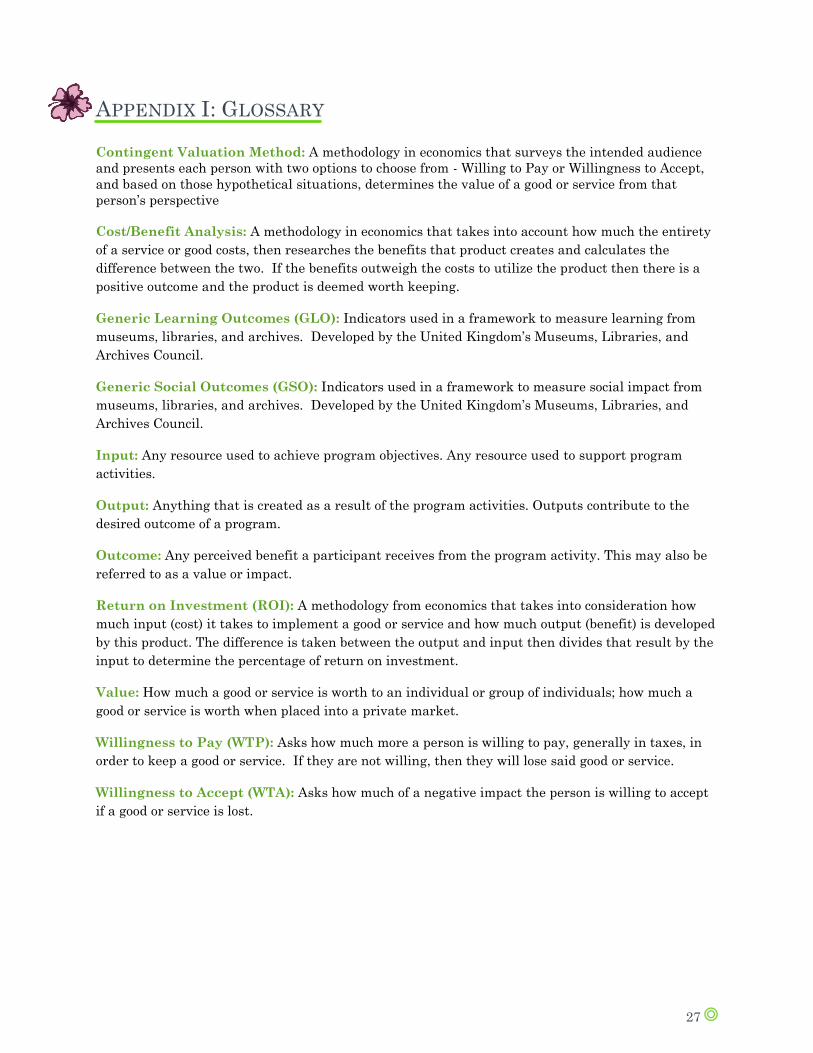
27
APPENDIX I: GLOSSARY
Contingent Valuation Method: A methodology in economics that surveys the intended audience
and presents each person with two options to choose from - Willing to Pay or Willingness to Accept,
and based on those hypothetical situations, determines the value of a good or service from that
person’s perspective
Cost/Benefit Analysis: A methodology in economics that takes into account how much the entirety
of a service or good costs, then researches the benefits that product creates and calculates the
difference between the two. If the benefits outweigh the costs to utilize the product then there is a
positive outcome and the product is deemed worth keeping.
Generic Learning Outcomes (GLO): Indicators used in a framework to measure learning from
museums, libraries, and archives. Developed by the United Kingdom’s Museums, Libraries, and
Archives Council.
Generic Social Outcomes (GSO): Indicators used in a framework to measure social impact from
museums, libraries, and archives. Developed by the United Kingdom’s Museums, Libraries, and
Archives Council.
Input: Any resource used to achieve program objectives. Any resource used to support program
activities.
Output: Anything that is created as a result of the program activities. Outputs contribute to the
desired outcome of a program.
Outcome: Any perceived benefit a participant receives from the program activity. This may also be
referred to as a value or impact.
Return on Investment (ROI): A methodology from economics that takes into consideration how
much input (cost) it takes to implement a good or service and how much output (benefit) is developed
by this product. The difference is taken between the output and input then divides that result by the
input to determine the percentage of return on investment.
Value: How much a good or service is worth to an individual or group of individuals; how much a
good or service is worth when placed into a private market.
Willingness to Pay (WTP): Asks how much more a person is willing to pay, generally in taxes, in
order to keep a good or service. If they are not willing, then they will lose said good or service.
Willingness to Accept (WTA): Asks how much of a negative impact the person is willing to accept
if a good or service is lost.
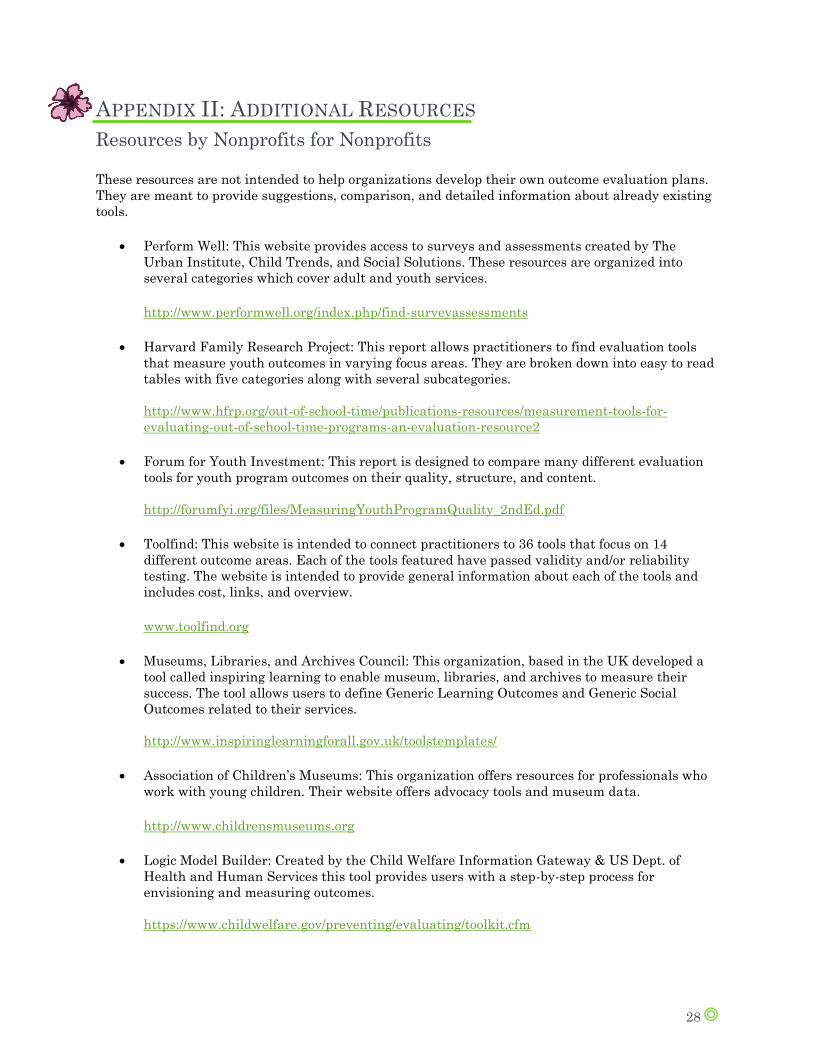
28
APPENDIX II: ADDITIONAL RESOURCES Resources by Nonprofits for Nonprofits These resources are not intended to help organizations develop their own outcome evaluation plans.
They are meant to provide suggestions, comparison, and detailed information about already existing
tools.
Perform Well: This website provides access to surveys and assessments created by The
Urban Institute, Child Trends, and Social Solutions. These resources are organized into
several categories which cover adult and youth services.
http://www.performwell.org/index.php/find-surveyassessments
Harvard Family Research Project: This report allows practitioners to find evaluation tools
that measure youth outcomes in varying focus areas. They are broken down into easy to read
tables with five categories along with several subcategories.
http://www.hfrp.org/out-of-school-time/publications-resources/measurement-tools-for-
evaluating-out-of-school-time-programs-an-evaluation-resource2
Forum for Youth Investment: This report is designed to compare many different evaluation
tools for youth program outcomes on their quality, structure, and content.
http://forumfyi.org/files/MeasuringYouthProgramQuality_2ndEd.pdf
Toolfind: This website is intended to connect practitioners to 36 tools that focus on 14
different outcome areas. Each of the tools featured have passed validity and/or reliability
testing. The website is intended to provide general information about each of the tools and
includes cost, links, and overview.
www.toolfind.org
Museums, Libraries, and Archives Council: This organization, based in the UK developed a
tool called inspiring learning to enable museum, libraries, and archives to measure their
success. The tool allows users to define Generic Learning Outcomes and Generic Social
Outcomes related to their services.
http://www.inspiringlearningforall.gov.uk/toolstemplates/
Association of Children’s Museums: This organization offers resources for professionals who
work with young children. Their website offers advocacy tools and museum data.
http://www.childrensmuseums.org
Logic Model Builder: Created by the Child Welfare Information Gateway & US Dept. of
Health and Human Services this tool provides users with a step-by-step process for
envisioning and measuring outcomes.
https://www.childwelfare.gov/preventing/evaluating/toolkit.cfm
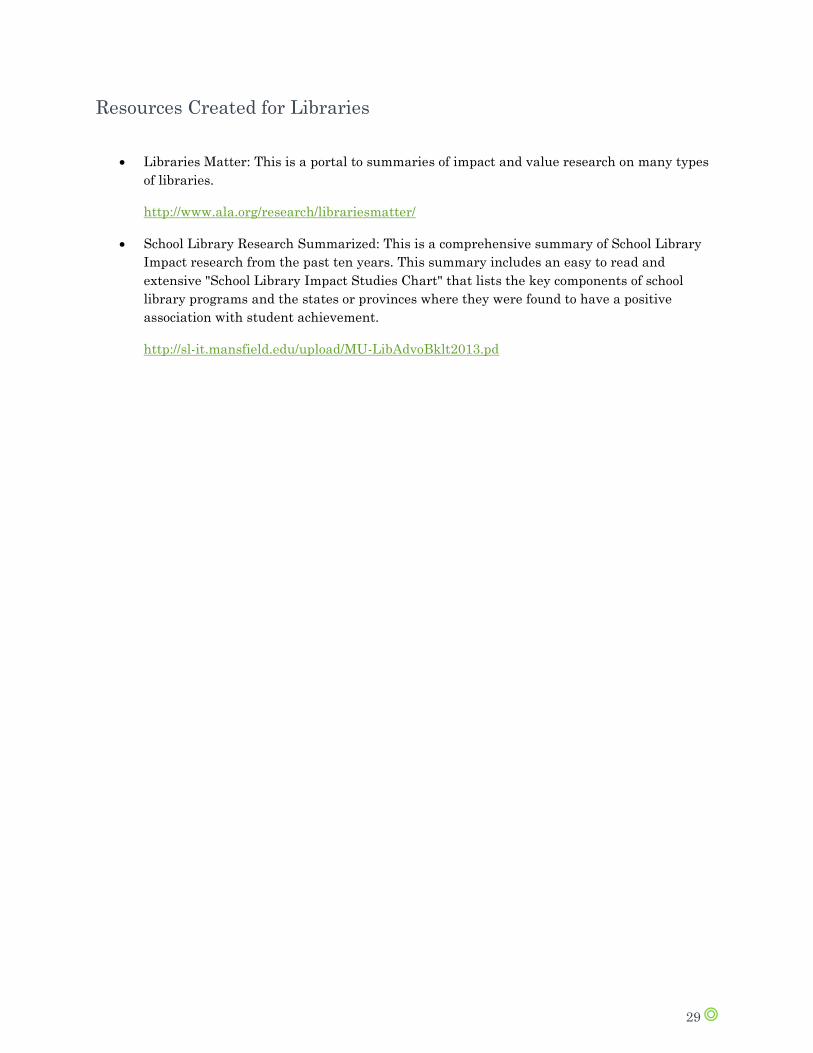
29
Resources Created for Libraries
Libraries Matter: This is a portal to summaries of impact and value research on many types
of libraries.
http://www.ala.org/research/librariesmatter/
School Library Research Summarized: This is a comprehensive summary of School Library
Impact research from the past ten years. This summary includes an easy to read and
extensive "School Library Impact Studies Chart" that lists the key components of school
library programs and the states or provinces where they were found to have a positive
association with student achievement.
http://sl-it.mansfield.edu/upload/MU-LibAdvoBklt2013.pd