Embed Size (px)
Citation preview
Accepted Manuscript
Association of symptoms of insomnia and sleep parametersamong kidney transplant recipients
Katalin Z. Ronai, Andras Szentkiralyi, Alpar S. Lazar, Zsolt I.Lazar, Istvan Papp, Ferenc Gombos, Rezso Zoller, Maria E. Czira,Anett V. Lindner, Istvan Mucsi, Robert Bodizs, Miklos Z. Molnar,Marta Novak
PII: S0022-3999(17)30114-9DOI: doi: 10.1016/j.jpsychores.2017.05.019Reference: PSR 9348
To appear in: Journal of Psychosomatic Research
Received date: 16 February 2017Revised date: 15 May 2017Accepted date: 29 May 2017
Please cite this article as: Katalin Z. Ronai, Andras Szentkiralyi, Alpar S. Lazar, ZsoltI. Lazar, Istvan Papp, Ferenc Gombos, Rezso Zoller, Maria E. Czira, Anett V. Lindner,Istvan Mucsi, Robert Bodizs, Miklos Z. Molnar, Marta Novak , Association of symptomsof insomnia and sleep parameters among kidney transplant recipients, Journal ofPsychosomatic Research (2017), doi: 10.1016/j.jpsychores.2017.05.019
This is a PDF file of an unedited manuscript that has been accepted for publication. Asa service to our customers we are providing this early version of the manuscript. Themanuscript will undergo copyediting, typesetting, and review of the resulting proof beforeit is published in its final form. Please note that during the production process errors maybe discovered which could affect the content, and all legal disclaimers that apply to thejournal pertain.
ACC
EPTE
D M
ANU
SCR
IPT
1
Title: Association of symptoms of insomnia and sleep parameters among
kidney transplant recipients
Running head: Insomnia, sleep architecture, kidney transplantation
Katalin Z Ronai MD1, Andras Szentkiralyi MD, PhD
1,2, Alpar S Lazar PhD
1,3, Zsolt I Lazar PhD
4,
Istvan Papp MSc4, Ferenc Gombos MSc
5, Rezso Zoller MD
6, Maria E Czira MD, PhD
2, Anett V
Lindner MD, PhD7, Istvan Mucsi MD, PhD
1,8 Robert Bodizs PhD
1, Miklos Z Molnar MD, PhD
9,10,
Marta Novak MD, PhD1,11
1 Inst. of Behavioural Sciences, Semmelweis University, Budapest, Hungary
2 Inst. of Epidemiology and Social Medicine, University of Muenster, Muenster, Germany
3 Faculty of Medicine and Health Sciences, University of East Anglia, Norwich, UK
4 Dept. of Physics, Babes-Bolyai University, Cluj-Napoca, Romania
5 Dept. of General Psychology, Pázmány Péter Catholic University, Budapest, Hungary
6 1st Dept. of Internal Medicine, Semmelweis University, Budapest, Hungary
7 Klinikum Landkreis Erding, Interdisciplinary Pain Center, Erding, Germany
8 Dept. of Medicine, Division of Nephrology, University Health Network, University of Toronto, Toronto,
Canada 9
Dept. Transplantation and Surgery, Semmelweis University, Budapest, Hungary 10
Division of Nephrology, Department of Medicine, University of Tennessee Health Science Center, TN, USA 11
Centre for Mental Health, University Health Network and Dept. of Psychiatry, University of Toronto, Toronto,
Canada
Corresponding author: Marta Novak
address: Toronto General Hospital, University Health Network
EN8-212 200 Elizabeth street, Toronto Ontario M5G 2C4 Canada
phone number: +1-416-340-3043
email: [email protected]
Acknowledgements
The authors thank patients and staff of the Dept. of Transplantation and Surgery and the Sleep
Laboratory at the 1st Dept. of Internal Medicine, Semmelweis University, Budapest, Hungary. The
analysis was performed at the Inst. of Behavioural Sciences, Semmelweis University, Budapest,
Hungary. RB received personal fees from Pharma Nord Hungary - unrelated to this research. MZM
received a Grant from NIH and had a position at Merck Advisory Board – both were unrelated to this
research. The other authors have indicated no financial conflicts of interest.
ACCEPTED MANUSCRIPT
ACC
EPTE
D M
ANU
SCR
IPT
2
ABSTRACT
Objective: Insomnia complaints are frequent among kidney transplant (kTx) recipients and are
associated with fatigue, depression, lower quality of life and increased morbidity. However, it is not
known if subjective insomnia symptoms are associated with objective parameters of sleep architecture.
Thus, we analyze the association between sleep macrostructure and EEG activity versus insomnia
symptoms among kTx recipients.
Methods: Participants (n1 = 100) were selected from prevalent adult transplant recipients (n0 = 1,214)
followed at a single institution. Insomnia symptoms were assessed by the Athens Insomnia Scale
(AIS) and standard overnight polysomnography was performed. In a subgroup of patients (n2 = 56)
sleep microstructure was also analyzed with power spectral analysis.
Results: In univariable analysis AIS score was not associated with sleep macrostructure parameters
(sleep latency, total sleep time, slow wave sleep, wake after sleep onset), nor with NREM and REM
beta or delta activity in sleep microstructure. In multivariable analysis after controlling for covariables
AIS score was independently associated with the proportion of slow wave sleep (β= 0.263; CI: 0.026 -
0.500) and REM beta activity (β= 0.323; CI= 0.041-0.606) (p<0.05 for both associations).
Conclusions: Among kTx recipients the severity of insomnia symptoms is independently associated
with higher proportion of slow wave sleep and increased beta activity during REM sleep but not with
other parameters sleep architecture. The results suggest a potential compensatory sleep protective
mechanism and a sign of REM sleep instability associated with insomnia symptoms among this
population.
Keywords: beta activity, insomnia, kidney transplant recipients, polysomnography, sleep architecture,
slow wave sleep
ACCEPTED MANUSCRIPT
ACC
EPTE
D M
ANU
SCR
IPT
3
Introduction
Several studies suggest that 50–80% of patients with end-stage kidney disease (ESKD) may
have sleep-related problems, including insomnia [1-4], restless legs syndrome [5-7], periodic limb
movements in sleep [2, 5-7] and obstructive sleep apnea [8-10]. Successful kidney transplantation
might alleviate some sleep problems [3, 11], but the prevalence of poor sleep remains remarkably high
among these patients: 52.5% among kidney transplant (kTx) recipients were poor sleeper in a cohort
study [12]. We previously showed the percentage of kTx recipients who had at least one insomnia
complaint was nearly 1.5 times higher compared to the general population [3].
Insomnia and poor sleep are frequent complaints in kTx recipients and they are associated
with fatigue [13], depression [3, 4], pain [4], post-traumatic stress-symptoms [4] and lower quality of
life [3, 12, 14]. Surprisingly, there is almost a complete lack of information regarding objectively
measured sleep parameters in kTx recipients. Altough there are a few published articles that report
polysomnographic assessment of sleep in kTx recipients [15-19] most reports focus on obstructive
sleep apnea and do not analyze sleep structure in details [16-19].
Insomnia disorder is characterized by difficulty falling asleep, difficulty staying asleep or poor
sleep quality, and it leads to impaired daytime functioning, tiredness, fatigue and sleepiness according
to the International Classification of Sleep Disorders III and Diagnostic and Statistical Manual of
Mental Disorders V criteria [20, 21]. These complaints can be of multi-factorial origin among kTx
recipients. Anxiety, fear of rejection, deteriorating graft function, altered metabolism of sleep-
regulatory mediators, ongoing subclinical inflammation, the presence of other comorbid conditions,
immunosuppressant (IS) or other medications and hospitalization may all influence a preexisting sleep
disorder or contribute to de novo emergence of sleep problems [22, 23].
Diagnosis of insomnia in CKD is similar to the diagnosis among the general population and it
is based on clinical interview [23]. The assessment of polysomnography (PSG) is required only when
a comorbid sleep-disorder is suspected. However, studies using PSG and detailed EEG analysis
contributed important information about the pathophysiology of insomnia among non-kidney disease
patients and helped to develop better therapies to improve the subjective symptoms. Patients with
insomnia disorder often have longer sleep onset latency (SOL) [24, 25], lower total sleep time (TST)
[24-27], dysregulated sleep homeostasis (less slow wave sleep [SWS] or delta activity) [24, 26, 28, 29]
or higher wake time after sleep onset (WASO) [24, 25, 27, 30]. Moreover, increased wake-like (beta)
EEG activity during sleep is also characteristic for patients with insomnia [27, 31, 32].
The association of subjective insomnia complaints with objectively assessed sleep architecture
and EEG activity (microstructure) have not been investigated before among kTx recipients. However,
gaining insight into the objective structure of sleep behind the subjective symptoms might help to treat
patients with insomnia more properly among this patients population. Thus, in this study we
hypothesized that, similarly to patients with insomnia but no kidney disease, insomnia symptoms are
ACCEPTED MANUSCRIPT
ACC
EPTE
D M
ANU
SCR
IPT
4
associated with altered sleep macro- and microstructure paramateres (longer SOL, shorter TST, less
SWS and delta activity, higher WASO and beta activity).
Methods
Sample of patients and data collection
Data for this analysis are obtained from the ‘‘SLeep disorders Evaluation in Patients after kidney
Transplantation (SLEPT) study’’ [15, 19, 33-40]. Potentially eligible patients were selected from all
prevalent adult transplant recipients (‘‘total clinic population’’; n = 1,214) who were regularly
followed at a single outpatient academic transplant center, the kidney transplant clinic of the Dept. of
Transplantation and Surgery at Semmelweis University, Budapest, Hungary (Figure 1).
All patients followed at the clinic on December 31, 2006 were considered for enrollment in the
Malnutrition and inflammation in transplant (MINIT-HU) study. After applying exclusion criteria
(transplant received within less than 3 months, presence of active and acute respiratory disorder, acute
infection or hospitalization within 1 month, surgery within 3 months), 1,198 patients remained (‘‘base
population’’). From this ‘‘base population’’ we randomly selected and approached 150 patients (‘‘kTx
study sample’’) using the simple random sampling strategy offered by SPSS 15.0 (IBM Corporation,
Armonk, New York, USA).
From these 150 eligible patients (‘‘kTx study sample’’), 50 individuals (33%) refused to participate.
Consequently, the ‘‘kTx PSG sample’’ who underwent PSG included 100 kTx patients (Figure 1).
There were no significant differences regarding age and sex between the ’’kTx PSG sample” and those
who refused to participate (data not shown). The basic characteristics (age, sex, eGFR, hemoglobin,
serum albumin) of the ‘‘kTx PSG sample’’ were similar to the characteristics of the ‘‘total clinic
population’’ (data not shown).
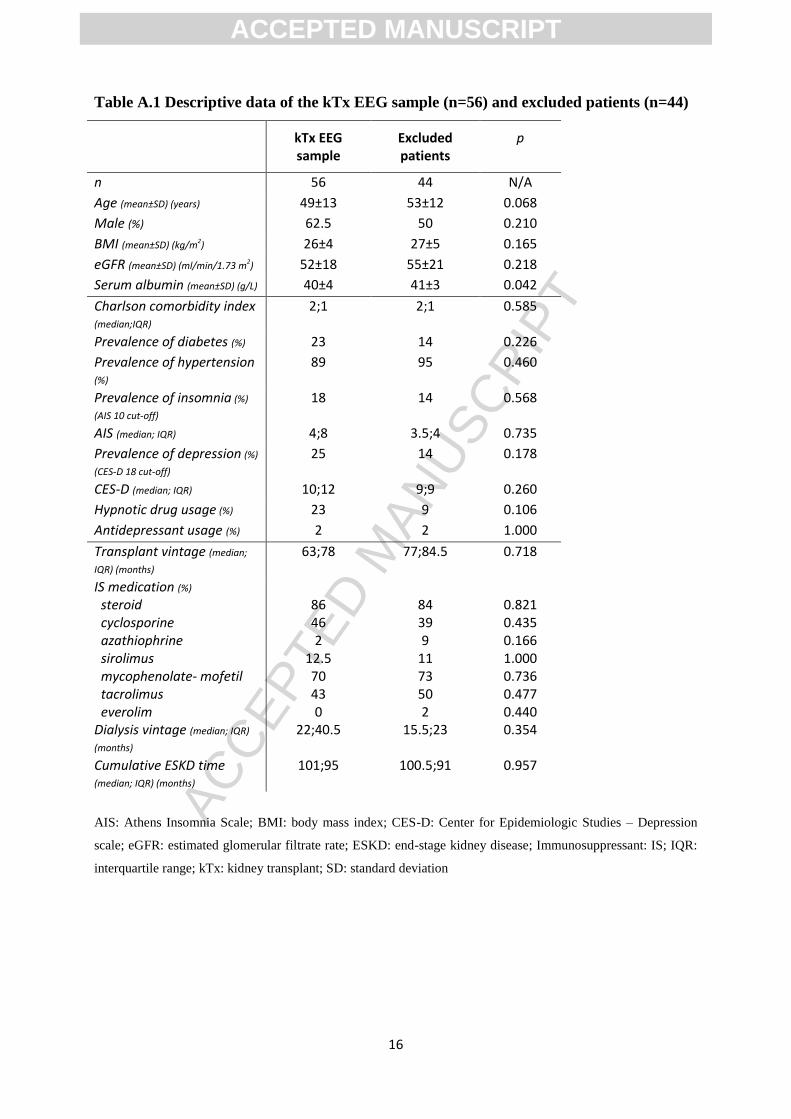
Of all PSG recordings in the ’’kTx PSG sample” 56 had sufficient quality to allow sleep microstruture
analysis (’’kTx EEG sample”) (Figure 1). There were no significant differences in the baseline
characteristics between the ’’kTx EEG sample’’ and the 44 participants excluded from the EEG
analysis, except for significantly lower serum albumin in the ’’kTx EEG sample’’ (Table A.1).
Assessment of insomnia
The Athens Insomnia Scale (AIS) was used to assess sleep complaints and to identify possible cases of
insomnia [41, 42]. The AIS consists of eight items, with score range 0–24, with higher scores
indicating worse sleep. Subjects are asked to grade the severity of the sleep complaints (absent, mild,
severe, very severe) only if the particular complaint occurred at least three times per week during the
last month. A cut-off score of 10 has been suggested for epidemiological studies to detect clinically
significant insomnia [42]. The English version of the AIS had been previously translated to Hungarian
and validated by our group [43].
ACCEPTED MANUSCRIPT
ACC
EPTE
D M
ANU
SCR
IPT
5
Polysomnography (PSG) and sleep staging
Standard, attended overnight PSG was performed in acoustically isolated and video-monitored sleep
laboratory equipped with individual suits (SOMNOscreenTM PSG Tele, SOMNOmedics GmBH,
Germany, CE0494). The following data were recorded: 5 EEG channels (A1, A2, C3, C4, Cz),
electrooculogram, chin electromyography, tibial electromyography, electrocardiography, airflow,
thoracic–abdominal movements, pulse oximetry, tracheal sound (snoring) and body position. The
ground and common reference electrodes were placed at Fpz and Cz, respectively. EEG signals were
sampled and stored at 128 Hz, low- and high-pass filters were set at 35 Hz and 0.2 Hz, respectively.
All recordings were performed on weekdays, the timing of “lights off” and “lights on” were mostly set
around 22:00 and 6:00, respectively.
Recordings were manually scored by two somnologists (MZM, ASL). Sleep stages were determined in
30 sec epochs according to Rechtschaffen and Kales [44]. Sleep macroarchitecture was characterized
by the following variables: sleep onset latency (SOL: time elapsed from “lights off ” to the first
occurrence of sleep stage 2); total sleep time (TST); wake after sleep onset (WASO: time spent awake
from sleep onset to “lights on”); sleep efficiency (SE: ratio of total sleep time over the time spent in
bed); percentages of stages 1, 2, slow wave sleep (SWS: stages 3 and 4 combined) and percentage and
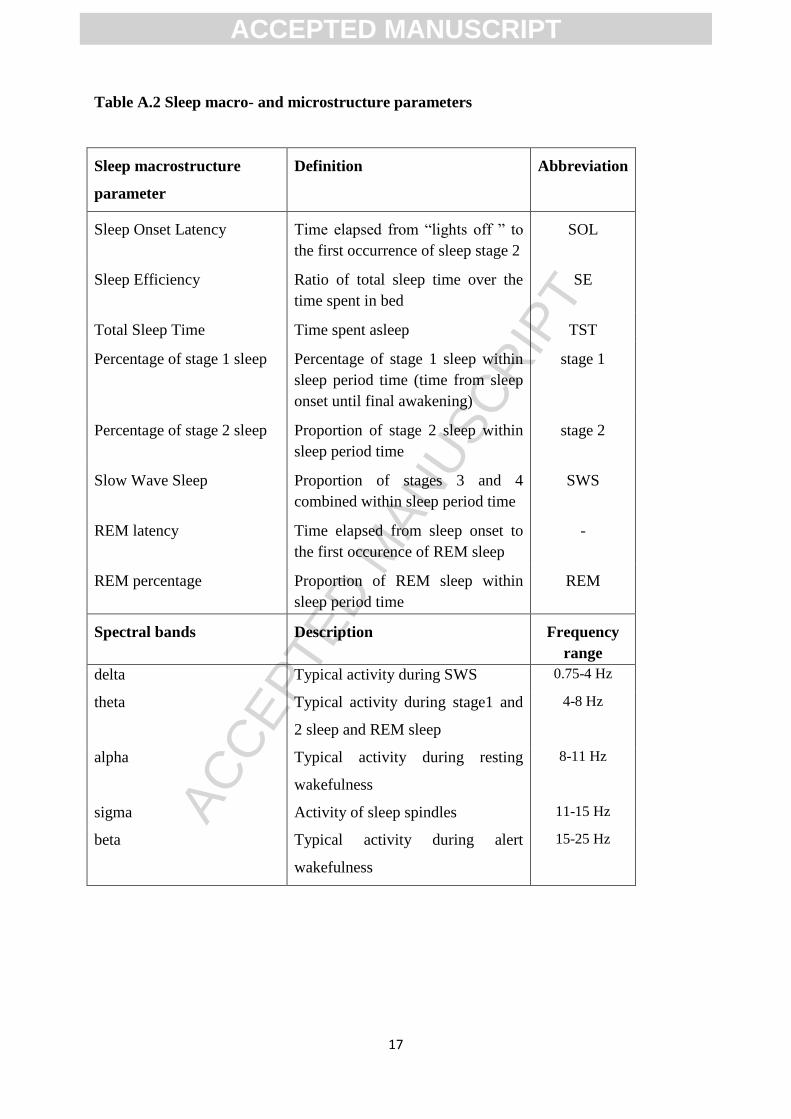
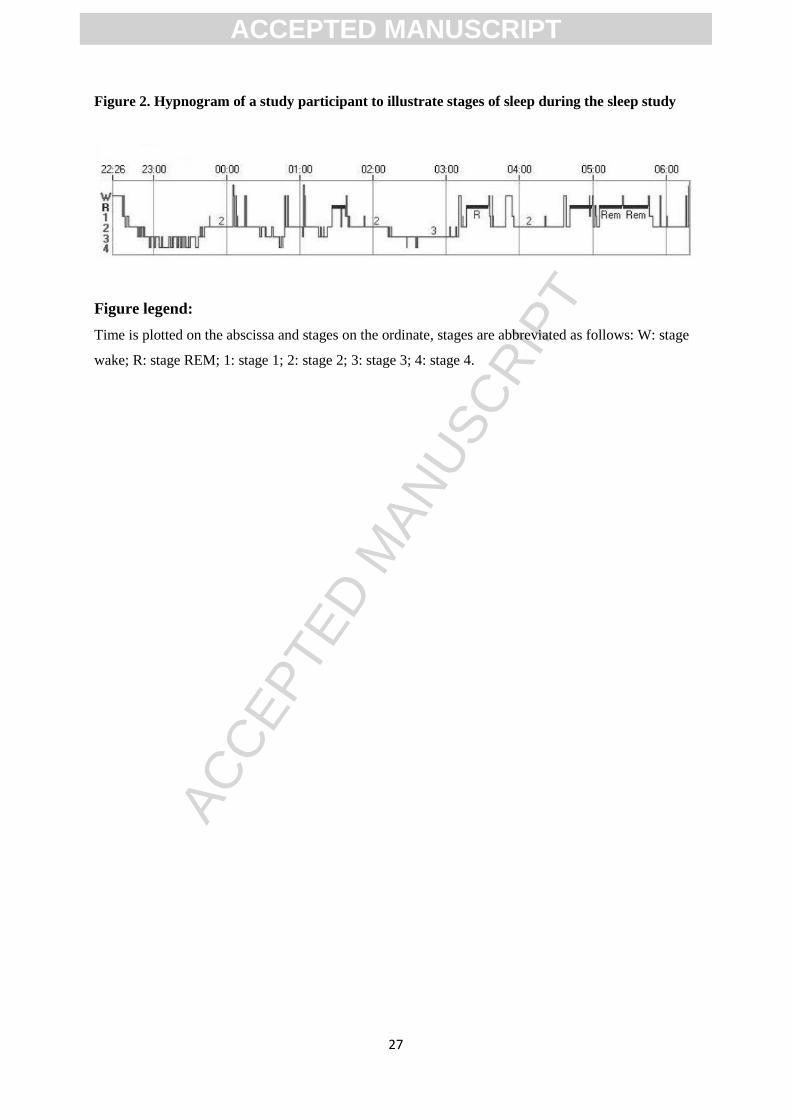
latency of REM (rapid eye movement) sleep. (With an illustrative aim we included a hypnogram
[Figure 2.] and a table [Table A.2] summarizing the sleep structure variables measured in the study).
Respiratory events and periodic leg movements were also scored according to standard criteria [45,
46]. Apnea was defined as the absence of airflow for more than 10 sec; hypopnea was defined as a
clearly discernible reduction in airflow for more than 10 sec associated with an arousal and/or 3%
reduction in oxygen saturation. The apnea-hypopnea index (AHI) was defined as the number of apneas
and hypopneas per hour of sleep. Periodic limb movements were defined as limb movements with
duration of 0.5–5 sec; inter-movement interval of 5–90 sec; and separation criteria for limb
movements occurring in both legs: more than 5 sec between onsets. The periodic limb movement
index (PLMI) was defined as the number of limb movements per hours during sleep.
Analysis of sleep microstructure
Sleep microstructure was analysed with power spectral analysis. Prior to power spectral analysis EEG
artefacts were removed from all EEG channels. For this purpose, EEG segments containing artefacts
were visually identified and annotated on a 4-second basis by an experienced somnologist using our
custom-made software (FerciosEEG, © Ferenc Gombos 2008-2016) [47]. EEG signals were
subsequently exported, while the annotated segments were excluded from further analysis. Power
spectral density averaged over the whole night was calculated separately for NREM (stages 2, 3 and 4)
and REM sleep stages.
ACCEPTED MANUSCRIPT
ACC
EPTE
D M
ANU
SCR
IPT
6
Artefact-free EEG segments of interest were concatenated and power density was calculated for
central derivations (C3-Cz, C4-Cz) using Welch's periodogram method as averages over detrended
Hanning windowed 4-second long epochs with 50% overlap. Frequency-specific absolute spectral
powers (in µV2/Hz) were obtained as the integral of the cubic spline interpolated power values over
the delta (0.75-4 Hz), theta (4-8 Hz), alpha (8-11 Hz), sigma (11-15 Hz) and beta (15-25 Hz) bands
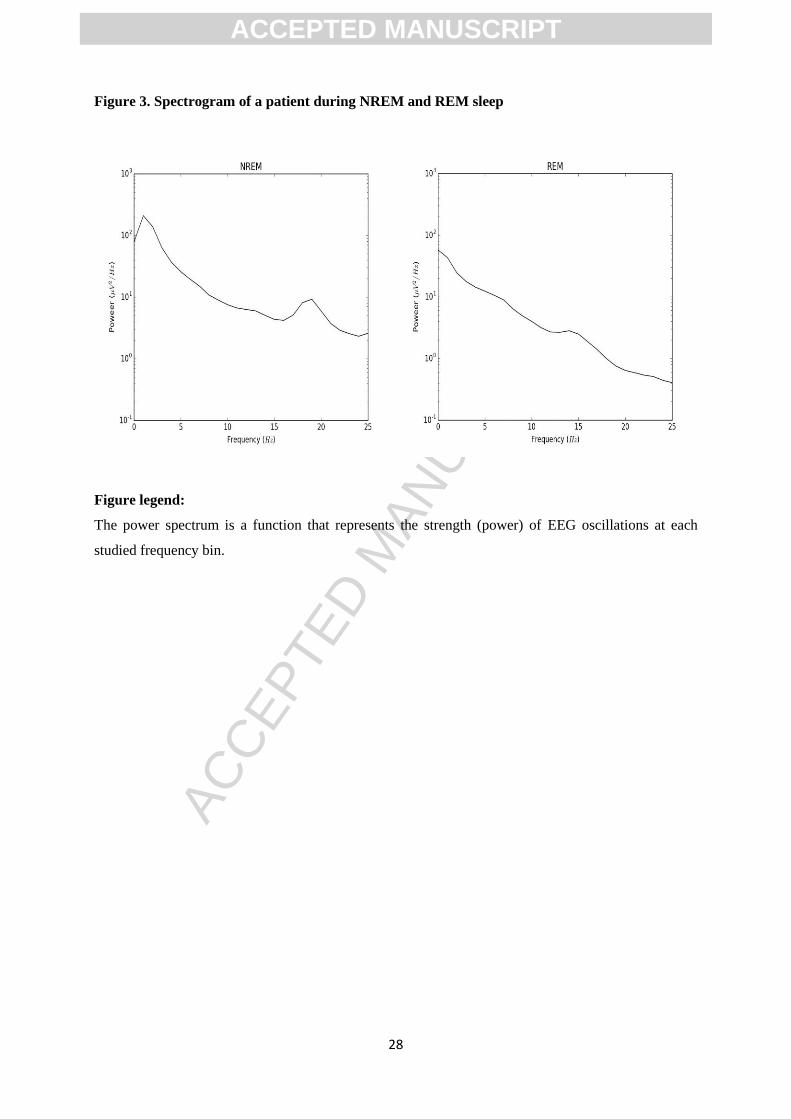
divided by the width of the respective band [48-50] (With an illustrative aim we included a spectral
band picture (Figure 3) of a patient and we summerized the different frequency bands in Table A.2).
The algorithms were based on the NumPy, SciPy, and Matplotlib libraries for scientific computing
[51, 52].
Assessment of depression and comorbidities
We assessed depressive symptoms with the Hungarian version of the Center for Epidemiologic
Studies - Depression (CES-D) scale [53]. This was translated and validated by our team using standard
procedures [54]. This questionnaire contains 20 items that ask participants to grade how frequently
their complaints occured (rarely, 1-2 days, 3-4 days, 5-7 days) within the last week. The total CES-D
score was used to describe psychological distress in the sample.
Comorbidity was assessed by the modified Charlson Comorbidity Index [55] completed by the main
responsible transplant physician of the participant. Information about medication use was obtained
from the questionnaires and the medical charts.
Laboratory data
Laboratory data were extracted from the medical charts, including blood hemoglobin, serum albumin
and creatinine. Estimated glomerular filtration rate (eGFR) was calculated using the ‘‘4-variable’’
CKD-EPI (Chronic Kidney Disease EPIdemiology collaboration) formula [56]. All laboratory data
was within a month of the sleep study.
Transplantation and donor related data
Transplantation-related information collected included current medications, transplant and dialysis
‘‘vintage’’ (i.e., time elapsed since transplantation or time spent on dialysis prior to transplantation),
history of acute rejection, age and sex of donor and history of delayed graft function. Time elapsed
since the initiation of the first treatment for ESKD - cumulative ESKD time - was also calculated.
Standard maintenance IS therapy generally consisted of prednisolone, either cyclosporine A
microemulsion formulation or tacrolimus, combined with mycophenolate mofetil or azathioprine,
everolimus or sirolimus. All enrolled kTx recipients were receiving maintenance IS therapy during our
study.
ACCEPTED MANUSCRIPT
ACC
EPTE
D M
ANU
SCR
IPT
7
Ethics approval
The study was approved by the Research Ethics Board of the Semmelweis University (4/2007). Before
enrollment, patients received detailed verbal and written information about the aims and protocol of
the study and signed an informed consent.
Statistical analysis
Statistical analysis was carried out using STATA 13.0 software. Continuous variables were compared
using Student’s t-test or the Mann-Whitney U test, as appropriate. Categorical variables were analyzed
using the chi-square test or Fisher's exact test where the observation numbers were low. Correlation
analysis was performed using Pearson and Spearman rank correlation analysis.
We analyzed the association between the AIS score and the PSG macrostructure parameters and
frequency power spectra with multivariable linear regression. The models were built with the sleep
parameter as dependent variable and the AIS score as independent variable. At first step we included
the AIS score, age, sex and graft function into Model 1. Additionally the CES-D score and hypnotic
medication use variables were also included into Model 2. We selected the covariables based on
theoretical considerations.
We used transformations (square root – SOL; logarithmic – WASO, power spectra) to achieve normal
distribution of the variables where it was necessary. In all statistics, two-sided tests were used and
p<0.05 was considered statistically significant.
We also performed multivariable analyses of sleep macro- and microstructure versus AIS score
including additional covariables (AHI, PLMI, Charlson Comorbidity Index, IS medications - data not
shown) and these variables did not alter the results considerably. Thus, we decided not to include these
analyses in the present report.
Results
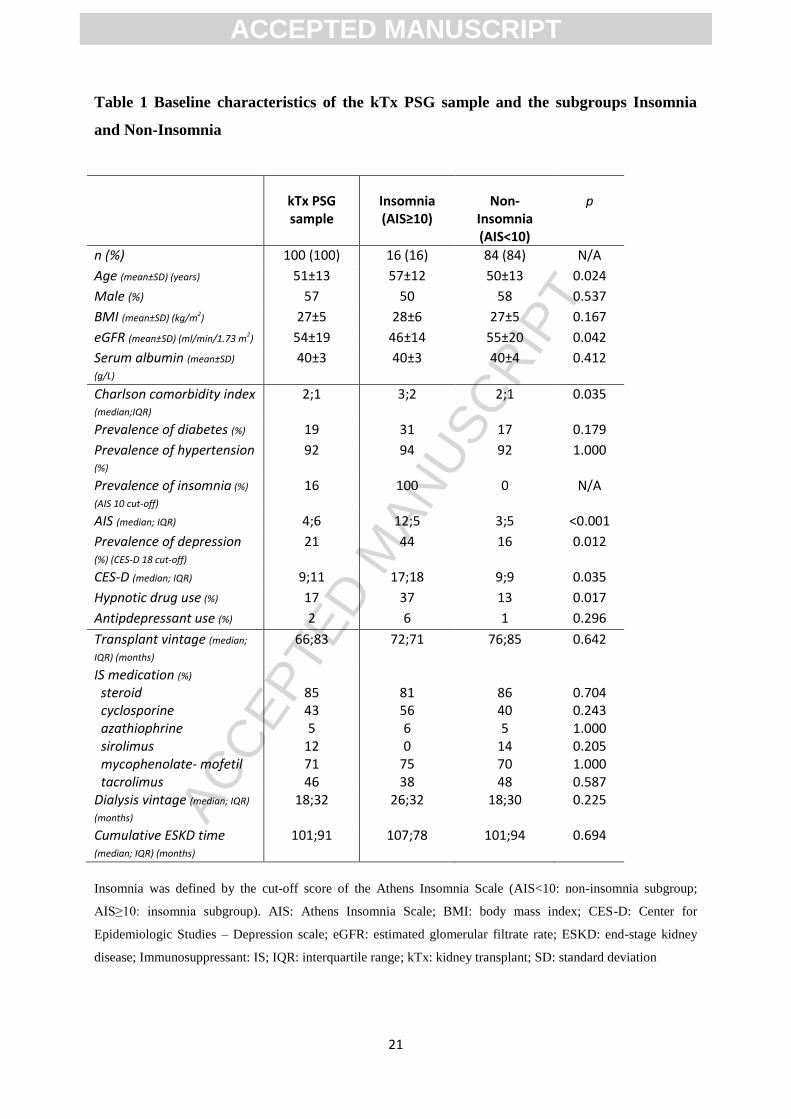
The demographic and laboratory parameters, comorbid conditions and transplantation related data of
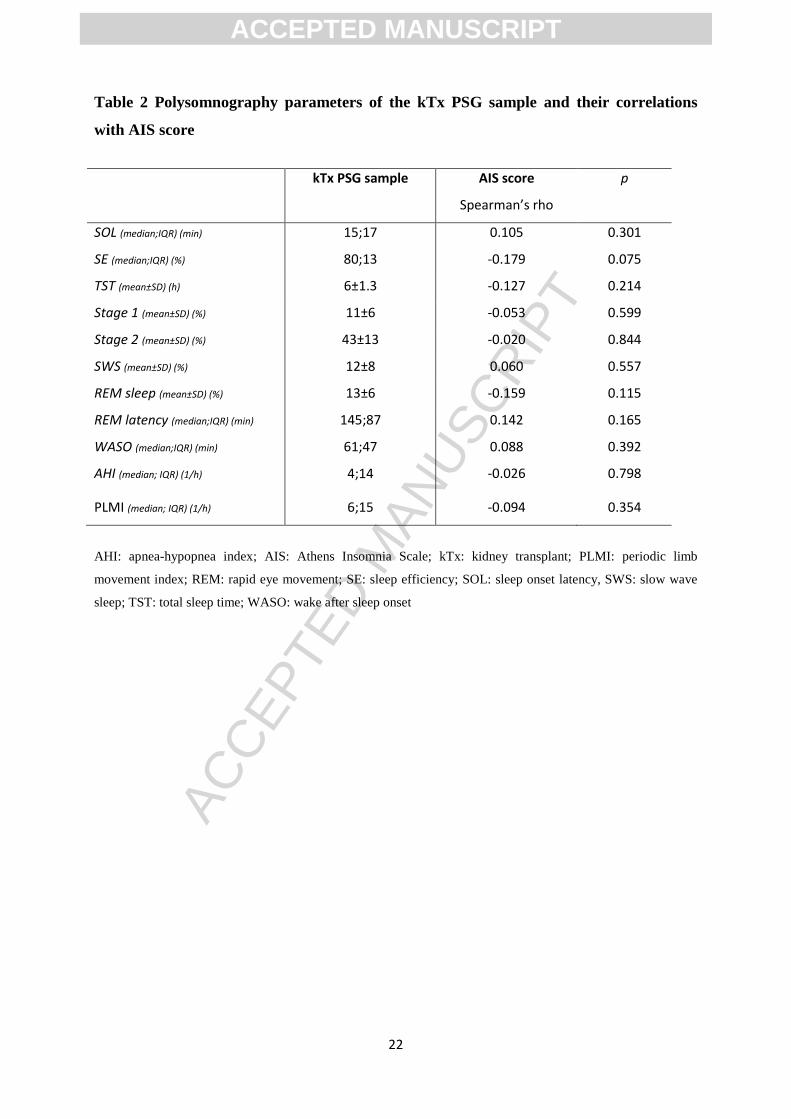
the ’’kTx PSG sample” are presented in Table 1. Descriptive data of sleep macrostructure parameters
are presented in Table 2.
Prevalence and severity of insomnia symptoms and their associations with descriptive and sleep
architecture parameters
The median (IQR) AIS score was 4 (6) in the ‘’kTx PSG sample’’ (Table 1). Sixteen percent of the
kTx recipients had high risk of insomnia based on the AIS cut-off score. Seventeen percent of the
patients were using hypnotic medication.
ACCEPTED MANUSCRIPT
ACC
EPTE
D M
ANU
SCR
IPT
8
High risk of insomnia was significantly associated with older age, worse kidney function (lower
estimated glomerular filtration rate [eGFR]), higher number of comorbidities, higher prevalence of
hypnotic drug use and presence of depression and severity of depressive symptoms (Table 1). These
associations were analysed and discussed in more details in our previous publication about a larger
sample of kTx recipients (n = 884) [3].
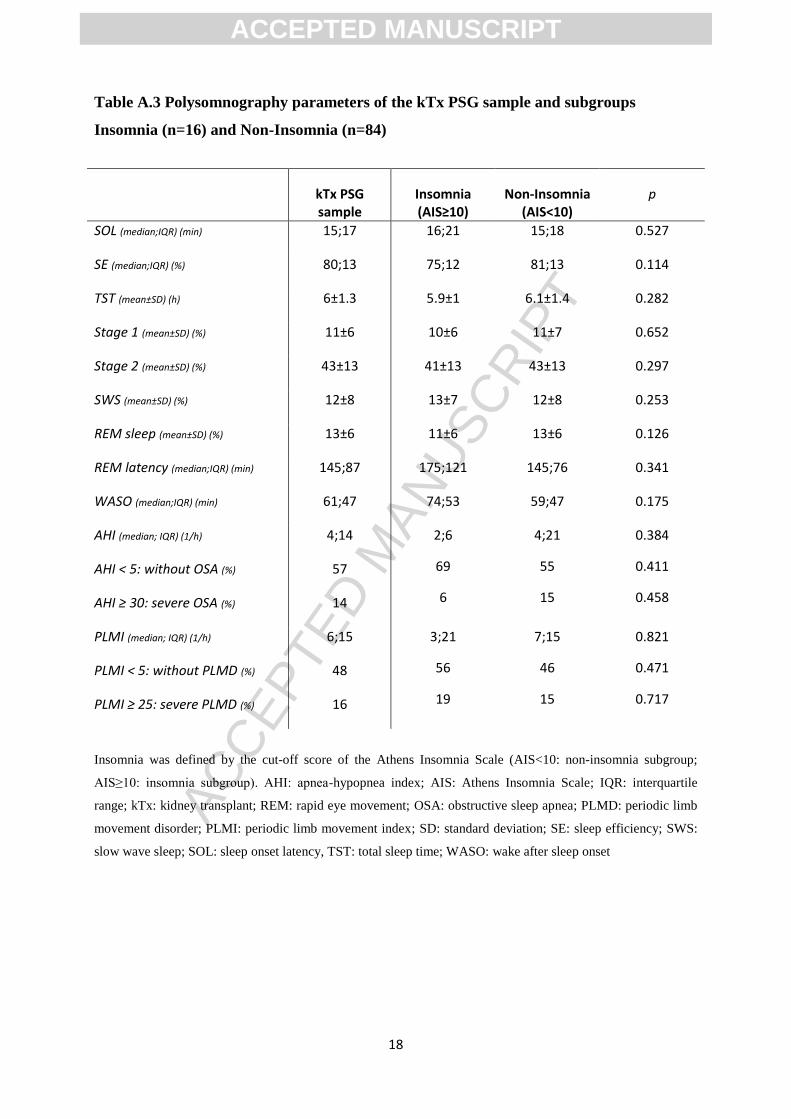
High risk for insomnia was not associated with sleep macrostructure parameters in our sample (Table
A.3). However, there was a trend towards a negative correlation between the AIS score and SE (r= -
0.178; p= 0.075) (Table 2). No other associations were present between the AIS score and sleep
macrostructure.
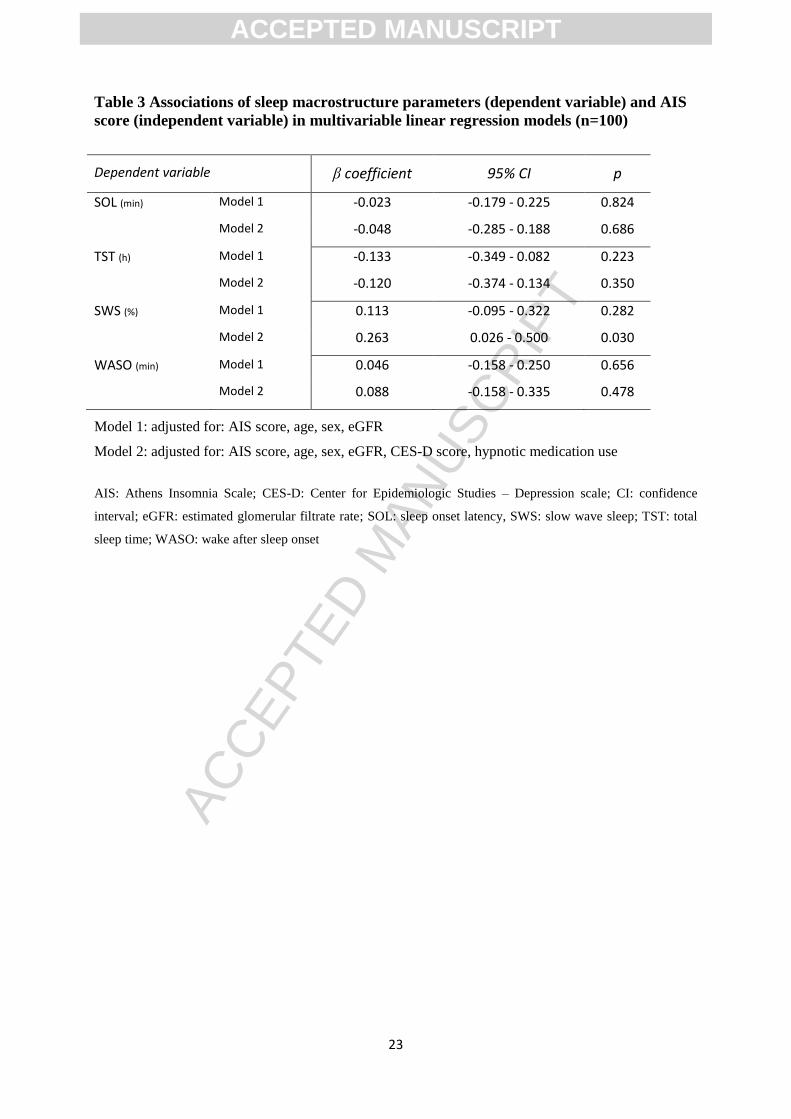
Multivariable analysis of insomnia symptoms versus sleep macrostructure
We analyzed the selected sleep macrostructure parameters with multivariable linear regression (Table
3). After controlling for potential confounders (Model 1: age, sex, eGFR and Model 2: age, sex, eGFR,
CES-D, hypnotic medication use) higher AIS score was significantly associated with higher
proportion of SWS (β: 0.263; CI: 0.026 - 0.500; p = 0.030). AIS score was not associated with SOL,
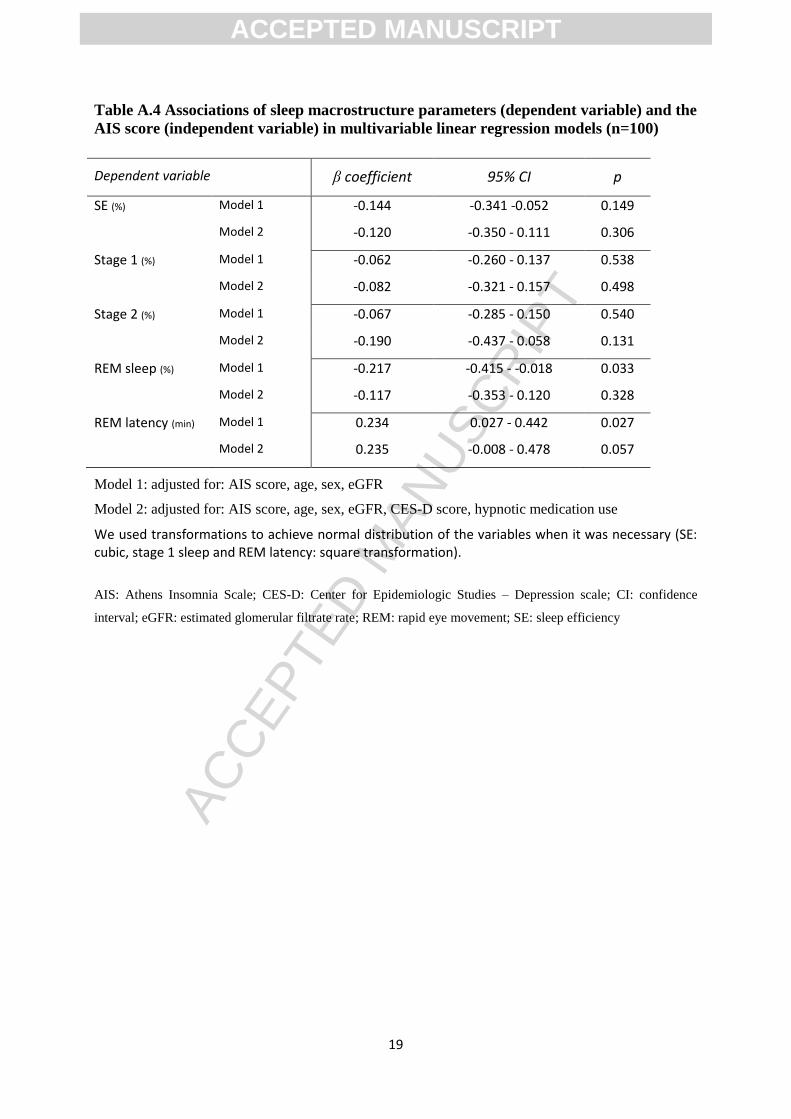
TST or WASO in our sample. (With an explorative aim we also analyzed other sleep parameters in
multivariable analysis. The results are presented in Table A.4).
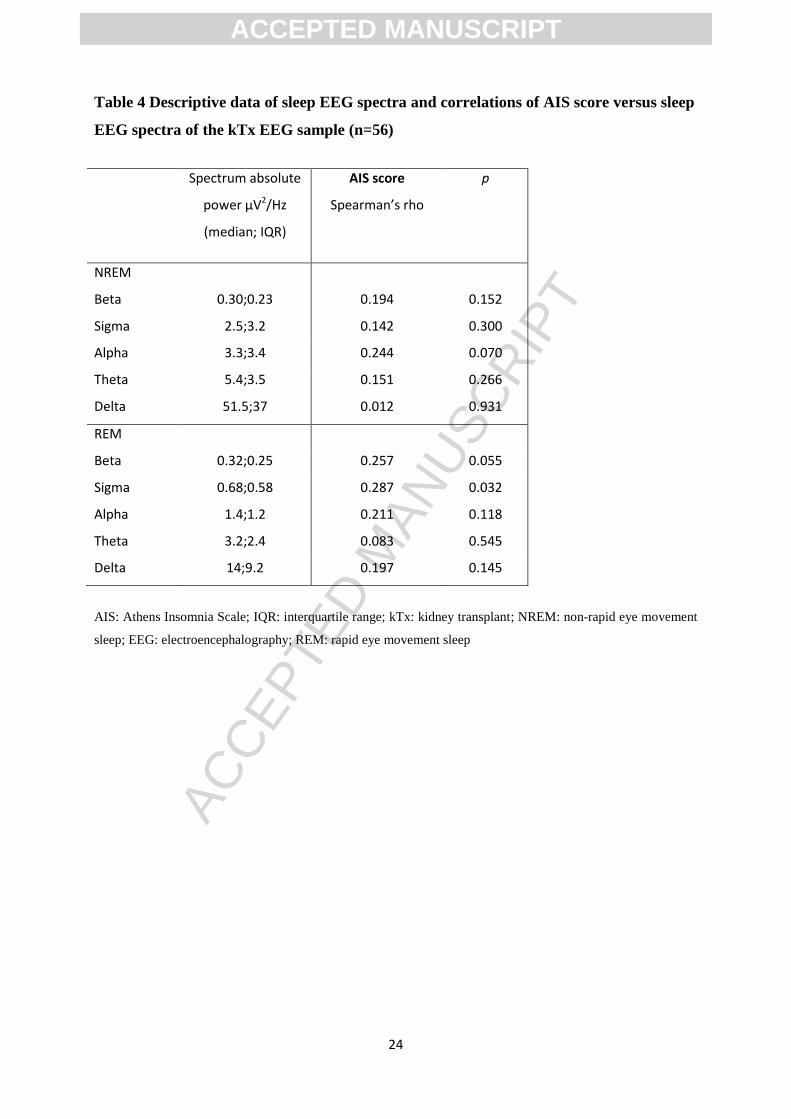
Associations of insomnia symptoms and sleep EEG spectra
In the next step we analyzed the association between AIS score and absolute power spectra (Table 4).
The AIS score significantly correlated with the REM sigma frequency band (r=0.287; p=0.032) and
there were trends towards a positive correlation with REM beta (r=0.257; p=0.055) and NREM alpha
(r=0.244; p=0.070). The AIS score was not associated with power spectra of NREM beta, NREM delta
or REM delta in the univariable analysis.
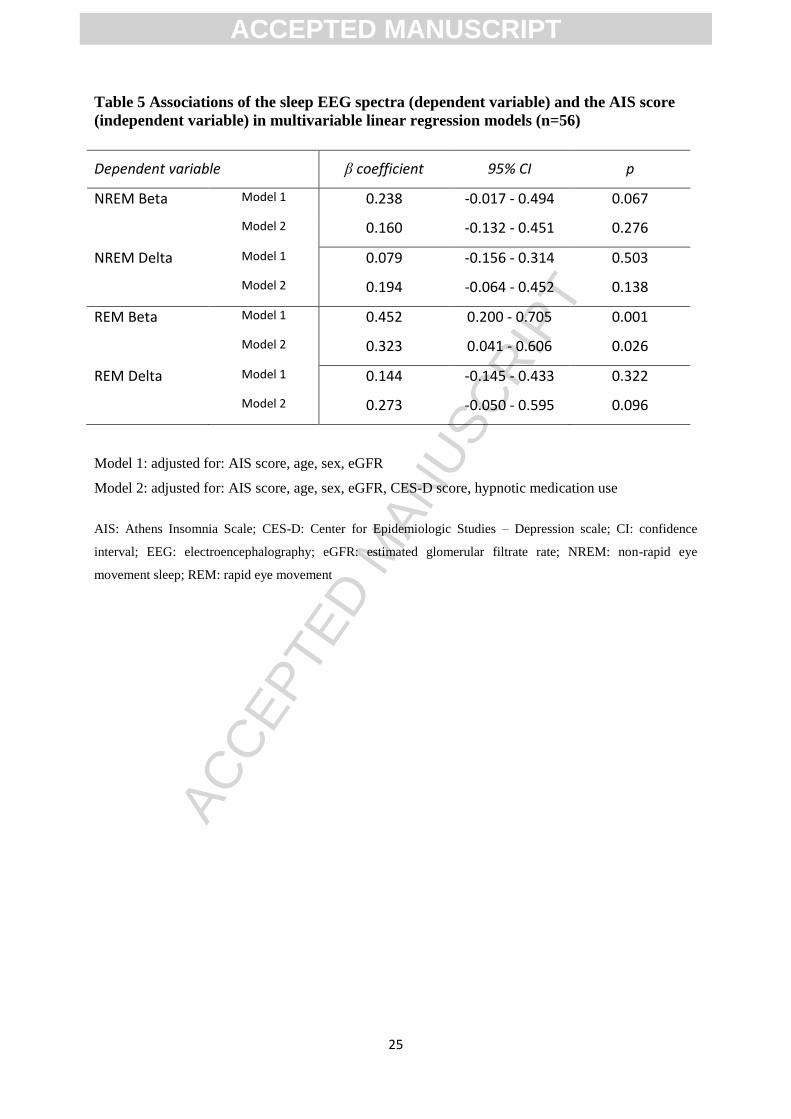
We further analyzed the association of beta and delta power spectra with the AIS score in
multivariable regression models (Table 5). After adjusting for covariables the AIS score was
independently associated with higher REM beta (Model 2, β: 0.323; CI: 0.041 - 0.606; p= 0.026).
Power spectra of NREM beta and delta or REM delta were not associated with AIS score (Table 5).
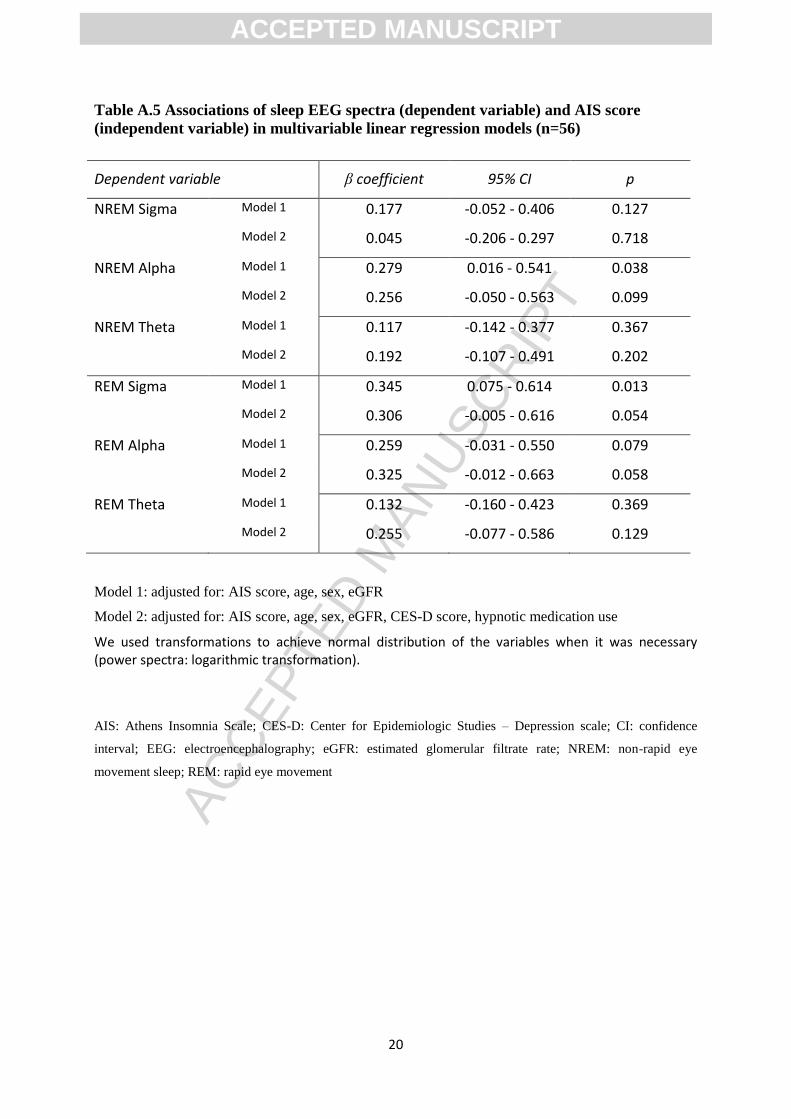
(With an explorative aim we also analyzed other frequency bands in multivariable analysis. The results
are presented in Table A.5.)
Discussion
This is the first study analyzing detailed sleep architecture and sleep EEG activity associated
with insomnia symptoms in kTx recipients. Our main finding is that the severity of insomnia
symptoms is associated with higher amount of SWS and higher beta power during REM sleep.
ACCEPTED MANUSCRIPT
ACC
EPTE
D M
ANU
SCR
IPT
9
While there is a growing literature about the importance of subjective sleep quality among kTx
recipients [3, 4, 12, 57], only limited information has been published about the objectively measured
sleep characteristics in this population. Three prospective studies have reported on the change of sleep
disordered breathing before and after kidney transplantation [16-18]. These studies yielded
inconsistent results regarding the improvement of sleep architecture following kidney transplantation
and reported incomplete data of sleep macrostructure parameters. In the studies which reported SOL
[16, 17], TST [16], SWS [16-18] and WASO [17] the values were comparable with our findings.
Additionally, in our previous report we presented data about the severity of depressive symptoms and
its associations with sleep macrostructure among kTx recipients [15].
To gain insight to the sleep characteristics of kTx recipients associated with insomnia
symptoms first we analyzed sleep macrostructure. Contrary to our expectations, univariable analysis
did not reveal any significant associations between insomnia symptoms and sleep macrostructure.
Similarly, SOL, TST and WASO parameters were not associated with symptoms of insomnia in
multivariable analysis, either. Similar negative findings were also reported in patients with different
medical conditions comorbid with insomnia [58].
Although the previously mentioned parameters of sleep macrostructure were not associated
with symptoms of insomnia in the current study, contrary to our expectations, higher proportion of
SWS was associated with higher AIS score in the fully adjusted multivariable model. In the general
population insomnia has been characterized by lower homeostatic sleep pressure as indicated by less
SWS [24, 28]. Our results, however, suggest an increased homeostatic sleep pressure associated with
higher subjective insomnia complaints in kTx patients. This may be either a homeostatic
rebound/compensation to a less restorative sleep quality experienced on a chronic basis by the patients
or may be due to intrinsic circadian factors, subclinical inflammation and/or medication.
Unfortunately, our study design does not enable us to answer this question and further studies are
needed to determine if an increased proportion of SWS is related to the treatment modality itself or to
other biological factors related to the kidney disease.
The so-called ,,paradoxical” increase of SWS was also described in patients with chronic
fatigue syndrome [59, 60], and this might reflect an attempt to compensate an impaired process
reflected in ultraslow oscillations [60, 61]. Besides insomnia symptoms, prevalence of fatigue is also
very high among ESKD and in a study worse subjective sleep quality and higher proportion of stage 2
sleep (suggesting higher sleep spindling – sleep protection of NREM sleep) was associated with higher
fatigue score [62]. SWS was not different between the high fatigue versus low fatigue groups,
however, associations of fatigue with sleep macrostructure parameters were not analysed in
multivariable analysis.
Proportion of SWS varies among patients with different stages of CKD and different treatment
modalities for ESKD. In a large study of more than 1,740 participants with intact or various degree of
impaired renal function, patients with more advanced CKD tended to have shorter SWS duration after
ACCEPTED MANUSCRIPT
ACC
EPTE
D M
ANU
SCR
IPT
10
adjustment for age, sex, sleep disordered breathing severity and PLMI [63]. In another work ESKD
patients treated with ambulatory peritoneal dialysis (APD) had higher proportion of SWS (after
adjustment for age, sex, race and body mass index) compared to patients with earlier stages of CKD,
despite that APD patients had worse subjective sleep quality [64]. In two prospective PSG studies the
proportion of stage 3 sleep was significantly higher after kTx compared to hemodialysis [17, 18],
however, in one study SWS significantly decreased after kTx [16].
In sleep microstructure analysis we could not confirm the association of higher homeostatic
sleep pressure with insomnia symptoms: NREM delta power was not associated with AIS in our
sample. However, this might be due to methodological reasons. Here we analysed NREM stages 2,3
and 4 combined and not SWS separately. Furthermore, we had a 5 channel EEG, however, it is known
that differences in the power spectrum is not only present at central sites. According to literature
additional recording for example at frontal sites might rather be informative to capture localized
association of insomnia symptoms and delta EEG activity [25, 26].
In this analysis we also hypothetized that higher wake-like EEG activity (beta) is associated
with more severe insomnia symptoms among this population. Interestingly, we did not observe an
association between AIS score and beta frequency band during NREM sleep, however, during REM
sleep higher beta activity was independently associated with insomnia symptoms after adjustment for
covariables. Increased beta power during REM sleep was also found in the work of Merica et al. who
investigated primary insomnia subjects [26].
A growing interest has recently been directed to assess the association between ’’REM
instability” and insomnia [65]. According to this theory microarousals or wake intrusions preceding or
during REM sleep or relative cortical activation during REM could contribute to altered time-
perception [25, 30, 66]. This, in turn, might worsen the perception of sleep and lead to sleep-
maintenance insomnia complaints. Interestingly, sleep-maintenance insomnia based on the AIS score
was found to be the most frequent subtype of insomnia among kTx recipients in our previous work [3].
Additionally, we found that prolonged REM latency and less REM sleep were associated with the
severity of insomnia symptoms after controlling for age, sex and graft function in multivariable
models (data was presented in the Appendix). After additional adjustment for depressive symptoms
and hypnotic medication use these associations did not remain significant, however, this might be due
to the relatively small sample size and consequent low statistical power of our study. These results
together with the association of REM beta activity and insomnia symptoms may indicate higher
instability of REM sleep among kTx recipients with more severe symptoms.
Several limitations of this study should be considered when interpreting our results. First of
all, admittedly, our study sample was quite heterogeneous. Importantly, we did not exclude patients
with obstructive sleep apnea or periodic limb movement disorder from our analysis. Although in
studies of insomnia disorder the presence of these sleep disorders usually represent exclusion criteria,
sleep disorders in kTx recipients in most cases are present simultaneously and excluding those patients
ACCEPTED MANUSCRIPT
ACC
EPTE
D M
ANU
SCR
IPT
11
would have largely limited enrollment. Furthermore, we wanted to study sleep characteristics in a
’’real life” clinical patient population on a sample which is representative to the total clinic population.
For these reasons we decided to select the patients with random sampling and considered obstructive
sleep apnea or periodic limb movement disorder as potential confounders. (We adjusted the models for
AHI and PLMI as well and these variables did not alter the results considerably - data was not shown).
Second, we assessed only a one-night PSG, and for this reason first-night effect might have
influenced our findings. We did not offer a two-night assessment to enhance acceptability and
participation in the study. However, the lack of an adaptation night might be one of the reasons why
the EEG recordings contained substantial amount of artefact.
Third, patients in this study were taking multiple medications and this might influenced our
results. We have very little specific knowledge about the effect of IS treatment on EEG spectra and on
sleep structure. As we mentioned in Methods, we also performed the analysis including IS medications
as additional covariables in the multivariable models, and they did not alter the results of this report.
Additionally, 17 % of the patients were taking sleeping pills that can modify EEG activity during sleep
[67, 68]. For this reason we statistically controlled our models for hypnotic medication use.
Lastly, we analyzed sleep microstructure only in a subgroup of patients of the “kTx PSG
sample”. We excluded 44 EEG-s prior to power spectral analysis based on the quality of the EEG
recordings. This might have introduced selection bias since patients with worse sleep may “produce”
lower quality sleep recordings (patients excluded from the power spectral analysis did have
significantly lower SE and shorter TST - data was not shown). However, clinical and socio-
demographic characteristics of excluded subjects were comparable to those remaining in the final
“kTx EEG sample” (Table A.1), suggesting that the results are still representative to the “total clinic
population”.
In summary, in our present report insomnia symptom severity was associated with higher
proportion of SWS and higher REM beta power in the fully adjusted models. (Other parameters of
sleep macrostructure and beta and delta power during NREM sleep were not associated with insomnia
symptoms among kTx recipients.) The observed alterations might be signs of an impaired homeostatic
sleep regulation and instability of REM sleep associated with insomnia symptoms among this
population.
This study is the first analysis that reports sleep architecture in a relatively high number of kTx
recipients and its association with insomnia symptoms. Most importantly we would like to draw
attention to the significance of sleep complaints among this population and highlight that insomnia
symptoms are associated with different alterations in sleep architecture than in the non-kidney disease
population. Other works are needed to replicate our findings and to explore in more details whether
higher homeostatic sleep pressure associated with insomnia symptoms is due to some yet undefined
factors (p.e: fatigue, treatment modality, medications, subclinical inflammation). Future research
should also investigate whether appropriate interventions to improve sleep (such as sleep hygiene,
ACCEPTED MANUSCRIPT
ACC
EPTE
D M
ANU
SCR
IPT
12
encouraging siesta, relaxation before sleep or cognitive behavioural therapy for insomnia, CBT-i)
would change these observed sleep parameters and also improve subjective sleep complaints of kTx
recipients.
Part of this manuscript has been accepted as poster for the 5th annual conference of the European
Association of Psychosomatic Medicine.
ACCEPTED MANUSCRIPT
ACC
EPTE
D M
ANU
SCR
IPT
13
References:
1. Iliescu, E.A., K.E. Yeates, and D.C. Holland, Quality of sleep in patients with chronic kidney disease. Nephrol Dial Transplant, 2004. 19(1): p. 95-9.
2. Mucsi, I., et al., Sleep disorders and illness intrusiveness in patients on chronic dialysis. Nephrol Dial Transplant, 2004. 19(7): p. 1815-22.
3. Novak, M., et al., Chronic insomnia in kidney transplant recipients. Am J Kidney Dis, 2006. 47(4): p. 655-65.
4. Liaveri, P.G., et al., Quality of sleep in renal transplant recipients and patients on hemodialysis. J Psychosom Res, 2017. 93: p. 96-101.
5. Unruh, M.L., et al., Restless legs symptoms among incident dialysis patients: association with lower quality of life and shorter survival. Am J Kidney Dis, 2004. 43(5): p. 900-9.
6. Gigli, G.L., et al., Restless legs syndrome in end-stage renal disease. Sleep Med, 2004. 5(3): p. 309-15.
7. Molnar, M.Z., et al., Restless Legs Syndrome in patients after renal transplantation. Am J Kidney Dis, 2005. 45(2): p. 388-96.
8. Chen, W.C., et al., Sleep behavior disorders in a large cohort of chinese (Taiwanese) patients maintained by long-term hemodialysis. Am J Kidney Dis, 2006. 48(2): p. 277-84.
9. de Oliveira Rodrigues, C.J., et al., Relationship among end-stage renal disease, hypertension, and sleep apnea in nondiabetic dialysis patients. Am J Hypertens, 2005. 18(2 Pt 1): p. 152-7.
10. Molnar, M.Z., et al., High prevalence of patients with a high risk for obstructive sleep apnoea syndrome after kidney transplantation--association with declining renal function. Nephrol Dial Transplant, 2007. 22(9): p. 2686-92.
11. Russcher, M., et al., The effects of kidney transplantation on sleep, melatonin, circadian rhythm and quality of life in kidney transplant recipients and living donors. Nephron, 2015. 129(1): p. 6-15.
12. Sabbatini, M., et al., Sleep quality in renal transplant patients: a never investigated problem. Nephrol Dial Transplant, 2005. 20(1): p. 194-8.
13. Rodrigue, J.R., et al., A cross-sectional study of fatigue and sleep quality before and after kidney transplantation. Clin Transplant, 2011. 25(1): p. E13-21.
14. Sabbatini, M., et al., Renal transplantation and sleep: a new life is not enough. J Nephrol, 2008. 21 Suppl 13: p. S97-101.
15. Ronai, K.Z., et al., Depressive Symptoms are Associated with Objectively Measured Sleep Parameters in Kidney Transplant Recipients. J Clin Sleep Med, 2017.
16. Beecroft, J.M., et al., Impact of kidney transplantation on sleep apnoea in patients with end-stage renal disease. Nephrol Dial Transplant, 2007. 22(10): p. 3028-33.
17. Jurado-Gamez, B., et al., Kidney transplantation improves sleep-related breathing in hemodialysis patients. Blood Purif, 2008. 26(6): p. 485-90.
18. Rodrigues, C.J., et al., Sleep-disordered breathing changes after kidney transplantation: a polysomnographic study. Nephrol Dial Transplant, 2010. 25(6): p. 2011-5.
19. Fornadi, K., et al., Sleep apnea is not associated with worse outcomes in kidney transplant recipients. Sci Rep, 2014. 4: p. 6987.
20. American Academy of Sleep Medicine. International Classification of Sleep Disorders: Diagnostic and Coding Manual. 3rd ed. Darien, IL American Academy of Sleep Medicine, 2014.
21. American Psychiatric Association: Diagnostic and Statistical Manual of Mental Disorders, Fifth Edition. Arlington, VA, American Psychiatric Association, 2013.
22. Molnar, M.Z., M. Novak, and I. Mucsi, Sleep disorders and quality of life in renal transplant recipients. Int Urol Nephrol, 2009. 41(2): p. 373-82.
ACCEPTED MANUSCRIPT
ACC
EPTE
D M
ANU
SCR
IPT
14
23. Lindner, A.V., et al., Insomnia in Patients With Chronic Kidney Disease. Semin Nephrol, 2015. 35(4): p. 359-72.
24. Huang, L., et al., Polysomnographically determined sleep and body mass index in patients with insomnia. Psychiatry Res, 2013. 209(3): p. 540-4.
25. St-Jean, G., et al., REM and NREM power spectral analysis on two consecutive nights in psychophysiological and paradoxical insomnia sufferers. Int J Psychophysiol, 2013. 89(2): p. 181-94.
26. Merica, H., R. Blois, and J.M. Gaillard, Spectral characteristics of sleep EEG in chronic insomnia. Eur J Neurosci, 1998. 10(5): p. 1826-34.
27. Spiegelhalder, K., et al., Increased EEG sigma and beta power during NREM sleep in primary insomnia. Biol Psychol, 2012. 91(3): p. 329-33.
28. Pigeon, W.R. and M.L. Perlis, Sleep homeostasis in primary insomnia. Sleep Med Rev, 2006. 10(4): p. 247-54.
29. Krystal, A.D., et al., NREM sleep EEG frequency spectral correlates of sleep complaints in primary insomnia subtypes. Sleep, 2002. 25(6): p. 630-40.
30. Perusse, A.D., et al., REM sleep as a potential indicator of hyperarousal in psychophysiological and paradoxical insomnia sufferers. Int J Psychophysiol, 2015. 95(3): p. 372-8.
31. Riemann, D., et al., The hyperarousal model of insomnia: a review of the concept and its evidence. Sleep Med Rev, 2010. 14(1): p. 19-31.
32. Levenson, J.C., D.B. Kay, and D.J. Buysse, The pathophysiology of insomnia. Chest, 2015. 147(4): p. 1179-92.
33. Molnar, M.Z., et al., Sleep apnea is associated with cardiovascular risk factors among kidney transplant patients. Clin J Am Soc Nephrol, 2010. 5(1): p. 125-32.
34. Molnar, M.Z., et al., Association between the malnutrition-inflammation score and post-transplant anaemia. Nephrol Dial Transplant, 2011. 26(6): p. 2000-6.
35. Molnar, M.Z., et al., Evaluation of the malnutrition-inflammation score in kidney transplant recipients. Am J Kidney Dis, 2010. 56(1): p. 102-11.
36. Kovesdy, C.P., et al., Body mass index, waist circumference and mortality in kidney transplant recipients. Am J Transplant, 2010. 10(12): p. 2644-51.
37. Kovesdy, C.P., et al., Associations between serum leptin level and bone turnover in kidney transplant recipients. Clin J Am Soc Nephrol, 2010. 5(12): p. 2297-304.
38. Kovesdy, C.P., et al., Association of serum phosphorus level with anemia in kidney transplant recipients. Transplantation, 2011. 91(8): p. 875-82.
39. Molnar, M.Z., et al., Association of the malnutrition-inflammation score with clinical outcomes in kidney transplant recipients. Am J Kidney Dis, 2011. 58(1): p. 101-8.
40. Fornadi, K., et al., Lack of association between objectively assessed sleep disorders and inflammatory markers among kidney transplant recipients. Int Urol Nephrol, 2012. 44(2): p. 607-17.
41. Soldatos, C.R., D.G. Dikeos, and T.J. Paparrigopoulos, Athens Insomnia Scale: validation of an instrument based on ICD-10 criteria. J Psychosom Res, 2000. 48(6): p. 555-60.
42. Soldatos, C.R., D.G. Dikeos, and T.J. Paparrigopoulos, The diagnostic validity of the Athens Insomnia Scale. J Psychosom Res, 2003. 55(3): p. 263-7.
43. Novak, M., et al., Increased utilization of health services by insomniacs--an epidemiological perspective. J Psychosom Res, 2004. 56(5): p. 527-36.
44. Rechtschaffen A, K.A., A manual of standardized terminology, techniques and scoring system for sleep stages of human subjects. Brain Information Service/Brain Research Institute, University of California, Los Angeles, 1968.
45. Sleep-related breathing disorders in adults: recommendations for syndrome definition and measurement techniques in clinical research. The Report of an American Academy of Sleep Medicine Task Force. Sleep, 1999. 22(5): p. 667-89.
46. Walters, A.S., et al., The scoring of movements in sleep. J Clin Sleep Med, 2007. 3(2): p. 155-67.
ACCEPTED MANUSCRIPT
ACC
EPTE
D M
ANU
SCR
IPT
15
47. Kis, A., et al., Development of a non-invasive polysomnography technique for dogs (Canis familiaris). Physiol Behav, 2014. 130: p. 149-56.
48. Lazar, A.S., et al., Reduced fronto-cortical brain connectivity during NREM sleep in Asperger syndrome: an EEG spectral and phase coherence study. Clin Neurophysiol, 2010. 121(11): p. 1844-54.
49. Lazar, A.S., Z.I. Lazar, and D.J. Dijk, Circadian regulation of slow waves in human sleep: Topographical aspects. Neuroimage, 2015. 116: p. 123-34.
50. Lazar, A.S., et al., Sleep deficits but no metabolic deficits in premanifest Huntington's disease. Ann Neurol, 2015. 78(4): p. 630-48.
51. Hunter, J.D., Matplotlib: A 2D Graphics Environment. Comput Sci Eng, 2007. 9: p. 90-95. 52. Oliphant, T.E., Python for Scientific Computing. Comput Sci Eng, 2007. 9: p. 10-20. 53. Radloff L., The CES-D Scale — A self-report depression scale for research in the general
population. . Appl Psychol Measure 1977. 1: p. 385–401. 54. Beaton, D.E., et al., Guidelines for the process of cross-cultural adaptation of self-report
measures. Spine (Phila Pa 1976), 2000. 25(24): p. 3186-91. 55. Jassal, S.V., D.E. Schaubel, and S.S. Fenton, Baseline comorbidity in kidney transplant
recipients: a comparison of comorbidity indices. Am J Kidney Dis, 2005. 46(1): p. 136-42. 56. Levey, A.S., et al., A new equation to estimate glomerular filtration rate. Ann Intern Med,
2009. 150(9): p. 604-12. 57. Williams, J.M., et al., A Novel Application of a Biopsychosocial Theory in the Understanding of
Disturbed Sleep before and after Kidney Transplantation. J Clin Sleep Med, 2015. 12(2): p. 247-56.
58. Budhiraja, R., et al., Prevalence and polysomnographic correlates of insomnia comorbid with medical disorders. Sleep, 2011. 34(7): p. 859-67.
59. Neu, D., et al., High slow-wave sleep and low-light sleep: chronic fatigue syndrome is not likely to be a primary sleep disorder. J Clin Neurophysiol, 2009. 26(3): p. 207-12.
60. Le Bon, O., et al., Ultra-slow delta power in chronic fatigue syndrome. Psychiatry Res, 2012. 200(2-3): p. 742-7.
61. Neu, D., et al., Slow wave sleep in the chronically fatigued: Power spectra distribution patterns in chronic fatigue syndrome and primary insomnia. Clin Neurophysiol, 2015. 126(10): p. 1926-33.
62. Jhamb, M., et al., Prevalence and correlates of fatigue in chronic kidney disease and end-stage renal disease: are sleep disorders a key to understanding fatigue? Am J Nephrol, 2013. 38(6): p. 489-95.
63. Ogna, A., et al., Sleep Characteristics in Early Stages of Chronic Kidney Disease in the HypnoLaus Cohort. Sleep, 2016. 39(4): p. 945-53.
64. Roumelioti, M.E., et al., Objective and subjective sleep disorders in automated peritoneal dialysis. Can J Kidney Health Dis, 2016. 3: p. 6.
65. Riemann, D., et al., REM sleep instability--a new pathway for insomnia? Pharmacopsychiatry, 2012. 45(5): p. 167-76.
66. Feige, B., et al., Does REM sleep contribute to subjective wake time in primary insomnia? A comparison of polysomnographic and subjective sleep in 100 patients. J Sleep Res, 2008. 17(2): p. 180-90.
67. Borbely, A.A., et al., Effect of benzodiazepine hypnotics on all-night sleep EEG spectra. Hum Neurobiol, 1985. 4(3): p. 189-94.
68. Tan, X., et al., Long-, intermediate- and short-acting benzodiazepine effects on human sleep EEG spectra. Psychiatry Clin Neurosci, 2003. 57(1): p. 97-104.
ACCEPTED MANUSCRIPT
ACC
EPTE
D M
ANU
SCR
IPT
16
Table A.1 Descriptive data of the kTx EEG sample (n=56) and excluded patients (n=44)
kTx EEG sample
Excluded patients
p
n 56 44 N/A
Age (mean±SD) (years) 49±13 53±12 0.068
Male (%) 62.5 50 0.210
BMI (mean±SD) (kg/m2) 26±4 27±5 0.165
eGFR (mean±SD) (ml/min/1.73 m2) 52±18 55±21 0.218
Serum albumin (mean±SD) (g/L) 40±4 41±3 0.042
Charlson comorbidity index (median;IQR)
2;1 2;1 0.585
Prevalence of diabetes (%) 23 14 0.226
Prevalence of hypertension (%)
89 95 0.460
Prevalence of insomnia (%)
(AIS 10 cut-off) 18 14 0.568
AIS (median; IQR) 4;8 3.5;4 0.735
Prevalence of depression (%)
(CES-D 18 cut-off) 25 14 0.178
CES-D (median; IQR) 10;12 9;9 0.260
Hypnotic drug usage (%) 23 9 0.106
Antidepressant usage (%) 2 2 1.000
Transplant vintage (median;
IQR) (months) 63;78 77;84.5 0.718
IS medication (%) steroid cyclosporine azathiophrine sirolimus mycophenolate- mofetil tacrolimus everolim
86 46 2
12.5 70 43 0
84 39 9
11 73 50 2
0.821 0.435 0.166 1.000 0.736 0.477 0.440
Dialysis vintage (median; IQR)
(months) 22;40.5 15.5;23 0.354
Cumulative ESKD time
(median; IQR) (months) 101;95 100.5;91 0.957
AIS: Athens Insomnia Scale; BMI: body mass index; CES-D: Center for Epidemiologic Studies – Depression
scale; eGFR: estimated glomerular filtrate rate; ESKD: end-stage kidney disease; Immunosuppressant: IS; IQR:
interquartile range; kTx: kidney transplant; SD: standard deviation
ACCEPTED MANUSCRIPT
ACC
EPTE
D M
ANU
SCR
IPT
17
Table A.2 Sleep macro- and microstructure parameters
Sleep macrostructure
parameter
Definition Abbreviation
Sleep Onset Latency Time elapsed from “lights off ” to
the first occurrence of sleep stage 2
SOL
Sleep Efficiency Ratio of total sleep time over the
time spent in bed
SE
Total Sleep Time Time spent asleep TST
Percentage of stage 1 sleep Percentage of stage 1 sleep within
sleep period time (time from sleep
onset until final awakening)
stage 1
Percentage of stage 2 sleep Proportion of stage 2 sleep within
sleep period time
stage 2
Slow Wave Sleep Proportion of stages 3 and 4
combined within sleep period time
SWS
REM latency Time elapsed from sleep onset to
the first occurence of REM sleep
-
REM percentage Proportion of REM sleep within
sleep period time
REM
Spectral bands Description Frequency
range
delta Typical activity during SWS 0.75-4 Hz
theta Typical activity during stage1 and
2 sleep and REM sleep
4-8 Hz
alpha Typical activity during resting
wakefulness
8-11 Hz
sigma Activity of sleep spindles 11-15 Hz
beta Typical activity during alert
wakefulness
15-25 Hz
ACCEPTED MANUSCRIPT
ACC
EPTE
D M
ANU
SCR
IPT
18
Table A.3 Polysomnography parameters of the kTx PSG sample and subgroups
Insomnia (n=16) and Non-Insomnia (n=84)
kTx PSG sample
Insomnia (AIS≥10)
Non-Insomnia (AIS<10)
p
SOL (median;IQR) (min) 15;17 16;21 15;18 0.527
SE (median;IQR) (%) 80;13 75;12 81;13 0.114
TST (mean±SD) (h) 6±1.3 5.9±1 6.1±1.4 0.282
Stage 1 (mean±SD) (%) 11±6 10±6 11±7 0.652
Stage 2 (mean±SD) (%) 43±13 41±13 43±13 0.297
SWS (mean±SD) (%) 12±8 13±7 12±8 0.253
REM sleep (mean±SD) (%) 13±6 11±6 13±6 0.126
REM latency (median;IQR) (min) 145;87 175;121 145;76 0.341
WASO (median;IQR) (min) 61;47 74;53 59;47 0.175
AHI (median; IQR) (1/h)
AHI < 5: without OSA (%)
AHI ≥ 30: severe OSA (%)
4;14
57
14
2;6
69
6
4;21
55
15
0.384
0.411
0.458
PLMI (median; IQR) (1/h)
PLMI < 5: without PLMD (%)
PLMI ≥ 25: severe PLMD (%)
6;15
48
16
3;21
56
19
7;15
46
15
0.821
0.471
0.717
Insomnia was defined by the cut-off score of the Athens Insomnia Scale (AIS<10: non-insomnia subgroup;
AIS≥10: insomnia subgroup). AHI: apnea-hypopnea index; AIS: Athens Insomnia Scale; IQR: interquartile
range; kTx: kidney transplant; REM: rapid eye movement; OSA: obstructive sleep apnea; PLMD: periodic limb
movement disorder; PLMI: periodic limb movement index; SD: standard deviation; SE: sleep efficiency; SWS:
slow wave sleep; SOL: sleep onset latency, TST: total sleep time; WASO: wake after sleep onset
ACCEPTED MANUSCRIPT
ACC
EPTE
D M
ANU
SCR
IPT
19
Table A.4 Associations of sleep macrostructure parameters (dependent variable) and the
AIS score (independent variable) in multivariable linear regression models (n=100)
Dependent variable β coefficient 95% CI p
SE (%) Model 1 -0.144 -0.341 -0.052 0.149
Model 2 -0.120 -0.350 - 0.111 0.306
Stage 1 (%) Model 1 -0.062 -0.260 - 0.137 0.538
Model 2 -0.082 -0.321 - 0.157 0.498
Stage 2 (%) Model 1 -0.067 -0.285 - 0.150 0.540
Model 2 -0.190 -0.437 - 0.058 0.131
REM sleep (%) Model 1 -0.217 -0.415 - -0.018 0.033
Model 2 -0.117 -0.353 - 0.120 0.328
REM latency (min) Model 1 0.234 0.027 - 0.442 0.027
Model 2 0.235 -0.008 - 0.478 0.057
Model 1: adjusted for: AIS score, age, sex, eGFR
Model 2: adjusted for: AIS score, age, sex, eGFR, CES-D score, hypnotic medication use
We used transformations to achieve normal distribution of the variables when it was necessary (SE: cubic, stage 1 sleep and REM latency: square transformation).
AIS: Athens Insomnia Scale; CES-D: Center for Epidemiologic Studies – Depression scale; CI: confidence
interval; eGFR: estimated glomerular filtrate rate; REM: rapid eye movement; SE: sleep efficiency
ACCEPTED MANUSCRIPT
ACC
EPTE
D M
ANU
SCR
IPT
20
Table A.5 Associations of sleep EEG spectra (dependent variable) and AIS score
(independent variable) in multivariable linear regression models (n=56)
Dependent variable β coefficient 95% CI p
NREM Sigma Model 1 0.177 -0.052 - 0.406 0.127
Model 2 0.045 -0.206 - 0.297 0.718
NREM Alpha Model 1 0.279 0.016 - 0.541 0.038
Model 2 0.256 -0.050 - 0.563 0.099
NREM Theta Model 1 0.117 -0.142 - 0.377 0.367
Model 2 0.192 -0.107 - 0.491 0.202
REM Sigma Model 1 0.345 0.075 - 0.614 0.013
Model 2 0.306 -0.005 - 0.616 0.054
REM Alpha Model 1 0.259 -0.031 - 0.550 0.079
Model 2 0.325 -0.012 - 0.663 0.058
REM Theta Model 1 0.132 -0.160 - 0.423 0.369
Model 2 0.255 -0.077 - 0.586 0.129
Model 1: adjusted for: AIS score, age, sex, eGFR
Model 2: adjusted for: AIS score, age, sex, eGFR, CES-D score, hypnotic medication use
We used transformations to achieve normal distribution of the variables when it was necessary (power spectra: logarithmic transformation).
AIS: Athens Insomnia Scale; CES-D: Center for Epidemiologic Studies – Depression scale; CI: confidence
interval; EEG: electroencephalography; eGFR: estimated glomerular filtrate rate; NREM: non-rapid eye
movement sleep; REM: rapid eye movement
ACCEPTED MANUSCRIPT
ACC
EPTE
D M
ANU
SCR
IPT
21
Table 1 Baseline characteristics of the kTx PSG sample and the subgroups Insomnia
and Non-Insomnia
kTx PSG sample
Insomnia (AIS≥10)
Non-Insomnia (AIS<10)
p
n (%) 100 (100) 16 (16) 84 (84) N/A
Age (mean±SD) (years) 51±13 57±12 50±13 0.024
Male (%) 57 50 58 0.537
BMI (mean±SD) (kg/m2) 27±5 28±6 27±5 0.167
eGFR (mean±SD) (ml/min/1.73 m2) 54±19 46±14 55±20 0.042
Serum albumin (mean±SD)
(g/L) 40±3 40±3 40±4 0.412
Charlson comorbidity index (median;IQR)
2;1 3;2 2;1 0.035
Prevalence of diabetes (%) 19 31 17 0.179
Prevalence of hypertension (%)
92 94 92 1.000
Prevalence of insomnia (%)
(AIS 10 cut-off) 16 100 0 N/A
AIS (median; IQR) 4;6 12;5 3;5 <0.001
Prevalence of depression
(%) (CES-D 18 cut-off) 21 44 16 0.012
CES-D (median; IQR) 9;11 17;18 9;9 0.035
Hypnotic drug use (%) 17 37 13 0.017
Antipdepressant use (%) 2 6 1 0.296
Transplant vintage (median;
IQR) (months) 66;83 72;71 76;85 0.642
IS medication (%) steroid cyclosporine azathiophrine sirolimus mycophenolate- mofetil tacrolimus
85 43 5
12 71 46
81 56 6 0
75 38
86 40 5
14 70 48
0.704 0.243 1.000 0.205 1.000 0.587
Dialysis vintage (median; IQR)
(months) 18;32 26;32 18;30 0.225
Cumulative ESKD time
(median; IQR) (months) 101;91 107;78 101;94 0.694
Insomnia was defined by the cut-off score of the Athens Insomnia Scale (AIS<10: non-insomnia subgroup;
AIS≥10: insomnia subgroup). AIS: Athens Insomnia Scale; BMI: body mass index; CES-D: Center for
Epidemiologic Studies – Depression scale; eGFR: estimated glomerular filtrate rate; ESKD: end-stage kidney
disease; Immunosuppressant: IS; IQR: interquartile range; kTx: kidney transplant; SD: standard deviation
ACCEPTED MANUSCRIPT
ACC
EPTE
D M
ANU
SCR
IPT
22
Table 2 Polysomnography parameters of the kTx PSG sample and their correlations
with AIS score
kTx PSG sample AIS score
Spearman’s rho
p
SOL (median;IQR) (min) 15;17 0.105 0.301
SE (median;IQR) (%) 80;13 -0.179 0.075
TST (mean±SD) (h) 6±1.3 -0.127 0.214
Stage 1 (mean±SD) (%) 11±6 -0.053 0.599
Stage 2 (mean±SD) (%) 43±13 -0.020 0.844
SWS (mean±SD) (%) 12±8 0.060 0.557
REM sleep (mean±SD) (%) 13±6 -0.159 0.115
REM latency (median;IQR) (min) 145;87 0.142 0.165
WASO (median;IQR) (min) 61;47 0.088 0.392
AHI (median; IQR) (1/h) 4;14 -0.026 0.798
PLMI (median; IQR) (1/h) 6;15 -0.094 0.354
AHI: apnea-hypopnea index; AIS: Athens Insomnia Scale; kTx: kidney transplant; PLMI: periodic limb
movement index; REM: rapid eye movement; SE: sleep efficiency; SOL: sleep onset latency, SWS: slow wave
sleep; TST: total sleep time; WASO: wake after sleep onset
ACCEPTED MANUSCRIPT
ACC
EPTE
D M
ANU
SCR
IPT
23
Table 3 Associations of sleep macrostructure parameters (dependent variable) and AIS
score (independent variable) in multivariable linear regression models (n=100)
Dependent variable β coefficient 95% CI p
SOL (min) Model 1 -0.023 -0.179 - 0.225 0.824
Model 2 -0.048 -0.285 - 0.188 0.686
TST (h) Model 1 -0.133 -0.349 - 0.082 0.223
Model 2 -0.120 -0.374 - 0.134 0.350
SWS (%) Model 1 0.113 -0.095 - 0.322 0.282
Model 2 0.263 0.026 - 0.500 0.030
WASO (min) Model 1 0.046 -0.158 - 0.250 0.656
Model 2 0.088 -0.158 - 0.335 0.478
Model 1: adjusted for: AIS score, age, sex, eGFR
Model 2: adjusted for: AIS score, age, sex, eGFR, CES-D score, hypnotic medication use
AIS: Athens Insomnia Scale; CES-D: Center for Epidemiologic Studies – Depression scale; CI: confidence
interval; eGFR: estimated glomerular filtrate rate; SOL: sleep onset latency, SWS: slow wave sleep; TST: total
sleep time; WASO: wake after sleep onset
ACCEPTED MANUSCRIPT
ACC
EPTE
D M
ANU
SCR
IPT
24
Table 4 Descriptive data of sleep EEG spectra and correlations of AIS score versus sleep
EEG spectra of the kTx EEG sample (n=56)
Spectrum absolute
power µV2/Hz
(median; IQR)
AIS score
Spearman’s rho
p
NREM
Beta 0.30;0.23 0.194 0.152
Sigma 2.5;3.2 0.142 0.300
Alpha 3.3;3.4 0.244 0.070
Theta 5.4;3.5 0.151 0.266
Delta 51.5;37 0.012 0.931
REM
Beta 0.32;0.25 0.257 0.055
Sigma 0.68;0.58 0.287 0.032
Alpha 1.4;1.2 0.211 0.118
Theta 3.2;2.4 0.083 0.545
Delta 14;9.2 0.197 0.145
AIS: Athens Insomnia Scale; IQR: interquartile range; kTx: kidney transplant; NREM: non-rapid eye movement
sleep; EEG: electroencephalography; REM: rapid eye movement sleep
ACCEPTED MANUSCRIPT
ACC
EPTE
D M
ANU
SCR
IPT
25
Table 5 Associations of the sleep EEG spectra (dependent variable) and the AIS score
(independent variable) in multivariable linear regression models (n=56)
Dependent variable β coefficient 95% CI p
NREM Beta Model 1 0.238 -0.017 - 0.494 0.067
Model 2 0.160 -0.132 - 0.451 0.276
NREM Delta Model 1 0.079 -0.156 - 0.314 0.503
Model 2 0.194 -0.064 - 0.452 0.138
REM Beta Model 1 0.452 0.200 - 0.705 0.001
Model 2 0.323 0.041 - 0.606 0.026
REM Delta Model 1 0.144 -0.145 - 0.433 0.322
Model 2 0.273 -0.050 - 0.595 0.096
Model 1: adjusted for: AIS score, age, sex, eGFR
Model 2: adjusted for: AIS score, age, sex, eGFR, CES-D score, hypnotic medication use
AIS: Athens Insomnia Scale; CES-D: Center for Epidemiologic Studies – Depression scale; CI: confidence
interval; EEG: electroencephalography; eGFR: estimated glomerular filtrate rate; NREM: non-rapid eye
movement sleep; REM: rapid eye movement
ACCEPTED MANUSCRIPT
ACC
EPTE
D M
ANU
SCR
IPT
26
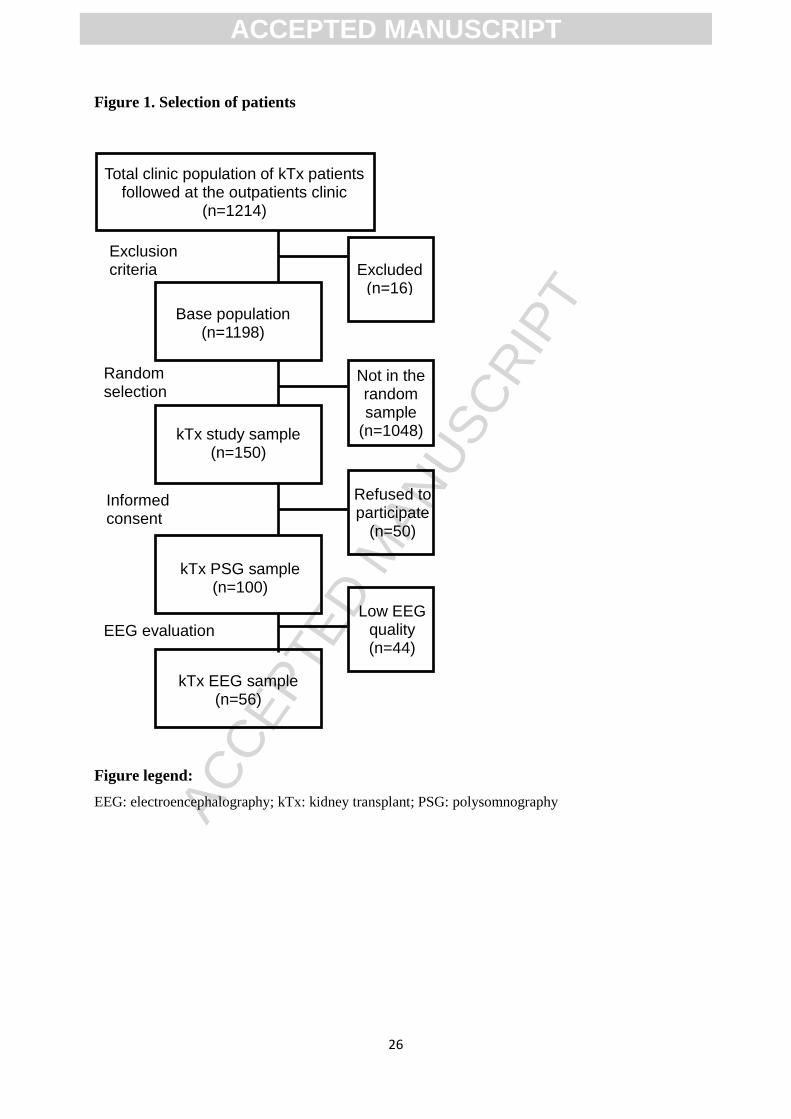
Figure 1. Selection of patients
Figure legend:
EEG: electroencephalography; kTx: kidney transplant; PSG: polysomnography
Total clinic population of kTx patients followed at the outpatients clinic
(n=1214)
Base population (n=1198)
kTx study sample (n=150)
kTx PSG sample (n=100)
Not in the random sample
(n=1048)
Excluded (n=16)
Refused to participate
(n=50)
Exclusion criteria
Random selection
Informed consent
kTx EEG sample (n=56)
Low EEG quality (n=44)
EEG evaluation
ACCEPTED MANUSCRIPT
ACC
EPTE
D M
ANU
SCR
IPT
27
Figure 2. Hypnogram of a study participant to illustrate stages of sleep during the sleep study
Figure legend:
Time is plotted on the abscissa and stages on the ordinate, stages are abbreviated as follows: W: stage
wake; R: stage REM; 1: stage 1; 2: stage 2; 3: stage 3; 4: stage 4.
ACCEPTED MANUSCRIPT
ACC
EPTE
D M
ANU
SCR
IPT
28
Figure 3. Spectrogram of a patient during NREM and REM sleep
Figure legend:
The power spectrum is a function that represents the strength (power) of EEG oscillations at each
studied frequency bin.
ACCEPTED MANUSCRIPT
ACC
EPTE
D M
ANU
SCR
IPT
29
Highlights:
First polysomnography study analyzing sleep architecture associated with insomnia symptoms among
kidney transplant recipients.
Insomnia symptoms were independently associated with higher proportion of slow wave sleep.
Insomnia symptoms were independently associated with increased beta activity during REM sleep.
The results suggests a compensatory sleep protective mechanism and a sign of REM sleep instability
associated with insomnia symptoms among kidney transplant recipients.
ACCEPTED MANUSCRIPT