Embed Size (px)
Citation preview
Atmospheric Convection
A Primer
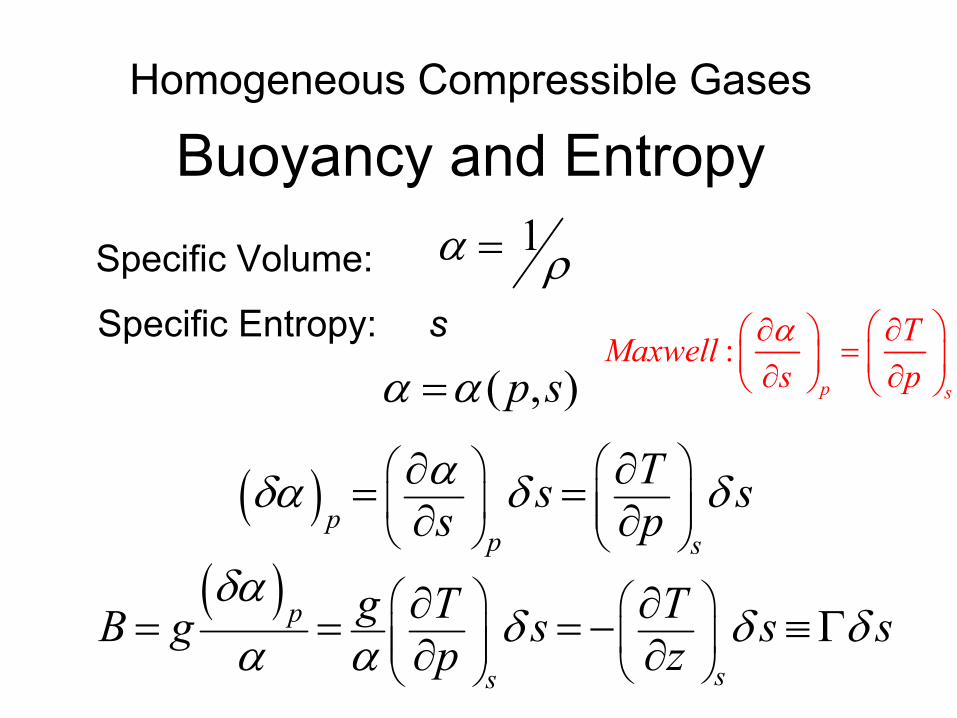
Buoyancy and EntropySpecific Volume: α = 1ρSpecific Entropy: s
α =α ( ,p s)
( ) ∂α ∂Tδα δ= = s δ sp s p ∂ ∂p
( )s
δαB p g T ∂ ∂ T= =g s δ = − δ δα α p z ≡
∂ ∂s s
Homogeneous Compressible Gases
∂α TMaxwell : = ∂s p s
s sΓ
p∂∂
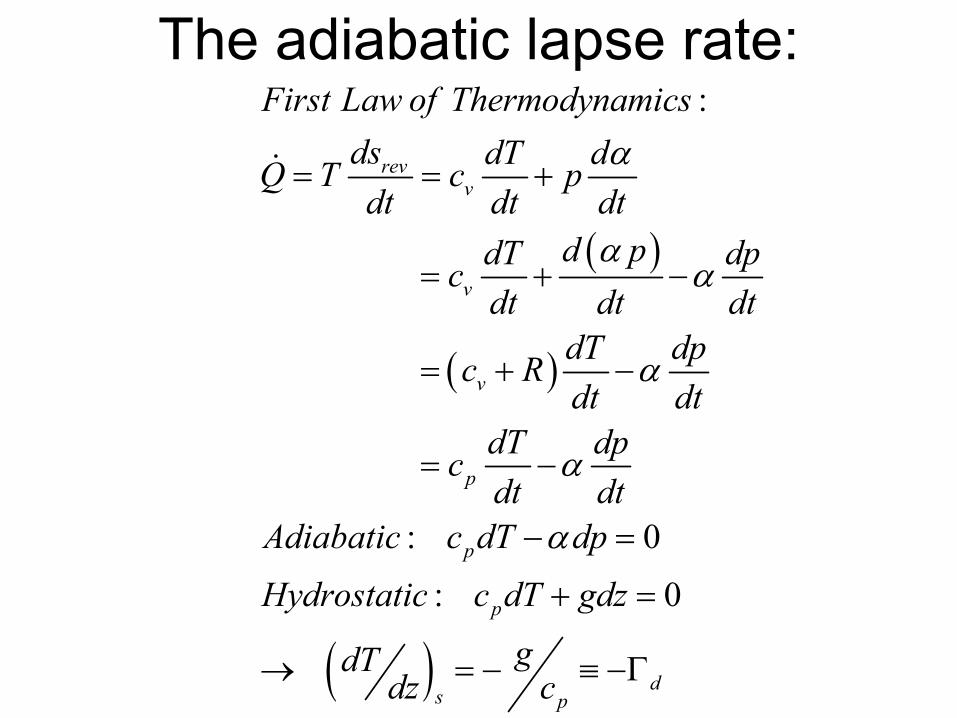
The adiabatic lapse rate:
( )
( )
( )
First Law of Thermodynamics :dsrev dT dαQ T= = cv + pdt dt dt
dT d pα dp= +cv −α
dt dt dtdT dp
= +c Rv −αdt dt
dT dp= −cp α
dt dtAdiabatic : 0cpdT − =αdp
Hydrostatic : 0cpdT + =gdz
dT g→ = − ≡ −Γdz c ds p
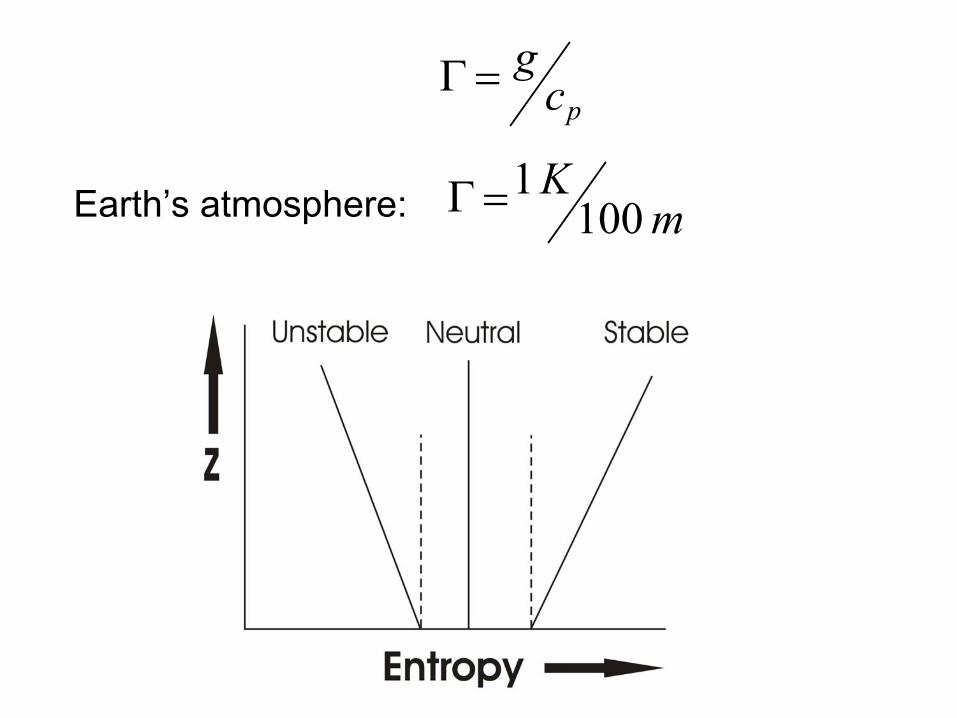
gΓ = cp
Earth’s atmosphere: Γ =1K100m
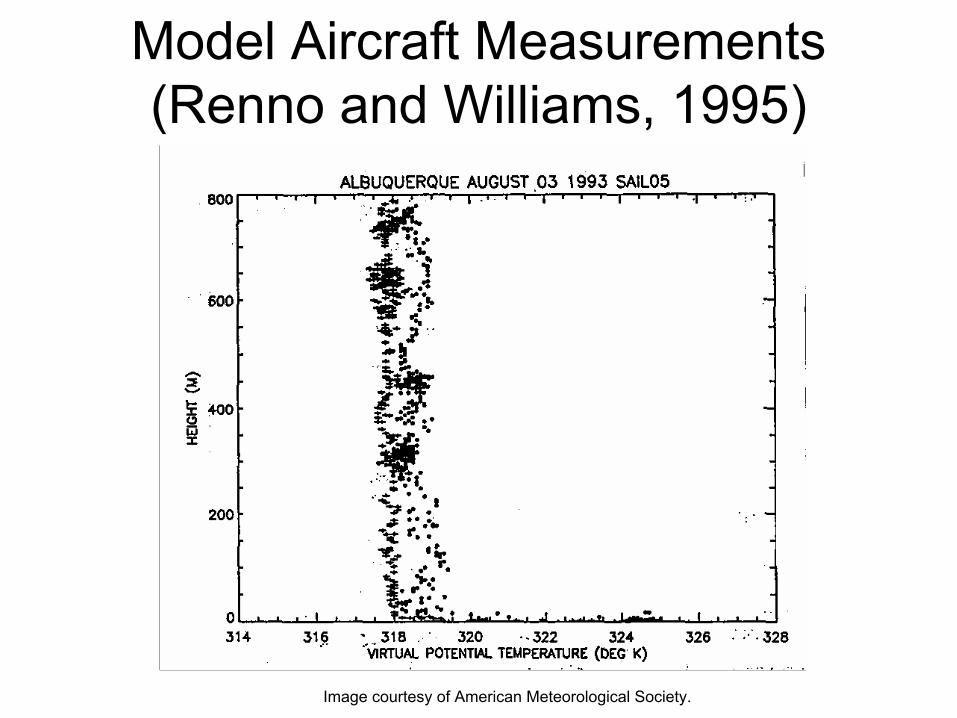
Model Aircraft Measurements(Renno and Williams, 1995)
Image courtesy of American Meteorological Society.
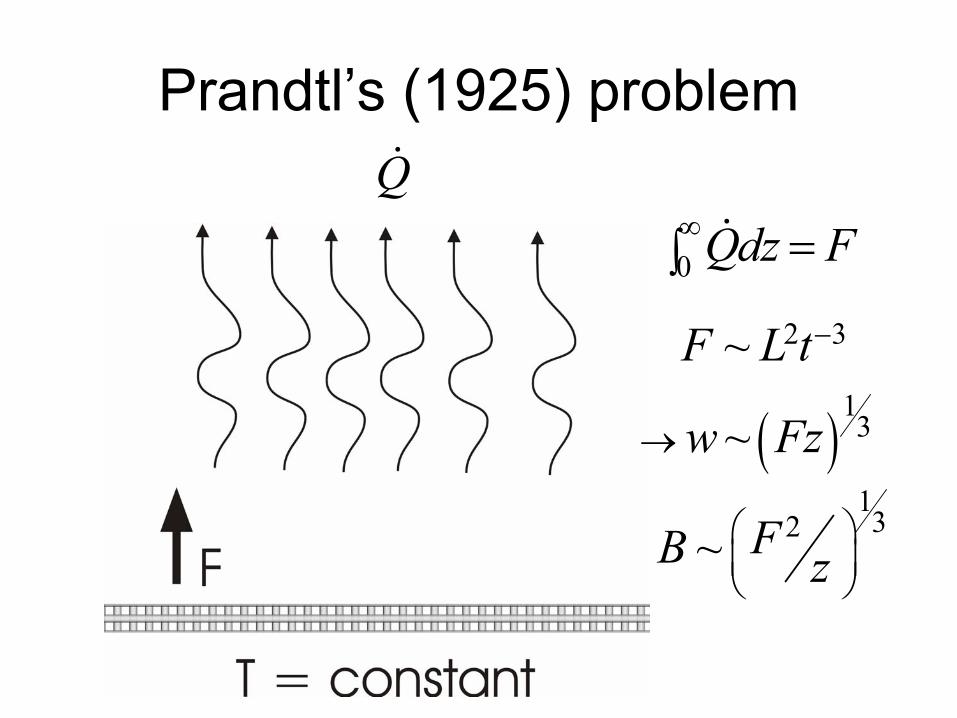
Prandtl’s (1925) problemQ
∫∞0 Qdz = F
F L~ 2 3t−
( )1
→w F~ z 3
1
B ~ F 2 3 z
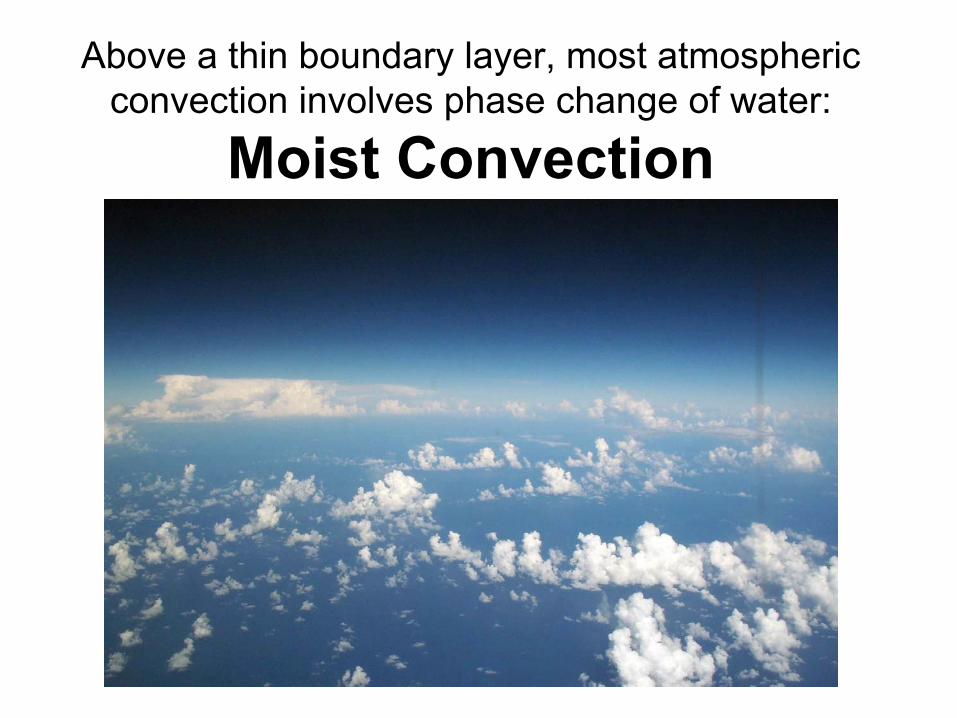
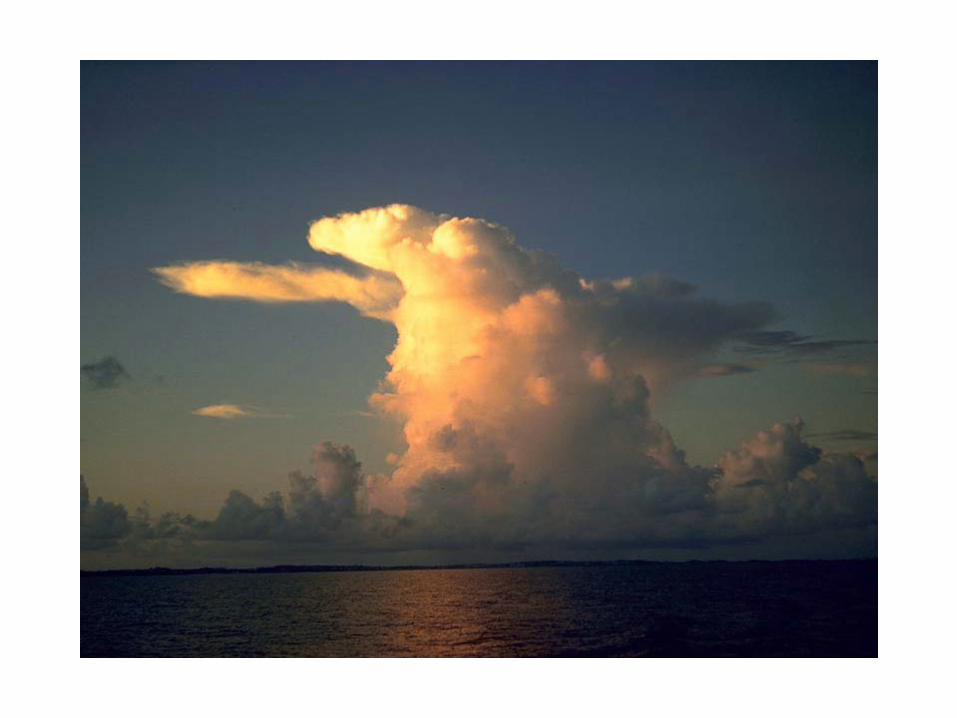
Above a thin boundary layer, most atmospheric convection involves phase change of water:
Moist Convection
Moist Convection
• Significant heating owing to phase changes of water
• Redistribution of water vapor – most important greenhouse gas
• Significant contributor to stratiform cloudiness – albedo and longwave trapping
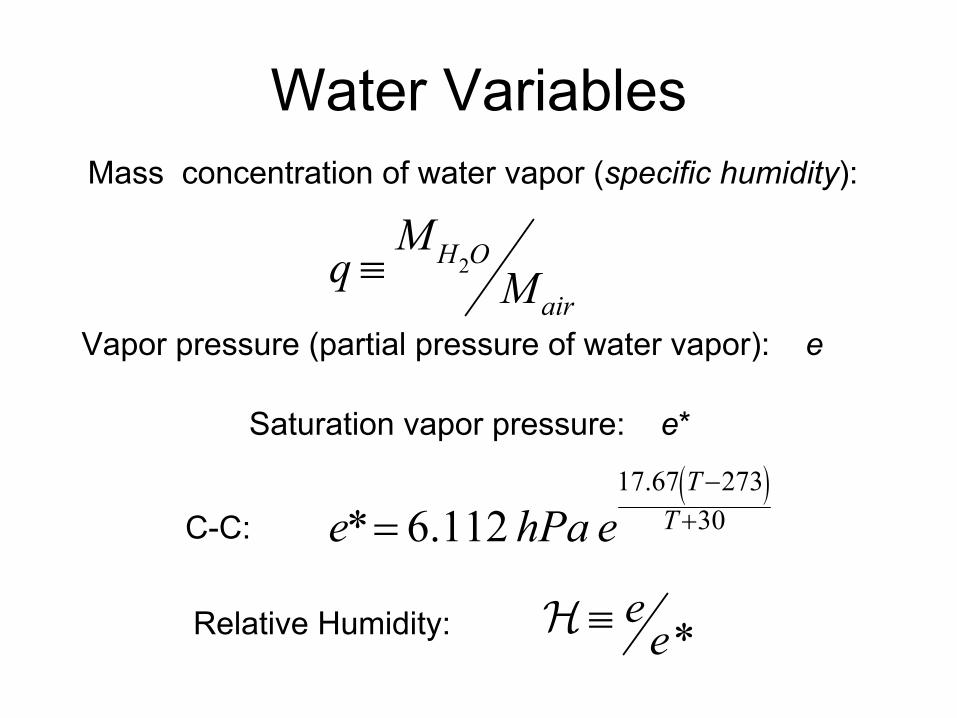
Water VariablesMass concentration of water vapor (specific humidity):
Mq ≡ H O2
MairVapor pressure (partial pressure of water vapor): e
Saturation vapor pressure: e*
Relative Humidity:
( )
H ≡ ee*
17.67 T−273
C-C: e h* 6= .112 Pa e T+30
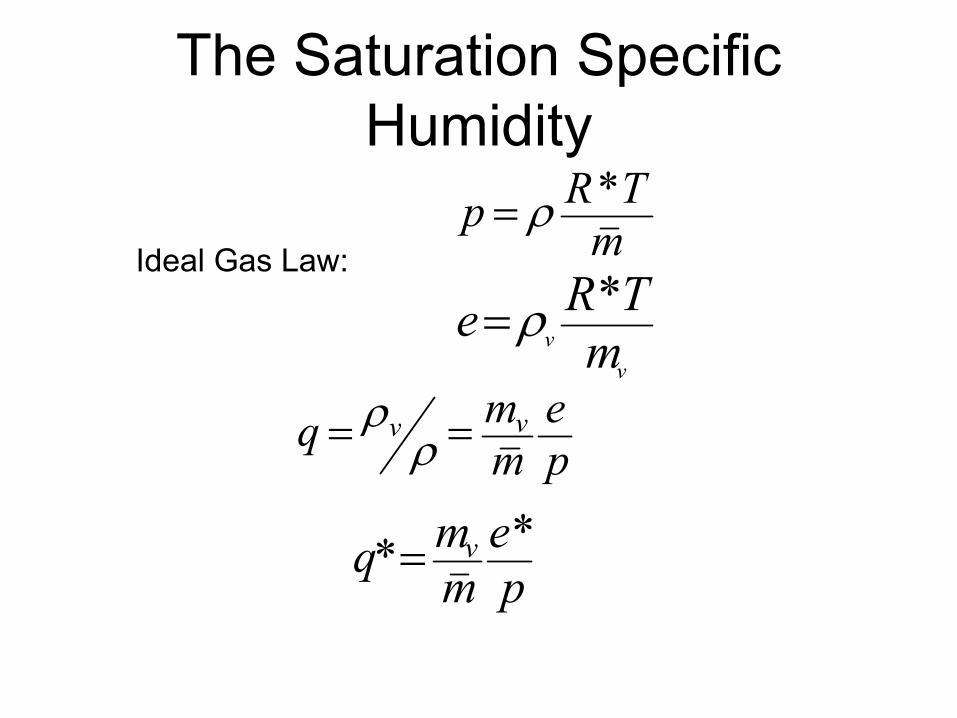
The Saturation Specific Humidity
Ideal Gas Law:
e R*T=ρv mv
p R*T= ρ m
q ρv m e= = vρ m pm ev *q*= m p
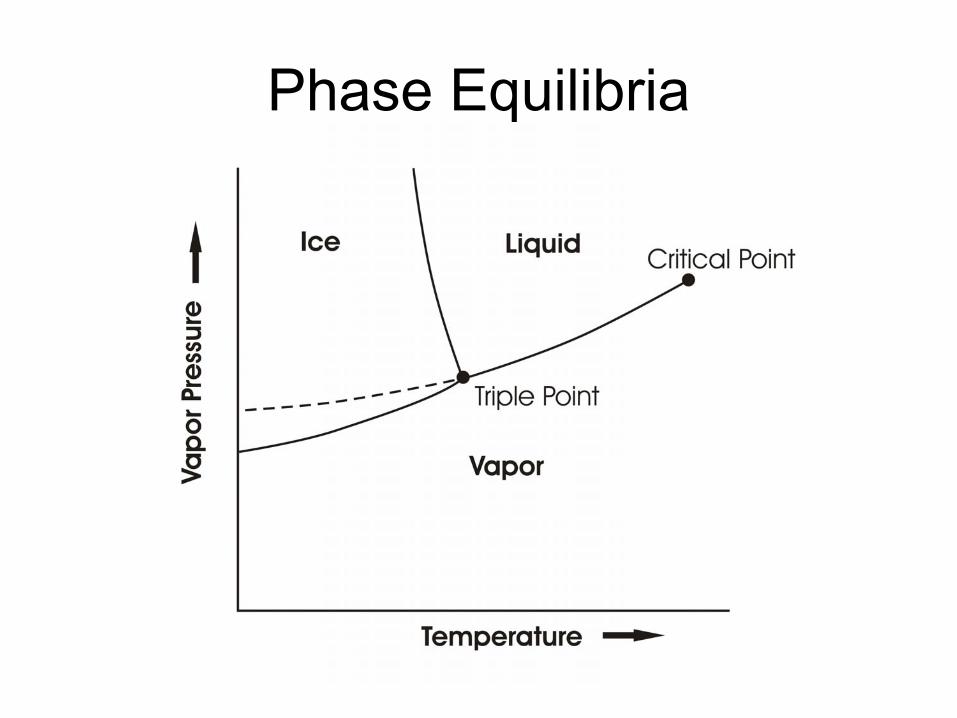
Phase Equilibria
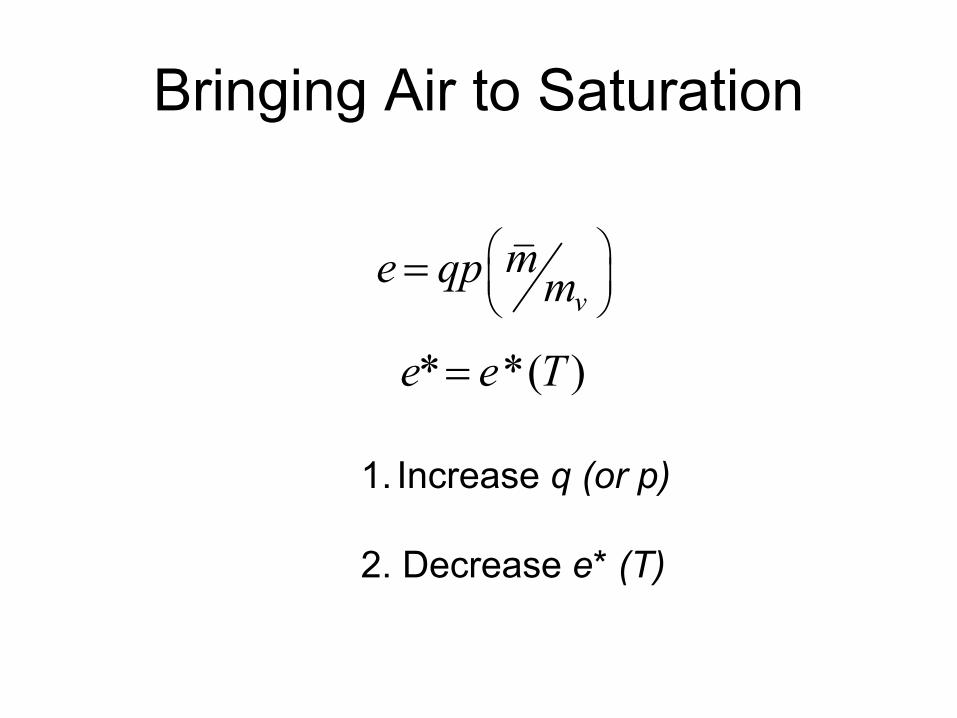
Bringing Air to Saturation
e q= pm m v
e e* *= (T )
1. Increase q (or p)
2. Decrease e* (T)
When Saturation Occurs…
• Heterogeneous Nucleation• Supersaturations very small in atmosphere• Drop size distribution sensitive to size
distribution of cloud condensation nuclei
00
Perc
enta
ge o
f clo
uds
with
ice
parti
cle
conc
entra
tions
abo
ve d
etec
tabl
e le
vel
-5 -10 -15 -20 -25
20
4010
15
1233
25 25
23
2014
16 168
315
4
7 1
1 1
2 1 1 1
60
80
100
Cloud top temperature (oC)
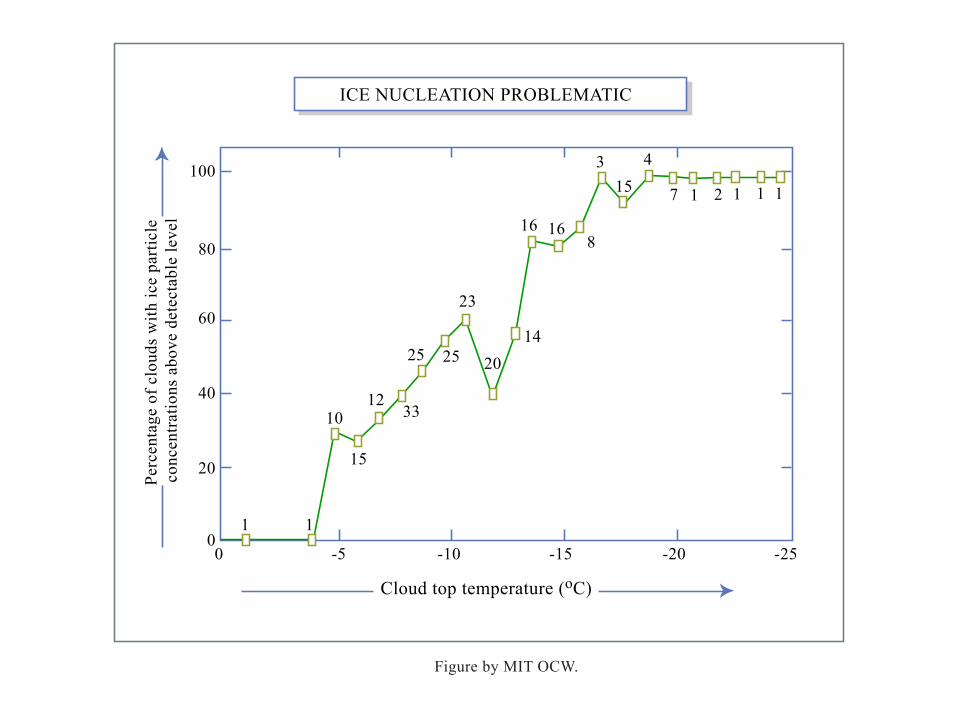
ICE NUCLEATION PROBLEMATIC
Figure by MIT OCW.
Precipitation Formation:
• Stochastic coalescence (sensitive to drop size distributions)
• Bergeron-Findeisen Process• Strongly nonlinear function of cloud water
concentration• Time scale of precipitation formation ~10-
30 minutes
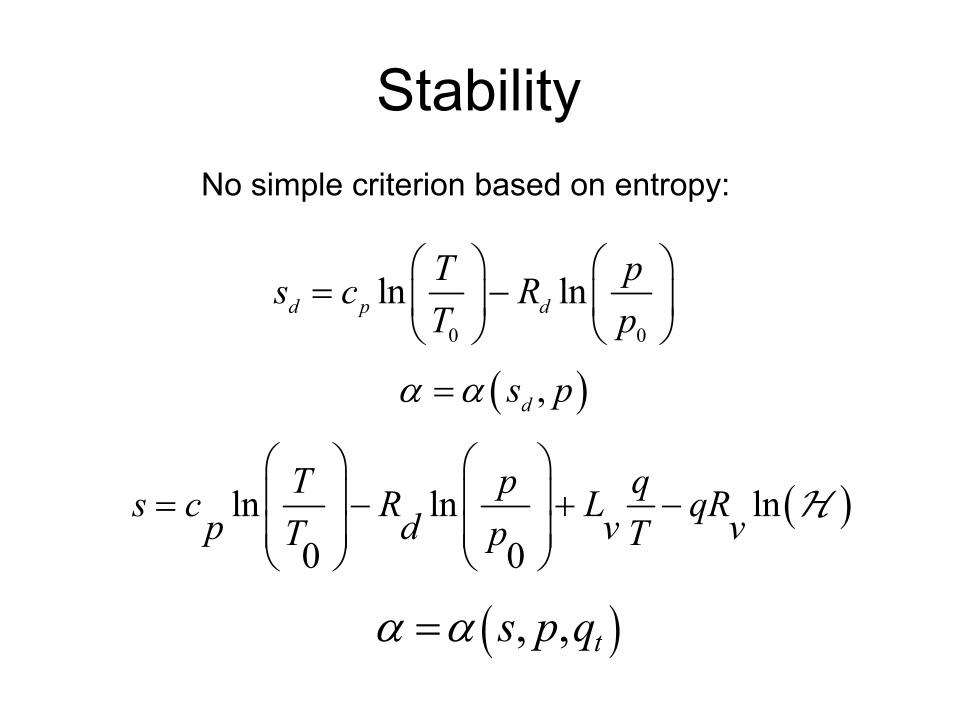
StabilityNo simple criterion based on entropy:
T p s cd p= −ln Rd ln
T p0 0
α =α (sd , p) T p qs c= −ln R ln + L − qR ln ( )Hp d T p v T v 0 0
α =α (s, ,p qt )
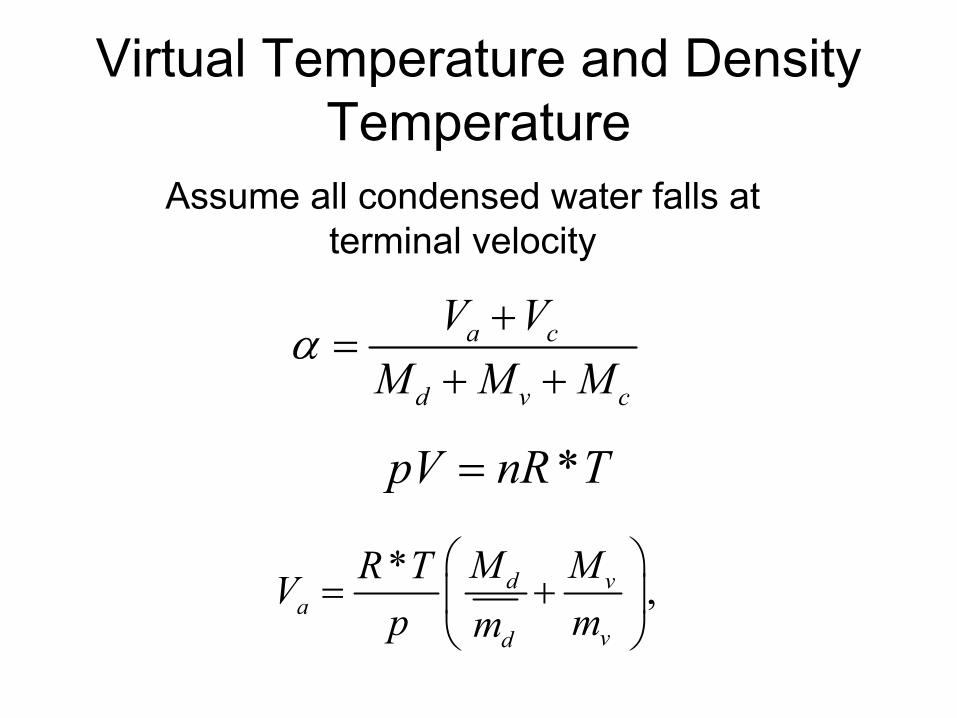
Virtual Temperature and Density Temperature
Assume all condensed water falls at terminal velocity
V Vα a c+=Md v+ +M Mc
pV n= R*T
R T* M MV d va = + ,p m md v
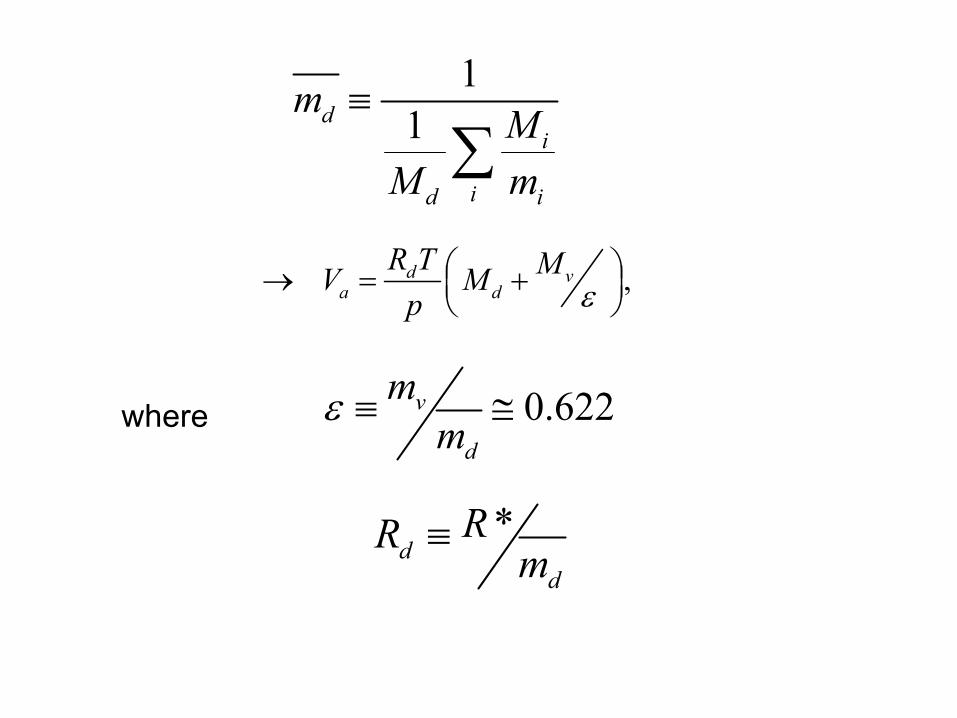
1md ≡ 1 Mi
M ∑d ii m
R Td M→ =V M va d + ,
p ε
wheremε ≡ ≅v 0.622md
R R*d ≡ md
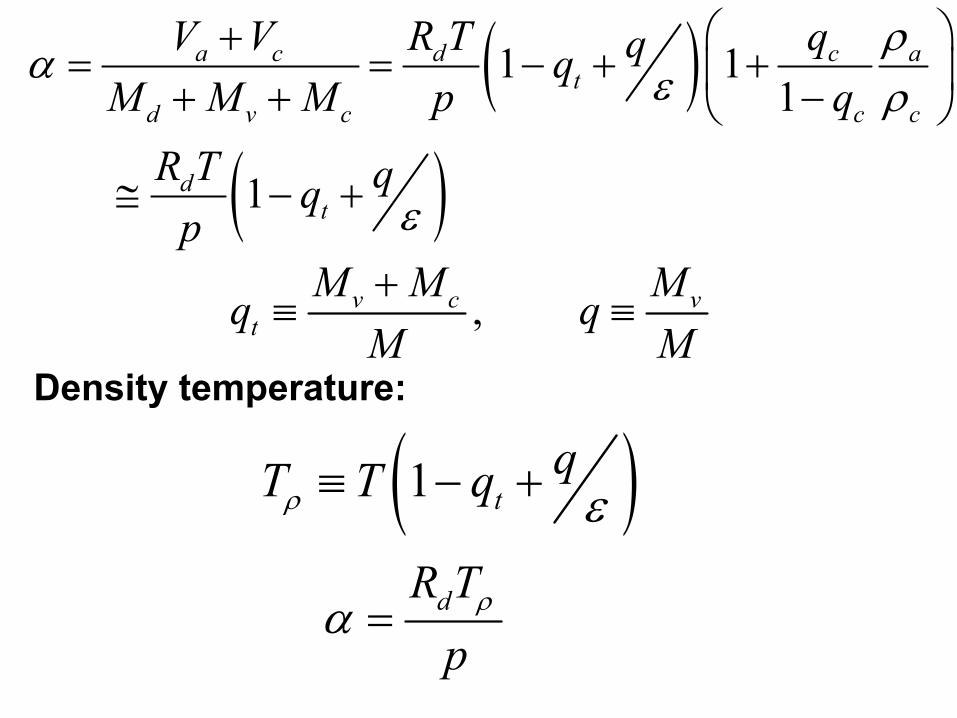
V V+= =a c RdT q qα 1 1− + c ρq a
M Md v+ +Mc p t ε 1− qc ρcR Td q≅ −1 qp ( )t + ε
Density temperature:
T T ( qρ ≡ −1 qt + ε )
RdTα = ρ
p
Mv c+M Mq q, vt ≡ ≡
M M
( ) +
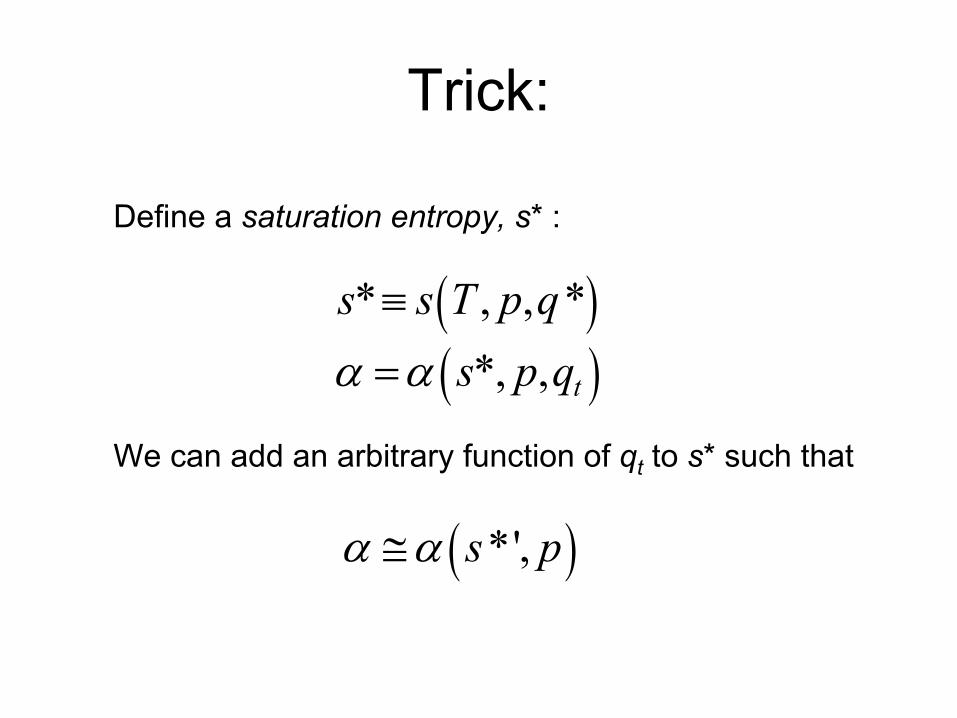
Trick:
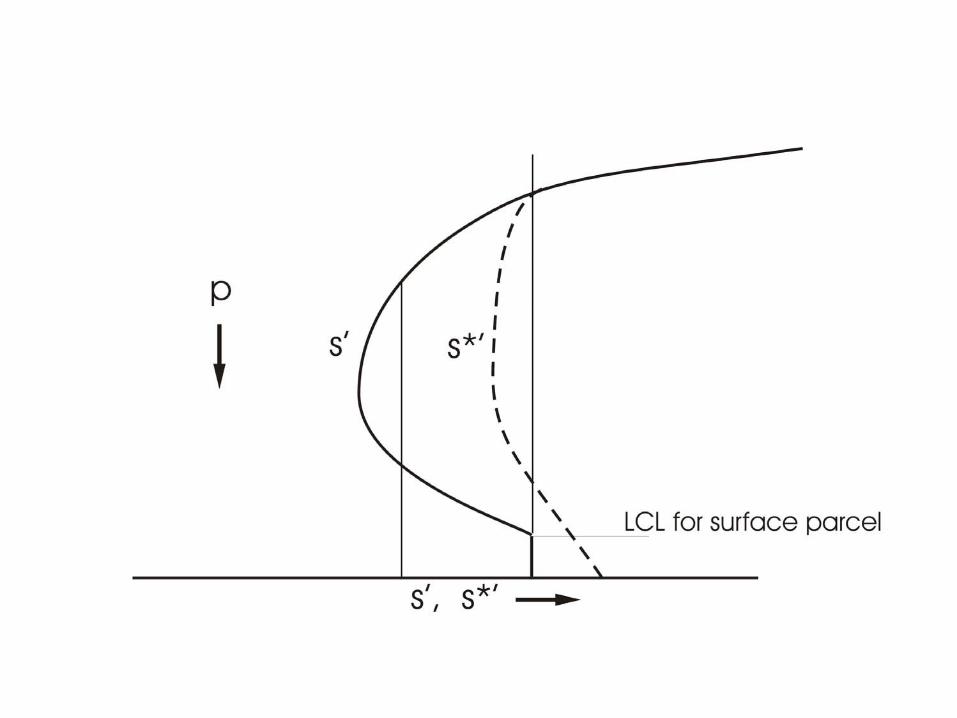
Define a saturation entropy, s* :
s* ,≡ s T( p,q*)α =α (s*, p q, t )
We can add an arbitrary function of qt to s* such that
α ≅α (s*', p)
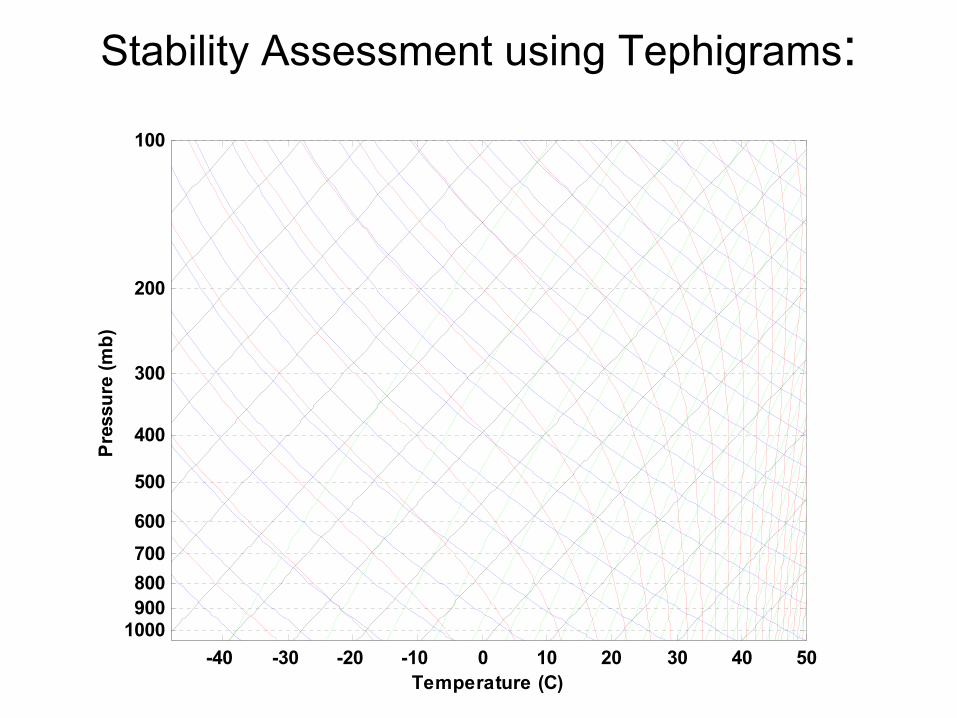
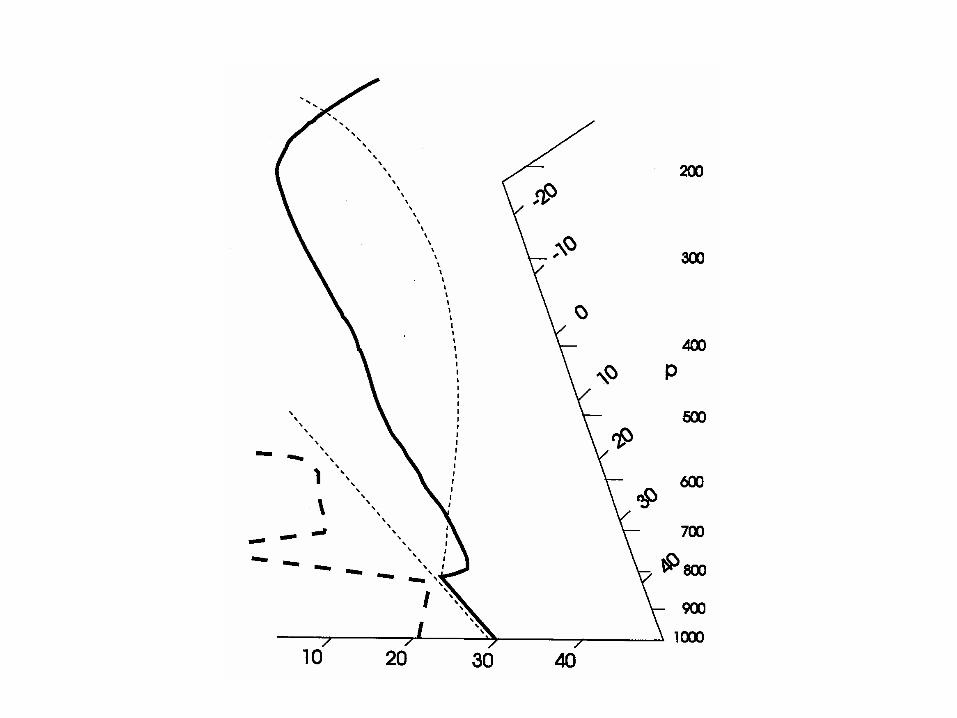
Stability Assessment using Tephigrams:
-40 -30 -20 -10 0 10 20 30 40 50
100
200
300
400
500
600700800900
1000
Temperature (C)
Pre
ssur
e (m
b)
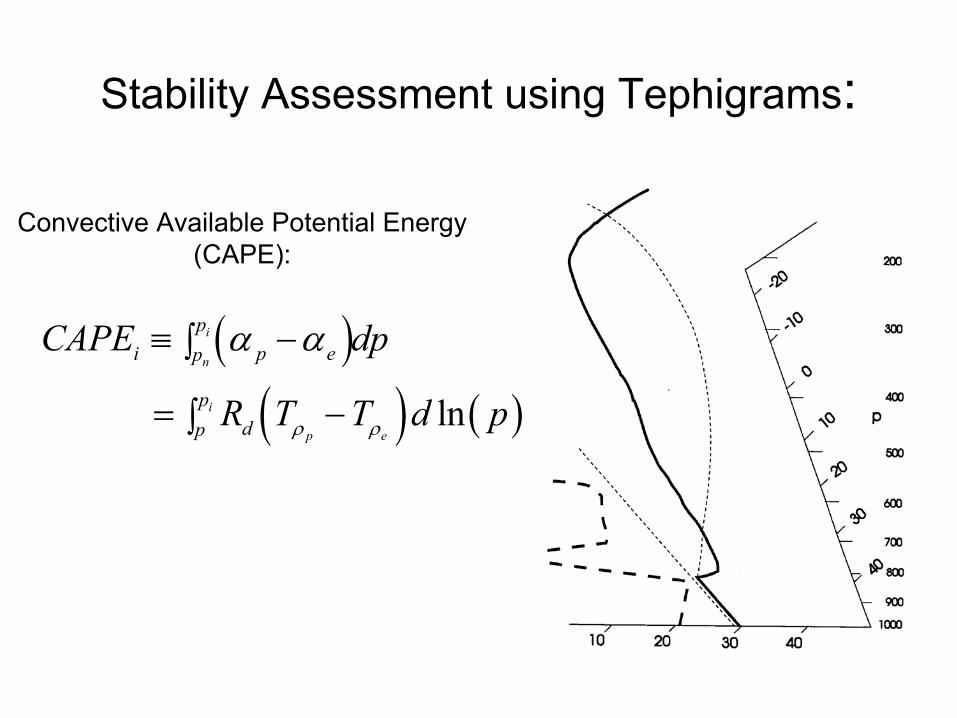
Stability Assessment using Tephigrams:
Convective Available Potential Energy(CAPE):
CAPE pii p≡ −∫pn ( )α αe dp
= −∫pip R Td ( )ρ ρp e
T d ln ( p)
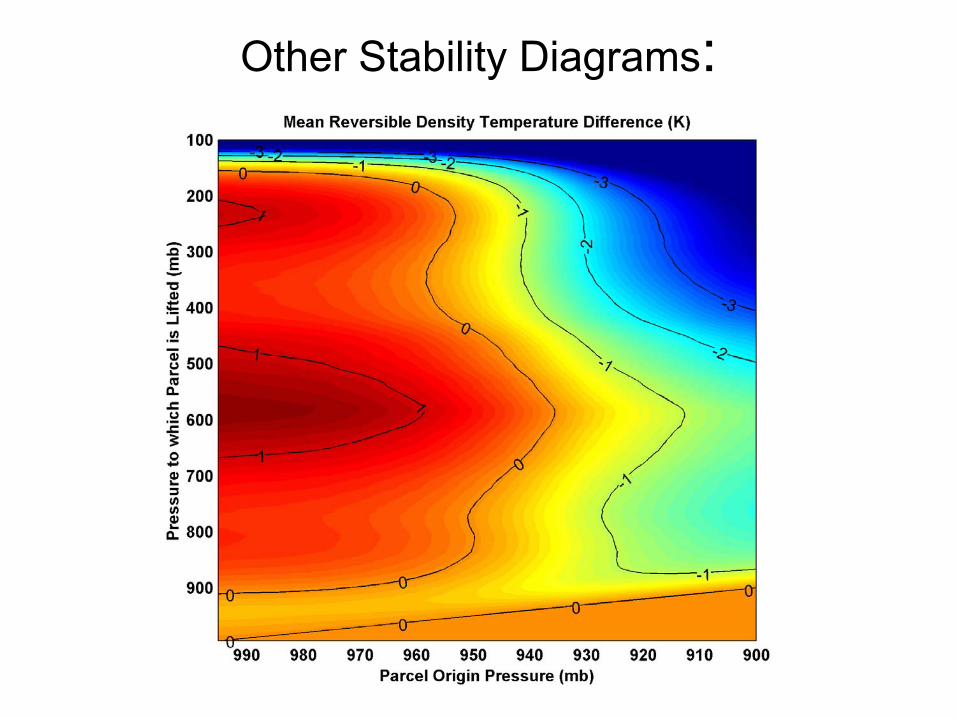
Other Stability Diagrams:
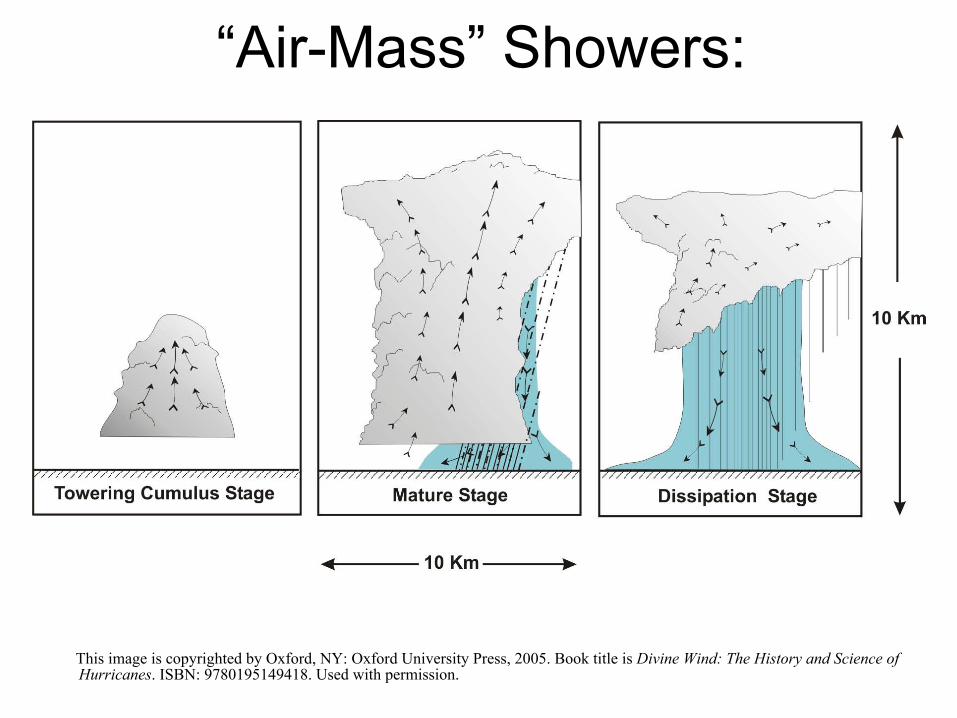
“Air-Mass” Showers:
This image is copyrighted by Oxford, NY: Oxford University Press, 2005. Book title is Divine Wind: The History and Science of Hurricanes. ISBN: 9780195149418. Used with permission.
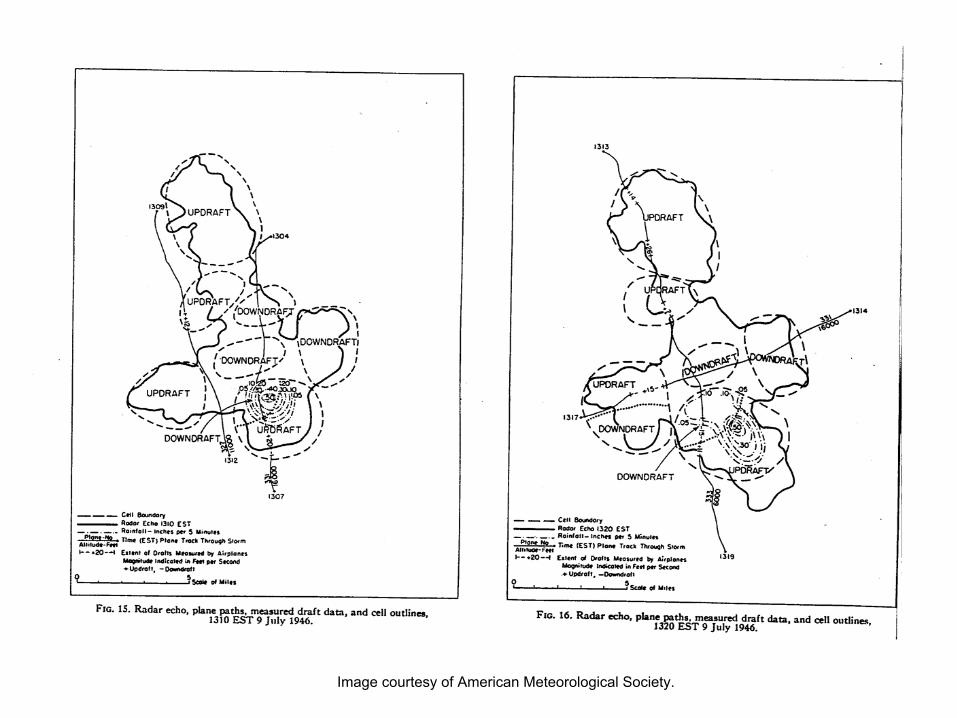
Image courtesy of American Meteorological Society.
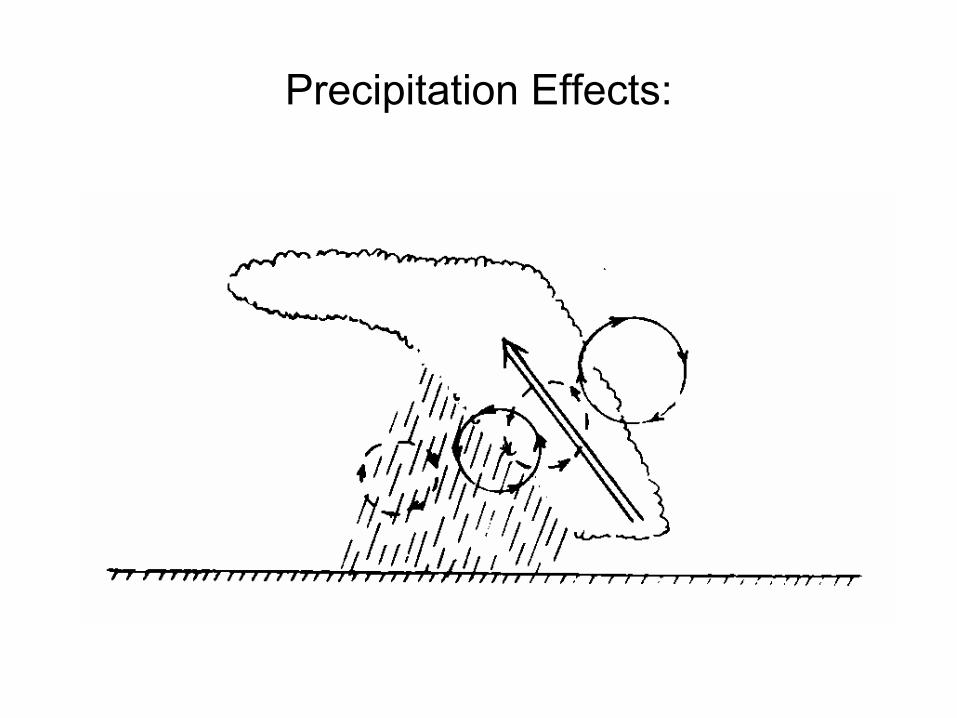
Precipitation Effects:
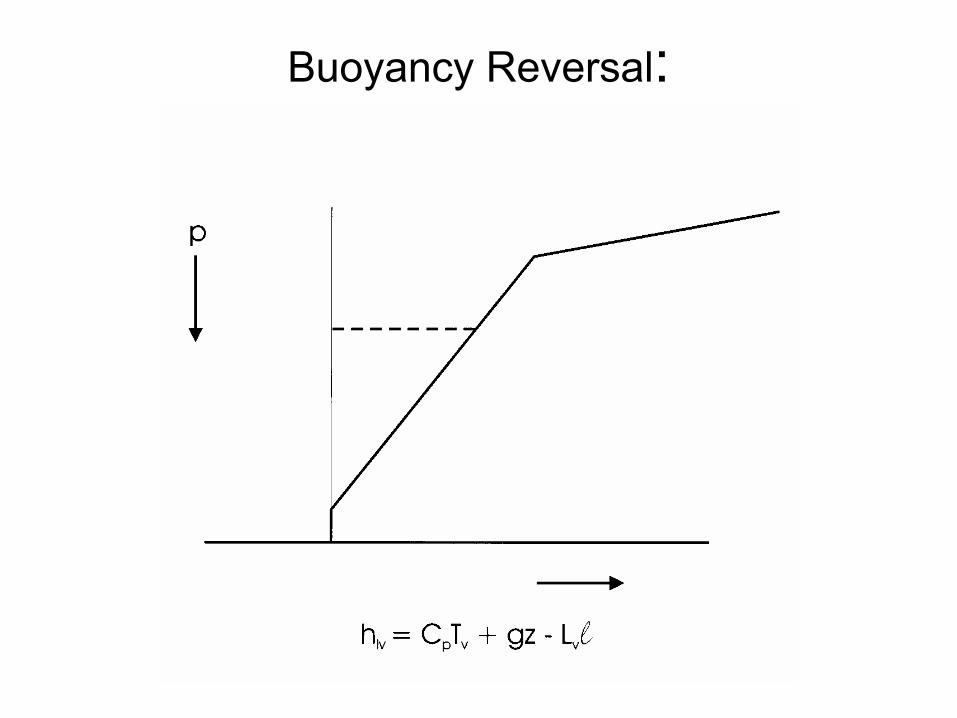
Buoyancy Reversal:
Summary of Differences Between Dry andMoist Convection:
• Possibility of metastable states• Strong asymmetry between cloudy and
clear regions• Typically, only thin layers near surface are
unstable to upward displacements• Mixing can cause buoyancy reversal• Large potential for evaporatively cooled
downdrafts• Separation of buoyancy from displacement
can lead to propagating convection
• Buoyancy of unsaturated downdrafts depends on supply of precipitation
• Entropy produced mostly through mixing, not dissipation
• Internal waves can co-exist with unstable convection
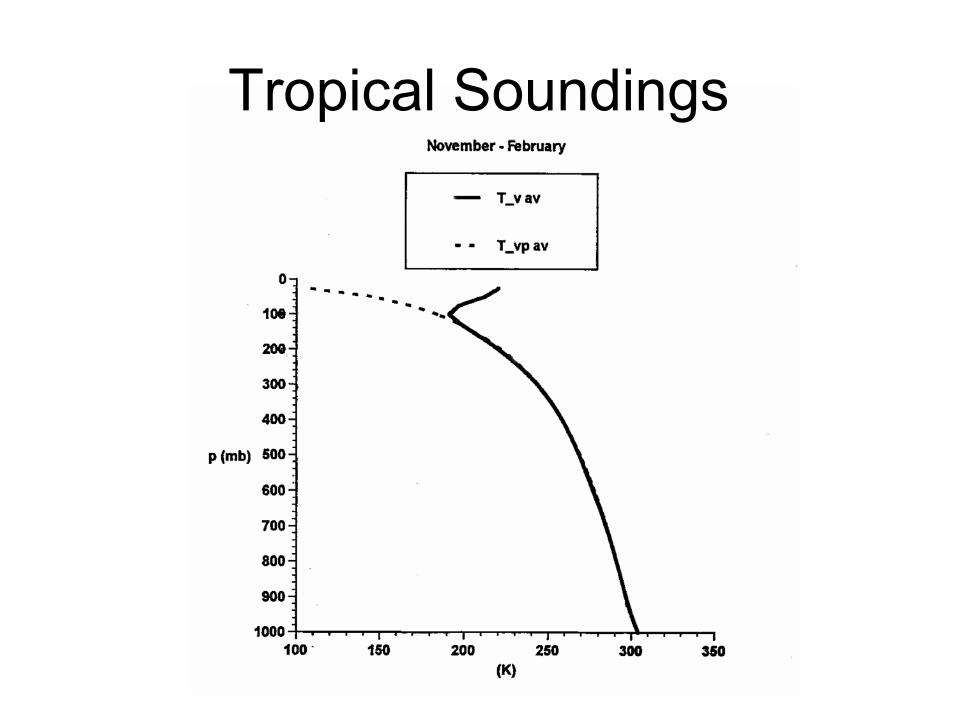
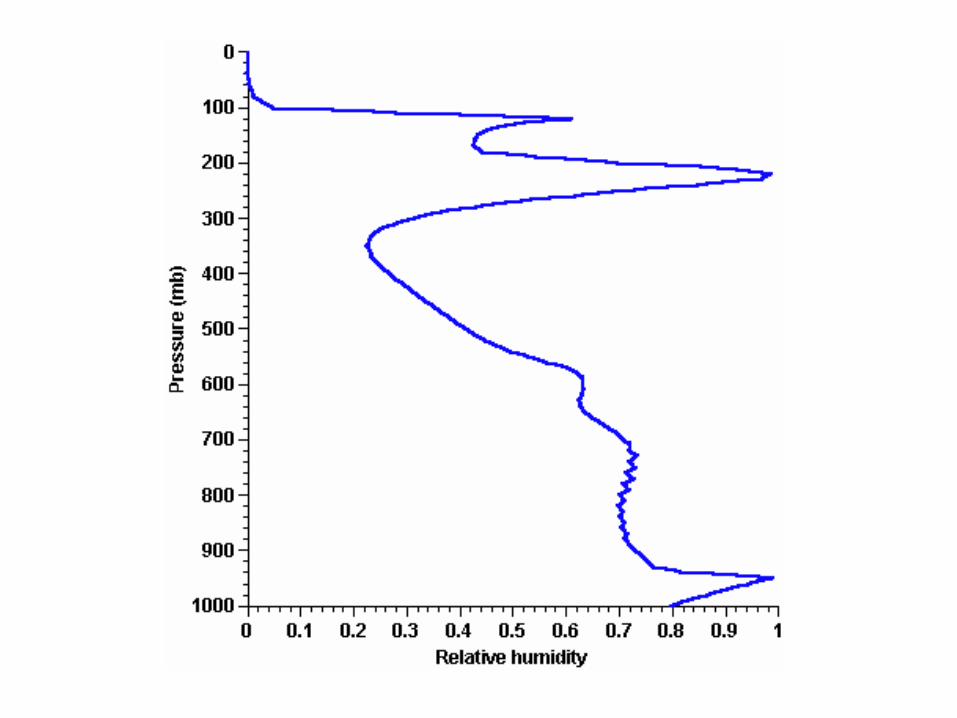
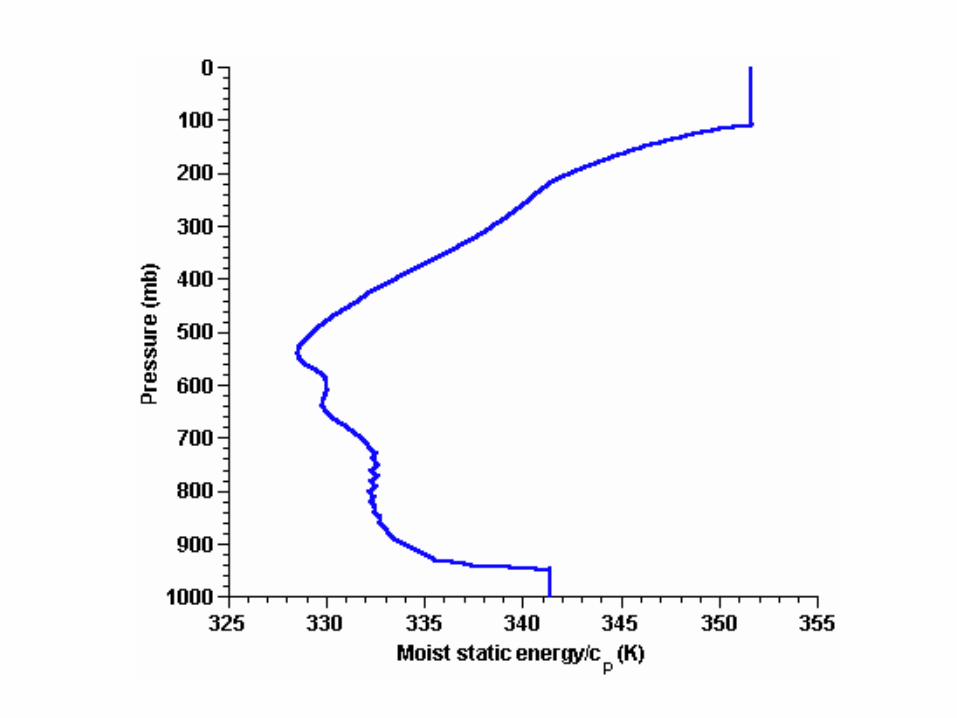
Tropical Soundings
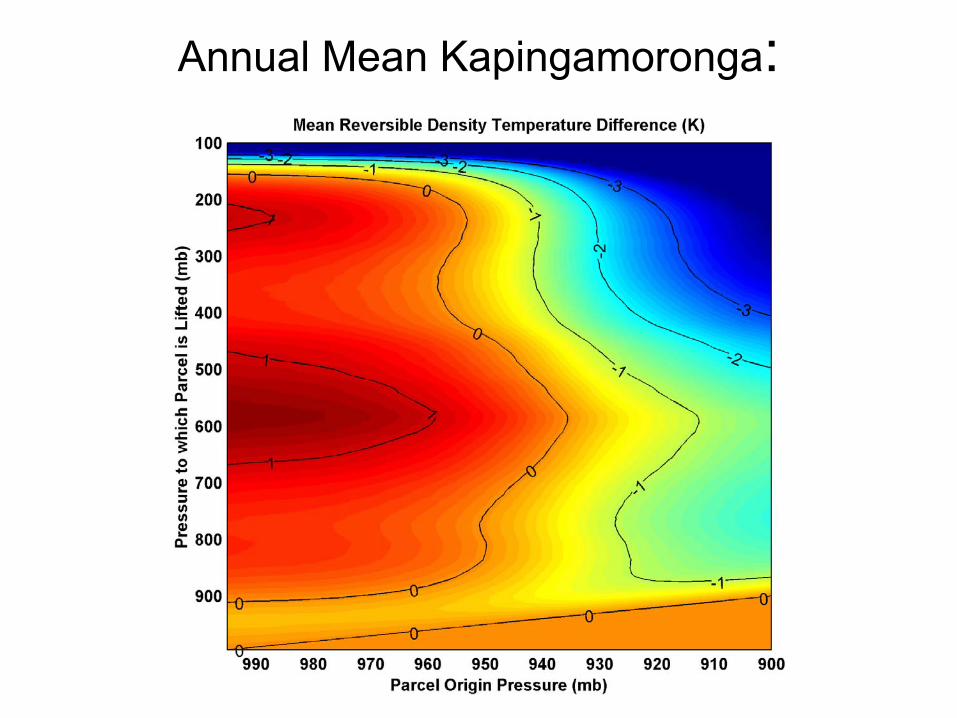
Annual Mean Kapingamoronga:
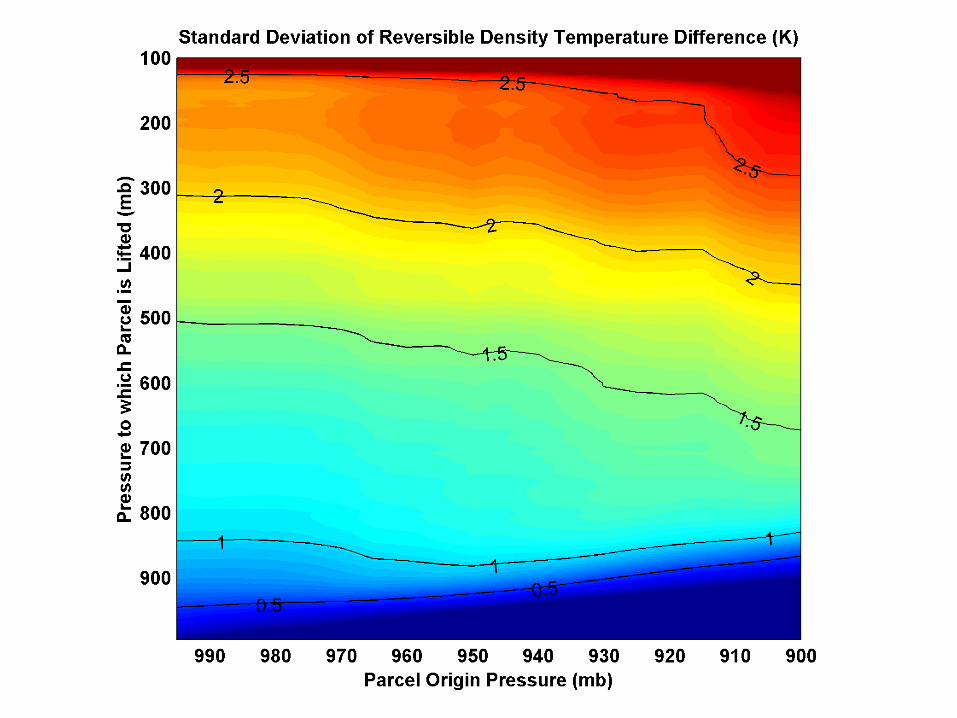
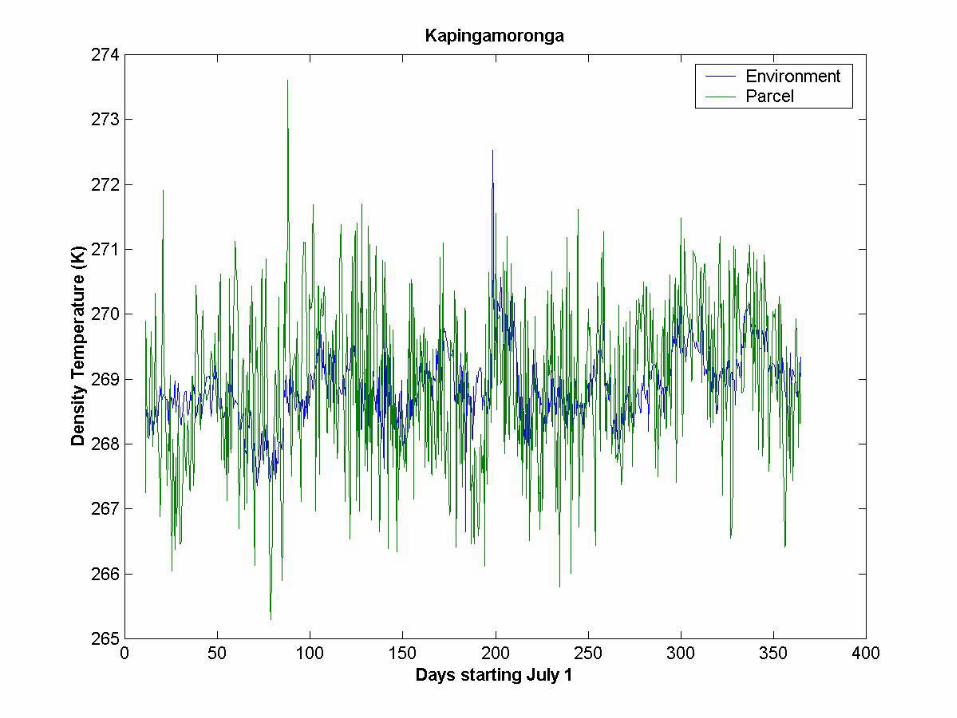
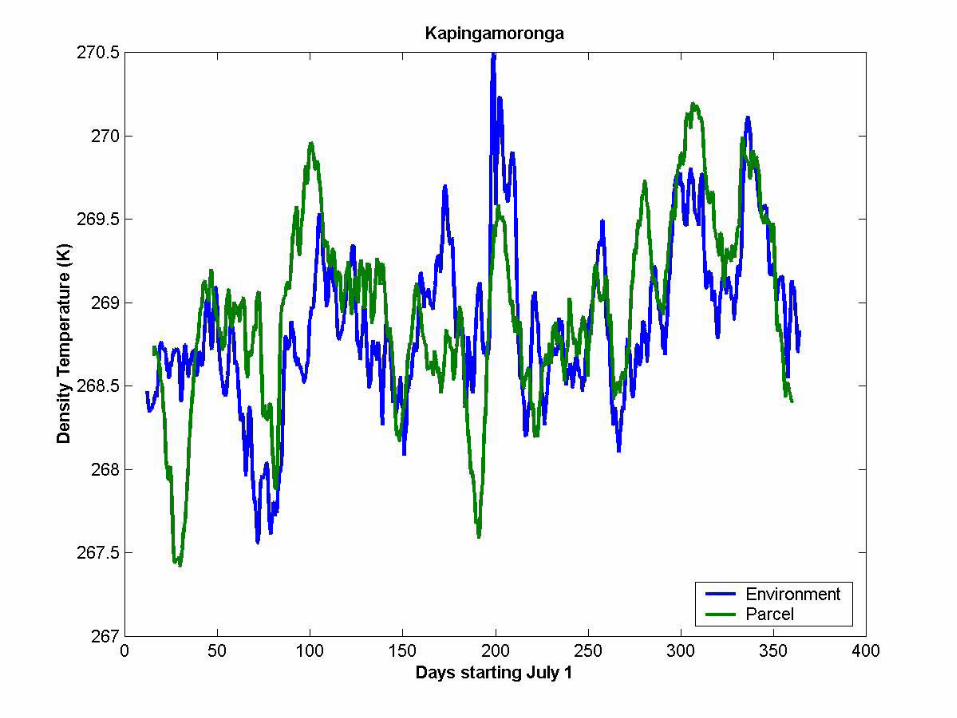
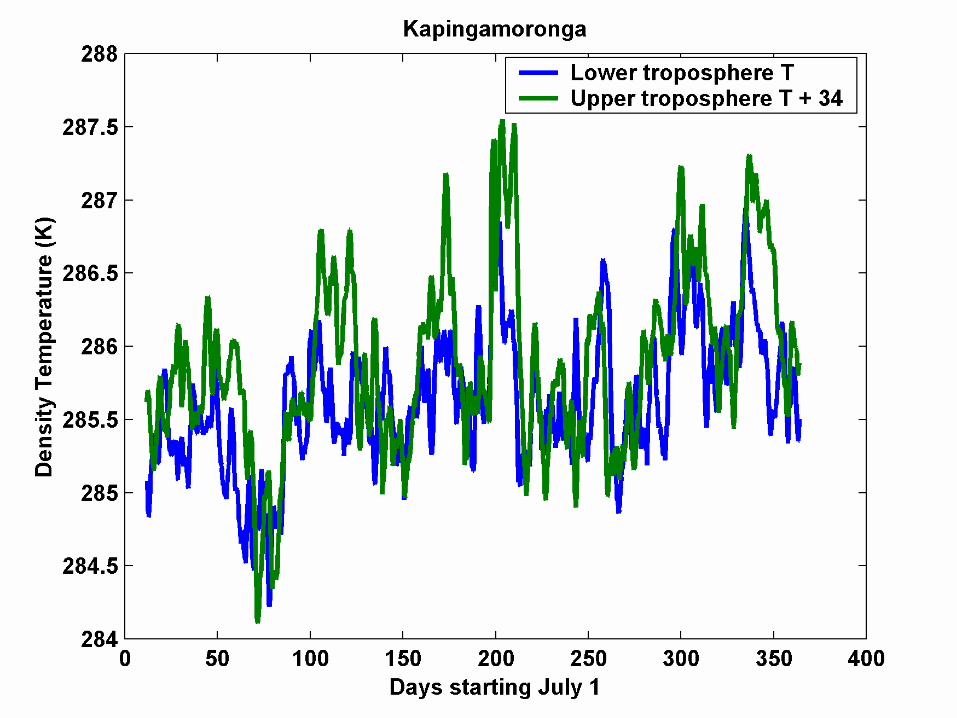
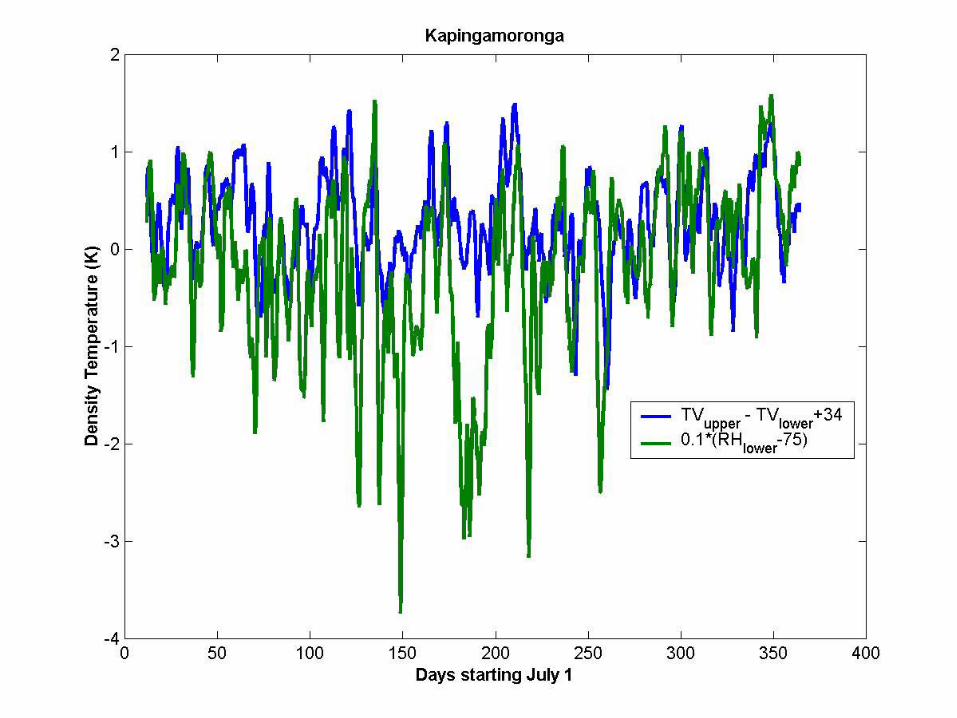
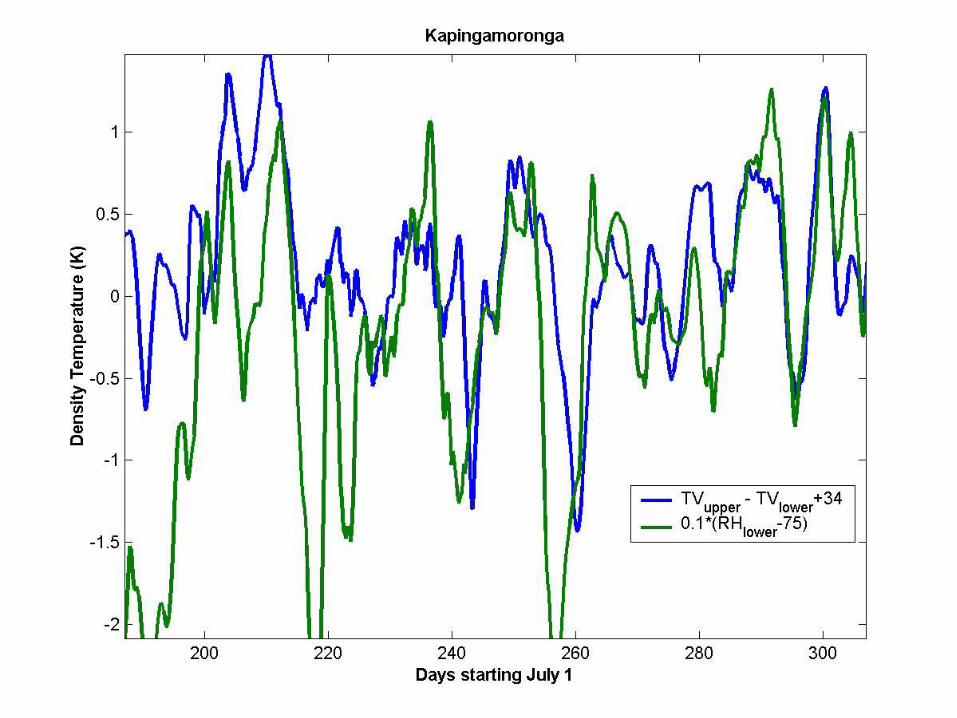
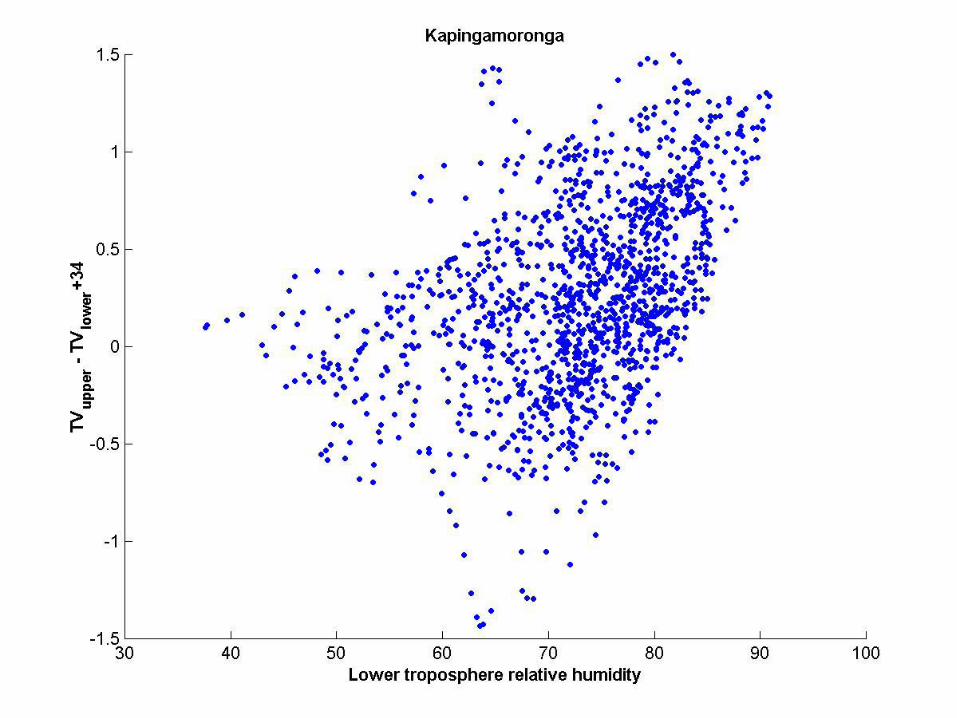
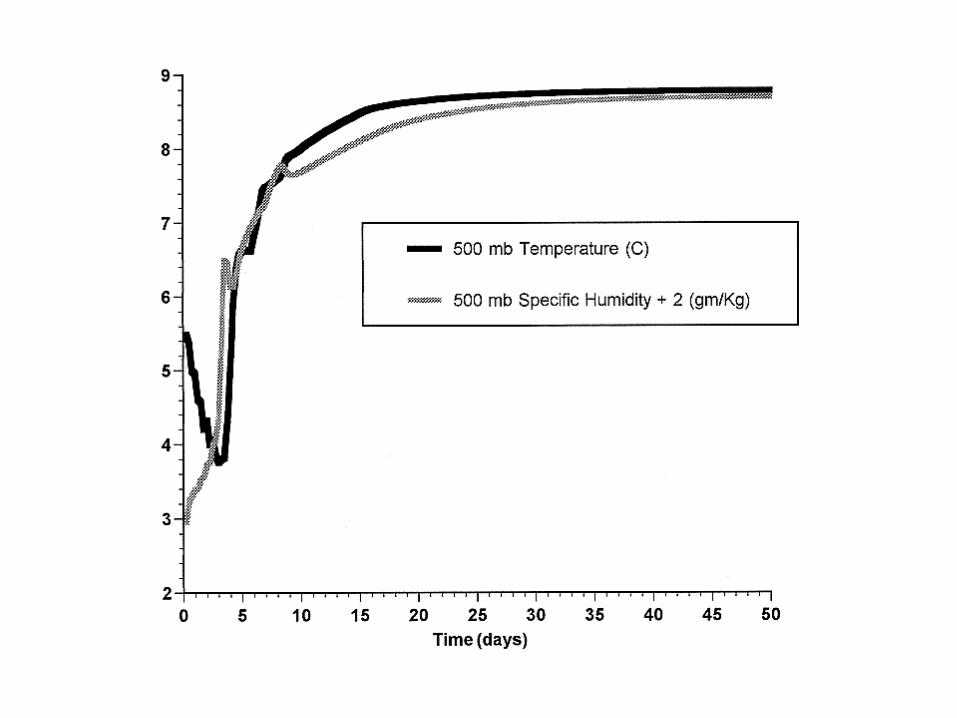
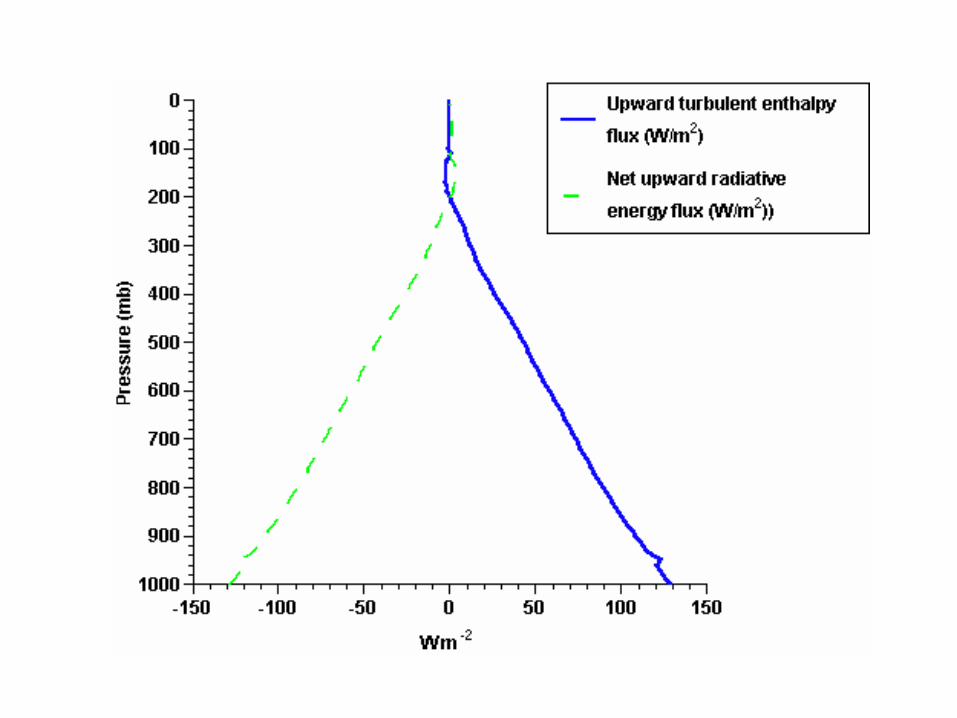
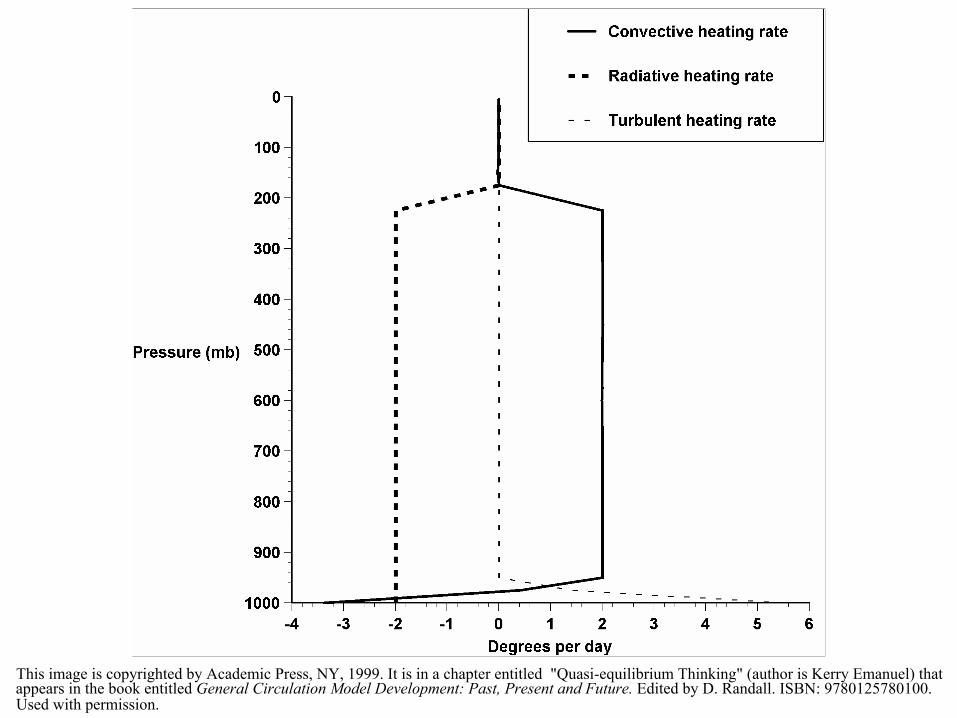
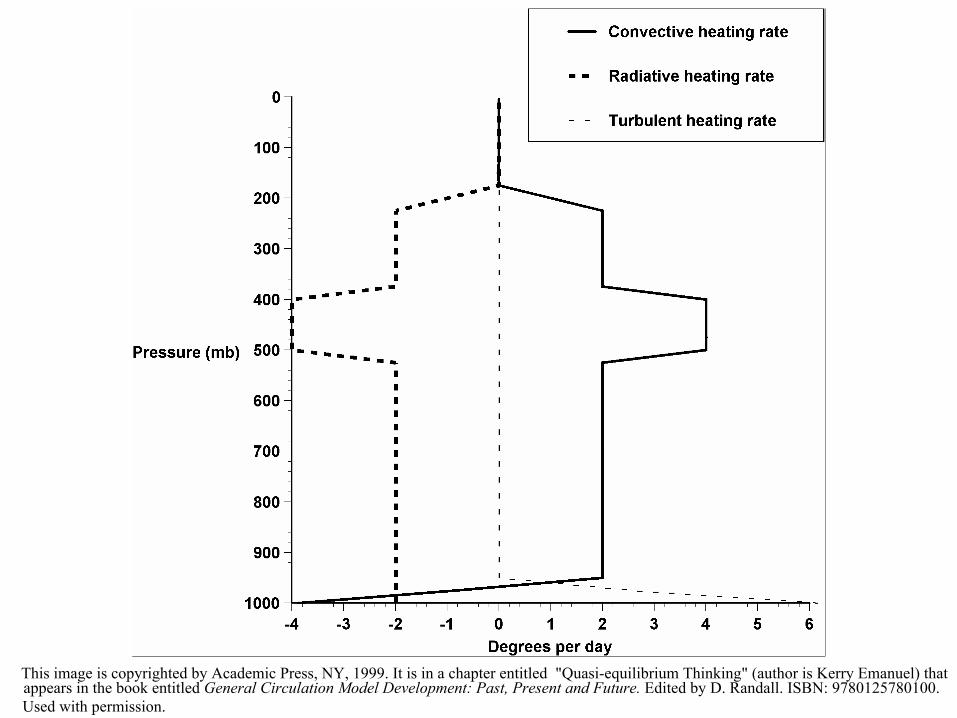
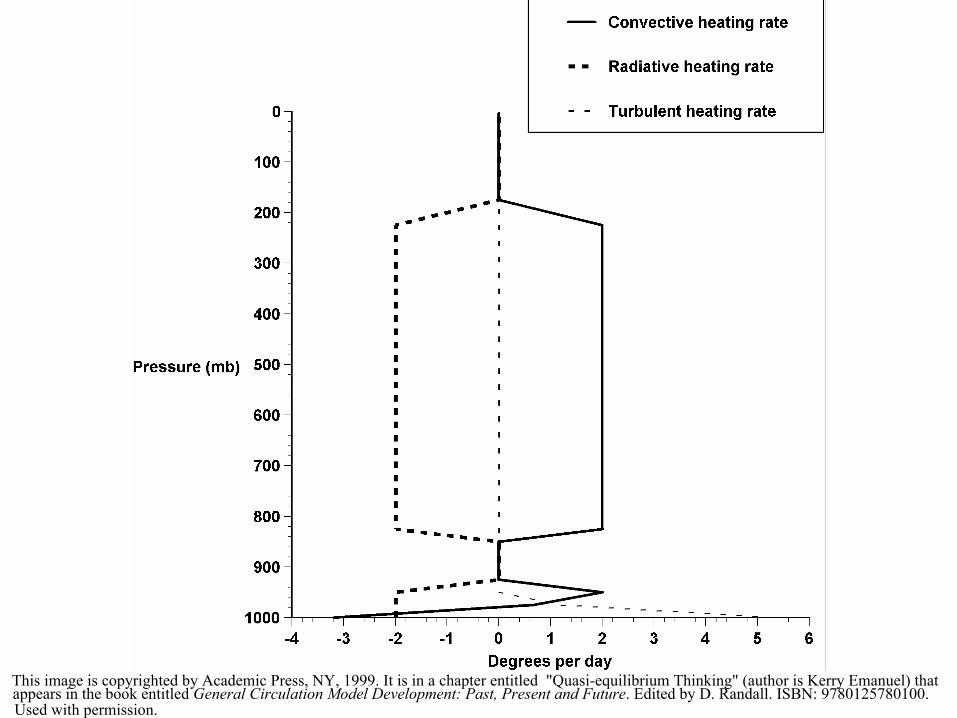
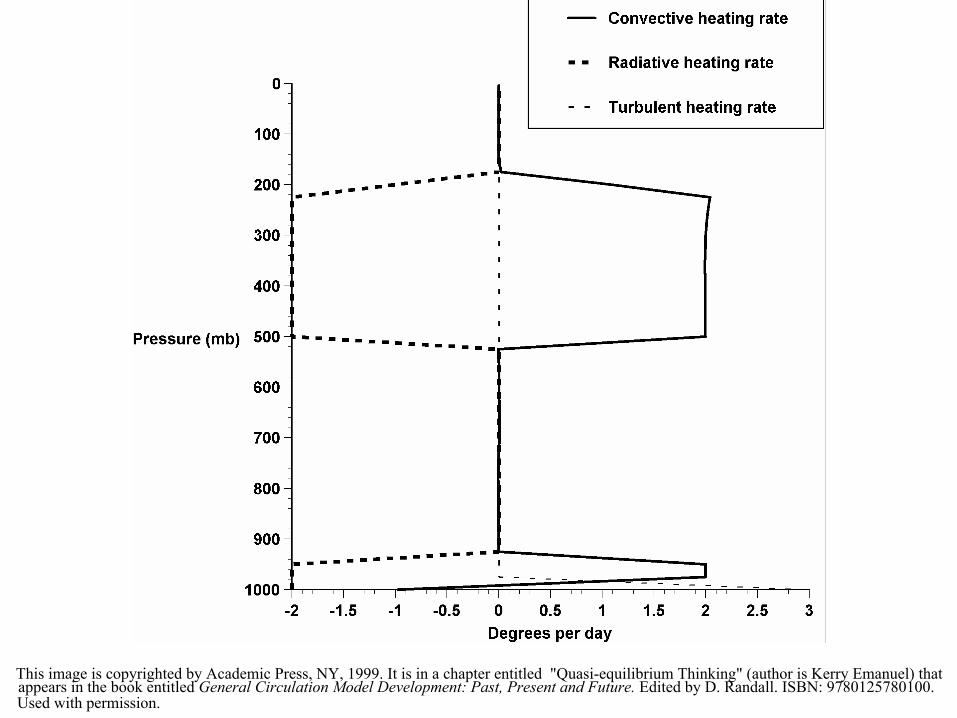
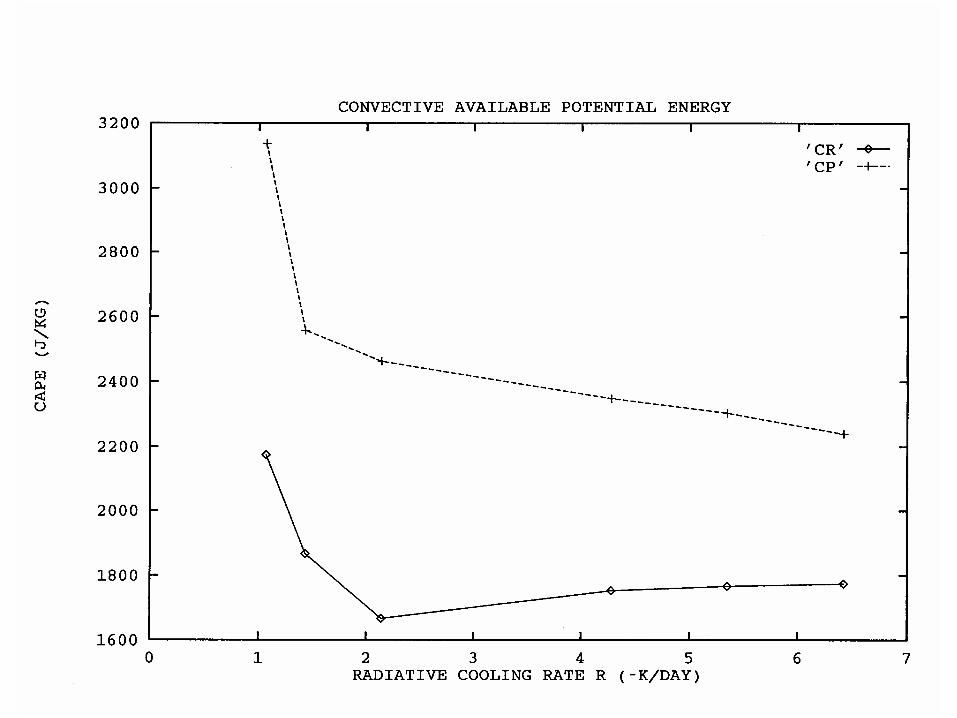
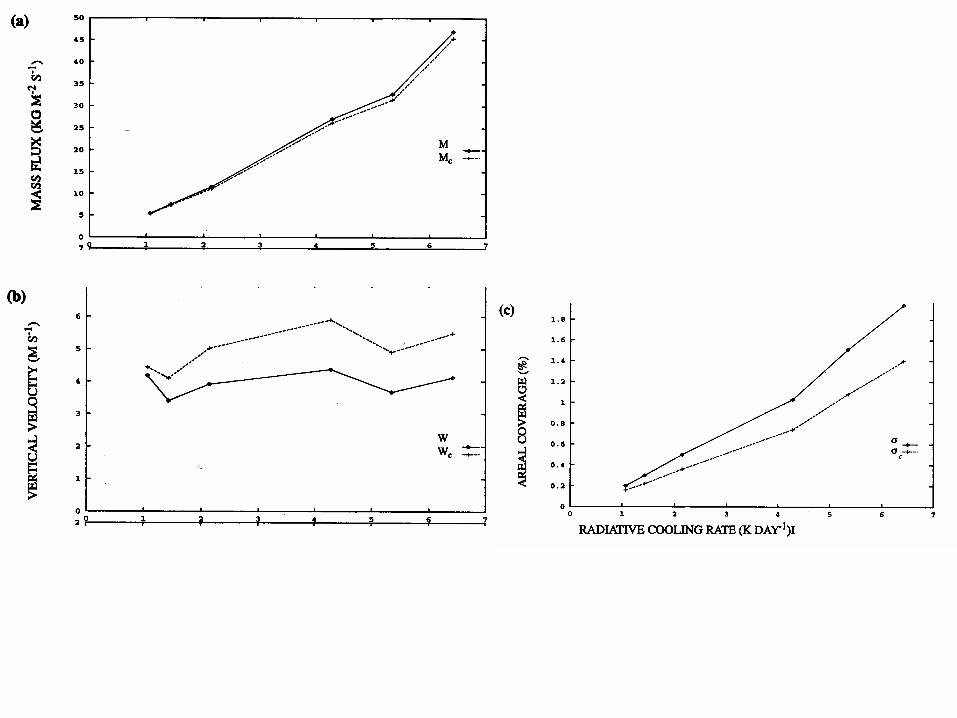
Radiative-Moist Convective Equilibrium
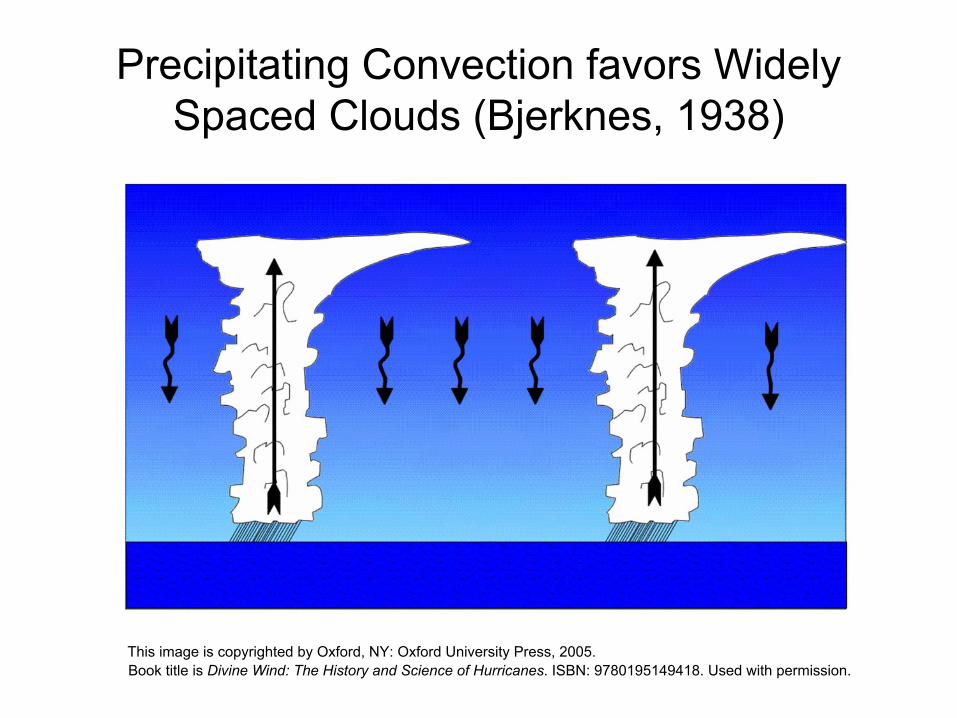
Precipitating Convection favors Widely Spaced Clouds (Bjerknes, 1938)
This image is copyrighted by Oxford, NY: Oxford University Press, 2005.Book title is Divine Wind: The History and Science of Hurricanes. ISBN: 9780195149418. Used with permission.
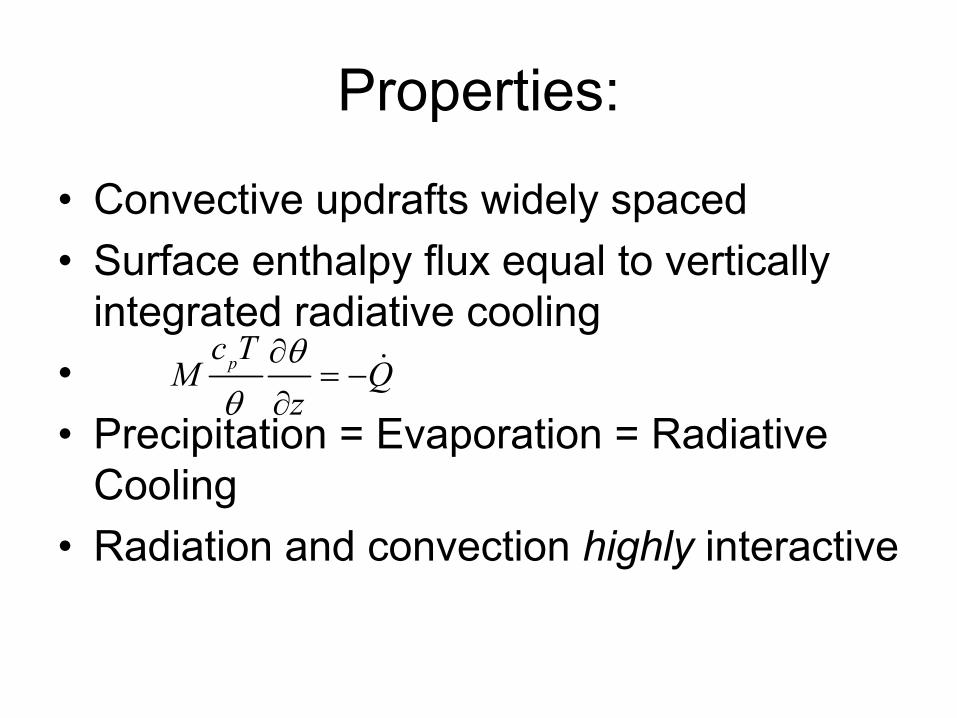
Properties:
• Convective updrafts widely spaced• Surface enthalpy flux equal to vertically
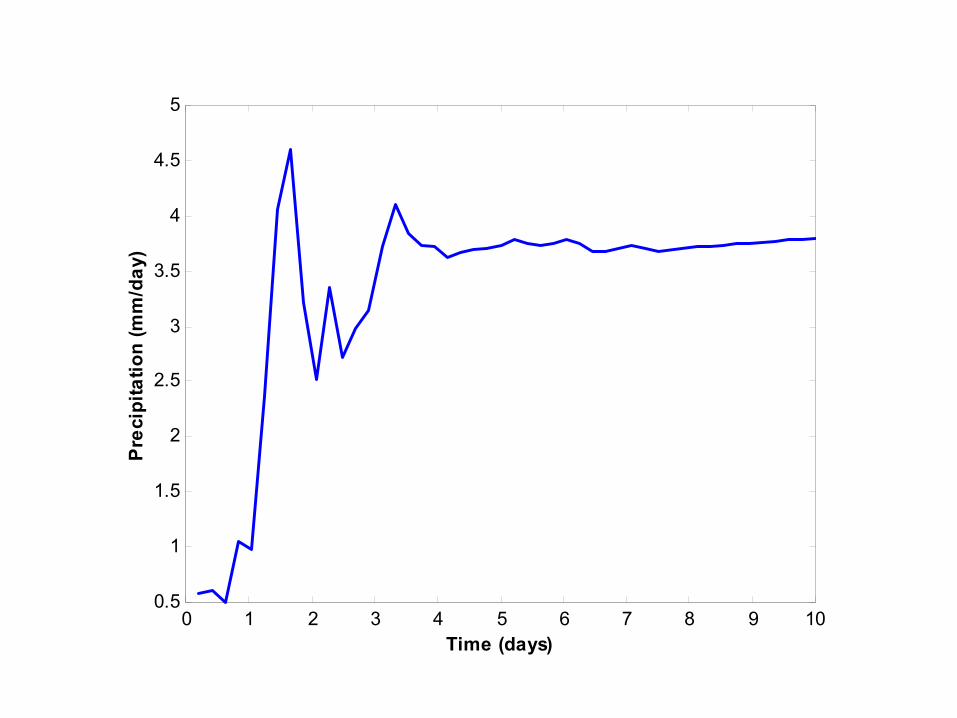
integrated radiative cooling•• Precipitation = Evaporation = Radiative
Cooling • Radiation and convection highly interactive
c TM p ∂θ
= −Qθ ∂z
5
4.5
4
3.5
3
2.5
2
1.5
1
0.5
)ya (m
m/d
niotait
ipceP
r
0 1 2 3 4 5 6 7 8 9 10Time (days)
This image is copyrighted by Academic Press, NY, 1999. It is in a chapter entitled "Quasi-equilibrium Thinking" (author is Kerry Emanuel) that appears in the book entitled General Circulation Model Development: Past, Present and Future. Edited by D. Randall. ISBN: 9780125780100. Used with permission.
This image is copyrighted by Academic Press, NY, 1999. It is in a chapter entitled "Quasi-equilibrium Thinking" (author is Kerry Emanuel) that appears in the book entitled General Circulation Model Development: Past, Present and Future. Edited by D. Randall. ISBN: 9780125780100. Used with permission.
This image is copyrighted by Academic Press, NY, 1999. It is in a chapter entitled "Quasi-equilibrium Thinking" (author is Kerry Emanuel) that appears in the book entitled General Circulation Model Development: Past, Present and Future. Edited by D. Randall. ISBN: 9780125780100. Used with permission.
This image is copyrighted by Academic Press, NY, 1999. It is in a chapter entitled "Quasi-equilibrium Thinking" (author is Kerry Emanuel) that appears in the book entitled General Circulation Model Development: Past, Present and Future. Edited by D. Randall. ISBN: 9780125780100. Used with permission.
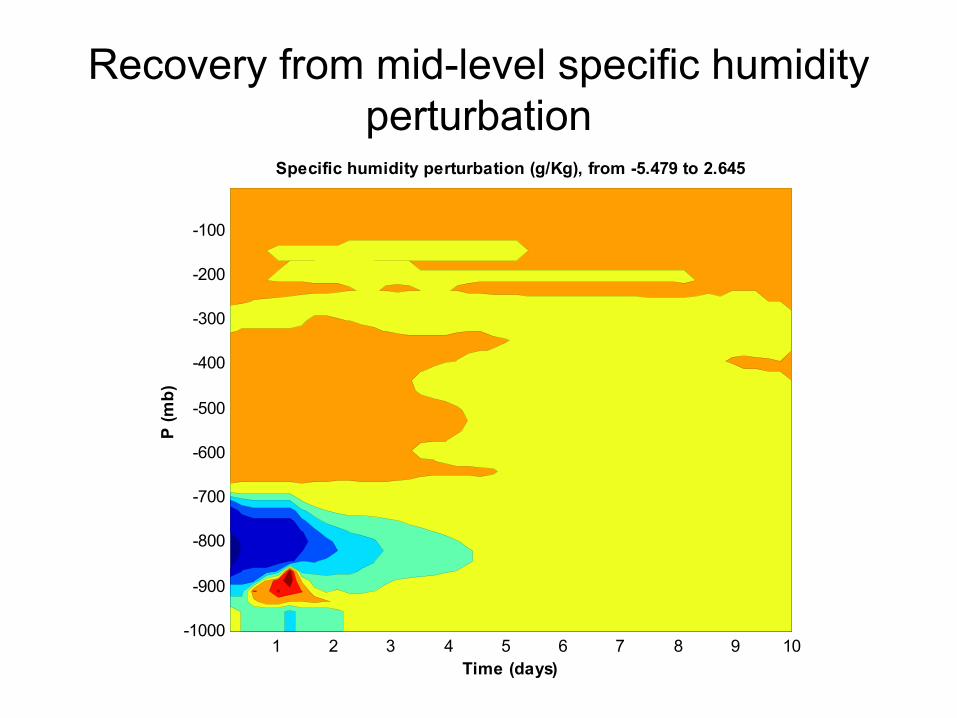
Recovery from mid-level specific humidity perturbation
1 2 3 4 5 6 7 8 9 10-1000
-900
-800
-700
-600
-500
-400
-300
-200
-100
Specific humidity perturbation (g/Kg), from -5.479 to 2.645
Time (days)
P (m
b)
-100
-200
-300
-400
-500
-600
-700
-800
-900
-1000
)bm
P (
1 2 3 4 5 6 7 8 9 10
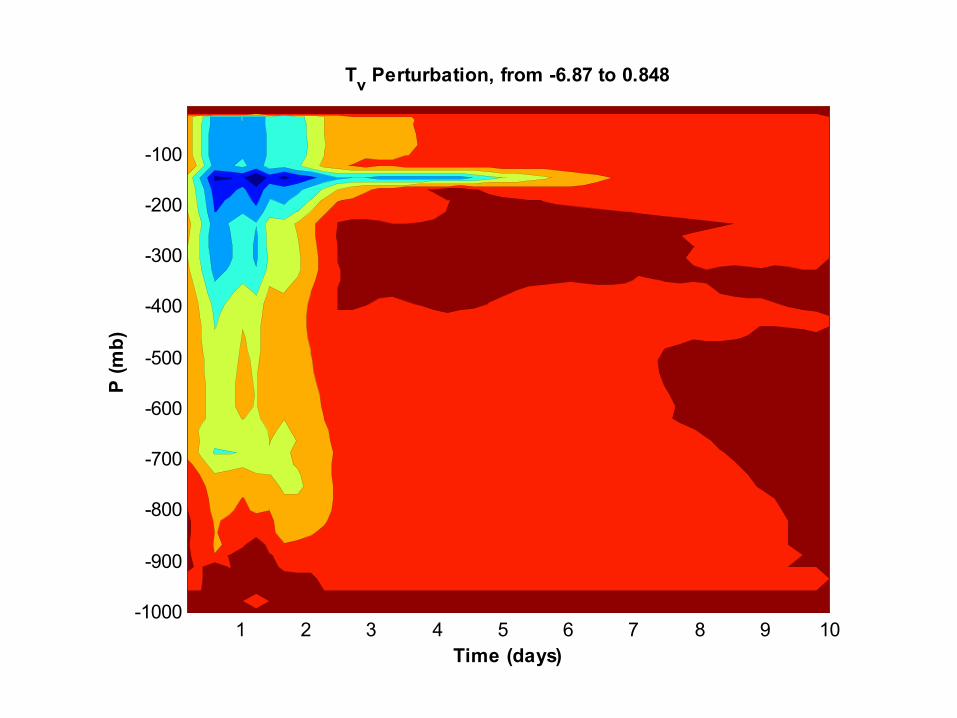
T Perturbation, from -6.87 to 0.848v
Time (days)
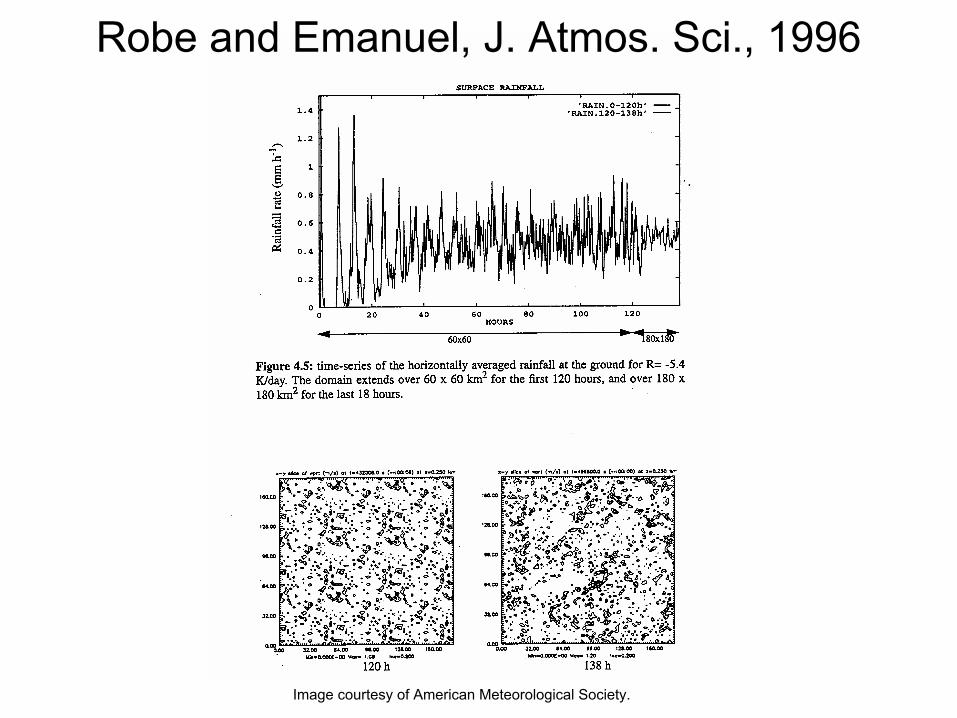
Robe and Emanuel, J. Atmos. Sci., 1996
Image courtesy of American Meteorological Society.
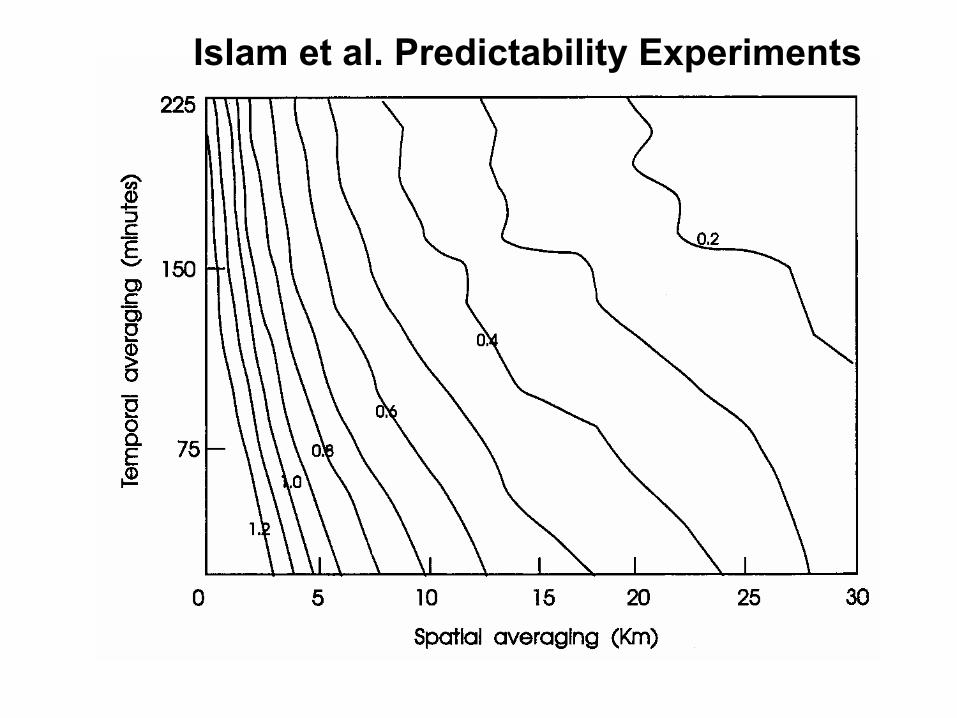
Islam et al. Predictability Experiments
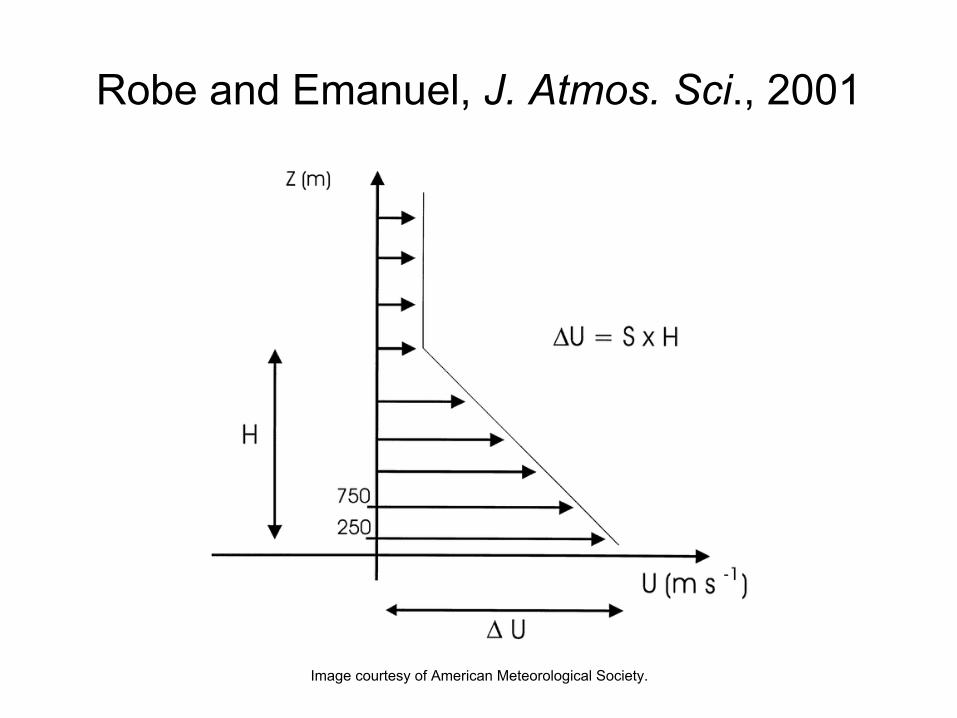
Robe and Emanuel, J. Atmos. Sci., 2001
Image courtesy of American Meteorological Society.
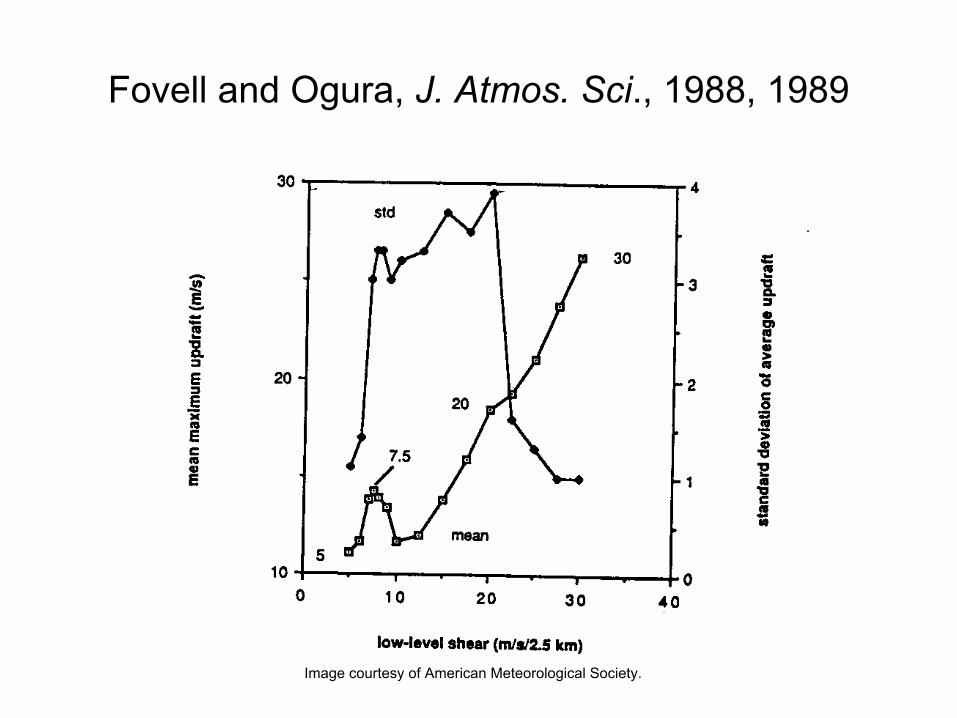
Fovell and Ogura, J. Atmos. Sci., 1988, 1989
Image courtesy of American Meteorological Society.
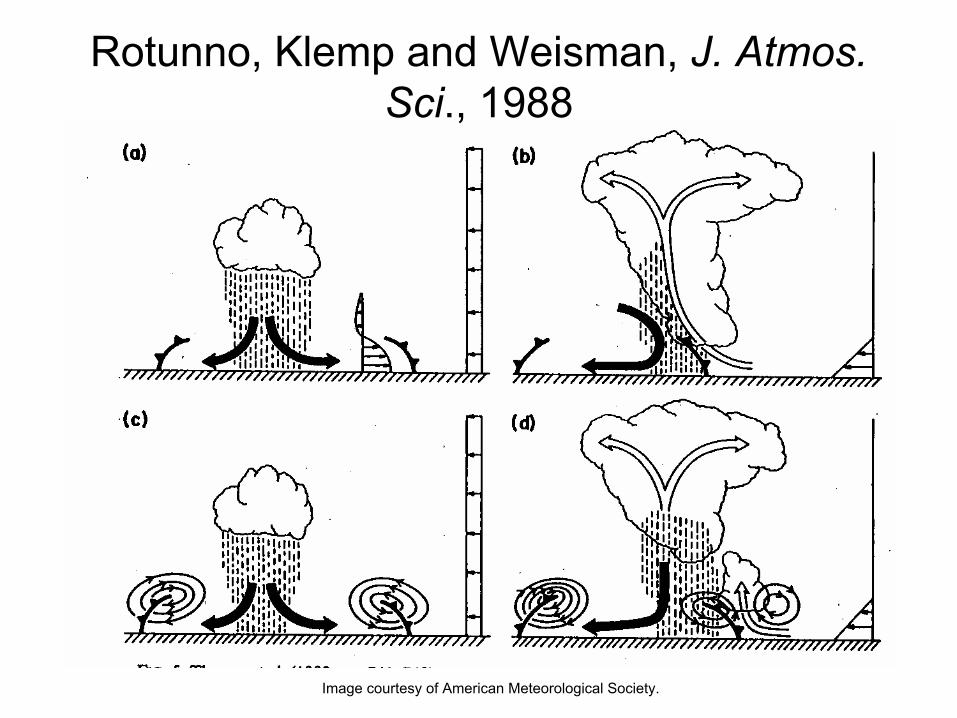
Rotunno, Klemp and Weisman, J. Atmos. Sci., 1988
Image courtesy of American Meteorological Society.
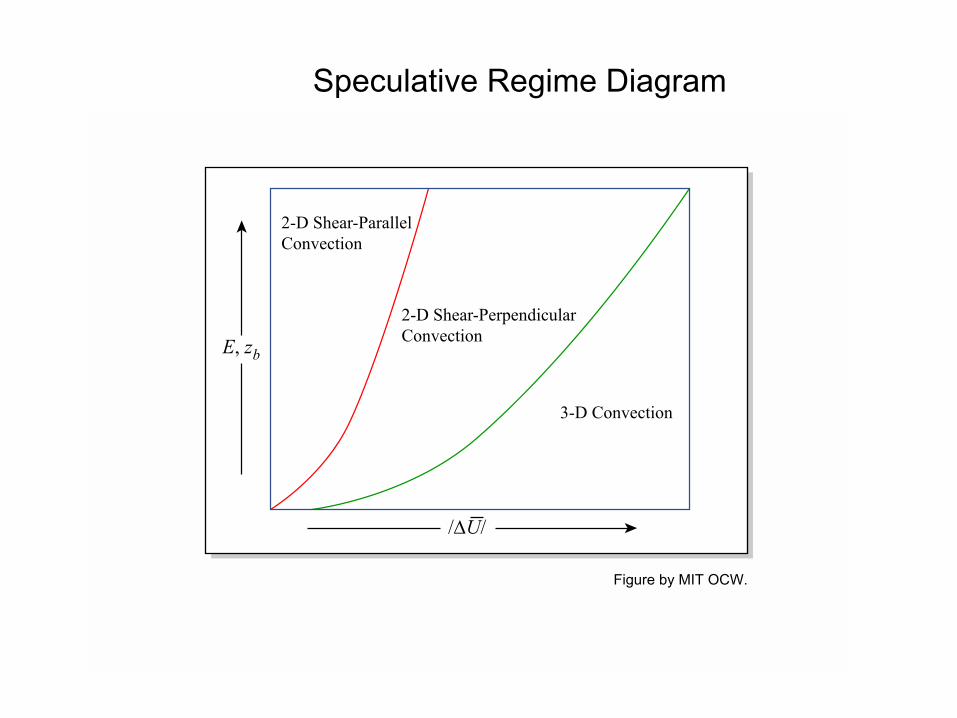
Speculative Regime Diagram
2-D Shear-ParallelConvection
3-D Convection
2-D Shear-PerpendicularConvectionE, zb
/∆U/
Figure by MIT OCW.
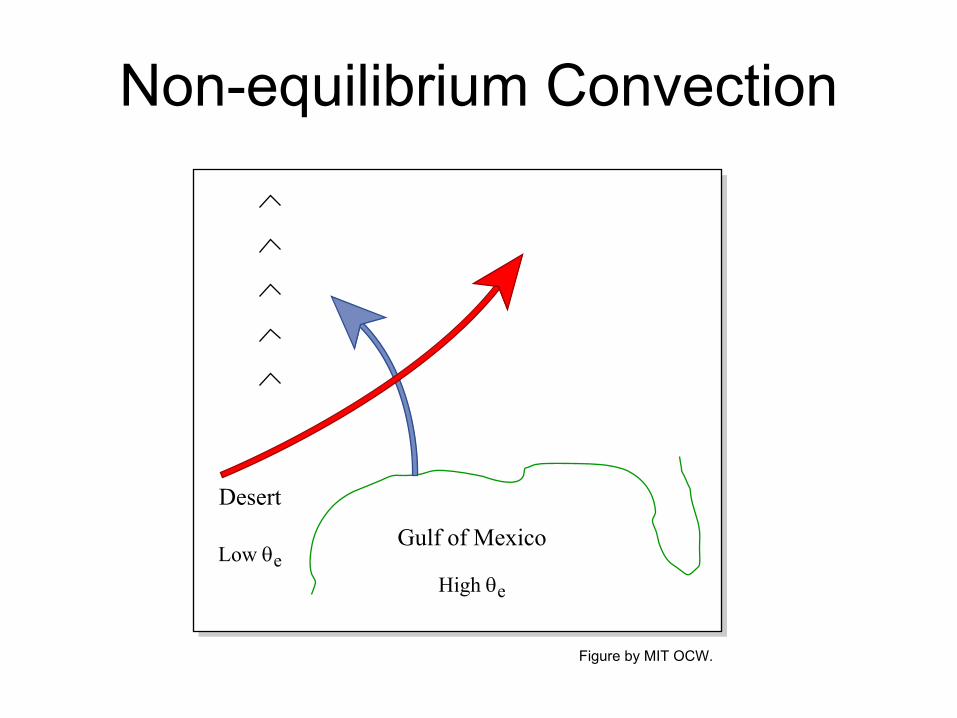
Non-equilibrium Convection
Gulf of Mexico
Desert
Low θeHigh θe
Figure by MIT OCW.
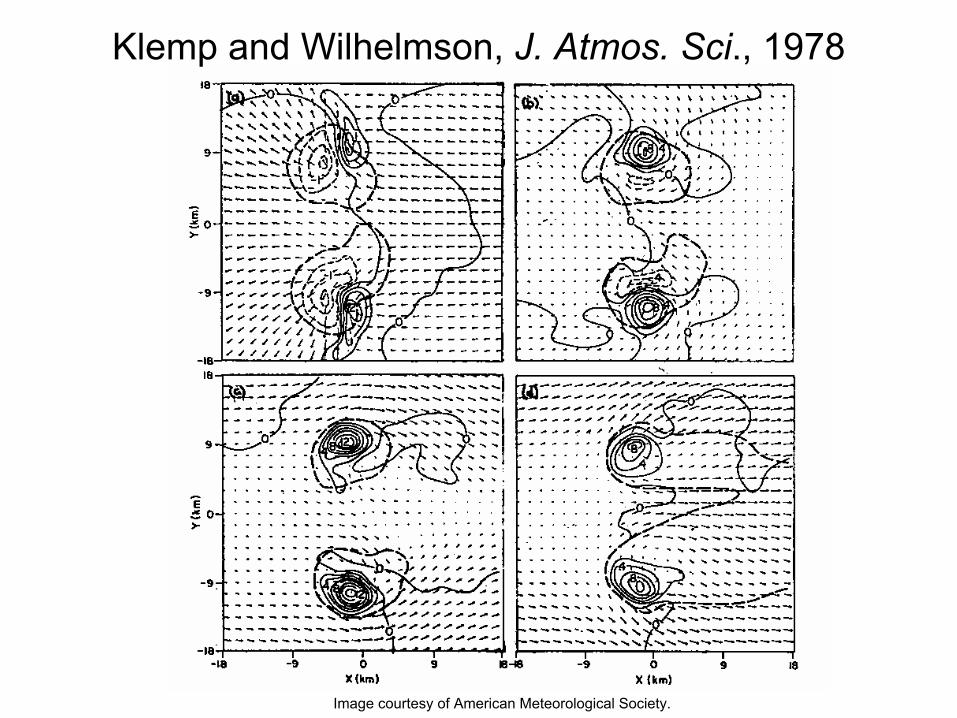
Klemp and Wilhelmson, J. Atmos. Sci., 1978
Image courtesy of American Meteorological Society.