Embed Size (px)
Citation preview

Attività del nodo di Alessandria
Enrico Scalas
www.econophysics.org
www.mfn.unipmn.it/~scalas/fisr.html
ENOC 05 Eindhoven, The Netherlands, 7-12 August 2005

Riassunto
• A4.1 e A4.4 Risultati
• A4.1 e A4.4 Il futuro
• A4.2 e A4.3 Nuovi risultati
• Due presentazioni (ENOC’05 e WEHIA 2005)

A Lévy-noise generator
Matteo Leccardi and Enrico Scalas
www.econophysics.org
www.mfn.unipmn.it/~scalas/fisr.html
ENOC 05 Eindhoven, The Netherlands, 7-12 August 2005
Summary
• Theory (and motivation)
• Algorithm
• Demo
• Conclusions
Theory

Theory (I): Continuous-time random walk(basic quantities, physical and financial intepretation)
tS : price of an asset at time t
tStx log : log price or position of a particle
, : joint probability density of jumps and of waiting times
iii txtx 1 iii tt 1
txp , : probability density function of finding log-price or position x at time t
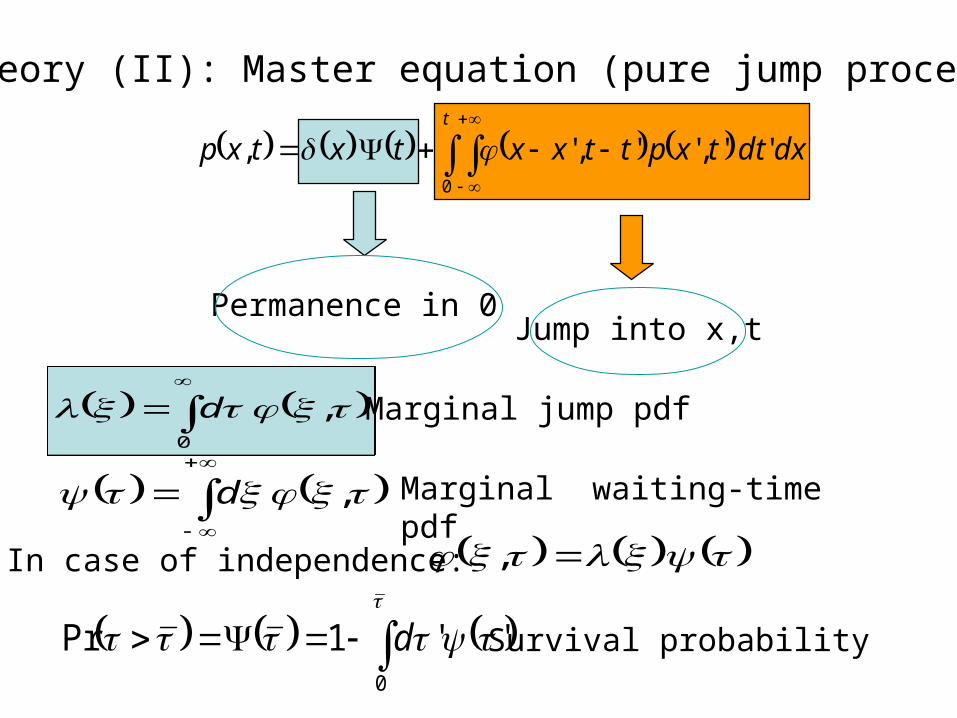
Theory (II): Master equation (pure jump process)
0
, d
, d
Marginal jump pdf
Marginal waiting-time pdf
,
Permanence in 0Jump into x,t
In case of independence:
0
' '1Pr d Survival probability
' ' ','',' ,0
dxdttxpttxxtxtxpt
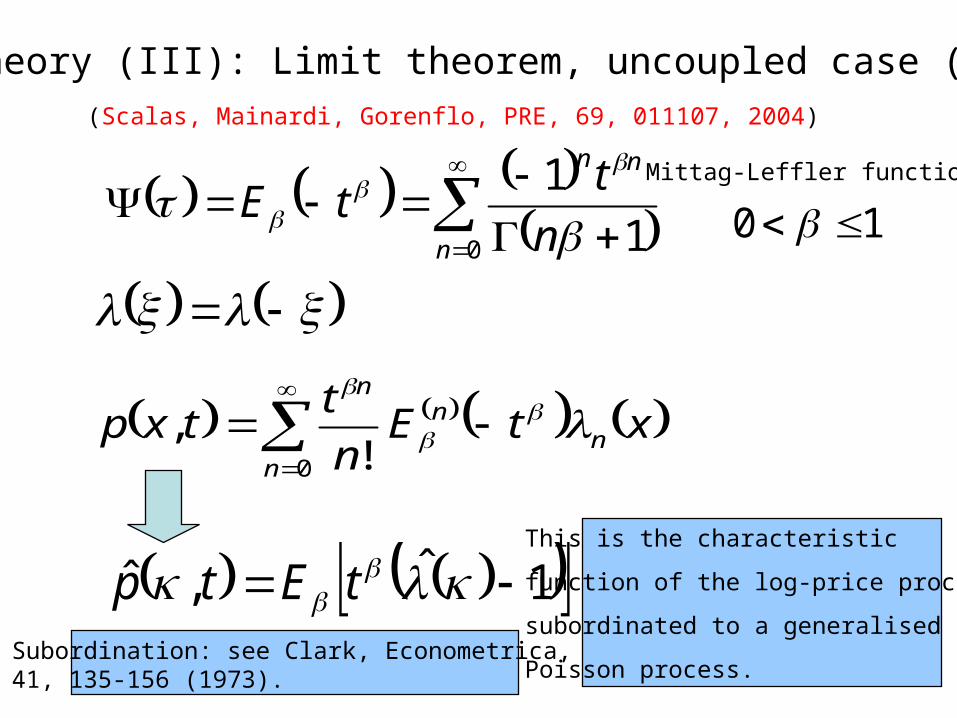
This is the characteristic
function of the log-price process
subordinated to a generalised
Poisson process.
Theory (III): Limit theorem, uncoupled case (I)
0 1
1
n
nn
n
ttE
(Scalas, Mainardi, Gorenflo, PRE, 69, 011107, 2004)
Mittag-Leffler function
10
0 !
,n
nn
n
xtEn
ttxp
1ˆ,ˆ tEtp
Subordination: see Clark, Econometrica, 41, 135-156 (1973).
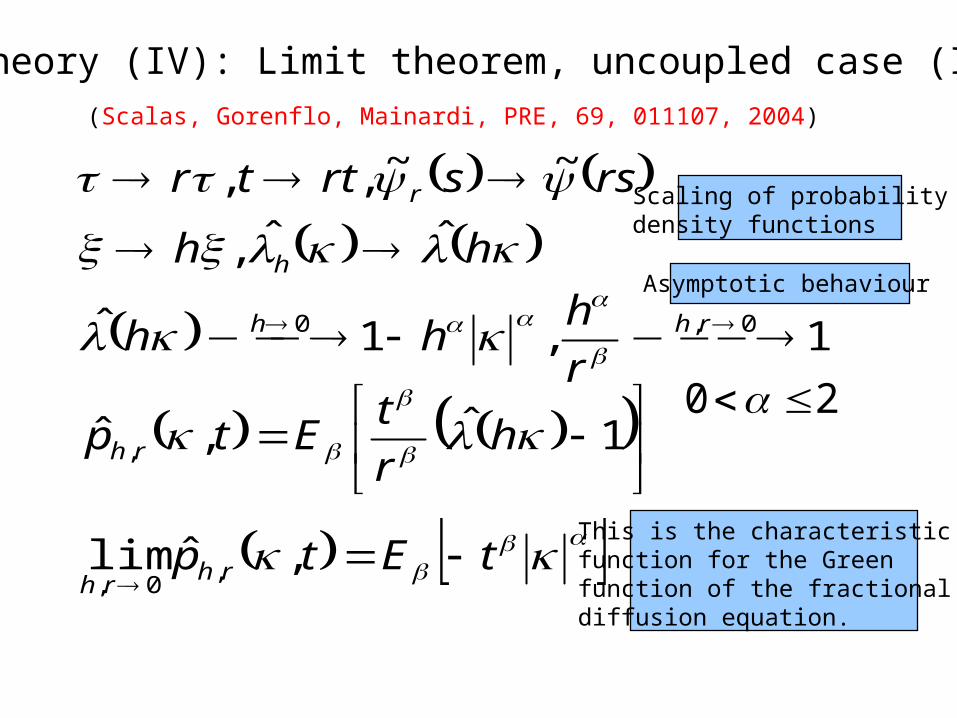
Theory (IV): Limit theorem, uncoupled case (II)(Scalas, Gorenflo, Mainardi, PRE, 69, 011107, 2004)
1ˆ,ˆ ,
hr
tEtp rh
rssrttr r ~~ , ,
hh hˆˆ ,
1 ,1ˆ 0,0 rhh
r
hhh
tEtp rh
rh
,ˆlim ,
0,
This is the characteristic function for the Greenfunction of the fractionaldiffusion equation.
20
Scaling of probabilitydensity functions
Asymptotic behaviour

Theory (V): Fractional diffusion(Scalas, Gorenflo, Mainardi, PRE, 69, 011107, 2004)
tEtu ,ˆ
txW
ttxu ,
1,
tuyidyW ,ˆ exp2
1,
1,~ˆ,
~ˆ ssussu
Green function of the pseudo-differential equation (fractional diffusion equation):
Normal diffusion
for =2, =1.

Algorithm

The Ziggurat AlgorithmMarsaglia, G., Tsang, W.W. (2000). The ziggurat method for generating random
variables. In Journal of Statistical Software, Vol. 5, Issue 8, pp.1-7.
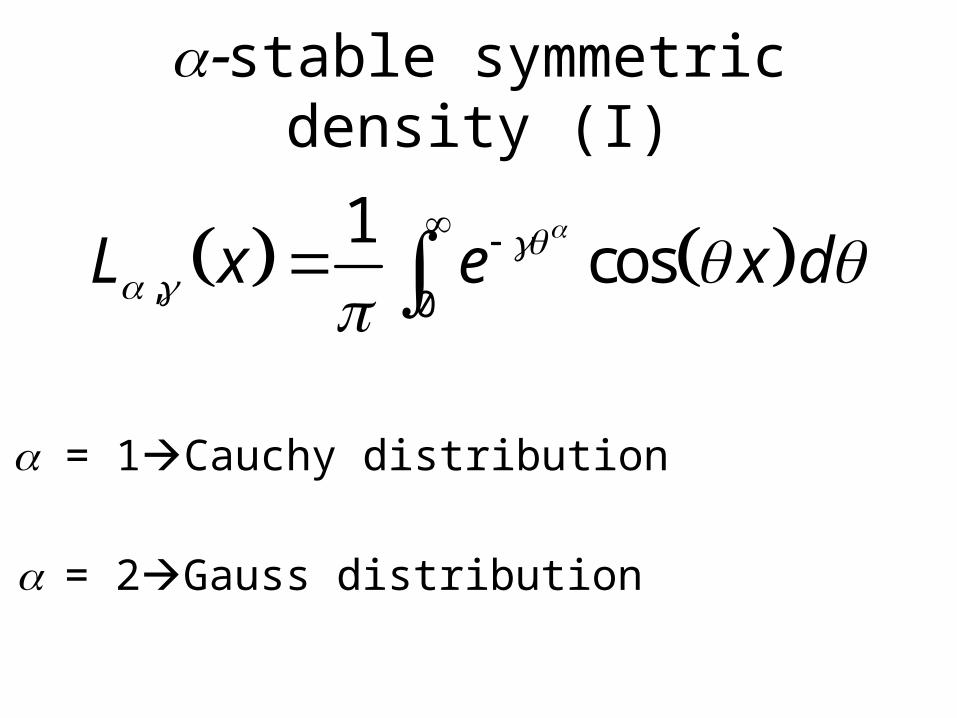
stable symmetric density (I)
, 0
1cosL x e x d
= 1Cauchy distribution
= 2Gauss distribution
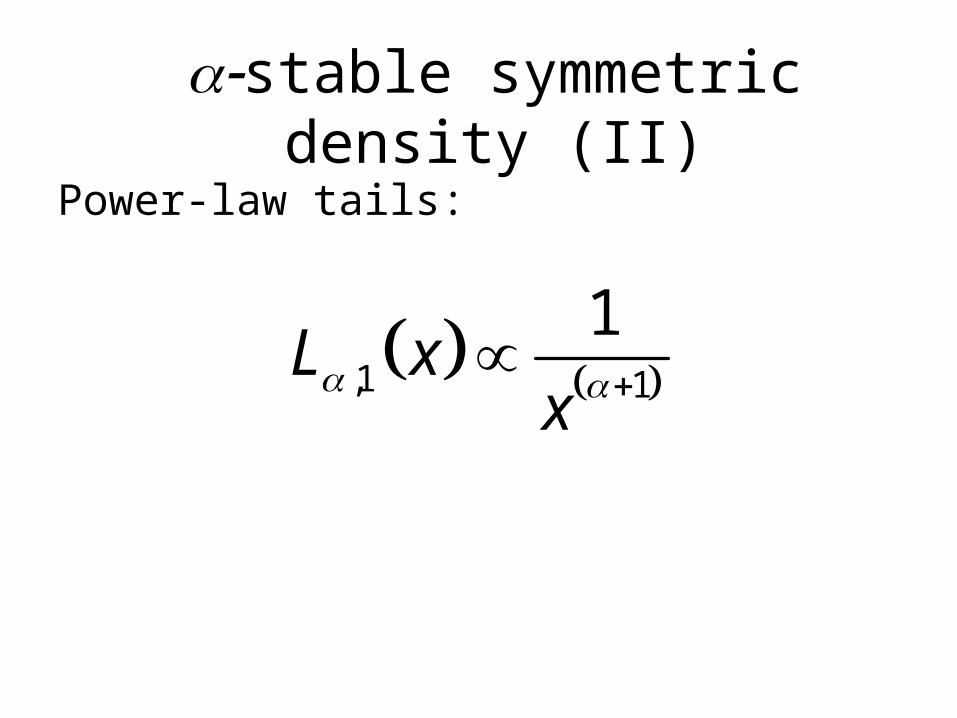
Power-law tails:
,1 1
1L x
x
stable symmetric density (II)
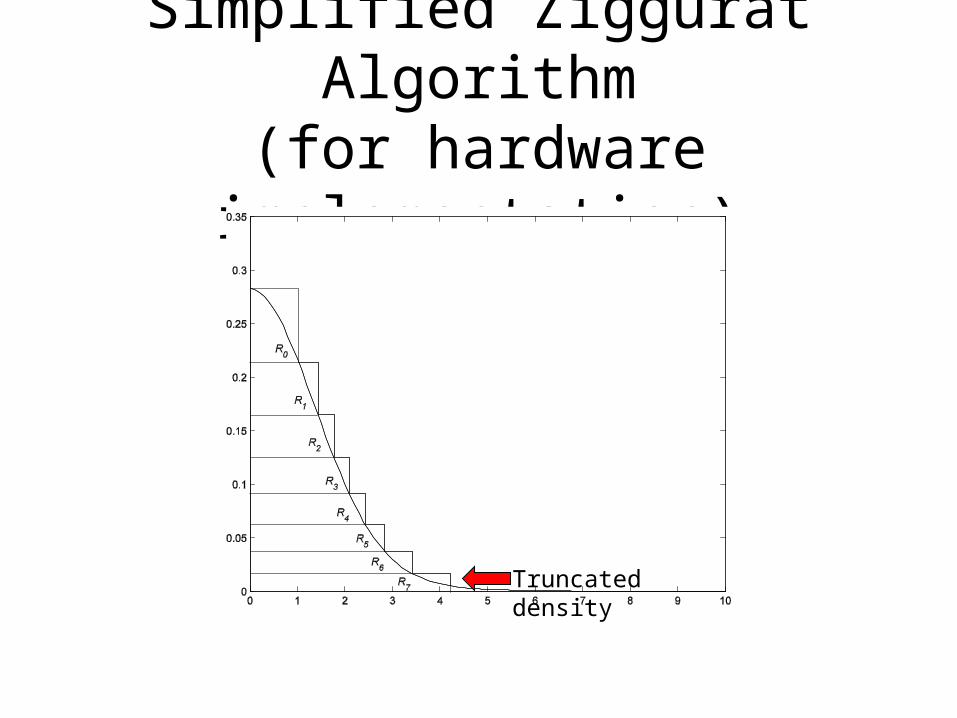
Simplified Ziggurat Algorithm(for hardware implementation)
Truncated density

FPGA (I)
• Field Programmable Gate Array
• Introduced in 1985
• Regular modular structure with interconnections
• Up to 107 logical gates

FPGA (II)
Reprogrammable
• Two kinds
OTP
• Reprogrammable: – Based on SRAM– Logic defined in LUT
• OTP– Anti-fuse technology– Logic defined with traditional logical gates
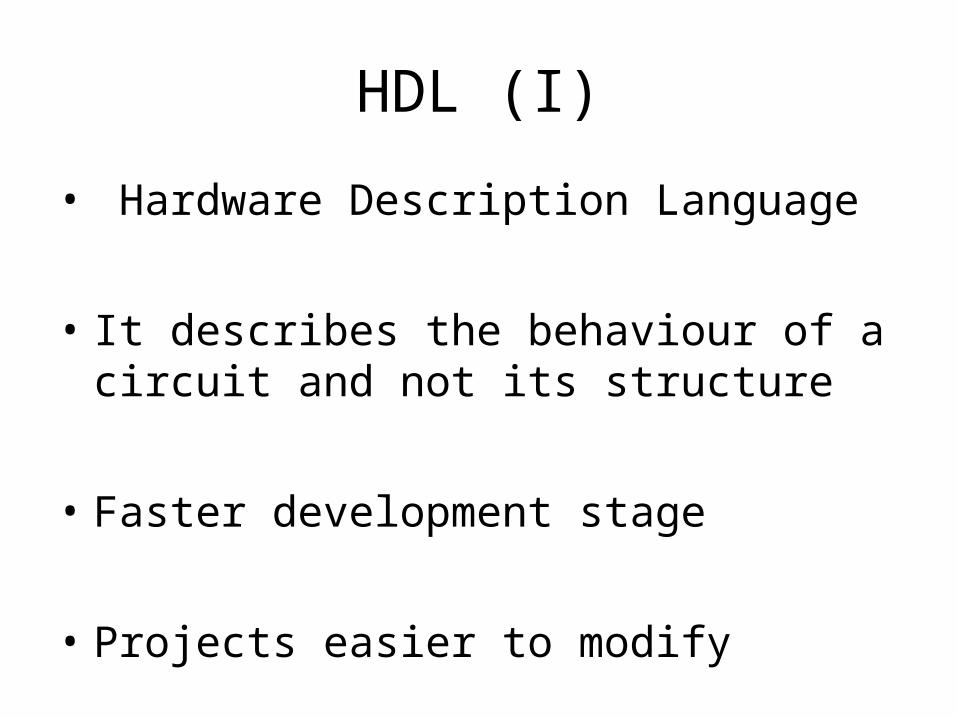
HDL (I)
• Hardware Description Language
• It describes the behaviour of a circuit and not its structure
• Faster development stage
• Projects easier to modify
HDL (II)
Verilog
• Two main dialects
VHDL
• Verilog is close to C
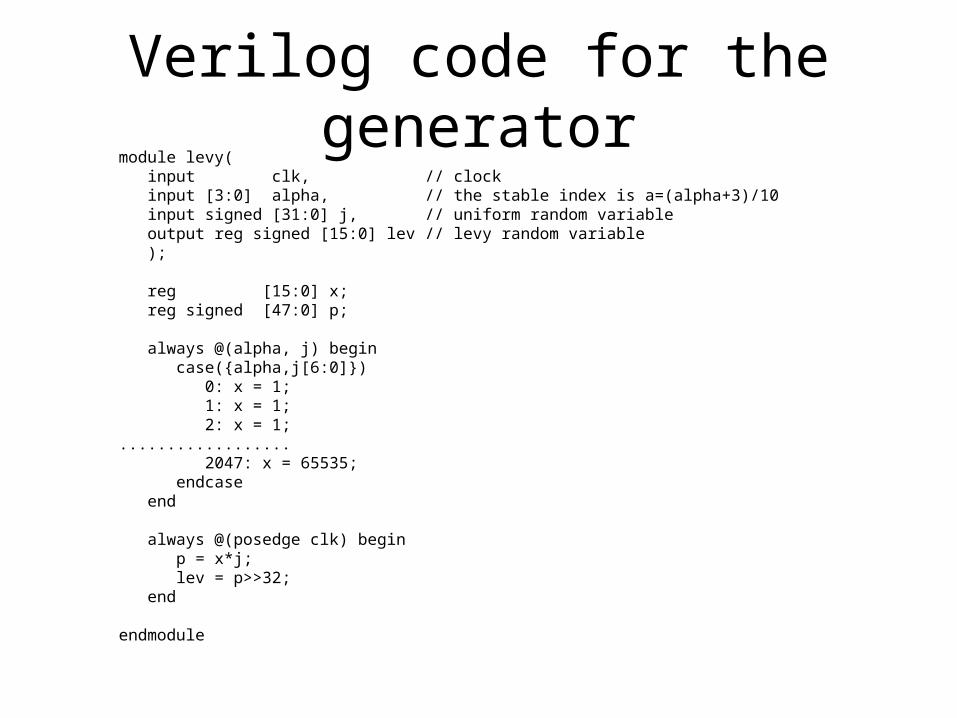
Verilog code for the generatormodule levy( input clk, // clock input [3:0] alpha, // the stable index is a=(alpha+3)/10 input signed [31:0] j, // uniform random variable output reg signed [15:0] lev // levy random variable );
reg [15:0] x; reg signed [47:0] p;
always @(alpha, j) begin case({alpha,j[6:0]}) 0: x = 1; 1: x = 1; 2: x = 1;.................. 2047: x = 65535; endcase end
always @(posedge clk) begin p = x*j; lev = p>>32; end
endmodule

Algorithm test (I)=1.7, =1350
-4 -3 -2 -1 0 1 2 3 4
x 104
0
0.5
1
1.5
2
2.5
3x 10
-4
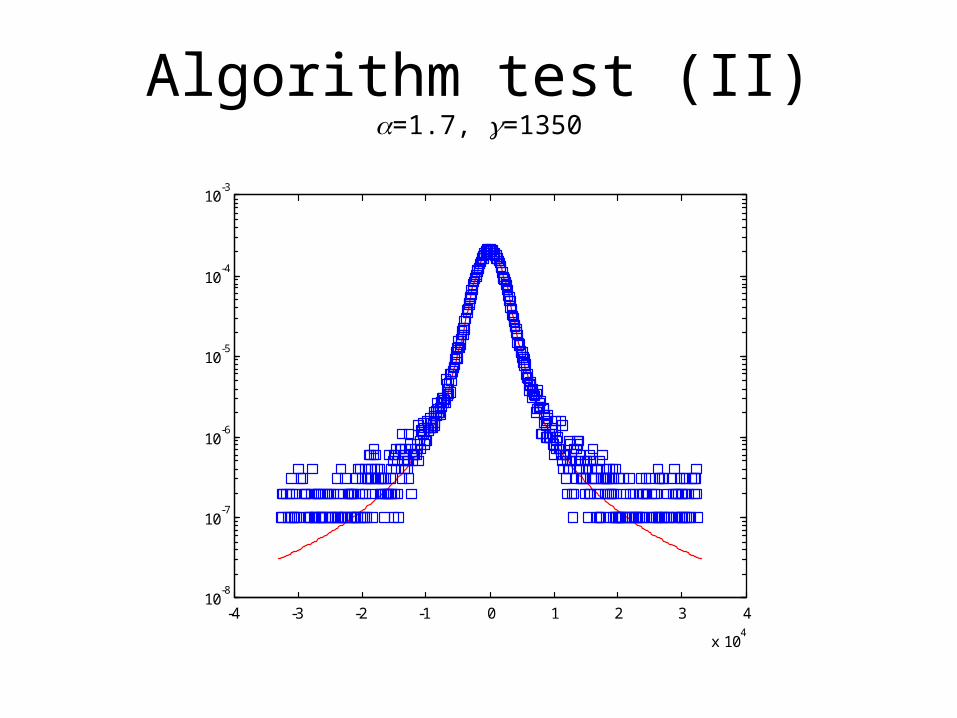
Algorithm test (II)=1.7, =1350
-4 -3 -2 -1 0 1 2 3 4
x 104
10-8
10-7
10-6
10-5
10-4
10-3
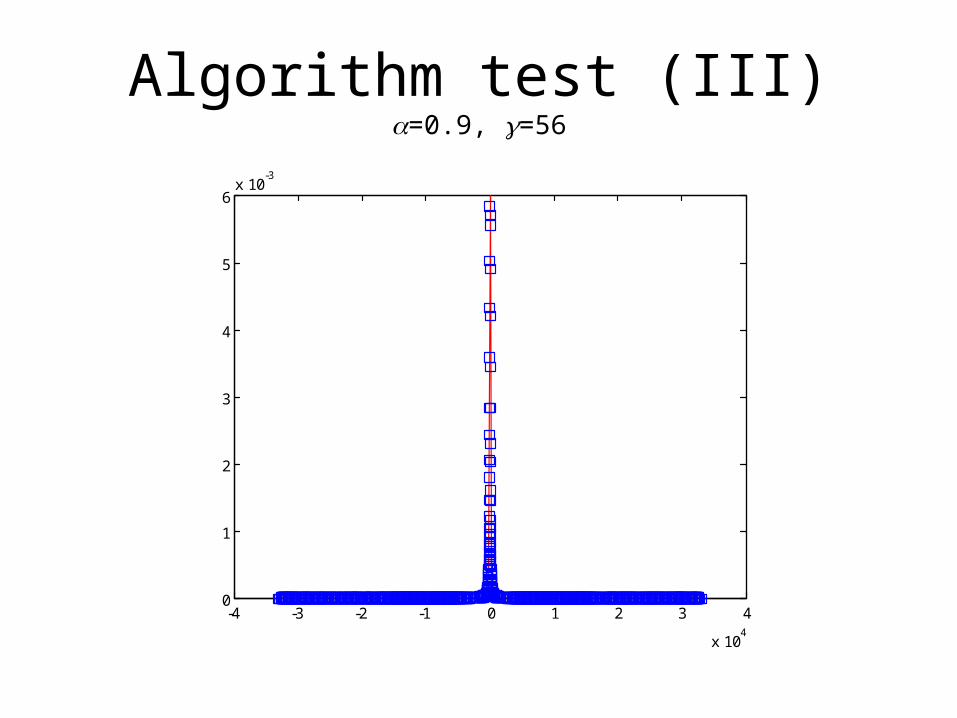
Algorithm test (III)=0.9, =56
-4 -3 -2 -1 0 1 2 3 4
x 104
0
1
2
3
4
5
6x 10
-3
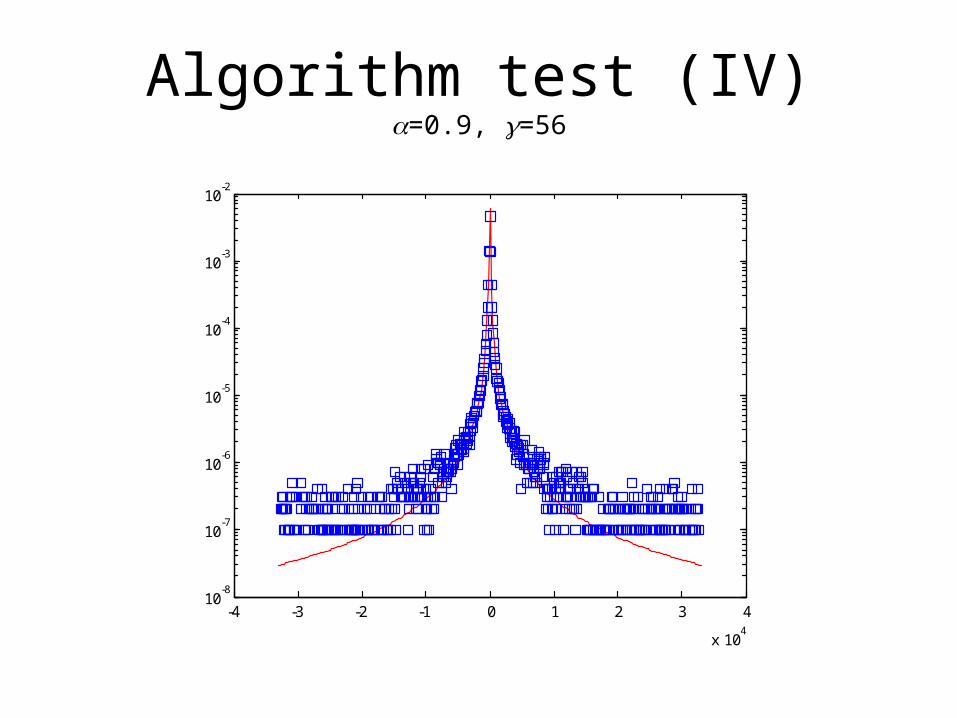
Algorithm test (IV)=0.9, =56
-4 -3 -2 -1 0 1 2 3 4
x 104
10-8
10-7
10-6
10-5
10-4
10-3
10-2

Kolmogorov-Smirnov Test d d(1) 5% d(2) 15%
0.6 0.12675 0.018144 0.014423 FALSE FALSE
0.7 0.03891 0.017084 0.013581 FALSE FALSE
0.8 0.01512 0.016212 0.012888 TRUE FALSE
0.9 0.00728 0.015279 0.012145 TRUE TRUE
1 0.006597 0.014565 0.011578 TRUE TRUE
1.1 0.005782 0.013893 0.011044 TRUE TRUE
1.2 0.004181 0.013207 0.010499 TRUE TRUE
1.3 0.004086 0.012759 0.010143 TRUE TRUE
1.4 0.005121 0.012235 0.009726 TRUE TRUE
1.5 0.004473 0.011592 0.009215 TRUE TRUE
1.6 0.003302 0.011123 0.008842 TRUE TRUE
1.7 0.005585 0.010531 0.008372 TRUE TRUE
1.8 0.004317 0.009908 0.007876 TRUE TRUE
1.9 0.003898 0.009226 0.007334 TRUE TRUE
1.95 0.00166 0.007558 0.006008 TRUE TRUE
1.99 0.00178 0.006787 0.005395 TRUE TRUE
Conclusions
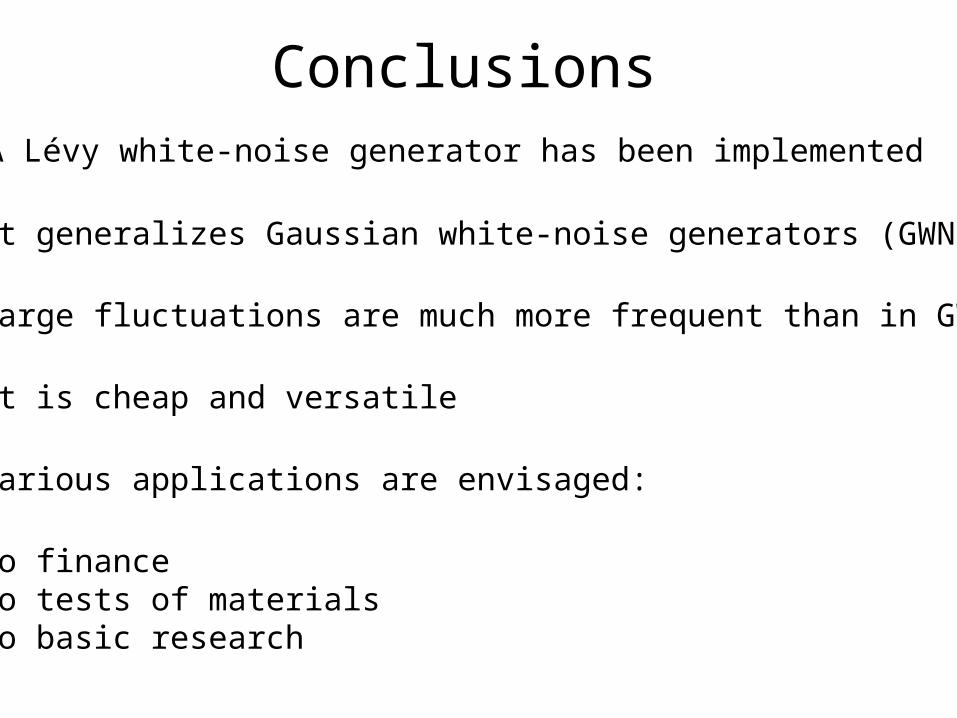
Conclusions• A Lévy white-noise generator has been implemented
• It generalizes Gaussian white-noise generators (GWNG)
• Large fluctuations are much more frequent than in GWNG
• It is cheap and versatile
• Various applications are envisaged:
• to finance• to tests of materials• to basic research• …
Enrico Scalas
(DISTA Università del Piemonte Orientale)
www.econophysics.org
www.fracalmo.org
WEHIA 2005 Colchester, Essex, UK – 13 -15 June 2005
Waiting times between orders and trades in double-auction markets

In collaboration with:
Jürgen Huber (Innsbruck)
Taisei Kaizoji (Tokyo)
Michael Kirchler (Innsbruck)
Alessandra Tedeschi (Rome)

Summary
• The continuous double auction
• Experiments
• Empirical results
• Discussion and conclusions
The continuous double auction
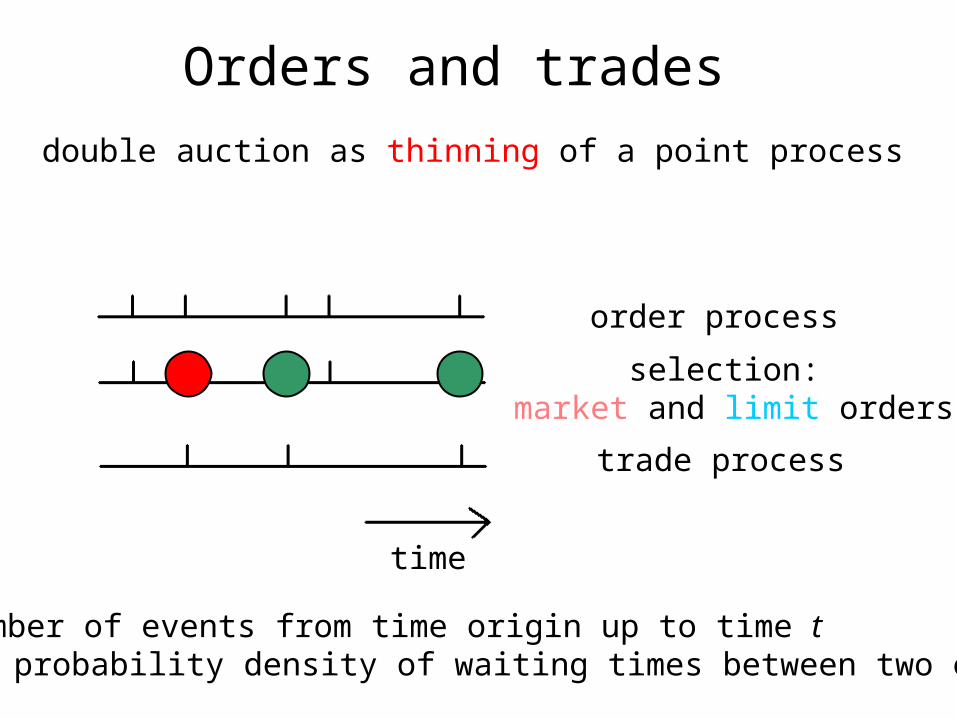
Orders and trades
time
order process
trade process
selection: market and limit orders
double auction as thinning of a point process
n: number of events from time origin up to time t (): probability density of waiting times between two events
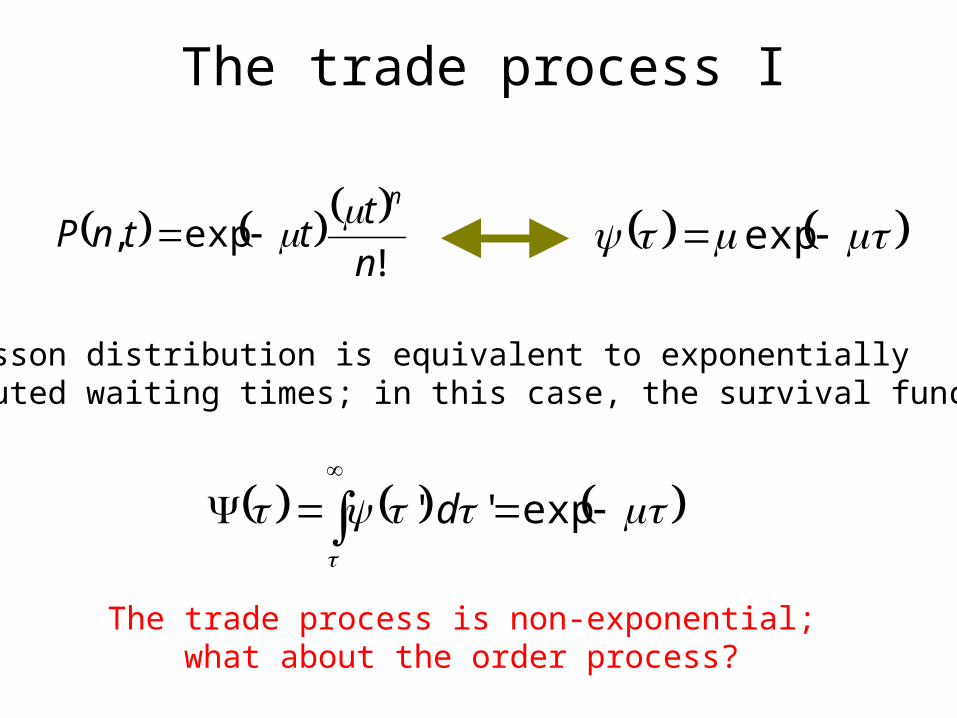
The trade process I
!
exp,n
tttnP
n exp
The Poisson distribution is equivalent to exponentially distributed waiting times; in this case, the survival function is:
exp' ' d
The trade process is non-exponential;what about the order process?
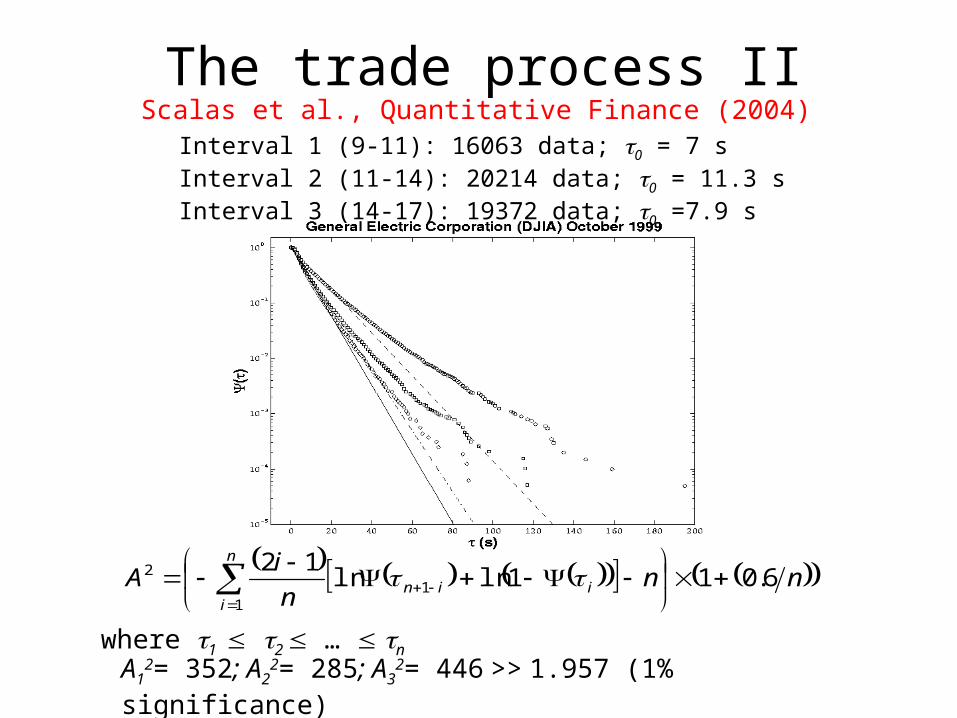
Interval 1 (9-11): 16063 data; 0 = 7 sInterval 2 (11-14): 20214 data; 0 = 11.3 sInterval 3 (14-17): 19372 data; 0 =7.9 s
nnn
iA iin
n
i
6.011lnln12
11
2
where 1 2 … n A1
2= 352; A22= 285; A3
2= 446 >> 1.957 (1% significance)
The trade process IIScalas et al., Quantitative Finance (2004)

Experiments

Experiments I• Experiments generalize Hellwig’s model (1982)• Generalization based on Schredelseker (2002)• Hellwig: traders do or do not know future 1-period dividends• Schredelseker: there are n discrete information levels Kirchler/Huber/Sutter: n traders compete in a continuousdouble auction market; trader i knows future dividends Di for i periods; i = 1,…, n. She also knows thenet present value of the stock given her information:
2
1
1,
11|
jk
kiki
e
i
ej
e
jkkj
r
D
rr
DIVE
Ij,k: information in period k, for agent j;re: risk adjusted interest rate

Experiments II
Beginning with I9, the functions in the Figure are shifted for each information level Ij by (9-j) periods to the right, showing a main characteristic of the model, namely that better informed agents receive information earlier than less informed traders. So, information on the intrinsic value of the company that trader I9 sees in one period is seen by trader I8 one period later, and by trader I1 eight periods later, giving the better informed an informational advantage.
For more details on the design, see Kirchler and Huber (2005).
n = 9
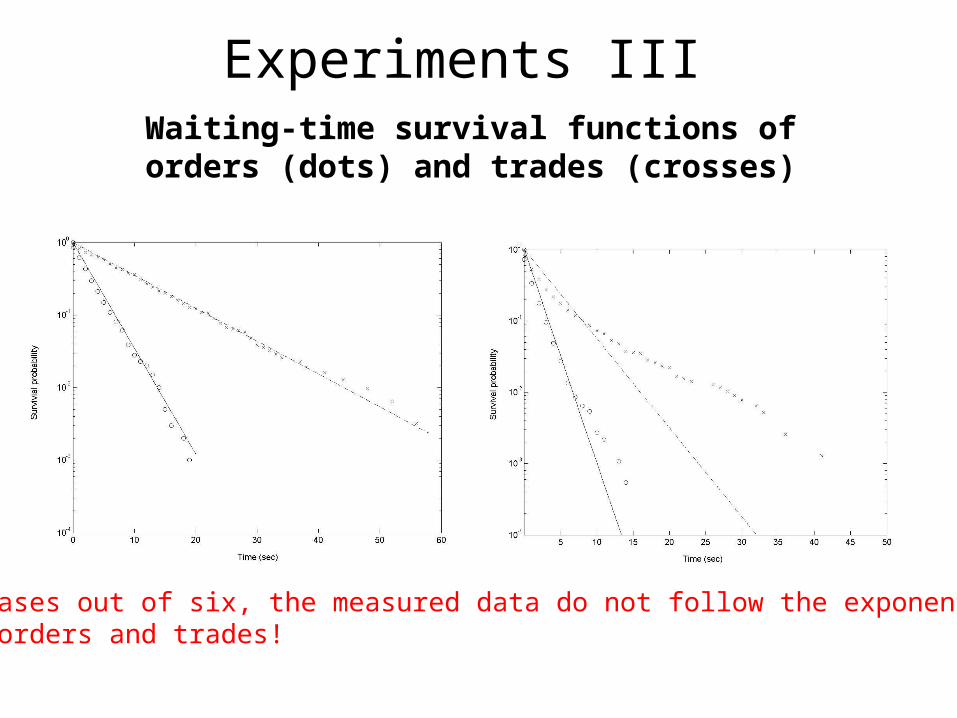
Experiments IIIWaiting-time survival functions of orders (dots) and trades (crosses)
in five cases out of six, the measured data do not follow the exponential law both for orders and trades!
Empirical results
Empirical results I
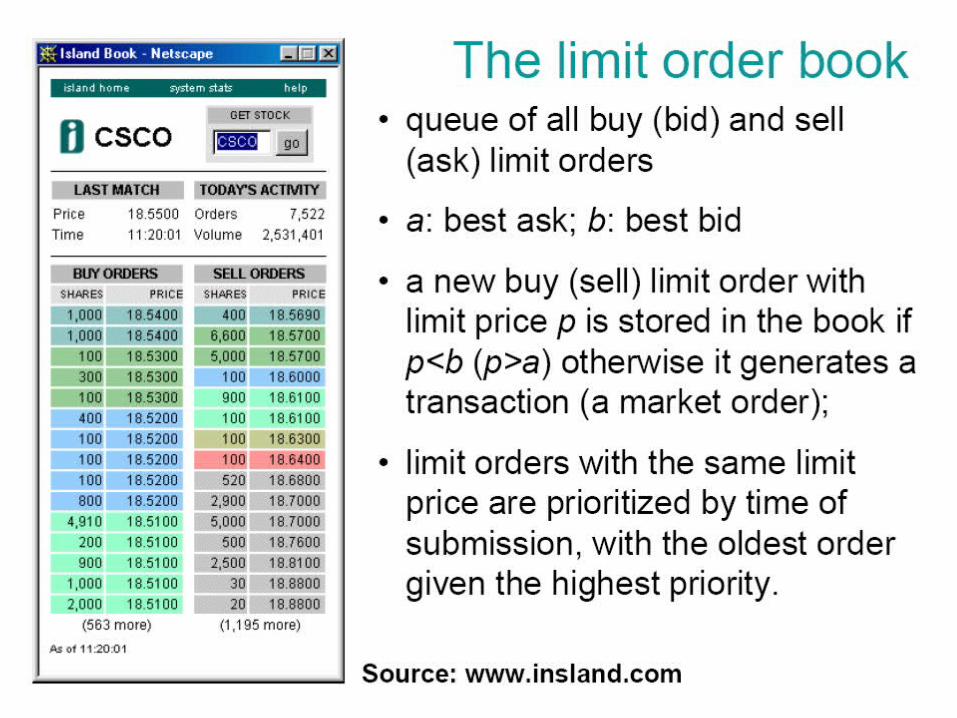
• Order data from the LSE
• Full order book available for the electronic market
• Glaxo Smith Kline (GSK) and Vodafone (VOD)March, June and October 2002
• Nearly 800,000 orders and 540,000 trades analyzed • Both limit and market orders have been included

Empirical results II
There is always excess standard deviation;the null hypothesis of exponentially distributed data is always rejected.
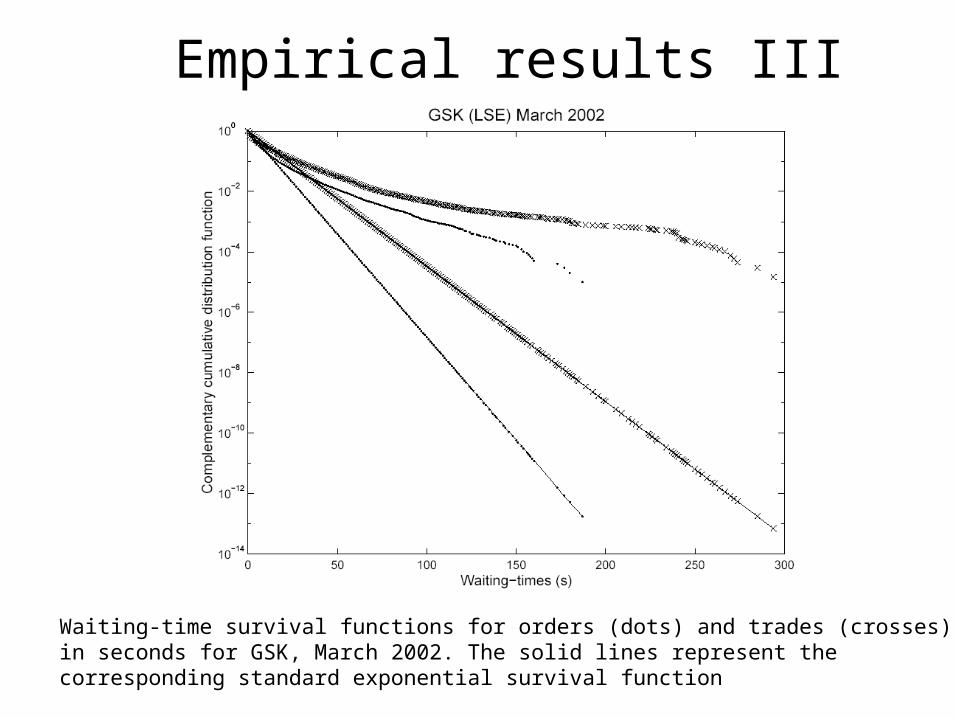
Empirical results III
Waiting-time survival functions for orders (dots) and trades (crosses) in seconds for GSK, March 2002. The solid lines represent the corresponding standard exponential survival function

Discussion and conclusions
Discussions and conclusions
Why should we bother? This has to do with the marketprice formation mechanism and with the order process. If the order process is modeled by means of a Poisson distribution (exponential survival function), its random thinningshould yield another Poisson distribution. This is not the case!
Moreover, experiments and empirical analyses show thatalready the order process cannot be described by a Poissonprocess. Researchers working in the field of agent-based market models are warned!
Simple explanation: variable human activity (see Scalaset al., Quantitative Finance 4, 695-702, 2004).