Embed Size (px)
Citation preview
1
Aus der
Klinik für Kardiologie
im Herz- und Diabeteszentrum NRW
-Universitätsklinik-
der Ruhr-Universität Bochum
Direktor: Prof. Dr. med. D. Horstkotte
Kardiale Mehrschicht - Computertomographie:
Volumetrie bei Herzinsuffizienzpatienten vor und nach kardialer
Resynchronisationstherapie
Kumulative
Inaugural-Dissertation
zur
Erlangung des Doktorgrades der Medizin
einer
Hohen Medizinischen Fakultät
der Ruhr-Universität Bochum
vorgelegt von
Janina Schröder
aus Herford
2010

2
Dekan: Prof. Dr. med. G. Muhr
1. Referent: Prof. Dr. med. D. Horstkotte
2. Referent: PD Dr. med. C. Hanefeld
Tag der Mündlichen Prüfung: 1. Februar 2011
3
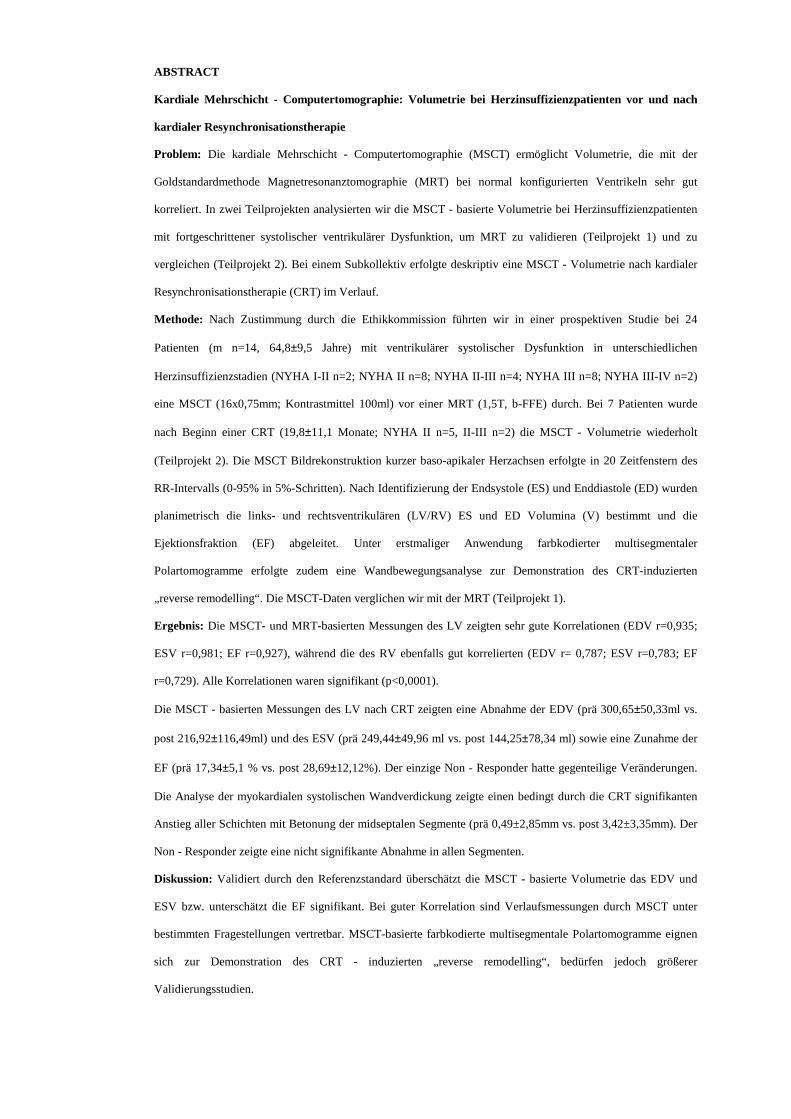
ABSTRACT
Kardiale Mehrschicht - Computertomographie: Volumetrie bei Herzinsuffizienzpatienten vor und nach
kardialer Resynchronisationstherapie
Problem: Die kardiale Mehrschicht - Computertomographie (MSCT) ermöglicht Volumetrie, die mit der
Goldstandardmethode Magnetresonanztomographie (MRT) bei normal konfigurierten Ventrikeln sehr gut
korreliert. In zwei Teilprojekten analysierten wir die MSCT - basierte Volumetrie bei Herzinsuffizienzpatienten
mit fortgeschrittener systolischer ventrikulärer Dysfunktion, um MRT zu validieren (Teilprojekt 1) und zu
vergleichen (Teilprojekt 2). Bei einem Subkollektiv erfolgte deskriptiv eine MSCT - Volumetrie nach kardialer
Resynchronisationstherapie (CRT) im Verlauf.
Methode: Nach Zustimmung durch die Ethikkommission führten wir in einer prospektiven Studie bei 24
Patienten (m n=14, 64,8±9,5 Jahre) mit ventrikulärer systolischer Dysfunktion in unterschiedlichen
Herzinsuffizienzstadien (NYHA I-II n=2; NYHA II n=8; NYHA II-III n=4; NYHA III n=8; NYHA III-IV n=2)
eine MSCT (16x0,75mm; Kontrastmittel 100ml) vor einer MRT (1,5T, b-FFE) durch. Bei 7 Patienten wurde
nach Beginn einer CRT (19,8±11,1 Monate; NYHA II n=5, II-III n=2) die MSCT - Volumetrie wiederholt
(Teilprojekt 2). Die MSCT Bildrekonstruktion kurzer baso-apikaler Herzachsen erfolgte in 20 Zeitfenstern des
RR-Intervalls (0-95% in 5%-Schritten). Nach Identifizierung der Endsystole (ES) und Enddiastole (ED) wurden
planimetrisch die links- und rechtsventrikulären (LV/RV) ES und ED Volumina (V) bestimmt und die
Ejektionsfraktion (EF) abgeleitet. Unter erstmaliger Anwendung farbkodierter multisegmentaler
Polartomogramme erfolgte zudem eine Wandbewegungsanalyse zur Demonstration des CRT-induzierten
„reverse remodelling“. Die MSCT-Daten verglichen wir mit der MRT (Teilprojekt 1).
Ergebnis: Die MSCT- und MRT-basierten Messungen des LV zeigten sehr gute Korrelationen (EDV r=0,935;
ESV r=0,981; EF r=0,927), während die des RV ebenfalls gut korrelierten (EDV r= 0,787; ESV r=0,783; EF
r=0,729). Alle Korrelationen waren signifikant (p<0,0001).
Die MSCT - basierten Messungen des LV nach CRT zeigten eine Abnahme der EDV (prä 300,65±50,33ml vs.
post 216,92±116,49ml) und des ESV (prä 249,44±49,96 ml vs. post 144,25±78,34 ml) sowie eine Zunahme der
EF (prä 17,34±5,1 % vs. post 28,69±12,12%). Der einzige Non - Responder hatte gegenteilige Veränderungen.
Die Analyse der myokardialen systolischen Wandverdickung zeigte einen bedingt durch die CRT signifikanten
Anstieg aller Schichten mit Betonung der midseptalen Segmente (prä 0,49±2,85mm vs. post 3,42±3,35mm). Der
Non - Responder zeigte eine nicht signifikante Abnahme in allen Segmenten.
Diskussion: Validiert durch den Referenzstandard überschätzt die MSCT - basierte Volumetrie das EDV und
ESV bzw. unterschätzt die EF signifikant. Bei guter Korrelation sind Verlaufsmessungen durch MSCT unter
bestimmten Fragestellungen vertretbar. MSCT-basierte farbkodierte multisegmentale Polartomogramme eignen
sich zur Demonstration des CRT - induzierten „reverse remodelling“, bedürfen jedoch größerer
Validierungsstudien.

4
Gewidmet
Stephan Schröder

1
Inhaltsverzeichnis
1. Einleitung 1
2. Zielsetzung 2
3. Material und Methoden 3
3.1 Patienten 3
3.2 MSCT 4
3.3 MRT 5
3.4 Bildanalyse mittels MRT und MSCT 5
3.5 Echokardiographie 6
3.6 Statistische Analyse 7
4. Ergebnisse: 7
4.1 MRT vs. MSCT 7
4.2 MSCT vor und nach CRT 11
5. Diskussion: 14
5.1 Vergleich MSCT und MRT 15
5.2 MSCT vor und nach CRT 18
5.3 Limitationen 22
Literaturverzeichnis 24
1
ZUSAMMENFASSUNG
1. Einleitung:
Die Pumpfunktion des linken Ventrikels ist am exaktesten durch die
Auswurfleistung (Ejektionsfraktion, EF) beschrieben. Die EF ist der Anteil am
enddiastolischen Volumen, der während der Systole antegrad getroffen wird. Zur
Berechnung der EF müssen das enddiastolische (ED) und das endsystolische (ES)
Volumen (V) bestimmt werden. Das Unterschreiten einer EF unter gegebenen
Bedingungen definiert eine eingeschränkte systolische Pumpfunktion. Die EF ist
unter anderem abhängig von der linksventrikulären Vor- und Nachlast und ein
geeigneter prognostischer Parameter. Veränderungen der linksventrikulären EF
unter einer Therapie erlauben die Beurteilung des Therapieerfolges.
Eine dieser Therapieoptionen bei geeigneten Patienten ist die kardiale
Resynchronisationstherapie (CRT). Dabei wird neben dem rechten Herzen, wie bei
einem Zweikammerschrittmacher, auch die linke Herzkammer über den
Koronarvenensinus in den Stimulationsprozess miteinbezogen. Durch die
koordinierte elektrische Stimulation der beiden Herzkammern wird die
Synchronisation der Ventrikel wieder hergestellt (resynchronisiert).
Für einen Teil der Herzinsuffizienzpatienten ist die CRT eine erfolgsversprechende
Therapieoption. Mittels CRT konnte eine prognostisch relevante Verringerung der
pathologisch vergrößerten EDV und ESV bzw. Steigerung der EF erzielt werden
[1].
Bei der Anwendung zweidimensionaler Techniken zur Beurteilung der EF, z. B.
mittels transthorakaler 2D Echokardiographie, ergeben sich mehrere Probleme.
Beispielsweise ist die Beurteilung vergrößerter Ventrikelvolumina als Folge
zugrunde gelegter geometrischer Modelle eingeschränkt. Ein weiterer limitierender
Faktor ist die relativ hohe „Interoperator“- und „Interstudy“-Variabilität [4].
Geringste Änderungen in der Längen- und Breitenbestimmung des Ventrikels
2
können über die Formel des Rotationsellipsoides extreme Fehlerfortpflanzungen
verursachen. Dies ist insbesondere relevant, wenn Ejektionsfraktionsänderungen zu
beurteilen sind (z. B. bei der Kontraktilitätsreserve durch Veränderung der EF
während der Belastung).
3D Schnittbildverfahren erlauben eine präzisere Analyse der kardialen Volumina.
Wegen ihrer hohen Messgenauigkeit und Reproduzierbarkeit sowie der geringen
„Interobserver“- und „Interstudy“-Variabilität gilt die MRT als Goldstandard für die
kardiale Volumetrie [9] [16]. Nachteile der Methode sind lange Akquisitionszeiten
sowie Kontraindikationen, v. a. metallene Implantate (z. B. das Tragen von
Schrittmachern).
Die kardiale Mehrschicht-Computertomographie (MSCT) wurde aufgrund ihrer
relativ hohen zeitlichen und hervorragenden räumlichen Auflösung für die nicht-
invasive Koronardiagnostik entwickelt. Während eines den gesamten Herzzyklus
erfassenden Scans lassen sich die akquirierten Bilddaten außerdem zur Bestimmung
der Ventrikelvolumina verwenden. Die MSCT - basierte kardiale Volumetrie
korreliert sehr gut mit der MRT, wie an Patienten mit regelrechter systolischer
Pumpfunktion gezeigt werden konnte [8] [12] [15]. Bei deutlich kürzeren
Untersuchungszeiten eignet sich die MSCT besser zur Untersuchung von Patienten
mit Orthopnoe und Klaustrophobie und ermöglicht zudem die Untersuchung von
Patienten mit metallenen Implantaten.
2. Zielsetzung:
Teilprojekt 1 der Arbeit diente der Validierung der MSCT - basierten Volumetrie
bei Herzinsuffizienzpatienten. Darüber hinaus setzten wir die MSCT zur
Verlaufsvolumetrie vor und nach kardialer CRT (mittels Implantation eines
biventrikulären Schrittmachers) ein. Dabei untersuchten wir die Möglichkeit der
3
MSCT - basierten linksventrikulären Wandbewegungsanalyse im Sinne des zu
erwartenden CRT - induzierten „reverse remodelling“.
3. Material und Methoden:
3.1 Patienten
In Teilprojekt 1 erfolgte bei 24 Herzinsuffizenzpatienten (14 Männer, 10 Frauen,
mittleres Alter 64,8 ± 9,5 Jahre, BMI 27,21 ± 4,46) mit verschiedenen kardialen
Grunderkrankungen (Dilatative Kardiomyopathie (DCM) n=12; hypertensive
Herzerkrankung (HHD) n=4; koronare Herzerkrankung (KHK) n=8) und
verschiedenen Herzinsuffizienzstadien (NYHA I-II n=2; NYHA II n= 8; NYHA II-
III n=4; NYHA III n=8; NYHA III-IV n=2) die MSCT maximal einen Tag vor der
MRT. Zum Zeitpunkt der Untersuchung waren alle Patienten klinisch stabil. Die
optimierte medikamentöse Therapie (medikamentöser steady state) umfasste stets
einen Betablocker. Eine Nachdosierung des Betablockers zwecks
Herzfrequenzsenkung vor der Volumetrie erfolgte in keinem Fall. Der beide
Untersuchungen (MSCT und MRT) umfassende Zeitrahmen betrug maximal zwei
Tage.
In Teilprojekt 2 untersuchten wir ein Subkollektiv (n=7) der zuvor beschriebenen
Studienpopulation. Bei diesen Herzinsuffizienzpatienten (3 Männer, 4 Frauen,
durchschnittliches Alter 63,3 ± 7,3 Jahre; NYHA III n=5, NYHA III-IV n=2) mit
DCM war 2D echokardiographisch eine ventrikuläre Asynchronie nachgewiesen
worden. Nach Indikationsstellung zur CRT und folgender Implantation eines
atrioventrikulären biventrikulären Schrittmachers erfolgte in dieser Subgruppe eine
zweite MSCT - Untersuchung bzw. 2D Echokardiographie zur volumetrischen
Verlaufsbestimmung.
Die hiesige Ethikkommission hatte den Studien zuvor zugestimmt. Von jedem
rekrutierten Patient wurde eine schriftliche Einverständniserklärung eingefordert.
4
3.2 Mehrschicht - Computertomographie (MSCT)
Die MSCT - Untersuchung erfolgte mit einem für kardiale Untersuchungen
konzipierten „Scanner“ (16 – slice - MSCT, Rotationsgeschwindigkeit 420 ms,
Cardiac Sensation; Siemens, Medical Solutions, Forchheim, Deutschland) unter
Anwendung des Untersuchungsprotokolls für nicht-invasive Koronarangiographie:
Kollimation 16 × 0,75 mm, Increment 0,5 mm, 120 KV, 300 mAs, 100 ml
Kontrastmittel (Iopromide, Jodgehalt 370 mg/ml; Ultravist™, Bayer - Schering,
Berlin, Deutschland), Kontrastmittel-Flussrate 4 ml/sec. Zwecks optimaler
Kontrastierung folgte der Kontrastmittelgabe unmittelbar eine i.v. - Gabe von 100
ml NaCl - Bolus. Während eines Atemanhaltemanövers und unter fortlaufender
EKG-Aufzeichnung wurde der helikale Scan (Spiral - CT) beginnend auf Höhe der
Carina in kraniokaudaler Richtung zum kardialen Apex abgefahren. Alle Patienten
waren aufgefordert, vor dem Scanvorgang zu hyperventilieren und während des
Scans bei offenem Mund den Atem in Inspiration anzuhalten.
Nach dem Scan wurden die Rohdaten im Rahmen der Nachbearbeitung auf einem
separaten Arbeitsplatz (Navigator, Siemens, Medical Solutions, Forchheim,
Deutschland) zu transversalen Bildern generiert. Basierend auf dem zur
Orientierung eingestellten „Vierkammerblick“ wurde die kurze Herzachse
rekonstruiert. Beginnend an der Herzbasis, markiert durch die Mitralklappe, wurden
bis zur Herzspitze 8 bis 14 konsekutive Schichten rekonstruiert (Maximum Intensity
Projection, rekonstruierte Schichtdicke 8 mm). Zur Identifizierung der
enddiastolischen (ED) und endsystolischen (ES) Phase wurden diese kardialen
Kurzachsenschnitte in 20 verschiedenen Zeitfenstern des RR-Intervalls (0% bis 95%
in 5%-Schritten) dargestellt.
5
3.3 Magnetresonanztomographie (MRT)
Die kardiale MRT (1,5 Tesla, Philips Medical Systems, Gyroscan ACS-NT,
Powertrak 5000, R8, maximale Gradientenleistung 30 mT/m, Anstiegszeit 150
T/m/s) wurde mit einer 5 - Kanal – Phased – Array - Oberflächenspule durchgeführt.
Phased - Array - Spulen bestehen aus mehreren Elementen, die beim kardialen MRT
auf der Vorder- und Rückseite des Thorax verteilt werden. Die Bildparameter waren
wie folgt: 15 kontinuierliche Phasen, Sichtfeld (Field Of View) 380 mm, 112 × 256
Matrix, rekonstruierte räumliche Auflösung 1,48 × 1,48 × 8 mm, TR 2,8 ms, TE 1,4
ms, Flipwinkel 65°, Zahl der Signalmittelungen (NSA) 1. Weitere Parameter
wurden angepasst, um eine Relation Echozeit (TE) / Wiederholungszeit (TR) von
0,5 und eine tolerable Atemanhaltzeit zu erreichen. Die Rekonstruktion eines Bildes
erfolgte dann aus den von den einzelnen Spulenelementen akquirierten Daten. In
Exspiration wurden Cine- Sequenzen im Vierkammerblick und in der
Kurzachsenebene erstellt, die den linken und rechten Ventrikel in beiden
Einstellungen in 8 bis 14 konsekutiven Schichten darstellen.
Zur Vermeidung von Bewegungsartefakten wurden alle Aufnahmen mit EKG-
Triggerung und Atemanhaltetechnik angefertigt. Durch das Anlegen eines
Atemgurtes konnte die Atembewegung visuell an der MRT-Konsole nachvollzogen
werden. Die Messungen wurden bei Erreichen der endexspiratorischen Atemlage
mit einem Atemanhaltekommando gestartet.
3.4 Bildanalyse in MSCT und MRT
Bei beiden Methoden wurde die Bildanalyse off-line mit einem kommerziell
erhältlichen System (Personalcomputer / Linus) durchgeführt. Für den linken
Ventrikel (LV) und den rechten Ventrikel (RV) wurde die Enddiastole (ED) als die
Phase definiert, die innerhalb der endokardialen Konturen die größte Gesamtfläche
6
zeigt. Als Phase mit der kleinsten Gesamtfläche wurde die Endsystole (ES)
definiert.
In beiden Phasen wurden die endokardialen Konturen von der Herzbasis bis zur
Herzspitze semiautomatisch planimetriert. Das eingesetzte Planimetrieprogramm
(Programmierung: Peter Barth, Herz- und Diabeteszentrum Nordrhein Westfalen,
Ruhr-Universität Bochum) gab die Konturierung wie folgt vor: durch einen
Mausklick in das Ventrikelcavum und einen weiteren in das Myokard konnten
Unterschiede in den Signalintensitätsunterschieden berechnet werden. Der
Mittelwert wurde definiert als die Signalintensität der Myokard- / Cavumgrenze,
welche dann als endokardiale Kontur in der jeweiligen Schicht definiert wurde. Die
Planimetrie wurde bei beiden Methoden manuell korrigiert. Dabei wurden die
Papillarmuskeln konsequent dem Myokard zugerechnet [19]. Die rechtsventrikuläre
Volumetrie wurde ebenfalls semiautomatisch durchgeführt. Unter Anwendung der
Scheibchensummationsmethode (modifizierte Simpson Methode [7]) wurde die für
die LV - Planimetrie relevante basalste Schicht als solche definiert, die der
Mitralklappe am nächsten liegt bei zirkumferenziell ≥50% des sichtbaren LV -
Myokards.
Die Planimetrie diente der Bestimmung der ED und ES Volumina (V) von LV und
RV (LV-EDV und LV-ESV, RV-EDV und RV-ESV) sowie der Berechnung der
LV- bzw. RV-EF.
3.5 Echokardiographie
Die 2D Echokardiographie erfolgte in Linksseitenlage unter Anwendung aller
parasternalen und apikalen Standardprojektionen. Alle Untersuchungen wurden mit
einem kommerziell erhältlichen Ultraschallgerät durchgeführt (Vivid 7, EchoPac
Bildbearbeitungssoftware, GE Medical System, Horten, Norwegen). Die erhobenen
Daten wurden als Videosequenzen und Standbilder digital gespeichert. Die LV -
7
Volumetrie wurde nach der modifizierten Simpson Gleichung [17] durchgeführt.
Dafür verwendeten wir den 2- und 4- Kammerblick. Die ED wurde definiert als das
erste Bild nach der R- Zacke, die ES durch die kleinste LV - Fläche. Alle
Untersuchungen erfolgten unter Verzicht auf Atemkommandos.
3.6 Statistische Analyse
Alle Volumina des RV und LV sind in Mittelwert ± Standardabweichung (SD)
ausgedrückt. Die Daten werden absolut und prozentual angegeben. Der Vergleich
von MSCT - mit MRT - (und 2D Echokardiographie -) basierten volumetrischen
Daten für den LV und RV wurde durch die Kalkulation der Abweichung (mittlere
Differenz) und der 95%-Grenze des Vergleichs (2 SD um die mittlere Differenz) in
Bland-Altman-Plots [3] dargestellt. Für die statistische Analyse wurde der Pearson
Korrelationskoeffizient berechnet. Die Signifikanz wurde durch den Wilcoxon
Ranks Test [18] bestimmt. Die Signifikanzschwelle wurde definiert als p=0,05. Alle
Analysen wurden mit SPSS (SPSS Inc., Microsoft Windows, Mac OS X, Linux)
durchgeführt.
4. Ergebnisse
Der volumetrische CT Dosis Index (CTDI) und das Dosis- Längen- Produkt (DLP)
betrugen 665,67 ± 25,63 mGy and 625,33 ± 171,88 mGy × cm. Daraus resultierte
eine Strahlenexposition (DLP Umwandlungsfaktor [m 0,017, f 0,025]) von 11,32 ±
0,44 mSv für Männer und 15,63 ± 4,30 mSv für Frauen.
4.1 MRT vs. MSCT
In Teilprojekt 1 bestand hinsichtlich der LV - Volumetrie eine enge Korrelation
zwischen MRT und MSCT: EDV r=0,938, ESV r=0,981 und EF r=0,927. Die LV -
8
Volumina wurden durch MSCT hochsignifikant überschätzt (p <0,0001), die LV-EF
hochsignifikant unterschätzt (p<0,0001).
Bzgl. der RV - Volumetrie zeigte sich ebenfalls eine gute Korrelation: EDV r=
0,787, ESV r=0,783 sowie EF r=0,729. Die RV-Volumina wurden durch MSCT
hochsignifikant überschätzt (p<0,0001), während die RV-EF hochsignifikant
unterschätzt wurde (p<0,0001).
9
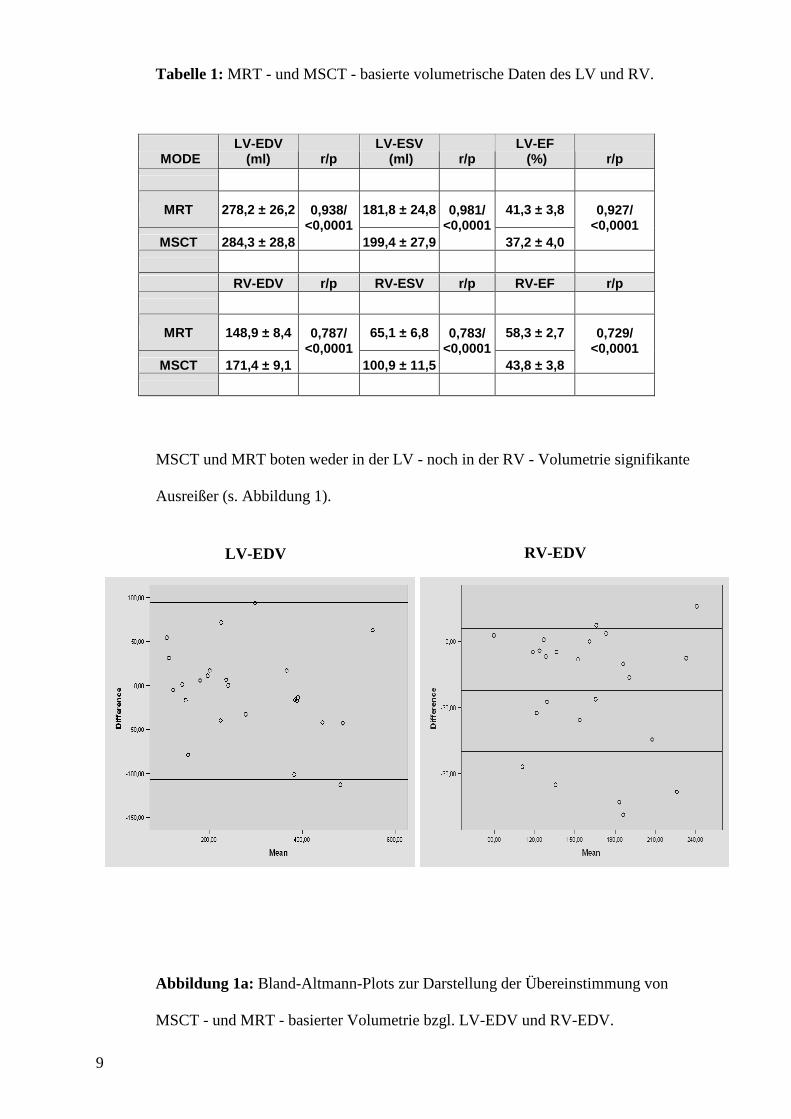
Tabelle 1: MRT - und MSCT - basierte volumetrische Daten des LV und RV.
MSCT und MRT boten weder in der LV - noch in der RV - Volumetrie signifikante
Ausreißer (s. Abbildung 1).
Abbildung 1a: Bland-Altmann-Plots zur Darstellung der Übereinstimmung von
MSCT - und MRT - basierter Volumetrie bzgl. LV-EDV und RV-EDV.
MODE LV-EDV
(ml) r/p LV-ESV
(ml) r/p LV-EF (%) r/p
MRT 278,2 ± 26,2 181,8 ± 24,8 41,3 ± 3,8
MSCT 284,3 ± 28,8
0,938/ <0,0001
199,4 ± 27,9
0,981/ <0,0001
37,2 ± 4,0
0,927/ <0,0001
RV-EDV r/p RV-ESV r/p RV-EF r/p
MRT 148,9 ± 8,4 65,1 ± 6,8 58,3 ± 2,7
MSCT 171,4 ± 9,1
0,787/ <0,0001
100,9 ± 11,5
0,783/ <0,0001
43,8 ± 3,8
0,729/ <0,0001
LV-EDV RV-EDV
10
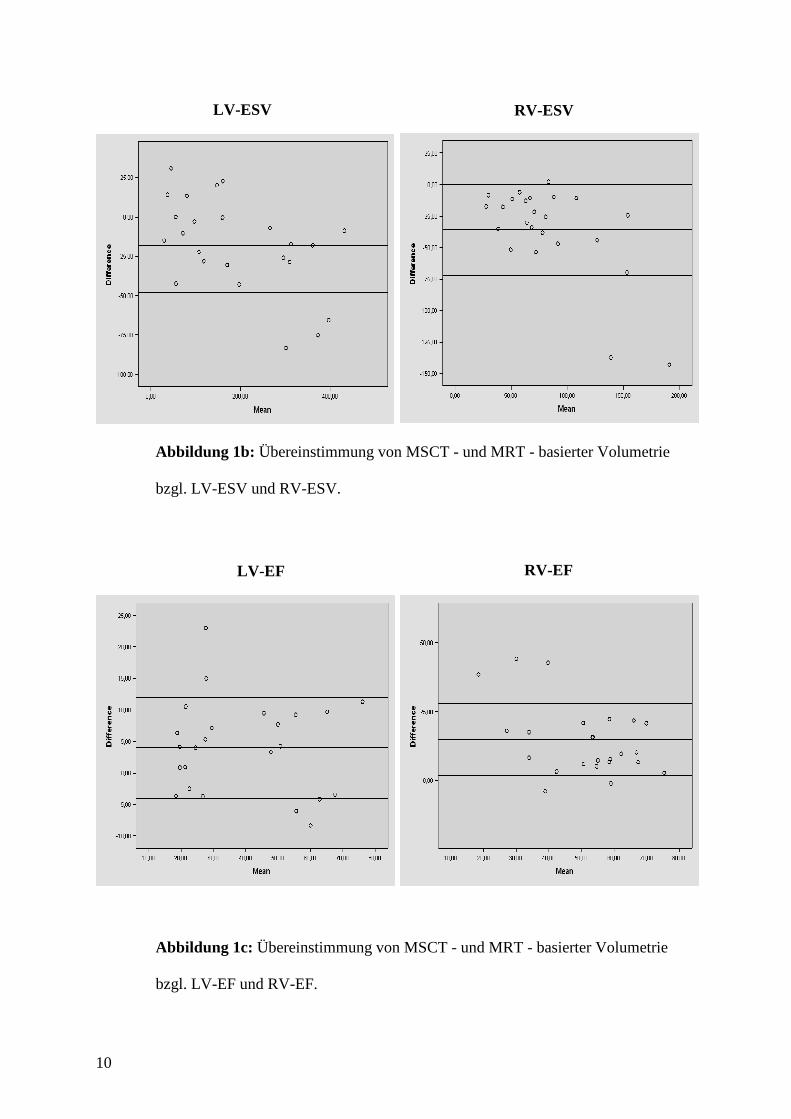
Abbildung 1b: Übereinstimmung von MSCT - und MRT - basierter Volumetrie
bzgl. LV-ESV und RV-ESV.
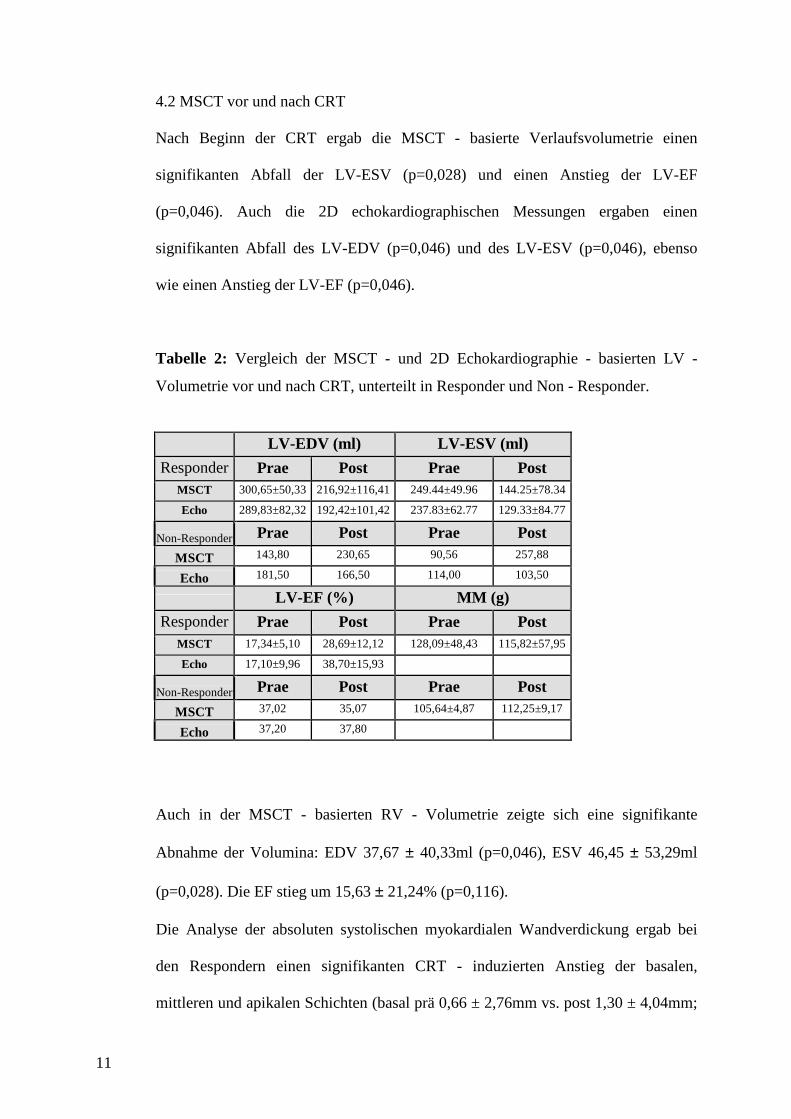
Abbildung 1c: Übereinstimmung von MSCT - und MRT - basierter Volumetrie
bzgl. LV-EF und RV-EF.
LV-ESV RV-ESV
LV-EF RV-EF
11
4.2 MSCT vor und nach CRT
Nach Beginn der CRT ergab die MSCT - basierte Verlaufsvolumetrie einen
signifikanten Abfall der LV-ESV (p=0,028) und einen Anstieg der LV-EF
(p=0,046). Auch die 2D echokardiographischen Messungen ergaben einen
signifikanten Abfall des LV-EDV (p=0,046) und des LV-ESV (p=0,046), ebenso
wie einen Anstieg der LV-EF (p=0,046).
Tabelle 2: Vergleich der MSCT - und 2D Echokardiographie - basierten LV -
Volumetrie vor und nach CRT, unterteilt in Responder und Non - Responder.
LV-EDV (ml) LV-ESV (ml)
Responder Prae Post Prae Post MSCT 300,65±50,33 216,92±116,41 249.44±49.96 144.25±78.34
Echo 289,83±82,32 192,42±101,42 237.83±62.77 129.33±84.77
Non-Responder Prae Post Prae Post
MSCT 143,80 230,65 90,56 257,88
Echo 181,50 166,50 114,00 103,50
LV-EF (%) MM (g)
Responder Prae Post Prae Post MSCT 17,34±5,10 28,69±12,12 128,09±48,43 115,82±57,95
Echo 17,10±9,96 38,70±15,93
Non-Responder Prae Post Prae Post
MSCT 37,02 35,07 105,64±4,87 112,25±9,17
Echo 37,20 37,80
Auch in der MSCT - basierten RV - Volumetrie zeigte sich eine signifikante
Abnahme der Volumina: EDV 37,67 ± 40,33ml (p=0,046), ESV 46,45 ± 53,29ml
(p=0,028). Die EF stieg um 15,63 ± 21,24% (p=0,116).
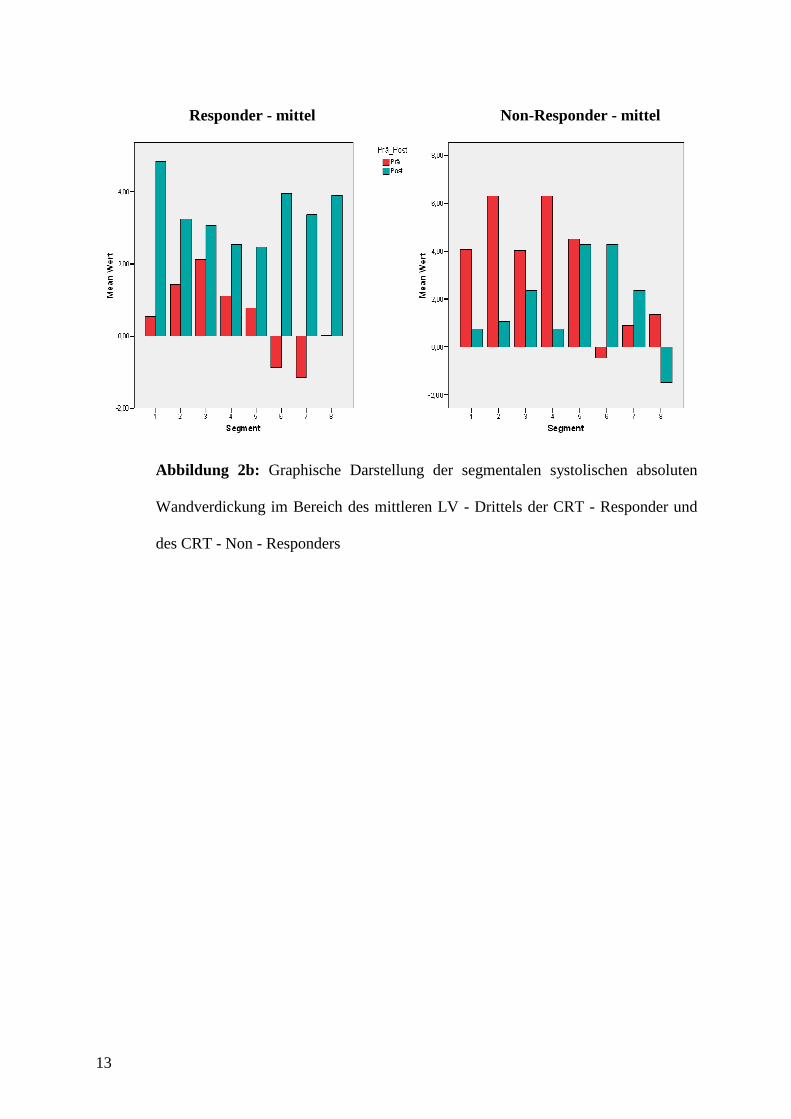
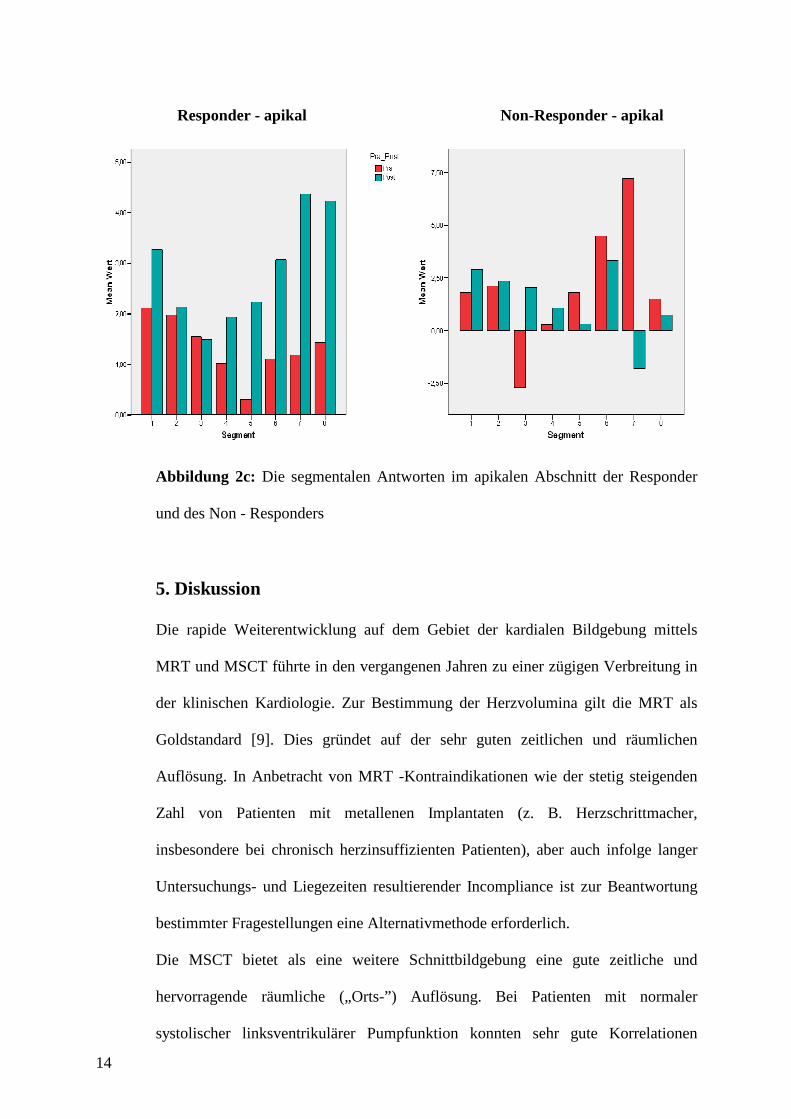
Die Analyse der absoluten systolischen myokardialen Wandverdickung ergab bei
den Respondern einen signifikanten CRT - induzierten Anstieg der basalen,
mittleren und apikalen Schichten (basal prä 0,66 ± 2,76mm vs. post 1,30 ± 4,04mm;
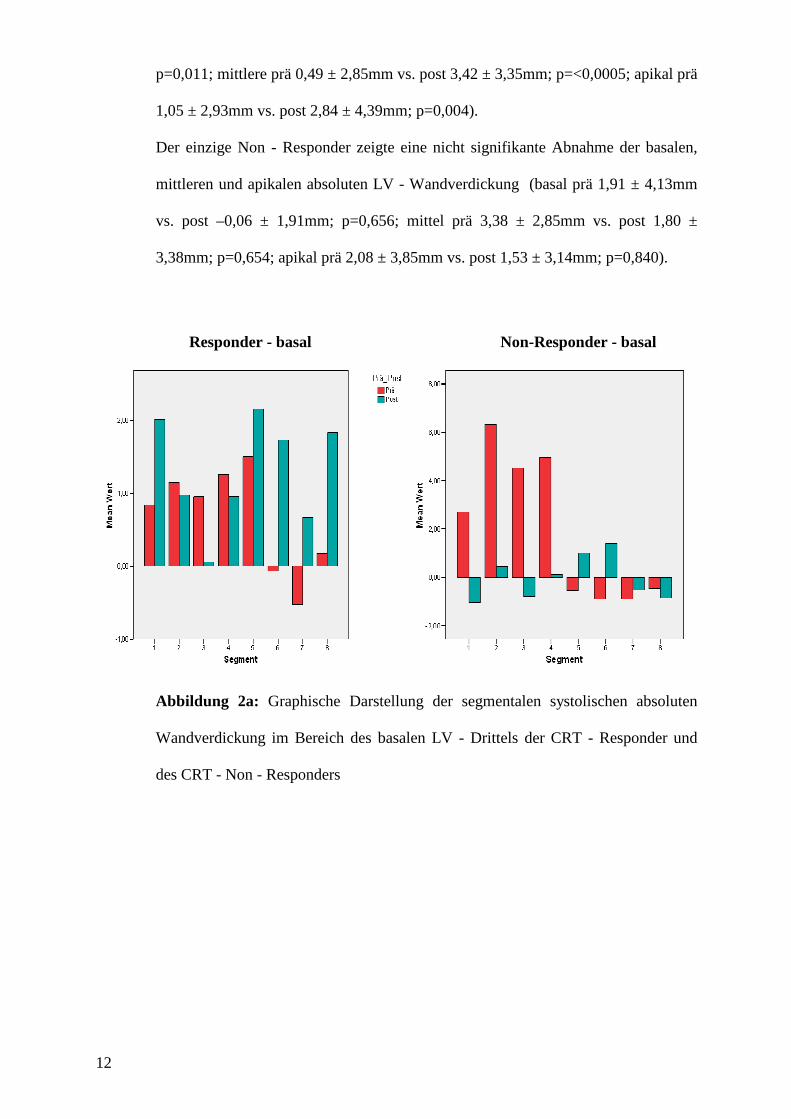
12
p=0,011; mittlere prä 0,49 ± 2,85mm vs. post 3,42 ± 3,35mm; p=<0,0005; apikal prä
1,05 ± 2,93mm vs. post 2,84 ± 4,39mm; p=0,004).
Der einzige Non - Responder zeigte eine nicht signifikante Abnahme der basalen,
mittleren und apikalen absoluten LV - Wandverdickung (basal prä 1,91 ± 4,13mm
vs. post –0,06 ± 1,91mm; p=0,656; mittel prä 3,38 ± 2,85mm vs. post 1,80 ±
3,38mm; p=0,654; apikal prä 2,08 ± 3,85mm vs. post 1,53 ± 3,14mm; p=0,840).
Abbildung 2a: Graphische Darstellung der segmentalen systolischen absoluten
Wandverdickung im Bereich des basalen LV - Drittels der CRT - Responder und
des CRT - Non - Responders
Responder - basal Non-Responder - basal
13
Abbildung 2b: Graphische Darstellung der segmentalen systolischen absoluten
Wandverdickung im Bereich des mittleren LV - Drittels der CRT - Responder und
des CRT - Non - Responders
Responder - mittel Non-Responder - mittel
14
Abbildung 2c: Die segmentalen Antworten im apikalen Abschnitt der Responder
und des Non - Responders
5. Diskussion
Die rapide Weiterentwicklung auf dem Gebiet der kardialen Bildgebung mittels
MRT und MSCT führte in den vergangenen Jahren zu einer zügigen Verbreitung in
der klinischen Kardiologie. Zur Bestimmung der Herzvolumina gilt die MRT als
Goldstandard [9]. Dies gründet auf der sehr guten zeitlichen und räumlichen
Auflösung. In Anbetracht von MRT -Kontraindikationen wie der stetig steigenden
Zahl von Patienten mit metallenen Implantaten (z. B. Herzschrittmacher,
insbesondere bei chronisch herzinsuffizienten Patienten), aber auch infolge langer
Untersuchungs- und Liegezeiten resultierender Incompliance ist zur Beantwortung
bestimmter Fragestellungen eine Alternativmethode erforderlich.
Die MSCT bietet als eine weitere Schnittbildgebung eine gute zeitliche und
hervorragende räumliche („Orts-”) Auflösung. Bei Patienten mit normaler
systolischer linksventrikulärer Pumpfunktion konnten sehr gute Korrelationen
Responder - apikal Non-Responder - apikal
15
zwischen MSCT - und MRT - basierter Volumetrie gezeigt werden [8] [14]. Die
vorliegende Arbeit beschäftigt sich mit der MSCT - basierten links- und
rechtventrikulären kardialen Volumetrie bei Patienten mit eingeschränkter kardialer
Pumpfunktion. Sie umfasst zwei Teilprojekte, die aufeinander aufbauen.
Grundlegend verglichen wir in Teilprojekt 1 die MSCT mit der
Goldstandardmethode, MRT. Weiterführend analysierten wir in Teilprojekt 2
volumetrische Verlaufsbestimmungen mittels MSCT und 2D Echokardiographie -
vor und nach Beginn einer CRT (Longitudinalstudie). In diesem Teilprojekt wurden
neben den volumetrischen Parametern besonderes Augenmerk auf die mittels MSCT
ermittelte systolische absolute Wandverdickung gelegt. Mit Hilfe der so
ermöglichten linksventrikulären Wandbewegungsanalyse war es unser Ziel, das
CRT - induzierte „reverse remodelling“ zu beurteilen. Hierzu führten wir MSCT -
basierte farbkodierte multisegmentale Polartomogramme ein.
5.1 Vergleich MSCT und MRT
Unser Patientenkollektiv umfasste zunächst 24 Patienten mit chronischer
Herzinsuffizienz unterschiedlicher klinischer Schweregrade, überwiegend NYHA
III, denen verschiedene kardiale Grunderkrankungen zugrunde lagen (Teilprojekt 1).
Bei der volumetrischen Evaluation fokussierten wir auf das EDV und ESV sowie
die EF.
Die bisher in der Literatur veröffentlichten Studien zur MSCT - basierten
Volumetrie, validiert durch den Goldstandard, MRT, wurden dagegen an Patienten
durchgeführt, die eine regelrechte globale LV - Pumpfunktion aufwiesen [5] [11]
[15]. Die Untersuchung von Patienten mit überwiegend mittel- bis hochgradig
eingeschränkter systolischer Pumpfunktion ist eine große Herausforderung, da diese
Patienten - häufig mit Orthopnoe - lange Liegezeiten (Untersuchungszeiten) oft nur
16
schlecht tolerieren. Andererseits sind sie aufgrund der veränderten LV - Volumetrie
für andere Untersuchungstechniken nur eingeschränkt geeignet.
Wie andere Arbeitsgruppen an Studienpopulationen mit regelrechter systolischer
Pumpfunktion beobachteten, fanden auch wir bei unseren herzinsuffizienten
Patienten - bezogen auf die MRT - Volumetrie - bei sehr guten Korrelationen eine
signifikante Überschätzung des LV-ESV und -EDV (p<0,0001) sowie eine
Unterschätzung der LV-EF (p<0,0001) durch MSCT.
Die Korrelation der RV - Volumetrie war erwartungsgemäß schwach. Aufgrund
seiner komplexen Geometrie ist der RV auch mittels Schnittbildgebung ungleich
schwieriger zu planimetrieren als der LV. Dennoch korrelierten die MSCT mit den
MRT - Daten gut, wobei RV-EDV und -ESV ebenfalls signifikant über- und die EF
unterschätzt wurde (jeweils p<0,0001). Sowohl in der LV - als auch in der RV -
Analyse gab es keine signifikanten Ausreißer, die das Ergebnis hätten verfälschen
können.
In dem durchgeführten Teilprojekt 1 analysierten wir MSCT mit MRT im Sinne
einer Vergleichsstudie. Die den resultierenden Diskrepanzen zugrunde liegenden
Ursachen waren im Rahmen des gewählten klinischen Studiendesigns kausal und
bzgl. ihrer klinischen Konsequenz nicht zu klären. Sie sollen angesichts der nicht
vollständigen Übereinstimmung der verglichenen Methoden jedoch angesprochen
werden.
Die methodenspezifischen Unterschiede bzgl. Liegezeit, Dunkelheit und Lautstärke
während der MRT - Untersuchungen werden subjektiv unterschiedlich
wahrgenommen und bedeuten potentiellen Stress. Es wurde gezeigt, dass dies einen
signifikanten Abfall der LV - EF hervorrufen kann, der wiederum einen Anstieg der
17
Herzfrequenz und des Blutdrucks verursacht [10]. Bei der MSCT kommt es bei
Geräuschlosigkeit, normaler Helligkeit im Untersuchungsraum sowie kürzeren
Liegezeiten zu geringerem mentalen Stress.
Für diese Studie relevant sind zudem mechanische Parameter, bzgl. derer sich
MSCT und MRT unterscheiden bzw. sich auf die Hämodynamik verschieden
auswirken können. Die 16 - Zeilen - CT ermöglicht diagnostische Bildqualität in
einem weiten Herzfrequenzbereich (38-102/min) [12]. Darüber hinaus kann eine
ausgeprägte Herzfrequenzvariabilität die Bildqualität erheblich einschränken [21].
Generell muss eine kontrollierende Betablockerapplikation – wie bei der MSCT -
basierten nicht- invasiven Koronardiagnostik etabliert – bei geplanter Volumetrie
aufgrund des potentiellen Einflusses auf Hämodynamik und kardiale Volumina
eingesetzt werden.
Die Bildqualität der zugrunde liegenden MSCT - Angiographie ist aufgrund der
limitierten zeitlichen Auflösung anfällig für Atemartefakte. Derartige
Bewegungsartefakte können die Myokardkonturierung bei der Planimetrie
erschweren und volumetrische Bestimmungen verfälschen. Die von uns
untersuchten Patienten mit teilweise hochgradig eingeschränkter LV - Funktion
boten alle eine sehr geringe Bewegungsamplitude. Diese Situation begünstigt eine
gute Bildqualität trotz suboptimaler zeitlicher Auflösung.
Hinsichtlich der Kontrastmittelapplikation finden sich in der Literatur keine
Hinweise auf einen möglichen Einfluss der Bolusinjektion von 100 ml jodhaltigen
Kontrastmittels auf die Hämodynamik des Herzens. Es ist jedoch bekannt, dass u. a.
das von uns gewählte Kontrastmittel sehr schnell eine hohe osmotische Wirkung
entfaltet und eine intravasale Volumenveränderung nach sich zieht.
Unabhängig davon ist während des in Inspiration durchgeführten MSCT - Scans das
LV-EDV im Vergleich zur Exspiration verringert. Im Gegensatz zum LV - ist das
RV - Volumen während der Inspirationsphase am größten [20].
18
Die vorliegende Arbeit kann nur darauf hinweisen, dass obig angeführte
Mechanismen grundsätzlich, aber im Besonderen bei der Analyse dieses
„intermodalen“ Vergleiches Berücksichtigung finden sollten. Ihr genaues Ausmaß
kann jedoch nur unter experimentellen Bedingungen untersucht werden.
Zusammenfassend zeigt die Teilstudie 1, dass MSCT und MRT gut korrelieren. Bei
MRT - Kontraindikationen wie metallischen Implantaten (z. B. Schrittmachern oder
Defibrillatoren) könnte folglich die 16 - Zeilen - CT als präzisere Alternative zur 2D
Echokardiographie eingesetzt werden. Zu erwarten ist dabei eine Überschätzung der
ventrikulären Volumina und Unterschätzung der Ejektionsfraktionen.
Die Bestimmung der links- und rechtsventrikulären Funktionen durch die kardiale
MSCT bietet Informationen, die von diagnostischer, therapeutischer und
prognostischer Bedeutung sein können. Angesichts der einhergehenden
Strahlenexposition ist diese Methode jedoch nicht als Methode der ersten Wahl
einzusetzen. Gerechtfertigt ist ihr Einsatz in Fällen, in denen Zusatzinformationen
erforderlich sind, die die 2D Echokardiographie nicht erbringen kann. Außerdem
sollten nur Patienten untersucht werden, die eventuelle Strahlenschäden nicht
erleben können.
5.2 MSCT vor und nach CRT
Das Teilprojekt 2 baut auf dem grundlegenden Projekt 1 auf und ist als deskriptive
Studie zu werten. Wir untersuchten ein Subkollektiv herzinsuffizienter Patienten mit
DCM (n=7), bei denen im Verlauf ein biventrikulärer Schrittmacher (BVSM) im
Sinne einer kardialen Resynchronisationstherapie (CRT) implantiert wurde. Mittels
MSCT - basierter Volumetrie war es das Ziel dieser deskriptiven Studie, den
19
mindestens bei einem Teil der Patienten zu erwartenden CRT - Effekt („reverse
remodelling“) zu detektieren, lokalisieren und zu quantifizieren. Bei der prospektiv
festgelegten kleinen Patientenzahl ging es uns darum, das Potenzial der Methode zur
Demonstration des CRT - induzierten „reverse remodelling“ aufzuzeigen.
Die Indikation für eine CRT kann gestellt werden bei Patienten in einem klinischen
Herzinsuffizienzstadium NYHA ≥ III. Vorliegen muss eine systolische LV-
Dysfunktion (LV-EF ≤ 35%) und eine gestörte kardiale Erregungsausbreitung
(elektrokardiographisch signifikanter Linksschenkelblock, QRS ≥ 120ms). Unter der
Vorstellung einer resultierenden ventrikulären Dyssynchronie
(echokardiographisch) gründet das Therapiekonzept der CRT auf dem Prinzip einer
elektromechanischen Resynchronisation. Bei CRT - Respondern wird neben der
klinischen Verbesserung eine Verringerung des EDV und ESV sowie eine
Steigerung der EF beobachtet.
In der MUSTIC - Studie [13] konnte bei Herzinsuffizienz- Patienten unter CRT
neben einer höheren Lebensqualität und einer Verbesserung der Mitralinsuffizienz
ein Anstieg der LV-EF beobachtet werden. Die Arbeitsgruppen um Agacdiken und
Akyol zeigten eine durch CRT induzierte messbare Verbesserung der Herzfunktion,
sowohl klinisch als auch echokardiographisch, die über Jahre stabil blieb [1] [2].
In unserer Serie variierte vor CRT die NYHA - Klasse zwischen III und IV (III n=5,
III-IV n=2). Nach CRT rangierte die NYHA Klasse der 6 CRT - Responder
zwischen I und II (I n=1, I-II n=4, II n= 1). Der einzige Non - Responder konnte
seine NYHA- Klasse (NYHA III) nicht verbessern.
Nach MSCT - basierter LV - und RV - Volumetrie bestimmten wir zudem die
Myokardmasse. Die linksventrikulären Parameter dienten - vor und nach CRT - dem
20
Vergleich mit der 2D Echokardiographie. Unterstellt wurde eine in Teilprojekt 1
dokumentierte gute Korrelation von MSCT mit der Goldstandardmethode, MRT.
Die MSCT und 2D Echokardiographie erfolgte i. d. R. am selben Tag, maximal drei
Tage vor CRT. Die MSCT - und 2D Echokardiographie - Verlaufsuntersuchungen
wurden – aufgrund mangelnder Compliance – 19,8 ± 11,1 Monate (Min 12, Max 30,
Median 12) nach Beginn der CRT am selben Tag durchgeführt. Unter CRT -
Bedingungen zeigte sich in den Messungen mit MSCT ein Abfall der LV-EDV und
LV-ESV sowie ein Anstieg der LV-EF (p=0,046), was echokardiographisch für LV-
EDV und LV-ESV sowie für LV-EF ebenfalls zu konstatieren war (p=0,046). Dabei
überschätzt die Echokardiographie die durch MSCT bestimmte LV-EF signifikant
(p=0,016).
Von den 7 Patienten konnten 6 durch MSCT korrekt als CRT - Responder
identifiziert werden. Dies zeigte sich in einer Abnahme der EDV und ESV sowie an
dem Anstieg der LV- und RV-EF. Ebenso konnte der einzige Non - Responder
durch die MSCT als solcher identifiziert werden. Dieser zeigte gegenläufige
Veränderungen der LV - Parameter.
Auch die MSCT - basierten Messungen des RV zeigten eine signifikante Abnahme
der RV-EDV (p=0,046) und RV-ESV (p=0,028). Die RV-EF stieg um 15,63 ±
21,24% (p=0,116).
Die LV-Wandbewegungsanalyse war ein weiteres Thema der vorliegenden Arbeit.
„Reverse remodelling“ bezeichnet u. a. die Umkehrung der durch interventrikuläre
Dyssynchronie verursachten septalen Verdünnung nach CRT. Wir analysierten eine
messbare Größe zum Nachweis des CRT - induzierten „reverse remodelling“, so
dass wir uns für eine bis dato nicht eingesetzte Größe, die systolische absolute
21
myokardiale Wandverdickung, entschieden. Dazu erfolgte zunächst eine
Unterteilung des LV in 8 longitudinal verlaufende Quadranten, die wiederum in
einen apikalen, mittleren und basalen Abschnitt unterteilt wurden. Die Quadranten 1
und 2 repräsentieren die Vorderwand, 3 und 4 die Lateralwand und 5 bis 8 das
Septum einschließlich seiner angrenzenden Vorder- und Hinterwandsegmente.
In der Gruppe der CRT - Responder verringerte sich erwartungsgemäß die LV -
Myokardmasse im Durchschnitt um 9,5%, wohingegen der Non - Responder einen
leichten Anstieg um 1,5% aufwies. Die Analyse der myokardialen systolischen
Wandverdickung zeigte einen signifikanten Anstieg in den basalen, mittleren und
apikalen Schichten bedingt durch CRT (Responder). Dabei zeigten das Septum und
seine angrenzenden Segmente 5, 6, 7 und 8 den besten „Response“ auf die CRT. Bei
dem Non-Responder zeigte sich hingegen eine nicht signifikante Abnahme der
basalen, mittleren und apikalen absoluten Wandverdickung.
Bei den CRT- Respondern war – verdeutlicht durch die MSCT - basierten MIP Cine
views – eine deutliche Dickenzunahme der Herzwände nachzuweisen. Durch die
posterolateral verzögerte Kontraktion und die dadurch resultierende
Septumhypotrophie war eine leichte Asymmetrie vor CRT sichtbar. Die
posterolateralen Wände waren dicker als die septalen.
Zur verbesserten Detektion und Lokalisation, aber auch zur Quantifizierung des
CRT- induzierten „reverse remodelling“ wendeten wir erstmals MSCT - basierte
farbkodierte multisegmentale Polartomogramme an, die durch die SIEMENS
Software ARGUS zur Verfügung standen. Die Farbstufe „Hellblau“ bedeutet keine
systolische Wandverdickung, „dunkelrot“ bedeutet maximale systolische absolute
Wandverdickung in mm. Unsere CRT - Responder zeigten in unterschiedlicher
22
Intensität eine Rückumverteilung der Muskelmasse im Sinne eines „reverse
remodelling“. Der Non - Responder zeigte kein „reverse remodelling“.
5.3 Limitationen
Die verschiedenartigen Limitationen der MSCT - basierten Volumetrie sind z. T. CT
- spezifisch: die MSCT als Röntgenmethode geht mit einer nicht unwesentlichen
Röntgenstrahlen- und Kontrastmittelexposition einher, was Einfluss bei der
Patientenpräselektion haben sollte. Alte Menschen erleben Strahlenschäden
statistisch nicht, die sich in der Regel Jahrzehnte nach der Exposition manifestieren
(bei einer 20-jährigen Frau liegt das Risiko für eine Krebserkrankung durch CT -
Scan bei 1 zu 143, bei einer 80- jährigen Frau bei 1 zu 3261 [6]), weisen jedoch
häufig eine chronische Niereninsuffizienz auf. Für die LV - Wandbewegungsanalyse
verwendeten wir Polartomogramme, die von dem üblichen 17 - Segment - Modell
abweichen. Die RV - Geometrie stellt auch für die MSCT als 3D Schnittbildgebung
ein Problem dar, das auf der weiter zu optimierenden räumlichen wie zeitlichen
Auflösung aber auch auf einem suboptimalen Signal - to - Noise - Verhältnis
gründet.
Studienspezifisch hat die kleine Studienpopulation in Teilprojekt 2 der Studie nur
deskriptiven Charakter. Darüber hinaus fehlt die Validierung durch eine
Goldstandardmethode (hier 2D Echokardiographie). Die Verlaufsmessungen
erfolgten nicht wie geplant nach etwaig gleichem Therapieintervall nach CRT,
sondern infolge einer problematischen Patienten- Compliance abweichend.
Die MSCT - basierte Volumetrie korreliert gut mit dem Goldstandard MRT, wobei
der RV für beide Techniken problematisch darzustellen ist. Die MSCT ermöglicht
CRT - Responder von Non - Respondern zu unterscheiden. Aufgrund der
dargelegten Limitationen sollte die MSCT nicht an erster Stelle für die kardiale

23
Volumetrie eingesetzt werden, sondern kann bei bestimmten Fragestellungen (wie
beispielsweise bei fraglicher Effektivität eines Schrittmachers bei nicht eindeutiger
Klinik) in Erwägung gezogen werden.
24
Literaturverzeichnis
[1] Agacdiken, A., Vural, A., Ural, D., Sahin, T., Kozdag, G., Kahraman, G., Bildirici, U., Ural, E., Komsuoglu, B.(2005). Effect of cardiac resynchronization therapy on left ventricular diastolic filling pattern in responder and nonresponder patients. Pacing Clin Electrophysiol 28 (7), 654-60
[2] Akyol, A., Alper, A.T., Cakmak, N., Hasdemir, H., Eksik, A., Oguz, E., Erdinler, I.,
Ulufer, F.T., Gurkan, K.(2006). Long-term effects of cardiac resynchronization therapy on heart rate and heart rate variability. Tohoku J Exp Med 209 (4), 337-46
[3] Bland, J.M., Altmann, D.G. (1986) Lancet, 1 (8476) [4] de Simone, G., Galderisi, M.(2002). Quantitation of left ventricular mass and
function: balancing evidence with dreams. Ital Heart J 3 (10), 562-70 [5] Dewey, M., Muller, M., Eddicks, S., Schnapauff, D., Teige, F., Rutsch, W., Borges,
A.C., Hamm, B.(2006). Evaluation of global and regional left ventricular function with 16-slice computed tomography, biplane cineventriculography, and two-dimensional transthoracic echocardiography: comparison with magnetic resonance imaging. J Am Coll Cardiol 48 (10), 2034-44
[6] Einstein, A.J., Henzlova, M.J., Rajagopalan, S.(2007).Estimating risk of cancer
associated with radiation exposure from 64-slice computed tomography coronary angiography. JAMA. 298(3), 317-23
[7] Erbel, R., Krebs, W., Henn, G., Schweizer, P., Richter, H.A., Meyer, J., Effert,
S.(1982). Comparison of single-plane and biplane volume determination by two-dimensional echocardiography. 1. Asymmetric model hearts. Eur Heart J 3 (5), 469-80
[8] Grude, M., Juergens, K.U., Wichter, T., Paul, M., Fallenberg, E.M., Muller, J.G.,
Heindel, W., Breithardt, G., Fischbach, R.(2003). Evaluation of global left ventricular myocardial function with electrocardiogram-gated multidetector computed tomography: comparison with magnetic resonance imaging. Invest Radiol 38 (10), 653-61
[9] Heuschmid, M., Rothfuss, J., Schroder, S., Kuttner, A., Fenchel, M., Stauder, N.,
Mahnken, A.H., Burgstahler, C., Miller, S., Claussen, C.D., Kopp, A.F.(2005). Left ventricular functional parameters: comparison of 16-slice spiral CT with MRI. Rofo 177 (1), 60-6
[10] Jain, D., Shaker, S.M., Burg, M., Wackers, F.J., Soufer, R., Zaret, B.L.(1998). Effects
of mental stress on left ventricular and peripheral vascular performance in patients with coronary artery disease. J Am Coll Cardiol 31 (6), 1314-22
[11] Koch, K., Oellig, F., Kunz, P., Bender, P., Oberholzer, K., Mildenberger, P., Hake, U.,
Kreitner, K.F., Thelen, M.(2004). Assessment of global and regional left ventricular function with a 16-slice spiral-CT using two different software tools for quantitative functional analysis and qualitative evaluation of wall motion changes in comparison with magnetic resonance imaging. Rofo 176 (12), 1786-93
[12] Leschka, S., Wildermuth, S., Boehm, T., Desbiolles, L., Husmann, L., Plass, A.,
Koepfli, P., Schepis, T., Marincek, B., Kaufmann, P.A., Alkadhi, H.(2006).
25
Noninvasive coronary angiography with 64-section CT: effect of average heart rate and heart rate variability on image quality. Radiology 241 (2), 378-85
[13] Linde, C., Leclercq, C., Rex, S., Garrigue, S., Lavergne, T., Cazeau, S., McKenna,
W., Fitzgerald, M., Deharo, J.C., Alonso, C., Walker, S., Braunschweig, F., Bailleul, C., Daubert, J.C.(2002). Long-term benefits of biventricular pacing in congestive heart failure: results from the MUltisite STimulation in cardiomyopathy (MUSTIC) study. J Am Coll Cardiol 40 (1), 111-8
[14] Mahnken, A.H., Spuentrup, E., Niethammer, M., Buecker, A., Boese, J., Wildberger,
J.E., Flohr, T., Sinha, A.M., Krombach, G.A., Gunther, R.W.(2003). Quantitative and qualitative assessment of left ventricular volume with ECG-gated multislice spiral CT: value of different image reconstruction algorithms in comparison to MRI. Acta Radiol 44 (6), 604-11
[15] Mahnken, A.H., Spuntrup, E., Wildberger, J.E., Heuschmid, M., Niethammer, M.,
Sinha, A.M., Flohr, T., Bucker, A., Gunther, R.W.(2003). Quantification of cardiac function with multislice spiral CT using retrospective EKG-gating: comparison with MRI. Rofo 175 (1), 83-8
[16] Miller, S., Hahn, U., Bail, D.M., Helber, U., Nagele, T., Scheule, A.M., Schick, F.,
Duda, S.H., Claussen, C.D.(1999). Cardiac MRI for determining functional left ventricular parameters. Rofo 170 (1), 47-53
[17] Schiller, N.B., Shah, P.M., Crawford, M., DeMaria, A., Devereux, R., Feigenbaum,
H., Gutgesell, H., Reichek, N., Sahn, D., Schnittger, I., Silverman, N.H., Tajik, A.J.(1989). Recommendations for quantitation of the left ventricle by two-dimensional echocardiography: American Society of Echocardiography Committee on Standards, Subcommittee on Quantitation of Two-dimensional Echocardiograms. J Am Soc Echocardiogr. 2, 358-367
[18] Siegel, S., Castellan, N. J. Jr. (1988). Nonparametric statistics for the behavioral
sciences. New York: McGraw-Hill. [19] Steen, H., Nasir, K., Flynn, E., El-Shehaby, I., Lai, S., Katus, H.A., Bluemcke, D.,
Lima, J.A.(2007). Is magnetic resonance imaging the 'reference standard' for cardiac functional assessment? Factors influencing measurement of left ventricular mass and volumes. Clin Res Cardiol 96 (10), 743-51
[20] Thompson, R.B., McVeigh, E.R.(2006). Cardiorespiratory-resolved magnetic
resonance imaging: measuring respiratory modulation of cardiac function. Magn Reson Med 56 (6), 1301-10
[21] Vembar, M., Garcia, M.J., Heuscher, D.J., Haberl, R., Matthews, D., Bohme, G.E.,
Greenberg, N.L.(2003). A dynamic approach to identifying desired physiological phases for cardiac imaging using multislice spiral CT. Med Phys 30 (7), 1683-93

26
Danksagungen:
Herrn Professor Dr. med. D. Horstkotte danke ich sehr für die Überlassung meines
Dissertationsthemas. Sehr herzlich danke ich darüber hinaus Herrn Christoph Langer
für die umfassende Betreuung der Arbeit, Herrn Bernhard Vaske, Mr. Grant Dugtig,
meiner Familie und allen Freunden, sowie ganz besonders meinem Mann Stephan.
27
Lebenslauf
Persönliche Daten
Name: Janina Schröder
Geburtsdaten: 26.03.1983, Herford
Werdegang
08/89 – 07/93 Grundschule Halstern, Löhne
08/93 – 06/02 Städtisches Gymnasium Löhne
Abschluss: Abitur, Note 2,1
10/02 – 04/09 Studium der Humanmedizin an der Medizinischen Hochschule
Hannover
Medizinische Praktika und Famulaturen
03/03 Praktikum Gastroenterologische Station Zweckverband Bad
Oeynhausen
06/03 Praktikum Gastroenterologische Station Zweckverband Bad
Oeynhausen
03/04 Praktikum Neugeborenenstation, Klinikum Herford
08/05 Famulatur in der Abteilung Gastroenterologie des
Zweckverbandskrankenhauses Bad Oeynhausen
03/06 Famulatur in der pädiatrischen Praxis Mahnegold- Randel, Löhne
08/06 Famulatur in der internistisch-kardiologischen Abteilung des Herz- und
Diabeteszentrums NRW, Bad Oeynhausen
04/07 Famulatur in der orthopädischen Praxis Rhades, Bad Oeynhausen
09/07 Famulatur in der unfallchirurgischen Praxis Waezada, Bad Oeynhausen
03/08 – 06/08 Block Innere Medizin des Praktischen Jahres im Klinikum Uelzen
06/08 – 10/08 Block Chirurgie des Praktischen Jahres im Klinikum Uelzen
10/08 – 02/09 Block Wahlfach Pädiatrie des Praktischen Jahres im Klinikum Uelzen
Berufliche Tätigkeit
Seit 08/09 Assistenzärztin für Radiologie in der Gemeinschaftspraxis Radiologie
und Nuklearmedizin Buchholz in der Nordheide
28
Forschungstätigkeit und Doktorarbeit
01/06 – 12/08 Verfassen der Doktorarbeit in der kardiologischen Klinik des Herz- und
Diabeteszentrums NRW, Ruhr-Universität Bochum, Bad Oeynhausen
Publikationen
03/07 Postervorstellung „Mehrschicht-Computertomographie bei
Herzinsuffizienzpatienten: Volumetrische Evaluation vor und unter
kardialer Resynchronisationstherapie.“ auf der 73. Jahrestagung der
Deutschen Gesellschaft für Kardiologie in Mannheim 2007
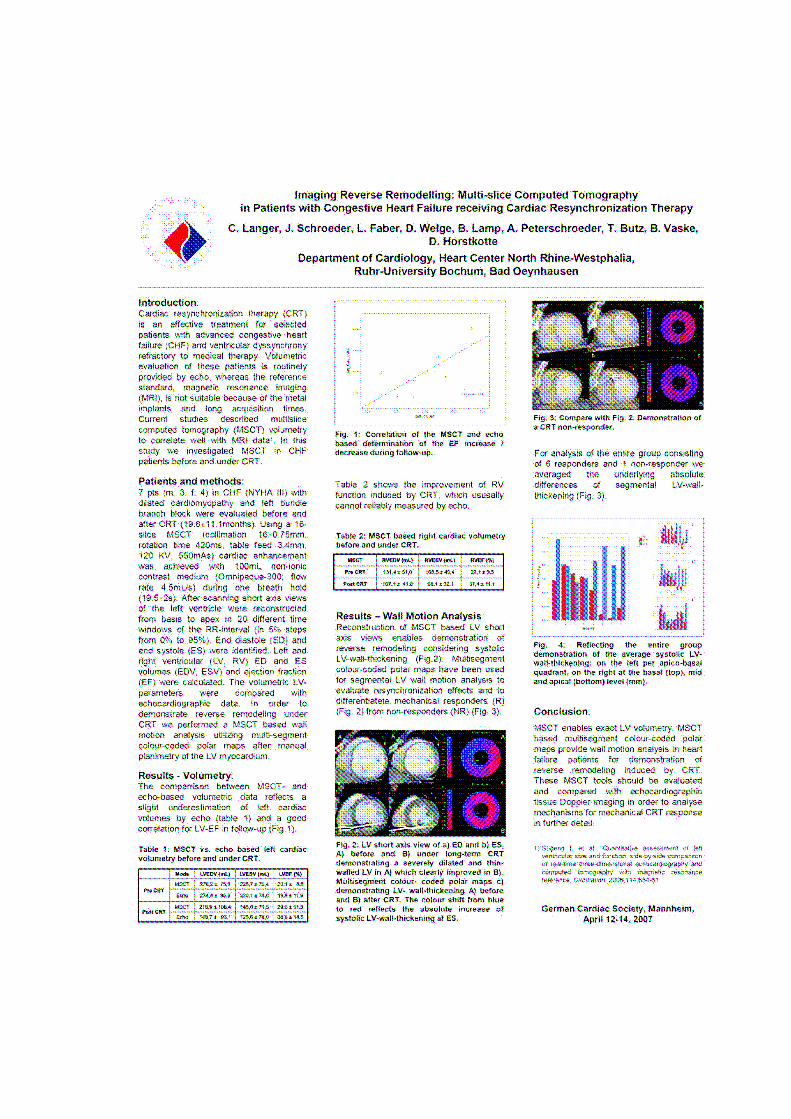
06/07 Postervorstellung „Imaging reverse remodelling: multi-slice computed
tomography in patients with congestive heart failure receiving cardiac
resynchronization therapy.” Europace 2007 in Lissabon
03/08 Freier Vortrag- Resynchronisation und Bildgebung „Kardiale
Mehrschicht Computertomographie: Volumetrie bei
Herzinsuffizienzpatienten vor und nach kardialer
Resynchronisationstherapie“ auf der 74. Jahrestagung der Deutschen
Gesellschaft für Kardiologie in Mannheim 2008
09/09 Schroeder J, Peterschroeder A, Vaske B, Butz T, Barth P, Oldenburg O,
et al.Cardiac volumetry in patients with heart failure and reduced
ejection fraction: acomparative study correlating multi-slice computed
tomography and magnetic resonance tomography. Reasons for
intermodal disagreement. Clin Res Cardiol 2009;98:739-470
02/10 Langer C, Schroeder J, Peterschroeder A, Vaske B, Faber L, Welge D,
Niethammer M, Lamp B, Butz T, Bitter T, Oldenburg O, Horstkotte
D.The potential of multi-slice computed tomography based volumetry
for demonstrating reverse remodeling induced by cardiac
resynchronisation therapy. Comput Med Imaging Graph. 2010 Feb 17
29
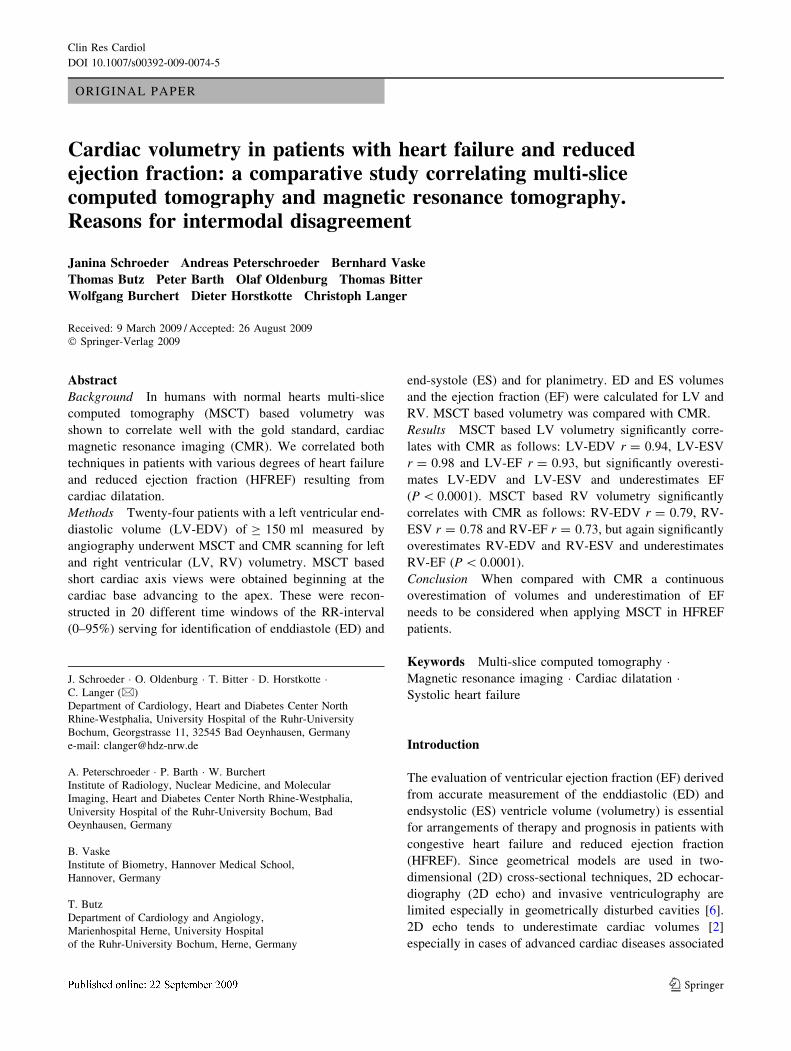
ORIGINAL PAPER
Cardiac volumetry in patients with heart failure and reducedejection fraction: a comparative study correlating multi-slicecomputed tomography and magnetic resonance tomography.Reasons for intermodal disagreement
Janina Schroeder Æ Andreas Peterschroeder Æ Bernhard Vaske ÆThomas Butz Æ Peter Barth Æ Olaf Oldenburg Æ Thomas Bitter ÆWolfgang Burchert Æ Dieter Horstkotte Æ Christoph Langer
Received: 9 March 2009 / Accepted: 26 August 2009
� Springer-Verlag 2009
Abstract
Background In humans with normal hearts multi-slice
computed tomography (MSCT) based volumetry was
shown to correlate well with the gold standard, cardiac
magnetic resonance imaging (CMR). We correlated both
techniques in patients with various degrees of heart failure
and reduced ejection fraction (HFREF) resulting from
cardiac dilatation.
Methods Twenty-four patients with a left ventricular end-
diastolic volume (LV-EDV) of C 150 ml measured by
angiography underwent MSCT and CMR scanning for left
and right ventricular (LV, RV) volumetry. MSCT based
short cardiac axis views were obtained beginning at the
cardiac base advancing to the apex. These were recon-
structed in 20 different time windows of the RR-interval
(0–95%) serving for identification of enddiastole (ED) and
end-systole (ES) and for planimetry. ED and ES volumes
and the ejection fraction (EF) were calculated for LV and
RV. MSCT based volumetry was compared with CMR.
Results MSCT based LV volumetry significantly corre-
lates with CMR as follows: LV-EDV r = 0.94, LV-ESV
r = 0.98 and LV-EF r = 0.93, but significantly overesti-
mates LV-EDV and LV-ESV and underestimates EF
(P \ 0.0001). MSCT based RV volumetry significantly
correlates with CMR as follows: RV-EDV r = 0.79, RV-
ESV r = 0.78 and RV-EF r = 0.73, but again significantly
overestimates RV-EDV and RV-ESV and underestimates
RV-EF (P \ 0.0001).
Conclusion When compared with CMR a continuous
overestimation of volumes and underestimation of EF
needs to be considered when applying MSCT in HFREF
patients.
Keywords Multi-slice computed tomography �Magnetic resonance imaging � Cardiac dilatation �Systolic heart failure
Introduction
The evaluation of ventricular ejection fraction (EF) derived
from accurate measurement of the enddiastolic (ED) and
endsystolic (ES) ventricle volume (volumetry) is essential
for arrangements of therapy and prognosis in patients with
congestive heart failure and reduced ejection fraction
(HFREF). Since geometrical models are used in two-
dimensional (2D) cross-sectional techniques, 2D echocar-
diography (2D echo) and invasive ventriculography are
limited especially in geometrically disturbed cavities [6].
2D echo tends to underestimate cardiac volumes [2]
especially in cases of advanced cardiac diseases associated
J. Schroeder � O. Oldenburg � T. Bitter � D. Horstkotte �C. Langer (&)
Department of Cardiology, Heart and Diabetes Center North
Rhine-Westphalia, University Hospital of the Ruhr-University
Bochum, Georgstrasse 11, 32545 Bad Oeynhausen, Germany
e-mail: [email protected]
A. Peterschroeder � P. Barth � W. Burchert
Institute of Radiology, Nuclear Medicine, and Molecular
Imaging, Heart and Diabetes Center North Rhine-Westphalia,
University Hospital of the Ruhr-University Bochum, Bad
Oeynhausen, Germany
B. Vaske
Institute of Biometry, Hannover Medical School,
Hannover, Germany
T. Butz
Department of Cardiology and Angiology,
Marienhospital Herne, University Hospital
of the Ruhr-University Bochum, Herne, Germany
123
Clin Res Cardiol
DOI 10.1007/s00392-009-0074-5
with very dilated hearts. The image acquisition and inter-
pretation is very much operator and acoustic window
dependant [9].
Three-dimensional (3D) modalities allow for more exact
analysis of cardiac volumetry. Because of its high accu-
racy, reproducibility, low interstudy and interobserver
variability, cardiac magnetic resonance imaging (CMR) is
the gold standard for cardiac volumetry. However, disad-
vantages of CMR are long image acquisition times and
contraindications such as metal implants.
An alternative method for precise volumetry would be
eligible to enable 3D cross-sectional examinations of
patients carrying cardiac pacemakers and defibrillators and
also cater for those patients who cannot tolerate long idle
periods because of orthopnea or claustrophobia. Multi-slice
computed tomography (MSCT) is a 3D cross-sectional
method rapidly advancing in clinical cardiology. Origi-
nally, MSCT was introduced for non-invasive coronary
angiography. Also providing cardiac volumetry, in indi-
viduals with normal cardiac systolic pump function MSCT
has been proven to correlate excellently with CMR [7].
Despite the introduction of MSCT scanners of improved
temporal and spatial resolution, 16-slice technology has
still been considered in current recommendations on car-
diac CT [1, 3].
In this study we compared MSCT with CMR with
respect to left and right cardiac volumetry. In contrast to
other comparative studies reporting MSCT based volume-
try [4, 14], the present series reflects patients at different
stages of HFREF with mildly to highly reduced systolic
pump function, predominantly with severely dilated hearts
due to different etiologies.
Methods
Population
In 2004 we performed a prospective single-center study in
24 patients (14 men, 10 women, age 64.8 ± 9.5 years, BMI
27.21 ± 4.46 kg/m2) with various heart diseases (dilated
cardiomyopathy n = 12; hypertensive heart disease n = 4;
ischemic cardiomyopathy (CAD) n = 8) associated with
reduced systolic left ventricular pump function (left ven-
tricular ejection fraction \ 50%) and enlarged hearts (left
ventricular end-diastolic volume (LV-EDV) C 150 ml
[15]) determined by invasive coronary angiography, left
cardiac ventriculography and hemodynamical assessment,
respectively. Thirteen patients had a left bundly branch
block. The recruited patients were at different stages of
HFREF (NYHA I–II n = 1; NYHA II n = 11; NYHA II–
III n = 1; NYHA III n = 9; NYHA III–IV n = 2) who
were undergoing MSCT and CMR for volumetric
evaluation (Table 1). At the time of examination all patients
were in sinus rhythm and clinically stable. The patients had
a steady state consensus medication containing beta
blockers. Extra beta blockers for heart rhythm control were
not given before any volumetric exam. The maximum time
span including both examinations was 2 days. The German
Federal Office for Radiation Protection (www.bfs.de/en/bfs)
and the local ethics committee had approved the study
protocol according to the Helsinki Declaration (1975/1983).
Written informed consent was obtained from each patient.
Multi-slice computed tomography
Cardiac MSCT (16-slice CT, Cardiac Sensation, Siemens,
Medical Solutions, Forchheim, Germany) was performed
using the scan protocol defined for non-invasive coronary
angiography (collimation 16 mm 9 0.75 mm, gantry
rotation speed 420 ms, 120 kV, 300 mAs, 100 ml contrast
medium (Iopromide, iodine content 370 mg/ml; Ultra-
vistTM, Bayer-Schering, Berlin, Germany), flow rate 4 ml/s,
increment 8 mm, reconstructed slice thickness 8 mm).
Under ECG recording, helical scanning was performed
within a single breath-hold from the carina to the cardiac
apex. All patients were instructed to hyperventilate before
the scan and to hold their breath in inspiration during the
scan. After MSCT scanning, the raw data was used for
retrospective reconstruction of the transverse images using
an offline workstation (Navigator, Siemens, Medical
Solutions, Forchheim, Germany). Based on the four
chamber view for orientation, short cardiac axis views
demonstrating LV and RV were reconstructed from the
cardiac basis beginning at the mitral valve annulus to the
apex resulting in 8–14 adjacent slices. These were recon-
structed in 20 different time windows of the RR-interval
(0–95% in 5% steps) serving for identification of the ES
and ED phase (Fig. 1).
Magnetic resonance imaging
Magnetic resonance imaging (1.5 T, Gyroscan ACS-NT,
Philips Medical Systems, Best, The Netherlands, Powert-
rak 5000, R8, maximum gradient performance 30 mT/m,
slew rate 150 T/m/s) was performed using a five-element
cardiac phased-array synergy coil. Imaging parameters: 15
continuous phases, field of view 380 mm, scan percentage
180% in order to get the relation echo time (TE)/repetition
time (TR) of 0.5 and a tolerable breath-hold time,
112 9 256 matrix, reconstructed spatial resolution
1.48 mm 9 1.48 mm 9 8 mm, TR 2.8 ms, TE 1.4 ms, flip
angle 65�, no partial echo, number of signal averages 1.
Following the acquisition of survey scans, breath-hold cine
sequences in four-chamber and short-axis plane were
obtained in expiration covering left and right ventricle in
Clin Res Cardiol
123
both views in 8–14 adjacent slices. An ECG-triggered,
multiple heart-phase, free precession steady state technique
(balanced fast field echo) was used (Fig. 1). Sensitivity
encoding was used (SENSE), which leads to an advance of
temporal resolution of 39–100 ms (65 ± 15.1 ms)
depending on heart rate.
Image analysis in MSCT and CMR
Image analysis was performed off-line on a commercially
available system (personal computer/Linux) for both
methods. In either modality and for LV and RV, end-
diastole was defined as the phase with the largest total area
and end-systole (ES) with the smallest total area within the
endocardial contours. At these two phases all slices from
cardiac basis (mitral annulus) to apex endocardial contours
were semi-automatically traced in order to calculate car-
diac volumes and EF by slice summation for the LV. In
both methods, contours were defined by one mouse click
into the cavum and another into the myocardium to see the
differences of signal intensities. The mean value was
defined to be the signal intensity of the myocardium/cavum
line, which was then marked as the endocardial contour in
the respective slice. In both methods contours underwent
manual corrections. The MSCT based image data was
evaluated by a radiologist and a cardiologist and the CMR
images by two radiologists, all experienced in their
respective field of 3D cross-sectional imaging. Papillary
muscles were consequently excluded from the cavity. RV
volumetry was also provided by semi-automatic contour-
ing. For short-axis reformations, the most basal slice was
defined as the image closest to the mitral valve annulus
showing LV myocardium in at least 50% of its perimeter
(Fig. 1).
Statistical analysis
All LV and RV volumes and EF were expressed as
mean ± SD. Categorical data are represented with absolute
frequencies and percentages. The agreement between CMR
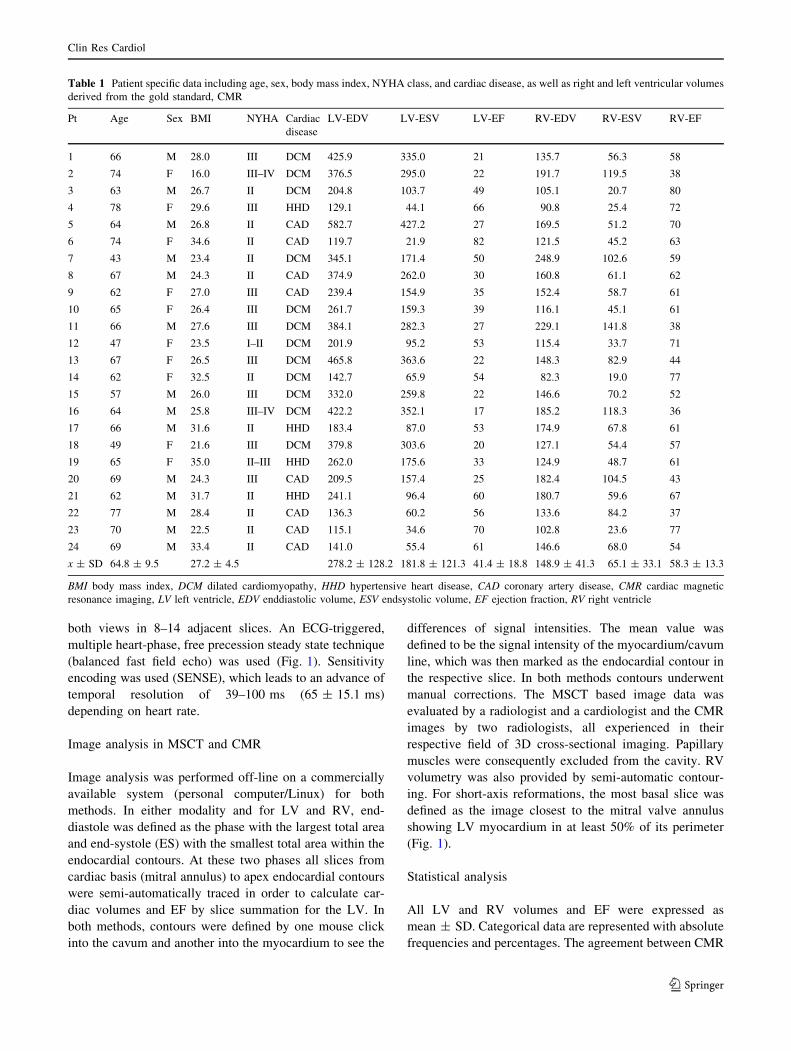
Table 1 Patient specific data including age, sex, body mass index, NYHA class, and cardiac disease, as well as right and left ventricular volumes
derived from the gold standard, CMR
Pt Age Sex BMI NYHA Cardiac
disease
LV-EDV LV-ESV LV-EF RV-EDV RV-ESV RV-EF
1 66 M 28.0 III DCM 425.9 335.0 21 135.7 56.3 58
2 74 F 16.0 III–IV DCM 376.5 295.0 22 191.7 119.5 38
3 63 M 26.7 II DCM 204.8 103.7 49 105.1 20.7 80
4 78 F 29.6 III HHD 129.1 44.1 66 90.8 25.4 72
5 64 M 26.8 II CAD 582.7 427.2 27 169.5 51.2 70
6 74 F 34.6 II CAD 119.7 21.9 82 121.5 45.2 63
7 43 M 23.4 II DCM 345.1 171.4 50 248.9 102.6 59
8 67 M 24.3 II CAD 374.9 262.0 30 160.8 61.1 62
9 62 F 27.0 III CAD 239.4 154.9 35 152.4 58.7 61
10 65 F 26.4 III DCM 261.7 159.3 39 116.1 45.1 61
11 66 M 27.6 III DCM 384.1 282.3 27 229.1 141.8 38
12 47 F 23.5 I–II DCM 201.9 95.2 53 115.4 33.7 71
13 67 F 26.5 III DCM 465.8 363.6 22 148.3 82.9 44
14 62 F 32.5 II DCM 142.7 65.9 54 82.3 19.0 77
15 57 M 26.0 III DCM 332.0 259.8 22 146.6 70.2 52
16 64 M 25.8 III–IV DCM 422.2 352.1 17 185.2 118.3 36
17 66 M 31.6 II HHD 183.4 87.0 53 174.9 67.8 61
18 49 F 21.6 III DCM 379.8 303.6 20 127.1 54.4 57
19 65 F 35.0 II–III HHD 262.0 175.6 33 124.9 48.7 61
20 69 M 24.3 III CAD 209.5 157.4 25 182.4 104.5 43
21 62 M 31.7 II HHD 241.1 96.4 60 180.7 59.6 67
22 77 M 28.4 II CAD 136.3 60.2 56 133.6 84.2 37
23 70 M 22.5 II CAD 115.1 34.6 70 102.8 23.6 77
24 69 M 33.4 II CAD 141.0 55.4 61 146.6 68.0 54
x ± SD 64.8 ± 9.5 27.2 ± 4.5 278.2 ± 128.2 181.8 ± 121.3 41.4 ± 18.8 148.9 ± 41.3 65.1 ± 33.1 58.3 ± 13.3
BMI body mass index, DCM dilated cardiomyopathy, HHD hypertensive heart disease, CAD coronary artery disease, CMR cardiac magnetic
resonance imaging, LV left ventricle, EDV enddiastolic volume, ESV endsystolic volume, EF ejection fraction, RV right ventricle
Clin Res Cardiol
123
and MSCT measurement of RV and LV volumes and EF
was evaluated through the use of Bland–Altmann analysis
by calculating the bias (mean difference) and the 95%
limits of agreement (two SD around the mean difference).
For the statistical analysis the Pearson correlation coeffi-
cient (r) was calculated. Significant differences were
determined by using the Wilcoxon Signed Ranks Test. The
significance level was P \ 0.05. All analyses were con-
ducted using SPSS (SPSS, version 17, Chicago, IL, USA).
Results
Threatened by repeated breathing commands two patients
had to interrupt CMR scanning because of the onset of
orthopnea. For demographical, clinical data and cardiac
dimensions see Table 1. The average heart rate in CMR
was 65.4 ± 15.1 bpm and in MSCT 64.6 ± 15.8 bpm.
Limiting artifacts due to arrhythmia or respiratory motion
which may have led to exclusion of data analysis were
detected in neither CMR nor in MSCT.
With regard to radiation exposure, the volumetric CT
dose index and the dosage length product (DLP) were
665.67 ± 25.63 mGy and 625.33 ± 171.88 mGy 9 cm
respectively, resulting in a calculated radiation exposure
[DLP times conversion factor (m 0.017, f 0.025)] of
11.32 ± 0.44 mSv for male and 15.63 ± 4.30 mSv for
female patients.
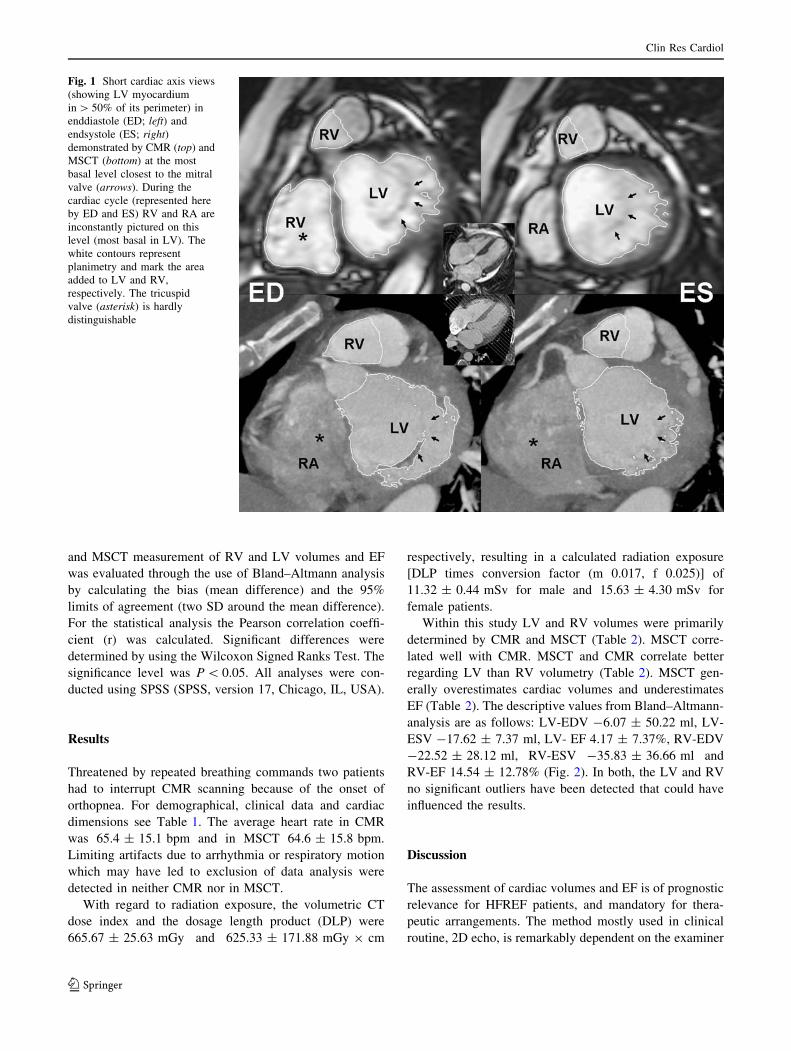
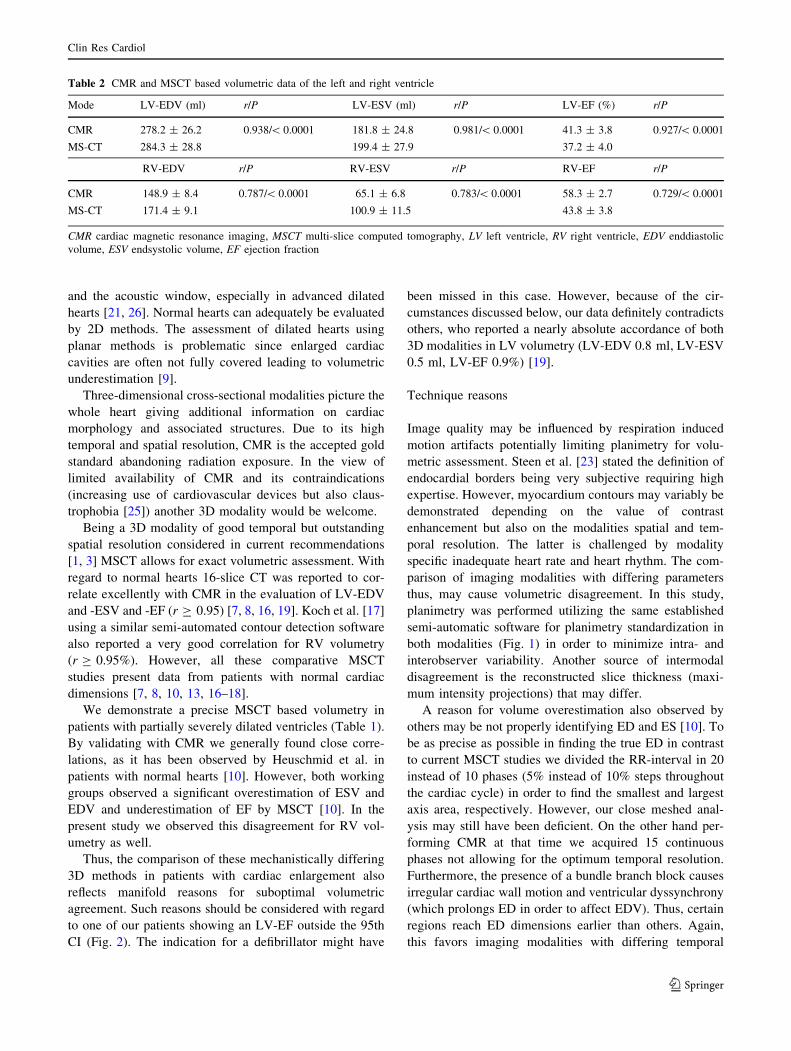
Within this study LV and RV volumes were primarily
determined by CMR and MSCT (Table 2). MSCT corre-
lated well with CMR. MSCT and CMR correlate better
regarding LV than RV volumetry (Table 2). MSCT gen-
erally overestimates cardiac volumes and underestimates
EF (Table 2). The descriptive values from Bland–Altmann-
analysis are as follows: LV-EDV -6.07 ± 50.22 ml, LV-
ESV -17.62 ± 7.37 ml, LV- EF 4.17 ± 7.37%, RV-EDV
-22.52 ± 28.12 ml, RV-ESV -35.83 ± 36.66 ml and
RV-EF 14.54 ± 12.78% (Fig. 2). In both, the LV and RV
no significant outliers have been detected that could have
influenced the results.
Discussion
The assessment of cardiac volumes and EF is of prognostic
relevance for HFREF patients, and mandatory for thera-
peutic arrangements. The method mostly used in clinical
routine, 2D echo, is remarkably dependent on the examiner
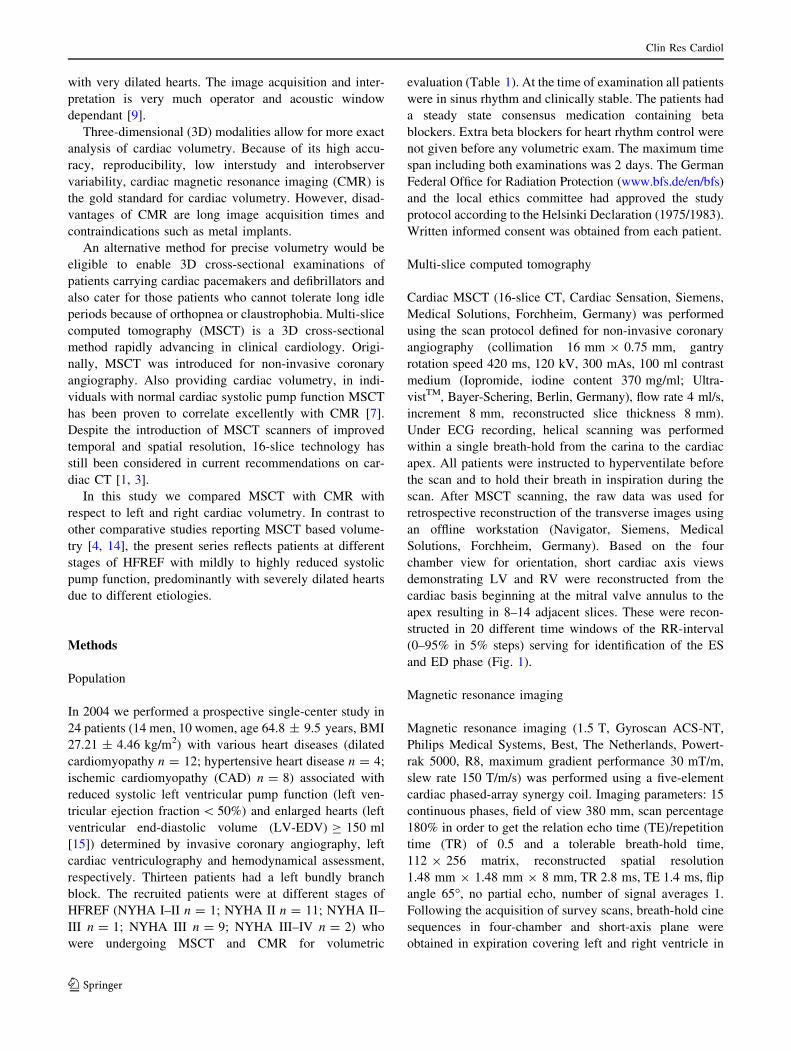
Fig. 1 Short cardiac axis views
(showing LV myocardium
in [ 50% of its perimeter) in
enddiastole (ED; left) and
endsystole (ES; right)demonstrated by CMR (top) and
MSCT (bottom) at the most
basal level closest to the mitral
valve (arrows). During the
cardiac cycle (represented here
by ED and ES) RV and RA are
inconstantly pictured on this
level (most basal in LV). The
white contours represent
planimetry and mark the area
added to LV and RV,
respectively. The tricuspid
valve (asterisk) is hardly
distinguishable
Clin Res Cardiol
123
and the acoustic window, especially in advanced dilated
hearts [21, 26]. Normal hearts can adequately be evaluated
by 2D methods. The assessment of dilated hearts using
planar methods is problematic since enlarged cardiac
cavities are often not fully covered leading to volumetric
underestimation [9].
Three-dimensional cross-sectional modalities picture the
whole heart giving additional information on cardiac
morphology and associated structures. Due to its high
temporal and spatial resolution, CMR is the accepted gold
standard abandoning radiation exposure. In the view of
limited availability of CMR and its contraindications
(increasing use of cardiovascular devices but also claus-
trophobia [25]) another 3D modality would be welcome.
Being a 3D modality of good temporal but outstanding
spatial resolution considered in current recommendations
[1, 3] MSCT allows for exact volumetric assessment. With
regard to normal hearts 16-slice CT was reported to cor-
relate excellently with CMR in the evaluation of LV-EDV
and -ESV and -EF (r C 0.95) [7, 8, 16, 19]. Koch et al. [17]
using a similar semi-automated contour detection software
also reported a very good correlation for RV volumetry
(r C 0.95%). However, all these comparative MSCT
studies present data from patients with normal cardiac
dimensions [7, 8, 10, 13, 16–18].
We demonstrate a precise MSCT based volumetry in
patients with partially severely dilated ventricles (Table 1).
By validating with CMR we generally found close corre-
lations, as it has been observed by Heuschmid et al. in
patients with normal hearts [10]. However, both working
groups observed a significant overestimation of ESV and
EDV and underestimation of EF by MSCT [10]. In the
present study we observed this disagreement for RV vol-
umetry as well.
Thus, the comparison of these mechanistically differing
3D methods in patients with cardiac enlargement also
reflects manifold reasons for suboptimal volumetric
agreement. Such reasons should be considered with regard
to one of our patients showing an LV-EF outside the 95th
CI (Fig. 2). The indication for a defibrillator might have
been missed in this case. However, because of the cir-
cumstances discussed below, our data definitely contradicts
others, who reported a nearly absolute accordance of both
3D modalities in LV volumetry (LV-EDV 0.8 ml, LV-ESV
0.5 ml, LV-EF 0.9%) [19].
Technique reasons
Image quality may be influenced by respiration induced
motion artifacts potentially limiting planimetry for volu-
metric assessment. Steen et al. [23] stated the definition of
endocardial borders being very subjective requiring high
expertise. However, myocardium contours may variably be
demonstrated depending on the value of contrast
enhancement but also on the modalities spatial and tem-
poral resolution. The latter is challenged by modality
specific inadequate heart rate and heart rhythm. The com-
parison of imaging modalities with differing parameters
thus, may cause volumetric disagreement. In this study,
planimetry was performed utilizing the same established
semi-automatic software for planimetry standardization in
both modalities (Fig. 1) in order to minimize intra- and
interobserver variability. Another source of intermodal
disagreement is the reconstructed slice thickness (maxi-
mum intensity projections) that may differ.
A reason for volume overestimation also observed by
others may be not properly identifying ED and ES [10]. To
be as precise as possible in finding the true ED in contrast
to current MSCT studies we divided the RR-interval in 20
instead of 10 phases (5% instead of 10% steps throughout
the cardiac cycle) in order to find the smallest and largest
axis area, respectively. However, our close meshed anal-
ysis may still have been deficient. On the other hand per-
forming CMR at that time we acquired 15 continuous
phases not allowing for the optimum temporal resolution.
Furthermore, the presence of a bundle branch block causes
irregular cardiac wall motion and ventricular dyssynchrony
(which prolongs ED in order to affect EDV). Thus, certain
regions reach ED dimensions earlier than others. Again,
this favors imaging modalities with differing temporal
Table 2 CMR and MSCT based volumetric data of the left and right ventricle
Mode LV-EDV (ml) r/P LV-ESV (ml) r/P LV-EF (%) r/P
CMR 278.2 ± 26.2 0.938/\ 0.0001 181.8 ± 24.8 0.981/\ 0.0001 41.3 ± 3.8 0.927/\ 0.0001
MS-CT 284.3 ± 28.8 199.4 ± 27.9 37.2 ± 4.0
RV-EDV r/P RV-ESV r/P RV-EF r/P
CMR 148.9 ± 8.4 0.787/\ 0.0001 65.1 ± 6.8 0.783/\ 0.0001 58.3 ± 2.7 0.729/\ 0.0001
MS-CT 171.4 ± 9.1 100.9 ± 11.5 43.8 ± 3.8
CMR cardiac magnetic resonance imaging, MSCT multi-slice computed tomography, LV left ventricle, RV right ventricle, EDV enddiastolic
volume, ESV endsystolic volume, EF ejection fraction
Clin Res Cardiol
123
resolutions to deviate from each other concerning volu-
metric assessment.
Another relevant issue is the definition of papillary
muscles. Their inconsequent and incomplete inclusion or
exclusion from cardiac cavity may dramatically affect
measurement accuracy. As suggested by others, in the
present study papillary muscles were consequently exclu-
ded from the cavity [10, 19, 23].
A further potential source of error for determining vol-
umetric parameters from short cardiac axis views of either
3D method is the definition and the inclusion or exclusion
of the most basal slice. It may include outflow tract and
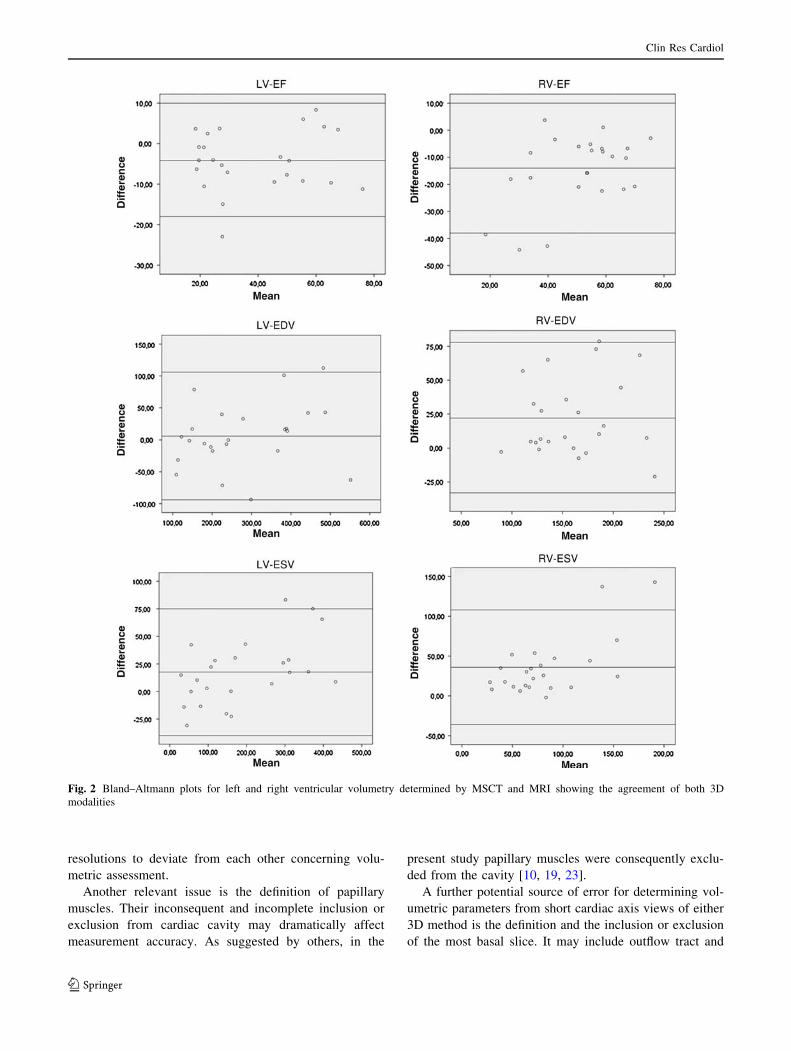
Fig. 2 Bland–Altmann plots for left and right ventricular volumetry determined by MSCT and MRI showing the agreement of both 3D
modalities
Clin Res Cardiol
123
atrium. In LV and especially in RV volumetry, the con-
sequent inclusion or exclusion of these parts is most
challenging even for 3D cross-sectional methods (Fig. 1).
In this study we defined the most basal slice as the image
closest to the mitral valve showing LV myocardium in at
least 50% of its perimeter [14].
Volumetric assessment of the RV is in general more
problematic because of its complex geometry [11]. In
MSCT as well as in CMR anatomical landmarks are
mandatory for planimetry but may hardly be detected at
deficient contrast. Raman et al. however, note the depen-
dence of RV evaluability from optimized contrast
enhancement which can certainly also be applied to LV
evaluability [22].
Physiological causes
During inspiration LV-EDV is supposed to be smaller
when compared to expiration. With respect to RV-EDV it
is reverse [24]. In CMR data acquisition happens during
breath-hold in expiration, while in MSCT it is limited to
the inspiration phase, which may also contribute to cause
volumetric disagreement. Thus, the comparison of MSCT
and CMR implies a not fully congruent ED and ES.
A further reason for differing volumetric values is the
proven day-to-day fluctuation of left ventricular function
described by McAnulty et al. [20]. Interstudy variations in
left ventricular volumes and EF were interpreted as spon-
taneous changes. The average interval between the proce-
dures was 24 h (48 h in this study) and as in this study
neither medical nor catheter based intervention were done
[20]. Whether volumetric fluctuation is even increased in
HFREF patients—with regard to frequency and ampli-
tude—remains unclear. Evident is that during CMR various
conditions like longer idle period, darkness and sound
intensity cause mental stress. In healthy subjects this may
provoke a decrease of LV-EF [12].
The HFREF patients (Table 1) recruited for this study
were challenged by prolonged examination where they had
to lie down in an uncomfortable environment favoring
mental stress [12]. 16-slice CT needs one breath-hold
lasting a maximum of around 20 s for data acquisition. It
has to be considered that in patients with advanced HFREF,
the position (suppine in CMR for C 20 min and in MSCT
for around 8 min until the scan starts may have an impact
on cardiac volumetry.
The influence of agents
Our cohort of HFREF patients had a steady state consensus
medication containing beta blockers. Extra beta blockers
for heart rate control must not be given before any
volumetric exam, since altered cardiac hemodynamic cir-
cumstances falsify ventricular volumetry.
During MSCT a bolus injection of 100 ml of contrast
medium should not have a significant influence on a normal
heart. However, the impact of such a bolus on patients in a
supine position with a highly reduced cardiac pump func-
tion may have an influence.
Another aspect is the osmotical effect of the contrast
medium we used: the osmolarity of 100 ml Iopromid
(Ultravist; iodine content 370 mg/ml, Bayer-Schering,
Berlin, Germany) is 600 mosmol/ml, which is twice the
amount of the human body fluid. To reach the same osm-
otical value, the same quantity of intracellular water is
rapidly drawn into the vasculature during the examination
followed by an increased volume load provided by the
contrast medium itself.
Limitations
All patients were recruited after being identified to have
LV dilatation or dysfunction during invasive diagnosis.
The cut-off LV-EDV of 150 ml was taken from the liter-
ature [15]. In the following CMR and MSCT based 3D
volumetric assessment, a subgroup was proved to have
normal LV volumes or EF. This disagreement between
invasive diagnosis and 3D imaging has reasons partially
discussed above and was caused by technical problems
during angio as, e.g., low contrast, cath induced ventricular
tachycardia etc. By focussing on the dilated hearts this
subgroup may have biased the results. Removing these
patients would have reduced the study power. We worked
with absolute values instead of indices.
The extent of mechanistical circumstances, in which
MSCT and CMR differ but may have specifically influ-
enced cardiac volumetry, was not primarily investigated.
As current studies also under the use of semi-automated
planimetry software showed a persistent good intra- and
interobserver variability, such analysis was neglected in the
present study.
With regard to temporal resolution the compared
modalities clearly differentiate (CMR up to 40 ms, MSCT
up to 105 ms) which may have contributed to the sys-
tematic difference in volumetric assessment. However,
current studies proved a very good accordance of both 3D
modalities in patients with normal systolic pump function
[9, 10, 16, 18]. Thus, compared to latest MSCT scanners
16-slice technology considered in current guidelines [1, 3]
maybe problematic in non-invasive coronary angiography
but temporal resolution is of less relevance in the volu-
metric assessment of patients with reduced EF and cardiac
dilatation showing a clearly lower motion amplitude and
velocity in average.
Clin Res Cardiol
123
Multi-slice computed tomography is not considered to
be first-line modality for cardiac volumetry which it
should certainly not be applied exclusively for. However,
MSCT can simultaneously provide accessory dynamic
information in certain patients undergoing non-invasive
coronary angiography what it was originally established
for.
In this study patients with atrial fibrillation (AF) were
excluded. AF is a contraindication for MSCT based non-
invasive coronary angiography [1, 3] but is found in about
45% of HFREF patients [5]. Thus, AF limits MSCT to only
a portion of HFREF patients with enlarged ventricles
needing coronary diagnosis and more precise volumetric
assessment than e.g. 2D echo can provide. However, AF
can also reduce diagnostic accuracy of CMR based volu-
metric analysis due to limited temporal resolution.
Multi-slice computed tomography based volumetry,
which requires scan coverage including ED and ES, posses
a relatively high radiation exposure. This makes MSCT
unsuitable for routine volumetric studies. However, in
patients of advanced age or with HFREF and a reduced life
expectancy who are not to be exposed to radiation-related
diseases, MSCT may be used to obtain an accurate diag-
nosis in certain circumstances.
Conclusion
In patients with profoundly dilated hearts MSCT based
volumetry correlates well with the gold standard, CMR. A
continuous overestimation of EDV and ESV and underes-
timation of EF needs to be considered when applying
MSCT in HFREF patients. This intermodal disagreement is
due to a variety of differing mechanistical circumstances.
However, definitely not being a first-line volumetric tool
rather than providing cardiac volumetry as a by-product,
this qualifies MSCT as an alternative method for CMR in
cases of contraindications. MSCT based volumetry should
be reserved for patients who should not be exposed to
radiation induced illness.
Acknowledgments We would like to thank Mrs Astrid Kleemeyer,
Mr Armin Kuehn, Mrs Kathleen Hedde, Mr Grant Dugtig and Mr Jan
Hendrik Langer, for their friendly contribution to this work. The
project was supported by a grant of Schering/Bayer, Germany.
References
1. Abbara S, Arbab-Zadeh A, Callister TQ, Desai MY, Mamuya W,
Thomson L, Weigold WG (2009) SCCT guidelines for perfor-
mance of coronary computed tomographic angiography: a report
of the Society of Cardiovascular Computed Tomography
Guidelines Committee. J Cardiovasc Comput Tomogr 3(3):190–
204 [Epub 2009 Mar 31]
2. Allison JD, Flickinger FW, Wright JC, Falls DG III, Prisant LM,
VonDohlen TW, Frank MJ (1993) Measurement of left ventric-
ular mass in hypertrophic cardiomyopathy using MRI: compari-
son with echocardiography. Magn Reson Imaging 11:329–334
3. Bluemke DA, Achenbach S, Budoff M, Gerber TC, Gersh B,
Hillis LD, Hundley WG, Manning WJ, Printz BF, Stuber M,
Woodard PK (2008) Noninvasive coronary artery imaging:
magnetic resonance angiography and multidetector computed
tomography angiography: a scientific statement from the ameri-
can heart association committee on cardiovascular imaging and
intervention of the council on cardiovascular radiology and
intervention, and the councils on clinical cardiology and cardio-
vascular disease in the young. Circulation 118:586–606
4. Butler J, Shapiro MD, Jassal DS, Neilan TG, Nichols J, Ferencik
M, Brady TJ, Hoffmann U, Cury RC (2007) Comparison of
multidetector computed tomography and two-dimensional trans-
thoracic echocardiography for left ventricular assessment in
patients with heart failure. Am J Cardiol 99:247–249
5. Cleland JG, Swedberg K, Follath F, Komajda M, Cohen-Solal A,
Aguilar JC, Dietz R, Gavazzi A, Hobbs R, Korewicki J, Madeira
HC, Moiseyev VS, Preda I, van Gilst WH, Widimsky J, Free-
mantle N, Eastaugh J, Mason J (2003) The EuroHeart Failure
survey programme—a survey on the quality of care among
patients with heart failure in Europe. Part 1: patient characteris-
tics and diagnosis. Eur Heart J 24:442–463
6. Delagardelle C, Feiereisen P, Vaillant M, Gilson G, Lasar Y,
Beissel J, Wagner D (2008) Reverse remodelling through exer-
cise training is more pronounced in non-ischemic heart failure.
Clin Res Cardiol 97:865–871
7. Dewey M, Muller M, Eddicks S, Schnapauff D, Teige F, Rutsch
W, Borges AC, Hamm B (2006) Evaluation of global and
regional left ventricular function with 16-slice computed
tomography, biplane cineventriculography, and two-dimensional
transthoracic echocardiography: comparison with magnetic res-
onance imaging. J Am Coll Cardiol 48:2034–2044
8. Grude M, Juergens KU, Wichter T, Paul M, Fallenberg EM,
Muller JG, Heindel W, Breithardt G, Fischbach R (2003) Eval-
uation of global left ventricular myocardial function with elec-
trocardiogram-gated multidetector computed tomography:
comparison with magnetic resonance imaging. Invest Radiol
38:653–661
9. Gutierrez-Chico JL, Zamorano JL, Perez de Isla L, Orejas M,
Almeria C, Rodrigo JL, Ferreiros J, Serra V, Macaya C (2005)
Comparison of left ventricular volumes and ejection fractions
measured by three-dimensional echocardiography versus by two-
dimensional echocardiography and cardiac magnetic resonance in
patients with various cardiomyopathies. Am J Cardiol 95:809–
813
10. Heuschmid M, Rothfuss J, Schroder S, Kuttner A, Fenchel M,
Stauder N, Mahnken AH, Burgstahler C, Miller S, Claussen CD,
Kopp AF (2005) Left ventricular functional parameters: com-
parison of 16-slice spiral CT with MRI. Rofo 177:60–66
11. Hur J, Kim TH, Kim SJ, Ryu YH, Kim HJ (2007) Assessment of
the right ventricular function and mass using cardiac multi-
detector computed tomography in patients with chronic obstruc-
tive pulmonary disease. Korean J Radiol 8:15–21
12. Jain D, Shaker SM, Burg M, Wackers FJ, Soufer R, Zaret BL
(1998) Effects of mental stress on left ventricular and peripheral
vascular performance in patients with coronary artery disease.
J Am Coll Cardiol 31:1314–1322
13. Juergens KU, Grude M, Maintz D, Fallenberg EM, Wichter T,
Heindel W, Fischbach R (2004) Multi-detector row CT of left
ventricular function with dedicated analysis software versus MR
imaging: initial experience. Radiology 230:403–410
14. Juergens KU, Seifarth H, Maintz D, Grude M, Ozgun M, Wichter
T, Heindel W, Fischbach R (2006) MDCT determination of
Clin Res Cardiol
123
volume and function of the left ventricle: are short-axis image
reformations necessary? AJR Am J Roentgenol 186:S371–S378
15. Kennedy JW, Baxley WA, Figley MM, Dodge HT, Blackmon JR
(1966) Quantitative angiocardiography. I. The normal left ven-
tricle in man. Circulation 34(2):272–278 (No abstract available)
16. Koch K, Oellig F, Kunz P, Bender P, Oberholzer K, Mildenberger
P, Hake U, Kreitner KF, Thelen M (2004) Assessment of global and
regional left ventricular function with a 16-slice spiral-CT using
two different software tools for quantitative functional analysis and
qualitative evaluation of wall motion changes in comparison with
magnetic resonance imaging. Rofo 176:1786–1793
17. Koch K, Oellig F, Oberholzer K, Bender P, Kunz P, Mildenberger
P, Hake U, Kreitner KF, Thelen M (2005) Assessment of right
ventricular function by 16-detector row CT: comparison with
magnetic resonance imaging. Eur Radiol 15:312–318
18. Mahnken AH, Spuentrup E, Niethammer M, Buecker A, Boese J,
Wildberger JE, Flohr T, Sinha AM, Krombach GA, Gunther RW
(2003) Quantitative and qualitative assessment of left ventricular
volume with ECG-gated multislice spiral CT: value of different
image reconstruction algorithms in comparison to MRI. Acta
Radiol 44:604–611
19. Mahnken AH, Spuntrup E, Wildberger JE, Heuschmid M,
Niethammer M, Sinha AM, Flohr T, Bucker A, Gunther RW (2003)
Quantification of cardiac function with multislice spiral CT using
retrospective EKG-gating: comparison with MRI. Rofo 175:83–88
20. McAnulty JH, Kremkau EL, Rosch J, Hattenhauer MT,
Rahimtoola SH (1974) Spontaneous changes in left ventricular
function between sequential studies. Am J Cardiol 34:23–28
21. Otterstad JE, Froeland G, St John Sutton M, Holme I (1997)
Accuracy and reproducibility of biplane two-dimensional echo-
cardiographic measurements of left ventricular dimensions and
function. Eur Heart J 18:507–513
22. Raman SV, Shah M, McCarthy B, Garcia A, Ferketich AK (2006)
Multi-detector row cardiac computed tomography accurately
quantifies right and left ventricular size and function compared
with cardiac magnetic resonance. Am Heart J 151:736–744
23. Steen H, Nasir K, Flynn E, El-Shehaby I, Lai S, Katus HA,
Bluemcke D, Lima JA (2007) Is magnetic resonance imaging the
‘reference standard’ for cardiac functional assessment? Factors
influencing measurement of left ventricular mass and volumes.
Clin Res Cardiol 96:743–751
24. Thompson RB, McVeigh ER (2006) Cardiorespiratory-resolved
magnetic resonance imaging: measuring respiratory modulation
of cardiac function. Magn Reson Med 56:1301–1310
25. Thorpe S, Salkovskis PM, Dittner A (2008) Claustrophobia in
MRI: the role of cognitions. Magn Reson Imaging 26:1081–1088
26. Wallerson DC, Devereux RB (1987) Reproducibility of echo-
cardiographic left ventricular measurements. Hypertension
9:II6–II18
Clin Res Cardiol
123
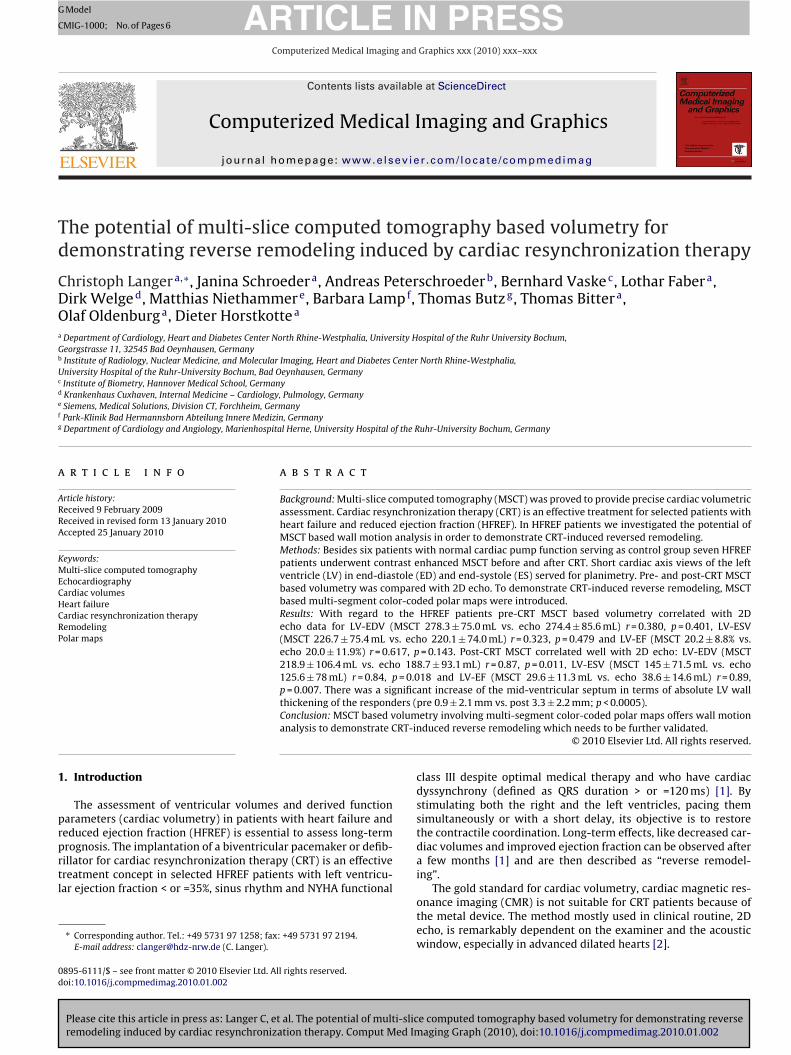
G
C
Td
CDOa
Gb
Uc
d
e
f
g
a
ARRA
KMECHCRP
1
prprtl
0d
ARTICLE IN PRESSModel
MIG-1000; No. of Pages 6
Computerized Medical Imaging and Graphics xxx (2010) xxx–xxx
Contents lists available at ScienceDirect
Computerized Medical Imaging and Graphics
journa l homepage: www.e lsev ier .com/ locate /compmedimag
he potential of multi-slice computed tomography based volumetry foremonstrating reverse remodeling induced by cardiac resynchronization therapy
hristoph Langera,∗, Janina Schroedera, Andreas Peterschroederb, Bernhard Vaskec, Lothar Fabera,irk Welged, Matthias Niethammere, Barbara Lampf, Thomas Butzg, Thomas Bittera,laf Oldenburga, Dieter Horstkottea
Department of Cardiology, Heart and Diabetes Center North Rhine-Westphalia, University Hospital of the Ruhr University Bochum,eorgstrasse 11, 32545 Bad Oeynhausen, GermanyInstitute of Radiology, Nuclear Medicine, and Molecular Imaging, Heart and Diabetes Center North Rhine-Westphalia,niversity Hospital of the Ruhr-University Bochum, Bad Oeynhausen, GermanyInstitute of Biometry, Hannover Medical School, GermanyKrankenhaus Cuxhaven, Internal Medicine – Cardiology, Pulmology, GermanySiemens, Medical Solutions, Division CT, Forchheim, GermanyPark-Klinik Bad Hermannsborn Abteilung Innere Medizin, GermanyDepartment of Cardiology and Angiology, Marienhospital Herne, University Hospital of the Ruhr-University Bochum, Germany
r t i c l e i n f o
rticle history:eceived 9 February 2009eceived in revised form 13 January 2010ccepted 25 January 2010
eywords:ulti-slice computed tomography
chocardiographyardiac volumeseart failureardiac resynchronization therapyemodelingolar maps
a b s t r a c t
Background: Multi-slice computed tomography (MSCT) was proved to provide precise cardiac volumetricassessment. Cardiac resynchronization therapy (CRT) is an effective treatment for selected patients withheart failure and reduced ejection fraction (HFREF). In HFREF patients we investigated the potential ofMSCT based wall motion analysis in order to demonstrate CRT-induced reversed remodeling.Methods: Besides six patients with normal cardiac pump function serving as control group seven HFREFpatients underwent contrast enhanced MSCT before and after CRT. Short cardiac axis views of the leftventricle (LV) in end-diastole (ED) and end-systole (ES) served for planimetry. Pre- and post-CRT MSCTbased volumetry was compared with 2D echo. To demonstrate CRT-induced reverse remodeling, MSCTbased multi-segment color-coded polar maps were introduced.Results: With regard to the HFREF patients pre-CRT MSCT based volumetry correlated with 2Decho data for LV-EDV (MSCT 278.3 ± 75.0 mL vs. echo 274.4 ± 85.6 mL) r = 0.380, p = 0.401, LV-ESV(MSCT 226.7 ± 75.4 mL vs. echo 220.1 ± 74.0 mL) r = 0.323, p = 0.479 and LV-EF (MSCT 20.2 ± 8.8% vs.
echo 20.0 ± 11.9%) r = 0.617, p = 0.143. Post-CRT MSCT correlated well with 2D echo: LV-EDV (MSCT218.9 ± 106.4 mL vs. echo 188.7 ± 93.1 mL) r = 0.87, p = 0.011, LV-ESV (MSCT 145 ± 71.5 mL vs. echo125.6 ± 78 mL) r = 0.84, p = 0.018 and LV-EF (MSCT 29.6 ± 11.3 mL vs. echo 38.6 ± 14.6 mL) r = 0.89,p = 0.007. There was a significant increase of the mid-ventricular septum in terms of absolute LV wallthickening of the responders (pre 0.9 ± 2.1 mm vs. post 3.3 ± 2.2 mm; p < 0.0005).olumRT-in
Conclusion: MSCT based vanalysis to demonstrate C
. Introduction
The assessment of ventricular volumes and derived functionarameters (cardiac volumetry) in patients with heart failure andeduced ejection fraction (HFREF) is essential to assess long-term
Please cite this article in press as: Langer C, et al. The potential of multi-slicremodeling induced by cardiac resynchronization therapy. Comput Med Im
rognosis. The implantation of a biventricular pacemaker or defib-illator for cardiac resynchronization therapy (CRT) is an effectivereatment concept in selected HFREF patients with left ventricu-ar ejection fraction < or =35%, sinus rhythm and NYHA functional
∗ Corresponding author. Tel.: +49 5731 97 1258; fax: +49 5731 97 2194.E-mail address: [email protected] (C. Langer).
895-6111/$ – see front matter © 2010 Elsevier Ltd. All rights reserved.oi:10.1016/j.compmedimag.2010.01.002
etry involving multi-segment color-coded polar maps offers wall motionduced reverse remodeling which needs to be further validated.
© 2010 Elsevier Ltd. All rights reserved.
class III despite optimal medical therapy and who have cardiacdyssynchrony (defined as QRS duration > or =120 ms) [1]. Bystimulating both the right and the left ventricles, pacing themsimultaneously or with a short delay, its objective is to restorethe contractile coordination. Long-term effects, like decreased car-diac volumes and improved ejection fraction can be observed aftera few months [1] and are then described as “reverse remodel-ing”.
e computed tomography based volumetry for demonstrating reverseaging Graph (2010), doi:10.1016/j.compmedimag.2010.01.002
The gold standard for cardiac volumetry, cardiac magnetic res-onance imaging (CMR) is not suitable for CRT patients because ofthe metal device. The method mostly used in clinical routine, 2Decho, is remarkably dependent on the examiner and the acousticwindow, especially in advanced dilated hearts [2].
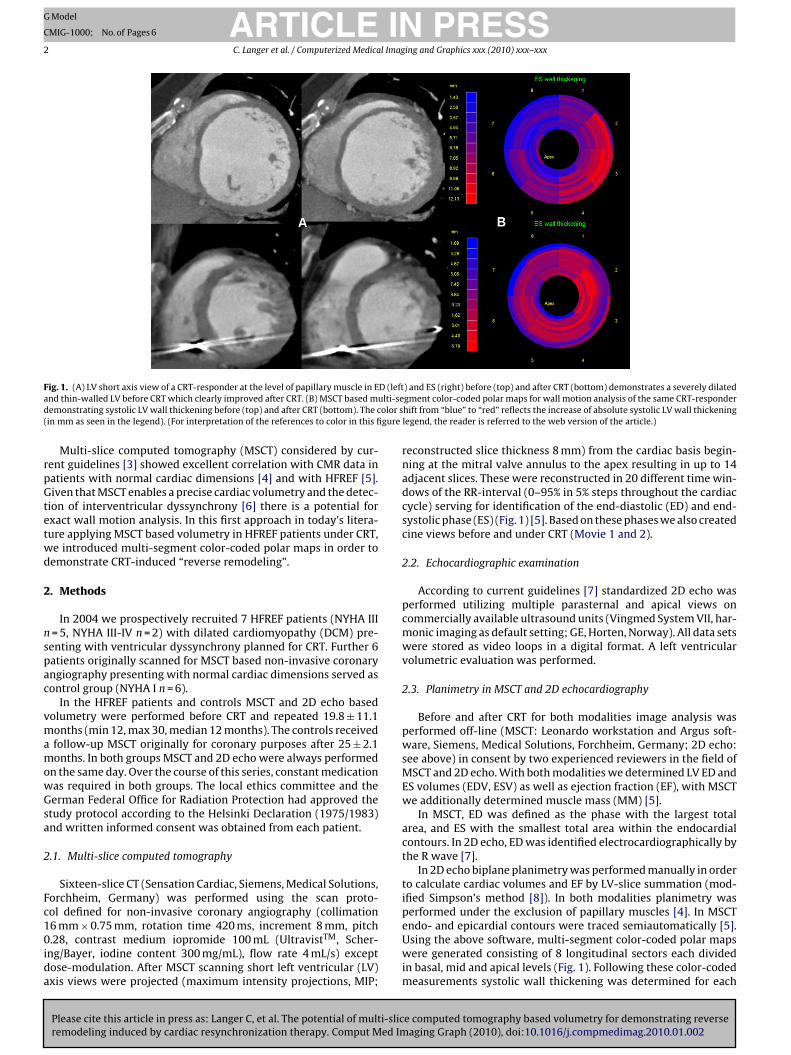
ARTICLE IN PRESSG Model
CMIG-1000; No. of Pages 6
2 C. Langer et al. / Computerized Medical Imaging and Graphics xxx (2010) xxx–xxx
F D (lefta ulti-sed olor s( gure
rpGtetwd
2
nspac
vmamowGsa
2
Fc10ida
ig. 1. (A) LV short axis view of a CRT-responder at the level of papillary muscle in End thin-walled LV before CRT which clearly improved after CRT. (B) MSCT based memonstrating systolic LV wall thickening before (top) and after CRT (bottom). The cin mm as seen in the legend). (For interpretation of the references to color in this fi
Multi-slice computed tomography (MSCT) considered by cur-ent guidelines [3] showed excellent correlation with CMR data inatients with normal cardiac dimensions [4] and with HFREF [5].iven that MSCT enables a precise cardiac volumetry and the detec-
ion of interventricular dyssynchrony [6] there is a potential forxact wall motion analysis. In this first approach in today’s litera-ure applying MSCT based volumetry in HFREF patients under CRT,e introduced multi-segment color-coded polar maps in order toemonstrate CRT-induced “reverse remodeling”.
. Methods
In 2004 we prospectively recruited 7 HFREF patients (NYHA III= 5, NYHA III-IV n = 2) with dilated cardiomyopathy (DCM) pre-
enting with ventricular dyssynchrony planned for CRT. Further 6atients originally scanned for MSCT based non-invasive coronaryngiography presenting with normal cardiac dimensions served asontrol group (NYHA I n = 6).
In the HFREF patients and controls MSCT and 2D echo basedolumetry were performed before CRT and repeated 19.8 ± 11.1onths (min 12, max 30, median 12 months). The controls receivedfollow-up MSCT originally for coronary purposes after 25 ± 2.1onths. In both groups MSCT and 2D echo were always performed
n the same day. Over the course of this series, constant medicationas required in both groups. The local ethics committee and theerman Federal Office for Radiation Protection had approved thetudy protocol according to the Helsinki Declaration (1975/1983)nd written informed consent was obtained from each patient.
.1. Multi-slice computed tomography
Sixteen-slice CT (Sensation Cardiac, Siemens, Medical Solutions,orchheim, Germany) was performed using the scan proto-ol defined for non-invasive coronary angiography (collimation
Please cite this article in press as: Langer C, et al. The potential of multi-slicremodeling induced by cardiac resynchronization therapy. Comput Med Im
6 mm × 0.75 mm, rotation time 420 ms, increment 8 mm, pitch.28, contrast medium iopromide 100 mL (UltravistTM, Scher-
ng/Bayer, iodine content 300 mg/mL), flow rate 4 mL/s) exceptose-modulation. After MSCT scanning short left ventricular (LV)xis views were projected (maximum intensity projections, MIP;
) and ES (right) before (top) and after CRT (bottom) demonstrates a severely dilatedgment color-coded polar maps for wall motion analysis of the same CRT-responderhift from “blue” to “red” reflects the increase of absolute systolic LV wall thickeninglegend, the reader is referred to the web version of the article.)
reconstructed slice thickness 8 mm) from the cardiac basis begin-ning at the mitral valve annulus to the apex resulting in up to 14adjacent slices. These were reconstructed in 20 different time win-dows of the RR-interval (0–95% in 5% steps throughout the cardiaccycle) serving for identification of the end-diastolic (ED) and end-systolic phase (ES) (Fig. 1) [5]. Based on these phases we also createdcine views before and under CRT (Movie 1 and 2).
2.2. Echocardiographic examination
According to current guidelines [7] standardized 2D echo wasperformed utilizing multiple parasternal and apical views oncommercially available ultrasound units (Vingmed System VII, har-monic imaging as default setting; GE, Horten, Norway). All data setswere stored as video loops in a digital format. A left ventricularvolumetric evaluation was performed.
2.3. Planimetry in MSCT and 2D echocardiography
Before and after CRT for both modalities image analysis wasperformed off-line (MSCT: Leonardo workstation and Argus soft-ware, Siemens, Medical Solutions, Forchheim, Germany; 2D echo:see above) in consent by two experienced reviewers in the field ofMSCT and 2D echo. With both modalities we determined LV ED andES volumes (EDV, ESV) as well as ejection fraction (EF), with MSCTwe additionally determined muscle mass (MM) [5].
In MSCT, ED was defined as the phase with the largest totalarea, and ES with the smallest total area within the endocardialcontours. In 2D echo, ED was identified electrocardiographically bythe R wave [7].
In 2D echo biplane planimetry was performed manually in orderto calculate cardiac volumes and EF by LV-slice summation (mod-ified Simpson’s method [8]). In both modalities planimetry wasperformed under the exclusion of papillary muscles [4]. In MSCT
e computed tomography based volumetry for demonstrating reverseaging Graph (2010), doi:10.1016/j.compmedimag.2010.01.002
endo- and epicardial contours were traced semiautomatically [5].Using the above software, multi-segment color-coded polar mapswere generated consisting of 8 longitudinal sectors each dividedin basal, mid and apical levels (Fig. 1). Following these color-codedmeasurements systolic wall thickening was determined for each
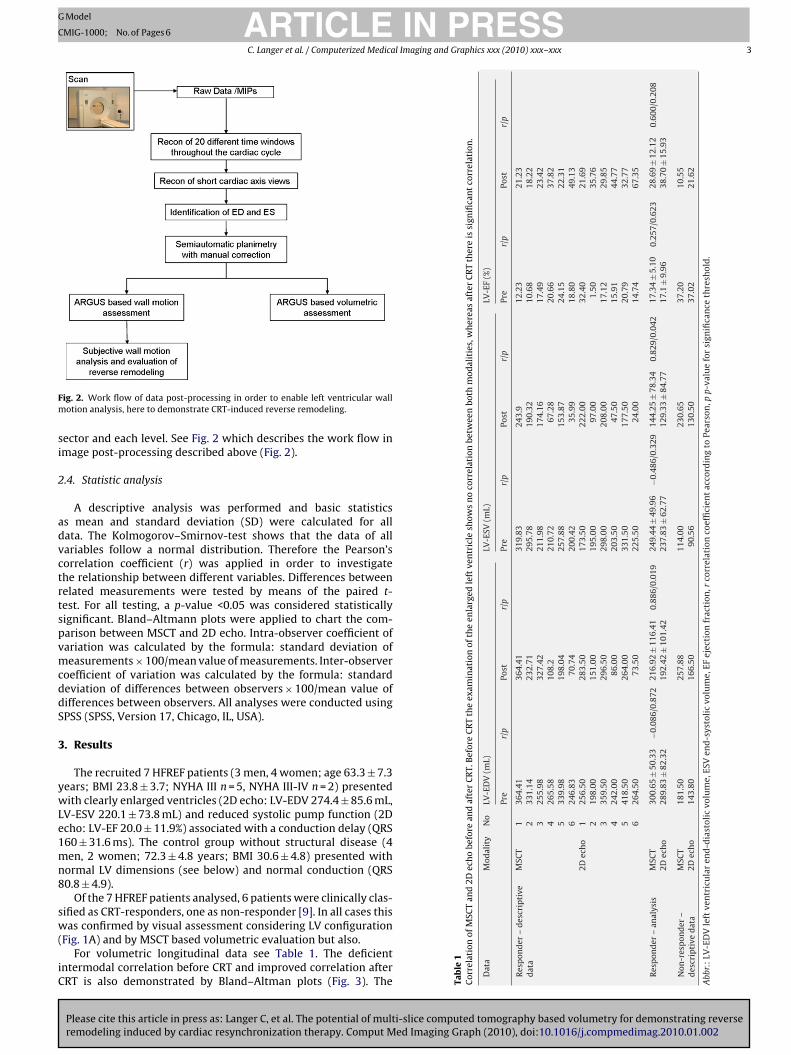
ARTICLE IN PRESSG Model
CMIG-1000; No. of Pages 6
C. Langer et al. / Computerized Medical Imaging and Graphics xxx (2010) xxx–xxx 3
Fm
si
2
advctrtspvmcddS
3
ywLe1mn8
sw(
iC
SCT
and
2Dec
ho
befo
rean
daf
ter
CR
T.B
efor
eC
RT
the
exam
inat
ion
ofth
een
larg
edle
ftve
ntr
icle
show
sn
oco
rrel
atio
nbe
twee
nbo
thm
odal
itie
s,w
her
eas
afte
rC
RT
ther
eis
sign
ifica
nt
corr
elat
ion
.
Mod
alit
yN
oLV
-ED
V(m
L)LV
-ESV
(mL)
LV-E
F(%
)
Pre
r/p
Post
r/p
Pre
r/p
Post
r/p
Pre
r/p
Post
r/p
escr
ipti
veM
SCT
136
4.41
364.
4131
9.83
243.
912
.23
21.2
32
331.
1423
2.71
295.
7819
0.32
10.6
818
.22
325
5.98
327.
4221
1.98
174.
1617
.49
23.4
24
265.
5810
8.2
210.
7267
.28
20.6
637
.82
533
9.98
198.
0425
7.88
153.
8724
.15
22.3
16
246.
8370
.74
200.
4235
.99
18.8
049
.13
2Dec
ho
125
6.50
283.
5017
3.50
222.
0032
.40
21.6
92
198.
0015
1.00
195.
0097
.00
1.50
35.7
63
359.
5029
6.50
298.
0020
8.00
17.1
229
.85
424
2.00
86.0
020
3.50
47.5
015
.91
44.7
75
418.
5026
4.00
331.
5017
7.50
20.7
932
.77
626
4.50
73.5
022
5.50
24.0
014
.74
67.3
5
alys
isM
SCT
300.
65±
50.3
3−0
.086
/0.8
7221
6.92
±11
6.41
0.88
6/0.
019
249.
44±
49.9
6−0
.486
/0.3
2914
4.25
±78
.34
0.82
9/0.
042
17.3
4±
5.10
0.25
7/0.
623
28.6
9±
12.1
20.
600/
0.20
82D
ech
o28
9.83
±82
.32
192.
42±
101.
4223
7.83
±62
.77
129.
33±
84.7
717
.1±
9.96
38.7
0±
15.9
3
r– a
MSC
T18
1.50
257.
8811
4.00
230.
6537
.20
10.5
52D
ech
o14
3.80
166.
5090
.56
130.
5037
.02
21.6
2
ftve
ntr
icu
lar
end
-dia
stol
icvo
lum
e,ES
Ven
d-s
ysto
lic
volu
me,
EFej
ecti
onfr
acti
on,r
corr
elat
ion
coef
fici
ent
acco
rdin
gto
Pear
son
,pp-
valu
efo
rsi
gnifi
can
ceth
resh
old
.
ig. 2. Work flow of data post-processing in order to enable left ventricular wallotion analysis, here to demonstrate CRT-induced reverse remodeling.
ector and each level. See Fig. 2 which describes the work flow inmage post-processing described above (Fig. 2).
.4. Statistic analysis
A descriptive analysis was performed and basic statisticss mean and standard deviation (SD) were calculated for allata. The Kolmogorov–Smirnov-test shows that the data of allariables follow a normal distribution. Therefore the Pearson’sorrelation coefficient (r) was applied in order to investigatehe relationship between different variables. Differences betweenelated measurements were tested by means of the paired t-est. For all testing, a p-value <0.05 was considered statisticallyignificant. Bland–Altmann plots were applied to chart the com-arison between MSCT and 2D echo. Intra-observer coefficient ofariation was calculated by the formula: standard deviation ofeasurements × 100/mean value of measurements. Inter-observer
oefficient of variation was calculated by the formula: standardeviation of differences between observers × 100/mean value ofifferences between observers. All analyses were conducted usingPSS (SPSS, Version 17, Chicago, IL, USA).
. Results
The recruited 7 HFREF patients (3 men, 4 women; age 63.3 ± 7.3ears; BMI 23.8 ± 3.7; NYHA III n = 5, NYHA III-IV n = 2) presentedith clearly enlarged ventricles (2D echo: LV-EDV 274.4 ± 85.6 mL,
V-ESV 220.1 ± 73.8 mL) and reduced systolic pump function (2Dcho: LV-EF 20.0 ± 11.9%) associated with a conduction delay (QRS60 ± 31.6 ms). The control group without structural disease (4en, 2 women; 72.3 ± 4.8 years; BMI 30.6 ± 4.8) presented with
ormal LV dimensions (see below) and normal conduction (QRS0.8 ± 4.9).
Of the 7 HFREF patients analysed, 6 patients were clinically clas-ified as CRT-responders, one as non-responder [9]. In all cases this
Please cite this article in press as: Langer C, et al. The potential of multi-slice computed tomography based volumetry for demonstrating reverseremodeling induced by cardiac resynchronization therapy. Comput Med Imaging Graph (2010), doi:10.1016/j.compmedimag.2010.01.002
as confirmed by visual assessment considering LV configurationFig. 1A) and by MSCT based volumetric evaluation but also.
For volumetric longitudinal data see Table 1. The deficientntermodal correlation before CRT and improved correlation afterRT is also demonstrated by Bland–Altman plots (Fig. 3). The Ta
ble
1C
orre
lati
onof
M
Dat
a
Res
pon
der
–d
dat
a
Res
pon
der
–an
Non
-res
pon
de
des
crip
tive
dat
Abb
r.:
LV-E
DV
le
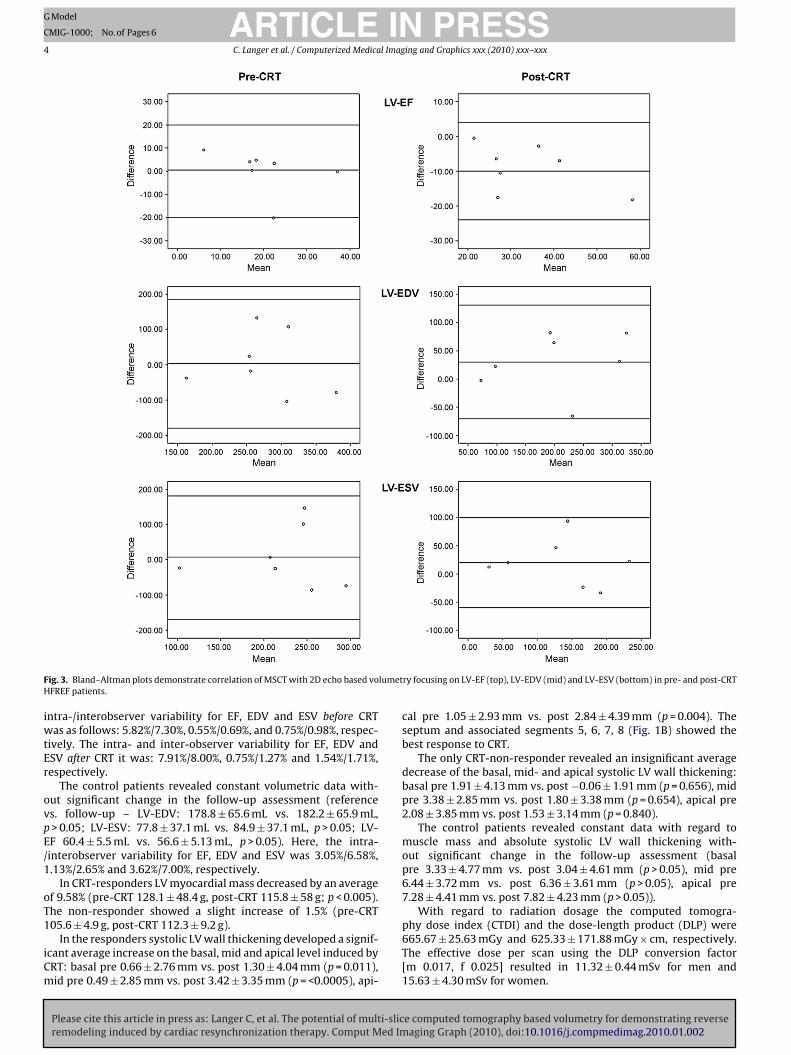
ARTICLE IN PRESSG Model
CMIG-1000; No. of Pages 6
4 C. Langer et al. / Computerized Medical Imaging and Graphics xxx (2010) xxx–xxx
F lumetH
iwtEr
ovpE/1
oT1
iCm
ig. 3. Bland–Altman plots demonstrate correlation of MSCT with 2D echo based voFREF patients.
ntra-/interobserver variability for EF, EDV and ESV before CRTas as follows: 5.82%/7.30%, 0.55%/0.69%, and 0.75%/0.98%, respec-
ively. The intra- and inter-observer variability for EF, EDV andSV after CRT it was: 7.91%/8.00%, 0.75%/1.27% and 1.54%/1.71%,espectively.
The control patients revealed constant volumetric data with-ut significant change in the follow-up assessment (references. follow-up – LV-EDV: 178.8 ± 65.6 mL vs. 182.2 ± 65.9 mL,> 0.05; LV-ESV: 77.8 ± 37.1 mL vs. 84.9 ± 37.1 mL, p > 0.05; LV-F 60.4 ± 5.5 mL vs. 56.6 ± 5.13 mL, p > 0.05). Here, the intra-interobserver variability for EF, EDV and ESV was 3.05%/6.58%,.13%/2.65% and 3.62%/7.00%, respectively.
In CRT-responders LV myocardial mass decreased by an averagef 9.58% (pre-CRT 128.1 ± 48.4 g, post-CRT 115.8 ± 58 g; p < 0.005).he non-responder showed a slight increase of 1.5% (pre-CRT
Please cite this article in press as: Langer C, et al. The potential of multi-slicremodeling induced by cardiac resynchronization therapy. Comput Med Im
05.6 ± 4.9 g, post-CRT 112.3 ± 9.2 g).In the responders systolic LV wall thickening developed a signif-
cant average increase on the basal, mid and apical level induced byRT: basal pre 0.66 ± 2.76 mm vs. post 1.30 ± 4.04 mm (p = 0.011),id pre 0.49 ± 2.85 mm vs. post 3.42 ± 3.35 mm (p = <0.0005), api-
ry focusing on LV-EF (top), LV-EDV (mid) and LV-ESV (bottom) in pre- and post-CRT
cal pre 1.05 ± 2.93 mm vs. post 2.84 ± 4.39 mm (p = 0.004). Theseptum and associated segments 5, 6, 7, 8 (Fig. 1B) showed thebest response to CRT.
The only CRT-non-responder revealed an insignificant averagedecrease of the basal, mid- and apical systolic LV wall thickening:basal pre 1.91 ± 4.13 mm vs. post −0.06 ± 1.91 mm (p = 0.656), midpre 3.38 ± 2.85 mm vs. post 1.80 ± 3.38 mm (p = 0.654), apical pre2.08 ± 3.85 mm vs. post 1.53 ± 3.14 mm (p = 0.840).
The control patients revealed constant data with regard tomuscle mass and absolute systolic LV wall thickening with-out significant change in the follow-up assessment (basalpre 3.33 ± 4.77 mm vs. post 3.04 ± 4.61 mm (p > 0.05), mid pre6.44 ± 3.72 mm vs. post 6.36 ± 3.61 mm (p > 0.05), apical pre7.28 ± 4.41 mm vs. post 7.82 ± 4.23 mm (p > 0.05)).
With regard to radiation dosage the computed tomogra-
e computed tomography based volumetry for demonstrating reverseaging Graph (2010), doi:10.1016/j.compmedimag.2010.01.002
phy dose index (CTDI) and the dose-length product (DLP) were665.67 ± 25.63 mGy and 625.33 ± 171.88 mGy × cm, respectively.The effective dose per scan using the DLP conversion factor[m 0.017, f 0.025] resulted in 11.32 ± 0.44 mSv for men and15.63 ± 4.30 mSv for women.
ING
C
l Imag
4
asaioipuMH
2s(nspammc
totsuais
visCtrmpeAimi
4
eimecTop
4
smv
ARTICLEModel
MIG-1000; No. of Pages 6
C. Langer et al. / Computerized Medica
. Discussion
CRT-induced reverse remodeling can be observed a few monthsfter CRT [1], as was the case with the CRT-responders of thisample group, here unambiguously confirmed by MSCT (Fig. 1And B) (Movie 1 and 2). While there is abundant data show-ng that 2D echo derived volumes predict survival post-CRT, it isf limited reproducibility because of its high inter-observer andnter-examination variability [10]. Moreover, this and further com-arative series showed that routinely used 2D echo significantlynderestimates dilated LV volumes [4]. The present series proposesSCT as a potential follow-up method, e.g. in clinically uncertainFREF patients under CRT.
In our pre-CRT patient group with severely dilated ventricles,D echo weakly correlated with MSCT probably due to a relativelymall acoustic window (Table 1). With regard to the remodeleddownsized) hearts which offer better cardiac assessment by a pla-ar method, correlation was better after CRT, although 2D echoignificantly underestimated cardiac volumes (Table 1). This is sup-orted by Yamamuro et al. [11] who ascertained that volumetricnalysis with MSCT is more accurate than 2D echo. Thus, MSCTay alternatively be involved in selected HFREF patients whenore precise volumetric assessment is demanded than 2D echo
an provide but CMR is contraindicated.According to current CRT studies validated by 2D echo [12]
he expected decrease in LV myocardial mass and the reductionf LV wall thickness found in CRT-responders was confirmed inhis series by MSCT. Thus, we are not reporting a new finding butuggesting a novel MSCT based discipline. Thereby, we can reportsing a new parameter: The absolute systolic LV wall thickeningnd its course under CRT demonstrated by MSCT. However, its clin-cal value remains unclear by now and should be analysed in largertudies.
Firstly looking at short cardiac axis views, short cardiac axisiews demonstrate septal thinning resulting from dyssynchrony-nduced delayed postero-lateral contraction leading to load-freeeptal contraction during early systole reversed with long-termRT. Eliminating the postero-lateral delay, CRT caused the redis-ribution of load increasing septal thickness which is visuallyecognizable. The newly applied multi-segment color-coded polaraps facilitate additional LV wall motion analysis in order to
recisely detect, localize and quantify CRT-induced reverse remod-ling (Fig. 1), which is the primary objective of this pilot study.nalysis of every patient clarifies that therapy responders show an
ncrease of absolute systolic LV wall thickening in nearly all seg-ents. In contrast, a decrease in wall thickening could be observed
n most segments of the only non-responder.
.1. Outlook
3D and contrast echo will further improve the validity ofcho based volumetry. CMR may provide faster data acquisition,mproved spatial resolution, faster performance, and may incre-
entally allow metal devices. However, by reducing radiationxposure and the required quantity of contrast medium, modernardiac MSCT provides maximized temporal and spatial resolution.his will allow for a variety of clinically relevant information withinne scan, e.g. ventricular wall motion analysis providing even morerecise demonstration of CRT effects.
.2. Limitations
Please cite this article in press as: Langer C, et al. The potential of multi-slicremodeling induced by cardiac resynchronization therapy. Comput Med Im
The major limitation of the present work is the small sampleize following the longitudinal study design requiring unchangededical (steady state) therapy in order to provide unaffected
olumetric assessment. In addition to possible bias the inclu-
PRESSing and Graphics xxx (2010) xxx–xxx 5
sion of only one CRT-non-responder gives the study a descriptivefeature.
The challenge to build an artificial asynchronous heart modelwas not realizable. The planned follow-up after 12 months post-CRT could not be held up because of patient incompliance. Themulti-segment color-coded polar maps we used do not exactlycorrespond to the 17-segment model established by the Amer-ican heart association [13] but provides even more segments todistinguish (Fig. 1B). Regardless of these limitations, the objectiveof this project was achieved, namely to point out the potential ofMSCT based volumetry and its advancement of wall motion anal-ysis in order to detect, localize and quantify CRT-induced reverseremodeling.
According to current guidelines [3] in this study we used a 16-slice MSCT scanner providing a temporal and spatial resolutionof 210–105 ms and 0.6 mm × 0.6 mm × 0.7 mm voxel size, respec-tively. Such key data are not state of the art in non-invasive coronaryangiography. However, with regard to the extensively publishedexcellent correlation with CMR data on cardiac volumetry [14]these design parameters are suitable for HFREF patients presentingwith a lower cardiac motion amplitude. Facing radiation exposureand the need of contrast medium, MSCT should in principle bereserved for special issues demanding more precise cardiac vol-umetric evaluation.
5. Conclusion
MSCT based volumetry – using multi-segment color-coded polarmaps – in HFREF patients under CRT has the potential of wallmotion analysis in order to detect, localize and quantify CRT-induced reversed remodeling. This diagnostic technique needsfurther to be analysed in larger studies for validation. However,due to the radiation exposure, required contrast medium, high costand required expertise MSCT based volumetry must not be appliedroutinely as a first line modality but may be considered in patientsfor whom additional information is required.
Acknowledgements
We like to thank Mrs. Astrid Kleemeyer, Mr. Armin Kuehn, Mr.Grant Dugtig, and Mr. Jan Hendrik Langer for their friendly con-tributions to this work. The project was supported by a grant ofSchering/Bayer, Germany.
Appendix A. Supplementary data
Supplementary data associated with this article can be found, inthe online version, at doi:10.1016/j.compmedimag.2010.01.002.
References
[1] Hunt SA. American College of Cardiology, American Heart Association TaskForce on Practice Guidelines. ACC/AHA 2005 guideline update for the diagnosisand management of chronic heart failure in the adult: a report of the Ameri-can College of Cardiology/American Heart Association Task Force on PracticeGuidelines (writing committee to update the 2001 guidelines for the evaluationand management of heart failure. J Am Coll Cardiol 2005;46:e1–81.
[2] Otterstad JE, Froeland G, St John Sutton M, Holme I. Accuracy and repro-ducibility of biplane two-dimensional echocardiographic measurements of leftventricular dimensions and function. Eur Heart J 1997;18:507–13.
[3] Abbara S, Arbab-Zadeh A, Callister TQ, Desai MY, Mamuya W, Thomson L,et al. SCCT guidelines for performance of coronary computed tomographicangiography: a report of the Society of Cardiovascular Computed Tomography
e computed tomography based volumetry for demonstrating reverseaging Graph (2010), doi:10.1016/j.compmedimag.2010.01.002
Guidelines Committee. J Cardiovasc Comput Tomogr 2009;3:190–204.[4] Dewey M, Muller M, Eddicks S, Schnapauff D, Teige F, Rutsch W, et al. Evalua-
tion of global and regional left ventricular function with 16-slice computedtomography, biplane cineventriculography, and two-dimensional transtho-racic echocardiography: comparison with magnetic resonance imaging. J AmColl Cardiol 2006;48:2034–44.
ING
C
6 l Imag
[
[
[
[
ARTICLEModel
MIG-1000; No. of Pages 6
C. Langer et al. / Computerized Medica
[5] Schroeder J, Peterschroeder A, Vaske B, Butz T, Barth P, Oldenburg O, et al.Cardiac volumetry in patients with heart failure and reduced ejection fraction: acomparative study correlating multi-slice computed tomography and magneticresonance tomography. Reasons for intermodal disagreement. Clin Res Cardiol2009;98:739–47.
[6] Truong QA, Singh JP, Cannon CP, Sarwar A, Nasir K, Auricchio A, et al.Quantitative analysis of intraventricular dyssynchrony using wall thick-ness by multidetector computed tomography. JACC Cardiovasc Imaging2008;1:772–81.
[7] Cheitlin MD, Armstrong WF, Aurigemma GP, Beller GA, Bierman FZ, DavisJL, et al. ACC/AHA/ASE 2003 Guideline Update for the Clinical Applicationof Echocardiography: summary article. A report of the American Collegeof Cardiology/American Heart Association Task Force on Practice Guide-lines (ACC/AHA/ASE Committee to Update the 1997 Guidelines for the
Please cite this article in press as: Langer C, et al. The potential of multi-slicremodeling induced by cardiac resynchronization therapy. Comput Med Im
Clinical Application of Echocardiography). J Am Soc Echocardiogr 2003;16:1091–110.
[8] Erbel R, Krebs W, Henn G, Schweizer P, Richter HA, Meyer J, et al. Compar-ison of single-plane and biplane volume determination by two-dimensionalechocardiography. 1. Asymmetric model hearts. Eur Heart J 1982;3:469–80.
[
PRESSing and Graphics xxx (2010) xxx–xxx
[9] Packer M. Proposal for a new clinical end point to evaluate the efficacy of drugsand devices in the treatment of chronic heart failure. J Card Fail 2001;7:176–82.
10] de Simone G, Galderisi M. Quantitation of left ventricular mass and function:balancing evidence with dreams. Ital Heart J 2002;3:562–70.
11] Yamamuro M, Tadamura E, Kubo S, Toyoda H, Nishina T, Ohba M, et al. Cardiacfunctional analysis with multi-detector row CT and segmental reconstructionalgorithm: comparison with echocardiography, SPECT, and MR imaging. Radi-ology 2005;234:381–90.
12] Zhang Q, Fung JW, Auricchio A, Chan JY, Kum LC, Wu LW, et al. Differentialchange in left ventricular mass and regional wall thickness after cardiac resyn-chronization therapy for heart failure. Eur Heart J 2006;27:1423–30.
13] Cerqueira MD, Weissman NJ, Dilsizian V, Jacobs AK, Kaul S, Laskey WK, etal. Standardized myocardial segmentation and nomenclature for tomographicimaging of the heart. A statement for healthcare professionals from the Cardiac
e computed tomography based volumetry for demonstrating reverseaging Graph (2010), doi:10.1016/j.compmedimag.2010.01.002
Imaging Committee of the Council on Clinical Cardiology of the American HeartAssociation. Int J Cardiovasc Imaging 2002;18:539–42.
14] Schuijf JD, Bax JJ, Jukema JW, Lamb HJ, Salm LP, de Roos A, et al. Assess-ment of left ventricular volumes and ejection fraction with 16-slice multi-slicecomputed tomography; comparison with 2D-echocardiography. Int J Cardiol2007;116:201–5.