Embed Size (px)
Citation preview
8/4/2019 Austin Plastic Ani Sot Ropy
http://slidepdf.com/reader/full/austin-plastic-ani-sot-ropy 1/13
Inflation and burst of aluminum tubes. Part II:An advanced yield function including
deformation-induced anisotropy
Yannis P. Korkolis, Stelios Kyriakides*
Research Center for Mechanics of Solids, Structures and Materials, WRW 110, C0600,
The University of Texas at Austin, WRW 110, Austin, TX 78712, United States
Received 14 September 2007; received in final revised form 27 February 2008Available online 14 March 2008
Abstract
In a recent study [Korkolis, Y.P., Kyriakides, S., 2008. Inflation and burst of anisotropic alumi-num tubes for hydroforming applications. Int’l. J. Plasticity 24, 509–543], the formability of alumi-num tubes was investigated using a combination of experimental and numerical approaches. Thetubes were loaded to failure under combined internal pressure and axial load along radial pathsin the engineering stress space. The experiments were then simulated using appropriate FE modelsand two established anisotropic yield functions. It was found that for some loading paths the com-puted deformations did not agree with the experimental ones, whereas rupture was generally over-predicted. In the current study the problem is tackled using a more advanced yield function [Barlat,F., Brem, J.C., Yoon, J.W., Chung, K., Dick, R.E., Lege, D.J., Pourboghrat, F., Choi, S.-H., Chu,E., 2003. Plane stress function for aluminum alloy sheets – part I: theory. Int’l. J. Plasticity 19, 1297– 1319]. Three different calibration schemes of this function are employed, in two of which the exper-
imentally observed deformation-induced anisotropy is taken into account. It is demonstrated thatboth deformation and failure can ultimately be predicted successfully, albeit arduously, using ahybrid procedure detailed herein.Ó 2008 Elsevier Ltd. All rights reserved.
Keywords: Aluminum; Tube hydroforming; Burst; Deformation-induced anisotropy
0749-6419/$ - see front matter Ó 2008 Elsevier Ltd. All rights reserved.
doi:10.1016/j.ijplas.2008.02.011
*
Corresponding author. Tel.: +1 5124714167; fax: +1 5124715500.E-mail address: [email protected] (S. Kyriakides).
Available online at www.sciencedirect.com
International Journal of Plasticity 24 (2008) 1625–1637
www.elsevier.com/locate/ijplas
8/4/2019 Austin Plastic Ani Sot Ropy
http://slidepdf.com/reader/full/austin-plastic-ani-sot-ropy 2/13
1. Introduction
A series of tests have recently been conducted involving Al-6260-T4 tubes inflatedunder combined internal pressure and axial load (Korkolis and Kyriakides, 2008). The
tubes were loaded to failure along radial paths in the engineering stress space. Hill-typeplastic work contours (Hill et al., 1994) were constructed from the results, which indicatedsome deformation-induced anisotropy. The specimens developed localized axisymmetricbulging associated with a limit load. The loading scheme followed enabled control of the test past that instability, to localized failure. In axial tension dominant loading pathsthe tubes failed by circumferential rupture. For hoop stress dominant paths the rupturewas along a tube generator (see Kuwabara et al., 2005 for similar experiments). The exper-iments were then simulated with finite element (FE) models in which Hosford’s (1979) andKarafillis and Boyce’s (1993) anisotropic yield functions were employed, using an associ-ated flow rule and isotropic hardening. Two distinct FE models were developed, each tai-lored to simulate either axial or circumferential rupture. The two yield functions werecalibrated not only to the plastic work contours, but also with regards to the successfulprediction of the limit load states (loads and deformations). The simulations revealed somedeficiencies of these constitutive models. First, the induced strain paths were not uniformlypredicted with sufficient accuracy and second, the onset of failure was uniformly overpre-dicted. In this brief note the subject is revisited using the same FE models but incorporat-ing a more powerful anisotropic yield function (Barlat et al., 2003). The effect of theevolution of the anisotropy is now also investigated.
2. Constitutive modeling: yield function Yld2000-2D (Barlat et al., 2003)
Hosford’s (1972) isotropic yield function in terms of the principal stress deviators canbe written as
j s1 À s2jk þ j2 s1 þ s2jk þ j s1 þ 2 s2jk ¼ 2rk o: ð1Þ
Barlat et al. introduced anisotropy by two linear transformations, one applied to the firstterm (/0) and the other to the second and third terms (/00):
/ ¼ /0 þ /00 ¼ jS 01 À S 02jk þ j2S 001 þ S 002jk þ jS 001 þ 2S 002jk ¼ 2rk o: ð2Þ
Here ðS 01; S 02Þ and ðS 001; S 002Þ are the principal values of the linearly transformed stress tensorsS
0 and S 00, respectively. These tensors are obtained from the stress deviator s and the stress
tensor r by:
S 0 ¼ C
0s ¼ C
0T r ¼ L
0r and S
00 ¼ C 00s ¼ C
00T r ¼ L
00r ð3Þ
where C 0, C 00, T , L0 and L00 are appropriate transformation tensors that allow introduction
of the anisotropy (Barlat et al., 2003). Thus, for our 2-D stress state
S 0 x
S 0 y
S 0 xy
8><>:
9>=>;
¼
L011 L0
12 0
L021 L0
22 0
0 0 L066
2
64
3
75
r x
r y
r xy
8><>:
9>=>;
and
S 00 x
S 00 y
S 00 xy
8><>:
9>=>;
¼
L0011 L00
12 0
L0021 L00
22 0
0 0 L0066
2
64
3
75
r x
r y
r xy
8><>:
9>=>;
ð4aÞ
where L0 and L
00 are related to parameters ai (i = 1,8) as follows:
1626 Y.P. Korkolis, S. Kyriakides / International Journal of Plasticity 24 (2008) 1625–1637
8/4/2019 Austin Plastic Ani Sot Ropy
http://slidepdf.com/reader/full/austin-plastic-ani-sot-ropy 3/13
L011
L012
L021
L022
L066
8>>>>>><
>>>>>>:
9>>>>>>=
>>>>>>;
¼
2=3 0 0
À1=3 0 0
0 À1=3 0
0 2=3 00 0 1
26666664
37777775
a1
a2
a7
8><
>:
9>=
>;and
L0011
L0012
L0021
L0022
L0066
8>>>>>><
>>>>>>:
9>>>>>>=
>>>>>>;
¼1
9
À2 2 8 À20
1 À4 À4 40
4 À4 À4 10
À2 8 2 À200 0 0 09
26666664
37777775
a3
a4
a5
a6
a8
8>>>>>><
>>>>>>:
9>>>>>>=
>>>>>>;
:
ð4bÞ
(The first and second derivatives of the yield function with respect to the stress compo-nents required for the flow rule and its numerical implementation appear in Barlat et al.(2003) and Yoon et al. (2004)).
The exponent k is assigned the value of 8 as is typical for aluminum alloys. Themodel is then calibrated by fitting the parameters ai (i = 1,8) to the experimental workcontours. Of these a7 and a8 are related to the shear stresses. Korkolis and Kyriakides
(2008) demonstrated that shear anisotropy does not influence the predictions of this setof biaxial burst experiments and as a result it will be neglected here too (i.e.,a7 = a8 = 1). Three different calibration schemes were attempted, leading to differentperformance first in predicting the strain paths traced and second in identifying theonset of rupture. The three methods of calibration and the results are discussed inthe next section.
3. Model calibration and performance
3.1. Case I
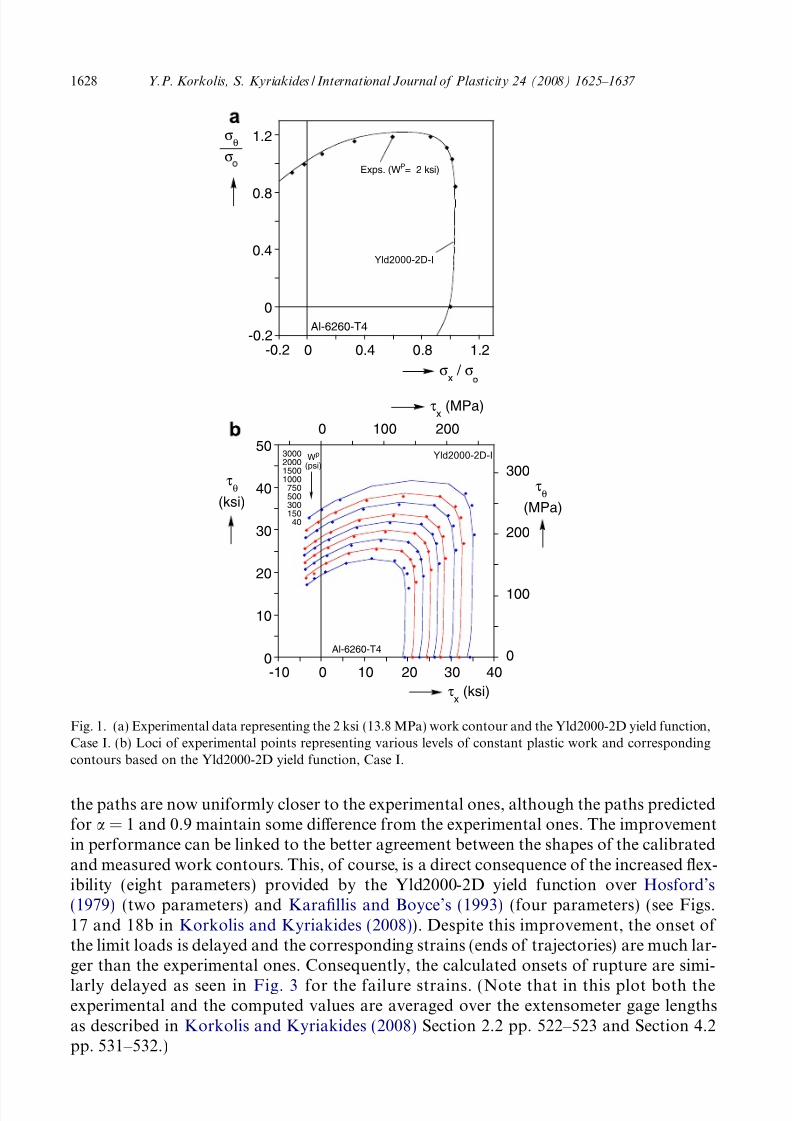
In this case, in view of the experimentally observed evolution of the plastic workcontours we found it more convenient to choose the anisotropy variables from a sub-sequent work contour, W p = 2 ksi (13.8 MPa). The ai were chosen for best fit of theexperimental data and are given in Table 1. Fig. 1a shows a plot of the experimentaldata normalized by the flow stress in uniaxial tension along with the yield surface cal-ibrated in this manner (solid line). The comparison is seen to be quite favorable. Thewhole set of work contours is compared to the corresponding experimental data inFig. 1b. It can be observed that this calibration procedure resulted in a very good
fit of the data for W
p
= 2 ksi (13.8 MPa), while the agreement is slightly more adversefor other contours but better than the corresponding results from the Hosford (Fig. 17in Korkolis and Kyriakides, 2008) and the Karafillis–Boyce (Fig. 18b in Korkolis andKyriakides, 2008) yield functions.
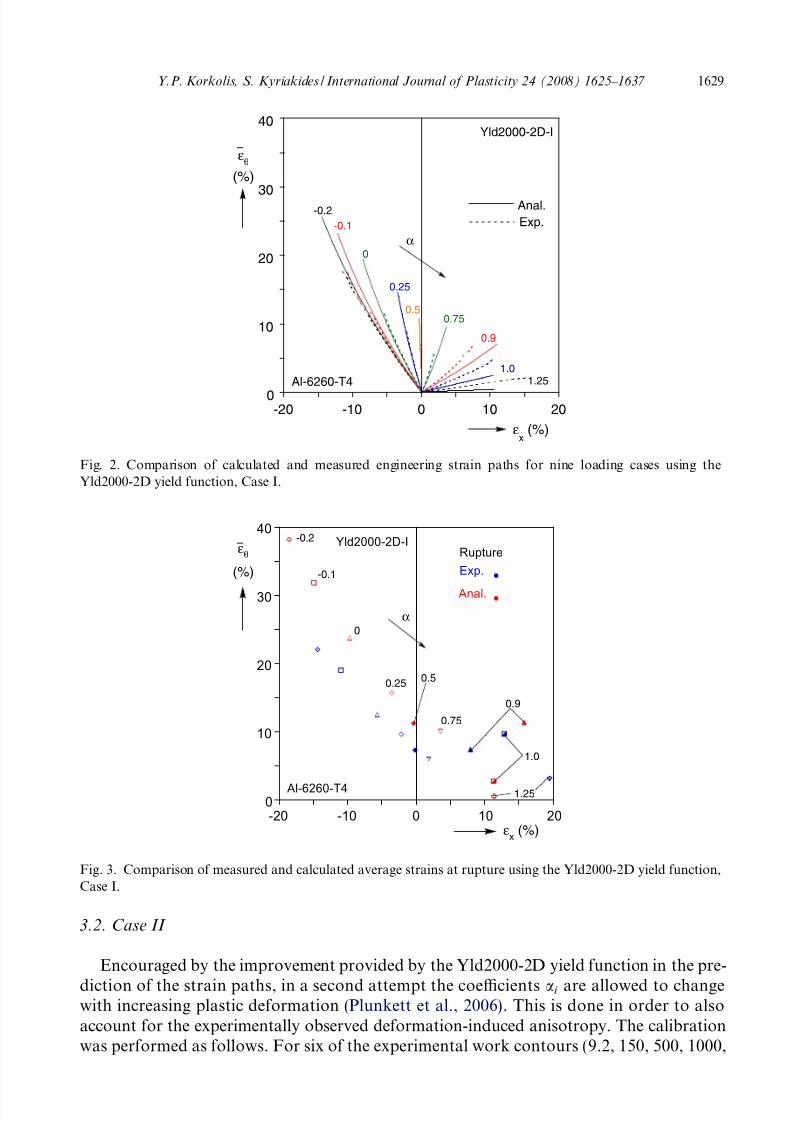
The calibrated yield function was implemented in the FE models of Korkolis andKyriakides (2008) and the nine experiments were simulated. Fig. 2 shows the calculated(engineering) strain paths, in each case truncated at the corresponding limit load. By com-parison to the corresponding results in Figs. 27 and 29 in Korkolis and Kyriakides (2008),
Table 1Anisotropy parameters for Case I
W p a1 a2 a3 a4 a5 a6 a7 a8
2 ksi 0.78 1.15 0.85 0.89 1.06 1.03 1.0 1.0
Y.P. Korkolis, S. Kyriakides / International Journal of Plasticity 24 (2008) 1625–1637 1627
8/4/2019 Austin Plastic Ani Sot Ropy
http://slidepdf.com/reader/full/austin-plastic-ani-sot-ropy 4/13
the paths are now uniformly closer to the experimental ones, although the paths predictedfor a = 1 and 0.9 maintain some difference from the experimental ones. The improvementin performance can be linked to the better agreement between the shapes of the calibratedand measured work contours. This, of course, is a direct consequence of the increased flex-ibility (eight parameters) provided by the Yld2000-2D yield function over Hosford’s(1979) (two parameters) and Karafillis and Boyce’s (1993) (four parameters) (see Figs.17 and 18b in Korkolis and Kyriakides (2008)). Despite this improvement, the onset of the limit loads is delayed and the corresponding strains (ends of trajectories) are much lar-ger than the experimental ones. Consequently, the calculated onsets of rupture are simi-
larly delayed as seen in Fig. 3 for the failure strains. (Note that in this plot both theexperimental and the computed values are averaged over the extensometer gage lengthsas described in Korkolis and Kyriakides (2008) Section 2.2 pp. 522–523 and Section 4.2pp. 531–532.)
0
0.4
0.8
1.2
0 0.4 0.8 1.2
σx
/ σ
σθ
σ
Al-6260-T4
Exps. (WP= 2 ksi)
Yld2000-2D-I
-0.2-0.2
0
10
20
30
40
50
0
100
200
300
-10 0 10 20 30 40
0 100 200
τx
(ksi)
Wp
(psi)
Al-6260-T4
300020001500100075050030015040
Yld2000-2D-I
τθ
(ksi)
τx
(MPa)
τθ
(MPa)
Fig. 1. (a) Experimental data representing the 2 ksi (13.8 MPa) work contour and the Yld2000-2D yield function,Case I. (b) Loci of experimental points representing various levels of constant plastic work and correspondingcontours based on the Yld2000-2D yield function, Case I.
1628 Y.P. Korkolis, S. Kyriakides / International Journal of Plasticity 24 (2008) 1625–1637
8/4/2019 Austin Plastic Ani Sot Ropy
http://slidepdf.com/reader/full/austin-plastic-ani-sot-ropy 5/13
3.2. Case II
Encouraged by the improvement provided by the Yld2000-2D yield function in the pre-
diction of the strain paths, in a second attempt the coefficients ai are allowed to changewith increasing plastic deformation (Plunkett et al., 2006). This is done in order to alsoaccount for the experimentally observed deformation-induced anisotropy. The calibrationwas performed as follows. For six of the experimental work contours (9.2, 150, 500, 1000,
0
10
20
30
40
-20 -10 0 10 20
εx
(%)
Al-6260-T4
Exp.
Anal.-0.2
-0.1
0
0.25
0.50.75
0.9
1.01.25
α
Yld2000-2D-I
εθ
(%)
Fig. 2. Comparison of calculated and measured engineering strain paths for nine loading cases using theYld2000-2D yield function, Case I.
0
10
20
30
40
-20 -10 0 10 20
Al-6260-T4
Exp.
Anal.
RuptureYld2000-2D-I
•
•
-0.2
-0.1
0
0.250.5
α
1.25
0.75
0.9
1.0
εθ
(%)
εx
(%)
Fig. 3. Comparison of measured and calculated average strains at rupture using the Yld2000-2D yield function,Case I.
Y.P. Korkolis, S. Kyriakides / International Journal of Plasticity 24 (2008) 1625–1637 1629
8/4/2019 Austin Plastic Ani Sot Ropy
http://slidepdf.com/reader/full/austin-plastic-ani-sot-ropy 6/13
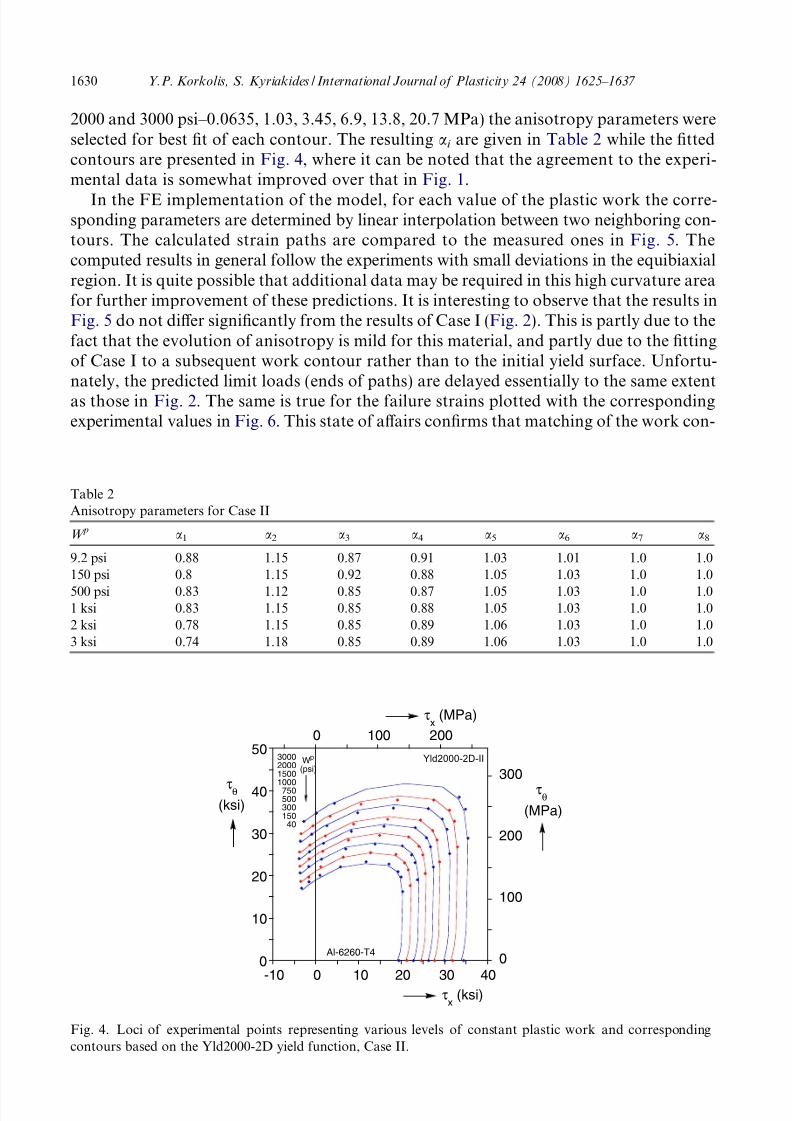
2000 and 3000 psi–0.0635, 1.03, 3.45, 6.9, 13.8, 20.7 MPa) the anisotropy parameters wereselected for best fit of each contour. The resulting ai are given in Table 2 while the fittedcontours are presented in Fig. 4, where it can be noted that the agreement to the experi-mental data is somewhat improved over that in Fig. 1.
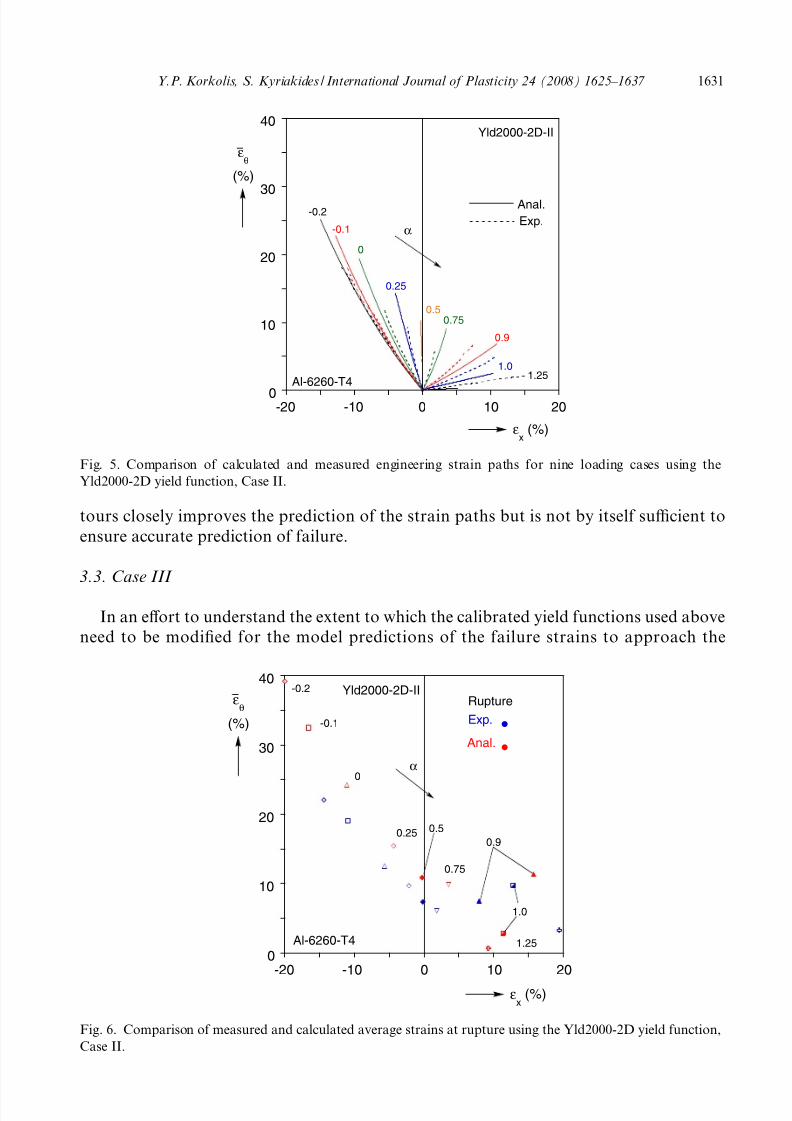
In the FE implementation of the model, for each value of the plastic work the corre-sponding parameters are determined by linear interpolation between two neighboring con-tours. The calculated strain paths are compared to the measured ones in Fig. 5. Thecomputed results in general follow the experiments with small deviations in the equibiaxialregion. It is quite possible that additional data may be required in this high curvature areafor further improvement of these predictions. It is interesting to observe that the results inFig. 5 do not differ significantly from the results of Case I (Fig. 2). This is partly due to thefact that the evolution of anisotropy is mild for this material, and partly due to the fittingof Case I to a subsequent work contour rather than to the initial yield surface. Unfortu-nately, the predicted limit loads (ends of paths) are delayed essentially to the same extentas those in Fig. 2. The same is true for the failure strains plotted with the correspondingexperimental values in Fig. 6. This state of affairs confirms that matching of the work con-
Table 2Anisotropy parameters for Case II
W p a1 a2 a3 a4 a5 a6 a7 a8
9.2 psi 0.88 1.15 0.87 0.91 1.03 1.01 1.0 1.0150 psi 0.8 1.15 0.92 0.88 1.05 1.03 1.0 1.0
500 psi 0.83 1.12 0.85 0.87 1.05 1.03 1.0 1.01 ksi 0.83 1.15 0.85 0.88 1.05 1.03 1.0 1.02 ksi 0.78 1.15 0.85 0.89 1.06 1.03 1.0 1.03 ksi 0.74 1.18 0.85 0.89 1.06 1.03 1.0 1.0
0
10
20
30
40
50
0
100
200
300
-10 0 10 20 30 40
0 100 200
τx
(ksi)
Wp
(psi)
Al-6260-T4
300020001500
100075050030015040
Yld2000-2D-II
τθ
(ksi)
τx
(MPa)
τθ
(MPa)
Fig. 4. Loci of experimental points representing various levels of constant plastic work and correspondingcontours based on the Yld2000-2D yield function, Case II.
1630 Y.P. Korkolis, S. Kyriakides / International Journal of Plasticity 24 (2008) 1625–1637
8/4/2019 Austin Plastic Ani Sot Ropy
http://slidepdf.com/reader/full/austin-plastic-ani-sot-ropy 7/13
tours closely improves the prediction of the strain paths but is not by itself sufficient toensure accurate prediction of failure.
3.3. Case III
In an effort to understand the extent to which the calibrated yield functions used aboveneed to be modified for the model predictions of the failure strains to approach the
0
10
20
30
40
-20 -10 0 10 20
εx
(%)
Al-6260-T4
Exp.
Anal.-0.2
-0.1
0
0.25
0.50.75
0.9
1.01.25
α
εθ
(%)
Yld2000-2D-II
Fig. 5. Comparison of calculated and measured engineering strain paths for nine loading cases using theYld2000-2D yield function, Case II.
0
10
20
30
40
-20 -10 0 10 20
εθ
(%)
εx
(%)
Al-6260-T4
Exp.
Anal.
RuptureYld2000-2D-II
•
-0.2
-0.1
0
0.25 0.5
α
1.25
0.75
0.9
1.0
Fig. 6. Comparison of measured and calculated average strains at rupture using the Yld2000-2D yield function,Case II.
Y.P. Korkolis, S. Kyriakides / International Journal of Plasticity 24 (2008) 1625–1637 1631
8/4/2019 Austin Plastic Ani Sot Ropy
http://slidepdf.com/reader/full/austin-plastic-ani-sot-ropy 8/13
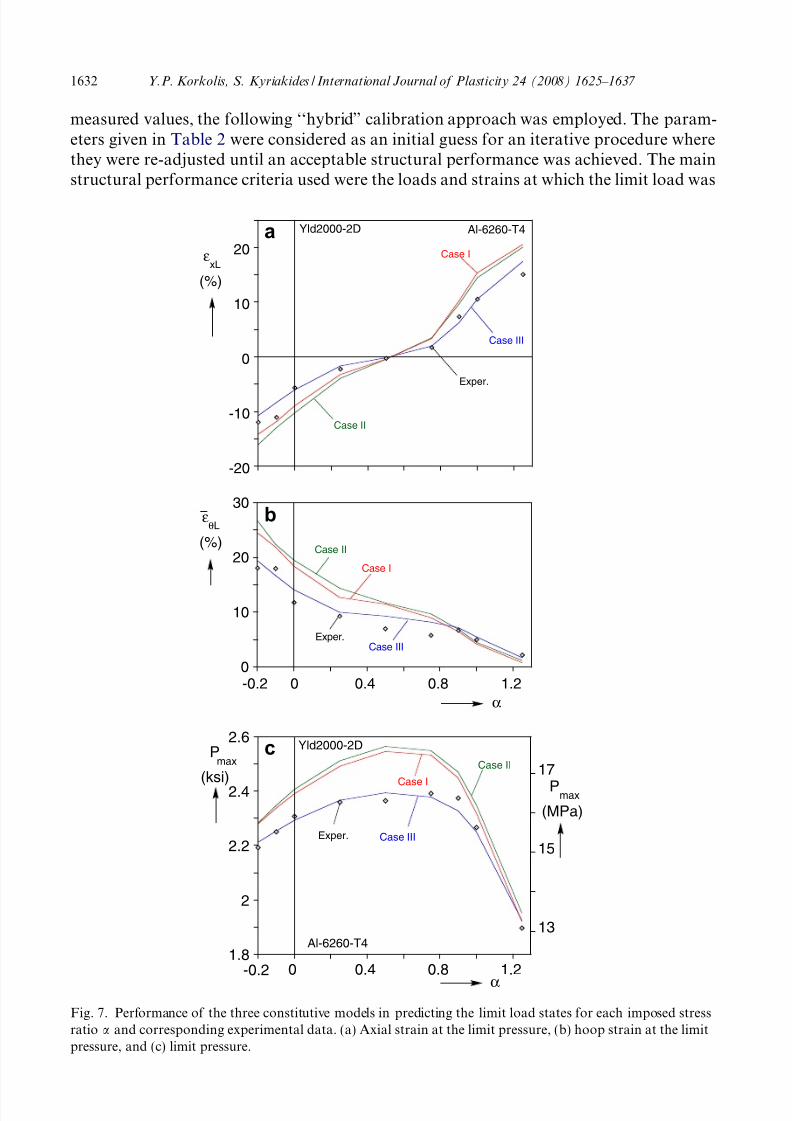
measured values, the following ‘‘hybrid” calibration approach was employed. The param-eters given in Table 2 were considered as an initial guess for an iterative procedure wherethey were re-adjusted until an acceptable structural performance was achieved. The mainstructural performance criteria used were the loads and strains at which the limit load was
-20
-10
0
10
20
Al-6260-T4
Exper.
Case III
Case II
Case I
Yld2000-2D
εxL
(%)
0
10
20
30
0 0.4 0.8 1.2
α
Exper.Case III
Case II
Case I
εθL
(%)
-0.2
a
b
c
1.8
2
2.2
2.4
2.6
0 0.4 0.8 1.2
13
15
17
α
Al-6260-T4
Exper. Case III
Case II
Case I
Yld2000-2DP
max
(ksi)
-0.2
Pmax
(MPa)
Fig. 7. Performance of the three constitutive models in predicting the limit load states for each imposed stressratio a and corresponding experimental data. (a) Axial strain at the limit pressure, (b) hoop strain at the limitpressure, and (c) limit pressure.
1632 Y.P. Korkolis, S. Kyriakides / International Journal of Plasticity 24 (2008) 1625–1637
8/4/2019 Austin Plastic Ani Sot Ropy
http://slidepdf.com/reader/full/austin-plastic-ani-sot-ropy 9/13
attained. Fig. 7 shows the axial (a) and circumferential strains (b) at the limit loads mea-sured in the experiments as a function of the loading parameter a (=rx/rh). Included arethe corresponding values predicted using the constitutive models of Cases I and II. Bothare seen to deviate from the experimental values by a certain degree. The two models also
overpredict the corresponding limit pressures (P max) shown in Fig. 7c.To improve this performance, the parameters were iteratively readjusted by performing
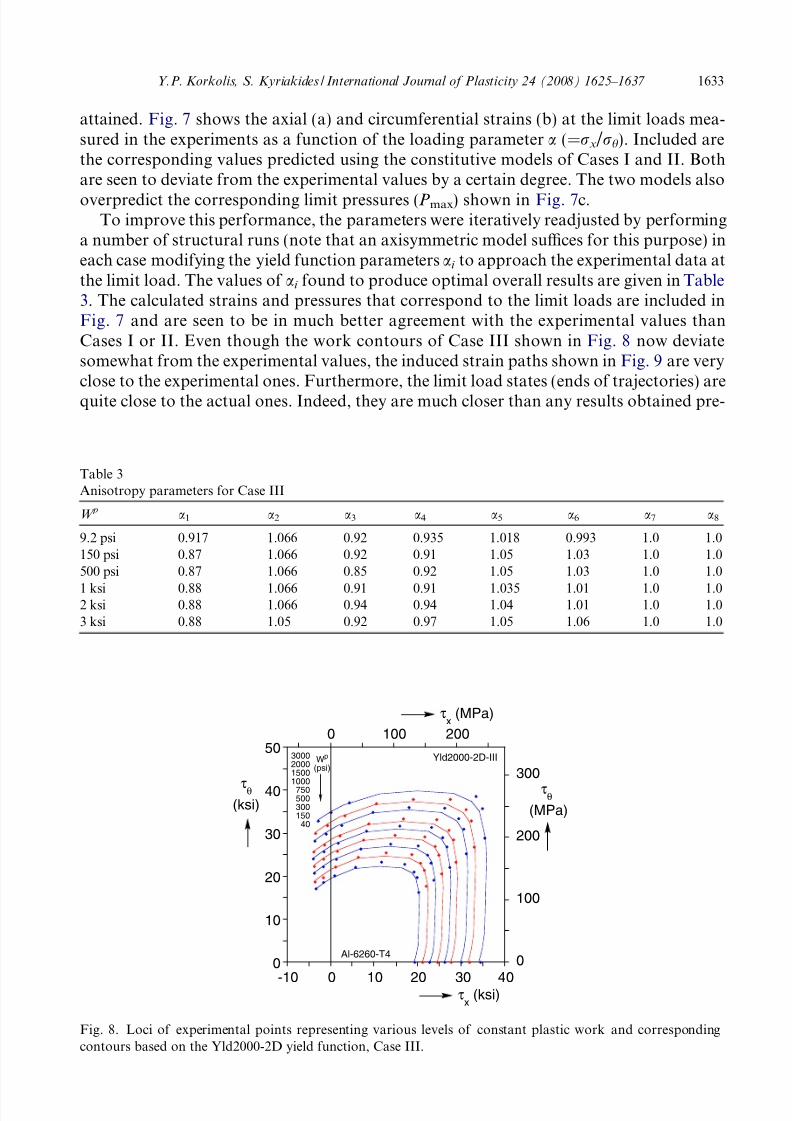
a number of structural runs (note that an axisymmetric model suffices for this purpose) ineach case modifying the yield function parameters ai to approach the experimental data atthe limit load. The values of ai found to produce optimal overall results are given in Table3. The calculated strains and pressures that correspond to the limit loads are included inFig. 7 and are seen to be in much better agreement with the experimental values thanCases I or II. Even though the work contours of Case III shown in Fig. 8 now deviatesomewhat from the experimental values, the induced strain paths shown in Fig. 9 are veryclose to the experimental ones. Furthermore, the limit load states (ends of trajectories) arequite close to the actual ones. Indeed, they are much closer than any results obtained pre-
Table 3Anisotropy parameters for Case III
W p a1 a2 a3 a4 a5 a6 a7 a8
9.2 psi 0.917 1.066 0.92 0.935 1.018 0.993 1.0 1.0150 psi 0.87 1.066 0.92 0.91 1.05 1.03 1.0 1.0500 psi 0.87 1.066 0.85 0.92 1.05 1.03 1.0 1.0
1 ksi 0.88 1.066 0.91 0.91 1.035 1.01 1.0 1.02 ksi 0.88 1.066 0.94 0.94 1.04 1.01 1.0 1.03 ksi 0.88 1.05 0.92 0.97 1.05 1.06 1.0 1.0
0
10
20
30
40
50
0
100
200
300
-10 0 10 20 30 40
0 100 200
τx
(ksi)
τθ
(ksi)
Wp
(psi)
Al-6260-T4
3000200015001000750500300150
40
τθ
(MPa)
τx
(MPa)
Yld2000-2D-III
Fig. 8. Loci of experimental points representing various levels of constant plastic work and correspondingcontours based on the Yld2000-2D yield function, Case III.
Y.P. Korkolis, S. Kyriakides / International Journal of Plasticity 24 (2008) 1625–1637 1633
8/4/2019 Austin Plastic Ani Sot Ropy
http://slidepdf.com/reader/full/austin-plastic-ani-sot-ropy 10/13
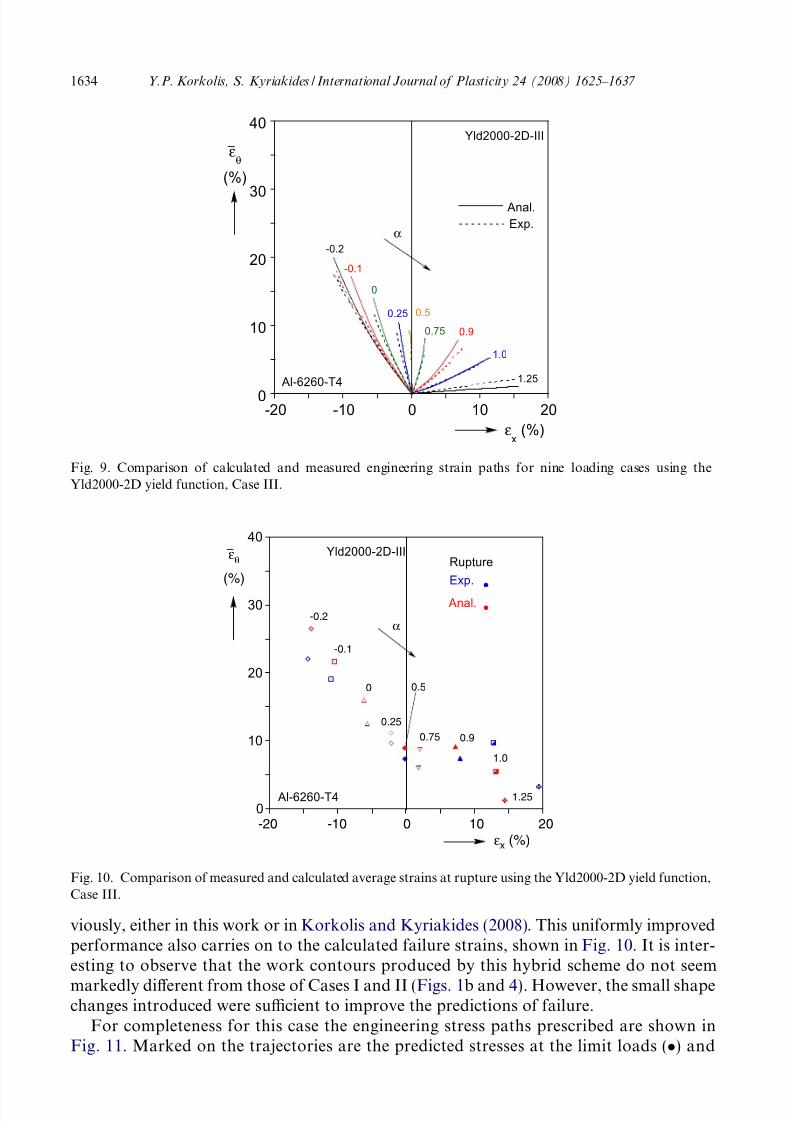
viously, either in this work or in Korkolis and Kyriakides (2008). This uniformly improvedperformance also carries on to the calculated failure strains, shown in Fig. 10. It is inter-esting to observe that the work contours produced by this hybrid scheme do not seem
markedly different from those of Cases I and II (Figs. 1b and 4). However, the small shapechanges introduced were sufficient to improve the predictions of failure.
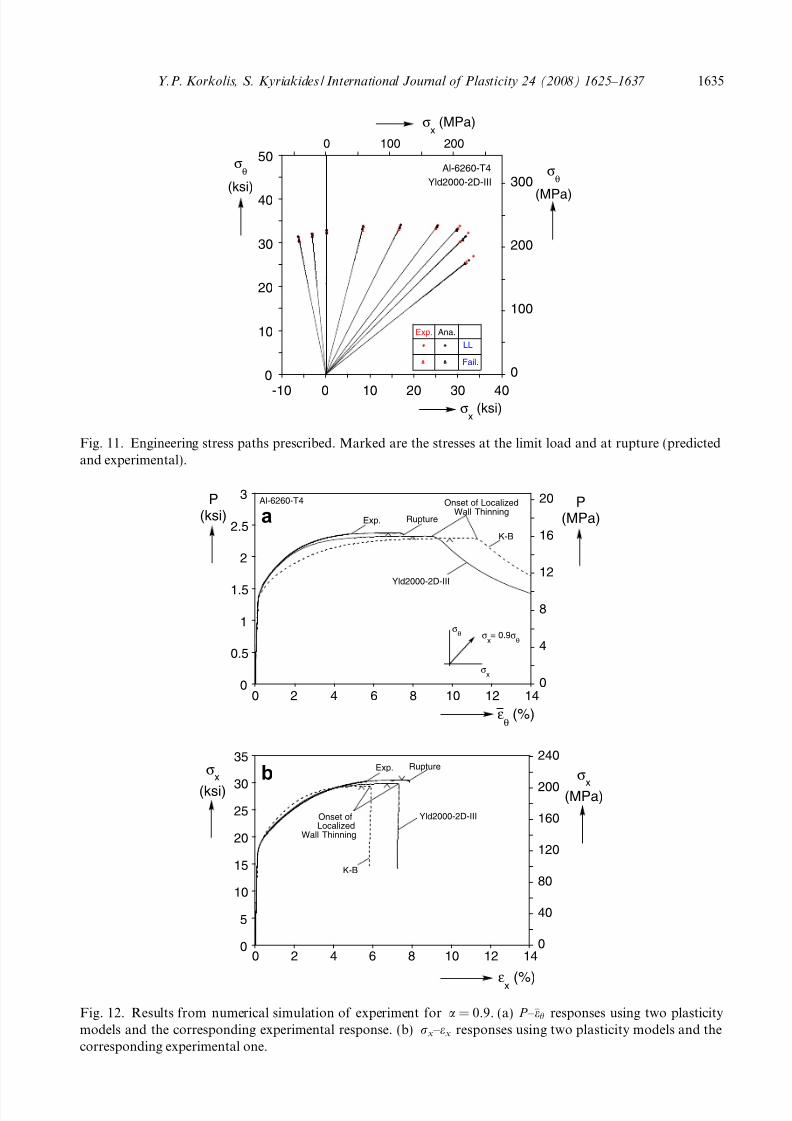
For completeness for this case the engineering stress paths prescribed are shown inFig. 11. Marked on the trajectories are the predicted stresses at the limit loads () and
0
10
20
30
40
-20 -10 0 10 20
εx
(%)
Al-6260-T4
Exp.
Anal.
-0.2
-0.1
0
0.25 0.5
0.75 0.9
1.0
1.25
α
εθ
(%)
Yld2000-2D-III
Fig. 9. Comparison of calculated and measured engineering strain paths for nine loading cases using theYld2000-2D yield function, Case III.
0
10
20
30
40
Al-6260-T4
Exp.
Anal.
RuptureYld2000-2D-III
•
•
0
0.25
0.5
α
1.25
0.75 0.9
1.0
-0.2
-0.1
εθ
(%)
-20 -10 0 10 20
εx (%)
Fig. 10. Comparison of measured and calculated average strains at rupture using the Yld2000-2D yield function,Case III.
1634 Y.P. Korkolis, S. Kyriakides / International Journal of Plasticity 24 (2008) 1625–1637
8/4/2019 Austin Plastic Ani Sot Ropy
http://slidepdf.com/reader/full/austin-plastic-ani-sot-ropy 11/13
0
10
20
30
40
50
-10 0 10 20 30 40
0
100
200
300
0 100 200
σθ
(ksi)
σx
(ksi)
Al-6260-T4 σθ
(MPa)
σx
(MPa)
Exp. Ana.
LL
Fail.
Yld2000-2D-III
Fig. 11. Engineering stress paths prescribed. Marked are the stresses at the limit load and at rupture (predictedand experimental).
0
0.5
1
1.5
2
2.5
3
0 2 4 6 8 10 12 140
4
8
12
16
20P(ksi)
εθ
(%)
Al-6260-T4
Yld2000-2D-III
K-B
Exp.
σx= 0.9σ
θ
σθ
σx
Rupture
Onset of LocalizedWall Thinning
P(MPa)
0
5
10
15
20
25
30
35
0 2 4 6 8 10 12 140
40
80
120
160
200
240
Yld2000-2D-III
K-B
Exp. Rupture
Onset ofLocalized
Wall Thinning
εx (%)
σx
(ksi)
σ
x(MPa)
a
b
Fig. 12. Results from numerical simulation of experiment for a = 0.9. (a) P – eh responses using two plasticitymodels and the corresponding experimental response. (b) rx – ex responses using two plasticity models and thecorresponding experimental one.
Y.P. Korkolis, S. Kyriakides / International Journal of Plasticity 24 (2008) 1625–1637 1635
8/4/2019 Austin Plastic Ani Sot Ropy
http://slidepdf.com/reader/full/austin-plastic-ani-sot-ropy 12/13
at the onset of rupture (N) and the corresponding experimental values (red color)1. Bothenvelopes are seen to agree well with the experimental ones.
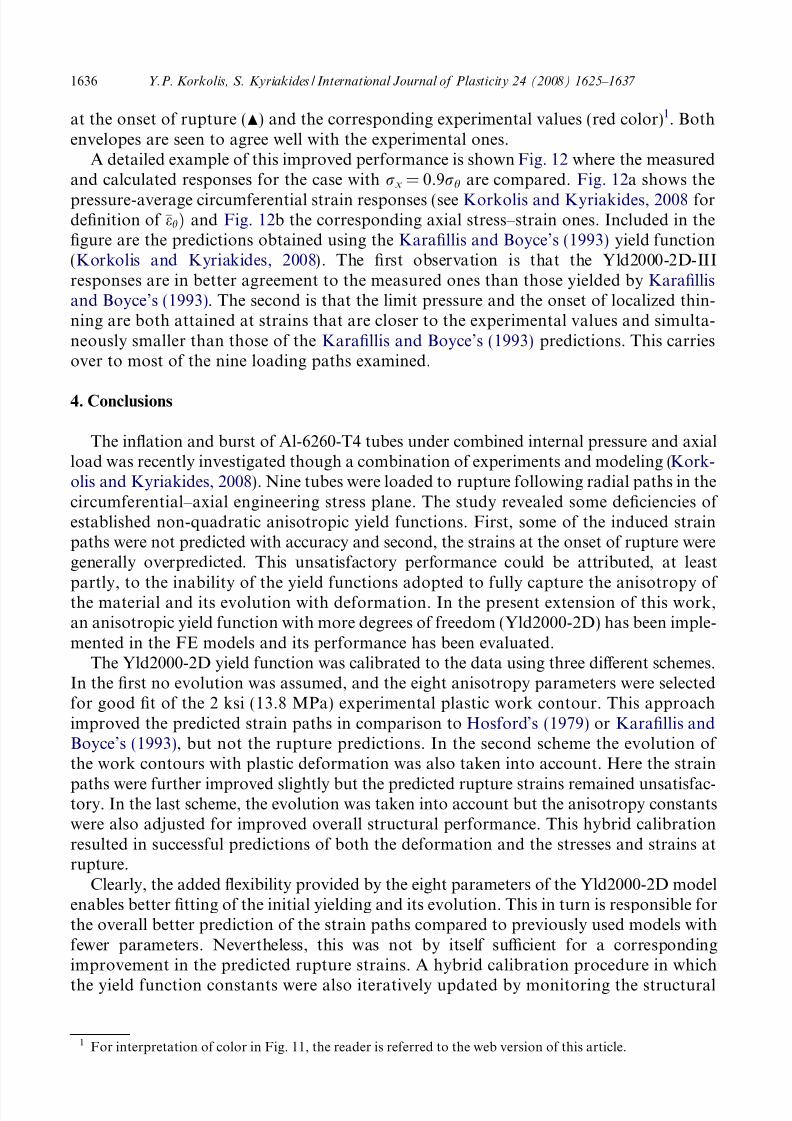
A detailed example of this improved performance is shown Fig. 12 where the measuredand calculated responses for the case with rx = 0.9rh are compared. Fig. 12a shows the
pressure-average circumferential strain responses (see Korkolis and Kyriakides, 2008 fordefinition of ehÞ and Fig. 12b the corresponding axial stress–strain ones. Included in thefigure are the predictions obtained using the Karafillis and Boyce’s (1993) yield function(Korkolis and Kyriakides, 2008). The first observation is that the Yld2000-2D-IIIresponses are in better agreement to the measured ones than those yielded by Karafillisand Boyce’s (1993). The second is that the limit pressure and the onset of localized thin-ning are both attained at strains that are closer to the experimental values and simulta-neously smaller than those of the Karafillis and Boyce’s (1993) predictions. This carriesover to most of the nine loading paths examined.
4. Conclusions
The inflation and burst of Al-6260-T4 tubes under combined internal pressure and axialload was recently investigated though a combination of experiments and modeling (Kork-olis and Kyriakides, 2008). Nine tubes were loaded to rupture following radial paths in thecircumferential–axial engineering stress plane. The study revealed some deficiencies of established non-quadratic anisotropic yield functions. First, some of the induced strainpaths were not predicted with accuracy and second, the strains at the onset of rupture weregenerally overpredicted. This unsatisfactory performance could be attributed, at least
partly, to the inability of the yield functions adopted to fully capture the anisotropy of the material and its evolution with deformation. In the present extension of this work,an anisotropic yield function with more degrees of freedom (Yld2000-2D) has been imple-mented in the FE models and its performance has been evaluated.
The Yld2000-2D yield function was calibrated to the data using three different schemes.In the first no evolution was assumed, and the eight anisotropy parameters were selectedfor good fit of the 2 ksi (13.8 MPa) experimental plastic work contour. This approachimproved the predicted strain paths in comparison to Hosford’s (1979) or Karafillis andBoyce’s (1993), but not the rupture predictions. In the second scheme the evolution of the work contours with plastic deformation was also taken into account. Here the strain
paths were further improved slightly but the predicted rupture strains remained unsatisfac-tory. In the last scheme, the evolution was taken into account but the anisotropy constantswere also adjusted for improved overall structural performance. This hybrid calibrationresulted in successful predictions of both the deformation and the stresses and strains atrupture.
Clearly, the added flexibility provided by the eight parameters of the Yld2000-2D modelenables better fitting of the initial yielding and its evolution. This in turn is responsible forthe overall better prediction of the strain paths compared to previously used models withfewer parameters. Nevertheless, this was not by itself sufficient for a correspondingimprovement in the predicted rupture strains. A hybrid calibration procedure in which
the yield function constants were also iteratively updated by monitoring the structural
1 For interpretation of color in Fig. 11, the reader is referred to the web version of this article.
1636 Y.P. Korkolis, S. Kyriakides / International Journal of Plasticity 24 (2008) 1625–1637
8/4/2019 Austin Plastic Ani Sot Ropy
http://slidepdf.com/reader/full/austin-plastic-ani-sot-ropy 13/13
response had to be implemented for best overall performance. The work contours corre-sponding to the optimized model differ slightly from the experimental ones as well as fromthose of the Yld2000-2D Cases I and II. This indicates that failure is very sensitive to smallchanges in the yield function. However, the calibration procedure adopted is clearly too
cumbersome for implementation in more complex settings.The difficulties encountered in achieving optimal overall performance of the simulations
are most probably linked to the adoption of isotropic hardening in the modeling. Ruptureis sensitive to the actual shape of the current yield surface, which is known to both trans-late and deform. Such features are of course not captured by isotropic hardening plastic-ity, indicating that more advanced models that capture such evolution characteristicscombined with modern anisotropic yield functions are desirable (e.g., see Choi et al.,2006).
Acknowledgements
The authors acknowledge with thanks financial support of this work received from theNational Science Foundation through Grant DMI-0140599 and supplementary fundingprovided by G.M. with Robin Stevenson as coordinator. Special thanks to Alcoa and Ed-mund Chu for providing initial seed funding for the project and the tubes analyzed andtested. Discussions with Frederic Barlat of Alcoa were instrumental in the adoption of the Yld2000-2D yield function.
References
Barlat, F., Brem, J.C., Yoon, J.W., Chung, K., Dick, R.E., Lege, D.J., Pourboghrat, F., Choi, S.-H., Chu, E.,
2003. Plane stress function for aluminum alloy sheets – part I: theory. Int’l. J. Plasticity 19, 1297–1319.
Choi, Y., Han, C.-S., Lee, J.K., Wagoner, R.H., 2006. Modeling multi-axial deformation of planar anisotropic
elasto-plastic materials, part I: theory. Int’l. J. Plasticity 22, 1745–1764.
Hill, R., Hecker, S.S., Stout, M.G., 1994. An investigation of plastic flow and differential work hardening in
orthotropic brass tubes under fluid pressure and axial load. Int’l. J. Solids Struct. 21, 2999–3021.
Hosford, W.F., 1972. A generalized isotropic yield criterion. ASME J. Appl. Mech. 309, 607–609.
Hosford, W.F., 1979. On yield loci of anisotropic cubic metals. In: Proc. 7th North Amer. Metalworking
Research Conf., Society of Manufacturing Engineers, Dearborn, MI, pp. 191–196.
Karafillis, A.P., Boyce, M.C., 1993. A general anisotropic yield criterion using bounds and a transformation
weighting tensor. J. Mech. Phys. Solids 41, 1859–1886.
Korkolis, Y.P., Kyriakides, S., 2008. Inflation and burst of anisotropic aluminum tubes for hydroformingapplications. Int’l. J. Plasticity 24, 509–543.
Kuwabara, T., Yoshida, K., Narihara, K., Takahashi, S., 2005. Anisotropic plastic deformation of extruded
aluminum alloy tube under axial forces and internal pressure. Int’l. J. Plasticity 21, 101–117.
Plunkett, B., Lebensohn, R.A., Cazacu, O., Barlat, F., 2006. Anisotropic yield function of hexagonal materials
taking into account texture development and anisotropic hardening. Acta Mater. 54, 4159–4169.
Yoon, J.W., Barlat, F., Dick, R.E., Chung, K., Kang, T.J., 2004. Plane stress function for aluminum alloy sheets
– part II: FE formulation and its implementation. Int’l. J. Plasticity 20, 495–522.
Y.P. Korkolis, S. Kyriakides / International Journal of Plasticity 24 (2008) 1625–1637 1637