Embed Size (px)
Citation preview

BANK OF GREECE
EUROSYSTEM
Working PaperMoney supply and
Greek historical monetary statistics: definition, construction, sources and data
Sophia Lazaretou
WORKINKPAPERWORKINKPAPERWORKINKPAPERWORKINKPAPERWORKINKPAPERNOVEMBER 2009
510

BANK OF GREECE Economic Research Department – Special Studies Division 21, Ε. Venizelos Avenue GR-102 50 Athens Τel: +30210-320 3610 Fax: +30210-320 2432 www.bankofgreece.gr Printed in Athens, Greece at the Bank of Greece Printing Works. All rights reserved. Reproduction for educational and non-commercial purposes is permitted provided that the source is acknowledged. ISSN 1109-66

MONEY SUPPLY AND GREEK HISTORICAL MONETARY STATISTICS: DEFINITION, CONSTRUCTION, SOURCES AND
DATA
Sophia Lazaretou Bank of Greece
ABSTRACT This paper attempts to provide, for the first time, a survey of the construction of estimates of the quantity of money in Greece since the inception of the National Bank of Greece in 1842 until the eve of WWII. Specifically, we describe in detail the methods of construction and the sources of data used in building these aggregates. We discuss the data collection procedure and publication practices. The end product is presented in a data appendix. JEL Classification: E51, N24 Keywords: money, monetary aggregates, data, sources. Acknowledgements: An adapted version was presented at the XVth World Economic History Congress, session on Economic and Monetary History of 19-20 centuries’ SEE, Utrecht, 3-7 August, 2009. I would like to thank Claude Diebolt, Heather Gibson and session participants for their comments and suggestions, especially Alice Teichova, Michael Palairet and Sevket Pamuk. Earlier versions were presented in the 1st and the 4th Workshops of the Data Collection Task Force of the South Eastern European Monetary History Network (SEEMHN DCTF) held in Sofia (hosted by the BNB) and Vienna (hosted by the OeNB) in October 2006 and December 2008, respectively. I would like to express my thanks to all workshop participants and especially to Roumen Avramov, Kalina Dimitrova, Martin Ivanov, Peter Moosleschner and Matthias Morys for their fruitful discussions. I also wish to thank the historical archives of the National Bank of Greece and the library of the Bank of Greece; without their help, this paper would not have been possible. The views expressed in this paper are those of the author and do not necessarily reflect those of the Bank of Greece. I alone am responsible for the remaining errors. Correspondence: Sophia Lazaretou Bank of Greece, 21, El. Venizelou Ave., 10250, Athens, Greece, Tel. 0030 210 320 2992 e-mail: [email protected]

4
1. Introduction
Monetary aggregates have played a central role in the conduct of monetary policy.
They have historically been constructed to guide monetary policy; long-run price
developments are largely determined by the growth rate of the supply of money. Price
stability, a necessary condition for maximizing sustainable economic growth, is the
principle goal of monetary policy and is attained by appropriate long-run money growth.
Data on monetary aggregates are the most important and widely used in macroeconomics
and finance. Monetary aggregates have been used in practice as indicators of the stance of
the monetary policy. They are also used in modelling money demand behaviour; in
setting appropriate monetary targets to attain price stability (‘money targeting’); and in
testing financial market efficiency. Historically speaking, as Milton Friedman and Anna
Schwartz have pointed out, the measurement of money is ‘…an activity that dates back
almost to the beginning of the republic…” (1970, p.1).
However, measuring an abstract concept such as ‘money’ is always a difficult
task. Typically, a monetary aggregate should accurately reflect the portfolio choices by
households and firms. It should include the medium of exchange in an economy, namely,
currency and banknotes in circulation as well as the deposits and liquid assets that
households and firms hold and that affect their spending plans. Through time, innovation
in financial instruments changes institutional arrangements and practices in the money
market and, thus, affects the definition of monetary aggregates and revises the measures
of money. But how many of these items should be included in a monetary aggregate?
And on what criteria should they be selected?
Since 1842 when an issuing bank, the National Bank of Greece (NBG), was first
established and its note was first introduced as a medium of exchange, the Greek
monetary authorities tried to measure the quantity of money by simply reporting the stock
of banknotes in circulation.1 Monetary aggregates were not built. This paper aims at
analyzing an important financial structure, namely the quantity of money. Specifically, it
attempts to provide for the first time a survey of the construction of estimates of the
1 For a detailed analysis of Greece’s monetary history see Lazaretou (1995, 2005).
5

quantity of money for Greece from 1842 till the onset of WWII and to present a
consistent time series of monetary aggregates for that period.
To this end, we use definitional and statistical issues in order to trace the history
of money in Greece. We describe the methods of construction and the sources of the data
used. We discuss the data collection procedure and publication practices. It is worth
mentioning that, till now, Greek historical time series for money have not been compiled
in an official and easily accessible database. The historical long-run time series that has
been recently published refers only to banknotes in circulation.2 Moreover, it is not
compiled in a systematic way, nor has any attempt ever been made to build monetary
aggregates. Therefore, we are hopeful that this paper will contribute to the dissemination
of monetary aggregates data to a wider audience so as to further stimulate research in
monetary developments in the European periphery.
The paper proceeds as follows. Section 2 provides the standard definitions of
money and monetary aggregates. Section 3 deals with monetary aggregates. In particular,
it concerns construction and measuring, time series availability, data constraints and data
sources. It also discusses problems of comparability since a wide variety of data have
been received and incorporated. The end product is presented in a data appendix at the
end of the paper. Section 4 concludes.
2. Money and monetary aggregates: definitions
Both economic thought and statistical practices affect the definitions of monetary
aggregates and hence their usefulness as indicators and/or targets of monetary policy.
Structural changes in financial markets and new financial instruments call for a re-
definition of the monetary aggregate since its ability to predict economic activity might
be adversely influenced.
According to the monetarist approach to measuring the money supply,
fluctuations in prices and quantities result from monetary policy. The monetary
explanation goes back to the ‘currency school’ of the 19th century: further issue of
2 See, OeNB (2008) and Bank of Greece (2009).
6

banknotes without metallic backing will cause inflationary pressures in the domestic
economy. Therefore, the institutionally set reserve-banknote ratio was regarded as a key
policy variable in the metallic monetary regimes of the 19th century. This was because the
advocates of the currency school could not consider other items – apart from banknotes –
such as demand bank deposits, as money substitutes. They supported that banknotes were
the only money substitutes and the amount of banknote issue should be determined by a
strict and clear cut convertibility rule so as to preserve price stability.3
The standard approach to measuring money relies on the monetarist approach of
Friedman and Schwartz (1970). They adopt an empirical rather than an a priori
definition.4 They consider that the best way to define money is to rely on the statistical
correlation between the money supply and some macroeconomic indicator such as
national output. They sum up this approach in one phrase: ‘Which counterpart is most
useful in making predictions about observable phenomena on the basis of the theory one
accepts’ (1970, p.139). The money supply is thus equal to the aggregate value of several
items treated as money (i.e. coins, notes, demand deposits, time deposits, savings, and
government bonds) while an ‘optimal’ monetary aggregate is that with the highest
correlation with either current or lagged real income (see Friedman and Meiselman
1969).5
More recently, Andersen and Kavajecz (1994) argue that the ‘ideal’ monetary
aggregate would be composed of assets that satisfy three criteria: (i) they are capital
certain or nearly so; (ii) they are highly liquid; (iii) they are closely related to economic
activity.
Monetary aggregates are generally distinguished according to ‘narrow’ and
‘broad’ aggregates. Narrow monetary aggregates are composed of the medium of
exchange, that is, assets that are highly liquid and whose market value remains invariant
to realized or expected changes in economic activity or market interest rates. Hence,
narrow measures satisfy well the first two criteria. By contrast, broader monetary
3 Irving Fisher (1913) pointed out, for the first time, that bank deposits (demand and time) could equally substitute notes as a mean of payment. 4 For a critique, see Mason (2007). 5 See also Kaufman (1969), Smith (1978) and Laidler (1966, 1969).
7
measures often include assets that are capital uncertain - assets such as long-term
deposits, whose market value varies with market interest rates, the pace of economic
activity or private agents’ expectations of these variables. Therefore, monetary aggregates
are defined to include the nominal rather than the market value of these assets.
Households and firms, however, substitute financial assets at market rather than nominal
values. However, if such assets were included in monetary aggregates at market values,
the measured aggregate would become capital uncertain and might vary with market
rates. Thus, its usefulness as an indicator or a target of monetary policy would be
considerably reduced.
3. Greek historical monetary aggregates, 1842-1939
3.1 Data sources
For Greece, definitions of money primarily include the liabilities of private
financial institutions, namely deposits and banknotes. Therefore, banks’ balance sheets
and their annual reports are the primary sources of historical monetary aggregates data.
However, definitions of money as a mean of payment, such as M1 or M2, or even a
liquidity index, such as M3, are nowhere to be found.
In particular, for the pre-1928 period, data on banknotes circulated by the NBG
appeared for the first time in 1843.6 The published sources were the Bank’s balance
sheets and its annual report. In its annual and semi-annual balance sheets, the stock of
banknotes in circulation was reported for end-June and end-December call dates. In its
annual report, observations appeared on a monthly and a yearly basis. Analytically, Table
1 of the NBG’s annual report is the only well-defined information set for the 19th century.
It presents the stock of notes (of both high and low denominated values) in circulation on
the Bank’s statement on the last day of every month. The maximum and minimum values
in any year as well as annual averages based on the monthly observations were also
6 In the first year of the NBG’s operation, that was 1842, the end-of-June and end-of-December call dates are only available. The entries are from its annual and semi-annual balance sheets for that year. Both Bank’s balance sheets and profit-loss statements for that year were published in French and were not printed but hand-written. Prior to 1842, the Greek ministry of Finance had the right of money issue. Coins of low denominated value were chiefly used in money transactions; however, data do not exist.
8

reported. Keeping the same publication practice throughout the period under study, data
comparability was enhanced.
The NBG was created in 1842 and functioned as a ‘universal’ bank; it was a
deposit and a discount bank as well as a provider of short- and long-term lending to the
private sector and to the state. At the same time, it was granted by the government till
1927 the monopoly of note issue. The Bank’s monopoly covered almost the whole
territory of the country except for Crete, the new provinces of Epirus and Thessaly and
the Ionian islands. Three other smaller banks with both commercial and issuing activities
had the exclusive privilege of note issue in these specific regions, namely the Bank of
Epirus and Thessaly (1882-1897), the Bank of Crete (1899-1919) and the Ionian Bank
(1839-1920).7 Located in the country’s provinces, they circulated their own note, albeit
for only a short period of time and over an extremely limited geographical area. They
gradually retired from their privilege to the advantage of the NBG. Fortunately, they
followed the same publication practice with the NBG, i.e., they reported the stock of
banknotes in circulation on the last day of every year or month.
For the period 1928-1939, the primary data source is the Monthly Statistical
Bulletin of the Bank of Greece (BoG). The BoG was established in May 1928 as the
country’s central bank with the monopoly of money issue and the prime responsibility of
ensuring price and exchange rate stability. Again, the data did not refer to a consistent
time series of narrow or broad money definitions but to reported data for money in
circulation and private bank deposits at monthly and annual frequencies.
Table 3 of the Bulletin shows notes and coins in circulation and demand deposits
of the government and commercial banks with the BoG for each call data of the month
since its inception. It includes monthly developments in the balance sheet items of the
central bank and the commercial banks as well; it reports monthly figures for all
commercial bank private deposits and money balances held as vault cash by the banks. It
should be mentioned that the modified Table 1 of the Bank’s Monthly Statistical Bulletin
7 Data for the banknotes issued and circulated by the Ionian Bank do not exist since only the consolidated financial statements of the parent bank in London were published.
9

in its post-war version – it first appeared post-1950 - comes from Table 3. In that Table,
the staff of the BoG reported data for M1 and its components.8
3.2 Data collection
The data collection process is the most important underlying principle of the
construction of monetary aggregates data. And this is because throughout the whole
sample period many changes had been made to the data collection process and/or
publication practices. Therefore, in this section we present a brief outline of the data
inflows reported in the data sources and used in the construction process during a small
number of distinct time periods over which data collection and data reporting differed
notably.
1842 is the starting date of our sample; it marks a watershed for Greece. It was the
year that the NBG started to operate; and more importantly, it first issued and circulated
banknotes ‘payable to the bearer upon request’ that were readily and fully convertible
into specie. Pre-1880, banknotes issued solely by the NBG were circulated in a limited
amount. During that period, financial development progressed only slowly; bank deposits
were negligible and exchange was largely based on barter. However, in the period 1880-
1911, the picture changed. Key features of Greece’s economic and financial environment
were the gradual urbanization and appearance of a creditor-urban class. The continuous
opening of the NBG’s branches in all major cities and in the provinces largely
contributed to the increase in banknotes in circulation and their use by the public as a
mean of payment and a store of value. Moreover, the gradual territorial enlargements of
the country during that time led to the establishment and operation of other issuing banks
that circulated their own note in the new provinces (the Epirus-Thessaly Bank and the
Bank of Crete, mentioned above).
From 1912 to 1927 some changes in data reporting and data collection were
made. From the turn of the century to the early 1920s, the process of financial
intermediation moved quickly and numerous deposit banks were created. However, data
8 The Bulletin stopped appearing in 2004.
10

on total bank private deposits only began to be reported on an annual basis in 1912. Till
then, bank money deposits referred chiefly to the private deposits kept with the issuing
banks only.9
During the last distinct period under study, from 1928 to 1939, major institutional
reforms took place concerning central and commercial banking. In particular, the
foundation of an independent central bank, namely the BoG,10 in May 1928 was the
outcome of the international trend in the interwar period to re-organize central bank
functions. The new institution had the sole privilege of issuing and circulating the
country’s legal tender and operated as an official body in the conduct of monetary and
exchange rate policy according to the central banking orthodoxy of the time. Moreover, a
rigorous set up for commercial bank regulation and supervision was initiated by law in
1931.11 Among other rules, all commercial banks were obliged to keep reserves with the
central bank to meet excess liquidity demand. Thus, from 1931 onwards data for
commercial compulsory deposits were also officially reported.12
3.3 Construction and measuring
We build two aggregates: (i) a broad definition of money (M3) which serves as a
liquidity index for the domestic economy and (ii) the monetary base (M0) which is
measured using the issuing and central banks’ liabilities, i.e., the uses side of the base
(currency and deposits with the central bank). The sample period is 1842-1939 and the
values are shown at annual (end-of-year) frequencies.
The Bank of Greece started to measure the quantity of money and build
aggregates by using the standard definitions as late as the early 1950s. This was because,
in the context of the gold standard, which was the monetary orthodoxy of the pre-war
time, the monetary authorities conducted a ‘bank rate policy’. This means that the short-
9 Besides, the largest part of the private deposits was kept with these banks. 10 By the detachment of the NBG’s issuing department and the remainder’s transformation into a pure commercial credit institution. 11 See the laws of 30 June and 7 July 1931. 12 Till then, smaller banks used to keep deposits with the biggest bank, i.e. the NBG. The latter, however, saw fit to act as an ‘implicit’ or ‘unofficial’ central bank or a banks’ bank. Data on these deposits do not exist since the NBG used to report only the sum of all private (non-government) deposits kept with it.
11

term rate imposed on discounts and advances provided by the central or issuing bank to
the commercial banks was the operating target of monetary policy. For example, in the
context of the interwar gold standard, the Bank of Greece used to change its rate taking
into account inflation trends and liquidity conditions in the domestic money market so as
to keep foreign exchange reserves intact and preserve the stability of the international
price of the national currency.
The monetary rule was simple and clear cut. The ‘discount window’ was the most
important monetary policy tool. By changing the discount rate, that is the key interest rate
at which banks borrowed money from the central or issuing bank, the latter could control
the stock of money in the market. The higher the discount rate, the lower the amount of
money that banks would decide to borrow and vice versa. In other words, manipulation of
the discount rate could influence the short-term lending rates in the money market.
Furthermore, the metallic monetary regimes required each country’s central bank
to maintain a constant ratio of reserves to banknotes in circulation. Excess unbacked note
issue would strengthen inflationary pressures in the domestic economy and would cause
capital outflows and reserve losses. In other words, the reserve banknote ratio determined
the correlation between the domestic money supply and metallic and foreign exchange
holdings. Obviously, banknote circulation was a key monetary variable, since the central
or issuing bank was obliged to announce and preserve a statutory lowest bound for
banknotes in circulation that were to be readily and fully convertible into specie or
foreign exchange. Therefore, the precise knowledge of the stock of banknotes was of
paramount importance if convertibility was to be secured.
In accordance with the monetary policy rules pursued in the context of a metallic
regime, the NBG, from its inception, tried to measure the stock of money in the domestic
economy by simply reporting the stock of the banknotes in circulation. According to its
statute (article 36), no less than 25% of banknotes in circulation were to be covered by
metallic or/and foreign exchange reserves. Further, according to the Bank of Greece’s
statute (article 61) it was strictly defined that no less than 25% of ‘actual’ money in
circulation (i.e. coins and banknotes) should be convertible into specie or foreign
exchange. By the same article, it was also defined that a lowest bound of 40% of
12

‘potential’ money in circulation should be covered. ‘Potential’ money circulation, in
contrast to ‘actual’ circulation, was defined as the sum of notes and coins in the hands of
the public plus reserves and commercial balances with the central bank, namely what
today we call the ‘monetary base’. Even though the concept of a monetary aggregate was
found nowhere, this was the first time the Greek monetary authorities implicitly made the
summation to explicitly estimate the quantity of money in the domestic economy.
In the first decade after the end of WWII the operating target changed. According
to the new orthodoxy of the monetary policy implementation, namely the quantity school
of central banking, a monetary aggregate such as the monetary base, was set as the new
operating target. It was at this time that the Bank of Greece started to measure the
quantity of money explicitly by building aggregates, such as the monetary base or M1.
By operating (selling or buying) in the open market the central bank tried to change the
monetary base and via the money multiplier to check the money supply directly.13
13 Following the advanced countries, in 1975, the Bank of Greece started to set and announce monetary targets and a specific year-on-year rate of growth of M0 till 1982 and M3 till 1998 were set. In other words, the Bank started to use monetary aggregates as policy targets or indicators. Thereafter, it stopped considering them as policy targets.
13

Table 1: Information on Greek historical monetary statistics, 1842-1939
Availability Monetary Statistics Definitions Time
period Time frequency
Source of Information
1. Broad money (M3)=
Liquidity index 1842-1927 yearly and semi-annually
1928-1939 yearly and monthly
(+) total private deposits kept with the issuing banks till 1911 and with all commercial banks from 1912 to 1939
Sight, time, savings and bank bonds
1842-1927 yearly and semi-
annually 1928-1939 yearly and monthly
Issuing Banks’ Balance Sheets and Annual Reports; Bank of Greece Monthly Statistical Bulletin; monthly statements of the commercial banks to the central bank
(-) vault cash
Cash held solely by the issuing banks till 1927; and by all depository institutions from 1928 to 1939
1842-1927 yearly and semi-
annually 1928-1939 yearly and monthly
Issuing Banks’ Balance Sheets; Bank of Greece Monthly Statistical Bulletin
(+) currency in circulation
Banknotes of small value, i.e. 1 and 2 drachmas, held by the non-bank public
1886-1910 yearly and semi-
annually
Issuing Banks’ Balance Sheets
(+) banknotes in circulation
Banknotes held by the non-bank public (i.e. outside the banking sector)
1842-1939 yearly and monthly
Issuing Banks’ Balance Sheets and Annual Reports; Bank of Greece Monthly Statistical Bulletin
14

Table 1: continued
Monetary Statistics
Definitions Availability Source of Information
Time period
Time frequency
2. Monetary Base (M0) =
1842-1927 1928-1939
yearly and semi-annually yearly and monthly
(+) banknotes in circulation (plus notes of small value)
Banknotes held by the non-bank public
1842-1939
yearly and monthly
Issuing Banks’ Balance Sheets and Annual Reports; Bank of Greece Monthly Statistical Bulletin
(+) vault cash
Cash held by the issuing banks in their notes and other depository institutions. From 1928 onwards, cash referred to money balances held by all commercial banks.
1842-1927 1928-1939
yearly and semi-annually yearly and monthly
Issuing Banks’ Balance Sheets; Banks’ statements to the Bank of Greece
(+) reserve requirements
Till 1931, no commercial bank was subject to keep reserves with the central bank. Before 1931, only the NBG was obliged to keep money balances with the BoG
1928-1939
yearly and monthly
Bank of Greece, Monthly Statistical Bulletin
15

Table 1: continued
Monetary Statistics
Definitions Availability Source of Information
Time period
Time frequency
3. Money Multiplier=
The ratio of broad money (M3) to monetary base (M0). It is an index of public confidence in the domestic banking and monetary system.
1842-1927 1928-1939
yearly, semi-annually yearly, monthly
4. Reserve-Banknote Ratio= total reserves over banknotes in circulation*
In the metallic monetary regimes this ratio determined the correlation between the money supply and metallic or foreign exchange reserves. Metallic= gold plus silver stock as a barren metal. Foreign exchange= deposits denominated in gold backed currencies
1842-1939 (from 1877 mainly gold) 1869-1939
yearly, monthly
National Bank of Greece, Annual Reports; Bank of Greece, Monthly Statistical Bulletin
Notes: (*) the data refer to the NBG (1842-1927) and the BoG (1928-1939). Source: compiled by the author.
16

Even though monetary aggregates are difficult to control and their measurement is
uncertain, money targeting might help the central bank stabilize inflationary expectations
and therefore the inflation rate. However, in the 1990s the globalisation of money and
capital markets as well as numerous financial innovations made money demand unstable
and thus reduced the usefulness of monetary aggregates as indicators of the stance of
monetary policy.14 Thus, in 1998, the Bank of Greece stopped considering monetary
aggregates as an intermediate policy target or an indicator of the impact of policy actions.
Table 1 provides important details on the definitions of monetary statistics, the
data availability (time period and frequency) and the source of information. Fortunately,
in the 19th and the early 20th centuries the money stock could be well measured by simply
summing the currency in circulation and private bank deposits. In contrast to the past,
nowadays the possibility of substituting among a wide variety of financial assets at low
cost makes the measurement of money and its control more difficult.
In the sense of the ‘optimum’ aggregate, we empirically find that the constructed
M0 and M3 aggregates are better measures of the money stock than solely banknote
circulation. The correlation between the rate of change of these monetary aggregates and
the growth of real GDP is higher than that for the rate of change of banknotes in
circulation. This correlation takes an even higher value after 1912 when data on total
private deposits at commercial banks started to be published. As a breakdown of
commercial bank deposits between demand, saving and time deposits is acquiring
accuracy first only for the biggest banks and afterwards (from 1928) for all banks, we can
also compute the correlation between income and each element of the monetary
aggregate. Several elements were tested: cash, notes in circulation, demand deposits, time
deposits, savings deposits. In all cases, the M3 aggregate recorded the highest correlation.
14 Lucas (1988) reassesses the evidence on the stability of the money demand estimated by Meltzer (1963). He justifies that there is a theoretical equilibrium relationship between real money balances, a nominal interest rate as a measure of the opportunity cost of money and GDP growth. He further estimates that equilibrium relationship using M1 data for the US up to 1985 and finds that there is a stable relationship between these variables. However, banking deregulation in the 1980s and the 1990s and financial innovation in the 1990s, associated with the impact of technological change on payments, made other monetary aggregates as liquid as M1, suggesting that we need to reconsider the measure of money. See, for example, Beyer et al. (2007), Hall et al. (2007) and Teles and Zhou (2005).
17
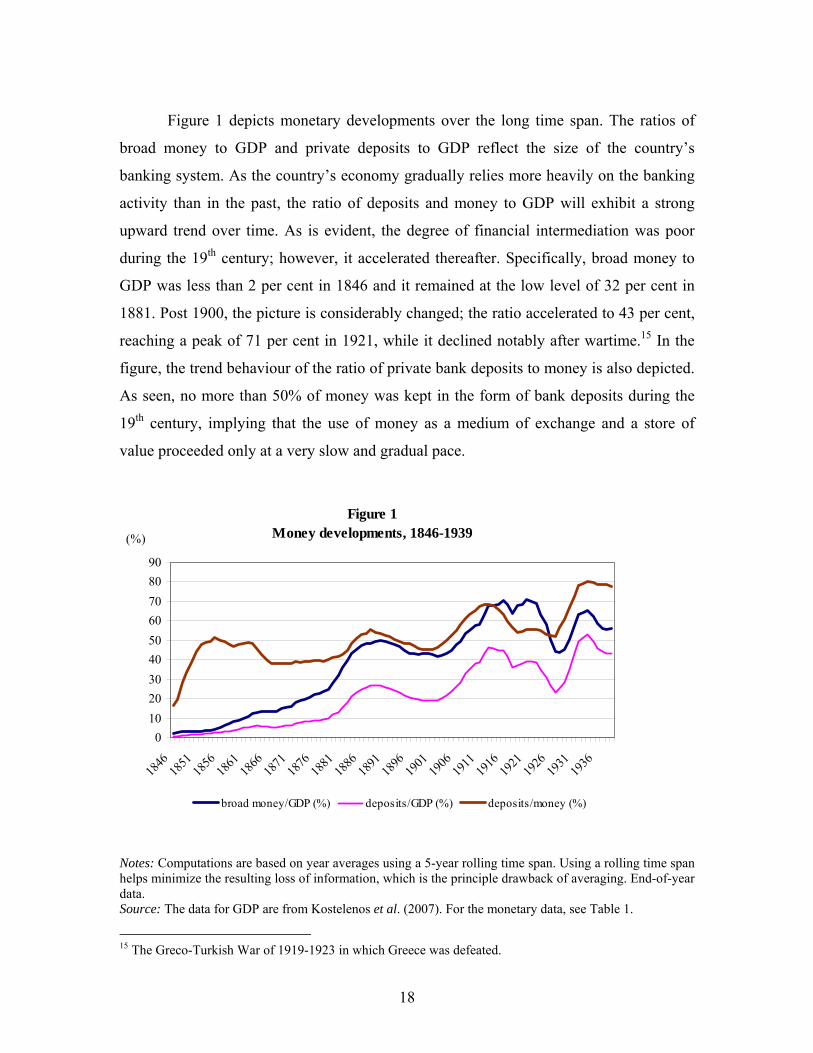
Figure 1 depicts monetary developments over the long time span. The ratios of
broad money to GDP and private deposits to GDP reflect the size of the country’s
banking system. As the country’s economy gradually relies more heavily on the banking
activity than in the past, the ratio of deposits and money to GDP will exhibit a strong
upward trend over time. As is evident, the degree of financial intermediation was poor
during the 19th century; however, it accelerated thereafter. Specifically, broad money to
GDP was less than 2 per cent in 1846 and it remained at the low level of 32 per cent in
1881. Post 1900, the picture is considerably changed; the ratio accelerated to 43 per cent,
reaching a peak of 71 per cent in 1921, while it declined notably after wartime.15 In the
figure, the trend behaviour of the ratio of private bank deposits to money is also depicted.
As seen, no more than 50% of money was kept in the form of bank deposits during the
19th century, implying that the use of money as a medium of exchange and a store of
value proceeded only at a very slow and gradual pace.
Figure 1Money developments, 1846-1939
0102030405060708090
1846
1851
1856
1861
1866
1871
1876
1881
1886
1891
1896
1901
1906
1911
1916
1921
1926
1931
1936
(%)
broad money/GDP (%) deposits/GDP (%) deposits/money (%)
Notes: Computations are based on year averages using a 5-year rolling time span. Using a rolling time span helps minimize the resulting loss of information, which is the principle drawback of averaging. End-of-year data. Source: The data for GDP are from Kostelenos et al. (2007). For the monetary data, see Table 1.
15 The Greco-Turkish War of 1919-1923 in which Greece was defeated.
18

Figure 2 plots the growth rate of broad money and the monetary base. As seen,
changes in the monetary base largely dominated changes in money balances. This implies
that the money multiplier, which reflects the behaviour of the banks and the public, had a
minimum impact on the determination of the money stock. It is found that monetary base
changes could explain more than 86% of money supply changes while the money
multiplier could explain only 14%. This finding demonstrates that, for most of the time,
the convertibility rule was suspended and money creation primarily determined the
money stock. Further, the underdeveloped nature of the country’s economy and the low
degree of financial integration were mirrored in the weak impact of both the banking
sector and the public, in favour of a larger contribution from the monetary base.
However, in the years of convertibility (1910-1914; 1928-1939)16 this association did not
hold. It seems that the money multiplier was the driving force of money supply
movements.17 This was because adherence to the convertibility rule largely determined
the stance of the monetary policy pursued. As a result, public confidence in the domestic
banking system was promoted.
Figure 2Monetary aggregates, 1846-1939
(%)
50
40
30
20
10
0 1847185218571862186718721877188218871892189719021907191219171922192719321937-10
monetary base (%) broad money (%)
Notes: annual percentage changes of averages based on a 5-year rolling time span. End-of-year data. Source: see the data appendix. 16 Greece joined the classical gold standard in 1910 and the interwar gold exchange standard in 1928. 17 This is a common feature of every peripheral country. For national stories see, Fratianni and Spinelli (2001) on Italy and Martín-Aceña on Spain and Portugal (2007). For Greece see, Lazaretou (2008).
19

4. Conclusions
This is the first systematic attempt to measure money and build monetary
aggregates based on standard definitions for earlier periods of the Greek state. We draw
data from official data sources as they appeared in the balance sheets and the annual
reports of the commercial and issuing banks as well as the central bank. We carefully
discussed the issues of data reporting and collecting as well as the standard definitions
used. The end product is presented in a data appendix.
However, some caveats are in order. First, to quote Andersen and Kavajecz
(1994), ‘…ideal historical data would be computed at similar frequencies under
consistent definitions’ (p.4). This is not, of course, the case for Greek historical data. The
gradual expansion of the Greek state, the co-existence of many issuing banks, even for
short intervals and in restricted geographical areas, the lack of data for key variables and
the different number of operating commercial banks at various years cause many
problems in computation that affect the strict comparability of the published data.
Second, due to data constraints regarding the de-composition of total private bank
deposits for a considerable number of years, we can only construct a broad definition of
money. Narrow aggregates such as M1 and M2 cannot be built.
Third, since the call dates for many key series only refer to the end of the year,
monetary aggregates can only be shown at annual frequency. In addition, the series were
based on banks’ financial statements on the last day of the month (or year).
Unfortunately, daily observations do not exist and thus a monetary aggregate derived
from averages of the daily data could not be built. From a statistical point of view,
building aggregates from daily data would be the ‘ideal’ procedure ‘…because seasonal
patterns within a month may cause data for individual days to be unrepresentative of both
the month’s average level and the aggregate’s trend growth rate’ (Andersen and Kavajecz
1994, p.4).18
18 See also Abott (1962).
20

References Abott, W. J. (1962), ‘Revision of Money Supply Series’, Federal Reserve Bulletin, August, 941-51. Anderson, R. and K. A. Kavajecz (1994), ‘A Historical Perspective on the Federal Reserve’s Monetary Aggregates: Definition, Construction and Targeting’, Federal Reserve Bank of St. Louis, Review, 76, 1-71. Bank of Greece (1928-1939), Monthly Statistical Bulletin, various issues. Bank of Greece (2009), ‘Monetary Time Series of Southeastern Europe from the 1870s to 1914’, SEEMHN and Bank of Greece Working Paper no 94, February. Bank of Crete (1899-1920), Annual Reports and Balance Sheets, Historical Archives of the National Bank of Greece, various issues. Bank of Epirus and Thessaly (1882-1897), Annual Reports and Balance Sheets, Historical Archives of the National Bank of Greece, various issues. Bayer, A., B. Fisher and J. von Landerberger (2007), ‘M3 Demand Stability; Implications for the Usefulness of Money in Monetary Policy Making’, ECB Eurosystem. MPC/035/07. Fisher, I. (1913), The Purchasing Power of Money, New York Macmillan. Fratianni, M. and F. Spinelli (2001), ‘Fiscal Dominance and Money Growth in Italy: the Long Record’, Explorations in Economic History, 38, 252-272. Friedman, M. and A. J. Schwartz (1970), Monetary Statistics of the United States, Columbia University Press and NBER. Friedman, M. and D. Meiselman (1963), ‘The Relative Stability of Monetary Velocity and the Investment Multiplier in the United States 1899-1958’, in Brown E. C. (ed.), Stabilization Policy, Englewood Cliffs, N.J. Princeton Hall. Hall, S.G., G. Hondroyiannis, P.A.V.B. Swamy and G. S. Tavlas (2007), ‘A Portfolio Balance Approach to Euro-Area Money Demand in a Time-Varying Environment’, Bank of Greece, Working Paper no 61, October. Kaufman, G. G. (1969), ‘More on an Empirical Definition of Money’, American Economic Review, 59, 1, 78-87. Kostelenos, G., D. Vasiliou, E. Kounaris, S. Petmezas and M. Sfakianakis (2007), Sources of the Economic History of Modern Greece: Quantitative Data and Statistical
21

Series: Greek Domestic Product, 1830-1939, Centre for Planning and Economic Research and the National Bank of Greece. Laidler, D. (1969), ‘The Definition of Money: Theoretical and Empirical Problems’, Journal of Money, Credit and Banking, 1, 508-525. Laidler, D. (1966), ‘Some Evidence on the Demand for Money’, Journal of Political Economy, 74, 55-68. Lazaretou, S. (2005), ‘The Drachma, Foreign Creditors and the International Monetary System: tales of a currency during the 19th and the early 20th centuries’, Explorations in Economic History, 42, 202-236. Lazaretou, S. (1995), ‘Government Spending, Monetary Policies and Exchange Rate Regime Switches: the drachma in the gold standard period’, Explorations in Economic History, 32, 28-50. Lazaretou, S. (2008), ‘Banking and Central Banking in pre-WWII Greece: money and currency developments’, SEEMHN and Bank of Greece Working Paper no 86, July. Lucas, R. E. Jr. (1988), ‘Money Demand in the United States: A Quantitative Review’, Carnegie-Rochester Conference Series on Public Policy, 29, 137-168. Martín-Aceña, P. (2007), ‘Central Banking in the Iberian Peninsula: A Comparison’, paper presented in the annual conference of the EABH, Malta, May 2007. Mason, W. E. (2007), ‘The Empirical Definition of Money: A Critique’, Economic Inquiry, 14, 525-538. Meltzer, A. H. (1963), ‘The Demand for Money: the Evidence from the Time Series’, Journal of Political Economy, 71, 219-246. National Bank of Greece (1842-1927), Annual Reports and Balance Sheets, Historical Archives of the National Bank of Greece, microfilms. OeNB (2008), ‘The Experience of Exchange Rate Regimes in Southeastern Europe in a Historical and Comparative Perspective’, Workshops no 13, Appendix. Smith, D. (1978), ‘The Demand for Alternative Monies in the UK: 1924-1977’, National Westminster Bank, Quarterly Review, November, 35-49. Teles, P. and R. Zhou (2005), ‘A Stable Money Demand: Looking for the Right Monetary Aggregate’, Federal Reserve Bank of Chicago, Economic Perspectives, 50-63.
22

Appendix
Table A: Monetary statistics for Greece, 1842-1939
Year Broad Money (M3) (1)
Monetary Base (M0) (2)
Money Multiplier (M3)/(M0)
(3)
Reserve-Banknote
Ratio (4)
1842 323.5 535.4 0.604 1.45* 1843 624.5 839.3 0.744 0.57 1844 1033.2 982.2 1.052 0.67 1845 1820.7 2252.8 0.808 0.50 1846 2692.7 3121.4 0.863 0.37 1847 2490.5 2299.0 1.083 0.36 1848 2002.8 2297.3 0.872 0.87 1849 2803.3 1797.5 1.560 0.86 1850 3471.4 2443.0 1.421 0.56 1851 3254.8 2618.5 1.243 0.78 1852 3529.8 2224.8 1.587 0.80 1853 4136.0 3286.3 1.259 0.94 1854 5409.4 4386.8 1.233 1.33 1855 7004.1 4863.1 1.440 1.14 1856 9752.0 6378.5 1.529 0.97 1857 12829.7 8822.5 1.454 0.65 1858 12312.8 9471.8 1.300 0.68 1859 13690.8 10828.5 1.264 0.52 1860 16967.0 9958.9 1.704 0.59 1861 19211.9 12671.2 1.516 0.50 1862 20836.6 12305.9 1.693 0.54 1863 23256.3 14962.5 1.554 0.50 1864 24853.2 16349.4 1.520 0.41 1865 26490.8 16684.8 1.588 0.40 1866 24231.9 16514.3 1.467 0.40 1867 28993.1 23376.4 1.240 0.47 1868 32609.5 31637.1 1.031 0.36 1869 37329.1 32348.9 1.154 0.46** 1870 39863.9 40341.8 0.988 0.61 1871 41209.2 46939.9 0.878 0.56 1872 48127.3 56263.7 0.855 0.64 1873 52776.7 44632.8 1.182 0.55 1874 57130.1 55349.8 1.032 0.48 1875 54427.0 56099.9 0.970 0.56 1876 55287.3 59504.8 0.929 0.51 1877 65226.1 70674.8 0.923 0.34 1878 83653.9 79016.9 1.059 0.14
23

Table A: continued
Year (1) (2) (3) (4) 1879 78386.4 77127.7 1.016 0.40 1880 105655.5 83134.3 1.271 0.32 1881 147200.9 118996.8 1.237 0.18 1882 167958.6 127320.3 1.319 0.17 1883 189208.1 139405.8 1.357 0.16 1884 178474.3 127741.3 1.397 0.69 1885 189299.5 124349.2 1.522 0.18 1886 224960.3 175422.3 1.282 0.09 1887 224073.3 168376.6 1.331 0.09 1888 216641.7 176768.0 1.226 0.13 1889 217774.4 168762.1 1.290 0.15 1890 236361.3 154826.9 1.527 0.10 1891 246425.2 159606.2 1.544 0.09 1892 241998.6 189887.0 1.274 0.10 1893 242841.7 169296.9 1.434 0.09 1894 220990.6 161096.0 1.372 0.09 1895 218368.7 159832.3 1.366 0.09 1896 222291.4 158975.5 1.398 0.10 1897 227191.8 161606.3 1.406 0.10 1898 240013.1 182828.8 1.313 0.10 1899 248776.5 211128.2 1.178 0.12 1900 242360.9 198798.2 1.219 0.14 1901 253506.6 223449.5 1.135 0.15 1902 258134.6 243416.9 1.060 0.13 1903 269524.1 257974.7 1.045 0.14 1904 292906.9 245211.1 1.195 0.17 1905 289701.1 237093.6 1.222 0.22 1906 315082.8 236481.3 1.332 0.29 1907 329427.5 236406.4 1.393 0.27 1908 394388.3 237219.6 1.663 0.35 1909 408833.8 220521.0 1.854 0.33 1910 416411.8 219655.7 1.896 0.55 1911 454854.4 160812.8 2.828 0.81 1912 633191.4 230635.2 2.745 0.88 1913 730022.8 297748.5 2.452 1.08 1914 727807.5 294431.5 2.472 0.84 1915 930819.2 395345.2 2.354 0.82 1916 1249487.3 571723.5 2.185 0.99 1917 1812870.6 890493.6 2.036 1.13 1918 2542432.6 1402051.6 1.813 1.37 1919 2973115.9 1401744.0 2.121 1.14 1920 3798776.0 2019385.8 1.881 0.95 1921 5273189.0 2508553.8 2.102 0.64
24

Table A: continued
Year (1) (2) (3) (4) 1922 6830899.0 3698465.4 1.847 0.44 1923 9268719.0 5406933.9 1.714 0.30 1924 10014923.7 5292613.8 1.892 0.27 1925 10719249.0 5547900.5 1.932 0.25 1926 11262640.3 5716500.9 1.970 0.30 1927 10175903.3 5690844.5 1.788 0.29 1928 17053400.0 6346700.0 2.687 0.54*** 1929 17499300.0 5741200.0 3.048 0.46 1930 22343600.0 5596500.0 3.992 0.46 1931 21775500.0 4743300.0 4.591 0.41 1932 20716800.0 5494100.0 3.771 0.30 1933 23296200.0 6904500.0 3.374 0.42 1934 24499400.0 7602400.0 3.223 0.41 1935 24685700.0 6813400.0 3.623 0.30 1936 25665400.0 7461500.0 3.440 0.27 1937 29167600.0 7657700.0 3.809 0.26 1938 31387500.0 8106800.0 3.872 0.21 1939 34066000.0 10060300.0 3.386 0.30
Notes: (*) metallic holdings only; (**) total reserves (metallic and foreign exchange holdings); (***) ratio of total reserves and ‘potential’ circulation. ‘Potential’ money in circulation was defined as the sum of the banknotes in the hands of the public plus reserves and commercial bank balances with the central bank (see the statute of the BoG, article 61). The data refer to the end of the year and the values are in thousands of LMU drachmas. For variables’ definitions and data sources see Table 1.
25

26

BANK OF GREECE WORKING PAPERS
76. Kossev, K. D., “The Banking Sector and the Great Depression in Bulgaria, 1924-1938: Interlocking and Financial Sector Profitability”, June 2008.
77. Buyst, E. and I. Maes, “The Regulation and Supervision of the Belgian Financial
System (1830-2005)”, June 2008. 78. Barisitz, S., “Banking Transformation (1989-2006) in Central and Eastern Europe –
with Special Reference to Balkans”, June 2008. 79. Lazarević, Ž., “Banking Performance in South-Eastern Europe during the Interwar
Period”, July 2008. 80. Apostolides, A., “How Similar to South-Eastern Europe were the Islands of Cyprus
and Malta in terms of Agricultural Output and Credit? Evidence during the Interwar Period”, July 2008.
81. Avramov, R. and D. Gnjatović, “Stabilization Policies in Bulgaria and Yugoslavia
during Communism’s Terminal Years: 1980s Economic Visions in Retrospect”, July 2008.
82. Nenovsky, N., M. Ivanov and G. Mihaylova, “The Evolution of Bulgarian Banks’
Efficiency during the Twenties: A DEA Approach”, July 2008. 83. Görmez, Y., “Banking in Turkey: History and Evolution ”, July 2008. 84. Ceca, K., K. Rexha and E. Orhan, “Banking and Finance in South-Eastern Europe:
The Albanian Case”, July 2008. 85. Bordo, M., “Growing up to Financial Stability”, July 2008. 86. Lazaretou, S., “Banking and Central Banking in Pre-WWII Greece: Money and
Currency Developments”, July 2008. 87. Sojic, M. and L. Djurdjevic, “Monetary Policy Objectives and Instruments Used by
the Privileged National Bank of the Kingdom of Serbia (1884-1914)”, July 2008. 88. Stoenescu. G.V., E. Blejan, B. Costache and A. I. Aloman, “The National Bank of
Romania and its Issue of Banknotes between Necessity and Possibility, 1880-1914”, July 2008.
89. Masciandaro, D. and M. Quintyn, “Institutions Matter: Financial Supervision
Architecture, Central Bank and Path Dependence. General Trends and the South Eastern European Countries”, September 2008.
27

90. Tavlas, G., H. Dellas and A. Stockman, “The Classification and Performance of Alternative Exchange-Rate Systems”, September 2008.
91. Milionis, A. E. and E. Papanagiotou, “A Note on the Use of Moving Average
Trading Rules to Test for Weak Form Efficiency in Capital Markets”, October 2008.
92. Athanasoglou, P.P. E. A. Georgiou and C. C. Staikouras, “Assessing Output and
Productivity Growth in the Banking Industry”, November 2008. 93. Brissimis, S. N. and M. D. Delis, “Bank-Level Estimates of Market Power”,
January 2009. 94. Members of the SEEMHN Data Collection Task Force with a Foreword by Michael
Bordo and an introduction by Matthias Morys, “Monetary Time Series of Southeastern Europe from 1870s to 1914”, February 2009.
95. Chronis, P., “Modeling Distortionary Taxation”, March 2009. 96. Hondroyiannis, G., “Fertility Determinants and Economic Uncertainty: An
Assessment using European Panel Data”, April 2009 97. Papageorgiou, D., “Macroeconomic Implications of Alternative Tax Regimes: The
Case of Greece”, May 2009. 98. Zombanakis, G. A., C. Stylianou and A. S. Andreou, “The Greek Current Account
Deficit: Is It Sustainable After All?”, June 2009. 99. Sideris, D., “Optimum Currency Areas, Structural Changes and the Endogeneity of
the OCA Criteria: Evidence from Six New EU Member States”, July 2009.
100. Asimakopoulos, I. and P. Athanasoglou, “Revisiting the Merger and Acquisition Performance of European Banks”, August 2009.
101. Brissimis, N. S. and D. M. Delis, “Bank Heterogeneity and Monetary Policy
Transmission”, August 2009. 102. Dellas, H. and G. S. Tavlas, “An Optimum-Currency-Area Odyssey”, September
2009. 103. Georgoutsos, A. D. and P. M. Migiakis, “Benchmark “Bonds Interactions under
Regime Shifts”, September 2009. 104. Tagkalakis, A., “Fiscal Adjustments and Asset Price Movements”, October 2009.
28

![V]DUG %RFLDQ Z RNXODUDFK ] EURG 0LFKDá )DN /HV]HN … · Po prelekcji Leszka Moczulskiego w salce katechetycznej na zapleczu jednego z krakowskich NR FLRáyZ 2G SUDZHM 5\V]DUG %RFLDQ](https://img.pdfslide.tips/doc/110x75/5c777a6009d3f229578be8c2/vdug-rfldq-z-rnxodudfk-eurg-0lfkda-dn-hvhn-po-prelekcji-leszka-moczulskiego.jpg)