Embed Size (px)
Citation preview
Johann Wolfgang Goethe Universität Frankfurt am MainInstitut für Kernphysik
Fachbereich Physik
Bachelor Thesis
im Studiengang Physik
Thema: Imaging ultrafast molecular dynamicstriggered by extreme ultraviolet photoabsorption
eingereicht von: Daniel Trabert ‹[email protected]›
eingereicht am: 13. Januar 2015
Erstgutachter: Herr Prof. Dr. Reinhard Dörner
Zweitgutachter: Herr PD Dr. Till Jahnke

Abstract
Ultrafast molecular dynamics of D2 and CO2 targets were investigated using anXUV – infrared pump-probe setup. Main goals of this study were to image themolecular wave packet created by a single XUV photo-absorption, and to investi-gate its coupling to the probing IR field. The experiments were conducted at theKansas Light Source (KLS) laser facility located at the James R. Macdonald Lab-oratory in Manhattan, Kansas. The 800 nm infrared (IR) radiation of the KLSwas used to generate its high-order harmonics in the XUV domain as well as toprobe the XUV-induced molecular motion, which was visualized by combined ionand electron momentum spectroscopy. The 11th harmonic of the KLS beam witha photon energy of 17.33 eV was chosen as a pump pulse. For D2 target, two dis-sociation mechanisms of the XUV-induced wave packet were studied, referred to aspredissociation and bond-softening. The latter pathway, where the molecule wasfirst ionized to the 1sσg state, and then dissociated by subsequent absorption of oneIR photon via the repulsive 2pσu curve, was found to be the predominant effect.Energy spectra of XUV-induced photo-electrons from the ionization of CO2 wererecorded and excitation to both, ground and excited ionic states, was identified.The dissociation yields of O+ and CO+ ions measured as a function of the XUV-IRpump-probe delay revealed different fragmentation pathways leading to these finalstates.
III


Contents
List of Figures VII
1 Introduction 1
2 Theoretical background 32.1 Electromagnetic waves . . . . . . . . . . . . . . . . . . . . . . . . . . 32.2 Gaussian Pulses . . . . . . . . . . . . . . . . . . . . . . . . . . . . . . 32.3 High-Harmonic Generation . . . . . . . . . . . . . . . . . . . . . . . 4
2.3.1 Three-step model . . . . . . . . . . . . . . . . . . . . . . . . . 42.3.2 Phase matching . . . . . . . . . . . . . . . . . . . . . . . . . . 6
2.4 Photo-absorption . . . . . . . . . . . . . . . . . . . . . . . . . . . . . 62.4.1 Transition to excited states . . . . . . . . . . . . . . . . . . . 62.4.2 Ionization . . . . . . . . . . . . . . . . . . . . . . . . . . . . . 72.4.3 Dissociation . . . . . . . . . . . . . . . . . . . . . . . . . . . . 8
2.5 Multi-photon absorption . . . . . . . . . . . . . . . . . . . . . . . . . 92.5.1 Above-threshold ionization . . . . . . . . . . . . . . . . . . . 9
2.6 Error calculation . . . . . . . . . . . . . . . . . . . . . . . . . . . . . 92.6.1 Statistical error . . . . . . . . . . . . . . . . . . . . . . . . . . 102.6.2 Systematic error . . . . . . . . . . . . . . . . . . . . . . . . . 102.6.3 Error propagation . . . . . . . . . . . . . . . . . . . . . . . . 10
3 Experimental Setup 113.1 Laser . . . . . . . . . . . . . . . . . . . . . . . . . . . . . . . . . . . . 113.2 Interferometer . . . . . . . . . . . . . . . . . . . . . . . . . . . . . . . 11
3.2.1 Semi-infinite gas cell . . . . . . . . . . . . . . . . . . . . . . . 113.2.2 Grating pair . . . . . . . . . . . . . . . . . . . . . . . . . . . 123.2.3 Delay stage . . . . . . . . . . . . . . . . . . . . . . . . . . . . 12
3.3 COLTRIMS . . . . . . . . . . . . . . . . . . . . . . . . . . . . . . . . 143.3.1 Spectrometer . . . . . . . . . . . . . . . . . . . . . . . . . . . 143.3.2 Detector . . . . . . . . . . . . . . . . . . . . . . . . . . . . . . 15
3.4 Electronics . . . . . . . . . . . . . . . . . . . . . . . . . . . . . . . . 163.4.1 Constant fraction discriminator . . . . . . . . . . . . . . . . . 163.4.2 Time to digital converter . . . . . . . . . . . . . . . . . . . . 16
3.5 Momentum calculation . . . . . . . . . . . . . . . . . . . . . . . . . . 173.6 Software . . . . . . . . . . . . . . . . . . . . . . . . . . . . . . . . . . 18
4 Experiment 194.1 Experimental procedures . . . . . . . . . . . . . . . . . . . . . . . . . 19
4.1.1 Alignment . . . . . . . . . . . . . . . . . . . . . . . . . . . . . 19
V

Contents
4.1.2 Time-of-flight . . . . . . . . . . . . . . . . . . . . . . . . . . . 214.1.3 Magnetic field . . . . . . . . . . . . . . . . . . . . . . . . . . . 224.1.4 Photon energy of 11th harmonic . . . . . . . . . . . . . . . . 23
4.2 XUV-IR pump-probe experiment on D2 target . . . . . . . . . . . . 234.3 XUV-IR pump-probe experiment on CO2 target . . . . . . . . . . . 30
5 Conclusion 37
6 Appendix 39
Bibliography 41
VI
List of Figures
2.1 Electromagnetic plane wave, illustration from [Mur] . . . . . . . . . 42.2 Schematic depiction of the three-step model [Ish10] . . . . . . . . . . 52.3 Electron kinetic energy with respect to the phases of ionization and
recombination [Ish10] . . . . . . . . . . . . . . . . . . . . . . . . . . . 62.4 Potential energy curves for the ground state and an excited state of
a diatomic molecule, numbers denote vibrational states, process ofphoton absorption (A) and photon emission (F) [Gov] . . . . . . . . 7
2.5 Potential curves for H+2 , the dissociative state 2pσ+
u is reached, themolecule fragments into H and H+ (modified from: [WMS+13]) . . 8
2.6 Schematic depiction of above-threshold ionization (ATI), the peaksin the electron energy are separated by hν. . . . . . . . . . . . . . . 9
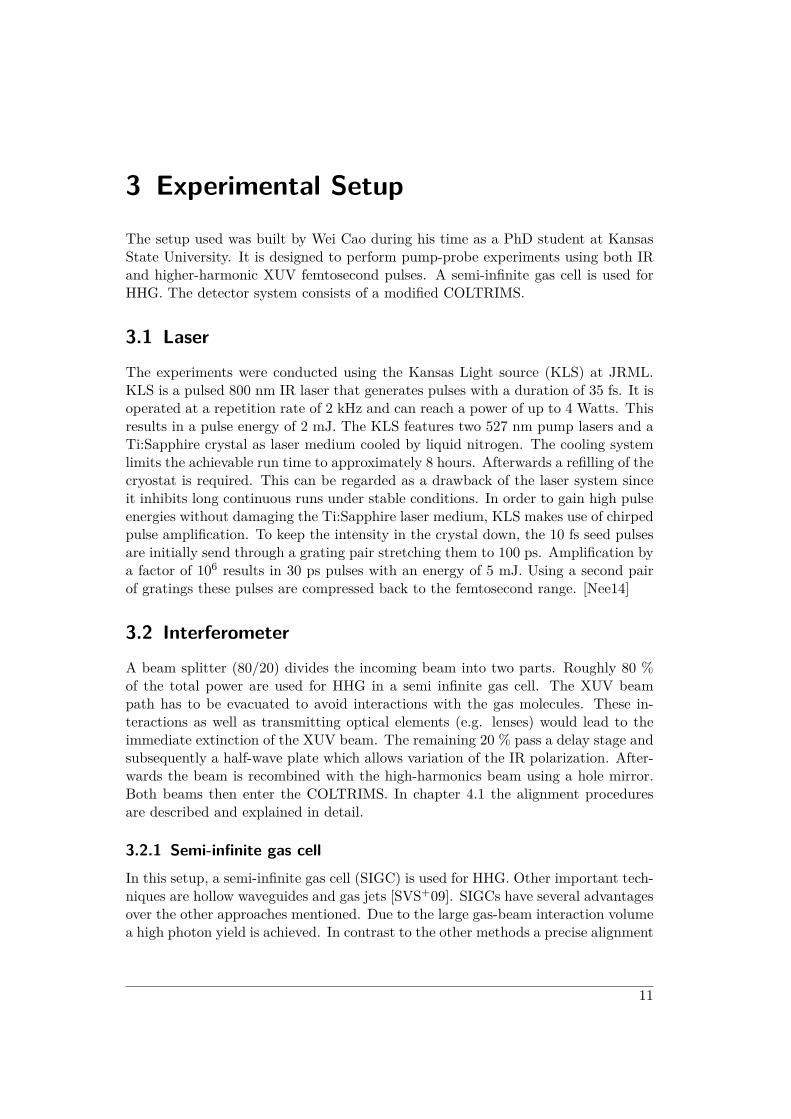
3.1 Schematic illustration of the pump-probe setup, modified from [Cao14] 123.2 From left to right: harmonics from 9th to 17th order as seen on the
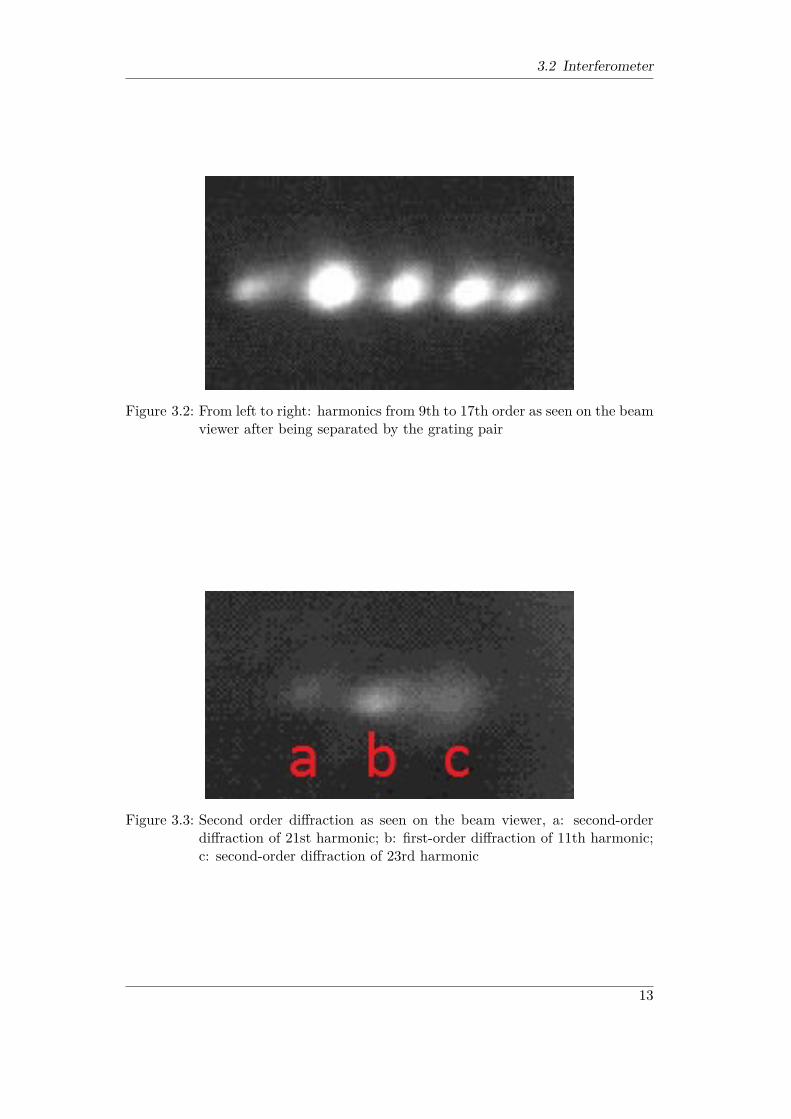
beam viewer after being separated by the grating pair . . . . . . . . 133.3 Second order diffraction as seen on the beam viewer, a: second-order
diffraction of 21st harmonic; b: first-order diffraction of 11th har-monic; c: second-order diffraction of 23rd harmonic . . . . . . . . . . 13
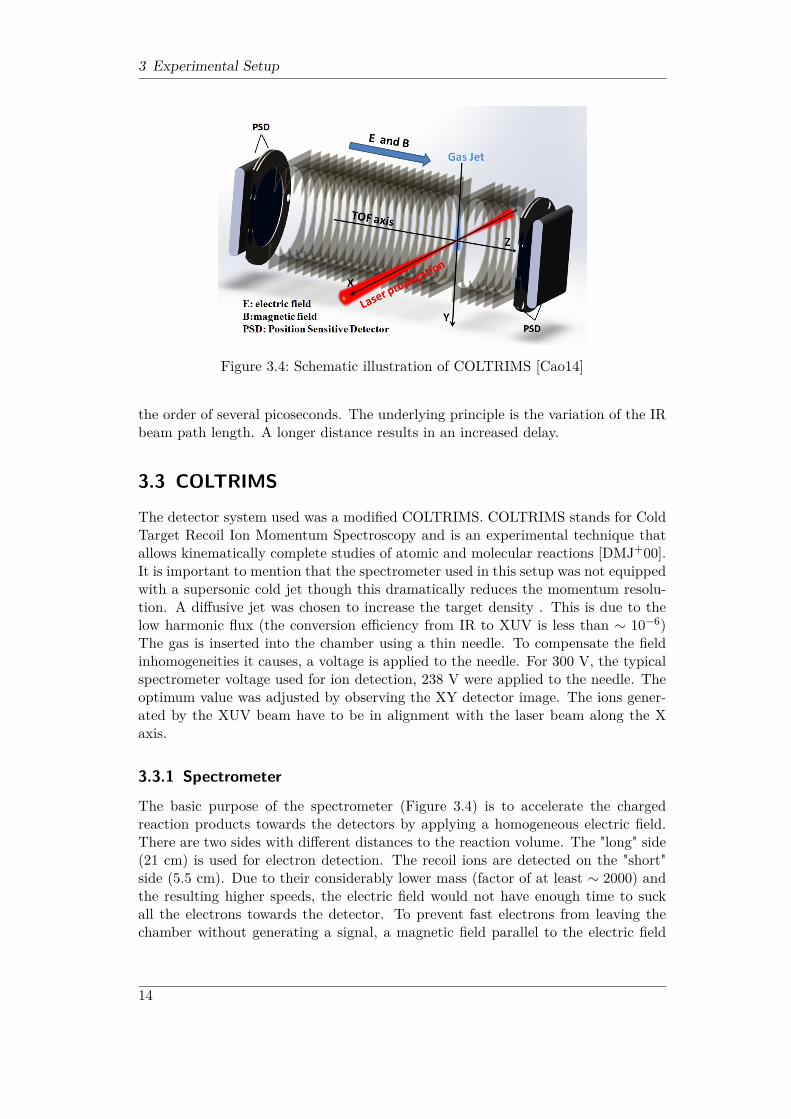
3.4 Schematic illustration of COLTRIMS [Cao14] . . . . . . . . . . . . . 143.5 Schematic illustration of a multichannel plate (MCP) [Cao14] . . . . 153.6 Schematic illustration of a delay-line anode [Cao14] . . . . . . . . . . 163.7 Diagram of the data acquisition electronics [Cao14] . . . . . . . . . . 17
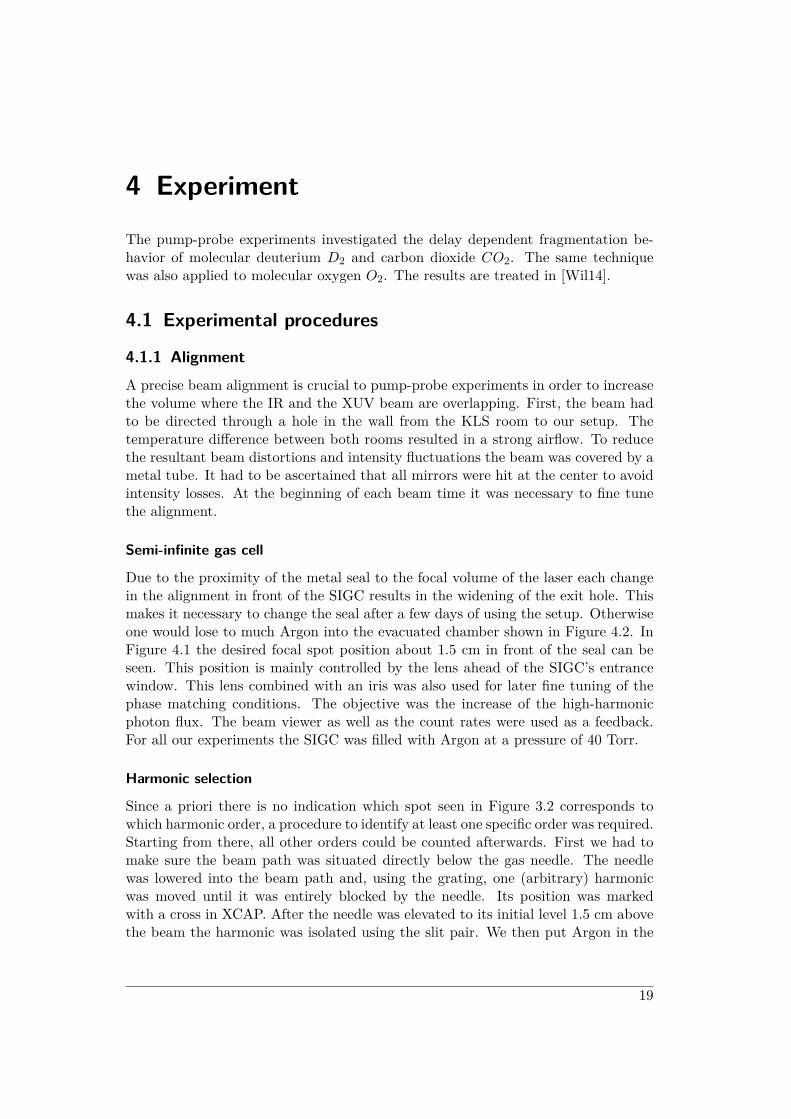
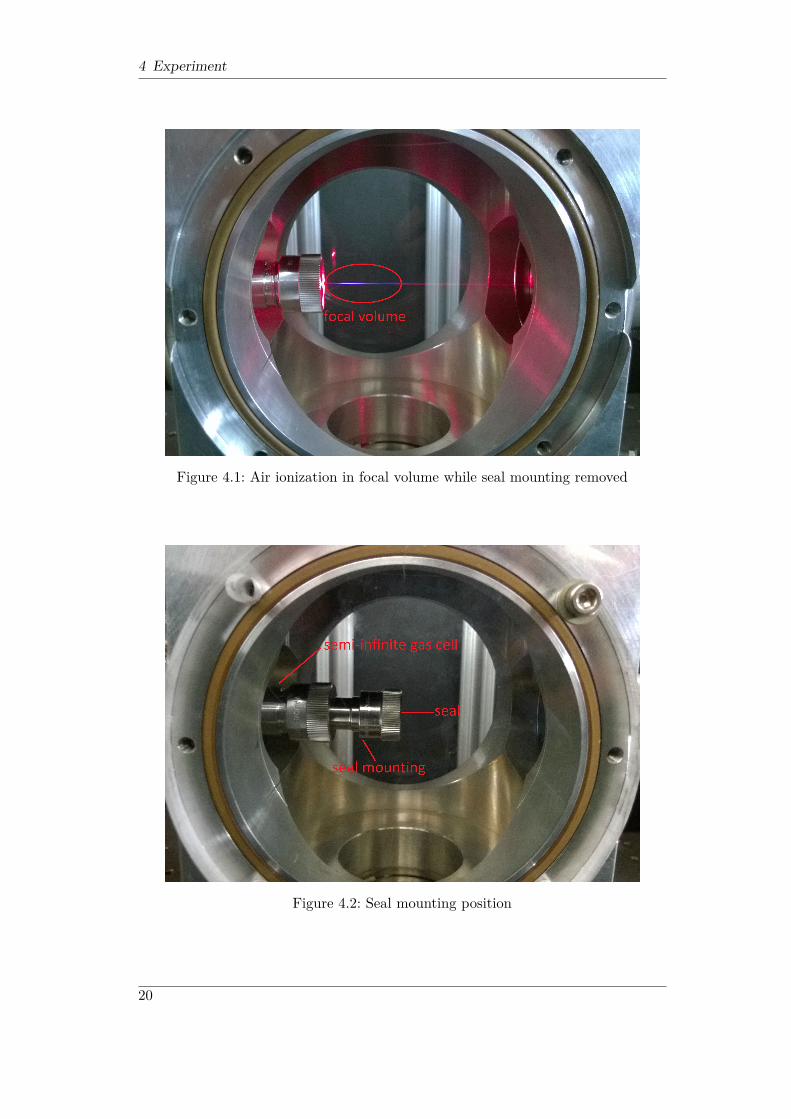
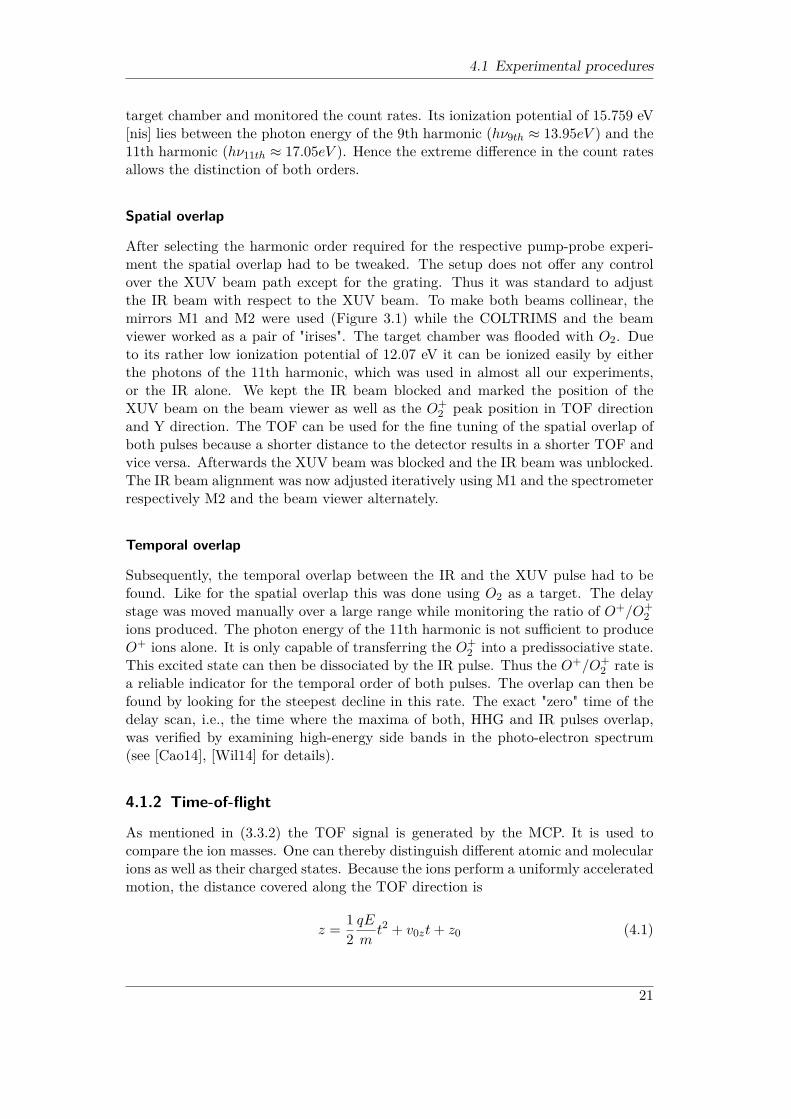
4.1 Air ionization in focal volume while seal mounting removed . . . . . 204.2 Seal mounting position . . . . . . . . . . . . . . . . . . . . . . . . . . 204.3 "wiggles" seen in Y vs. TOF spectrum; spectrometer voltage: 0V . . 224.4 Photoelectron energy spectrum for Argon; 11th harmonic; peak at
1.57 eV . . . . . . . . . . . . . . . . . . . . . . . . . . . . . . . . . . 234.5 Potential energy curves for D2 and D+
2 from [Cao14], the violet arrowindicates the photon energy of the 11th harmonic, the 1sσ state aswell as the D′1Πu states can be reached. . . . . . . . . . . . . . . . . 24
4.6 TOF spectrum D2 target, integrated over the entire IR delay range,11th harmonic IR-XUV delay scan, perpendicular polarization . . . 25
4.7 Y vs. TOF spectrum D2 target, integrated over the entire IR delayrange, 11th harmonic IR-XUV delay scan, perpendicular polarization 25
4.8 Y vs. TOF spectrum D2 target, integrated over the entire IR delayrange, 11th harmonic IR-XUV delay scan, parallel polarization . . . 26
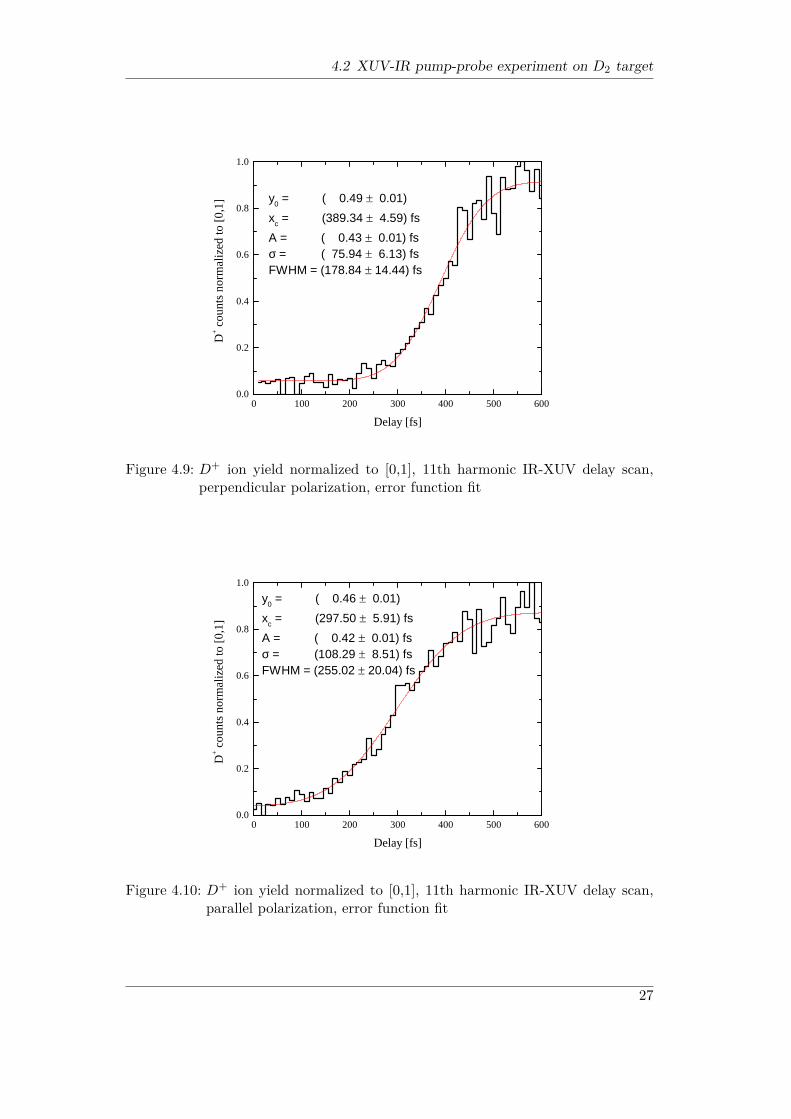
4.9 D+ ion yield normalized to [0,1], 11th harmonic IR-XUV delay scan,perpendicular polarization, error function fit . . . . . . . . . . . . . . 27
VII
LIST OF FIGURES
4.10 D+ ion yield normalized to [0,1], 11th harmonic IR-XUV delay scan,parallel polarization, error function fit . . . . . . . . . . . . . . . . . 27
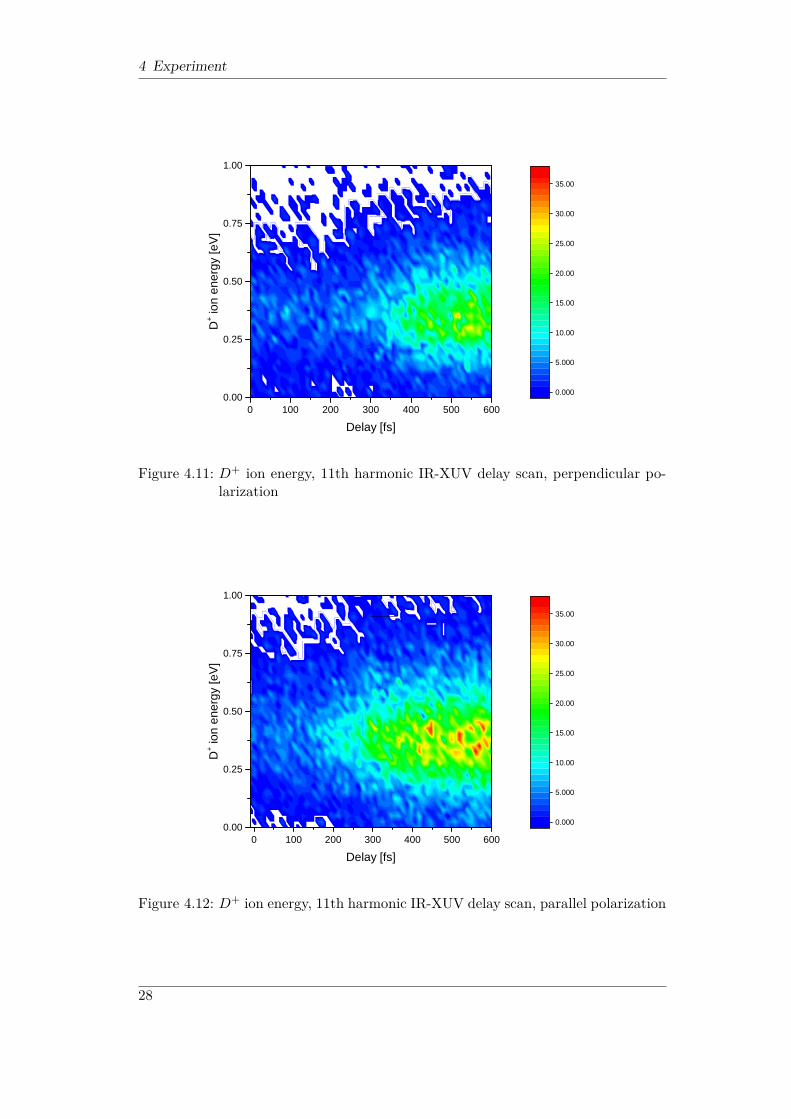
4.11 D+ ion energy, 11th harmonic IR-XUV delay scan, perpendicularpolarization . . . . . . . . . . . . . . . . . . . . . . . . . . . . . . . . 28
4.12 D+ ion energy, 11th harmonic IR-XUV delay scan, parallel polarization 284.13 Energy level diagram of ionized and neutral CO2 molecules as a func-
tion of the internuclear distance, modified from [YLJ+13] . . . . . . 304.14 CO2 potential energy curves as a function of the internuclear distance
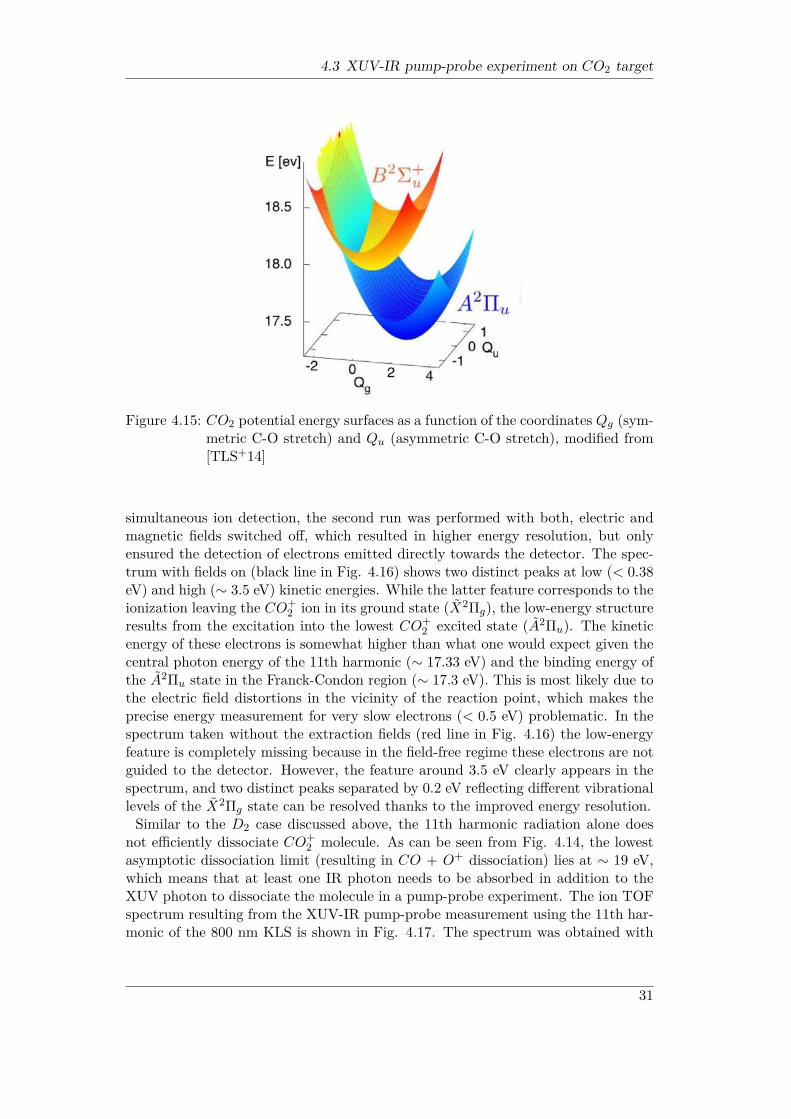
C-O, featuring different dissociation channels, from [ZKC85] . . . . . 304.15 CO2 potential energy surfaces as a function of the coordinates Qg
(symmetric C-O stretch) and Qu (asymmetric C-O stretch), modifiedfrom [TLS+14] . . . . . . . . . . . . . . . . . . . . . . . . . . . . . . 31
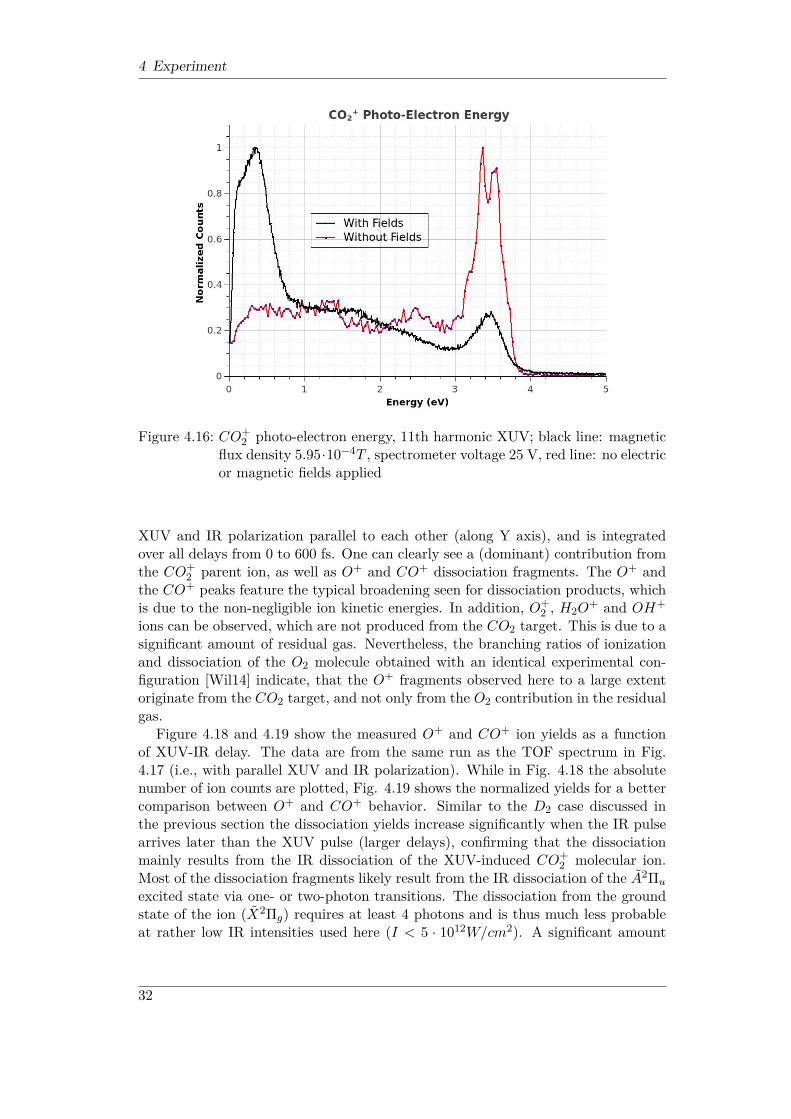
4.16 CO+2 photo-electron energy, 11th harmonic XUV; black line: mag-
netic flux density 5.95 · 10−4T , spectrometer voltage 25 V, red line:no electric or magnetic fields applied . . . . . . . . . . . . . . . . . . 32
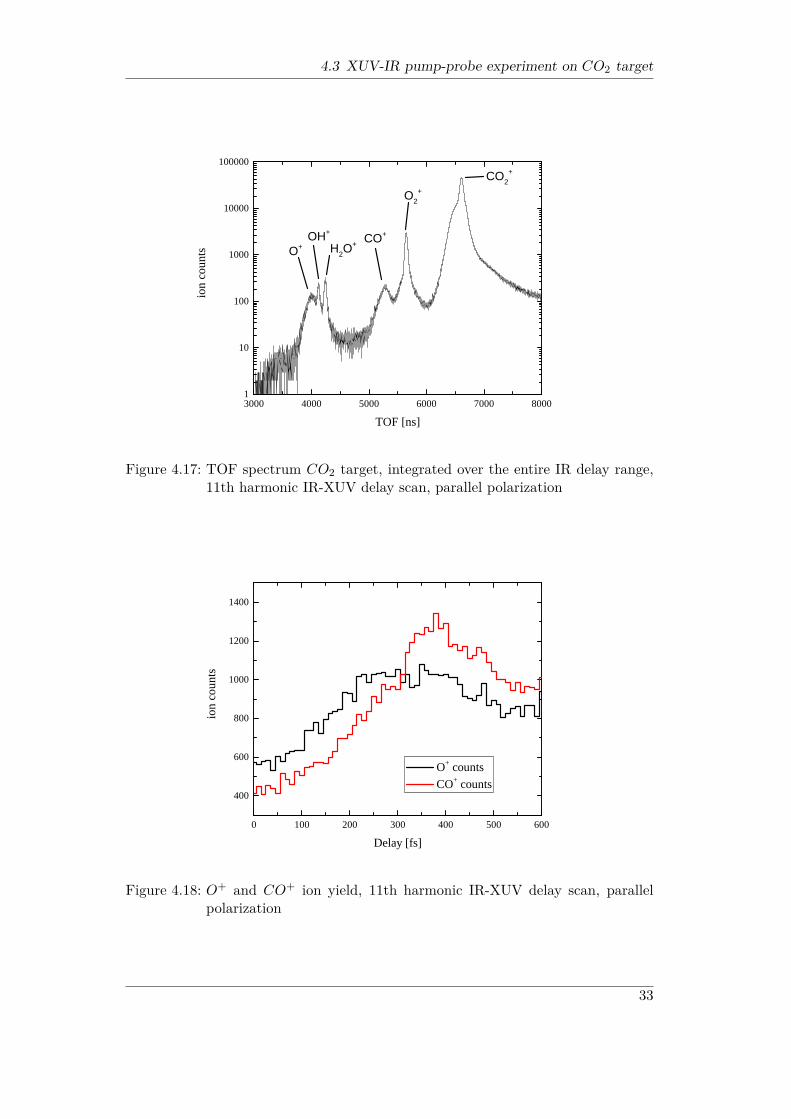
4.17 TOF spectrum CO2 target, integrated over the entire IR delay range,11th harmonic IR-XUV delay scan, parallel polarization . . . . . . . 33
4.18 O+ and CO+ ion yield, 11th harmonic IR-XUV delay scan, parallelpolarization . . . . . . . . . . . . . . . . . . . . . . . . . . . . . . . . 33
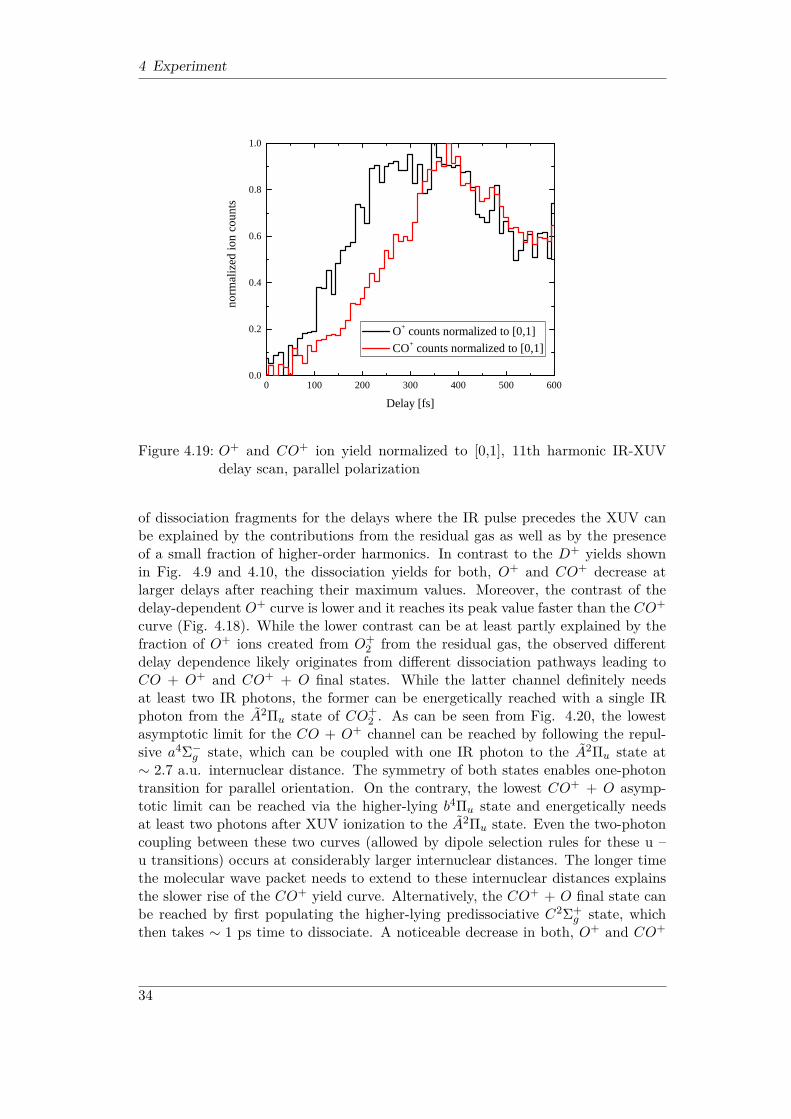
4.19 O+ and CO+ ion yield normalized to [0,1], 11th harmonic IR-XUVdelay scan, parallel polarization . . . . . . . . . . . . . . . . . . . . . 34
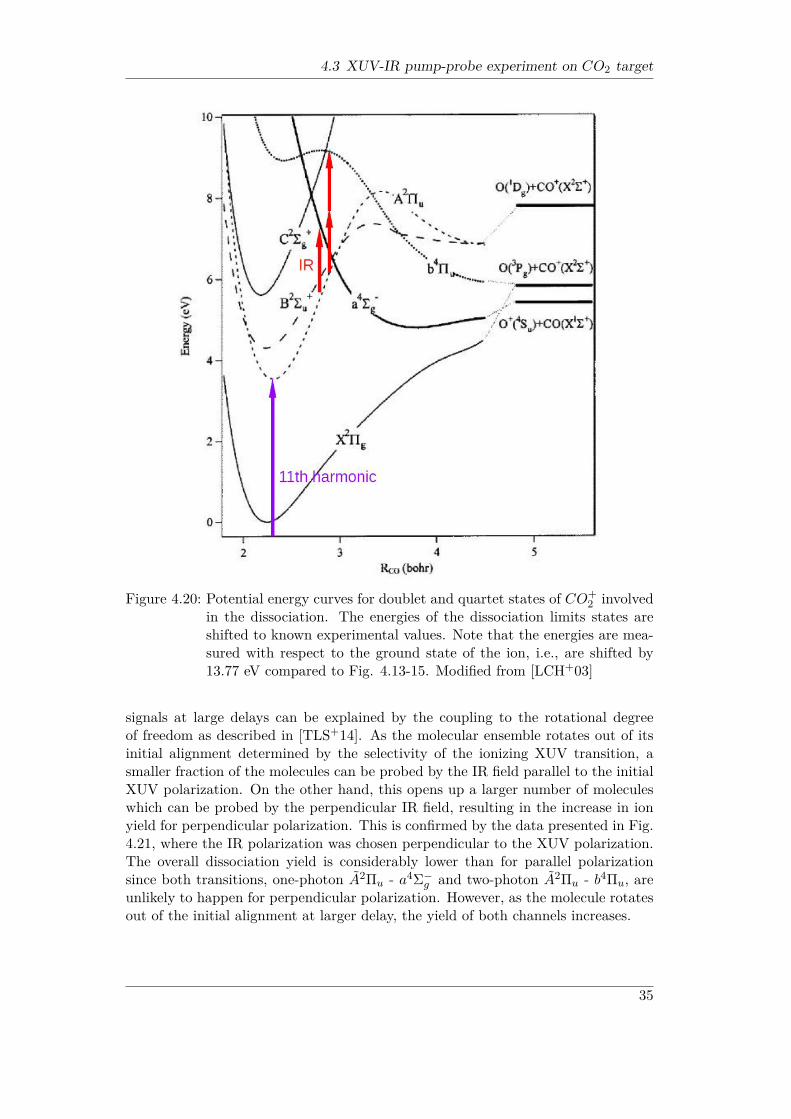
4.20 Potential energy curves for doublet and quartet states of CO+2 in-
volved in the dissociation. The energies of the dissociation limitsstates are shifted to known experimental values. Note that the ener-gies are measured with respect to the ground state of the ion, i.e., areshifted by 13.77 eV compared to Fig. 4.13-15. Modified from [LCH+03] 35
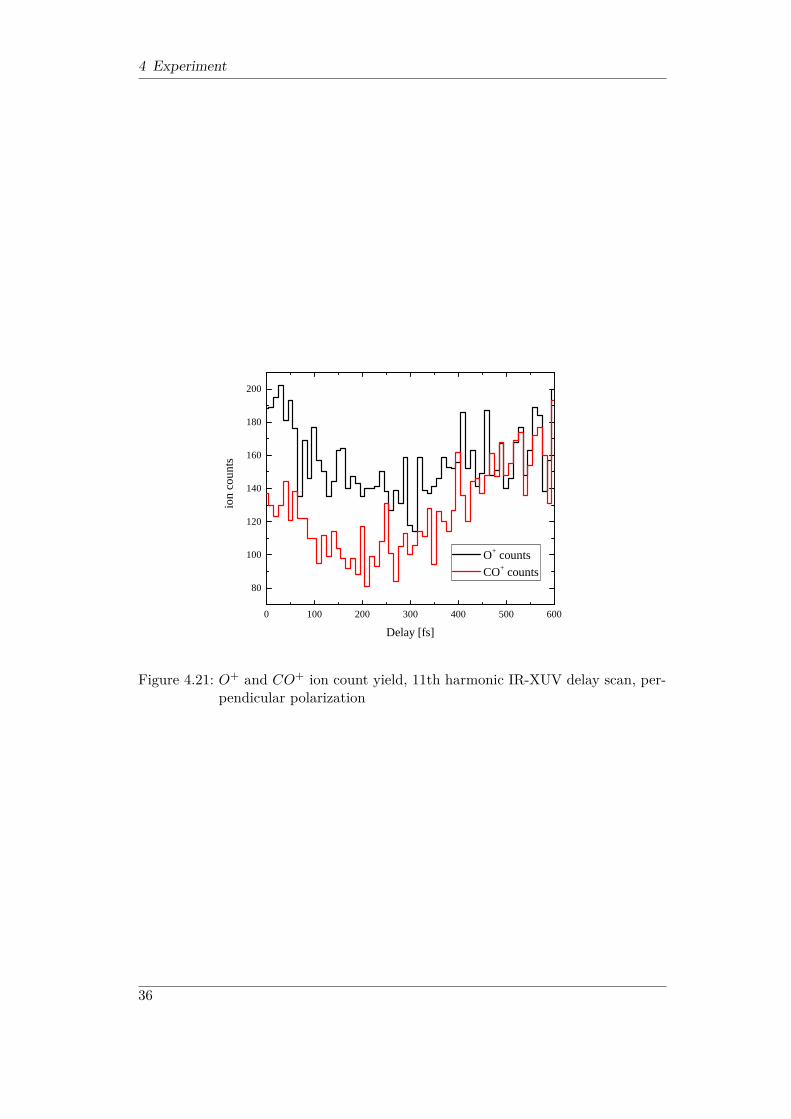
4.21 O+ and CO+ ion count yield, 11th harmonic IR-XUV delay scan,perpendicular polarization . . . . . . . . . . . . . . . . . . . . . . . . 36
VIII
1 Introduction
The development of quantum mechanics in the early 20th century revolutionizedthe understanding of the smallest constituents of our world. The idea of indivisi-ble elementary particles (atoms, Greek atomos) had been existing since the ancienttimes and it underwent many refinements. Especially the discovery of the electronby J.J. Thomson in 1897 and the distinction between nucleus and electron shell byErnest Rutherford in 1911 [Rut11] deepened the knowledge about the atomic innerstructure. These new insights simultaneously disproved the concept of indivisibilityand served as a basis for modern atomic and molecular physics. When Niels Bohrpostulated the existence of quantized electron orbits around the nucleus in 1913 thiswas regarded as analogous to the solar system. Only a few years later Louis deBroglie (1924) and Werner Heisenberg (1926) found that the microscopic world israther governed by probabilities and particles can be described as wave functions.This entirely new mathematical concept proved extremely beneficial to the presentday, but it took a long time until modern detector and spectrometer technologymade it possible to actually image these wave functions.Being quantum objects, molecules are also subject to the laws of wave mechanics.Their dynamics can be regarded as a combination of nuclear and electronic motions.The typical time scale for electronic dynamics is the attosecond (10−18s) regime.Due to their considerably higher mass, the nuclei are far slower. Relevant phe-nomena e.g. molecular vibrations typically take place on the femtosecond (10−15s)time scale and thus are referred to as femtochemistry. In recent years, moleculardynamics have become directly accessible to experiments. Especially the work of1999 Nobel price winner Ahmed Zewail laid the foundation for a new prosperousfield of research. This was made possible due to the development of lasers that arecapable of producing ultrashort pulses with a duration of only a few femtoseconds.Using these pulses in pump-probe experiments allows recording the time evolutionof molecular dynamics by altering the delay between two temporally separated laserpulses. The "pump" pulse excites the molecule until it is fragmented by the "probe"pulse.During a three-month stay at the James R. Macdonald Laboratory (JRML) of theKansas State University, Florian Wilhelm and I conducted pump-probe experimentson O2, D2 and CO2. High-harmonic generation (HHG) was used to produce the"pump" pulses by converting infrared (IR) laser pulses to extreme ultraviolet (XUV)light. The setup had been built by Wei Cao during his time as a PhD student atJRML. While Florian Wilhelm concentrated on the results for O2 in [Wil14], mythesis is focused on experiments on D2 and CO2 targets. The XUV photon en-ergy was adjusted to be just below the dissociation limit of the respective molecule.Hence at least one additional IR photon was required to dissociate the molecule.There are two fundamentally different mechanisms that lead to photo-dissociation
1

1 Introduction
of D2 referred to as bond-softening resp. ionization via super-excited states. In ourexperiment, it was possible to distinguish between both effects. Based on [TLS+14]the dissociation dynamics of CO2 was investigated. The time dependent O+ andCO+ ion yields were measured and different fragmentation channels were identi-fied. Additional data on the energy distribution of XUV-induced photo-electronswas taken.The results are discussed in the present thesis. In chapter 2 the theoretical back-ground for high-harmonic generation as well as the ionization mechanisms pertinentto the experiments are described. Chapter 3 deals with the setup and its properties.In the first part of chapter 4 I describe the experimental procedures and calibrationtechniques. The second part contains the results of the pump-probe experiments onD2 and CO2. These results are compared to theory and previous measurements.
2
2 Theoretical background
2.1 Electromagnetic wavesIn the absence of charges and currents the vacuum Maxwell equations can be de-coupled by applying the curl. This leads to the following wave equations [Gri98]:
∇E = µ0ε0∂2E∂t2
(2.1)
∇B = µ0ε0∂2B∂t2
(2.2)
Without loss of generality one can assume wave propagation along x direction. Fora monochromatic plane wave the solutions for (2.1) and (2.2) read:
E(x, t) = E0ei(kx−ωt) (2.3)
B(x, t) = B0ei(kx−ωt) (2.4)
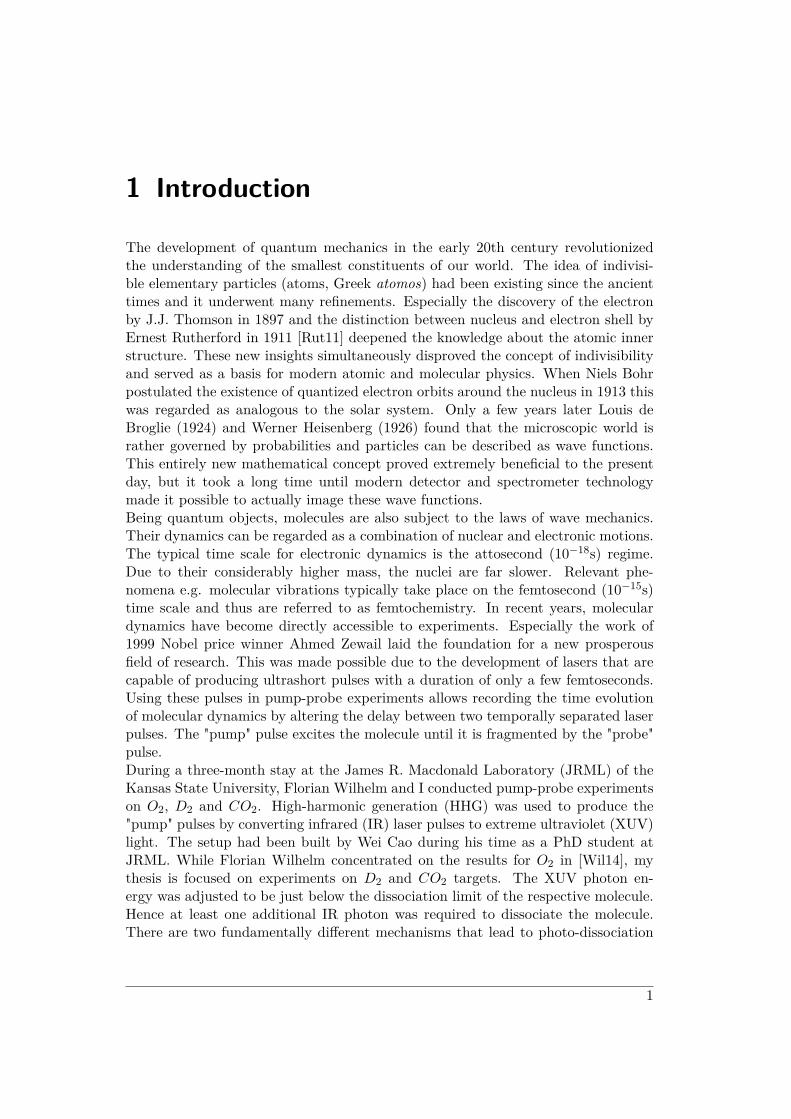
Due to the conditions ∇E = 0 and ∇B = 0 it follows that E0 and B0 are perpen-dicular to the propagation direction. As a consequence of Faraday’s law E0 and B0are also perpendicular and in phase with respect to each other (Figure 2.1).
2.2 Gaussian PulsesIn order to investigate ultrafast molecular dynamics, pulsed lasers are used. Es-pecially in pump-probe experiments a short pulse duration is desired. The moreprecisely the moment of the perturbation is known the higher is the temporal reso-lution the dynamics can be studied with. In good approximation the pulses have aGaussian shape in the temporal as well as the spatial domain. They can be describedas a superposition of plane waves. Again assuming propagation along x-directionthe equation for a Gaussian wave packet reads [Nol04]:
E(x, t) =∞∫−∞
b(k)ei(kx±ωt)dk (2.5)
with the weighting function
b(k) = 2√π∆k0
e
(4(k−k0)2
∆k20
)(2.6)
The Fourier transform of a Gaussian is a Gaussian itself. Thus for the ideal ("Fourier-transform limited) Gaussian pulse, spectral bandwidth and pulse duration are in-tertwined by [Cao14]:
∆t∆f = 0.44 (2.7)
3
2 Theoretical background
Figure 2.1: Electromagnetic plane wave, illustration from [Mur]
For example, a typical 35 fs pulse from the Kansas Light Source (KLS) has anenergetic bandwidth of 0.052 eV. Hence, the pulse might excite states on higherenergy levels than accessible by the nominal photon energy. It is important tomention that equation (2.7) does not apply to the XUV pulses produced by high-harmonic generation. Due to the chirp caused by the grating pair (chapter 3.2.2)the requirement of ideal Gaussian shape is not fulfilled.
2.3 High-Harmonic Generation
High-harmonic generation (HHG) is a nonlinear process that occurs in gaseous tar-gets irradiated by high intense laser fields. Thereby a portion of the incoming lightis converted to higher frequencies. The high-harmonic photon energies are integermultiples, referred to as "order", of the initial photon energy. The phenomenon canbe understood in different ways. While the Lewenstein model treats the problemin a fully quantum mechanical way, the "three-step model" offers a semiclassicaldescription that is sufficient for most applications. [LBI+94]
2.3.1 Three-step model
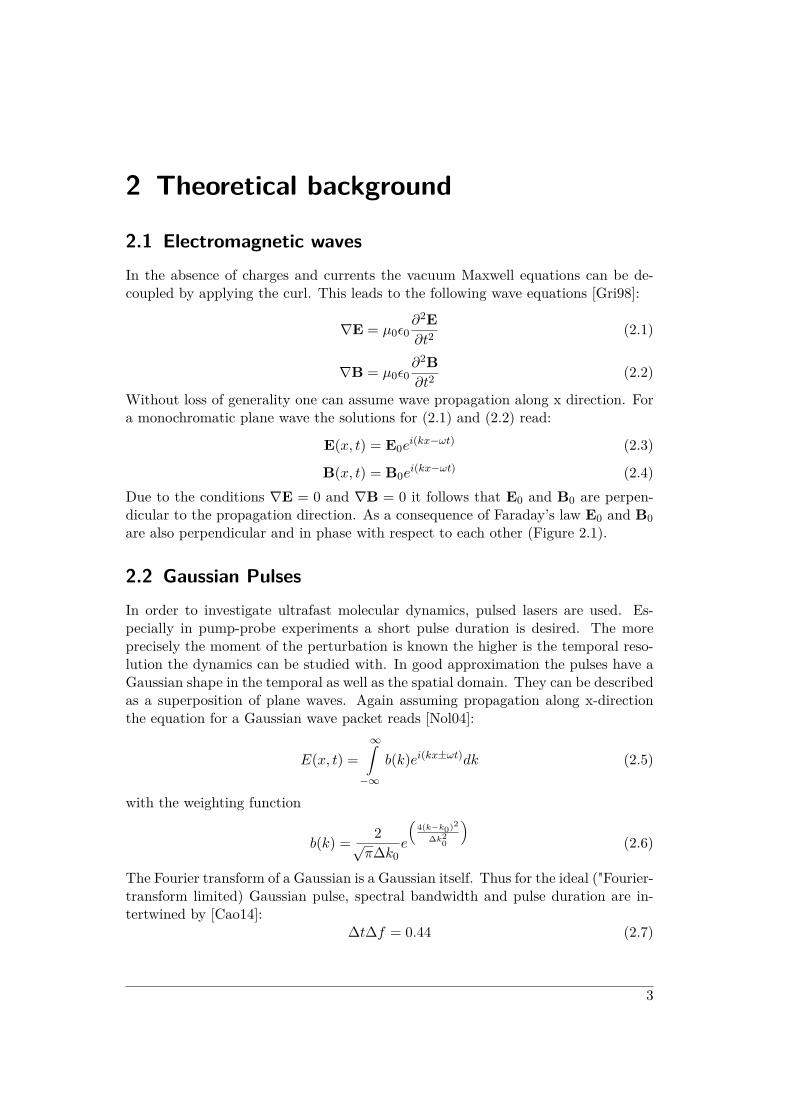
The laser field bends the atomic potential and thereby enables tunnel ionization.Once in the continuum, the electron follows classical trajectories governed by thefield and thus gains kinetic energy. The final step is the recombination of electronand ion. Due to the conservation of energy this process results in the emission of a
4
2.3 High-Harmonic Generation
Figure 2.2: Schematic depiction of the three-step model [Ish10]
photon. The energy Eγ of this photon can easily be calculated from:
Eγ = Ukin + Ip (2.8)
where Ip denotes the ionization potential and Ukin the kinetic energy of the elec-tron. The latter can be obtained by solving the classical equations of motion in thepresence of the oscillating electric field E(t) = E0cos(ωt) [Ish10]. Assuming that xis the direction of the electric field vector and that Θ = ωt the equation of motionfor the electron reads:
x(Θ) = qE0me
cos(Θ) (2.9)
Using the initial conditions for the time of ionization x(Θ0) = 0 and x(Θ0) = 0,twofold integration leads to
x(Θ) = qE0me
[(cos(Θ)− cos(Θ0)) + (Θ−Θ0)sin(Θ0)] (2.10)
By derivation of (2.10) one obtains the velocity and with that the kinetic energy ofthe electron at the moment of recombination:
Ekin = 12me
(eE0ω
)2(sin(Θr)− sin(Θ0))2 (2.11)
(2.11) can also be written in terms the ponderomotive energy Up = 14me
(eE0ω
)2:
Ekin = 2Up(sin(Θr)− sin(Θ0))2 (2.12)
Any pair of Θr and Θ0 that corresponds to a given Ekin at the moment of recom-bination has to satisfy x(Θr) = 0. For each energy value there exist two solutions:a short trajectory with (tr − t0) shorter than half a laser cycle and a long trajectory
5
2 Theoretical background
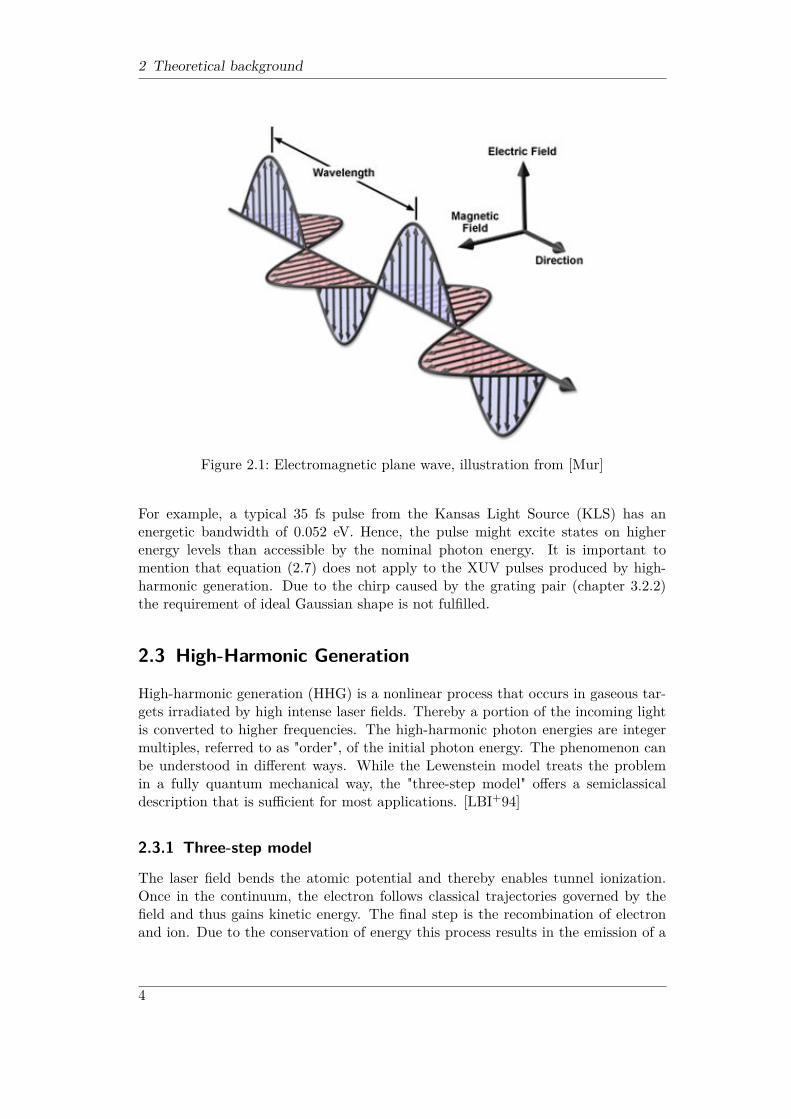
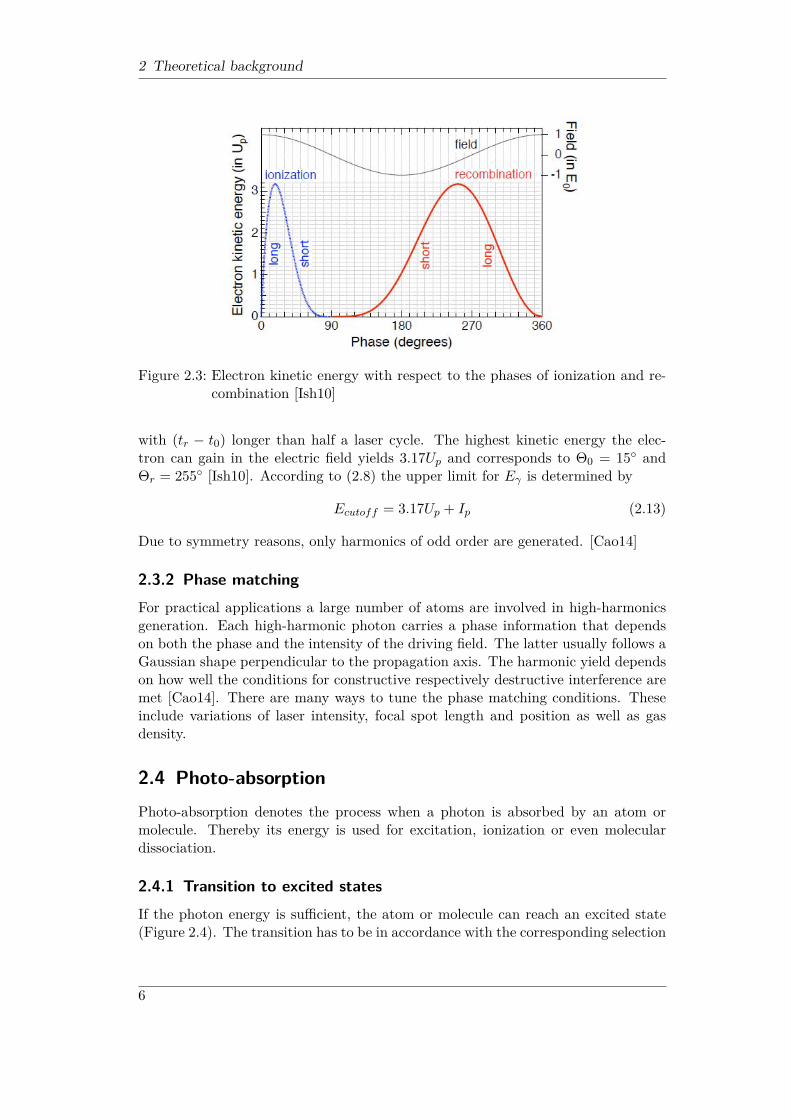
Figure 2.3: Electron kinetic energy with respect to the phases of ionization and re-combination [Ish10]
with (tr − t0) longer than half a laser cycle. The highest kinetic energy the elec-tron can gain in the electric field yields 3.17Up and corresponds to Θ0 = 15◦ andΘr = 255◦ [Ish10]. According to (2.8) the upper limit for Eγ is determined by
Ecutoff = 3.17Up + Ip (2.13)
Due to symmetry reasons, only harmonics of odd order are generated. [Cao14]
2.3.2 Phase matchingFor practical applications a large number of atoms are involved in high-harmonicsgeneration. Each high-harmonic photon carries a phase information that dependson both the phase and the intensity of the driving field. The latter usually follows aGaussian shape perpendicular to the propagation axis. The harmonic yield dependson how well the conditions for constructive respectively destructive interference aremet [Cao14]. There are many ways to tune the phase matching conditions. Theseinclude variations of laser intensity, focal spot length and position as well as gasdensity.
2.4 Photo-absorptionPhoto-absorption denotes the process when a photon is absorbed by an atom ormolecule. Thereby its energy is used for excitation, ionization or even moleculardissociation.
2.4.1 Transition to excited statesIf the photon energy is sufficient, the atom or molecule can reach an excited state(Figure 2.4). The transition has to be in accordance with the corresponding selection
6
2.4 Photo-absorption
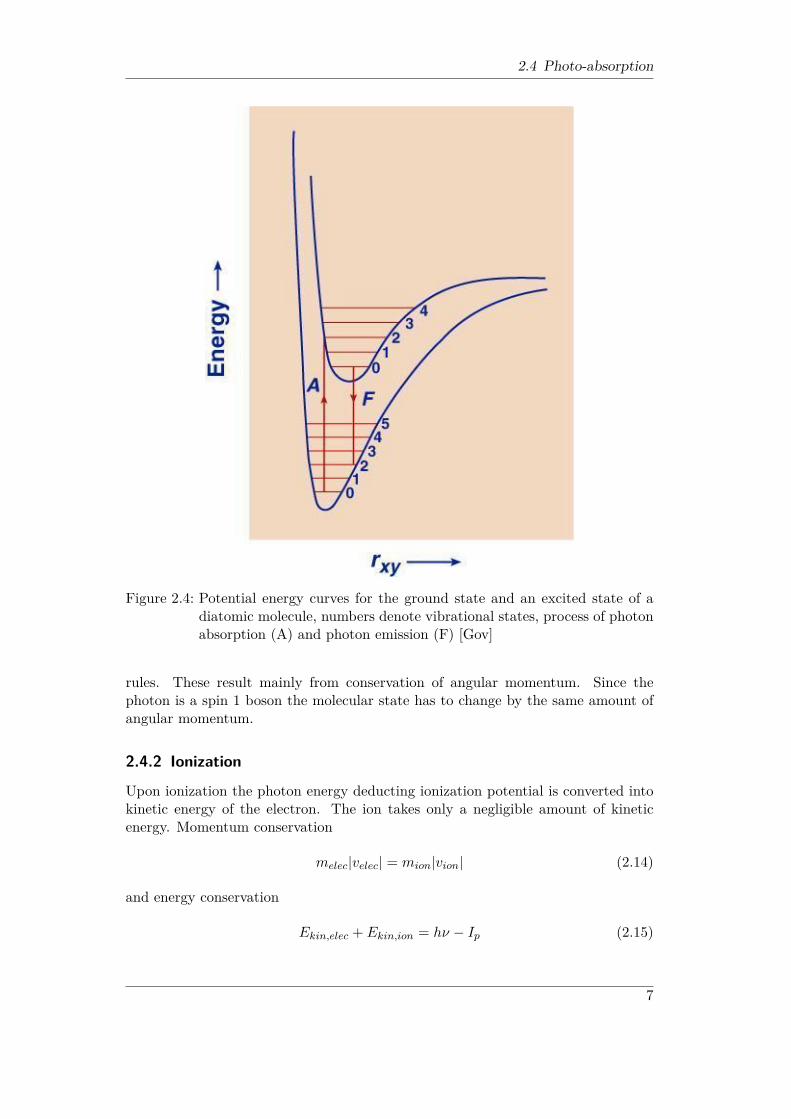
Figure 2.4: Potential energy curves for the ground state and an excited state of adiatomic molecule, numbers denote vibrational states, process of photonabsorption (A) and photon emission (F) [Gov]
rules. These result mainly from conservation of angular momentum. Since thephoton is a spin 1 boson the molecular state has to change by the same amount ofangular momentum.
2.4.2 Ionization
Upon ionization the photon energy deducting ionization potential is converted intokinetic energy of the electron. The ion takes only a negligible amount of kineticenergy. Momentum conservation
melec|velec| = mion|vion| (2.14)
and energy conservation
Ekin,elec + Ekin,ion = hν − Ip (2.15)
7
2 Theoretical background
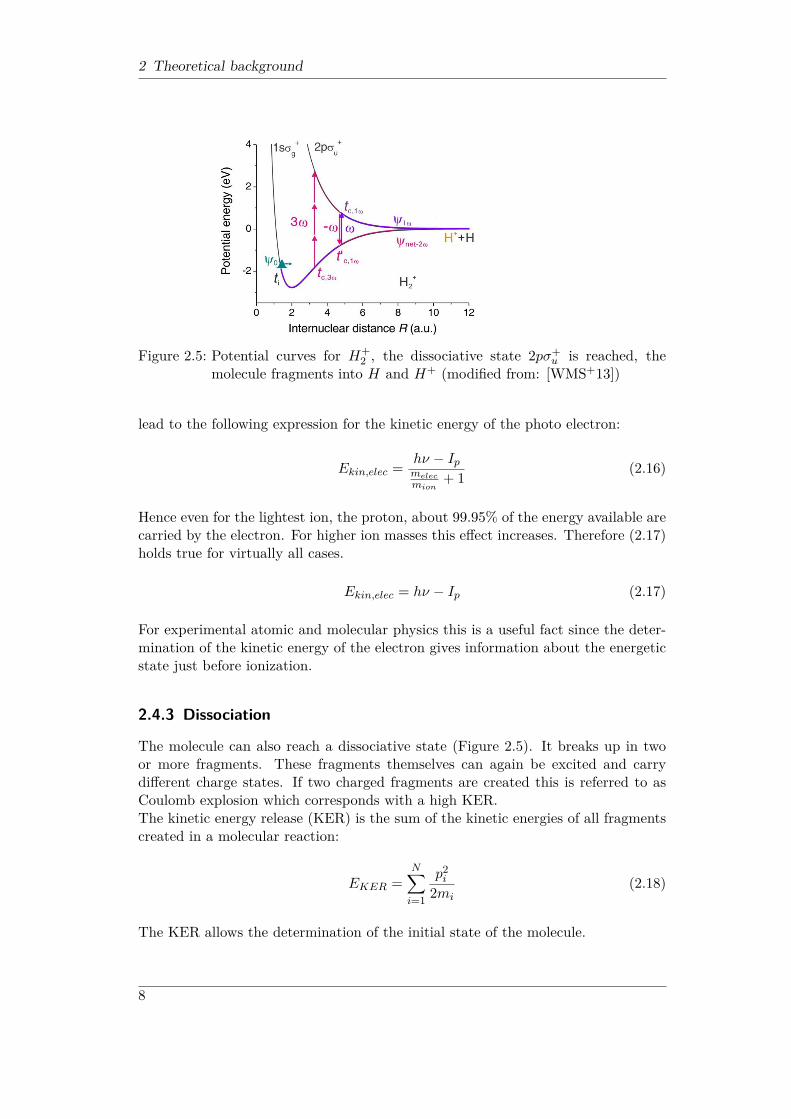
Figure 2.5: Potential curves for H+2 , the dissociative state 2pσ+
u is reached, themolecule fragments into H and H+ (modified from: [WMS+13])
lead to the following expression for the kinetic energy of the photo electron:
Ekin,elec = hν − Ipmelecmion
+ 1 (2.16)
Hence even for the lightest ion, the proton, about 99.95% of the energy available arecarried by the electron. For higher ion masses this effect increases. Therefore (2.17)holds true for virtually all cases.
Ekin,elec = hν − Ip (2.17)
For experimental atomic and molecular physics this is a useful fact since the deter-mination of the kinetic energy of the electron gives information about the energeticstate just before ionization.
2.4.3 Dissociation
The molecule can also reach a dissociative state (Figure 2.5). It breaks up in twoor more fragments. These fragments themselves can again be excited and carrydifferent charge states. If two charged fragments are created this is referred to asCoulomb explosion which corresponds with a high KER.The kinetic energy release (KER) is the sum of the kinetic energies of all fragmentscreated in a molecular reaction:
EKER =N∑i=1
p2i
2mi(2.18)
The KER allows the determination of the initial state of the molecule.
8
2.5 Multi-photon absorption
Ip
Pot
ent
ial e
ner
gy
ground state
hν
hν
hν
hν
hν
hν
hν
hν
Ekin
(electron)
Ekin
(electron)
Figure 2.6: Schematic depiction of above-threshold ionization (ATI), the peaks inthe electron energy are separated by hν.
2.5 Multi-photon absorption
In highly intense laser fields it is possible to reach states that are on higher energylevels than accessible to a single photon. Thereby the photons populate extremelyshort-lived virtual states. The selection rules mentioned before also apply to multi-photon processes.
2.5.1 Above-threshold ionization
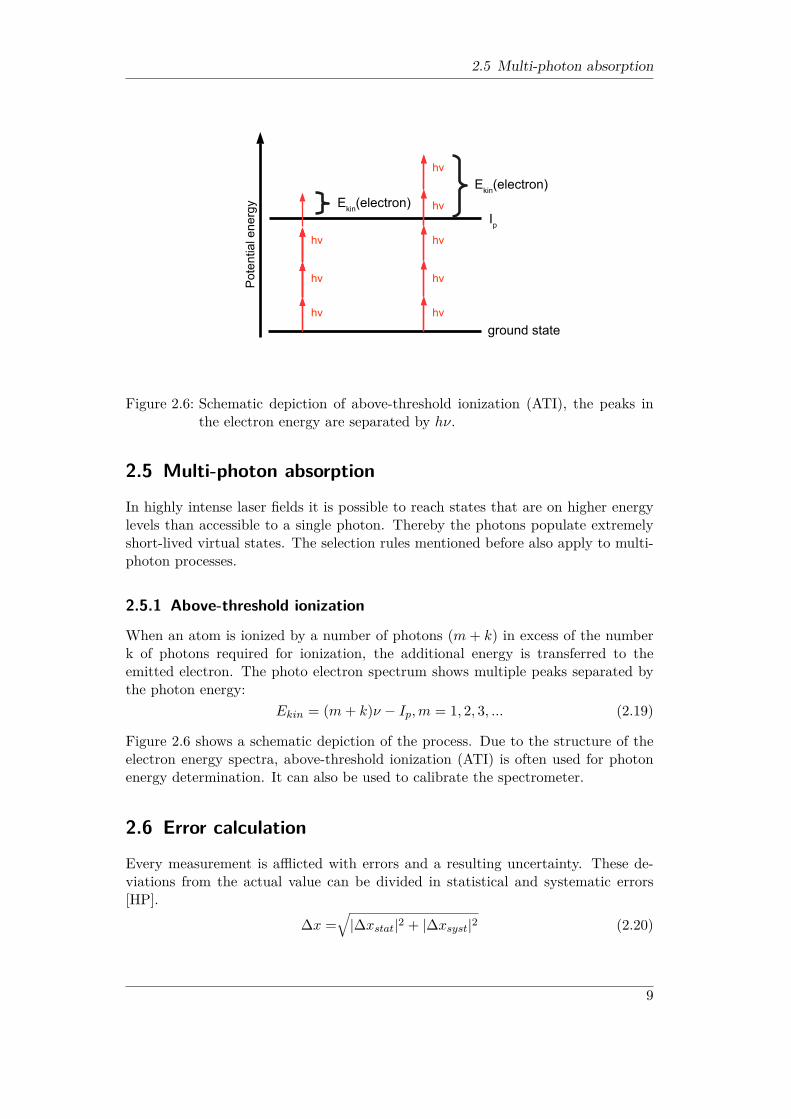
When an atom is ionized by a number of photons (m + k) in excess of the numberk of photons required for ionization, the additional energy is transferred to theemitted electron. The photo electron spectrum shows multiple peaks separated bythe photon energy:
Ekin = (m+ k)ν − Ip,m = 1, 2, 3, ... (2.19)
Figure 2.6 shows a schematic depiction of the process. Due to the structure of theelectron energy spectra, above-threshold ionization (ATI) is often used for photonenergy determination. It can also be used to calibrate the spectrometer.
2.6 Error calculation
Every measurement is afflicted with errors and a resulting uncertainty. These de-viations from the actual value can be divided in statistical and systematic errors[HP].
∆x =√|∆xstat|2 + |∆xsyst|2 (2.20)
9
2 Theoretical background
2.6.1 Statistical errorStatistical errors result from fluctuations and random perturbations to the experi-ment e.g. electronic noise, temperature fluctuations etc. The expectation value canbe calculated using the arithmetic average of n measurements:
Xn = 1n
n∑i=1
xi (2.21)
The measured values are usually normally distributed around the expectation valuewith the standard derivation σ:
Sn =
√√√√ 1n− 1
n∑i=1
(xi − Xn)2 (2.22)
This value can be used to calculate the standard deviation from the mean andthereby the uncertainty of the measurement result:
sn = Sn√n
(2.23)
As one can see the error is directly connected to the number of measurements.
2.6.2 Systematic errorSystematic errors can result from wrong calibration as well as intrinsic inaccuracyof the equipment use. It is also possible that the experimental setup itself induceseffects that are mistaken as "real" results.
2.6.3 Error propagationSince experimental results are rarely directly measured it is important to quantify theerror for cases where the desired value is calculated from a function f(x(1), x(2), ...x(N)).If the variables x(1), x(2), ...x(N) are uncorrelated the Gaussian error propagation canbe used:
∆f =
√√√√ N∑k=1
(∂f
∂x(k) ∆x(k))2
(2.24)
10
3 Experimental Setup
The setup used was built by Wei Cao during his time as a PhD student at KansasState University. It is designed to perform pump-probe experiments using both IRand higher-harmonic XUV femtosecond pulses. A semi-infinite gas cell is used forHHG. The detector system consists of a modified COLTRIMS.
3.1 Laser
The experiments were conducted using the Kansas Light source (KLS) at JRML.KLS is a pulsed 800 nm IR laser that generates pulses with a duration of 35 fs. It isoperated at a repetition rate of 2 kHz and can reach a power of up to 4 Watts. Thisresults in a pulse energy of 2 mJ. The KLS features two 527 nm pump lasers and aTi:Sapphire crystal as laser medium cooled by liquid nitrogen. The cooling systemlimits the achievable run time to approximately 8 hours. Afterwards a refilling of thecryostat is required. This can be regarded as a drawback of the laser system sinceit inhibits long continuous runs under stable conditions. In order to gain high pulseenergies without damaging the Ti:Sapphire laser medium, KLS makes use of chirpedpulse amplification. To keep the intensity in the crystal down, the 10 fs seed pulsesare initially send through a grating pair stretching them to 100 ps. Amplification bya factor of 106 results in 30 ps pulses with an energy of 5 mJ. Using a second pairof gratings these pulses are compressed back to the femtosecond range. [Nee14]
3.2 Interferometer
A beam splitter (80/20) divides the incoming beam into two parts. Roughly 80 %of the total power are used for HHG in a semi infinite gas cell. The XUV beampath has to be evacuated to avoid interactions with the gas molecules. These in-teractions as well as transmitting optical elements (e.g. lenses) would lead to theimmediate extinction of the XUV beam. The remaining 20 % pass a delay stage andsubsequently a half-wave plate which allows variation of the IR polarization. After-wards the beam is recombined with the high-harmonics beam using a hole mirror.Both beams then enter the COLTRIMS. In chapter 4.1 the alignment proceduresare described and explained in detail.
3.2.1 Semi-infinite gas cellIn this setup, a semi-infinite gas cell (SIGC) is used for HHG. Other important tech-niques are hollow waveguides and gas jets [SVS+09]. SIGCs have several advantagesover the other approaches mentioned. Due to the large gas-beam interaction volumea high photon yield is achieved. In contrast to the other methods a precise alignment
11

3 Experimental Setup
Figure 3.1: Schematic illustration of the pump-probe setup, modified from [Cao14]
is not required. In principle a SIGC consists of a simple gas-filled metal tube witha length large compared to the Rayleigh length. Therefore it can be considered asinfinite. The SIGC used in our setup has a length of 30 cm. The laser beam entersthe cell through a window. The harmonics exit on the rear end through a hole ina metal seal. This hole is created by the focused laser beam itself as part of thealignment process (Figure 4.1.1).
3.2.2 Grating pairThe SIGC produces harmonics with a large variety of orders. For most experimentsit is necessary to isolate a specific photon energy. Hence a grating pair is usedto separate the harmonics (Figure 3.2) and to scatter away remaining IR light.Selection of a single harmonic was then performed by using a beam viewer at the farend of the setup located behind the COLTRIMS. It is comprised of a phosphorusscreen with a preceding MCP. The image is filmed by a CCD. The camera softwareXCAP also features the possibility to mark positions. An adjustable slit was usedto block all harmonics except one out. It is important to consider that using thegrating pair results in a spatial chirp i.e. a space - dependent deviation of the photonenergy within a single harmonic. Another effect is higher-order diffraction depictedin Figure 3.3. It follows directly from Bragg’s law [Bra13]:
nλ = 2dsin(Θ) (3.1)
n = 1, 2, 3, ... is the diffraction order, λ the wavelength, d the lattice constant and θthe diffraction angle. It is obvious that different combinations of n and λ can resultin the same diffraction angle.
3.2.3 Delay stageThe piezo-driven delay stage has a range of 600 fs and is controlled by a LabVIEWprogram. It is mounted on a manually adjustable platform which allows changes in
12
3.2 Interferometer
Figure 3.2: From left to right: harmonics from 9th to 17th order as seen on the beamviewer after being separated by the grating pair
Figure 3.3: Second order diffraction as seen on the beam viewer, a: second-orderdiffraction of 21st harmonic; b: first-order diffraction of 11th harmonic;c: second-order diffraction of 23rd harmonic
13
3 Experimental Setup
Figure 3.4: Schematic illustration of COLTRIMS [Cao14]
the order of several picoseconds. The underlying principle is the variation of the IRbeam path length. A longer distance results in an increased delay.
3.3 COLTRIMS
The detector system used was a modified COLTRIMS. COLTRIMS stands for ColdTarget Recoil Ion Momentum Spectroscopy and is an experimental technique thatallows kinematically complete studies of atomic and molecular reactions [DMJ+00].It is important to mention that the spectrometer used in this setup was not equippedwith a supersonic cold jet though this dramatically reduces the momentum resolu-tion. A diffusive jet was chosen to increase the target density . This is due to thelow harmonic flux (the conversion efficiency from IR to XUV is less than ∼ 10−6)The gas is inserted into the chamber using a thin needle. To compensate the fieldinhomogeneities it causes, a voltage is applied to the needle. For 300 V, the typicalspectrometer voltage used for ion detection, 238 V were applied to the needle. Theoptimum value was adjusted by observing the XY detector image. The ions gener-ated by the XUV beam have to be in alignment with the laser beam along the Xaxis.
3.3.1 Spectrometer
The basic purpose of the spectrometer (Figure 3.4) is to accelerate the chargedreaction products towards the detectors by applying a homogeneous electric field.There are two sides with different distances to the reaction volume. The "long" side(21 cm) is used for electron detection. The recoil ions are detected on the "short"side (5.5 cm). Due to their considerably lower mass (factor of at least ∼ 2000) andthe resulting higher speeds, the electric field would not have enough time to suckall the electrons towards the detector. To prevent fast electrons from leaving thechamber without generating a signal, a magnetic field parallel to the electric field
14
3.3 COLTRIMS
Figure 3.5: Schematic illustration of a multichannel plate (MCP) [Cao14]
is applied. It forces the electrons on a cyclotron trajectory towards the electrondetector.
3.3.2 DetectorThe detectors on each side of the spectrometer are composed of a microchannel plate(MCP) and a subsequent position sensitive delay line anode.
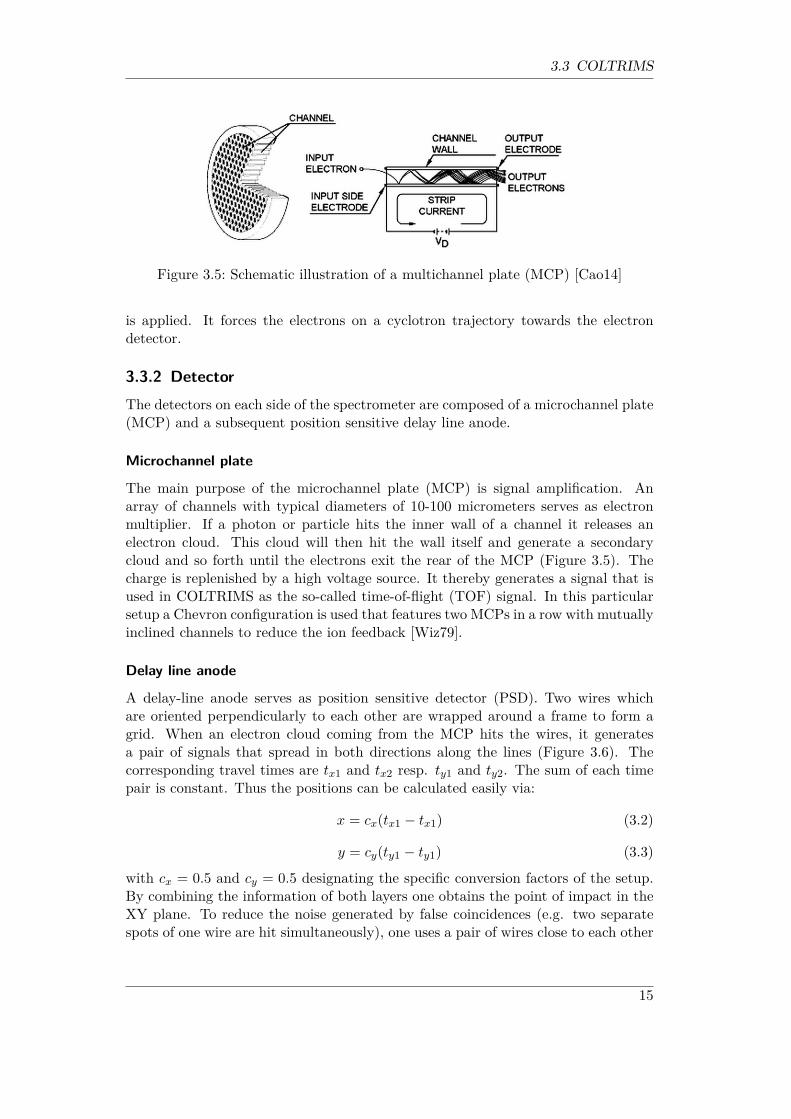
Microchannel plate
The main purpose of the microchannel plate (MCP) is signal amplification. Anarray of channels with typical diameters of 10-100 micrometers serves as electronmultiplier. If a photon or particle hits the inner wall of a channel it releases anelectron cloud. This cloud will then hit the wall itself and generate a secondarycloud and so forth until the electrons exit the rear of the MCP (Figure 3.5). Thecharge is replenished by a high voltage source. It thereby generates a signal that isused in COLTRIMS as the so-called time-of-flight (TOF) signal. In this particularsetup a Chevron configuration is used that features two MCPs in a row with mutuallyinclined channels to reduce the ion feedback [Wiz79].
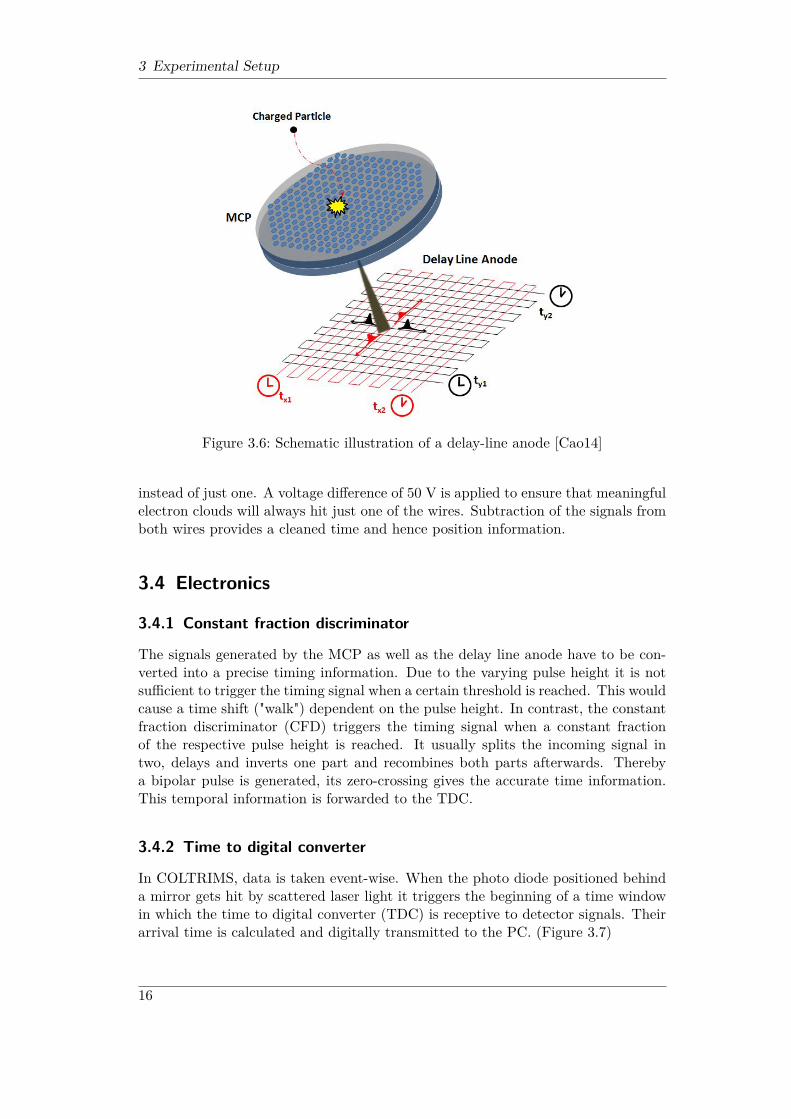
Delay line anode
A delay-line anode serves as position sensitive detector (PSD). Two wires whichare oriented perpendicularly to each other are wrapped around a frame to form agrid. When an electron cloud coming from the MCP hits the wires, it generatesa pair of signals that spread in both directions along the lines (Figure 3.6). Thecorresponding travel times are tx1 and tx2 resp. ty1 and ty2. The sum of each timepair is constant. Thus the positions can be calculated easily via:
x = cx(tx1 − tx1) (3.2)
y = cy(ty1 − ty1) (3.3)
with cx = 0.5 and cy = 0.5 designating the specific conversion factors of the setup.By combining the information of both layers one obtains the point of impact in theXY plane. To reduce the noise generated by false coincidences (e.g. two separatespots of one wire are hit simultaneously), one uses a pair of wires close to each other
15
3 Experimental Setup
Figure 3.6: Schematic illustration of a delay-line anode [Cao14]
instead of just one. A voltage difference of 50 V is applied to ensure that meaningfulelectron clouds will always hit just one of the wires. Subtraction of the signals fromboth wires provides a cleaned time and hence position information.
3.4 Electronics
3.4.1 Constant fraction discriminator
The signals generated by the MCP as well as the delay line anode have to be con-verted into a precise timing information. Due to the varying pulse height it is notsufficient to trigger the timing signal when a certain threshold is reached. This wouldcause a time shift ("walk") dependent on the pulse height. In contrast, the constantfraction discriminator (CFD) triggers the timing signal when a constant fractionof the respective pulse height is reached. It usually splits the incoming signal intwo, delays and inverts one part and recombines both parts afterwards. Therebya bipolar pulse is generated, its zero-crossing gives the accurate time information.This temporal information is forwarded to the TDC.
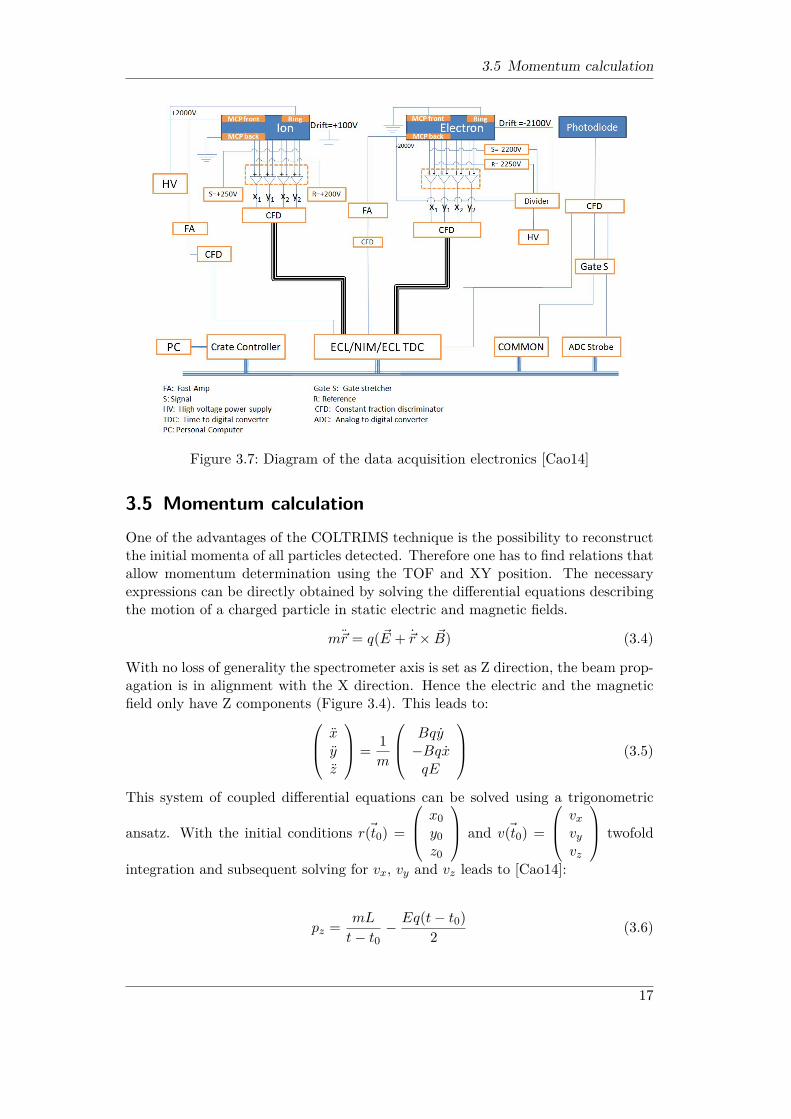
3.4.2 Time to digital converter
In COLTRIMS, data is taken event-wise. When the photo diode positioned behinda mirror gets hit by scattered laser light it triggers the beginning of a time windowin which the time to digital converter (TDC) is receptive to detector signals. Theirarrival time is calculated and digitally transmitted to the PC. (Figure 3.7)
16
3.5 Momentum calculation
Figure 3.7: Diagram of the data acquisition electronics [Cao14]
3.5 Momentum calculationOne of the advantages of the COLTRIMS technique is the possibility to reconstructthe initial momenta of all particles detected. Therefore one has to find relations thatallow momentum determination using the TOF and XY position. The necessaryexpressions can be directly obtained by solving the differential equations describingthe motion of a charged particle in static electric and magnetic fields.
m~r = q( ~E + ~r × ~B) (3.4)
With no loss of generality the spectrometer axis is set as Z direction, the beam prop-agation is in alignment with the X direction. Hence the electric and the magneticfield only have Z components (Figure 3.4). This leads to: x
yz
= 1m
Bqy−BqxqE
(3.5)
This system of coupled differential equations can be solved using a trigonometric
ansatz. With the initial conditions ~r(t0) =
x0y0z0
and ~v(t0) =
vxvyvz
twofold
integration and subsequent solving for vx, vy and vz leads to [Cao14]:
pz = mL
t− t0− Eq(t− t0)
2 (3.6)
17
3 Experimental Setup
px = mω
2
[(x− x0) cot
(mω
2
)+ (y − y0)
](3.7)
py = mω
2
[(y − y0) cot
(mω
2
)+ (x− x0)
](3.8)
ω = Bq
m(3.9)
In equation (3.6) L denotes the distance from the interaction region to the detector.Due to the much higher mass-to-charge ratio, these equations simplify for ions to:
px = x− x0t− t0
(3.10)
py = y − y0t− t0
(3.11)
The effects of the magnetic field on the ion trajectory can be neglected.
3.6 SoftwareThe program Spectcl developed by NSCL was used for on line as well as for offline analysis and data recording. The data is stored event by event in the so-calledlist-mode format, and can be resorted with any necessary conditions on any of therecorded or calculated quantities. The program allows the creation of 1d and 2dspectra.
18
4 Experiment
The pump-probe experiments investigated the delay dependent fragmentation be-havior of molecular deuterium D2 and carbon dioxide CO2. The same techniquewas also applied to molecular oxygen O2. The results are treated in [Wil14].
4.1 Experimental procedures
4.1.1 AlignmentA precise beam alignment is crucial to pump-probe experiments in order to increasethe volume where the IR and the XUV beam are overlapping. First, the beam hadto be directed through a hole in the wall from the KLS room to our setup. Thetemperature difference between both rooms resulted in a strong airflow. To reducethe resultant beam distortions and intensity fluctuations the beam was covered by ametal tube. It had to be ascertained that all mirrors were hit at the center to avoidintensity losses. At the beginning of each beam time it was necessary to fine tunethe alignment.
Semi-infinite gas cell
Due to the proximity of the metal seal to the focal volume of the laser each changein the alignment in front of the SIGC results in the widening of the exit hole. Thismakes it necessary to change the seal after a few days of using the setup. Otherwiseone would lose to much Argon into the evacuated chamber shown in Figure 4.2. InFigure 4.1 the desired focal spot position about 1.5 cm in front of the seal can beseen. This position is mainly controlled by the lens ahead of the SIGC’s entrancewindow. This lens combined with an iris was also used for later fine tuning of thephase matching conditions. The objective was the increase of the high-harmonicphoton flux. The beam viewer as well as the count rates were used as a feedback.For all our experiments the SIGC was filled with Argon at a pressure of 40 Torr.
Harmonic selection
Since a priori there is no indication which spot seen in Figure 3.2 corresponds towhich harmonic order, a procedure to identify at least one specific order was required.Starting from there, all other orders could be counted afterwards. First we had tomake sure the beam path was situated directly below the gas needle. The needlewas lowered into the beam path and, using the grating, one (arbitrary) harmonicwas moved until it was entirely blocked by the needle. Its position was markedwith a cross in XCAP. After the needle was elevated to its initial level 1.5 cm abovethe beam the harmonic was isolated using the slit pair. We then put Argon in the
19
4 Experiment
Figure 4.1: Air ionization in focal volume while seal mounting removed
Figure 4.2: Seal mounting position
20
4.1 Experimental procedures
target chamber and monitored the count rates. Its ionization potential of 15.759 eV[nis] lies between the photon energy of the 9th harmonic (hν9th ≈ 13.95eV ) and the11th harmonic (hν11th ≈ 17.05eV ). Hence the extreme difference in the count ratesallows the distinction of both orders.
Spatial overlap
After selecting the harmonic order required for the respective pump-probe experi-ment the spatial overlap had to be tweaked. The setup does not offer any controlover the XUV beam path except for the grating. Thus it was standard to adjustthe IR beam with respect to the XUV beam. To make both beams collinear, themirrors M1 and M2 were used (Figure 3.1) while the COLTRIMS and the beamviewer worked as a pair of "irises". The target chamber was flooded with O2. Dueto its rather low ionization potential of 12.07 eV it can be ionized easily by eitherthe photons of the 11th harmonic, which was used in almost all our experiments,or the IR alone. We kept the IR beam blocked and marked the position of theXUV beam on the beam viewer as well as the O+
2 peak position in TOF directionand Y direction. The TOF can be used for the fine tuning of the spatial overlap ofboth pulses because a shorter distance to the detector results in a shorter TOF andvice versa. Afterwards the XUV beam was blocked and the IR beam was unblocked.The IR beam alignment was now adjusted iteratively using M1 and the spectrometerrespectively M2 and the beam viewer alternately.
Temporal overlap
Subsequently, the temporal overlap between the IR and the XUV pulse had to befound. Like for the spatial overlap this was done using O2 as a target. The delaystage was moved manually over a large range while monitoring the ratio of O+/O+
2ions produced. The photon energy of the 11th harmonic is not sufficient to produceO+ ions alone. It is only capable of transferring the O+
2 into a predissociative state.This excited state can then be dissociated by the IR pulse. Thus the O+/O+
2 rate isa reliable indicator for the temporal order of both pulses. The overlap can then befound by looking for the steepest decline in this rate. The exact "zero" time of thedelay scan, i.e., the time where the maxima of both, HHG and IR pulses overlap,was verified by examining high-energy side bands in the photo-electron spectrum(see [Cao14], [Wil14] for details).
4.1.2 Time-of-flight
As mentioned in (3.3.2) the TOF signal is generated by the MCP. It is used tocompare the ion masses. One can thereby distinguish different atomic and molecularions as well as their charged states. Because the ions perform a uniformly acceleratedmotion, the distance covered along the TOF direction is
z = 12qE
mt2 + v0zt+ z0 (4.1)
21
4 Experiment
Figure 4.3: "wiggles" seen in Y vs. TOF spectrum; spectrometer voltage: 0V
Neglecting the initial speed v0z and assuming z0 = 0 the following relation can befound by identifying (4.1) for two different species of ions in the same charged state:
TOF1TOF2
=√m1m2
(4.2)
4.1.3 Magnetic fieldThe helical electron movement in the magnetic field is caused by the Lorentz forceacting as a centripetal force. Equaling both expressions leads to
evB = mev2
r(4.3)
Using the circumference 2πr (4.3) can be written in terms of the period T:
eB = 2πme
T(4.4)
Hence, the magnetic flux density B can be determined if the period is known:
B = 2πme
e
1T
(4.5)
Despite the electron’s movement in TOF direction, T denotes the time interval theelectron needs to return in the same XY position. Due to this fact "wiggles" can
22
4.2 XUV-IR pump-probe experiment on D2 target
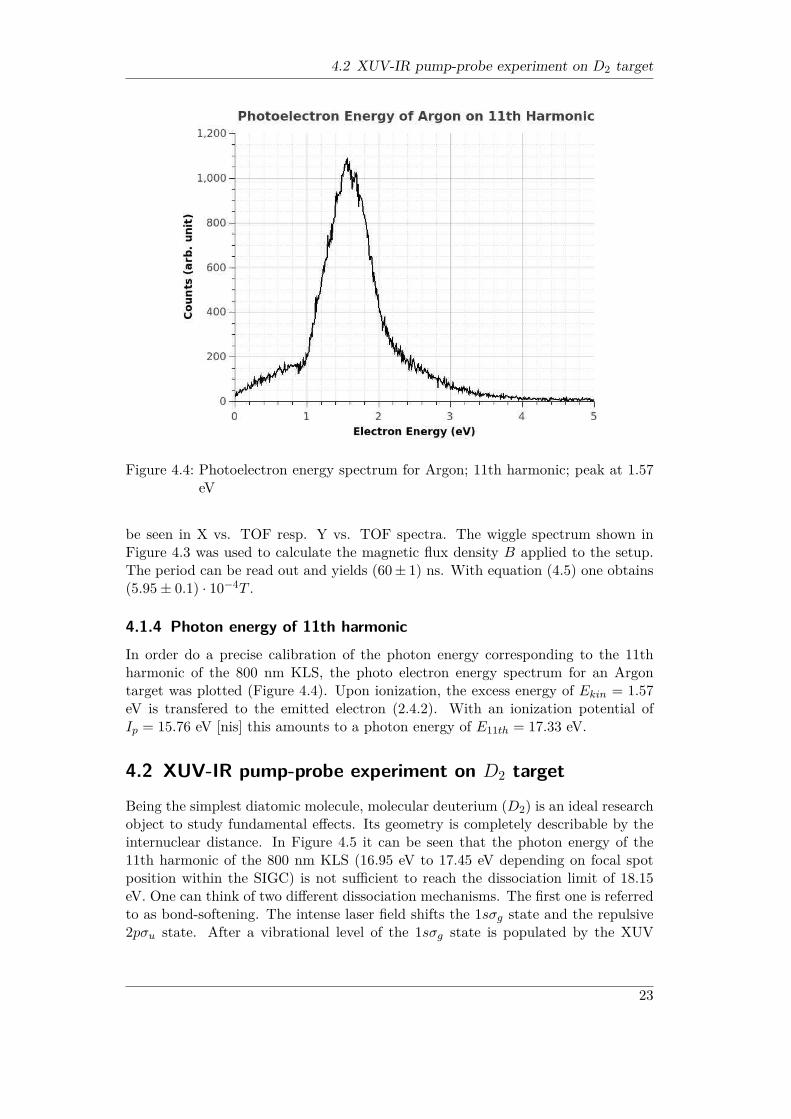
Figure 4.4: Photoelectron energy spectrum for Argon; 11th harmonic; peak at 1.57eV
be seen in X vs. TOF resp. Y vs. TOF spectra. The wiggle spectrum shown inFigure 4.3 was used to calculate the magnetic flux density B applied to the setup.The period can be read out and yields (60± 1) ns. With equation (4.5) one obtains(5.95± 0.1) · 10−4T .
4.1.4 Photon energy of 11th harmonicIn order do a precise calibration of the photon energy corresponding to the 11thharmonic of the 800 nm KLS, the photo electron energy spectrum for an Argontarget was plotted (Figure 4.4). Upon ionization, the excess energy of Ekin = 1.57eV is transfered to the emitted electron (2.4.2). With an ionization potential ofIp = 15.76 eV [nis] this amounts to a photon energy of E11th = 17.33 eV.
4.2 XUV-IR pump-probe experiment on D2 target
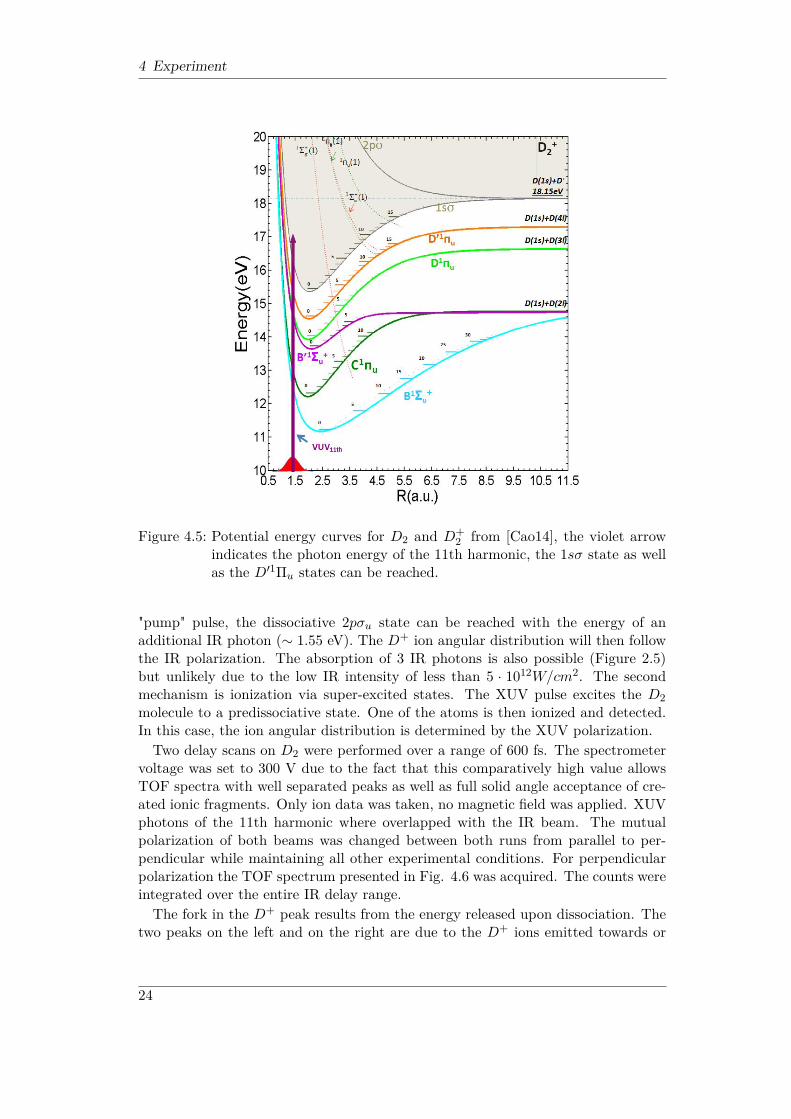
Being the simplest diatomic molecule, molecular deuterium (D2) is an ideal researchobject to study fundamental effects. Its geometry is completely describable by theinternuclear distance. In Figure 4.5 it can be seen that the photon energy of the11th harmonic of the 800 nm KLS (16.95 eV to 17.45 eV depending on focal spotposition within the SIGC) is not sufficient to reach the dissociation limit of 18.15eV. One can think of two different dissociation mechanisms. The first one is referredto as bond-softening. The intense laser field shifts the 1sσg state and the repulsive2pσu state. After a vibrational level of the 1sσg state is populated by the XUV
23
4 Experiment
Figure 4.5: Potential energy curves for D2 and D+2 from [Cao14], the violet arrow
indicates the photon energy of the 11th harmonic, the 1sσ state as wellas the D′1Πu states can be reached.
"pump" pulse, the dissociative 2pσu state can be reached with the energy of anadditional IR photon (∼ 1.55 eV). The D+ ion angular distribution will then followthe IR polarization. The absorption of 3 IR photons is also possible (Figure 2.5)but unlikely due to the low IR intensity of less than 5 · 1012W/cm2. The secondmechanism is ionization via super-excited states. The XUV pulse excites the D2molecule to a predissociative state. One of the atoms is then ionized and detected.In this case, the ion angular distribution is determined by the XUV polarization.Two delay scans on D2 were performed over a range of 600 fs. The spectrometer
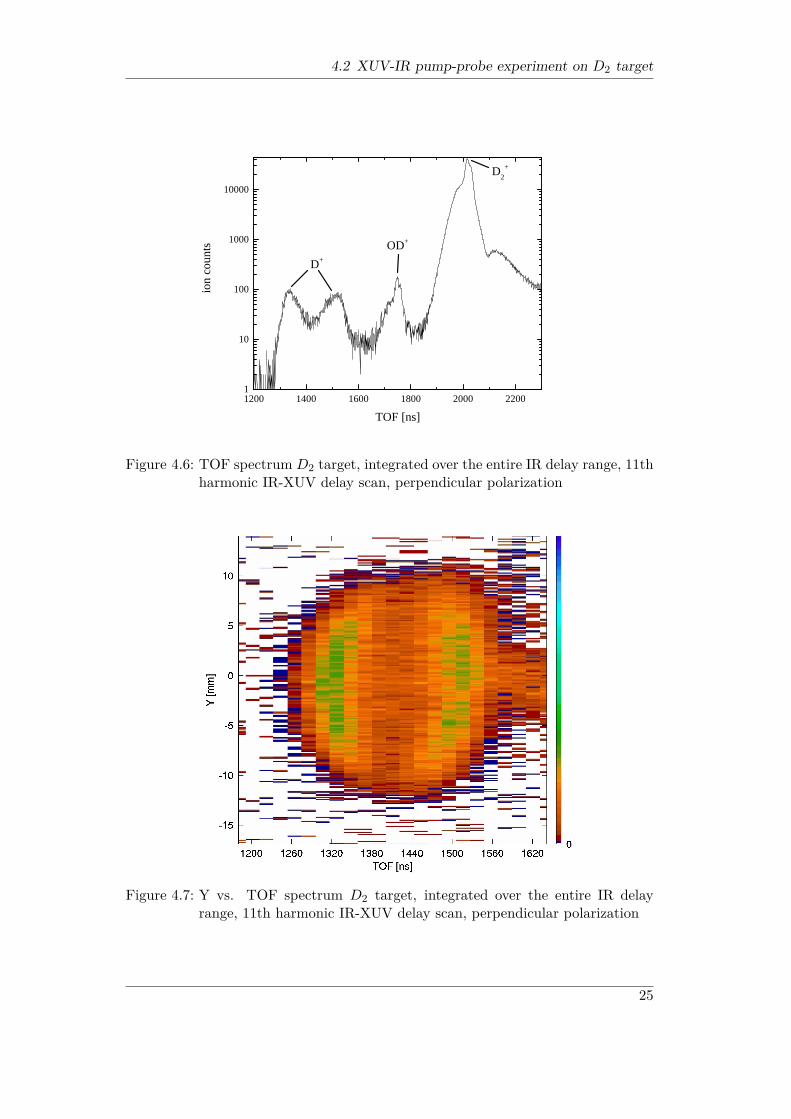
voltage was set to 300 V due to the fact that this comparatively high value allowsTOF spectra with well separated peaks as well as full solid angle acceptance of cre-ated ionic fragments. Only ion data was taken, no magnetic field was applied. XUVphotons of the 11th harmonic where overlapped with the IR beam. The mutualpolarization of both beams was changed between both runs from parallel to per-pendicular while maintaining all other experimental conditions. For perpendicularpolarization the TOF spectrum presented in Fig. 4.6 was acquired. The counts wereintegrated over the entire IR delay range.The fork in the D+ peak results from the energy released upon dissociation. The
two peaks on the left and on the right are due to the D+ ions emitted towards or
24
4.2 XUV-IR pump-probe experiment on D2 target
1 2 0 0 1 4 0 0 1 6 0 0 1 8 0 0 2 0 0 0 2 2 0 01
1 0
1 0 0
1 0 0 0
1 0 0 0 0ion
count
s
T O F [ n s ]
D +O D +
D 2+
Figure 4.6: TOF spectrum D2 target, integrated over the entire IR delay range, 11thharmonic IR-XUV delay scan, perpendicular polarization
Figure 4.7: Y vs. TOF spectrum D2 target, integrated over the entire IR delayrange, 11th harmonic IR-XUV delay scan, perpendicular polarization
25
4 Experiment
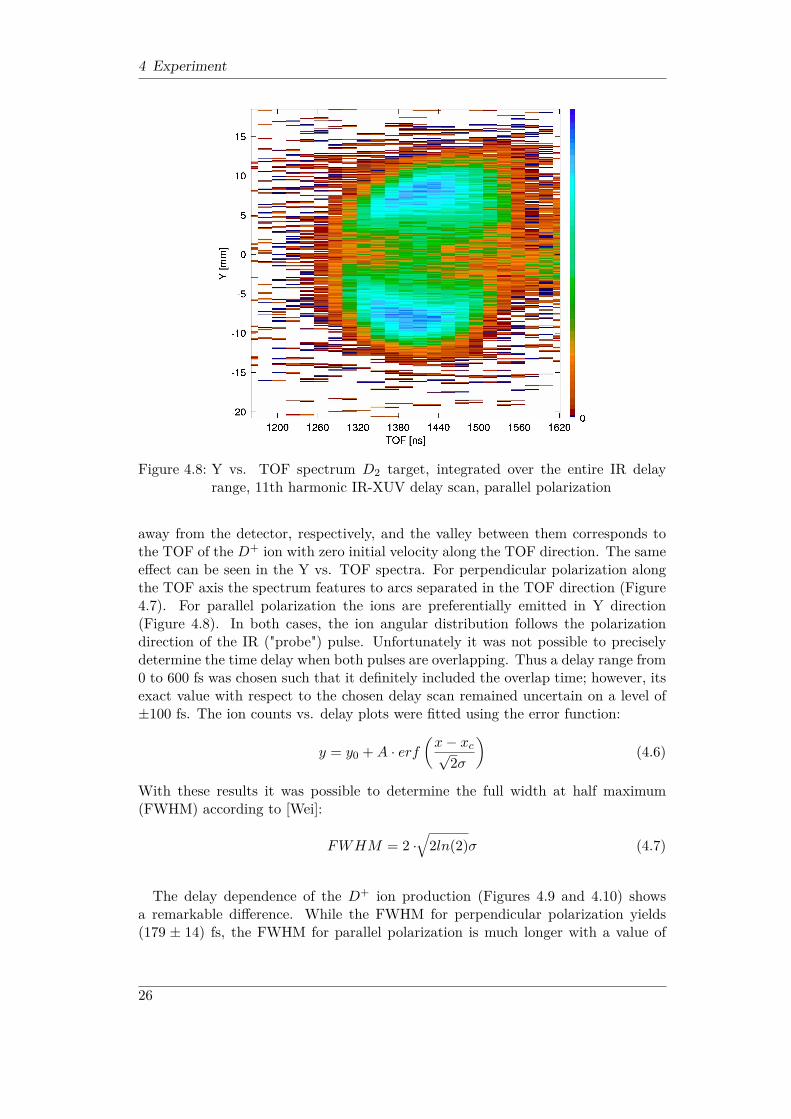
Figure 4.8: Y vs. TOF spectrum D2 target, integrated over the entire IR delayrange, 11th harmonic IR-XUV delay scan, parallel polarization
away from the detector, respectively, and the valley between them corresponds tothe TOF of the D+ ion with zero initial velocity along the TOF direction. The sameeffect can be seen in the Y vs. TOF spectra. For perpendicular polarization alongthe TOF axis the spectrum features to arcs separated in the TOF direction (Figure4.7). For parallel polarization the ions are preferentially emitted in Y direction(Figure 4.8). In both cases, the ion angular distribution follows the polarizationdirection of the IR ("probe") pulse. Unfortunately it was not possible to preciselydetermine the time delay when both pulses are overlapping. Thus a delay range from0 to 600 fs was chosen such that it definitely included the overlap time; however, itsexact value with respect to the chosen delay scan remained uncertain on a level of±100 fs. The ion counts vs. delay plots were fitted using the error function:
y = y0 +A · erf(x− xc√
2σ
)(4.6)
With these results it was possible to determine the full width at half maximum(FWHM) according to [Wei]:
FWHM = 2 ·√
2ln(2)σ (4.7)
The delay dependence of the D+ ion production (Figures 4.9 and 4.10) showsa remarkable difference. While the FWHM for perpendicular polarization yields(179 ± 14) fs, the FWHM for parallel polarization is much longer with a value of
26
4.2 XUV-IR pump-probe experiment on D2 target
0 1 0 0 2 0 0 3 0 0 4 0 0 5 0 0 6 0 00 . 0
0 . 2
0 . 4
0 . 6
0 . 8
1 . 0
D+ count
s norm
alized
to [0,
1]
D e l a y [ f s ]
y 0 = ( 0 . 4 9 � 0 . 0 1 )x c = ( 3 8 9 . 3 4 � 4 . 5 9 ) f sA = ( 0 . 4 3 � 0 . 0 1 ) f sσ = ( 7 5 . 9 4 � 6 . 1 3 ) f sF W H M = ( 1 7 8 . 8 4 � 1 4 . 4 4 ) f s
Figure 4.9: D+ ion yield normalized to [0,1], 11th harmonic IR-XUV delay scan,perpendicular polarization, error function fit
0 1 0 0 2 0 0 3 0 0 4 0 0 5 0 0 6 0 00 . 0
0 . 2
0 . 4
0 . 6
0 . 8
1 . 0y 0 = ( 0 . 4 6 � 0 . 0 1 )x c = ( 2 9 7 . 5 0 � 5 . 9 1 ) f sA = ( 0 . 4 2 � 0 . 0 1 ) f sσ = ( 1 0 8 . 2 9 � 8 . 5 1 ) f sF W H M = ( 2 5 5 . 0 2 � 2 0 . 0 4 ) f s
D+ count
s norm
alized
to [0,
1]
D e l a y [ f s ]
Figure 4.10: D+ ion yield normalized to [0,1], 11th harmonic IR-XUV delay scan,parallel polarization, error function fit
27
4 Experiment
0 . 0 0 0
5 . 0 0 0
1 0 . 0 0
1 5 . 0 0
2 0 . 0 0
2 5 . 0 0
3 0 . 0 0
3 5 . 0 0
0 1 0 0 2 0 0 3 0 0 4 0 0 5 0 0 6 0 00 . 0 0
0 . 2 5
0 . 5 0
0 . 7 5
1 . 0 0
D+ ion e
nergy
[eV]
D e l a y [ f s ]
Figure 4.11: D+ ion energy, 11th harmonic IR-XUV delay scan, perpendicular po-larization
0 . 0 0 0
5 . 0 0 0
1 0 . 0 0
1 5 . 0 0
2 0 . 0 0
2 5 . 0 0
3 0 . 0 0
3 5 . 0 0
0 1 0 0 2 0 0 3 0 0 4 0 0 5 0 0 6 0 00 . 0 0
0 . 2 5
0 . 5 0
0 . 7 5
1 . 0 0
D+ ion e
nergy
[eV]
D e l a y [ f s ]
Figure 4.12: D+ ion energy, 11th harmonic IR-XUV delay scan, parallel polarization
28

4.2 XUV-IR pump-probe experiment on D2 target
(255 ± 20) fs. The D+ ion energy shown in Figure 4.11 and in Figure 4.12 is alsoindependent of the polarization direction. Virtually all ions have energies from0.25 to 0.5 eV. These energies and the ion angular distributions indicate that thedominant dissociation mechanism is the bond-softening process.
29
4 Experiment
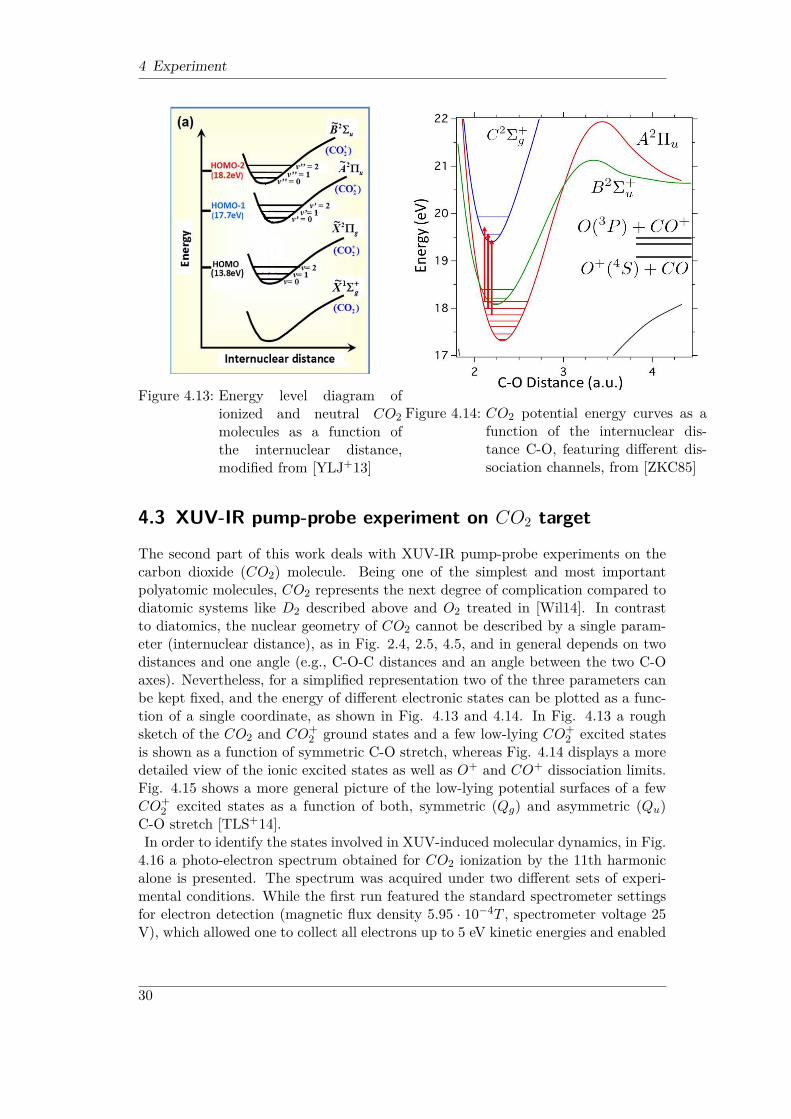
Figure 4.13: Energy level diagram ofionized and neutral CO2molecules as a function ofthe internuclear distance,modified from [YLJ+13]
Figure 4.14: CO2 potential energy curves as afunction of the internuclear dis-tance C-O, featuring different dis-sociation channels, from [ZKC85]
4.3 XUV-IR pump-probe experiment on CO2 target
The second part of this work deals with XUV-IR pump-probe experiments on thecarbon dioxide (CO2) molecule. Being one of the simplest and most importantpolyatomic molecules, CO2 represents the next degree of complication compared todiatomic systems like D2 described above and O2 treated in [Wil14]. In contrastto diatomics, the nuclear geometry of CO2 cannot be described by a single param-eter (internuclear distance), as in Fig. 2.4, 2.5, 4.5, and in general depends on twodistances and one angle (e.g., C-O-C distances and an angle between the two C-Oaxes). Nevertheless, for a simplified representation two of the three parameters canbe kept fixed, and the energy of different electronic states can be plotted as a func-tion of a single coordinate, as shown in Fig. 4.13 and 4.14. In Fig. 4.13 a roughsketch of the CO2 and CO+
2 ground states and a few low-lying CO+2 excited states
is shown as a function of symmetric C-O stretch, whereas Fig. 4.14 displays a moredetailed view of the ionic excited states as well as O+ and CO+ dissociation limits.Fig. 4.15 shows a more general picture of the low-lying potential surfaces of a fewCO+
2 excited states as a function of both, symmetric (Qg) and asymmetric (Qu)C-O stretch [TLS+14].In order to identify the states involved in XUV-induced molecular dynamics, in Fig.4.16 a photo-electron spectrum obtained for CO2 ionization by the 11th harmonicalone is presented. The spectrum was acquired under two different sets of experi-mental conditions. While the first run featured the standard spectrometer settingsfor electron detection (magnetic flux density 5.95 · 10−4T , spectrometer voltage 25V), which allowed one to collect all electrons up to 5 eV kinetic energies and enabled
30
4.3 XUV-IR pump-probe experiment on CO2 target
Figure 4.15: CO2 potential energy surfaces as a function of the coordinates Qg (sym-metric C-O stretch) and Qu (asymmetric C-O stretch), modified from[TLS+14]
simultaneous ion detection, the second run was performed with both, electric andmagnetic fields switched off, which resulted in higher energy resolution, but onlyensured the detection of electrons emitted directly towards the detector. The spec-trum with fields on (black line in Fig. 4.16) shows two distinct peaks at low (< 0.38eV) and high (∼ 3.5 eV) kinetic energies. While the latter feature corresponds to theionization leaving the CO+
2 ion in its ground state (X2Πg), the low-energy structureresults from the excitation into the lowest CO+
2 excited state (A2Πu). The kineticenergy of these electrons is somewhat higher than what one would expect given thecentral photon energy of the 11th harmonic (∼ 17.33 eV) and the binding energy ofthe A2Πu state in the Franck-Condon region (∼ 17.3 eV). This is most likely due tothe electric field distortions in the vicinity of the reaction point, which makes theprecise energy measurement for very slow electrons (< 0.5 eV) problematic. In thespectrum taken without the extraction fields (red line in Fig. 4.16) the low-energyfeature is completely missing because in the field-free regime these electrons are notguided to the detector. However, the feature around 3.5 eV clearly appears in thespectrum, and two distinct peaks separated by 0.2 eV reflecting different vibrationallevels of the X2Πg state can be resolved thanks to the improved energy resolution.Similar to the D2 case discussed above, the 11th harmonic radiation alone does
not efficiently dissociate CO+2 molecule. As can be seen from Fig. 4.14, the lowest
asymptotic dissociation limit (resulting in CO + O+ dissociation) lies at ∼ 19 eV,which means that at least one IR photon needs to be absorbed in addition to theXUV photon to dissociate the molecule in a pump-probe experiment. The ion TOFspectrum resulting from the XUV-IR pump-probe measurement using the 11th har-monic of the 800 nm KLS is shown in Fig. 4.17. The spectrum was obtained with
31
4 Experiment
Figure 4.16: CO+2 photo-electron energy, 11th harmonic XUV; black line: magnetic
flux density 5.95·10−4T , spectrometer voltage 25 V, red line: no electricor magnetic fields applied
XUV and IR polarization parallel to each other (along Y axis), and is integratedover all delays from 0 to 600 fs. One can clearly see a (dominant) contribution fromthe CO+
2 parent ion, as well as O+ and CO+ dissociation fragments. The O+ andthe CO+ peaks feature the typical broadening seen for dissociation products, whichis due to the non-negligible ion kinetic energies. In addition, O+
2 , H2O+ and OH+
ions can be observed, which are not produced from the CO2 target. This is due to asignificant amount of residual gas. Nevertheless, the branching ratios of ionizationand dissociation of the O2 molecule obtained with an identical experimental con-figuration [Wil14] indicate, that the O+ fragments observed here to a large extentoriginate from the CO2 target, and not only from the O2 contribution in the residualgas.
Figure 4.18 and 4.19 show the measured O+ and CO+ ion yields as a functionof XUV-IR delay. The data are from the same run as the TOF spectrum in Fig.4.17 (i.e., with parallel XUV and IR polarization). While in Fig. 4.18 the absolutenumber of ion counts are plotted, Fig. 4.19 shows the normalized yields for a bettercomparison between O+ and CO+ behavior. Similar to the D2 case discussed inthe previous section the dissociation yields increase significantly when the IR pulsearrives later than the XUV pulse (larger delays), confirming that the dissociationmainly results from the IR dissociation of the XUV-induced CO+
2 molecular ion.Most of the dissociation fragments likely result from the IR dissociation of the A2Πu
excited state via one- or two-photon transitions. The dissociation from the groundstate of the ion (X2Πg) requires at least 4 photons and is thus much less probableat rather low IR intensities used here (I < 5 · 1012W/cm2). A significant amount
32
4.3 XUV-IR pump-probe experiment on CO2 target
3 0 0 0 4 0 0 0 5 0 0 0 6 0 0 0 7 0 0 0 8 0 0 01
1 0
1 0 0
1 0 0 0
1 0 0 0 0
1 0 0 0 0 0
H 2 O +O H +
O +
O 2+
ion co
unts
T O F [ n s ]
C O 2+
C O +
Figure 4.17: TOF spectrum CO2 target, integrated over the entire IR delay range,11th harmonic IR-XUV delay scan, parallel polarization
0 1 0 0 2 0 0 3 0 0 4 0 0 5 0 0 6 0 0
4 0 0
6 0 0
8 0 0
1 0 0 0
1 2 0 0
1 4 0 0
ion co
unts
D e l a y [ f s ]
O + c o u n t s C O + c o u n t s
Figure 4.18: O+ and CO+ ion yield, 11th harmonic IR-XUV delay scan, parallelpolarization
33
4 Experiment
0 1 0 0 2 0 0 3 0 0 4 0 0 5 0 0 6 0 00 . 0
0 . 2
0 . 4
0 . 6
0 . 8
1 . 0
norma
lized i
on cou
nts
D e l a y [ f s ]
O + c o u n t s n o r m a l i z e d t o [ 0 , 1 ] C O + c o u n t s n o r m a l i z e d t o [ 0 , 1 ]
Figure 4.19: O+ and CO+ ion yield normalized to [0,1], 11th harmonic IR-XUVdelay scan, parallel polarization
of dissociation fragments for the delays where the IR pulse precedes the XUV canbe explained by the contributions from the residual gas as well as by the presenceof a small fraction of higher-order harmonics. In contrast to the D+ yields shownin Fig. 4.9 and 4.10, the dissociation yields for both, O+ and CO+ decrease atlarger delays after reaching their maximum values. Moreover, the contrast of thedelay-dependent O+ curve is lower and it reaches its peak value faster than the CO+
curve (Fig. 4.18). While the lower contrast can be at least partly explained by thefraction of O+ ions created from O+
2 from the residual gas, the observed differentdelay dependence likely originates from different dissociation pathways leading toCO + O+ and CO+ + O final states. While the latter channel definitely needsat least two IR photons, the former can be energetically reached with a single IRphoton from the A2Πu state of CO+
2 . As can be seen from Fig. 4.20, the lowestasymptotic limit for the CO + O+ channel can be reached by following the repul-sive a4Σ−g state, which can be coupled with one IR photon to the A2Πu state at∼ 2.7 a.u. internuclear distance. The symmetry of both states enables one-photontransition for parallel orientation. On the contrary, the lowest CO+ + O asymp-totic limit can be reached via the higher-lying b4Πu state and energetically needsat least two photons after XUV ionization to the A2Πu state. Even the two-photoncoupling between these two curves (allowed by dipole selection rules for these u –u transitions) occurs at considerably larger internuclear distances. The longer timethe molecular wave packet needs to extend to these internuclear distances explainsthe slower rise of the CO+ yield curve. Alternatively, the CO+ + O final state canbe reached by first populating the higher-lying predissociative C2Σ+
g state, whichthen takes ∼ 1 ps time to dissociate. A noticeable decrease in both, O+ and CO+
34
4.3 XUV-IR pump-probe experiment on CO2 target
Figure 4.20: Potential energy curves for doublet and quartet states of CO+2 involved
in the dissociation. The energies of the dissociation limits states areshifted to known experimental values. Note that the energies are mea-sured with respect to the ground state of the ion, i.e., are shifted by13.77 eV compared to Fig. 4.13-15. Modified from [LCH+03]
signals at large delays can be explained by the coupling to the rotational degreeof freedom as described in [TLS+14]. As the molecular ensemble rotates out of itsinitial alignment determined by the selectivity of the ionizing XUV transition, asmaller fraction of the molecules can be probed by the IR field parallel to the initialXUV polarization. On the other hand, this opens up a larger number of moleculeswhich can be probed by the perpendicular IR field, resulting in the increase in ionyield for perpendicular polarization. This is confirmed by the data presented in Fig.4.21, where the IR polarization was chosen perpendicular to the XUV polarization.The overall dissociation yield is considerably lower than for parallel polarizationsince both transitions, one-photon A2Πu - a4Σ−g and two-photon A2Πu - b4Πu, areunlikely to happen for perpendicular polarization. However, as the molecule rotatesout of the initial alignment at larger delay, the yield of both channels increases.
35
4 Experiment
0 1 0 0 2 0 0 3 0 0 4 0 0 5 0 0 6 0 0
8 0
1 0 0
1 2 0
1 4 0
1 6 0
1 8 0
2 0 0
ion co
unts
D e l a y [ f s ]
O + c o u n t s C O + c o u n t s
Figure 4.21: O+ and CO+ ion count yield, 11th harmonic IR-XUV delay scan, per-pendicular polarization
36
5 Conclusion
The main goal of this thesis was to study ultrafast molecular dynamics induced byXUV photo-absorption, and to study the behavior of such XUV-induced molecularwave packets in an intense IR laser field. These XUV-IR pump-probe experimentswere conducted in summer 2014 using 35 fs 800 nm IR pulses from KLS and HHGXUV pulses. In order to excite a well-defined molecular wave packet, a single har-monic order was selected with a grating pair used as a monochromator. In particular,the 11th harmonic of the 800 nm KLS light was chosen and used as a pump pulsefor experiments on O2 described in [Wil14], and on D2 and CO2, which are in thefocus of this work. For all these targets, the XUV photon energy of 17.33 eV was notsufficient to dissociate the respective molecules alone. For D2 the bond-softeningprocess was found to be the predominant dissociation mechanism, where one ad-ditional IR photon excites the molecule from the 1sσg state reached by the pumppulse to the dissociative 2pσu state. The angular distribution of the D+ fragments isdetermined by the IR polarization, highlighting the dominance of the bond-softeningmechanism.For the CO2 target a photo-electron energy spectrum was acquired using the 11thharmonic alone. It could be shown that both the ionic ground state (X2Πg) as wellas the lowest excited state of CO+
2 (A2Πu) are populated by the XUV pulse. Twodifferent vibrational levels of the X2Πg state could also be identified. The delaydependent O+ and CO+ ion yield was measured over an IR delay range of 600 fsfor two different IR polarizations (parallel and perpendicular to XUV polarization).For parallel polarization a slower increase in the CO+ count rates compared to theincrease in the O+ yield was observed. This slower increase in the CO+ count ratescould be explained by the time the wave packet needs to propagate to an internucleardistance that allows the 2-photon transition between the A2Πu state and the b4Πu
state. In contrast, the transition from the A2Πu state to the a4Σ−g state resulting inthe emission of an O+ ion requires only one IR photon and can occur in the earlierphase of the wave packet propagation. The decrease in both the O+ and the CO+
ion yield after reaching a peak value similar to the results published in [TLS+14]could be reproduced, which can be explained by de-excitation via the coupling tothe rotational degree of freedom.The results obtained in this work are important for the understanding of the behav-ior of simple molecular systems exposed to combined XUV and IR light. They alsoreveal the potential of using narrow-band single harmonics with a comparativelylong pulse duration for molecular pump-probe experiments.
37

6 Appendix
Acknowledgements
First of all I would like to thank my advisor Assistant Professor Dr. Artem Rudenkofrom Kansas State University. Whenever we were facing issues he was helpful withgood advice and active support.I also wish to thank my assessor Professor Dr. Reinhard Dörner for his proposalto go to Kansas State University and for supporting my application. Furthermoremany thanks to PD Dr. Till Jahnke for being my second assessor.I would like to express my special appreciation to Wei Cao who built the setupFlorian and I were using and who spent much of his free time teaching us how touse it. Many thanks to Yubaraj Malakar and Balram Kaderiya for their help withdata analysis.Last but not the least, I would like to thank my classmates and parents for supportingmy studies in so many ways.
Selbstständigkeitserklärung
nach § 28 (12) der Ordnung des Fachbereichs Physik an der Johann WolfgangGoethe-Universität für den Bachelor-und Masterstudiengang Physik vom 20.07.2011Hiermit erkläre ich, Daniel Trabert, dass ich die vorliegende Arbeit selbständig, ohnefremde Hilfe und ohne Benutzung anderer als der angegebenen Hilfsmittel angefertigthabe. Die aus fremden Quellen (einschließlich elektronischer Quellen) direkt oderindirekt übernommenen Gedanken sind ausnahmslos als solche kenntlich gemacht.Die Arbeit ist in gleicher oder ähnlicher Form oder auszugsweise im Rahmen eineranderen Prüfung noch nicht vorgelegt worden.
Frankfurt am Main,

Bibliography
[Bra13] W.L. Bragg. The diffraction of short electromagnetic waves by a crystal.In Proceedings of the Cambridge Philosophical Society, volume 17, pages43–57, 1913.
[Cao14] Wei Cao. Dissertation on »Pump-probe study of atoms and smallmolecules with laser driven high order harmonics« , 2014.
[DMJ+00] R. Dörner, V. Mergel, O. Jagutzki, L. Spielberger, J. Ullrich,R. Moshammer, and H. Schmidt-Böcking. Cold target recoil ion momen-tum spectroscopy: a ‘momentum microscope’ to view atomic collisiondynamics. Physics Reports, 330(2–3):95 – 192, 2000.
[Gov] Govindjee. Light absorption and fate of excitation energy: Franck-condon principle. http://www.life.illinois.edu/govindjee/biochem494/Abs.html.
[Gri98] David J. Griffiths. Introduction to Electrodynamics (3rd Edition). Ben-jamin Cummings, 1998.
[HP] Sascha Hankele and Patrick Paul. Hinweise zur Fehlerrechnung imGrundpraktikum der Physik. https://www.uni-ulm.de/fkp/lehre/GrundPraktikum/EinfuehrungFehlerrechnungHankelePaul.pdf.
[Ish10] Kenichi L. Ishikawa. High-Harmonic Generation, Advances in SolidState Lasers Development and Applications, Mikhail Grishin (Ed.). In-Tech, 2010.
[LBI+94] M. Lewenstein, Ph. Balcou, M. Yu. Ivanov, Anne L’Huillier, and P. B.Corkum. Theory of high-harmonic generation by low-frequency laserfields. Phys. Rev. A, 49:2117–2132, Mar 1994.
[LCH+03] Jianbo Liu, Wenwu Chen, M. Hochlaf, Ximei Qian, Chao Chang, andC. Y. Ng. Unimolecular decay pathways of state-selected co2+ in theinternal energy range of 5.2–6.2 ev: An experimental and theoreticalstudy. The Journal of Chemical Physics, 118(1), 2003.
[Mur] Tim Murphy. Faraday Cage, National High Magnetic Field Labo-ratory. http://www.magnet.fsu.edu/education/tutorials/tools/faradaycage.html.
[Nee14] Vincent Needham. James R. Macdonald Laboratory, KLS @ONLINE.http://jrm.phys.ksu.edu/lasers.html, 2014.
41
BIBLIOGRAPHY
[nis] NIST ChemistryWebBook, NIST Standard Reference Database Number69. http://webbook.nist.gov/chemistry/.
[Nol04] Wolfgang Nolting. Grundkurs Theoretische Physik 3:. Grundkurs The-oretische Physik / Wolfgang Nolting. Springer, 2004.
[Rut11] E. Rutherford. The scattering of alpha and beta particles by matter andthe structure of the atom. Phil.Mag., 21:669–688, 1911.
[SVS+09] Daniel S. Steingrube, Tobias Vockerodt, Emilia Schulz, Uwe Morgner,and Milutin Kovačev. Phase matching of high-order harmonics in asemi-infinite gas cell. Phys. Rev. A, 80:043819, Oct 2009.
[TLS+14] Henry Timmers, Zheng Li, Niranjan Shivaram, Robin Santra, Oriol Ven-drell, and Arvinder Sandhu. Coherent electron hole dynamics near aconical intersection. Phys. Rev. Lett., 113:113003, Sep 2014.
[Wei] Eric W. Weisstein. Full Width at Half Maximum From Math-World A Wolfram Web Resource. http://mathworld.wolfram.com/FullWidthatHalfMaximum.html.
[Wil14] Florian Wilhelm. XUV-IR femtosecond pump-probe experimentson O2 fragmentation« . https://www.atom.uni-frankfurt.de/publications/files/Wilhelm_2014.pdf, 2014.
[Wiz79] Joseph Ladislas Wiza. Microchannel plate detectors. Nuclear Instru-ments and Methods, 162(1–3):587 – 601, 1979.
[WMS+13] J Wu, M Magrakvelidze, LPH Schmidt, M Kunitski, T Pfeifer, M Schöf-fler, M Pitzer, M Richter, S Voss, H Sann, et al. Understanding the roleof phase in chemical bond breaking with coincidence angular streaking.Nature communications, 4, 2013.
[YLJ+13] Jinping Yao, Guihua Li, Xinyan Jia, Xiaolei Hao, Bin Zeng, ChenruiJing, Wei Chu, Jielei Ni, Haisu Zhang, Hongqiang Xie, Chaojin Zhang,Zengxiu Zhao, Jing Chen, Xiaojun Liu, Ya Cheng, and Zhizhan Xu.Alignment-dependent fluorescence emission induced by tunnel ionizationof carbon dioxide from lower-lying orbitals. Phys. Rev. Lett., 111:133001,Sep 2013.
[ZKC85] Th. Zimmermann, H. Köppel, and L. S. Cederbaum. On the bilinearvibronic coupling mechanism. The Journal of Chemical Physics, 83(9),1985.
42