Embed Size (px)
Citation preview

Analysis of the Particle Formation Process of StructuredMicroparticlesAlberto Baldelli, Mohammed A. Boraey,† David S. Nobes, and Reinhard Vehring*
Department of Mechanical Engineering, University of Alberta, 4-9 Mechanical Engineering Building, Edmonton, AB, T6G 2G8,Canada
ABSTRACT: The particle formation process for micro-particles of cellulose acetate butyrate dried from an acetonesolution was investigated experimentally and theoretically. Amonodisperse droplet chain was used to produce solutionmicrodroplets in a size range of 55−70 μm with solutionconcentrations of 0.37 and 10 mg/mL. As the droplets dried ina laminar air flow with a temperature of 30, 40, or 55 °C, theparticle formation process was recorded by two independentoptical methods. Dried particles in a size range of 10−30 μmwere collected for morphology analysis, showing hollow,elongated particles whose structure was dependent on thedrying gas temperature and initial solution concentration. Thesetup allowed comprehensive measurements of the particle formation process to be made, including the period after initial shellformation. The early particle formation process for this system was controlled by the diffusion of cellulose acetate butyrate in theliquid phase, whereas later stages of the process were dominated by shell buckling and folding.
KEYWORDS: particle engineering, drug delivery, particle formation, evaporation process, structured microparticles,cellulose acetate butyrate
■ INTRODUCTION
Respiratory drug delivery is facilitated by aerosols whosedispersed phase consists of liquid or solid microparticles,typically in a size range of about 0.5−5 μm for pulmonarydelivery and sizes larger than 10 μm for nasal deliveryapplications.1 Traditionally, many solid respirable dosageforms have consisted of micronized active pharmaceuticalingredients in a crystalline form, optionally utilizing carrierparticles, e.g., consisting of lactose, to aid in the dispersion of apowder dose.2 Lately, respiratory products have been marketedor are in development that rely on an expanded functionality ofthe delivered microparticles,3 providing, for example, reducedside effects via improved delivery efficiency,4 improved shelf lifeand environmental robustness via stabilization of labile oramorphous actives,5 including biologics, controlled release ortaste masking via encapsulation,6 etc. To accomplish thesegoals, advanced pharmaceutical microparticles typically containone or more excipients that address a specific design target, andthese microparticles are structured, i.e., the particle surface andcore have different composition, and, hence, may have differentuseful properties.7 Furthermore, the particle density isfrequently adjusted to improve aerosolization in dry powderinhalers or to achieve sufficient suspension stability in metereddose inhalers.8,9
Due to the complexity of the particle design task, a rationalrather than empirical approach for dosage form development isneeded. This rational approach is enabled by a rapidly growingdiscipline, particle engineering, which provides the required
mechanistic understanding, improved process capabilities, andadvanced analytical and experimental tools.10 A prerequisite forsuccessful particle engineering is a fundamental comprehensionof the process by which the microparticles are formed so thatthe process may be controlled to provide the desired particleproperties.11,12 Many processing techniques for structuredmicroparticles rely on drying of a droplet that comprises theactive and the excipients in dissolved or suspended form. In thiscase, the particle formation process is the transition from asolution or suspension droplet to a dried solid particle.13
During this process, the solvent evaporates and the solutes orsuspended materials may remain either homogeneously mixedor may separate, e.g., creating a core−shell morphology. For thelatter particles, the point in time during the drying process atwhich the shell is generated is called the shell formation time.14
It is influenced by the physical and chemical properties of thesolutes and the solvent and by the evaporation rate of thesolvent.15
Various techniques are used for the production of thesemicroparticle drugs, and examples include spray freeze-drying,16−20 supercritical fluid technology,21−24 microcrystalli-zation,25−28 and spray drying.29−32 Evaporation of micro-
Special Issue: Advances in Respiratory and Nasal Drug Delivery
Received: November 13, 2014Revised: January 26, 2015Accepted: February 16, 2015
Article
pubs.acs.org/molecularpharmaceutics
© XXXX American Chemical Society A DOI: 10.1021/mp500758sMol. Pharmaceutics XXXX, XXX, XXX−XXX

droplets is the underlying idea behind many of thesetechniques. At present, a common technique for themanufacture of structured microparticles is spray drying.Specifically, for pharmaceutical applications, spray drying hasseveral advantages: it can be conducted with minimal loss ofactivity of chemicals, a broad range of solutions or suspensionscan be applied, and important properties of the final particlescan be controlled.30 In addition, interest in this technique isgrowing with the increase in the demand for smallerparticles33,34 with more governable and defined properties.A mechanistic understanding of the particle formation
process is essential for the control and improvement ofproperties of pharmaceutical powders produced by spraydrying.35 As a result, during the last two decades, severalstudies have been conducted to investigate the particleformation process theoretically and experimentally.13,36−38
These studies focused mainly on the first part of the process,which can be modeled as evaporation of a solution droplet. Thesolvent evaporation phase plays a key role in the particleformation process.39 Four main techniques were used in thesestudies: observation of a single droplet in a quiescent gas,40−47
where one isolated droplet evaporates falling or while levitated,typically in a room temperature environment; analysis ofdroplets suspended from thin filaments, where several dropletsevaporate while attached to a wire;48−51 observation of a singledroplet falling in a gas flow,52−55 where only one dropletevaporates in an air flow; and studies on monodisperse freefalling droplets,56−59 where a chain of droplets is injected into agas flow. Several theoretical models have been developed thatdescribe the process of evaporating single droplets falling in agas flow52,60−63 and evaporation of droplets in a monodispersechain.56,64,65
The droplet chain method has been demonstrated to be agood choice for the experimental study of evaporationprocesses not only in spray drying but also in other areassuch as microfluidics, MEMS, combustion, and colloidschemistry.66−70 This broad interest comes from its ability toovercome many of the drawbacks encountered in othertechniques.71 For droplet chain techniques, evaporationmeasurements are feasible very shortly after generation of thedroplet, unlike in some single droplet techniques that requirecapture and stabilization of a droplet before measurements cancommence. Particles do not need to remain homogeneous,spherical, or electrically charged.65 Techniques involvingdroplets suspended from thin filaments may bias evaporationrates by affecting heat conduction via the contact between thefilament and the droplet. Also, filament techniques normallyrequire droplets with diameters in the millimeter range, whichundergo a different evaporation process compared to that ofmicrodroplets relevant for inhalation applications.72
A monodisperse droplet chain can be generated using athermal dispenser, a vibrating orifice, or a piezoceramicdispenser. The thermal dispenser has been used in severalstudies of inkjet printing,73−76 but it has been rarely used in thegeneration of monodisperse droplet chains77,78 because ofbubble generation inside the dispenser. These bubbles interferewith the ejection of the droplets and the homogeneity of thedroplet diameters in the chain.79 The instrument mostfrequently used for the production of monodisperse dropletchains until the beginning of the past decade was the vibratingorifice generator.80−84 The main benefit of this device is that itcan produce monodisperse droplets in a broad size range.However, a vibrating orifice generates a very closely spaced
droplet chain with a gap between two consecutive droplets onthe order of only the diameter of a few droplets.71 This can leadto droplet collisions and affect the mass transfer such that theevaporation rate is not representative of a single droplet.Piezoceramic dispensers provide a continuous and homoge-neous production of monodisperse droplets by applying thepiezoelectric effect.85 The mechanical deformation of apiezoceramic tube in response to an electric signal createsacoustic waves in the liquid contained in the tube, expellingdroplets in a reproducible manner and thus creating amonodisperse droplet chain with widely adjustable spacing.The monodisperse chain technique has a fundamental role in
particle formation studies. An analytical particle formationmodel was developed using experimental data from a dropletchain technique.33 In this paper, Vehring et al. presented apartial theoretical description of the particle formation process,an experimental validation of different formation mechanismsfor different solutes and different process conditions, and areview of the most common techniques for manufacturing ofmicroparticles. Boraey et al.37,86 refined the particle formationmodel, adding new parameters to the theoretical derivations,e.g., shell thickness of the dried particles. The two models,however, did not consider the particle formation process afterthe onset of shell formation and, thus, cannot describe animportant part of the process: the evaporation of residualsolvent contained by a shell.The aim of the present work is to fill this gap by providing a
more complete experimental analysis of the particle formationprocess, including the stage after the formation of a shell. Theevaporation of acetone solution droplets of a polymer, cellulosebutyrate acetate (CAB), is investigated as a model case todemonstrate the capabilities of the new experimental approach.The choice of the solvent facilitates the experimental part.Acetone shows a relatively high evaporation rate at roomtemperature. A high evaporation rate encloses a short dryingtime, which ensures the drying of the droplet before thecollection point. The choice of the solute relied on theproperties of CAB: its high solubility in acetone and its highmolecular weight. The high solubility permits the inception ofsolutions with varying solute quantity, needed to study theeffect of the initial concentration, and the high molecularweight promotes faster shell formation, leaving a reasonableperiod of time to investigate the evaporation process after shellformation. Besides, the use of CAB is of particular interest forthis process because of its wide use in studies related to theimprovement of the efficacy of drug delivery systems andcontrolled release applications.87−89
■ EXPERIMENTAL SECTIONChemicals. Cellulose acetate butyrate (CAB) (catalog
number 419044-500G, Sigma-Aldrich, St. Louis, MO, USA)was used; some of the properties analyzed and provided by themanufacturer are a molecular mass of about 65 000 g/mol andtrue density of 1.25 g/mL at 25 °C. Acetone (320110-1L ACSReagent, 99.5% purity, Sigma-Aldrich, St. Louis, MO, USA) wasused as the solvent, with a residual water content <0.5%. Themain physical properties of the acetone listed by the supplierare a vapor pressure of 24.4 kPa at 20 °C and density of 0.791g/mL at 25 °C.The solubility of CAB in acetone is a required input
parameter for the particle formation model applied in thisstudy. Therefore, the solubility was derived experimentally forthree reference temperatures, which were the predicted steady-
Molecular Pharmaceutics Article
DOI: 10.1021/mp500758sMol. Pharmaceutics XXXX, XXX, XXX−XXX
B

state droplet temperatures for the chosen drying conditions.CAB was gradually added to 10 mL of acetone until thesolution did not clear any further upon 3 h of sonication and 1h of agitation on a wrist action shaker. The saturated solutionstays in an environment at each reference temperature for 2 h;undissolved mass was removed. The determined solubilitieswere 216 ± 2 mg/mL at 14 °C, 247 ± 2 mg/mL at 20.5 °C,and 258 ± 3 mg/mL at 27.5 °C. These droplet temperaturescorrespond to drying gas temperatures of 30, 40, and 55 °C,respectively.90
To prepare CAB−acetone solutions, CAB was weighed usingan analytical balance (ME204E, Mettler Toledo, Mississauga,Ontario, Canada) and filled to volume with the solvent. Thesolution was closed with a paraffin film (PM992, PechineyPlastic Packaging, Chicago, IL, USA) and agitated for 1.5 h on awrist action shaker (Model 75, Burrell Scientific, Pittsburgh,PA, USA).Experimental Setup. An experimental system was
developed to provide droplets on demand and consisted ofthree main systems: feeding, collection, and optical, illustratedin Figures 1 and 2. The feeding system was charged throughfilters (09-754-28, Corning PTFE 0.2 μm, Fisher Scientific,Edmonton, AB, Canada) with a syringe (14-817-30, AirTiteNorm-Jet Eccentric Luer Fisher Scientific, Edmonton, AB,Canada) filled with a solution. The solution was stored in an S-shaped reservoir with a volume of 2 mL and entered apiezoceramic dispenser (MD-G-020 K, Microdrop Technolo-gies, Muhlenweg, Norderstedt, Germany) with an orificediameter of 50 μm. At the initiation of droplet generation, itwas necessary to apply additional pressure to overcome thecapillary forces between the liquid and the glass tube of thedroplet generator. For this purpose, the liquid feeding systemwas connected to a pressure regulated air supply (CDA)system.The droplet generator was composed of a borosilicate glass
tube surrounded by a piezoceramic tube. A driver (MD-E-3000Microdrop Technologies, Muhlenweg, Norderstedt, Germany)applied a voltage to the piezoceramic tube, contracting the tubein the longitudinal direction.91,92 The droplet generator wasplaced horizontally in an opening of the flow tube wall.Droplets were injected into a gas flow, which provided thethermal energy for the evaporation. The gas flow rate wasmeasured with a flow meter (4000 Series, TSI, Shoreview, MN,USA). Two heaters were located on the top of the flow tube,warming the air to the required temperature. The temperatureof the air was recorded at the droplet injection point and at acollection point at the end of the tube with two type Kthermocouples (TFE-K-20, Omega Engineering, Laval, Que-bec, Canada). The temperature difference between the twopoints ranged from 0 °C, when the drying gas was at roomtemperature, to 10 °C, when the drying gas was at 55 °C.Temperature was monitored using a temperature controller(RK-89000-10, Digi-Sense, Cole Palmer, Laval, Quebec,Canada).For the purpose of measuring the spacing between droplets,
the droplet chain was illuminated with a diode laser (SNF-660Lasiris, Coherent Co., Wilsonville, OR, USA) with a wavelengthof 657 nm, entering through the bottom of the flow tube. Thedriver of the droplet generator controlled a pulse generator(4001, Global Specialties, Yorba Linda, CA, USA) thattriggered the laser pulses. Pulse width and spacing wereadjusted to optimize stroboscopic illumination of the droplets.A digital camera (BM-500 GE GigE Vision, Pleora
Technologies, Kanata, Ontario, Canada) recorded the dropletchain trajectory, including the spacing between the droplets.The camera was connected to a computer for capture andvisualization of the images (JAI GigE Vision SDK and ControlTool, San Jose, CA, USA). For calibration purposes, imageswere recorded with a 1 mm resolution scale bar inserted in thecenter of the flow tube. The calibration process used a pixelresolution of 4.2 × 10⁻² μm/pixel, a magnification of 3.5×, afield of view of 13.9°, and a typical number of pixels across anominal drop of 0.5.As shown in Figure 1, the dried particles were collected for
data analysis at the point labeled “Collection point”. The
particles were considered to be completely dry at this point.Images recorded with a microscope lens showed that a constantdroplet diameter was already reached within the period of timeobservable through the optical window, indicating that thedrying process was nearly complete. As shown in Figure 1,particles continued to dry for a period of time at least 5 timeslonger than observable through the window. Dried particleswere gathered for analysis by ultramicroscopy with a custom-built suction system, placed 30 cm downstream of the injectionpoint. A hollowed-out scanning electron microscope (SEM)sample stub was placed inside the flow tube at the collectionpoint. The SEM stub was covered by double-sided adhesivetape with a central opening holding a membrane filter (GTTP013 00, Millipore Isopore Polycarbonate, Darmstadt, Germany)in place. The suction flow rate was regulated with a ball valveand measured by a flow meter (4000 Series, TSI, Shoreview,MN, USA). The collection flow rate was set to match thedrying gas flow rate. Collected particles were gold sputtercoated with a vacuum desk sputter coater (Desk II, DentonVacuum LLC., Moorestown, NJ, USA)93 and analyzed with ascanning electron microscope (SEM LEO 1430, Zeiss, Jena,
Figure 1. Schematic of the feeding and collection systems. The feedingsystem supplied the test solutions to the piezoceramic dispenser andconsisted of valves, tubing, and a reservoir. The feeding systemsupplies clean dry air (CDA) and liquid to the piezoceramic dispenser.Dried microparticles were collected at the end of a flow tube usinghollowed SEM stubs onto which a filter was placed using a double-sided adhesive ring.
Molecular Pharmaceutics Article
DOI: 10.1021/mp500758sMol. Pharmaceutics XXXX, XXX, XXX−XXX
C

Germany).94 SEM stub samples were kept in SEM mountholders in a storage box (16709 Pelco 18 Pin mount storageholder, Ted Pella Inc., Redding, CA, USA) to avoidcontamination of the particles. In addition, the interior of thesamples was analyzed after cutting them with a focused ionbeam (FIB) (Hitachi NB 50000, Chiyoda, Tokyo, Japan).95
A microscope lens (1-60068, 12× Zoom System, Navitar,Rochester, NY, USA) was used to image individual droplets tomeasure their diameter and morphology. The microscope lensrecorded the droplets and particles from the ejection point tothe collection point; the last image recorded before thecollection point revealed the same diameter and morphology ofthe dried particles imaged by SEM. For this purpose, the flowtube had two opposing optical windows. Droplets wereilluminated using a strobe light (Mounted High Power LEDsM530L3, Thorlabs, Newton, NJ, USA) with a wavelength of530 nm. The strobe light and the microscope lens were alignedand placed on a mounting stage, which was attached to astepping motor (VXM-2 Stepping Motor Controller, Velmex,Bloomfield, NY, USA), thus allowing the system to be movedvertically to follow the droplets along the chain whilemaintaining high magnification. To capture a steady dropletimage, the strobe light and the camera were operated in pulsemode using a pulse generator, named “Pulse generator 1” inFigure 2, (BNC model 575 pulse/delay generator, Berkeley
Nucleonics, San Rafael, CA, USA). This pulse generator hadtwo outputs for the strobe light and the camera and one inputfor the droplet generator driver MD-E-3000, relayed throughanother pulse generator (4001, Global Specialties, Yorba Linda,CA, USA), named “Pulse generator 2” in Figure 2. The secondpulse generator simplified the experiments that did not requirethe microscope lens.The connection between the strobe light, camera, and pulse
generator ensured a common frequency for imaging anddroplet generation. The first pulse generator allowedmodification of the pulse delay and pulse width of the strobelight and camera, as shown in the connected oscilloscope (TDS30143, Tektronix, Beaverton, OR, USA). To calibrate theimaging system, a calibration grid (Mutifunctional TargetDA029, Max Levy Co., Philadelphia, PA, USA) was imaged forevery test. The calibration process used a pixel resolution of0.877 μm/pixel and a typical number of pixels across a nominaldrop of 90. The magnification varied from 3 to 7 depending on
the droplet size, providing, respectively, a depth of field of 0.049and 0.114.
Measurement and Derivation of the Droplet orParticle Diameter. Two distinct methods, denoted spacingand imaging, were used to determine the aerodynamic andvolume equivalent diameters of the droplets or particles. Thevolume equivalent diameter is the diameter of a sphere with thesame volume as that of the droplet or particle considered. Theaerodynamic diameter is the diameter of a sphere with a densityof 1 g/cm3 having the same settling velocity in air as that of thedroplet or particle considered.96 The spacing method derivedthe aerodynamic diameter of the droplets or particles from thedistance between two consecutive droplets or particles in thedroplet chain (Figure 3).
For a given droplet generation frequency, f, the time step Δtbetween the generation of two droplets is simply the inverse ofthe frequency. Hence, the total droplet velocity, vy, can becalculated from the spacing between droplets, Δy, as shown ineq 1.
=ΔΔ
= Δvt
yfy
y (1)
Assuming the droplet reaches its terminal settling velocity, vs,in the time step Δt, the droplet settling velocity can becalculated by subtracting the gas velocity, vg, from the totaldroplet velocity as shown in eq 2,96 where QG is the gas flowrate and dT is the flow tube diameter.
= − = −v v v vQ
d
4s y G y
G
T2
(2)
Here, the gas velocity refers to the velocity at the center ofthe flow tube for a fully developed laminar flow. Formicrodroplets in Stokes flow, the settling velocity is relatedto the droplet diameter as shown in eq 3.96
Figure 2. Schematic illustration of the imaging system.
Figure 3. Annotated example of a typical droplet chain image. Δy isthe spacing between two consecutive droplets, d0, the initial dropletdiameter, d(t), the diameter of a droplet at time t, vs, the settlingvelocity, and vg, the velocity of the gas flow.
Molecular Pharmaceutics Article
DOI: 10.1021/mp500758sMol. Pharmaceutics XXXX, XXX, XXX−XXX
D

ρ
μ=v
d t g( )
18sp
2
(3)
where ρp is the density of the droplet.For microparticles in general, the aerodynamic diameter can
be derived from the settling velocity using eq 3 in combinationwith the definition of the aerodynamic diameter. This results ineq 4, where ρ* is the standard density of 1 g/cm3 and thedynamic viscosity, μ, for air at 20 °C is 1.002 Pa s.97 Thegravitational acceleration at the experiment’s location98 inEdmonton, Canada, was 9.81 m/s2. Since the morphology ofthe solid particles differed for every case considered, the shapefactor, χ, ranged from 1 for particles with spherical appearanceto 1.0996 for particles that resemble a cylinder with an aspectratio of 2.
μρ χ
= *dv
g18
as
(4)
The imaging method derived the volume equivalentdiameter, dv, through image analysis (ImageJ, ImagingProcessing and Analysis in Java, National Institutes of Health,1997, Bethesda, MD, USA) of the images of individual particlestaken by the microscope lens at each point in the trajectory ofthe evaporating droplet. For the case of nonspherical particles,the main dimensions of the shaped particles were derived. Foroblate particles, the major and minor axes were determined,and the particle volume was approximated as that of an oblatespheroid generated by rotating a corresponding ellipse aboutthe major axis.The aerodynamic diameter of the droplets prior to shell
formation was also independently obtained through theimaging method by conversion from the volume equivalentdiameter using the particle density. Assuming evaporation of apure liquid droplet, a theoretical derivation of the dropletdensity can be attained.37 Equation 5 provides the dropletdensity, ρp, as a function of time, where ρt,a is the true density ofacetone, C0 is the CAB initial concentration, d0 is the initialdiameter, and d(t) is the droplet diameter as a function of time.Equation 5 is valid only for dilute solutions; therefore, thisequation is valid only well before shell formation.
ρρ
ρ
=+
=+
= +⎛⎝⎜
⎞⎠⎟
tm m
V
d t C d
d t
Cd
d t
( )( )
( )
( )
Pa CAB
tot
t,a3
0 03
3
t,a 00
3
(5)
The combination of the diameters, found independently withthe two methods, provides two main results: first, validation ofthe theoretical derivations used and, second, determination ofimportant parameters for the particle formation process thatwere previously inaccessible. The comparison between theaerodynamic diameter found with the spacing method and thevolume equivalent diameter found with the imaging methodprovides the density for every phase of the particle formation,even after the shell formation.Experimental Determination of Droplet or Particle
Density and Mass. The droplet or particle density wasobtained through a comparison of the measured volumeequivalent and aerodynamic diameters. In eq 6, da is theaerodynamic diameter, dv is the volume equivalent diameter,and ρ* is standard density of 1 [g/cm3]. This equation permits
the tracing of the particle density through the particle formationprocess.
ρ ρ= *⎛⎝⎜
⎞⎠⎟
ddp
a
v
3
(6)
Once the volume equivalent diameter of the particle nolonger changes, the particles mass can still decrease due tosolvent evaporation from the core of the particle. In this phaseof the particle formation process, the particle mass can bederived from the particle density using eq 7, which can be usedto assess mass loss due to solvent evaporation after shellformation.
πρ=M t
t d( )
( )
6p v
3
(7)
Particle density was also derived via morphology analysis ofthe collected dried particles. After their diameter, df, wasdetermined, the final dried particles density, ρf, was derivedwith eq 8, where d0 is the initial volume equivalent diameterand df is the final dried particle diameter.
ρ =⎛⎝⎜
⎞⎠⎟C
ddf 0
0
f
3
(8)
In summary, the density and the mass of the droplets orparticles during the whole particle formation process werederived from the measured data without knowledge of anyother material or particle properties. In contrast to many othersizing techniques, the presented methods do not require inputof any optical or electrical material properties.
Particle Formation Model. The particle formation modelapplied in this study was developed by Vehring et al.33,99 andfurther refined by Boraey et al.37 The evaporation rate, κ, in thismodel is defined as the change of surface area over time and,using the experimental setup presented above, can beexperimentally determined from the droplet diameter usingeq 9.
κ = − ·d d t f( ( ) )02 2
(9)
The model presented by Boraey et al.37 can predict many ofthe final particle properties such as the volume equivalentdiameter, density, aerodynamic diameter, and the time at whichshell formation occurs based on the Peclet number of theevaporation process.
κ=PeD8 (10)
The diffusivity, D, of CAB in acetone strongly depends onthe mass fraction of acetone in the solution.100 However, theabove-mentioned model assumes a constant diffusivity. Thediffusivity of CAB in acetone close to saturation was chosenbecause this part of the evaporation process is most relevant forparticle formation. The saturation point indicates the point atwhich no more solute dissolved in the remaining solvent. As aresult, after this point the two processes happening are thedistribution of the solute inside the droplet and the mereevaporation of the solvent;101 these two phases are the keys ofthe particle formation process. The mutual diffusivity of CABwith 40 000 g/mol molecular weight in acetone has beenreported as 3.4 ± 0.5 × 10⁻¹¹ m2/s.100 It was adjusted for thehigher molecular weight of the CAB used in the present studyusing the Stokes−Einstein approximation.102
Molecular Pharmaceutics Article
DOI: 10.1021/mp500758sMol. Pharmaceutics XXXX, XXX, XXX−XXX
E

The model further assumes a constant evaporation rate,allowing an approximation of the droplet lifetime, or dryingtime, τD, as the ratio between the initial diameter squared andthe evaporation rate, eq 11.
τκ
=d
D0
2
(11)
From the Peclet number, the surface enrichment can beobtained. The surface enrichment is defined as the ratiobetween the surface concentration of the solute and the averageconcentration in the droplet.33,99 Depending on the value of thePeclet number, different relationships for the surface enrich-ment have been developed. For cases of Pe numbers between25 and 200 that were encountered in this study, eq 12 isapplicable.37
τ = − − − τ−E t Pe Pe( / )1
32[(15 4) (15 36) e ]t
D5 /4 D
(12)
Equation 12 is valid only up to t < 0.75τD. For times later inthe evaporation process, an analytical solution has not beendeveloped, but eq 12 can be extrapolated or the steady-stateapproximation,37 eq 13, can be used as an approximation. Inthis range, eqs 12 and 13 differ by less than 20%.37
= +EPe3
0.363(13)
In the presented model, the surface enrichment can then beused to estimate the time to reach saturation, τsat, i.e., the timefor the solute to reach saturation at the surface (eq 1437). Here,S0 indicates the initial saturation, defined as the ratio betweenthe CAB initial concentration and CAB solubility in acetone.
τ τ= − S E(1 ( ) )sat D 02/3
(14)
Uncertainty Analysis. Two types of uncertainty wereconsidered: the precision derived from the measured data andthe bias estimated from other sources, such as measurementdevices.103 The precision uncertainty was derived from therepeatability of every experiment, which was repeated at least10 times. The bias was derived from the measurement errors ofthe spacing and imaging methods. For instance, the maximumtotal uncertainty derived for aerodynamic and volumeequivalent diameters was 4.2 μm. For other properties, theuncertainty was propagated.
■ RESULTS AND DISCUSSIONMethod Suitability. Figure 4 shows the results of a method
suitability test for the spacing and imaging methods describedabove. The case considered for this test was the one with thelowest initial CAB concentration of 0.37 mg/mL because thecomparison between the aerodynamic diameter derived withthe spacing method and the aerodynamic diameter derived withthe imaging method relies on eq 5, which is valid only for dilutesolutions. In this case, shell formation was not reached duringthe observation window of the experiment. As is customary forevaporation experiments, the results were plotted as the squareof the diameter as a function of time. The time for the nthdroplet in the chain was calculated as nΔt = n/f and thennormalized by the drying time, τD, defined in eq 11. Figure 4shows close agreement between the results of the two newmethods, indicating their suitability for sizing of evaporatingmicrodroplets. A linear fit to the imaging and spacing curves in
Figure 4 shows a difference in slope of 55. Only for the last fewdata points did the results start to deviate from each other,indicating that the dilute solution assumption for eq 5 was nolonger valid.
Tracking of the Particle Formation Process. Four caseswere tested to investigate the effect of process parameters onthe evaporation and particle formation processes and theproperties of the final dry particles. For an initial CABconcentration of 10 mg/mL, drying gas temperatures of 30, 40,and 55 °C were used. The effect of the CAB initial solutionconcentration was investigated by using two differentconcentrations of 0.37 and 10 mg/mL with a constant dryinggas temperature of 30 °C.The particle formation process was evaluated through the
analysis of three main properties: droplet and particlediameters, density, and mass. Figure 5 shows the results ofthe diameter measurements. Two diameters are represented:aerodynamic diameter, eq 4, and the volume equivalentdiameter. Figure 5 shows the diameter squared trend withrespect to the normalized time variable as described for Figure4.As can be observed in Figure 5, the particle formation
process can be described in two stages. In the first stage, theliquid solution droplet shrinks due to solvent evaporation. Asexpected, the square of volume equivalent diameter decreaseslinearly with time, following eq 9. The slope of the closed linesfitted to this stage of the measurements provided theevaporation rates listed in the first column of Table 1. Fromthe first data point followed the initial droplet diameter,reported in the second column of Table 1. The initial diameterdecreased with both an increase in temperature and initialconcentration.The aerodynamic diameter in the first stage of the process
was found to be lower than the volume equivalent diameter.This can be explained by the true density of acetone, which islower than unit density. However, as the evaporationprogresses, the true density of the solution increases accordingto eq 5, and the gap between aerodynamic and volumeequivalent diameter decreases, as shown in Figure 5. It becomesapparent that by measuring both aerodynamic and volumeequivalent diameters the concentration in the evaporatingdroplet can be derived at any point in time.The second stage of the process begins with the deviation
from the constant slope in Figure 5, which indicates a slowingof the evaporation rate. Shortly thereafter, the volume
Figure 4. Comparison of the aerodynamic diameters obtained with thespacing and imaging methods.
Molecular Pharmaceutics Article
DOI: 10.1021/mp500758sMol. Pharmaceutics XXXX, XXX, XXX−XXX
F

equivalent diameter reached a plateau, which can be interpretedas the drying particles having achieved their final size. It isapparent, particularly in panels b and c of Figure 5, that theaerodynamic diameter still decreased in the second stage,whereas the volume equivalent diameter was already constant.This can be interpreted as continuing loss of mass, i.e., solvent,from a particle with fixed size.These trends become more obvious when the density is
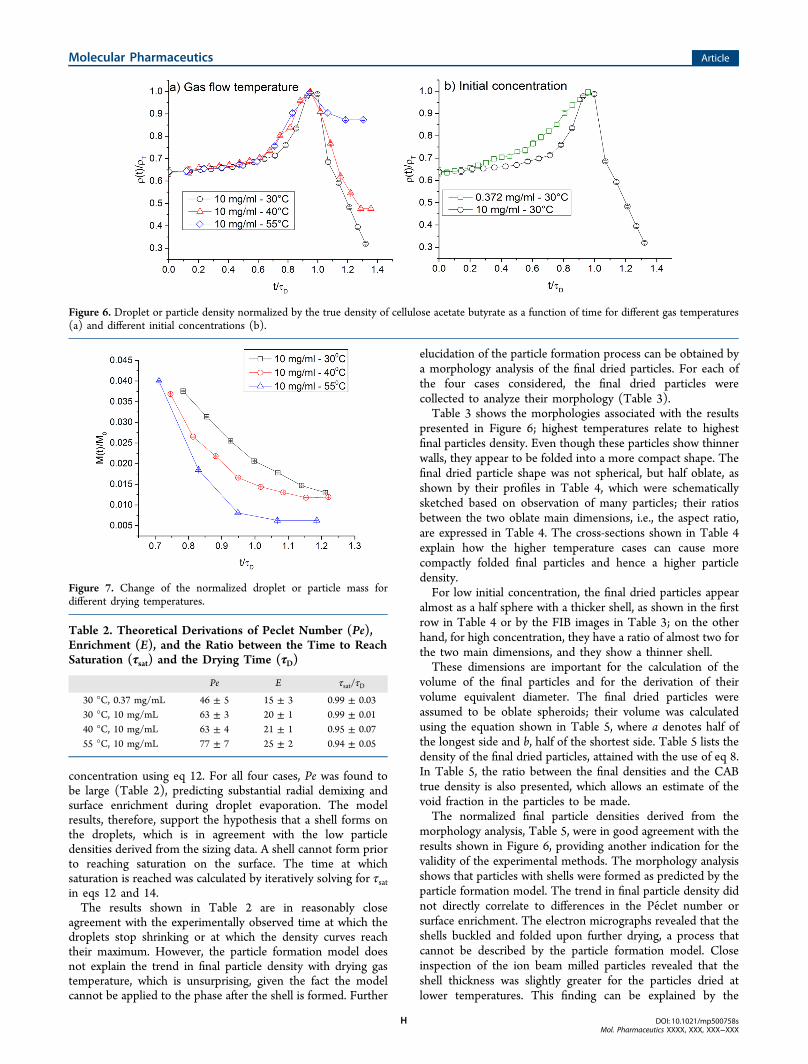
derived from the measured data using eq 6. Figure 6 shows thetrend of the density with respect to the normalized timevariable. Here, the droplet or particle density was normalized bythe true density of CAB. Figure 6a shows the results forvariation of drying gas temperature. In all three cases, theparticle density decreased after reaching a common maximumclose to the true density of CAB. At the end of the observationwindow, the lowest particle densities were found for the casewith the lowest drying temperature. For the 40 and 30 °C cases,
the particle density reached values much lower than the truedensity of CAB; this can be interpreted as formation of dryparticles with significant void space. Figure 6b shows the resultsfor variation of initial CAB concentration. The volumeequivalent diameter for the low concentration case did notreach a plateau during the observation window, so informationabout the shell formation phase could not be derived from thesizing data alone.The mass at every time step was derived from the density, as
shown in Figure 7. In Figure 7, the mass was calculated with eq7 and normalized by the initial mass, i.e., the mass at time step0. The presented methods allow, for the first time, to ourknowledge, direct observation of solvent mass loss rates inisolated microparticles drying in a carrier gas. The drying rate isthe slope of the curves presented in Figure 7. Hence, theplateau in the profile for the particle mass indicates thecompletion of the solvent evaporation process.The results of the particle formation model, while applicable
only to the first stage of the particle formation process, canprovide insight into the underlying mechanism of the process.From the data shown in Table 1, three important parameterswere derived: the Peclet number, the surface enrichment, andthe projected time to reach saturation on the surface. Theresults are reported in Table 2. The Peclet number is defined asthe ratio between the evaporation rate and the diffusivityaccording to eq 10. It was used to estimate the magnitude ofthe surface enrichment of CAB relative to the average
Figure 5. Comparison between the volume equivalent and the aerodynamic diameter for the cases considered: (a) 0.37 mg/mL, 30 °C; (b) 10 mg/mL, 30 °C; (c) 10 mg/mL, 40 °C; and (d) 10 mg/mL, 55 °C. The first diameter ejected from the dispenser is omitted. The line indicates the linearfit to the first part of the volume equivalent diameter curve, indicating the initial evaporation rate.
Table 1. Experimentally Derived Evaporation Rate, InitialDroplet Diameter, and Droplet Life Time for the Four CasesConsidered
κ [μm2/ms] d0 [μm] τD [ms]
30 °C, 0.37 mg/mL 20.2 ± 1.4 89.3 ± 3.9 386 ± 8630 °C, 10 mg/mL 25.2 ± 1.1 87.4 ± 1.7 306 ± 3940 °C, 10 mg/mL 25.6 ± 0.4 86.3 ± 3.3 298 ± 4555 °C, 10 mg/mL 26.4 ± 0.3 73.7 ± 2.4 217 ± 71
Molecular Pharmaceutics Article
DOI: 10.1021/mp500758sMol. Pharmaceutics XXXX, XXX, XXX−XXX
G
concentration using eq 12. For all four cases, Pe was found tobe large (Table 2), predicting substantial radial demixing andsurface enrichment during droplet evaporation. The modelresults, therefore, support the hypothesis that a shell forms onthe droplets, which is in agreement with the low particledensities derived from the sizing data. A shell cannot form priorto reaching saturation on the surface. The time at whichsaturation is reached was calculated by iteratively solving for τsatin eqs 12 and 14.The results shown in Table 2 are in reasonably close
agreement with the experimentally observed time at which thedroplets stop shrinking or at which the density curves reachtheir maximum. However, the particle formation model doesnot explain the trend in final particle density with drying gastemperature, which is unsurprising, given the fact the modelcannot be applied to the phase after the shell is formed. Further
elucidation of the particle formation process can be obtained bya morphology analysis of the final dried particles. For each ofthe four cases considered, the final dried particles werecollected to analyze their morphology (Table 3).Table 3 shows the morphologies associated with the results
presented in Figure 6; highest temperatures relate to highestfinal particles density. Even though these particles show thinnerwalls, they appear to be folded into a more compact shape. Thefinal dried particle shape was not spherical, but half oblate, asshown by their profiles in Table 4, which were schematicallysketched based on observation of many particles; their ratiosbetween the two oblate main dimensions, i.e., the aspect ratio,are expressed in Table 4. The cross-sections shown in Table 4explain how the higher temperature cases can cause morecompactly folded final particles and hence a higher particledensity.For low initial concentration, the final dried particles appear
almost as a half sphere with a thicker shell, as shown in the firstrow in Table 4 or by the FIB images in Table 3; on the otherhand, for high concentration, they have a ratio of almost two forthe two main dimensions, and they show a thinner shell.These dimensions are important for the calculation of the
volume of the final particles and for the derivation of theirvolume equivalent diameter. The final dried particles wereassumed to be oblate spheroids; their volume was calculatedusing the equation shown in Table 5, where a denotes half ofthe longest side and b, half of the shortest side. Table 5 lists thedensity of the final dried particles, attained with the use of eq 8.In Table 5, the ratio between the final densities and the CABtrue density is also presented, which allows an estimate of thevoid fraction in the particles to be made.The normalized final particle densities derived from the
morphology analysis, Table 5, were in good agreement with theresults shown in Figure 6, providing another indication for thevalidity of the experimental methods. The morphology analysisshows that particles with shells were formed as predicted by theparticle formation model. The trend in final particle density didnot directly correlate to differences in the Peclet number orsurface enrichment. The electron micrographs revealed that theshells buckled and folded upon further drying, a process thatcannot be described by the particle formation model. Closeinspection of the ion beam milled particles revealed that theshell thickness was slightly greater for the particles dried atlower temperatures. This finding can be explained by the
Figure 6. Droplet or particle density normalized by the true density of cellulose acetate butyrate as a function of time for different gas temperatures(a) and different initial concentrations (b).
Figure 7. Change of the normalized droplet or particle mass fordifferent drying temperatures.
Table 2. Theoretical Derivations of Peclet Number (Pe),Enrichment (E), and the Ratio between the Time to ReachSaturation (τsat) and the Drying Time (τD)
Pe E τsat/τD
30 °C, 0.37 mg/mL 46 ± 5 15 ± 3 0.99 ± 0.0330 °C, 10 mg/mL 63 ± 3 20 ± 1 0.99 ± 0.0140 °C, 10 mg/mL 63 ± 4 21 ± 1 0.95 ± 0.0755 °C, 10 mg/mL 77 ± 7 25 ± 2 0.94 ± 0.05
Molecular Pharmaceutics Article
DOI: 10.1021/mp500758sMol. Pharmaceutics XXXX, XXX, XXX−XXX
H

theoretical model, which predicts that for droplets that dry atlower temperatures saturation on the surface is reached later;see Figure 6 and Table 2. A later onset of shell formation on asmaller droplet is consistent with increased shell thickness.However, the final particle density is determined by the foldingmechanism, which appeared to lead to less void fraction for theparticles with lesser shell thickness, in agreement with a recentstudy on shell deformation.104
■ CONCLUSIONSThe new approach presented in this study enablescomprehensive experimental and theoretical analysis of theparticle formation process of drying microparticles, demon-strated here on a model compound, cellulose acetate butyrate
(CAB). The process can be tracked from the generation of thesolution droplets to the collection of dried particles. Solventevaporation rates can be assessed throughout the whole particleformation process, including the evaporation through theformed particle shell. The experimental approach relies onmorphology analysis of the dried particles and, additionally, ontwo optical methods that independently derive volumeequivalent and aerodynamic diameters from the spacing ofparticles in a monodisperse droplet chain and from individualparticle images, respectively. From a comparison of theequivalent diameters, the particle density and particle masscan be derived at each point in time, which enables tracking ofshell folding and solvent mass loss rates on partially driedparticles, an area that is currently theoretically inaccessible.Given only the distance between two consecutive particles, theparticle spacing method can provide an accurate prediction offinal particle density. The method is also applicable to morecomplicated combinations of solutes and solvents because itdoes not require knowledge of any optical or electrical materialproperties.In can be shown by current particle formation models and
verified by the presented experimental tools that the particleformation mechanism for solvent droplets dried in a high Pecletregime, as was the case for the current study, is stronglyinfluenced by liquid phase diffusion of the solute. At high Peclet
Table 3. Morphology Analysis by SEM and FIB for the Cases Considered
Table 4. Sketch of the Profiles for Two Main Axes of the Dried Particles Collected for the Four Cases Analyzed
Table 5. Densities of Dry Particles (in kg/m3) and Ratiobetween the Final Density and the CAB True Density (1250kg/m3) for All of the Cases Studied
V = (3/4)πa2bfinal density (ρf)
[kg/m3]final density (ρf)/true
density (ρT)
30 °C, 0.37 mg/mL 38.7 ± 1.7 0.03130 °C, 10 mg/mL 422 ± 1.3 0.33740 °C, 10 mg/mL 728 ± 2 0.58155 °C, 10 mg/mL 930 ± 0.9 0.754
Molecular Pharmaceutics Article
DOI: 10.1021/mp500758sMol. Pharmaceutics XXXX, XXX, XXX−XXX
I

numbers, radial demixing and subsequent surface enrichment ofthe solvent occurs, leading to the formation of a shell. However,the second phase of the process after the shell formation isoutside of the scope of simple analytical particle formationmodels. The experimental results show that shell buckling andfolding dominates this phase and determines the final particleproperties. This provides a strong motivation to developpredictive theoretical models for this phase of the dryingprocess as well.
■ AUTHOR INFORMATION
Corresponding Author*E-mail: [email protected].
Present Address†(M.A.B.) Mechanical Power Engineering Department, ZagazigUniversity, Zagazig 44519, Egypt.
NotesThe authors declare no competing financial interest.
■ ACKNOWLEDGMENTS
Funding from the Natural Sciences and Engineering ResearchCouncil of Canada (NSERC) and the Alberta InnovatesTechnology Futures is gratefully acknowledged. The authorswould also like to acknowledge Luis Augusto Ferraz Albani,who supported the design of the optical components.
■ NOMENCLATURE
C0, initial concentration of CAB in acetone [mg/mL]; D,diffusion coefficient of CAB in acetone [m2/s]; d(t), diameterof a droplet or particles at time t [μm]; da, aerodynamicdiameter [μm]; d0, initial droplet diameter [μm]; dT, diameterof the flow tube [m]; dv, volume equivalent diameter [μm]; E,surface enrichment; Δt, time step between two consecutivedroplets in the droplet chain [μm]; Δy, vertical spacingbetween two consecutive droplets in the droplet chain [μm]; κ,droplet evaporation rate [μm2/ms]; f, droplet productionfrequency [Hz]; g, gravitational acceleration [m2/s]; ma, massof acetone [kg]; mCAB, mass of cellulose acetate butyrate [kg];M(t), mass of a droplet or particle at time t [kg]; μ, drying gasdynamic viscosity [Pa s]; Pe, Peclet number; ρ0, initial densityof the solution droplet [kg/m3]; ρf, density of the driedmicroparticles [kg/m3]; ρp, density of droplets or particles inthe monodisperse droplet chain [kg/m3]; ρt,a, true density ofacetone [kg/m3]; ρ*, standard density [kg/m3]; QG, drying gasflow rate [L/min]; s0, initial solubility [mg/mL]; S0, initialsaturation; t, time [s]; TG; temperature of gas flow [°C]; τD,droplet drying time [ms]; τsat, saturation time [s]; V0, volume ofthe initial droplet of the droplet chain [m3]; vG, drying gas flowvelocity [m2/s]; vs, droplet or particle settling velocity [m2/s];vy, velocity of a falling droplet or particle [m2/s]; χ, particleshape factor
■ REFERENCES(1) Beck-Broichsitter, M.; Schweiger, C.; Schmehl, T.; Gessler, T.;Seeger, W.; Kissel, T. Characterization of novel spray-dried polymericparticles for controlled pulmonary drug delivery. J. Controlled Release2012, 158, 329−335.(2) Zhou, Q. T.; Morton, D. A. Drug−lactose binding aspects inadhesive mixtures: controlling performance in dry powder inhalerformulations by altering lactose carrier surfaces. Adv. Drug Delivery Rev.2012, 64, 275−284.
(3) Geller, D. E.; Weers, J.; Heuerding, S. Development of an inhaleddry-powder formulation of tobramycin using PulmoSphere technol-ogy. J. Aerosol Med. Pulm. Drug Delivery 2011, 24, 175−182.(4) Liu, L.; Sun, L.; Wu, Q.; Guo, W.; Li, L.; Chen, Y.; Li, Y.; Gong,C.; Qian, Z.; Wei, Y. Curcumin loaded polymeric micelles inhibitbreast tumor growth and spontaneous pulmonary metastasis. Int. J.Pharm. 2013, 443, 175−182.(5) Raftery, T. D.; Kerscher, P.; Hart, A. E.; Saville, S. L.; Qi, B.;Kitchens, C. L.; Mefford, O. T.; McNealy, T. L. Discrete nanoparticlesinduce loss of Legionella pneumophila biofilms from surfaces.Nanotoxicology 2014, 8, 477−484.(6) Cipolla, D.; Gonda, I.; Chan, H.-K. Liposomal formulations forinhalation. Ther. Delivery 2013, 4, 1047−1072.(7) Mandal, B.; Bhattacharjee, H.; Mittal, N.; Sah, H.; Balabathula, P.;Thoma, L. A.; Wood, G. C. Core−shell-type lipid−polymer hybridnanoparticles as a drug delivery platform. Nanomed.: Nanotechnol., Biol.Med. 2013, 9, 474−491.(8) Son, Y.-J.; Worth Longest, P.; Hindle, M. Aerosolizationcharacteristics of dry powder inhaler formulations for the excipientenhanced growth (EEG) application: effect of spray drying processconditions on aerosol performance. Int. J. Pharm. 2013, 443, 137−145.(9) Ling, T. Y.; Wang, J.; Pui, D. Y. Measurement of retentionefficiency of filters against nanoparticles in liquids using anaerosolization technique. Environ. Sci. Technol. 2009, 44, 774−779.(10) Chow, A. H.; Tong, H. H.; Chattopadhyay, P.; Shekunov, B. Y.Particle engineering for pulmonary drug delivery. Pharm. Res. 2007,24, 411−437.(11) Schafroth, N.; Arpagaus, C.; Jadhav, U. Y.; Makne, S.;Douroumis, D. Nano and microparticle engineering of water insolubledrugs using a novel spray-drying process. Colloids Surf., B 2012, 90, 8−15.(12) Dennehy, R. D. Particle engineering using power ultrasound.Org. Process Res. Dev. 2003, 7, 1002−1006.(13) Vicente, J.; Pinto, J.; Menezes, J.; Gaspar, F. Fundamentalanalysis of particle formation in spray drying. Powder Technol. 2013,247, 1−7.(14) Handscomb, C.; Kraft, M.; Bayly, A. A new model for the dryingof droplets containing suspended solids after shell formation. Chem.Eng. Sci. 2009, 64, 228−246.(15) Nandiyanto, A. B. D.; Okuyama, K. Progress in developingspray-drying methods for the production of controlled morphologyparticles: From the nanometer to submicrometer size ranges. Adv.Powder Technol. 2011, 22, 1−19.(16) Ali, M. E.; Lamprecht, A. Spray freeze drying for dry powderinhalation of nanoparticles. Eur. J. Pharm. Biopharm. 2014, 87, 510−517.(17) Parsian, A. R.; Vatanara, A.; Rahmati, M. R.; Gilani, K.; Khosravi,K. M.; Najafabadi, A. R. Inhalable budesonide porous microparticlestailored by spray freeze drying technique. Powder Technol. 2014, 260,36−41.(18) Anwar, S. H.; Kunz, B. The influence of drying methods on thestabilization of fish oil microcapsules: Comparison of spraygranulation, spray drying, and freeze drying. J. Food Eng. 2011, 105,367−378.(19) Cabane, B.; Blanchon, S.; Neves, C. Recombination ofnanometric vesicles during freeze-drying. Langmuir 2006, 22, 1982−1990.(20) Mumenthaler, M.; Leuenberger, H. Atmospheric spray-freezedrying: a suitable alternative in freeze-drying technology. Int. J. Pharm.1991, 72, 97−110.(21) Philippot, G.; Elissalde, C.; Maglione, M.; Aymonier, C.Supercritical fluid technology: a reliable process for high qualityBaTiO3 based nanomaterials. Adv. Powder Technol. 2014, 25, 1415−1429.(22) García-Gonzalez, C.; Smirnova, I. Use of supercritical fluidtechnology for the production of tailor-made aerogel particles fordelivery systems. J. Supercrit. Fluids 2013, 79, 152−158.
Molecular Pharmaceutics Article
DOI: 10.1021/mp500758sMol. Pharmaceutics XXXX, XXX, XXX−XXX
J

(23) Yoon, S.-D.; Byun, H.-S. Molecularly imprinted polymers forselective separation of acetaminophen and aspirin by using super-critical fluid technology. Chem. Eng. J. 2013, 226, 171−180.(24) Matson, D. W.; Smith, R. D. Supercritical fluid technologies forceramic-processing applications. J. Am. Ceram. Soc. 1989, 72, 871−881.(25) Wang, H.; Zhang, X.; Yang, G.; Xu, Y.; Ma, H.; Adam, J.; Gu, Z.a.; Chen, G. Micro-crystallization of the infrared transmittingchalcogenide glass in GeSe−PbSe system. Ceram. Int. 2009, 35, 83−86.(26) Liu, X.; Wang, X.; Sun, Z.; Lin, X.; Zhang, G.; Xu, D. Study onmicro-crystallization, growth, optical properties and defects of anonlinear optical crystal: MnHg (SCN). J. Cryst. Growth 2011, 317,92−97.(27) Sun, G.; Zhang, G.; Wang, X.; Xu, D. Nucleation kinetics,micro-crystallization and etching studies of l-histidine trifluoroacetatecrystal. J. Cryst. Growth 2011, 316, 132−136.(28) Redinova, T. [Microcrystallization of the saliva in childrenfollowing carbohydrate intake and the performance of cariesprophylactic measures]. Stomatologiia 1988, 68, 62−63.(29) Wu, Y.; Zou, L.; Mao, J.; Huang, J.; Liu, S. Stability andencapsulation efficiency of sulforaphane microencapsulated by spraydrying. Carbohydr. Polym. 2014, 102, 497−503.(30) Saffari, M.; Langrish, T. Effect of lactic acid in-processcrystallization of lactose/protein powders during spray drying. J.Food Eng. 2014, 137, 88−94.(31) Kumar, S.; Gokhale, R.; Burgess, D. J. Quality by designapproach to spray drying processing of crystalline nanosuspensions.Int. J. Pharm. 2014, 464, 234−242.(32) Masters, K. Spray Drying; CRC Press: Cleveland, OH, 1972.(33) Vehring, R.; Foss, W. R.; Lechuga-Ballesteros, D. Particleformation in spray drying. J. Aerosol Sci. 2007, 38, 728−746.(34) Donz, E.; Boiron, P.; Courthaudon, J.-L. Characterization ofindustrial dried whey emulsions at different stages of spray-drying. J.Food Eng. 2014, 126, 190−197.(35) Odziomek, M.; Sosnowski, T. R.; Gradon , L. Conception,preparation and properties of functional carrier particles for pulmonarydrug delivery. Int. J. Pharm. 2012, 433, 51−59.(36) Buck, A.; Palis, S.; Tsotsas, E. Model-based control of particleproperties in fluidised bed spray granulation. Powder Technol. 2015,270, 575−583.(37) Boraey, M. A.; Vehring, R. Diffusion controlled formation ofmicroparticles. J. Aerosol Sci. 2014, 67, 131−143.(38) Gradon, L.; Sosnowski, T. R. Formation of particles for drypowder inhalers. Adv. Powder Technol. 2014, 25, 43−55.(39) Paudel, A.; Worku, Z. A.; Meeus, J.; Guns, S.; Van den Mooter,G. Manufacturing of solid dispersions of poorly water soluble drugs byspray drying: formulation and process considerations. Int. J. Pharm.2013, 453, 253−284.(40) Wegener, M.; Paul, N.; Kraume, M. Fluid dynamics and masstransfer at single droplets in liquid/liquid systems. Int. J. Heat MassTransfer 2014, 71, 475−495.(41) Chen, W.-H.; Hou, Y.-L.; Hung, C.-I. A theoretical analysis ofthe capture of greenhouse gases by single water droplet at atmosphericand elevated pressures. Appl. Energy 2011, 88, 5120−5130.(42) Perdana, J.; Bereschenko, L.; Fox, M. B.; Kuperus, J. H.;Kleerebezem, M.; Boom, R. M.; Schutyser, M. A. Dehydration andthermal inactivation of Lactobacillus plantarum WCFS1: Comparingsingle droplet drying to spray and freeze drying. Food Res. Int. 2013,54, 1351−1359.(43) Davies, J. F.; Miles, R. E.; Haddrell, A. E.; Reid, J. P. Influence oforganic films on the evaporation and condensation of water in aerosol.Proc. Natl. Acad. Sci. U.S.A. 2013, 110, 8807−8812.(44) Reid, J. P.; Meresman, H.; Mitchem, L.; Symes, R. Spectroscopicstudies of the size and composition of single aerosol droplets. Int. Rev.Phys. Chem. 2007, 26, 139−192.(45) Chainani, E. T.; Ngo, K. T.; Scheeline, A. Electrochemistry in anacoustically levitated drop. Anal. Chem. 2013, 85, 2500−2506.
(46) Kukkonen, J.; Vesala, T.; Kulmala, M. The interdependence ofevaporation and settling for airborne freely falling droplets. J. AerosolSci. 1989, 20, 749−763.(47) Vesala, T.; Kukkonen, J.; Kulmala, M. A model for evaporationof freely falling droplets. NASA STI/Recon Technical Report N 1989,90, 18007.(48) Ali Al Zaitone, B.; Tropea, C. Evaporation of pure liquiddroplets: comparison of droplet evaporation in an acoustic field versusglass-filament. Chem. Eng. Sci. 2011, 66, 3914−3921.(49) Toth, T.; Ferraro, D.; Chiarello, E.; Pierno, M.; Mistura, G.;Bissacco, G.; Semprebon, C. Suspension of water droplets onindividual pillars. Langmuir 2011, 27, 4742−4748.(50) Duprat, C.; Bick, A. D.; Warren, P. B.; Stone, H. A. Evaporationof drops on two parallel fibers: influence of the liquid morphology andfiber elasticity. Langmuir 2013, 29, 7857−7863.(51) Shih, A. T.; Megaridis, C. M. Suspended droplet evaporationmodeling in a laminar convective environment. Combust. Flame 1995,102, 256−270.(52) Fakhari, A.; Lee, T. Multiple-relaxation-time lattice Boltzmannmethod for immiscible fluids at high Reynolds numbers. Phys. Rev. E2013, 87, 023304.(53) Chen, W.-H.; Tsai, M.-H.; Hung, C.-I. Numerical prediction ofCO2 capture process by a single droplet in alkaline spray. Appl. Energy2013, 109, 125−134.(54) Jalaal, M.; Mehravaran, K. Fragmentation of falling liquiddroplets in bag breakup mode. Int. J. Multiphase Flow 2012, 47, 115−132.(55) Crowe, C. T.; Sharma, M.; Stock, D. E. The particle-source-incell (PSI-CELL) model for gas-droplet flows. J. Fluids Eng. 1977, 99,325−332.(56) Rogers, S.; Wu, W. D.; Lin, S. X. Q.; Chen, X. D. Particleshrinkage and morphology of milk powder made with a monodispersespray dryer. Biochem. Eng. J. 2012, 62, 92−100.(57) Li, Y.; Zhang, S.; Li, J. Indirect-mode jet pulse spray systemdesign and monodisperse droplets generation. Chem. Eng. Sci. 2012,68, 461−468.(58) Azhdarzadeh, M.; Olfert, J. S.; Vehring, R.; Finlay, W. H. Effectof electrostatic charge on oral-extrathoracic deposition for uniformlycharged monodisperse aerosols. J. Aerosol Sci. 2014, 68, 38−45.(59) Berglund, R. N.; Liu, B. Y. Generation of monodisperse aerosolstandards. Environ. Sci. Technol. 1973, 7, 147−153.(60) Subramaniam, V.; Garimella, S. Numerical study of heat andmass transfer in lithium bromide-water falling films and droplets. Int. J.Refrig. 2014, 40, 211−226.(61) Bararnia, H.; Seyyedi, S.; Ganji, D.; Khorshidi, B. Numericalinvestigation of the coalescence and breakup of falling multi-droplets.Colloids Surf., A 2013, 424, 40−51.(62) Elperin, T.; Fominykh, A.; Krasovitov, B. Non-isothermalscavenging of highly soluble gaseous pollutants by rain in theatmosphere with non-uniform vertical concentration and temperaturedistributions. Meteorol. Atmos. Phys. 2014, 125, 197−211.(63) Caiazzo, G.; Di Nardo, A.; Langella, G.; Scala, F. Seawaterscrubbing desulfurization: A model for SO2 absorption in fall-downdroplets. Environ. Prog. Sustainable Energy 2012, 31, 277−287.(64) Frackowiak, B.; Lavergne, G.; Tropea, C.; Strzelecki, A.Numerical analysis of the interactions between evaporating dropletsin a monodisperse stream. Int. J. Heat Mass Transfer 2010, 53, 1392−1401.(65) Sazhin, S. Heating and evaporation of monocomponentdroplets. In Droplets and Sprays; Springer: New York, 2014; pp 97−142.(66) Waldron, K.; Wu, W. D.; Wu, Z.; Liu, W.; Selomulya, C.; Zhao,D.; Chen, X. D. Formation of monodisperse mesoporous silicamicroparticles via spray-drying. J. Colloid Interface Sci. 2014, 418, 225−233.(67) Seemann, R.; Brinkmann, M.; Pfohl, T.; Herminghaus, S.Droplet based microfluidics. Rep. Prog. Phys. 2012, 75, 016601.
Molecular Pharmaceutics Article
DOI: 10.1021/mp500758sMol. Pharmaceutics XXXX, XXX, XXX−XXX
K

(68) Vladisavljevic, G.; Kobayashi, I.; Nakajima, M. Production ofuniform droplets using membrane, microchannel and microfluidicemulsification devices. Microfluid. Nanofluid. 2012, 13, 151−178.(69) Roger, K.; Botet, R.; Cabane, B. Coalescence of repellingcolloidal droplets: a route to monodisperse populations. Langmuir2013, 29, 5689−5700.(70) Verboket, P. E.; Borovinskaya, O.; Meyer, N.; Gunther, D.;Dittrich, P. S. A new microfluidics based droplet dispenser for ICPMS.Anal. Chem. 2014, 86, 6012−6018.(71) Rogers, S.; Fang, Y.; Qi Lin, S. X.; Selomulya, C.; Dong Chen, X.A monodisperse spray dryer for milk powder: modelling the formationof insoluble material. Chem. Eng. Sci. 2012, 71, 75−84.(72) Schutyser, M. A.; Perdana, J.; Boom, R. M. Single droplet dryingfor optimal spray drying of enzymes and probiotics. Trends Food Sci,Technol, 2012, 27, 73−82.(73) Scoutaris, N.; Alexander, M. R.; Gellert, P. R.; Roberts, C. J.Inkjet printing as a novel medicine formulation technique. J. ControlledRelease 2011, 156, 179−185.(74) Parsa, S.; Gupta, M.; Loizeau, F.; Cheung, K. C. Effects ofsurfactant and gentle agitation on inkjet dispensing of living cells.Biofabrication 2010, 2, 025003.(75) Velichko, Y. S.; Khalatur, P. G.; Khokhlov, A. R. Moleculardispenser: conformation-dependent design approach. Macromolecules2003, 36, 5047−5050.(76) Frederickson, C. J.; Hayes, D. J.; Wallace, D. B.; Ussery, D.;Arcoria, C. J.; Motamedi, M.; Jennett, E.; Diven, D. Applications offluid MicroJets to medical and dental laser procedures. Proc. SPIE1995, 2396, 248−253.(77) Sgro, A. E.; Allen, P. B.; Chiu, D. T. Thermoelectricmanipulation of aqueous droplets in microfluidic devices. Anal.Chem. 2007, 79, 4845−4851.(78) Zhu, Y.; Power, B. E. Lab-on-a-chip in vitro compartmentaliza-tion technologies for protein studies. Adv. Biochem. Eng./Biotechnol.2008, 110, 81−114.(79) Riefler, N.; Wriedt, T. Generation of monodisperse micron-sized droplets using free adjustable signals. Part. Part. Syst. Charact.2008, 25, 176−182.(80) Shemirani, F. M.; Azhdarzadeh, M.; Mohammad, T.; Fong, J.;Church, T. K.; Lewis, D. A.; Finlay, W. H.; Vehring, R. A continuous,monodisperse propellant microdroplet stream as a model system forlaser analysis of mass transfer in metered dose inhaler sprays. Respir.Drug Delivery 2012, 773−776.(81) Lind, T.; Danner, S.; Guentay, S. Monodisperse fine aerosolgeneration using fluidized bed. Powder Technol. 2010, 199, 232−237.(82) Rajagopalan, V.; Grulke, E.; Ray, A.Generation of multi-component polymer particles using microdroplet evaporationtechnique. Chem. Eng. 2011, 24.(83) Tracey, P. J.; Vaughn, B. S.; Roberts, B. J.; Poad, B. L.; Trevitt,A. J. Rapid profiling of laser-induced photochemistry in singlemicrodroplets using mass spectrometry. Anal. Chem. 2014, 86,2895−2899.(84) Liu, B. Y.; Agarwal, J. K. Experimental observation of aerosoldeposition in turbulent flow. J. Aerosol Sci. 1974, 5, 145−155.(85) Ashgriz, N.; Yao, S. Development of a controlled spraygenerator. Rev. Sci. Instrum. 1987, 58, 1291−1296.(86) Boraey, M. A.; Hoe, S.; Sharif, H.; Miller, D. P.; Lechuga-Ballesteros, D.; Vehring, R. Improvement of the dispersibility of spray-dried budesonide powders using leucine in an ethanol−watercosolvent system. Powder Technol. 2013, 236, 171−178.(87) Huang, C.; Mahidhara, G.; Ke, Q.; Mo, X. A controlled releasesystem of biomacromolecules by encapsulating nanoparticles inelectrospun cellulose acetate butyrate nanofibers. J. Controlled Release2013, 172, e99.(88) Nibha, K. P.; Pancholi, S. An overview on: Sublingual route forsystemic drug delivery. Int. J. Res. Pharm. Biomed. Sci. 2012, 3, 913−923.(89) Keraliya, R. A.; Patel, C.; Patel, P.; Keraliya, V.; Soni, T. G.;Patel, R. C.; Patel, M.Osmotic drug delivery system as a part ofmodified release dosage form. ISRN Pharm. 2012, 2012.
(90) Vehring, R. Berechnung des Verdunstungs Prozesses vonMonodispersen Aerosolpartikeln. Ph.D. Thesis, Universitat Gesamthoch-schule, Duisburg, Germany, 1989.(91) Ulmke, H.; Wriedt, T.; Bauckhage, K. Piezoelectric dropletgenerator for the calibration of particle-sizing instruments. Chem. Eng.Technol. 2001, 24, 265−268.(92) Bogy, D. B.; Talke, F. Experimental and theoretical study ofwave propagation phenomena in drop-on-demand ink jet devices. IBMJ. Res. Dev. 1984, 28, 314−321.(93) Lee, K.; Cai, Z.; Griggs, J.; Guiatas, L.; Lee, D.; Okabe, T. SEM/EDS evaluation of porcelain adherence to gold-coated cast titanium. J.Biomed. Mater. Res., Part B 2004, 68, 165−173.(94) Everhart, T. E.; Hayes, T. L. The scanning electron microscope.Sci. Am. 1972, 226, 55−69.(95) Watkins, R.; Rockett, P.; Thoms, S.; Clampitt, R.; Syms, R.Focused ion beam milling. Vacuum 1986, 36, 961−967.(96) Hinds, W. C. Aerosol Technology: Properties, Behavior, andMeasurement of Airborne Particles; John Wiley & Sons: New York,2012.(97) Watson, J. T. R.; Basu, R.; Sengers, J. V. An improvedrepresentative equation for the dynamic viscosity of water substance. J.Phys. Chem. Ref. Data 1980, 9, 1255−1290.(98) Lightman, A. P. Problem book in relativity and gravitation;Princeton University Press: Princeton, NJ, 1975.(99) Vehring, R. Pharmaceutical particle engineering via spray drying.Pharm. Res. 2008, 25, 999−1022.(100) Verros, G.; Malamataris, N. Estimation of diffusion coefficientsin acetone-cellulose acetate solutions. Ind. Eng. Chem. Res. 1999, 38,3572−3580.(101) Petit, C.; Zemb, T.; Pileni, M. Structural study of micro-emulsion-based gels at the saturation point. Langmuir 1991, 7, 223−231.(102) Edward, J. T. Molecular volumes and the Stokes−Einsteinequation. J. Chem. Educ. 1970, 47, 261.(103) Beckwith, T. G.; Marangoni, R. D.; Lienhard, J. H. MechanicalMeasurements; Prentice Hall: Upper Saddle River, NJ, 2007.(104) Meng, F.; Doi, M.; Ouyang, Z. Cavitation in drying droplets ofsoft matter solutions. Phys. Rev. Lett. 2014, 113, 098301.
Molecular Pharmaceutics Article
DOI: 10.1021/mp500758sMol. Pharmaceutics XXXX, XXX, XXX−XXX
L