Embed Size (px)
Citation preview
STATISTICS OF MIGRATIONBALI
Hasil Sensus Penduduk 2010Results of the 2010 Population Census
Katalog BPS : 2204003.51
BADAN PUSAT STATISTIKStatistics Indonesia
https:
//www.b
ps.go.id

https:
//www.b
ps.go.id
STATISTIK MIGRASI BALI
STATISTICS OF MIGRATION BALI
Hasil Sensus Penduduk 2010
Results of the 2010 Population Census
BADAN PUSAT STATISTIK Statistics Indonesia
https:
//www.b
ps.go.id
STATISTIK MIGRASI BALI HASIL SENSUS PENDUDUK 2010 Statistics of Migration Bali Results of the 2010 Population Census ISBN. 978-979-064-519-6 No. Publikasi / Publication Number : 04140.1219 Katalog BPS / BPS Cataloque : 2204003.51 Ukuran Buku / Book Size : 21Cm x 28 Cm Naskah / Manuscript : Subdirektorat Statistik Mobilitas Penduduk dan Tenaga Kerja Subdirectorate of Population and Labour Force Mobility Statistics Gambar Kulit / Cover Design : Subdirektorat Statistik Mobilitas Penduduk dan Tenaga Kerja Subdirectorate of Population and Labour Force Mobility Statistics Diterbitkan oleh / Published by : Badan Pusat Statistik BPS – Statistics Indonesia Dicetak oleh / Printed by : Boleh dikutip dengan menyebut sumbernya
ii
May be cited with reference to the source
https:
//www.b
ps.go.id
KATA PENGANTAR
Migrasi atau perpindahan permanen merupakan salah satu komponen pertumbuhan penduduk selain fertilitas dan mortalitas. Namun demikian, dibandingkan dengan data fertilitas dan mortalitas, data migrasi masih sangat langka. Hal ini disebabkan oleh ketiadaan survei tersendiri untuk migrasi. Pertanyaan migrasi hanya tersedia lima tahun sekali, ditanyakan dalam sensus penduduk dan survei penduduk antar sensus. Kejadian migrasi adalah kejadian demografi yang sangat jarang, tidak semua orang mengalaminya, sehingga data migrasi yang berasal dari survei umumnya kurang baik karena terkait kecilnya sampel. Sementara, data migrasi yang bersumber dari pencatatan administrasi masih jauh dari kesempurnaan.
Dalam rangka memenuhi kebutuhan data migrasi secara lebih lengkap, maka Publikasi Statistik Migrasi hasil Sensus Penduduk 2010 ini disusun. Publikasi yang disajikan terdiri dari publikasi nasional dan provinsi dimana mencakup jenis migrasi seumur hidup dan migrasi risen. Pada publikasi nasional disajikan data migrasi untuk tingkat perpindahan antar provinsi. Sementara untuk publikasi provinsi disajikan data migrasi untuk tingkat perpindahan antar kabupaten/kota. Publikasi Statistik Migrasi ini merupakan publikasi pertama yang menyajikan secara lengkap besaran dan arus migrasi internal secara nasional dan masing-masing provinsi. Selain itu juga menyajikan karakteristik dari pelaku migrasi.
Semoga, publikasi ini dapat menjembatani kelangkaan data migrasi yang ada. Lebih jauh lagi, dapat membantu menjawab permasalahan kependudukan seperti komposisi penduduk, disparitas penduduk, kepadatan penduduk serta dapat dipakai untuk menyusun kebijakan kependudukan di Indonesia.
Kepada semua pihak yang telah membantu tersusunnya publikasi ini diucapkan terima kasih. Saran serta kritik dari pembaca sangat kami hargai.
Jakarta, Oktober 2012
Kepala Badan Pusat Statistik
Dr. Suryamin
iii
https:
//www.b
ps.go.id
FOREWORD
Migration or permanent migration is one of the component of population growth, in addition to fertility and mortality. However, compared with the data of fertility and mortality, migration data are still very scarce. This is caused by the absence of a separate survey specifically designed for migration. The question on migration is only available every five years, asked in the census and the inter-censal population survey. Occurance of demographic migration is a very rare, as not all people experience it, so the migration data from the survey are generally less reliable due to the small sample. Meanwhile, migration data derived from administrative records are still far from perfect.
In order to meet the needs of a more complete migration data, the Migration Statistics Publication derived from 2010 Population Census results was prepared. Publication is presented nationally and provincially, which include types of lifetime and recent migration. The national publication also presented migration data on movement among provinces, while provincial publication presented migration data on movement among districts. This is the first publication that presents the magnitude and internal migration flows. It also presented the characteristics of migrants.
It is our hope that, this publication is capable of bridging the existing scarcity of migration data. Furthermore, it can help answer problems such as the composition of the resident population, disparity in population, population density and can also be used to help formulate population policies in Indonesia.
BPS greatly appreciates and acknowledges all those who have assisted in the preparation of this publication. Advice and criticism from readers is also appreciated.
Jakarta, October 2012
BPS-Statistics Indonesia
Dr. Suryamin Chief Statistician
iv
https:
//www.b
ps.go.id
v
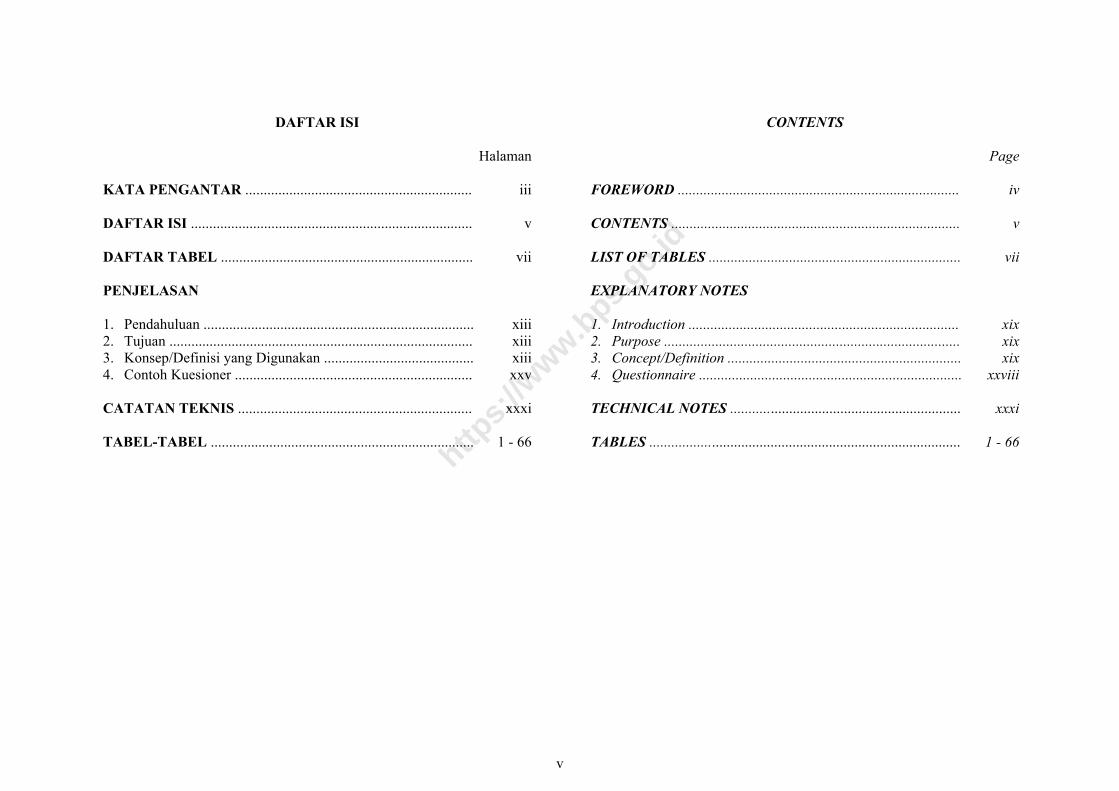
DAFTAR ISI
Halaman
KATA PENGANTAR .............................................................. iii DAFTAR ISI ............................................................................. v DAFTAR TABEL ..................................................................... vii PENJELASAN 1. Pendahuluan .......................................................................... xiii2. Tujuan ................................................................................... xiii3. Konsep/Definisi yang Digunakan ......................................... xiii4. Contoh Kuesioner ................................................................. xxv CATATAN TEKNIS ................................................................ xxxi TABEL-TABEL ........................................................................ 1 - 66
CONTENTS
Page FOREWORD ............................................................................. iv CONTENTS ............................................................................... v LIST OF TABLES ..................................................................... vii EXPLANATORY NOTES 1. Introduction .......................................................................... xix 2. Purpose ................................................................................. xix 3. Concept/Definition ................................................................ xix 4. Questionnaire ........................................................................ xxviii TECHNICAL NOTES ............................................................... xxxi TABLES ..................................................................................... 1 - 66
https:
//www.b
ps.go.id

vi
https:
//www.b
ps.go.id
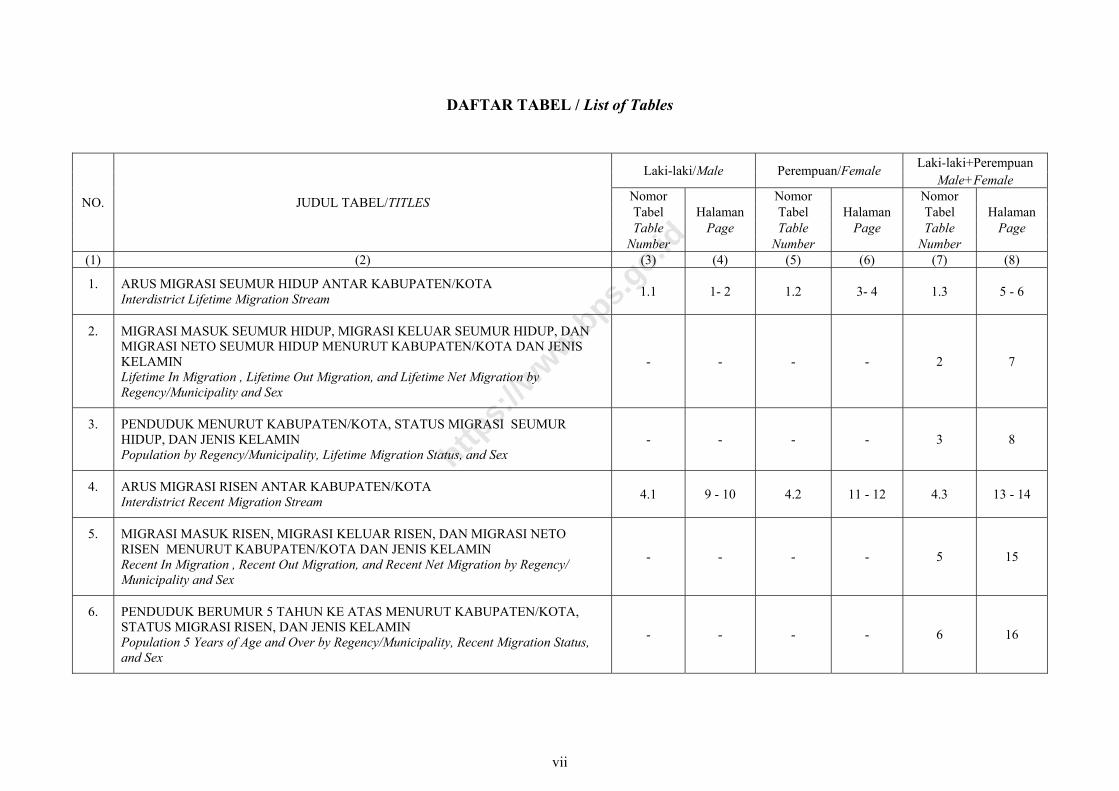
DAFTAR TABEL / List of Tables
NO. JUDUL TABEL/TITLES
Laki-laki/Male Perempuan/Female Laki-laki+Perempuan Male+Female
Nomor Nomor Nomor Tabel Halaman Tabel Halaman Tabel Halaman Table Page Table Page Table Page
Number Number Number (1) (2) (3) (4) (5) (6) (7) (8)
1. ARUS MIGRASI SEUMUR HIDUP ANTAR KABUPATEN/KOTA Interdistrict Lifetime Migration Stream 1.1 1- 2 1.2 3- 4 1.3 5 - 6
2. MIGRASI MASUK SEUMUR HIDUP, MIGRASI KELUAR SEUMUR HIDUP, DAN MIGRASI NETO SEUMUR HIDUP MENURUT KABUPATEN/KOTA DAN JENIS KELAMIN Lifetime In Migration , Lifetime Out Migration, and Lifetime Net Migration by Regency/Municipality and Sex
- - - - 2 7
3. PENDUDUK MENURUT KABUPATEN/KOTA, STATUS MIGRASI SEUMUR HIDUP, DAN JENIS KELAMIN Population by Regency/Municipality, Lifetime Migration Status, and Sex
- - - - 3 8
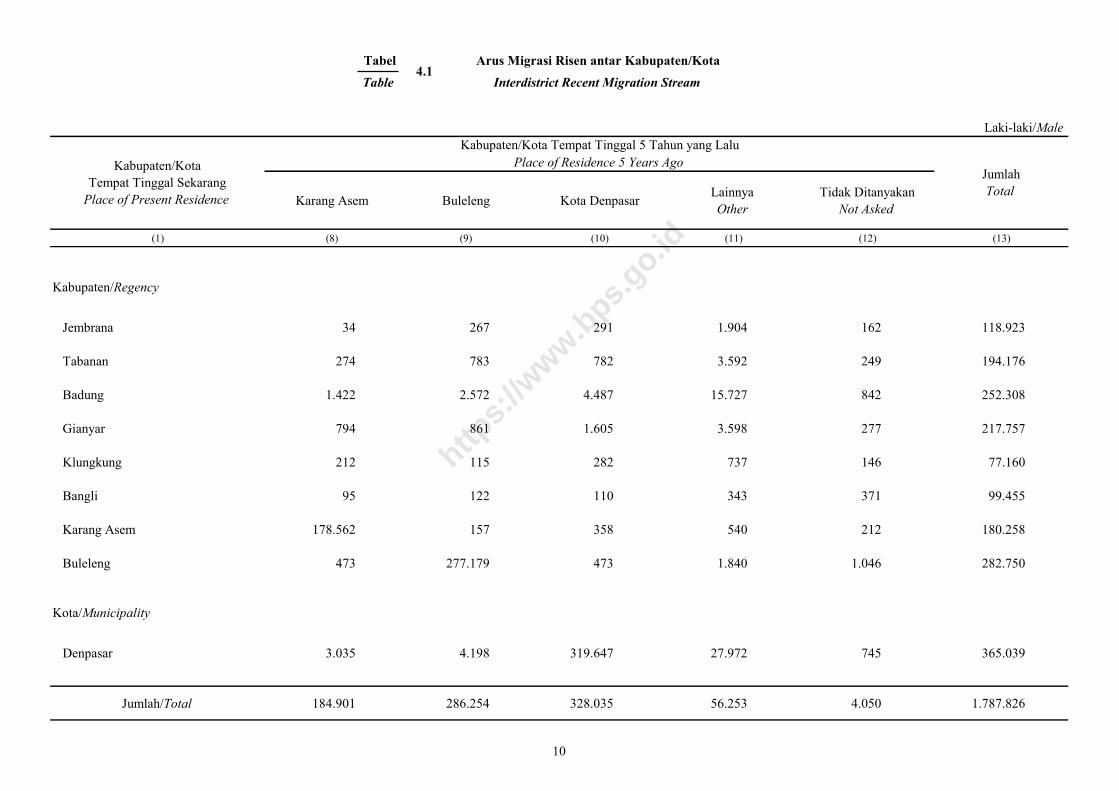
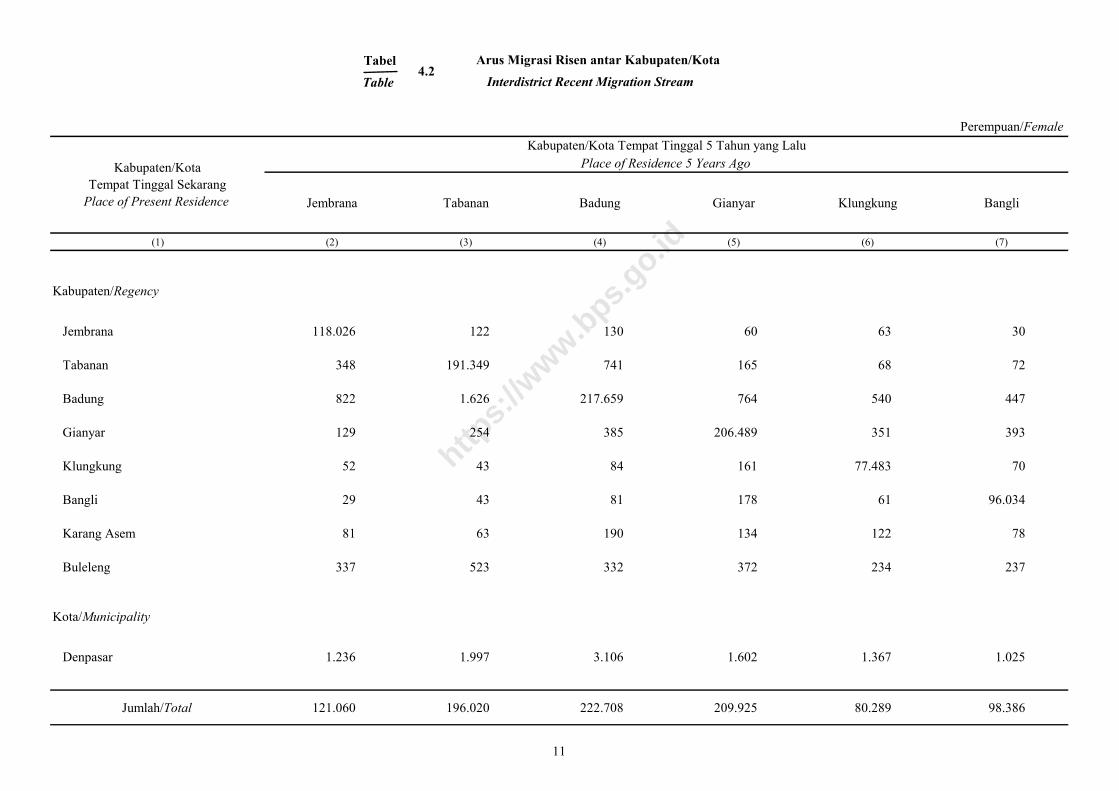
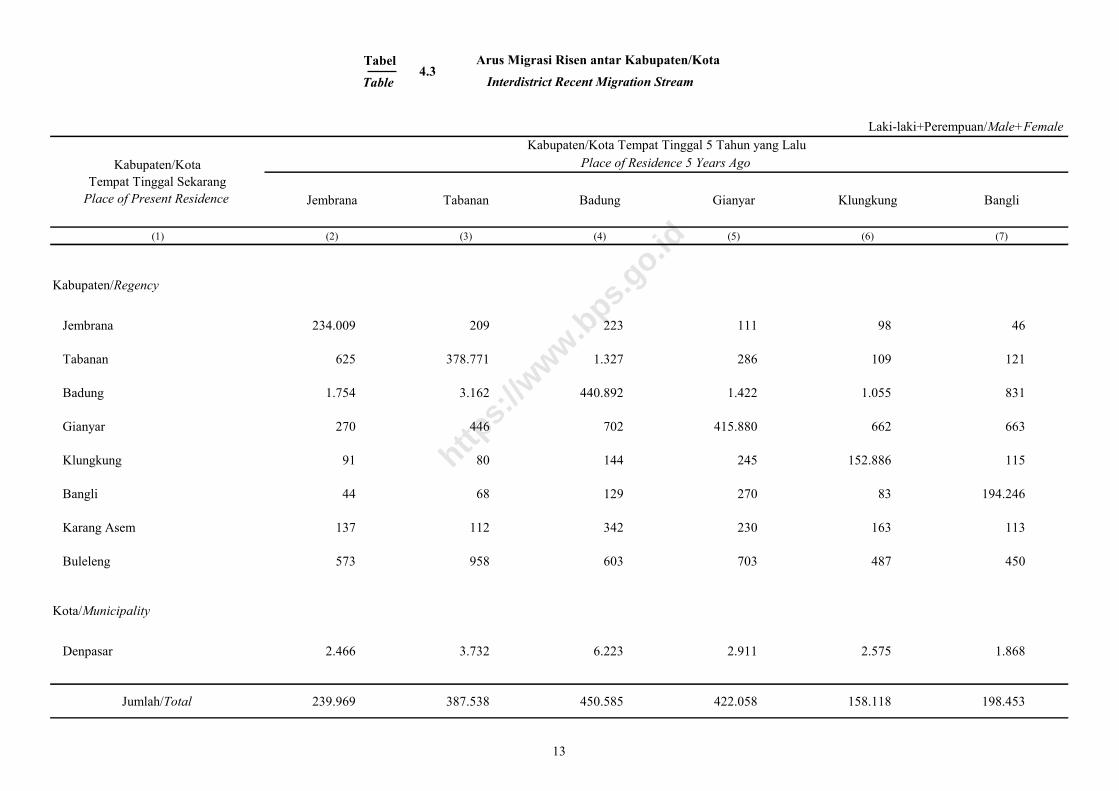
4. ARUS MIGRASI RISEN ANTAR KABUPATEN/KOTA Interdistrict Recent Migration Stream 4.1 9 - 10 4.2 11 - 12 4.3 13 - 14
5. MIGRASI MASUK RISEN, MIGRASI KELUAR RISEN, DAN MIGRASI NETO RISEN MENURUT KABUPATEN/KOTA DAN JENIS KELAMIN Recent In Migration , Recent Out Migration, and Recent Net Migration by Regency/ Municipality and Sex
- - - - 5 15
6. PENDUDUK BERUMUR 5 TAHUN KE ATAS MENURUT KABUPATEN/KOTA, STATUS MIGRASI RISEN, DAN JENIS KELAMIN Population 5 Years of Age and Over by Regency/Municipality, Recent Migration Status, and Sex
- - - - 6 16
vii
https:
//www.b
ps.go.id
Laki-laki+Perempuan
NO. JUDUL TABEL/TITLES
Laki-laki/Male Perempuan/Female Male+Female
Nomor Nomor Nomor Tabel Halaman Tabel Halaman Tabel Halaman Table Page Table Page Table Page
Number Number Number (1) (2) (3) (4) (5) (6) (7) (8)
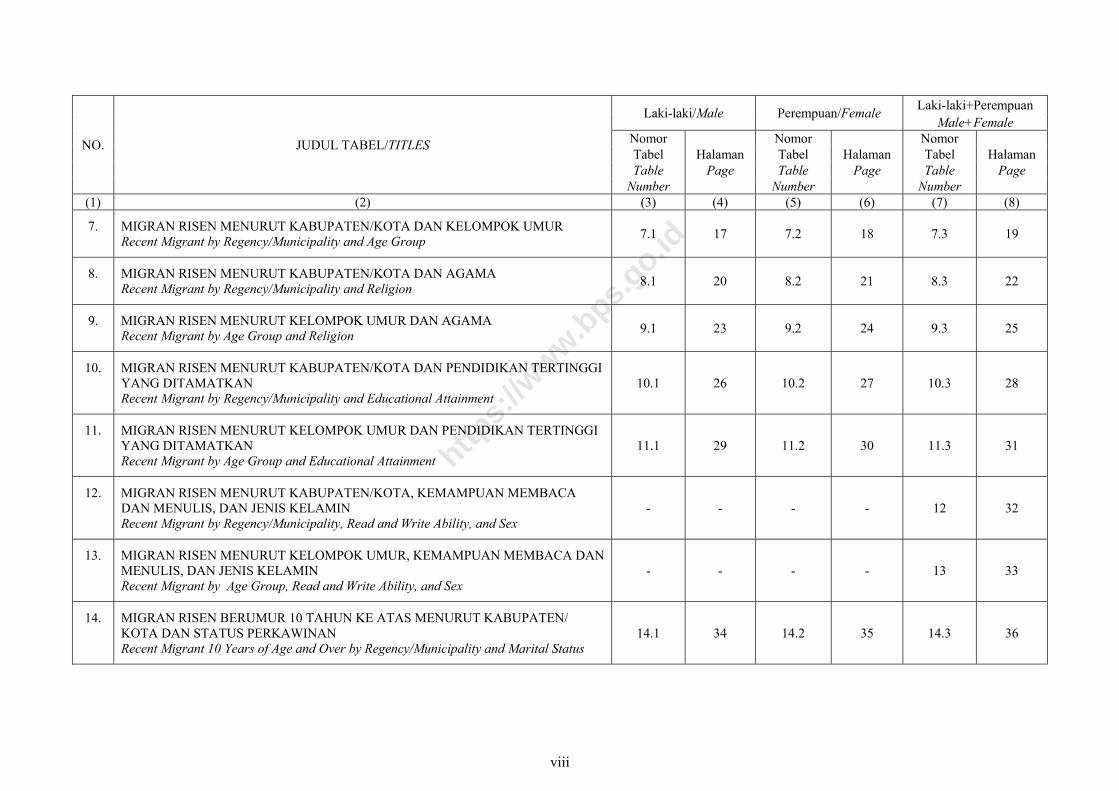
7. MIGRAN RISEN MENURUT KABUPATEN/KOTA DAN KELOMPOK UMUR Recent Migrant by Regency/Municipality and Age Group 7.1 17 7.2 18 7.3 19
8. MIGRAN RISEN MENURUT KABUPATEN/KOTA DAN AGAMA Recent Migrant by Regency/Municipality and Religion 8.1 20 8.2 21 8.3 22
9. MIGRAN RISEN MENURUT KELOMPOK UMUR DAN AGAMA Recent Migrant by Age Group and Religion 9.1 23 9.2 24 9.3 25
10. MIGRAN RISEN MENURUT KABUPATEN/KOTA DAN PENDIDIKAN TERTINGGI YANG DITAMATKAN Recent Migrant by Regency/Municipality and Educational Attainment
10.1 26 10.2 27 10.3 28
11. MIGRAN RISEN MENURUT KELOMPOK UMUR DAN PENDIDIKAN TERTINGGI YANG DITAMATKAN Recent Migrant by Age Group and Educational Attainment
11.1 29 11.2 30 11.3 31
12. MIGRAN RISEN MENURUT KABUPATEN/KOTA, KEMAMPUAN MEMBACA DAN MENULIS, DAN JENIS KELAMIN Recent Migrant by Regency/Municipality, Read and Write Ability, and Sex
- - - - 12 32
13. MIGRAN RISEN MENURUT KELOMPOK UMUR, KEMAMPUAN MEMBACA DAN MENULIS, DAN JENIS KELAMIN Recent Migrant by Age Group, Read and Write Ability, and Sex
- - - - 13 33
14. MIGRAN RISEN BERUMUR 10 TAHUN KE ATAS MENURUT KABUPATEN/ KOTA DAN STATUS PERKAWINAN Recent Migrant 10 Years of Age and Over by Regency/Municipality and Marital Status
14.1 34 14.2 35 14.3 36
viii
https:
//www.b
ps.go.id
Laki-laki+Perempuan
NO. JUDUL TABEL/TITLES
Laki-laki/Male Perempuan/Female Male+Female
Nomor Nomor Nomor Tabel Halaman Tabel Halaman Tabel Halaman Table Page Table Page Table Page
Number Number Number (1) (2) (3) (4) (5) (6) (7) (8)
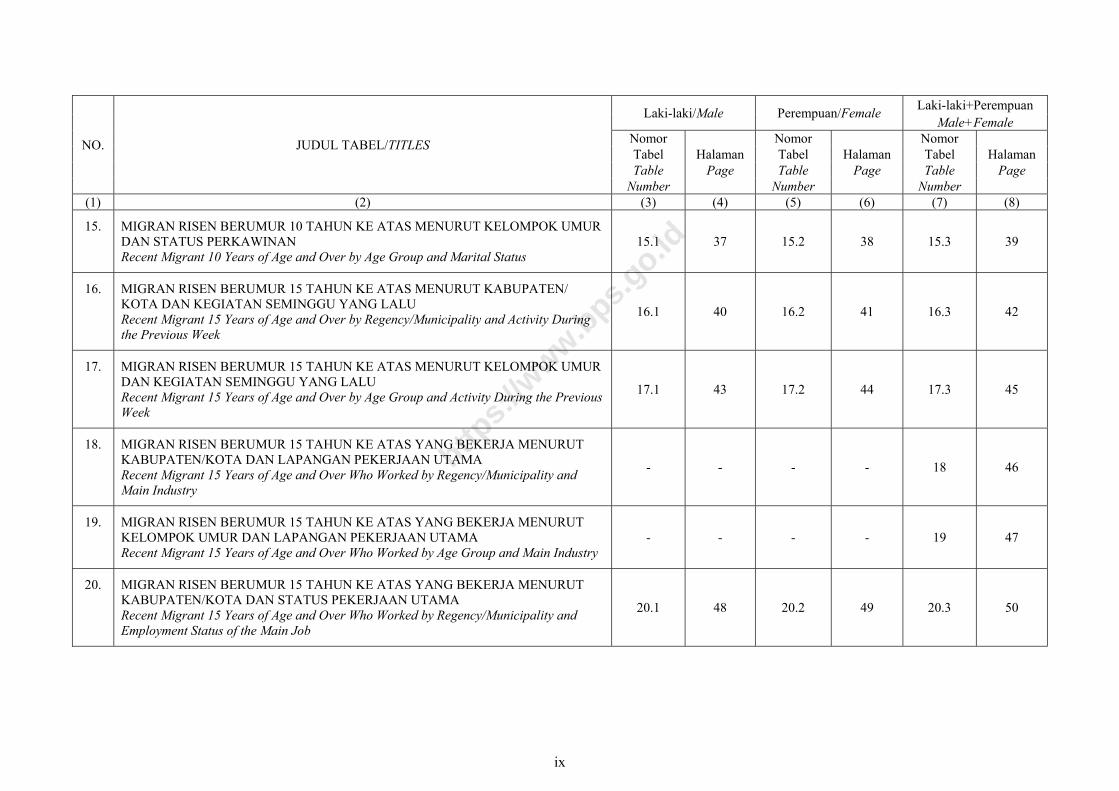
15. MIGRAN RISEN BERUMUR 10 TAHUN KE ATAS MENURUT KELOMPOK UMUR DAN STATUS PERKAWINAN Recent Migrant 10 Years of Age and Over by Age Group and Marital Status
15.1 37 15.2 38 15.3 39
16. MIGRAN RISEN BERUMUR 15 TAHUN KE ATAS MENURUT KABUPATEN/ KOTA DAN KEGIATAN SEMINGGU YANG LALU Recent Migrant 15 Years of Age and Over by Regency/Municipality and Activity During the Previous Week
16.1 40 16.2 41 16.3 42
17. MIGRAN RISEN BERUMUR 15 TAHUN KE ATAS MENURUT KELOMPOK UMUR DAN KEGIATAN SEMINGGU YANG LALU Recent Migrant 15 Years of Age and Over by Age Group and Activity During the Previous Week
17.1 43 17.2 44 17.3 45
18. MIGRAN RISEN BERUMUR 15 TAHUN KE ATAS YANG BEKERJA MENURUT KABUPATEN/KOTA DAN LAPANGAN PEKERJAAN UTAMA Recent Migrant 15 Years of Age and Over Who Worked by Regency/Municipality and Main Industry
- - - - 18 46
19. MIGRAN RISEN BERUMUR 15 TAHUN KE ATAS YANG BEKERJA MENURUT KELOMPOK UMUR DAN LAPANGAN PEKERJAAN UTAMA Recent Migrant 15 Years of Age and Over Who Worked by Age Group and Main Industry
- - - - 19 47
20. MIGRAN RISEN BERUMUR 15 TAHUN KE ATAS YANG BEKERJA MENURUT KABUPATEN/KOTA DAN STATUS PEKERJAAN UTAMA Recent Migrant 15 Years of Age and Over Who Worked by Regency/Municipality and Employment Status of the Main Job
20.1 48 20.2 49 20.3 50
ix
https:
//www.b
ps.go.id
Laki-laki+Perempuan
NO. JUDUL TABEL/TITLES
Laki-laki/Male Perempuan/Female Male+Female
Nomor Nomor Nomor Tabel Halaman Tabel Halaman Tabel Halaman Table Page Table Page Table Page
Number Number Number (1) (2) (3) (4) (5) (6) (7) (8)
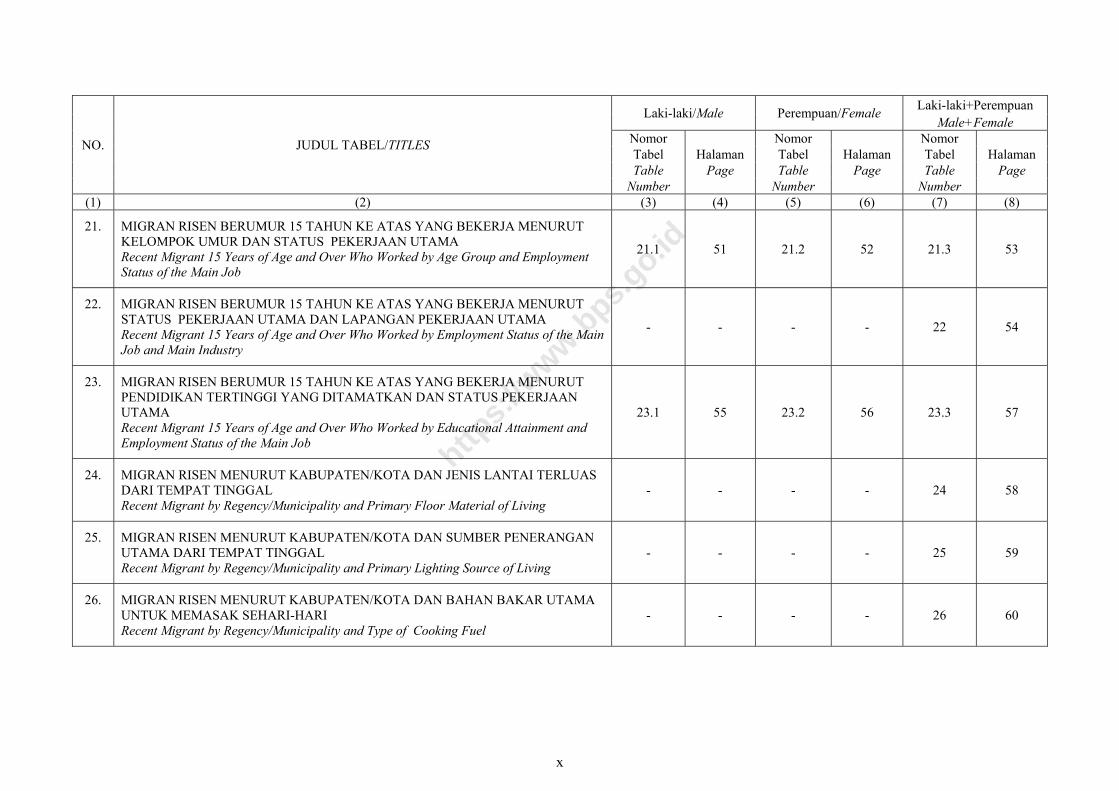
21. MIGRAN RISEN BERUMUR 15 TAHUN KE ATAS YANG BEKERJA MENURUT KELOMPOK UMUR DAN STATUS PEKERJAAN UTAMA Recent Migrant 15 Years of Age and Over Who Worked by Age Group and Employment Status of the Main Job
21.1 51 21.2 52 21.3 53
22. MIGRAN RISEN BERUMUR 15 TAHUN KE ATAS YANG BEKERJA MENURUT STATUS PEKERJAAN UTAMA DAN LAPANGAN PEKERJAAN UTAMA Recent Migrant 15 Years of Age and Over Who Worked by Employment Status of the Main Job and Main Industry
- - - - 22 54
23. MIGRAN RISEN BERUMUR 15 TAHUN KE ATAS YANG BEKERJA MENURUT PENDIDIKAN TERTINGGI YANG DITAMATKAN DAN STATUS PEKERJAAN UTAMA Recent Migrant 15 Years of Age and Over Who Worked by Educational Attainment and Employment Status of the Main Job
23.1 55 23.2 56 23.3 57
24. MIGRAN RISEN MENURUT KABUPATEN/KOTA DAN JENIS LANTAI TERLUAS DARI TEMPAT TINGGAL Recent Migrant by Regency/Municipality and Primary Floor Material of Living
- - - - 24 58
25. MIGRAN RISEN MENURUT KABUPATEN/KOTA DAN SUMBER PENERANGAN UTAMA DARI TEMPAT TINGGAL Recent Migrant by Regency/Municipality and Primary Lighting Source of Living
- - - - 25 59
26. MIGRAN RISEN MENURUT KABUPATEN/KOTA DAN BAHAN BAKAR UTAMA UNTUK MEMASAK SEHARI-HARI Recent Migrant by Regency/Municipality and Type of Cooking Fuel
- - - - 26 60
x
https:
//www.b
ps.go.id
Laki-laki+Perempuan
NO. JUDUL TABEL/TITLES
Laki-laki/Male Perempuan/Female Male+Female
Nomor Nomor Nomor Tabel Halaman Tabel Halaman Tabel Halaman Table Page Table Page Table Page
Number Number Number (1) (2) (3) (4) (5) (6) (7) (8)
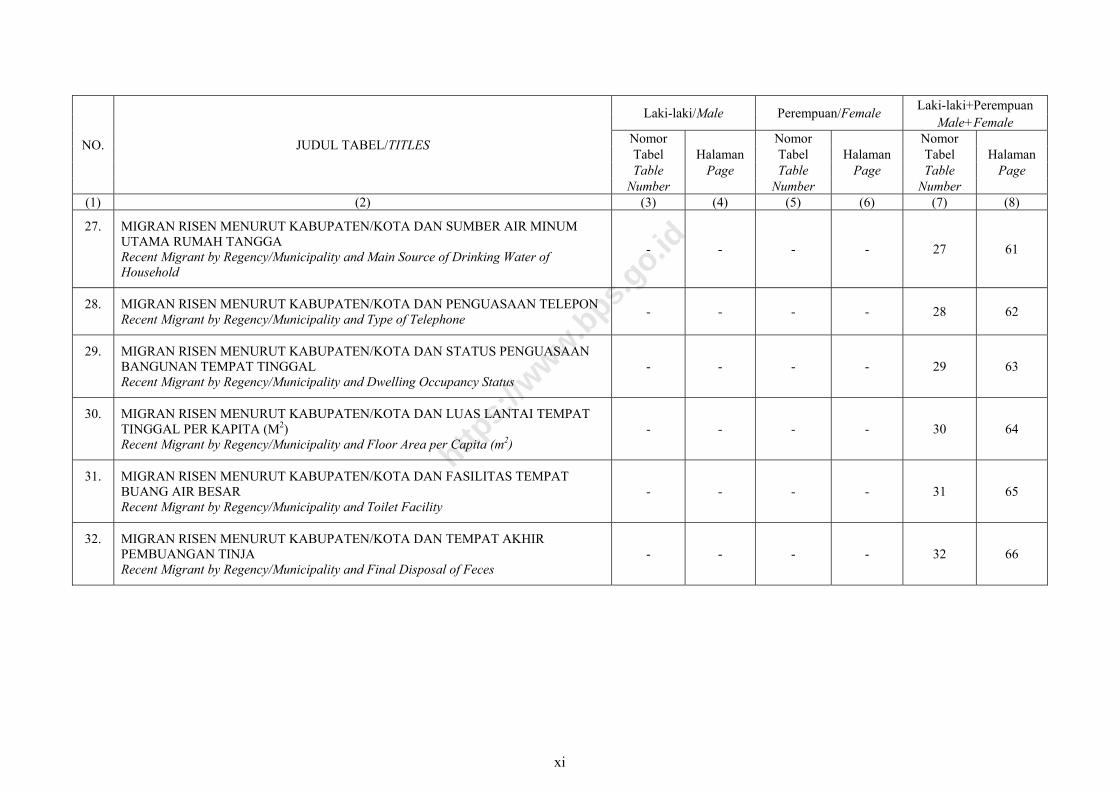
27. MIGRAN RISEN MENURUT KABUPATEN/KOTA DAN SUMBER AIR MINUM UTAMA RUMAH TANGGA Recent Migrant by Regency/Municipality and Main Source of Drinking Water of Household
- - - - 27 61
28. MIGRAN RISEN MENURUT KABUPATEN/KOTA DAN PENGUASAAN TELEPON Recent Migrant by Regency/Municipality and Type of Telephone - - - - 28 62
29. MIGRAN RISEN MENURUT KABUPATEN/KOTA DAN STATUS PENGUASAAN BANGUNAN TEMPAT TINGGAL Recent Migrant by Regency/Municipality and Dwelling Occupancy Status
- - - - 29 63
30. MIGRAN RISEN MENURUT KABUPATEN/KOTA DAN LUAS LANTAI TEMPAT TINGGAL PER KAPITA (M2) Recent Migrant by Regency/Municipality and Floor Area per Capita (m2)
- - - - 30 64
31. MIGRAN RISEN MENURUT KABUPATEN/KOTA DAN FASILITAS TEMPAT BUANG AIR BESAR Recent Migrant by Regency/Municipality and Toilet Facility
- - - - 31 65
32. MIGRAN RISEN MENURUT KABUPATEN/KOTA DAN TEMPAT AKHIR PEMBUANGAN TINJA Recent Migrant by Regency/Municipality and Final Disposal of Feces
- - - - 32 66
xi
https:
//www.b
ps.go.id

xii
https:
//www.b
ps.go.id
PENJELASAN
1. PENDAHULUAN
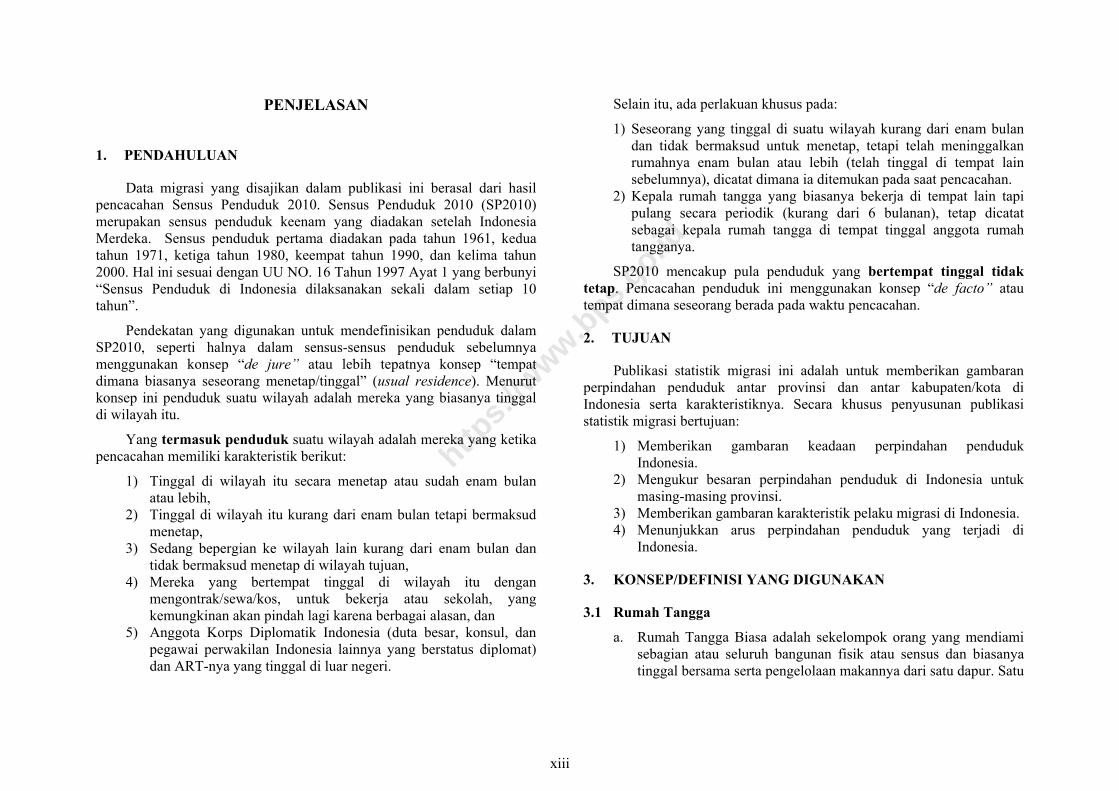
Data migrasi yang disajikan dalam publikasi ini berasal dari hasil pencacahan Sensus Penduduk 2010. Sensus Penduduk 2010 (SP2010) merupakan sensus penduduk keenam yang diadakan setelah Indonesia Merdeka. Sensus penduduk pertama diadakan pada tahun 1961, kedua tahun 1971, ketiga tahun 1980, keempat tahun 1990, dan kelima tahun 2000. Hal ini sesuai dengan UU NO. 16 Tahun 1997 Ayat 1 yang berbunyi “Sensus Penduduk di Indonesia dilaksanakan sekali dalam setiap 10 tahun”.
Pendekatan yang digunakan untuk mendefinisikan penduduk dalam SP2010, seperti halnya dalam sensus-sensus penduduk sebelumnya menggunakan konsep “de jure” atau lebih tepatnya konsep “tempat dimana biasanya seseorang menetap/tinggal” (usual residence). Menurut konsep ini penduduk suatu wilayah adalah mereka yang biasanya tinggal di wilayah itu.
Yang termasuk penduduk suatu wilayah adalah mereka yang ketika pencacahan memiliki karakteristik berikut:
1) Tinggal di wilayah itu secara menetap atau sudah enam bulan atau lebih,
2) Tinggal di wilayah itu kurang dari enam bulan tetapi bermaksud menetap,
3) Sedang bepergian ke wilayah lain kurang dari enam bulan dan tidak bermaksud menetap di wilayah tujuan,
4) Mereka yang bertempat tinggal di wilayah itu dengan mengontrak/sewa/kos, untuk bekerja atau sekolah, yang kemungkinan akan pindah lagi karena berbagai alasan, dan
5) Anggota Korps Diplomatik Indonesia (duta besar, konsul, dan pegawai perwakilan Indonesia lainnya yang berstatus diplomat) dan ART-nya yang tinggal di luar negeri.
Selain itu, ada perlakuan khusus pada:
1) Seseorang yang tinggal di suatu wilayah kurang dari enam bulan dan tidak bermaksud untuk menetap, tetapi telah meninggalkan rumahnya enam bulan atau lebih (telah tinggal di tempat lain sebelumnya), dicatat dimana ia ditemukan pada saat pencacahan.
2) Kepala rumah tangga yang biasanya bekerja di tempat lain tapi pulang secara periodik (kurang dari 6 bulanan), tetap dicatat sebagai kepala rumah tangga di tempat tinggal anggota rumah tangganya.
SP2010 mencakup pula penduduk yang bertempat tinggal tidak tetap. Pencacahan penduduk ini menggunakan konsep “de facto” atau tempat dimana seseorang berada pada waktu pencacahan.
2. TUJUAN
Publikasi statistik migrasi ini adalah untuk memberikan gambaran perpindahan penduduk antar provinsi dan antar kabupaten/kota di Indonesia serta karakteristiknya. Secara khusus penyusunan publikasi statistik migrasi bertujuan:
1) Memberikan gambaran keadaan perpindahan penduduk Indonesia.
2) Mengukur besaran perpindahan penduduk di Indonesia untuk masing-masing provinsi.
3) Memberikan gambaran karakteristik pelaku migrasi di Indonesia. 4) Menunjukkan arus perpindahan penduduk yang terjadi di
Indonesia.
3. KONSEP/DEFINISI YANG DIGUNAKAN
3.1 Rumah Tangga
a. Rumah Tangga Biasa adalah sekelompok orang yang mendiami sebagian atau seluruh bangunan fisik atau sensus dan biasanya tinggal bersama serta pengelolaan makannya dari satu dapur. Satu
xiii
https:
//www.b
ps.go.id
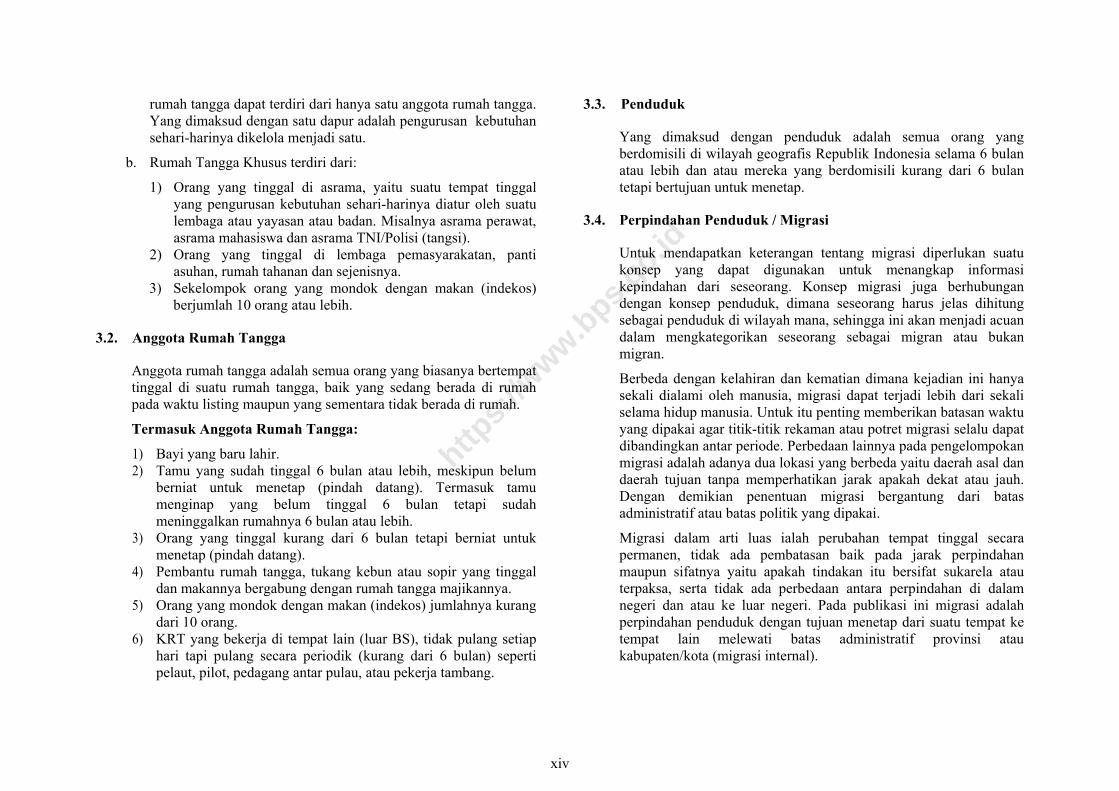
rumah tangga dapat terdiri dari hanya satu anggota rumah tangga. Yang dimaksud dengan satu dapur adalah pengurusan kebutuhan sehari-harinya dikelola menjadi satu.
b. Rumah Tangga Khusus terdiri dari:
1) Orang yang tinggal di asrama, yaitu suatu tempat tinggal yang pengurusan kebutuhan sehari-harinya diatur oleh suatu lembaga atau yayasan atau badan. Misalnya asrama perawat, asrama mahasiswa dan asrama TNI/Polisi (tangsi).
2) Orang yang tinggal di lembaga pemasyarakatan, panti asuhan, rumah tahanan dan sejenisnya.
3) Sekelompok orang yang mondok dengan makan (indekos) berjumlah 10 orang atau lebih.
3.2. Anggota Rumah Tangga
Anggota rumah tangga adalah semua orang yang biasanya bertempat tinggal di suatu rumah tangga, baik yang sedang berada di rumah pada waktu listing maupun yang sementara tidak berada di rumah.
Termasuk Anggota Rumah Tangga:
1) Bayi yang baru lahir. 2) Tamu yang sudah tinggal 6 bulan atau lebih, meskipun belum
berniat untuk menetap (pindah datang). Termasuk tamu menginap yang belum tinggal 6 bulan tetapi sudah meninggalkan rumahnya 6 bulan atau lebih.
3) Orang yang tinggal kurang dari 6 bulan tetapi berniat untuk menetap (pindah datang).
4) Pembantu rumah tangga, tukang kebun atau sopir yang tinggal dan makannya bergabung dengan rumah tangga majikannya.
5) Orang yang mondok dengan makan (indekos) jumlahnya kurang dari 10 orang.
6) KRT yang bekerja di tempat lain (luar BS), tidak pulang setiap hari tapi pulang secara periodik (kurang dari 6 bulan) seperti pelaut, pilot, pedagang antar pulau, atau pekerja tambang.
3.3. Penduduk
Yang dimaksud dengan penduduk adalah semua orang yang berdomisili di wilayah geografis Republik Indonesia selama 6 bulan atau lebih dan atau mereka yang berdomisili kurang dari 6 bulan tetapi bertujuan untuk menetap.
3.4. Perpindahan Penduduk / Migrasi
Untuk mendapatkan keterangan tentang migrasi diperlukan suatu konsep yang dapat digunakan untuk menangkap informasi kepindahan dari seseorang. Konsep migrasi juga berhubungan dengan konsep penduduk, dimana seseorang harus jelas dihitung sebagai penduduk di wilayah mana, sehingga ini akan menjadi acuan dalam mengkategorikan seseorang sebagai migran atau bukan migran.
Berbeda dengan kelahiran dan kematian dimana kejadian ini hanya sekali dialami oleh manusia, migrasi dapat terjadi lebih dari sekali selama hidup manusia. Untuk itu penting memberikan batasan waktu yang dipakai agar titik-titik rekaman atau potret migrasi selalu dapat dibandingkan antar periode. Perbedaan lainnya pada pengelompokan migrasi adalah adanya dua lokasi yang berbeda yaitu daerah asal dan daerah tujuan tanpa memperhatikan jarak apakah dekat atau jauh. Dengan demikian penentuan migrasi bergantung dari batas administratif atau batas politik yang dipakai.
Migrasi dalam arti luas ialah perubahan tempat tinggal secara permanen, tidak ada pembatasan baik pada jarak perpindahan maupun sifatnya yaitu apakah tindakan itu bersifat sukarela atau terpaksa, serta tidak ada perbedaan antara perpindahan di dalam negeri dan atau ke luar negeri. Pada publikasi ini migrasi adalah perpindahan penduduk dengan tujuan menetap dari suatu tempat ke tempat lain melewati batas administratif provinsi atau kabupaten/kota (migrasi internal).
xiv
https:
//www.b
ps.go.id
Batasan waktu migrasi ditetapkan 6 bulan sejalan dengan konsep tempat tinggal, artinya seorang dikatakan migran jika tinggal ditempat baru atau berniat tinggal ditempat baru paling sedikit 6 bulan lamanya. Keterangan bahwa seorang pernah pindah atau tidak adalah dengan melihat pada adanya perubahan tempat tinggal seseorang. Perbedaan tempat tinggal inilah yang digunakan sebagai proksi migrasi.
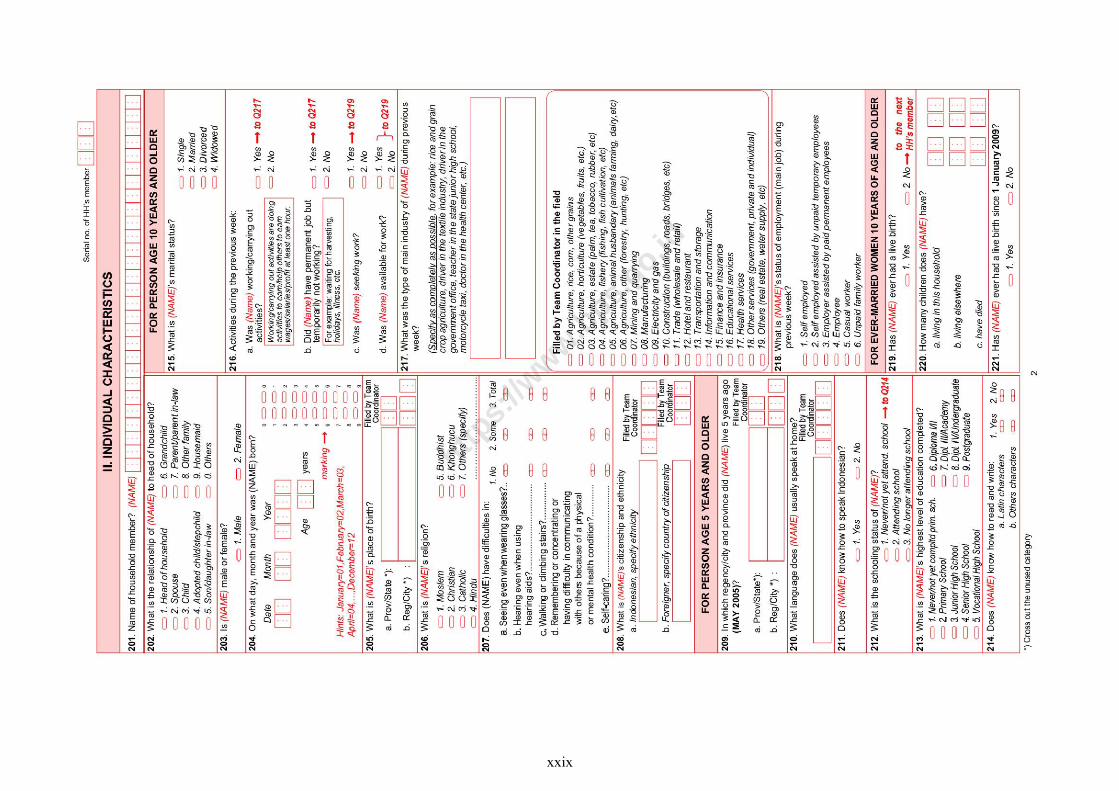
Ada tiga pertanyaan pada SP2010 yang dijadikan dasar perhitungan migrasi yaitu pertanyaan tentang provinsi dan kabupaten/kota tempat tinggal sekarang, pertanyaan provinsi dan kabupaten/kota tempat lahir dan pertanyaan mengenai provinsi dan kabupaten/kota tempat tinggal lima tahun yang lalu.
Dalam publikasi ini seseorang diklasifikasikan sebagai migran seumur hidup jika kabupaten/kota tempat lahirnya berbeda dari kabupaten/kota tempat tinggal sekarang. Seseorang diklasifikasikan sebagai migran risen jika kabupaten/kota tempat tinggal lima tahun yang lalu berbeda dari kabupaten/kota tempat tinggal sekarang.
a. Tempat lahir
Provinsi, kabupaten/kota tempat lahir adalah provinsi dan kabupaten/kota tempat tinggal ibu pada saat melahirkan. Misalnya seorang ibu bertempat tinggal di Kota Palembang (Sumatera Selatan) dan melahirkan di Kota Bandung. Apabila ibu dan anak tersebut kembali ke Palembang dalam waktu kurang dari 6 bulan, maka anak tersebut dicatat sebagai lahir di Provinsi Sumatera Selatan, Kota Palembang. Tetapi apabila anaknya tetap tinggal di Bandung selama 6 bulan atau lebih, maka anak tersebut dicatat lahir di Provinsi Jawa Barat, Kota Bandung.
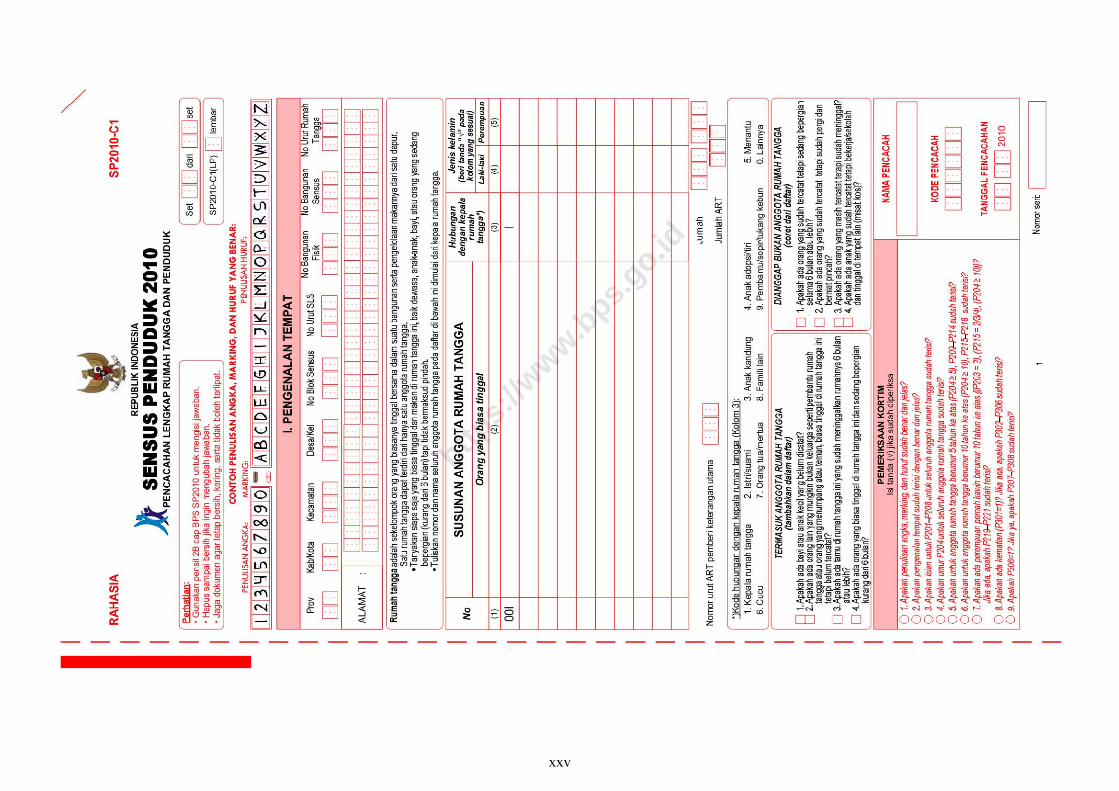
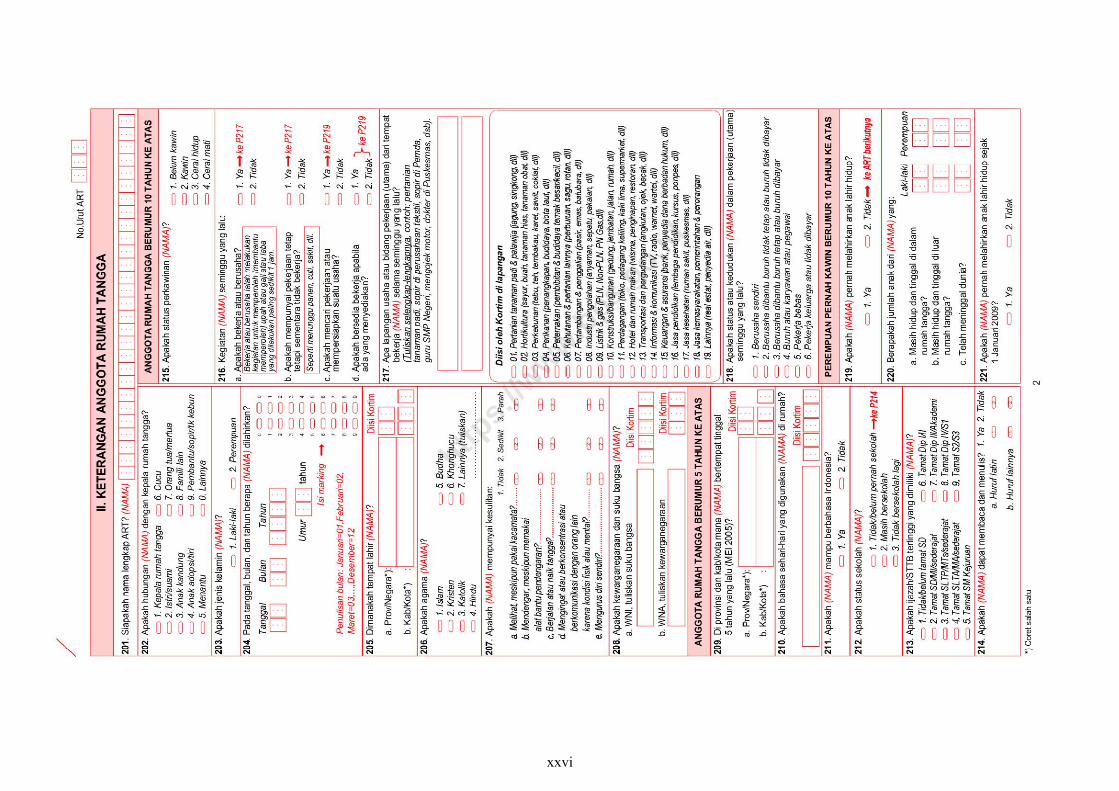
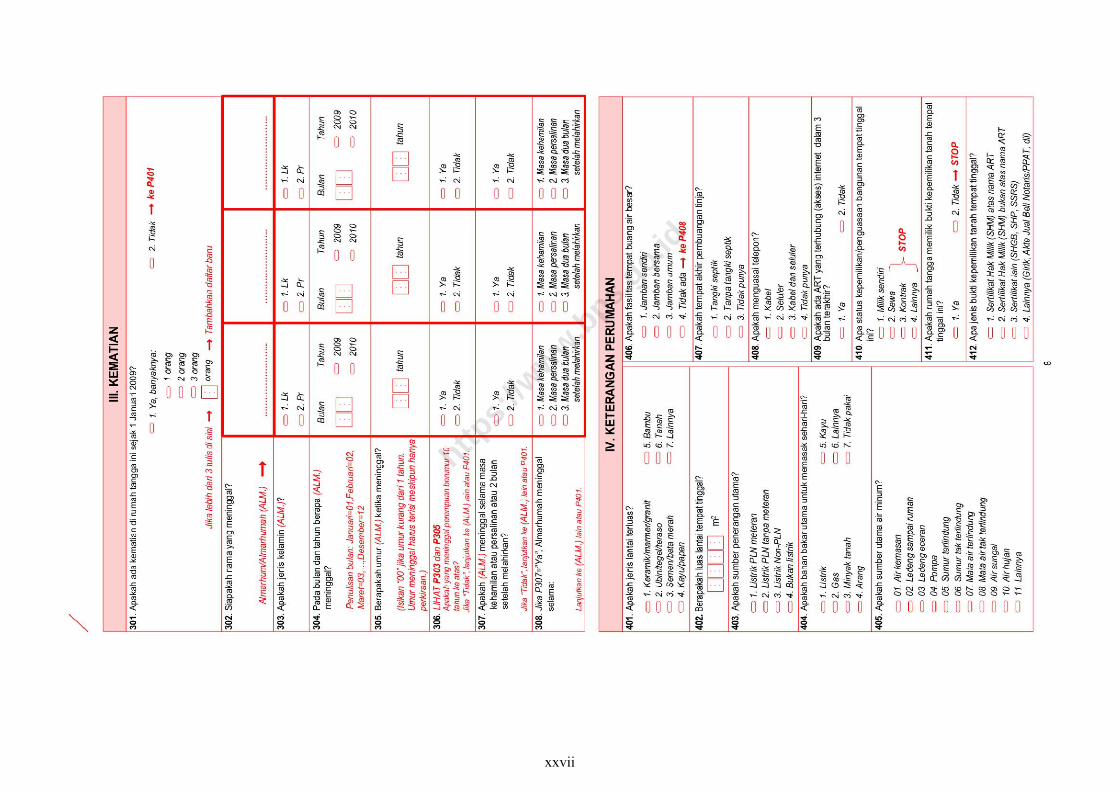
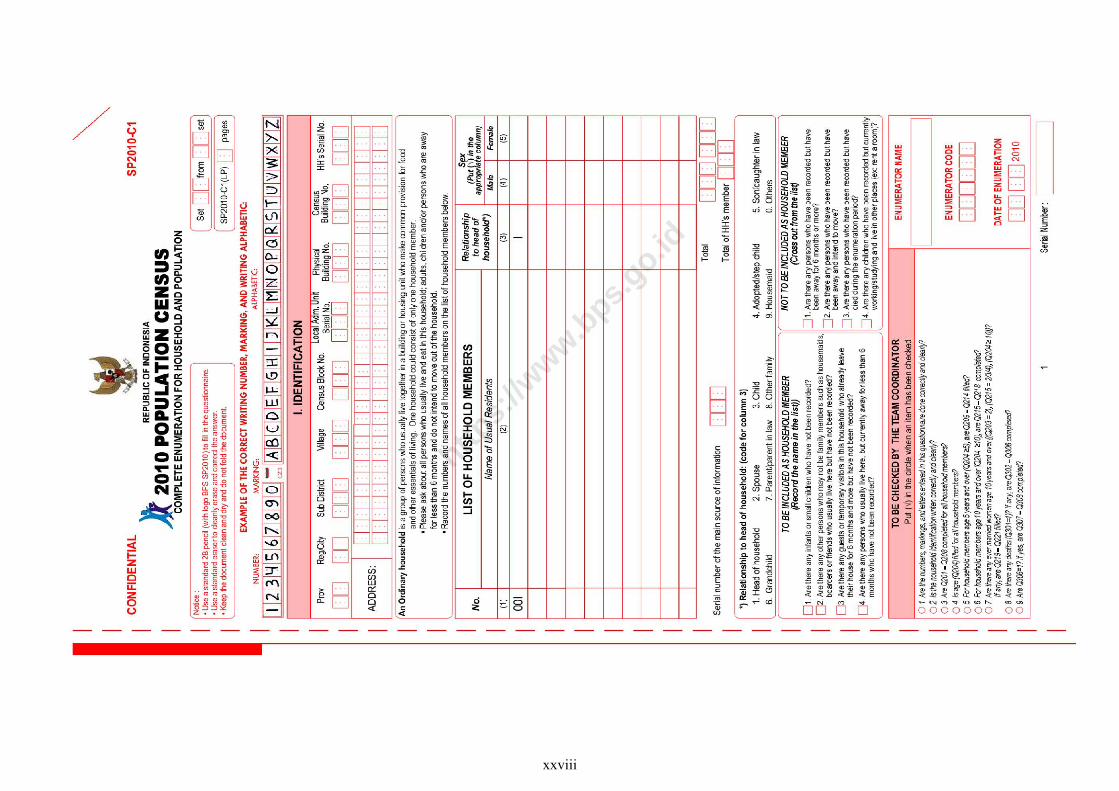
Pertanyaan tempat lahir diperoleh dari kuesioner SP2010-C1, SP2010-C2, dan SP2010-L2.
b. Tempat tinggal lima tahun yang lalu
Tempat tinggal lima tahun yang lalu adalah provinsi dan kabupaten/kota tempat tinggal responden lima tahun yang lalu, tepatnya pada bulan Mei 2005.
Pertanyaan tempat tinggal 5 tahun yang lalu hanya diperoleh dari kuesioner SP2010-C1.
3.5. Umur
Umur seseorang dapat diketahui apabila tanggal, bulan, tahun kelahiran diketahui. Penghitungan umur seseorang selalu dibulatkan ke bawah atau umur menurut ulang tahun yang terakhir.
Dengan cara penghitungan umur seperti di atas maka:
a. Yang berumur 0 tahun adalah penduduk yang berumur kurang dari satu tahun.
b. Yang berumur 1 tahun adalah penduduk yang berumur satu tahun lebih tetapi kurang dari dua tahun.
c. Yang berumur 0-4 tahun adalah penduduk yang berumur kurang dari lima tahun.
d. Yang berumur 5-9 tahun adalah penduduk yang berumur lima tahun atau lebih, kurang dari 10 tahun dan seterusnya.
e. Yang berumur 75+ adalah penduduk yang berumur 75 tahun atau lebih.
3.6. Agama
Keterangan mengenai agama yang dianut diperoleh dari jawaban responden yang diajukan sesuai dengan jenis agama yang tercantum pada daftar pertanyaan, yaitu Islam, Kristen, Katolik, Hindu, Budha, Khonghucu, dan lainnya.
xv
https:
//www.b
ps.go.id
3.7. Pendidikan Tertinggi yang Ditamatkan
Pendidikan tertinggi yang ditamatkan adalah tingkat pendidikan yang dicapai seseorang dengan mendapatkan tanda tamat (ijazah). Tamat adalah selesai mengikuti pelajaran pada kelas tertinggi suatu sekolah sampai akhir dengan mendapatkan tanda tamat/ijazah. Seseorang yang belum mengikuti pelajaran pada kelas tertinggi, tetapi ia mengikuti ujian dan lulus, dianggap tamat. Dalam SP2010, pendidikan yang ditamatkan dibagi menjadi 9 golongan yaitu:
1) Tidak/belum tamat SD. 2) Tamat SD/MI/sederajat. 3) Tamat SLTP/MTs/sederajat. 4) Tamat SLTA/MA/sederajat. 5) Tamat SM Kejuruan. 6) Tamat Diploma I/II. 7) Tamat Diploma III/Akademi. 8) Tamat Diploma IV/S1. 9) Tamat S2/S3.
3.8. Kemampuan Membaca dan Menulis
Dapat membaca dan menulis adalah dapat membaca dan menulis huruf latin dan atau huruf lainnya. Pengumpulan data keaksaraan dalam SP2010 didasarkan pada pernyataan/pengakuan responden, bukan pada uji/tes membaca dan menulis.
Seseorang dikatakan dapat membaca dan menulis huruf latin jika ia dapat membaca dan menulis kata-kata/kalimat sederhana dalam huruf latin. Huruf latin adalah huruf yang biasanya digunakan sehari-hari seperti huruf yang digunakan dalam bahasa Indonesia, bahasa Inggris dan sebagainya. Seseorang dikatakan dapat membaca dan menulis huruf lainnya jika ia dapat membaca dan menulis kata-kata/kalimat sederhana dalam huruf lainnya, seperti Arab, Jawa (Hanacaraka), aksara Batak, aksara Lampung, China/Mandarin, Kanji (Jepang), Korea, dan India.
Kegunaan pertanyaan ini untuk penentuan kebijakan yang berkaitan program penuntasan buta aksara.
3.9. Status Perkawinan
Status Perkawinan dibedakan menjadi;
Belum kawin adalah status dari mereka yang belum/tidak terikat dalam perkawinan pada saat pencacahan.
Kawin adalah status dari mereka yang terikat dalam perkawinan pada saat pencacahan, baik tinggal bersama maupun terpisah. Dalam hal ini tidak saja mereka yang kawin sah, secara hukum (adat, agama, negara dan sebagainya) tetapi juga mereka yang hidup bersama dan oleh masyarakat sekelilingnya dianggap sebagai suami istri.
Cerai hidup adalah status dari mereka yang hidup berpisah sebagai suami istri karena bercerai dan belum kawin lagi.
Cerai mati adalah status dari mereka yang suami/istrinya telah meninggal dunia dan belum kawin lagi.
3.10. Kegiatan Seminggu yang Lalu
Kegiatan seminggu yang lalu adalah aktivitas yang dilakukan seminggu sebelum pencacahan berlangsung seperti bekerja, sementara tidak bekerja, mencari pekerjaan/mempersiapkan usaha, sekolah, mengurus rumah tangga dan lainnya (pensiun, cacat jasmani dan lain-lain).
Bekerja adalah kegiatan melakukan pekerjaan dengan maksud memperoleh atau membantu memperoleh penghasilan atau keuntungan dengan jangka waktu paling sedikit selama satu jam dalam seminggu yang lalu. Bekerja selama satu jam tersebut harus dilakukan berturut-turut dan tidak terputus. Penghasilan atau keuntungan mencakup upah/gaji/pendapatan termasuk semua
xvi
https:
//www.b
ps.go.id
tunjangan dan bonus bagi pekerja/karyawan/pegawai, atau hasil usaha berupa sewa, atau keuntungan bagi pengusaha.
Mencari pekerjaan adalah kegiatan dari mereka yang berusaha mendapatkan perkerjaan.
Bersedia bekerja adalah keinginan untuk bekerja atau menerima pekerjaan tetapi tidak aktif mencari pekerjaan.
Bukan angkatan kerja adalah penduduk usia kerja (15 tahun ke atas) yang sekolah, mengurus rumah tangga atau melaksanakan kegiatan lainnya selain kegiatan pribadi.
3.11. Lapangan Pekerjaan Utama
Yang dimaksud lapangan pekerjaan adalah bidang kegiatan dari tempat bekerja untuk masing-masing anggota rumah tangga yang bekerja. Jika bekerja lebih dari satu bidang/lapangan pekerjaan, maka yang dicatat adalah lapangan usaha yang menggunakan waktu terbanyak. Jika waktu yang digunakan sama, maka pekerjaan yang memberikan penghasilan terbesar dianggap sebagai pekerjaan utama. Bidang pekerjaan/lapangan usaha adalah bidang kegiatan dari pekerjaan/usaha/perusahaan/instansi/ lembaga/organisasi tempat seseorang bekerja. Bidang pekerjaan/lapangan usaha pada kegiatan SP2010 ini adalah sebagai berikut:
1) Pertanian tanaman padi dan palawija (jagung, singkong, dll). 2) Hortikultura (sayur, buah, tanaman hias, tanaman obat, dll). 3) Perkebunan (tebu, teh, tembakau, karet, sawit, coklat, dll). 4) Perikanan (penangkapan, budidaya, biota laut, dll). 5) Peternakan (pembibitan dan budidaya ternak besar/kecil, dll). 6) Kehutanan dan pertanian lainnya (perburuan, sagu, rotan, dll). 7) Pertambangan dan penggalian (pasir, emas, batubara, dll). 8) Industri pengolahan (anyaman, sepatu, pakaian, dll). 9) Listrik dan gas (PLN, Non-PLN, PN Gas, Strom Aki, dll). 10) Konstruksi/bangunan (gedung, jembatan, jalan, rumah, dll).
11) Perdagangan (toko, pedagang keliling, kaki lima, super-market, dll).
12) Hotel dan rumah makan (wisma, penginapan, restoran, dll). 13) Transportasi dan pergudangan (angkutan, ojek, becak, dll). 14) Informasi dan Komunikasi (TV, radio, pos, warnet, wartel, dll). 15) Keuangan dan asuransi (bank, penyedia dana berbadan hukum,
dll). 16) Jasa pendidikan (lembaga pendidikan, kursus, ponpes, dll). 17) Jasa kesehatan (rumah sakit, puskesmas, apotek, dll). 18) Jasa kemasyarakatan, pemerintahan dan perorangan. 19) Lainnya (real estat, penyedia air, dll).
Pada publikasi statistik migrasi ini lapangan pekerjaan dibagi menjadi tiga kelompok, yaitu Pertanian, Manufaktur, dan Jasa-Jasa.
Yang termasuk dalam kelompok Pertanian adalah: pertanian tanaman padi dan palawija, hortikultura, perkebunan, perikanan, peternakan, kehutanan dan pertanian lainnya.
Untuk kelompok Manufaktur mencakup pertambangan dan penggalian, industri pengolahan, listrik dan gas, serta konstruksi/bangunan.
Sedangkan yang termasuk dalam kelompok Jasa-Jasa adalah: perdagangan, hotel dan rumah makan, transportasi dan pergudangan, informasi dan komunikasi, keuangan dan asuransi, jasa pendidikan, jasa kesehatan, jasa kemasyarakatan, pemerintahan dan perorangan, dan lainnya.
3.12. Status Pekerjaan
Status pekerjaan adalah jenis kedudukan seseorang dalam melakukan pekerjaan di suatu unit usaha/kegiatan.
Berusaha sendiri, adalah bekerja atau berusaha dengan menanggung resiko secara ekonomis, yaitu dengan tidak kembalinya ongkos produksi yang telah dikeluarkan dalam rangka usahanya tersebut, serta tidak menggunakan pekerja dibayar maupun pekerja
xvii
https:
//www.b
ps.go.id
tak dibayar, termasuk yang sifat pekerjaannya memerlukan teknologi atau keahlian khusus.
Berusaha dibantu buruh tidak tetap/buruh tak dibayar, adalah bekerja atau berusaha atas resiko sendiri, dan menggunakan buruh/pekerja tak dibayar dan atau buruh/pekerja tidak tetap.
Berusaha dibantu buruh tetap/buruh dibayar, adalah berusaha atas resiko sendiri dan mempekerjakan paling sedikit satu orang buruh/pekerja tetap yang dibayar.
Buruh/Karyawan/Pegawai, adalah seseorang yang bekerja pada orang lain atau instansi/kantor/perusahaan secara tetap dengan menerima upah/gaji baik berupa uang maupun barang. Buruh yang tidak mempunyai majikan tetap, tidak digolongkan sebagai buruh/karyawan, tetapi sebagai pekerja bebas. Seseorang dianggap memiliki majikan tetap jika memiliki 1 (satu) majikan (orang/rumah tangga) yang sama dalam sebulan terakhir, khusus pada sektor bangunan batasannya tiga bulan. Apabila majikannya instansi/lembaga, boleh lebih dari satu.
Pekerja bebas, mencakup pekerja bebas di usaha pertanian dan non pertanian:
a. Pekerja bebas di pertanian, adalah seseorang yang bekerja pada orang lain/majikan/institusi yang tidak tetap (lebih dari 1 majikan dalam sebulan terakhir) di usaha pertanian baik berupa usaha rumah tangga maupun bukan usaha rumah tangga atas dasar balas jasa dengan menerima upah atau imbalan baik berupa uang maupun barang, dan baik dengan sistem pembayaran harian maupun borongan. Usaha pertanian meliputi: pertanian tanaman pangan, perkebunan, kehutanan, peternakan, perikanan dan perburuan, termasuk juga jasa pertanian. Majikan adalah orang atau pihak yang memberikan pekerjaan dengan pembayaran yang disepakati.
b. Pekerja bebas di non pertanian adalah seseorang yang bekerja pada orang lain/majikan/institusi yang tidak tetap (lebih dari 1 majikan dalam sebulan terakhir), di usaha non pertanian dengan
menerima upah atau imbalan baik berupa uang maupun barang dan baik dengan sistem pembayaran harian maupun borongan. Usaha non pertanian meliputi: usaha di sektor pertambangan, industri, listrik, gas dan air, sektor konstruksi/bangunan, sektor perdagangan, sektor angkutan, pergudangan dan komunikasi, sektor keuangan, asuransi, usaha persewaan bangunan, tanah dan jasa perusahaan, sektor jasa kemasyarakatan, sosial dan perorangan.
Pekerja keluarga atau tidak dibayar adalah seseorang yang bekerja membantu orang lain yang berusaha dengan tidak mendapat upah/gaji, baik berupa uang maupun barang.
Pekerja tak dibayar tersebut dapat terdiri dari:
1) Anggota rumah tangga dari orang yang dibantunya, seperti istri/anak yang membantu suaminya/ayahnya bekerja di sawah dan tidak dibayar.
2) Bukan anggota rumah tangga tetapi keluarga dari orang yang dibantunya, seperti famili yang membantu melayani penjualan di warung dan tidak dibayar.
3) Bukan anggota rumah tangga dan bukan keluarga dari orang yang dibantunya, seperti orang yang membantu menganyam topi pada industri rumah tangga tetangganya dan tidak dibayar.
xviii
https:
//www.b
ps.go.id
EXPLANATORY NOTES
1. INTRODUCTION
Migration data presented in this publication come from the 2010 Population Census results. Population Census 2010 (SP2010) is the sixth population census held after the Independence. The first population census was held in 1961, second in 1971, third in 1980, fourth in 1990 and fifth in 2000. This is in accordance with the Act No. 16, 1997 Section 1, which states “Population Census in Indonesia is conducted every 10 years ".
As in the previous population censuses, the population census uses the concept of "de jure" population or the concept of "the place where a person usually lives " (usual residence). According to this concept the population of a region are those who usually live in that area.
Residents of an area are those who have the following charac-teristics:
1) Have settled in the area or have lived for six months or more, 2) Stay in the region for less than six months but intends to settle, 3) Currently traveling to other areas of less than six months and do
not intend to settle in the area of destination, 4) Those who live in the region by signing / rental / boarding, to
work or school, which is likely to move again for various reasons, and
5) Members of the Diplomatic Corps Indonesia (ambassadors, consuls, and other employee representatives of Indonesia who is a diplomat) including their member of households who are living abroad.
In addition, there are special treatment:
1) A person who lives in an area of less than six months and not looking to settle down, but had left his house six months or more (have lived elsewhere before), is recorded where he/she was found at the time of enumeration.
2) The head of household who normally work elsewhere but returned periodically (less than 6 months), are recorded as head of household in a residential household members.
SP2010 also includes people who do not have permanent residence. Enumeration of this group population uses the concept of "de facto" or recorded at a place where this person is enumerated.
2. PURPOSE
The purpose of preparation of publication on migration statistics is to provide an overview population movements between provinces and between districts in Indonesia and its characteristics. In particular, the preparation of this publication aimed to:
1) Provide an overview of the state of Indonesia's population displacement.
2) Measure the amount of population movement in Indonesia for each province.
3) Provide an overview of the characteristics of internal migrants in Indonesia.
4) Show the migration flows in Indonesia.
3. CONCEPT / DEFINITION
3.1 Household
a. Ordinary Household is a group of people who live part or all of the physical or census building and usually live together and eat from the same kitchen management, which is the maintenance of daily needs are managed as one. A household may consist of only one member of the household.
b. Special Households consist of:
1) People who live in the dorms, which is a place where the maintenance of daily needs is governed by an institution or a
xix
https:
//www.b
ps.go.id
foundation or organization. For example, nurses dormitory, student dormitories and boarding TNI / Police (barracks).
2) People who live in prisons, orphanages, detention centers and the like.
3) A group of people with eating mole (outhouse) accounted for 10 people or more.
3.2. Household Members
Household members are all people who usually reside in a household, both were in the house at the time of listing and that while not at home.
Household Members Including:
1) Newborns. 2) Guests who have stayed for 6 months or more, although not
intending to settle (move comes). Includes guest who stayed less than 6 months but had to leave his home for 6 months or more.
3) People who lives less than 6 months but intends to settle (move comes).
4) Housekeeper, gardener or driver who are living and dining joined household employer.
5) The mole people with eating (outhouse) less than 10 people. 6) Head of household working elsewhere (outside Census Block),
do not go home every day but return periodically (less than 6 months) as sailors, pilots, inter-island traders, or mine workers.
3.3. Population
Population is all people who reside in the geographical area of the Republic of Indonesia for 6 months or more and or those who live less than 6 months but intend to settle.
3.4 Population Movement / Migration
Information about migration required a concept that can be used to capture information from a person's movement. The concept of migration is also related to the concept of population, where one must clearly be counted as a resident of one region, so this will be a reference to categorize someone as a migrant or non-migrant.
Unlike birth and death where only experienced once in a lifetime, migration can occur more than once during the life time. Therefore, it is important to set the reference time, thus the portrait of migration is comparable between periods. Other differences in the grouping of migration is the existence of two different locations, namely the origin and destination regardless of whether near or far distance. Thus, the determination of the boundary depends on the administrative or political boundaries.
Migration in the broad sense is a permanent change of residence, there are no restrictions either on the distance and its displacement, whether the act was voluntary or forced, and there is no difference between the movement in the country and or abroad. In this publication, migration is the movement of the population with the aim of settling from one place to another through provincial administrative boundaries or districts (internal migration).
The time limits specified migration is 6 months in line with the concept of residence, meaning that a migrant is said to stay in the new place or intends to stay in the new place for at least 6 months. Information that a person ever been moving or not is by looking at a person's change of residence. Diffference on place of residence is used as a proxy for migration.
There are three questions on the 2010 Population Census used as the basis for calculating the migration: information on provincial and district of current residence, the question on provincial and district of place of birth and the question on provincial and district of residence five years ago.
xx
https:
//www.b
ps.go.id
In this publication a person is classified as lifetime migrant if district of birthplace is different from the district of current residence. A person is classified as recent migrant if district of residence five years ago is different from district of current residence.
a. Place of birth
A respondent’s place of birth is the province and district where his or her mother lived at the time the respondent was born. For example, a mother who lives in Palembang, South Sumatra; went to Bandung, West Java, to deliver her child. If the mother and her child returned to Palembang in less than 6 month, the birth place of the child would be in Palembang, South Sumatera. On the other hand, if the child remained in Bandung for 6 months or more after the delivery, the birth of place would be in Bandung, West Java.
The question of place of birth obtained from SP2010-C1, SP2010-C2, and SP2010-L2 questionnaires.
b. Place of 5 Years Ago
Place of 5 years ago is province and district where the respondent lived 5 years ago or the residence place of respondent at May 2005.
The question of place of 5 years ago obtained only from SP2010-C1 questionnaire.
3.5. Age
Person's age can be determined if the date, month, and year of birth is known. Calculating the age of a person is always rounded down or age by the last birthday.
By way of counting age as above, then:
a. 0-year-old is the population aged less than one year. b. 1-year-old is a resident aged one year but less than two years.
c. Aged 0-4 years is the population aged less than five years. d. Aged 5-9 years is the population aged between five years to less
than 10 years. e. Aged 75 + is the population aged 75 years or more.
3.6. Religion
Religion was recorded according to the respondent’s statement. The categories listed in the questionnaire, were: Moslem, Christian, Catholic, Hindu, Buddhist, Khonghucu, and others.
3.7. Educational Attainment
Educational attainment is the highest educational level completed by a person. Graduated is a classification for those who passed the highest level of a particular school with certificate or diploma regardless of whether the schools is government or privately managed. In addition, a person who had taken the final examination at the highest level and passed, is regarded as graduated even though the person had not gone through the highest level. In 2010 Population Cencus highest education was divided into 9 categories:
1) Never/not yet completed Primary School. 2) Primary School. 3) Junior High School. 4) Senior High School. 5) Vocational High School. 6) Diploma I/II. 7) Diploma III/Academy. 8) Diploma IV/Undergraduate. 9) Postgraduate.
3.8. Literacy
Can read and write is to read and write Latin letters or other letters. Someone said to be able to read and write Latin letters if he can read and write simple sentences in Latin letters. Latin letters are
xxi
https:
//www.b
ps.go.id
letters which are usually used in everyday life such as the letters used in Indonesian, English and so on. Someone said can read and write another letter if he could read and write simple sentences in other letters, such as Arabic, Javanese (Hanacaraka), Batak, Lampung, Chinese/Mandarin, Kanji (Japanese), Korea, and India.
This question is useful to determinate of policy relating to the education sector, especially education chasing pack.
3.9. Marital Status
Marital status distinguished between:
Not yet/never married is a status of those who have no/are not bound in marriage at the time of enumeration.
Married is a status for those who on enumeration date were bound by marriage regardless of whether they lived together or separately. This includes those who by law (e.g. tradition, religion, state, etc.) are formally married but also those who lived together and regarded by their surrounding community as husbands and wives.
Divorced is a category for those who divorced their husbands or wives and not yet remarried.
Widowed is a status for those whose husbands or wives were deceased and not yet remarried.
3.10. Activities During Last Week
Activities of the past week are activities conducted last week before enumeration such as working, temporarily not working, looking for work/established a new business/firm, attending school, doing housekeeping and others (retired, incapacitated, etc).
Working is an activity to do the job with the intention of obtaining or aiding to obtain the income or profits for a period of at least one hour a week ago. Working for an hour should be consecutive and
uninterrupted. Income or profit covers salary / wages / income including all allowances and bonuses for workers / employees / employee, or results of operations in the form of rents, or profits for entrepreneurs.
Looking for work is the activity of those who attempt a jobs.
Available for work is the desire to work or receive job but not actively looking for work.
Not economically active is person aged 15 years and over, but not classified in labour force, such as students, housekeepers, or others exclude personal activity.
3.11. Main Industry
Main industry is based on the activity of the enterprise/corporation/ institution where the respondents work or previously worked. If the respondents works in more then one industry, the industry recorded was the industry where the respondents work for longer time. If the time spend is the same, the industry recorded was the industry with higher paid. The industry in 2010 Population Census was categorized into 19:
1) Agriculture, rice, corn,other grains. 2) Agriculture, horticulture (vegetable, fruits, etc.). 3) Agriculture, estate (palm, tea, tobacco, rubber, etc.). 4) Agriculture, fishery (fishing, fish cultivation, etc.). 5) Agriculture, animal husbandry (animals farming, dairy, etc.). 6) Agriculture, other (forestry, hunting, etc.). 7) Mining and quarrying. 8) Manufacturing. 9) Electricity and gas. 10) Construction (buildings, roads, bridges, etc.). 11) Trade (wholesale and retail). 12) Hotel and restaurant. 13) Transportation and storage.
xxii
https:
//www.b
ps.go.id
14) Information and communication. 15) Finance and insurance. 16) Educational services. 17) Health services. 18) Other services (government, private and individual). 19) Others (real estate, water supply, etc.).
The main industry in this publication is divided into three groups: Agriculture, Manufacture, and Services (AMS). Agriculture consists of rice, corn,other grains, horticulture, estate, fishery, animal husbandry, and other (forestry, hunting, etc.). Manufacture consists of mining and quarrying, manufacturing, electricity and gas, and construction. Services consists of trade, hotel and restaurant, transportation and storage, information and communication, finance and insurance, educational services, health services, other services (government, private and individual), and others (real estate, water supply, etc.).
3.12. Employment Status
Employment status is the status of a person at the place where he/she works.
Own-account worker, is a person who works at her/his own risk without assisted by paid per mount worker or unpaid worker include technical job or skill job.
Employer assisted by temporary workers/unpaid worker, a person who works at her/his own risk and assisted by temporary worker/unpaid worker.
Employer assisted by permanent workers/paid workers, is a person who does his/her business at her/his own risk at least one assisted by paid permanent worker.
Employee, is a person who work permanently for other people or institution/office/company and gains some money/cash or goods as wage/salary. Labor who have no permanent employer is not
categorized as a laborer/ worker/employee but casual worker. A laborers, in general is considered to have a permanent employer if he has the same employer during the past month, particularly for building construction sector is 3 months. If the employer is an institution, more than 1 (one) is allowed.
Casual employee, includes casual employee in agriculture and casual employee not in agriculture.
Casual employee in agriculture, is a person who does not work permanently for other people/employer/ institution (more than 1 employer during the last 1 month) in agricultural sector either home industry or not home industry based on remuneration paid with money or goods, and based on daily or contact payment system. Agricultural industry covers food-based agricultural, plantation, forestry, livestock, fishery, hunting, including agricultural services. Employer is a person who gives a job with an agreement payment.
Casual employee not in agriculture, is a person who does not work permanently for other people/employer/ institution (more than 1 employer during then past 1 month) in non agricultural and gets money or goods as wage/salary either based on daily or contract payment system. Those sectors include non agricultural sector: mining, manufactures, electricity, gas and water, construction, trade, transportation, storage, and communication, financing, insurance, real estate, and business services, community, social, and personal services.
Family/Unpaid worker, is a person who works for other people without pay in cash or goods.
Those unpaid workers could be:
1) Family member who works for another person in their family i.e: wife or child who help their husband or father work in field and unpaid.
xxiii
https:
//www.b
ps.go.id
2) Not a family member who works for another person but still having family relations, such as those who help their family relatives to sell in a minimarket and unpaid.
3) Other persons outside of family members nor family relatives who work for another person, such as a person who weaves hats for their neighbours home industry and unpaid.
xxiv
https:
//www.b
ps.go.id
xxv
https:
//www.b
ps.go.id
xxvi
https:
//www.b
ps.go.id
xxvii
https:
//www.b
ps.go.id
xxviii
https:
//www.b
ps.go.id
xxix
https:
//www.b
ps.go.id
xxx
https:
//www.b
ps.go.id
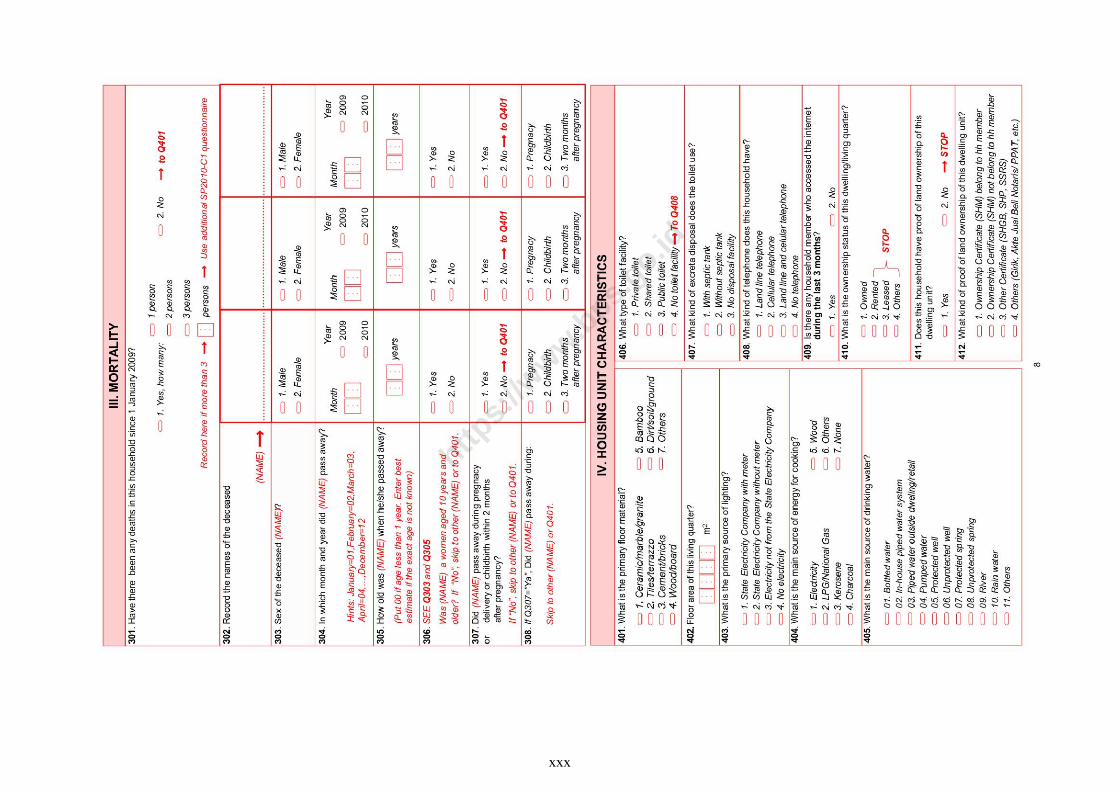
The question on place of birth is posed to the entire population. Lifetime migrant data is presented in Table 1 to Table 3. Recent migrant data obtained only from SP2010-C1 questionnaire. The question on place of 5 years ago is posed to the population aged 5 years and over. Recent migrant data is presented in Table 4 to Table 32.
This publication presents the data on lifetime and recent migration. Lifetime migrant data is obtained from SP2010-C1, SP2010-C2, and SP2010-L2 questionnaires. SP2010-C1 is used for complete enumeration for household and population. SP2010-C2 is used for complete enumeration in particular areas (apartement and elite neighborhood). SP2010-L2 is for enumeration for population without permanent residence.
There is a column of "Not Asked" in Table 4 and Table 6. “Not Asked” includes the population aged 5 years and over, taken from the SP2010-C2 and SP2010-L2 questionnaires.
There is a column of “Not Stated” in Table 8, 9, 16, and 17. "Not Stated" means respondents did not answer the question or the enumerator missed to ask the related question.
TECHNICAL NOTES
xxxi
Publikasi ini menyajikan data mengenai migrasi seumur hidup dan migrasi risen. Data migran seumur hidup diperoleh dari kuesioner SP2010-C1, SP2010-C2, dan SP2010-L2. SP2010-C1 digunakan untuk pencacahan lengkap rumah tangga dan penduduk. SP2010-C2 digunakan untuk pencacahan lengkap rumah tangga dan penduduk di lokasi khusus (apartemen dan perumahan eksklusif). SP2010-L2 digunakan untuk pencacahan penduduk yang bertempat tinggal tidak tetap.
Pertanyaan tempat lahir diajukan kepada seluruh penduduk. Data migran seumur hidup disajikan pada Tabel 1 sampai Tabel 3. Data migran risen diperoleh hanya dari kuesioner SP2010-C1 saja. Pertanyaan tempat tinggal 5 tahun yang lalu diajukan kepada penduduk yang berumur 5 tahun ke atas saja. Data migran risen disajikan mulai dari Tabel 4 sampai dengan Tabel 32.
Pada Tabel 8, 9, 16, dan 17 terdapat kolom “Tidak Terjawab”. Tidak terjawab artinya responden tidak menjawab atau petugas terlewat menanyakan pertanyaan yang berkaitan.
Pada Tabel 4 dan Tabel 6 terdapat kolom “Tidak Ditanyakan”. Tidak ditanyakan mencakup jumlah penduduk 5 tahun ke atas yang berasal dari kuesioner SP2010-C2 dan SP2010-L2.
CATATAN TEKNIS
https:
//www.b
ps.go.id

xxxii
https:
//www.b
ps.go.id

Tabel Arus Migrasi Seumur Hidup antar Kabupaten/Kota
Table Interdistrict Lifetime Migration Stream
Laki-laki/Male
Jembrana Tabanan Badung Gianyar Klungkung Bangli
(1) (2) (3) (4) (5) (6) (7)
Kabupaten/Regency
Jembrana 114.863 888 566 270 738 150
Tabanan 1.181 187.111 1.033 473 348 307
Badung 4.304 7.615 171.664 2.320 2.424 1.532
Gianyar 694 900 544 208.443 1.705 1.258
Klungkung 156 170 89 297 79.233 127
Bangli 82 137 113 374 148 106.166
Karang Asem 163 263 231 287 410 99
Buleleng 657 1.044 468 655 870 707
Kota/Municipality
Denpasar 6.721 13.184 4.916 6.672 8.507 5.257
Jumlah/Total 128.821 211.312 179.624 219.791 94.383 115.603
Kabupaten/Kota
Tempat Tinggal Sekarang
Place of Present Residence
Kabupaten/Kota Tempat Lahir / Place of Birth
1.1
1
https:
//www.b
ps.go.id
Tabel Arus Migrasi Seumur Hidup antar Kabupaten/Kota
Table Interdistrict Lifetime Migration Stream
Karang Asem Buleleng Kota DenpasarLainnya
Other
(1) (8) (9) (10) (11) (12)
Kabupaten/Regency
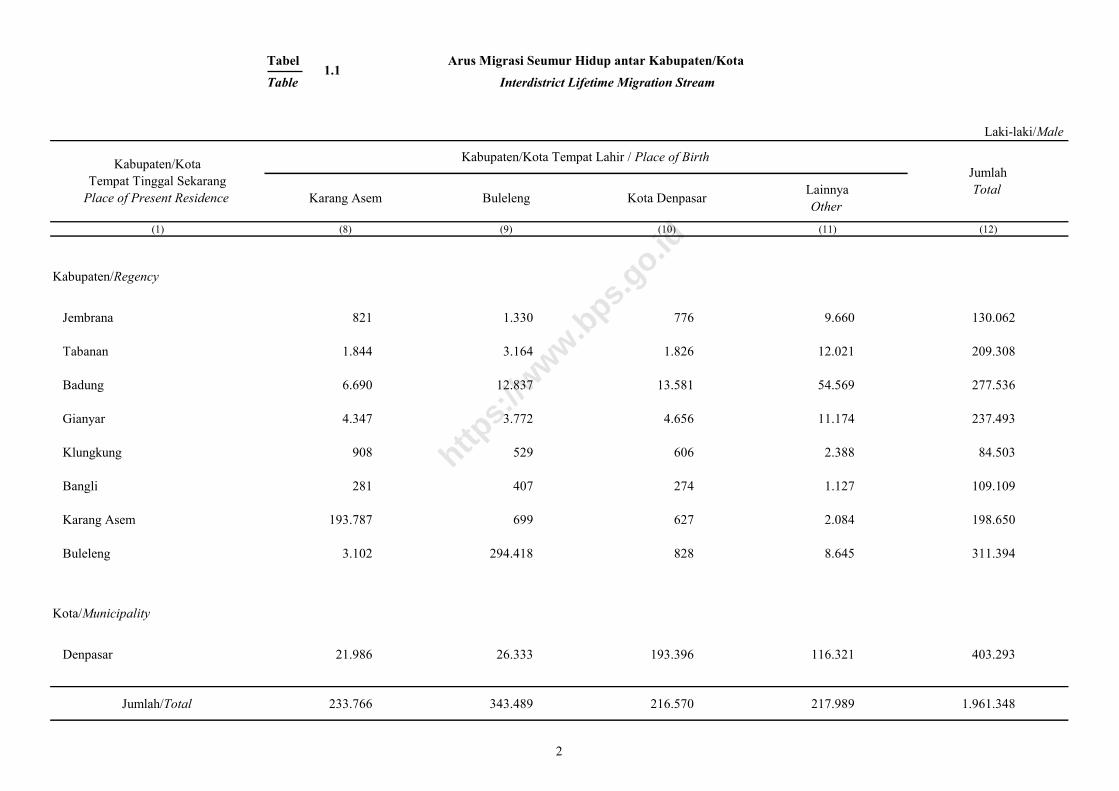
Jembrana 821 1.330 776 9.660 130.062
Tabanan 1.844 3.164 1.826 12.021 209.308
Badung 6.690 12.837 13.581 54.569 277.536
Gianyar 4.347 3.772 4.656 11.174 237.493
Klungkung 908 529 606 2.388 84.503
Bangli 281 407 274 1.127 109.109
Karang Asem 193.787 699 627 2.084 198.650
Buleleng 3.102 294.418 828 8.645 311.394
Kota/Municipality
Denpasar 21.986 26.333 193.396 116.321 403.293
Jumlah/Total 233.766 343.489 216.570 217.989 1.961.348
Laki-laki/Male
Kabupaten/Kota
Tempat Tinggal Sekarang
Place of Present Residence
Kabupaten/Kota Tempat Lahir / Place of Birth
Jumlah
Total
1.1
2
https:
//www.b
ps.go.id

Tabel Arus Migrasi Seumur Hidup antar Kabupaten/Kota
Table Interdistrict Lifetime Migration Stream
Perempuan/Female
Jembrana Tabanan Badung Gianyar Klungkung Bangli
(1) (2) (3) (4) (5) (6) (7)
Kabupaten/Regency
Jembrana 113.762 1.163 831 431 1.070 231
Tabanan 2.446 183.092 3.015 1.138 715 606
Badung 4.605 9.550 162.607 3.749 2.754 1.996
Gianyar 981 1.718 1.540 200.519 2.368 2.004
Klungkung 328 393 268 1.001 77.796 384
Bangli 171 292 277 1.125 389 100.823
Karang Asem 300 412 370 544 815 357
Buleleng 976 1.548 637 927 981 872
Kota/Municipality
Denpasar 7.361 15.414 8.391 9.404 9.033 6.193
Jumlah/Total 130.930 213.582 177.936 218.838 95.921 113.466
Kabupaten/Kota
Tempat Tinggal Sekarang
Place of Present Residence
Kabupaten/Kota Tempat Lahir / Place of Birth
1.2
3
https:
//www.b
ps.go.id
Tabel Arus Migrasi Seumur Hidup antar Kabupaten/Kota
Table Interdistrict Lifetime Migration Stream
Karang Asem Buleleng Kota DenpasarLainnya
Other
(1) (8) (9) (10) (11) (12)
Kabupaten/Regency
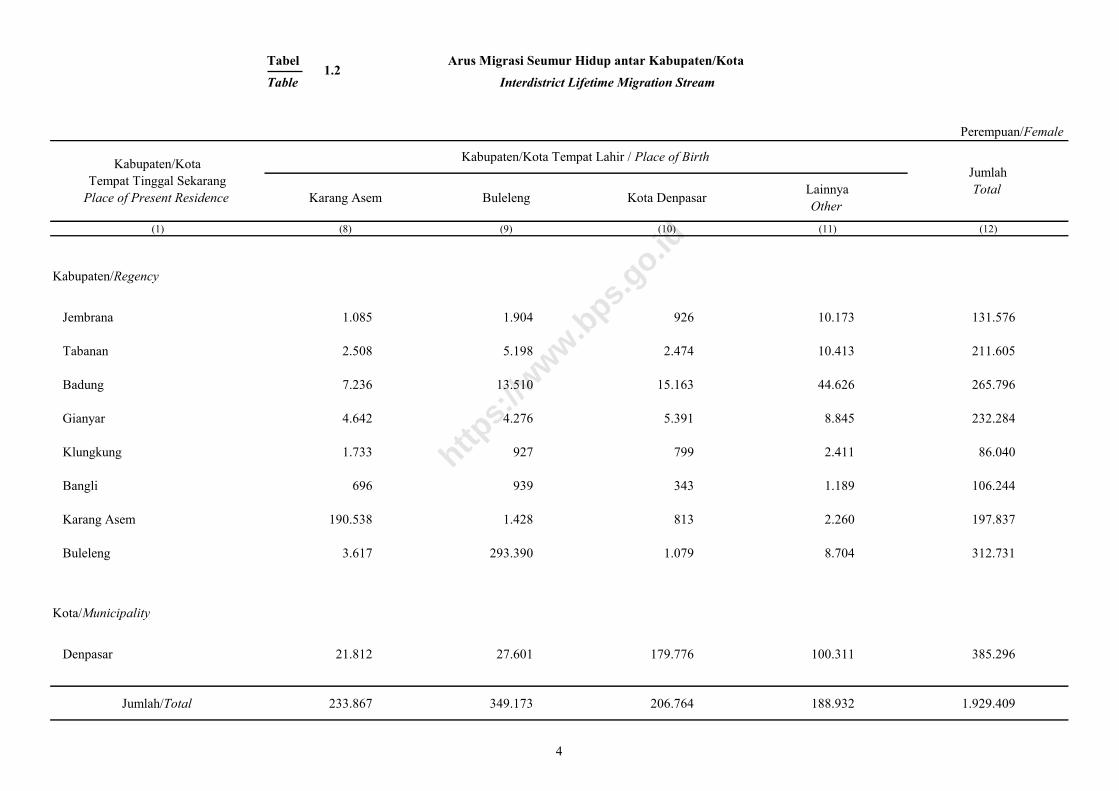
Jembrana 1.085 1.904 926 10.173 131.576
Tabanan 2.508 5.198 2.474 10.413 211.605
Badung 7.236 13.510 15.163 44.626 265.796
Gianyar 4.642 4.276 5.391 8.845 232.284
Klungkung 1.733 927 799 2.411 86.040
Bangli 696 939 343 1.189 106.244
Karang Asem 190.538 1.428 813 2.260 197.837
Buleleng 3.617 293.390 1.079 8.704 312.731
Kota/Municipality
Denpasar 21.812 27.601 179.776 100.311 385.296
Jumlah/Total 233.867 349.173 206.764 188.932 1.929.409
Perempuan/Female
Kabupaten/Kota
Tempat Tinggal Sekarang
Place of Present Residence
Kabupaten/Kota Tempat Lahir / Place of Birth
Jumlah
Total
1.2
4
https:
//www.b
ps.go.id
Tabel Arus Migrasi Seumur Hidup antar Kabupaten/Kota
Table Interdistrict Lifetime Migration Stream
Laki-laki+Perempuan/Male+Female
Jembrana Tabanan Badung Gianyar Klungkung Bangli
(1) (2) (3) (4) (5) (6) (7)
Kabupaten/Regency
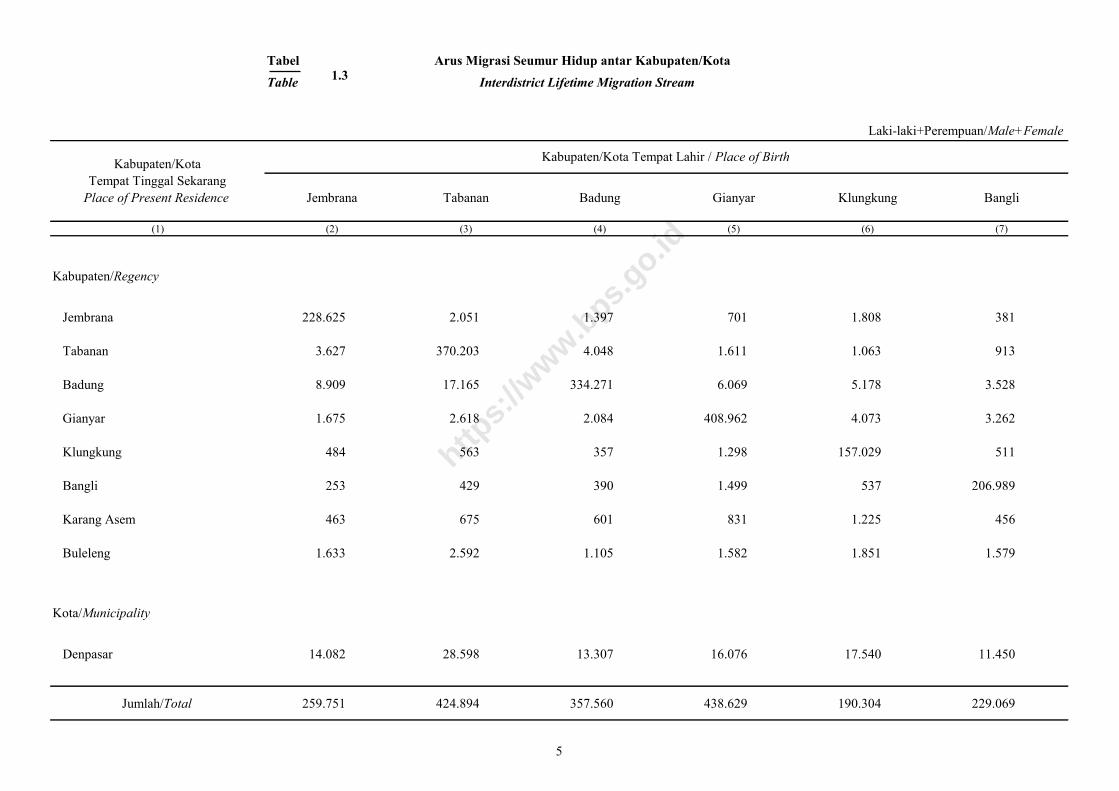
Jembrana 228.625 2.051 1.397 701 1.808 381
Tabanan 3.627 370.203 4.048 1.611 1.063 913
Badung 8.909 17.165 334.271 6.069 5.178 3.528
Gianyar 1.675 2.618 2.084 408.962 4.073 3.262
Klungkung 484 563 357 1.298 157.029 511
Bangli 253 429 390 1.499 537 206.989
Karang Asem 463 675 601 831 1.225 456
Buleleng 1.633 2.592 1.105 1.582 1.851 1.579
Kota/Municipality
Denpasar 14.082 28.598 13.307 16.076 17.540 11.450
Jumlah/Total 259.751 424.894 357.560 438.629 190.304 229.069
Kabupaten/Kota
Tempat Tinggal Sekarang
Place of Present Residence
Kabupaten/Kota Tempat Lahir / Place of Birth
1.3
5
https:
//www.b
ps.go.id
Tabel Arus Migrasi Seumur Hidup antar Kabupaten/Kota
Table Interdistrict Lifetime Migration Stream
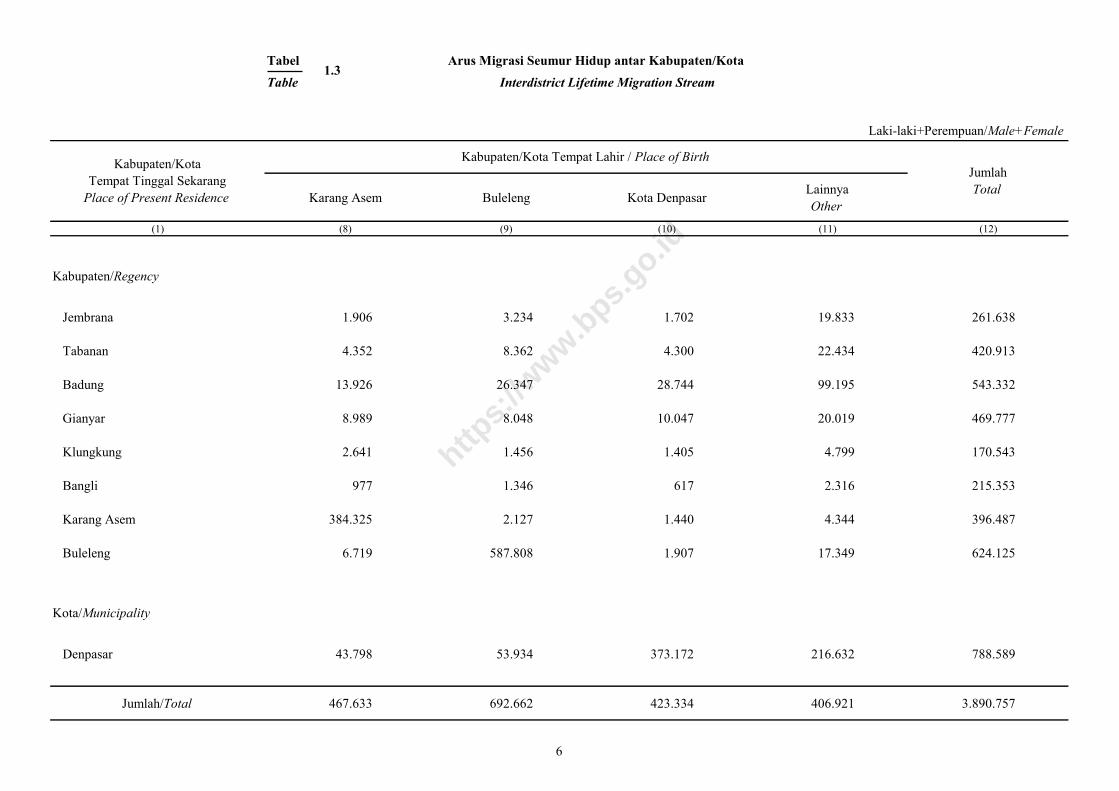
Laki-laki+Perempuan/Male+Female Laki-laki+Perempuan/Male+Female
Karang Asem Buleleng Kota DenpasarLainnya
Other
(1) (8) (9) (10) (11) (12)
Kabupaten/Regency
Jembrana 1.906 3.234 1.702 19.833 261.638
Tabanan 4.352 8.362 4.300 22.434 420.913
Badung 13.926 26.347 28.744 99.195 543.332
Gianyar 8.989 8.048 10.047 20.019 469.777
Klungkung 2.641 1.456 1.405 4.799 170.543
Bangli 977 1.346 617 2.316 215.353
Karang Asem 384.325 2.127 1.440 4.344 396.487
Buleleng 6.719 587.808 1.907 17.349 624.125
Kota/Municipality
Denpasar 43.798 53.934 373.172 216.632 788.589
Jumlah/Total 467.633 692.662 423.334 406.921 3.890.757
Kabupaten/Kota
Tempat Tinggal Sekarang
Place of Present Residence
Kabupaten/Kota Tempat Lahir / Place of Birth
Jumlah
Total
1.3
6
https:
//www.b
ps.go.id
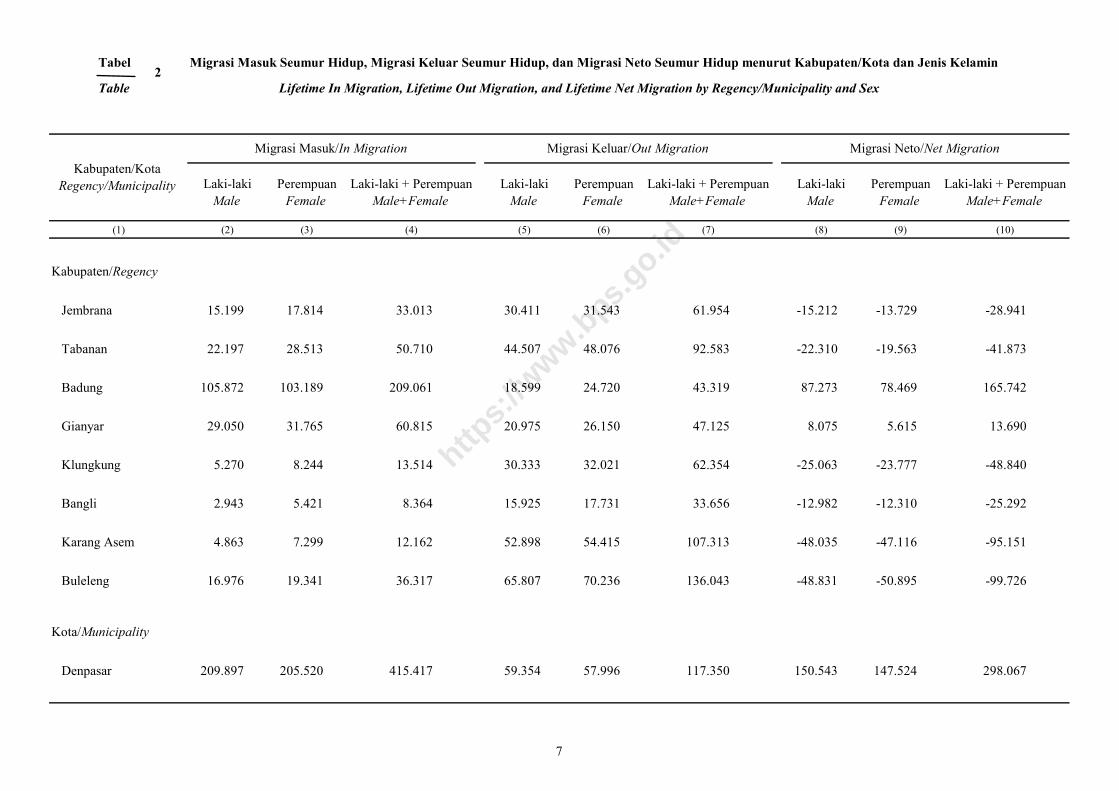
Tabel Migrasi Masuk Seumur Hidup, Migrasi Keluar Seumur Hidup, dan Migrasi Neto Seumur Hidup menurut Kabupaten/Kota dan Jenis Kelamin
Table Lifetime In Migration, Lifetime Out Migration, and Lifetime Net Migration by Regency/Municipality and Sex
Laki-laki Perempuan Laki-laki + Perempuan Laki-laki Perempuan Laki-laki + Perempuan Laki-laki Perempuan Laki-laki + Perempuan
Male Female Male+Female Male Female Male+Female Male Female Male+Female
(1) (2) (3) (4) (5) (6) (7) (8) (9) (10)
Kabupaten/Regency
Jembrana 15.199 17.814 33.013 30.411 31.543 61.954 -15.212 -13.729 -28.941
Tabanan 22.197 28.513 50.710 44.507 48.076 92.583 -22.310 -19.563 -41.873
Badung 105.872 103.189 209.061 18.599 24.720 43.319 87.273 78.469 165.742
Gianyar 29.050 31.765 60.815 20.975 26.150 47.125 8.075 5.615 13.690
Klungkung 5.270 8.244 13.514 30.333 32.021 62.354 -25.063 -23.777 -48.840
Bangli 2.943 5.421 8.364 15.925 17.731 33.656 -12.982 -12.310 -25.292
Karang Asem 4.863 7.299 12.162 52.898 54.415 107.313 -48.035 -47.116 -95.151
Buleleng 16.976 19.341 36.317 65.807 70.236 136.043 -48.831 -50.895 -99.726
Kota/Municipality
Denpasar 209.897 205.520 415.417 59.354 57.996 117.350 150.543 147.524 298.067
Migrasi Masuk/In Migration Migrasi Keluar/Out Migration Migrasi Neto/Net Migration
Kabupaten/Kota
Regency/Municipality
2
7
https:
//www.b
ps.go.id
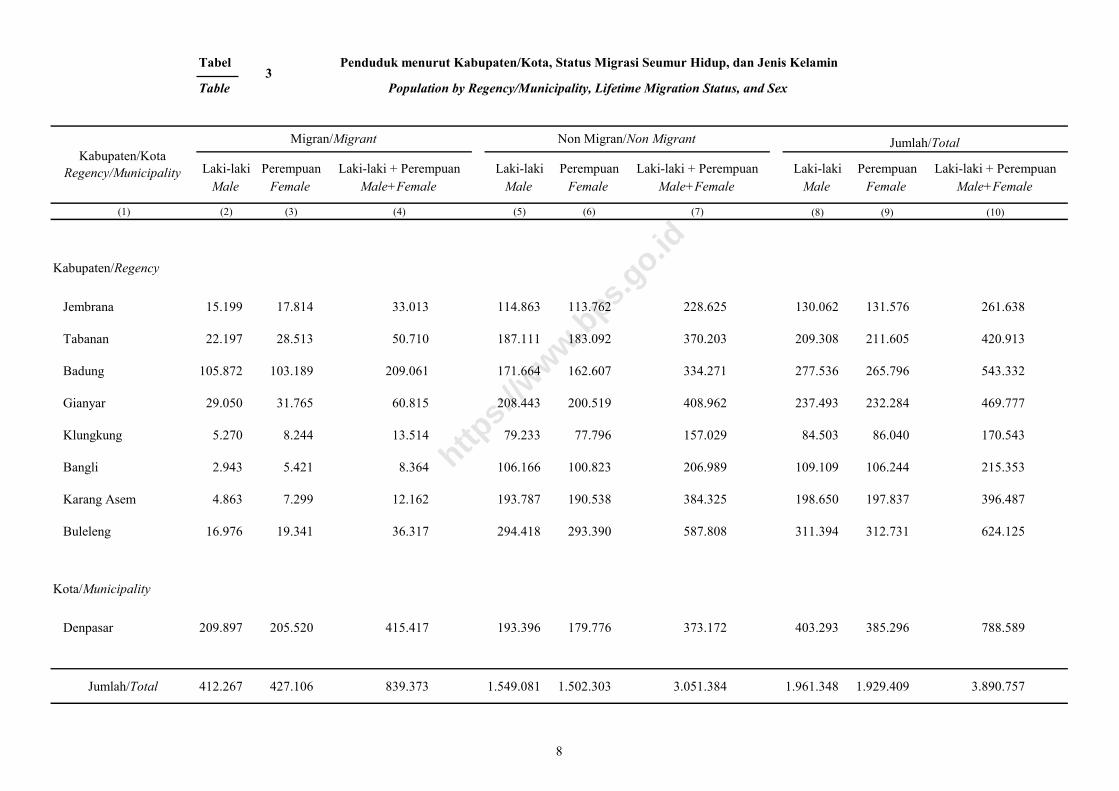
Tabel Penduduk menurut Kabupaten/Kota, Status Migrasi Seumur Hidup, dan Jenis Kelamin
Table Population by Regency/Municipality, Lifetime Migration Status, and Sex
Laki-laki Perempuan Laki-laki + Perempuan Laki-laki Perempuan Laki-laki + Perempuan Laki-laki Perempuan Laki-laki + Perempuan
Male Female Male+Female Male Female Male+Female Male Female Male+Female
(1) (2) (3) (4) (5) (6) (7) (8) (9) (10)
Kabupaten/Regency
Jembrana 15.199 17.814 33.013 114.863 113.762 228.625 130.062 131.576 261.638
Tabanan 22.197 28.513 50.710 187.111 183.092 370.203 209.308 211.605 420.913
Badung 105.872 103.189 209.061 171.664 162.607 334.271 277.536 265.796 543.332
Gianyar 29.050 31.765 60.815 208.443 200.519 408.962 237.493 232.284 469.777
Klungkung 5.270 8.244 13.514 79.233 77.796 157.029 84.503 86.040 170.543
Bangli 2.943 5.421 8.364 106.166 100.823 206.989 109.109 106.244 215.353
Karang Asem 4.863 7.299 12.162 193.787 190.538 384.325 198.650 197.837 396.487
Buleleng 16.976 19.341 36.317 294.418 293.390 587.808 311.394 312.731 624.125
Kota/Municipality
Denpasar 209.897 205.520 415.417 193.396 179.776 373.172 403.293 385.296 788.589
Jumlah/Total 412.267 427.106 839.373 1.549.081 1.502.303 3.051.384 1.961.348 1.929.409 3.890.757
Kabupaten/Kota
Regency/Municipality
Migran/Migrant Non Migran/Non Migrant Jumlah/Total
3
8
https:
//www.b
ps.go.id
Tabel
Table
Laki-laki/Male
Jembrana Tabanan Badung Gianyar Klungkung Bangli
(1) (2) (3) (4) (5) (6) (7)
Kabupaten/Regency
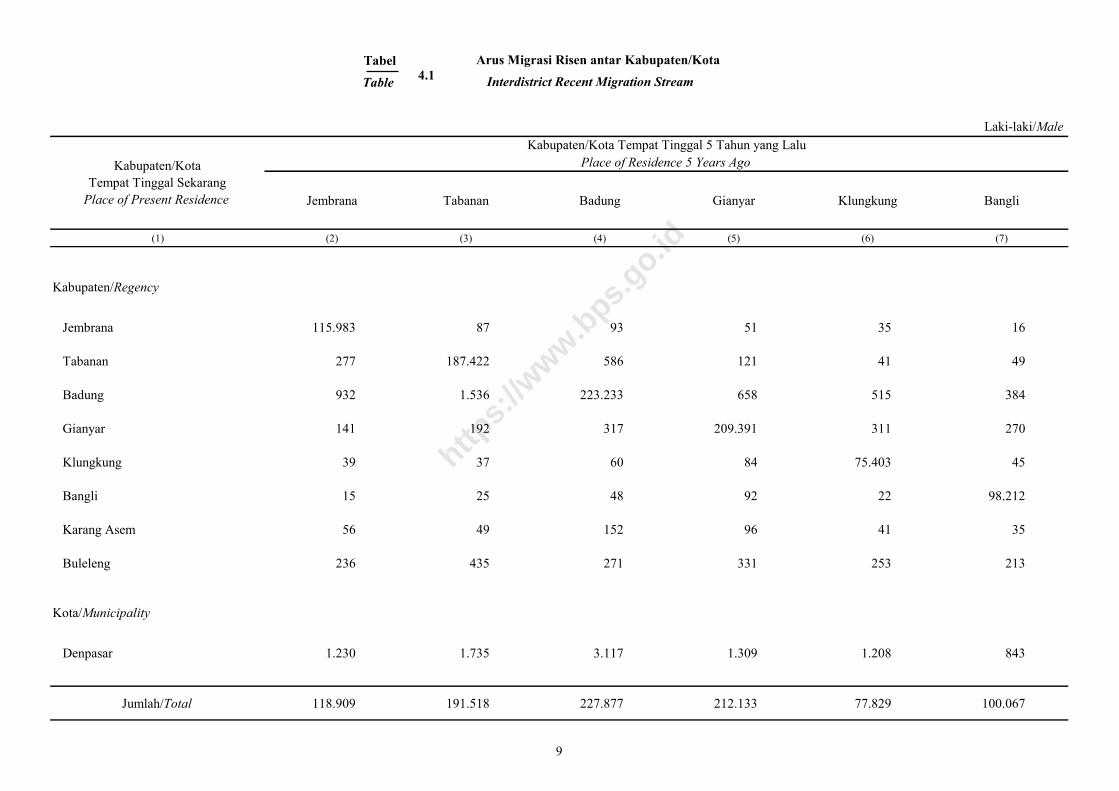
Jembrana 115.983 87 93 51 35 16
Tabanan 277 187.422 586 121 41 49
Badung 932 1.536 223.233 658 515 384
Gianyar 141 192 317 209.391 311 270
Klungkung 39 37 60 84 75.403 45
Bangli 15 25 48 92 22 98.212
Karang Asem 56 49 152 96 41 35
Buleleng 236 435 271 331 253 213
Kota/Municipality
Denpasar 1.230 1.735 3.117 1.309 1.208 843
Jumlah/Total 118.909 191.518 227.877 212.133 77.829 100.067
Arus Migrasi Risen antar Kabupaten/Kota
Interdistrict Recent Migration Stream
Kabupaten/Kota
Tempat Tinggal Sekarang
Place of Present Residence
Kabupaten/Kota Tempat Tinggal 5 Tahun yang Lalu
Place of Residence 5 Years Ago
4.1
9
https:
//www.b
ps.go.id
Tabel Arus Migrasi Risen antar Kabupaten/Kota
Table Interdistrict Recent Migration Stream
Karang Asem Buleleng Kota DenpasarLainnya
Other
Tidak Ditanyakan
Not Asked
(1) (8) (9) (10) (11) (12) (13)
Kabupaten/Regency
Jembrana 34 267 291 1.904 162 118.923
Tabanan 274 783 782 3.592 249 194.176
Badung 1.422 2.572 4.487 15.727 842 252.308
Gianyar 794 861 1.605 3.598 277 217.757
Klungkung 212 115 282 737 146 77.160
Bangli 95 122 110 343 371 99.455
Karang Asem 178.562 157 358 540 212 180.258
Buleleng 473 277.179 473 1.840 1.046 282.750
Kota/Municipality
Denpasar 3.035 4.198 319.647 27.972 745 365.039
Jumlah/Total 184.901 286.254 328.035 56.253 4.050 1.787.826
Laki-laki/Male
Kabupaten/Kota
Tempat Tinggal Sekarang
Place of Present Residence
Jumlah
Total
Kabupaten/Kota Tempat Tinggal 5 Tahun yang Lalu
Place of Residence 5 Years Ago
4.1
10
https:
//www.b
ps.go.id
Tabel
Table
Perempuan/Female
Jembrana Tabanan Badung Gianyar Klungkung Bangli
(1) (2) (3) (4) (5) (6) (7)
Kabupaten/Regency
Jembrana 118.026 122 130 60 63 30
Tabanan 348 191.349 741 165 68 72
Badung 822 1.626 217.659 764 540 447
Gianyar 129 254 385 206.489 351 393
Klungkung 52 43 84 161 77.483 70
Bangli 29 43 81 178 61 96.034
Karang Asem 81 63 190 134 122 78
Buleleng 337 523 332 372 234 237
Kota/Municipality
Denpasar 1.236 1.997 3.106 1.602 1.367 1.025
Jumlah/Total 121.060 196.020 222.708 209.925 80.289 98.386
Arus Migrasi Risen antar Kabupaten/Kota
Interdistrict Recent Migration Stream
Kabupaten/Kota
Tempat Tinggal Sekarang
Place of Present Residence
Kabupaten/Kota Tempat Tinggal 5 Tahun yang Lalu
Place of Residence 5 Years Ago
4.2
11
https:
//www.b
ps.go.id
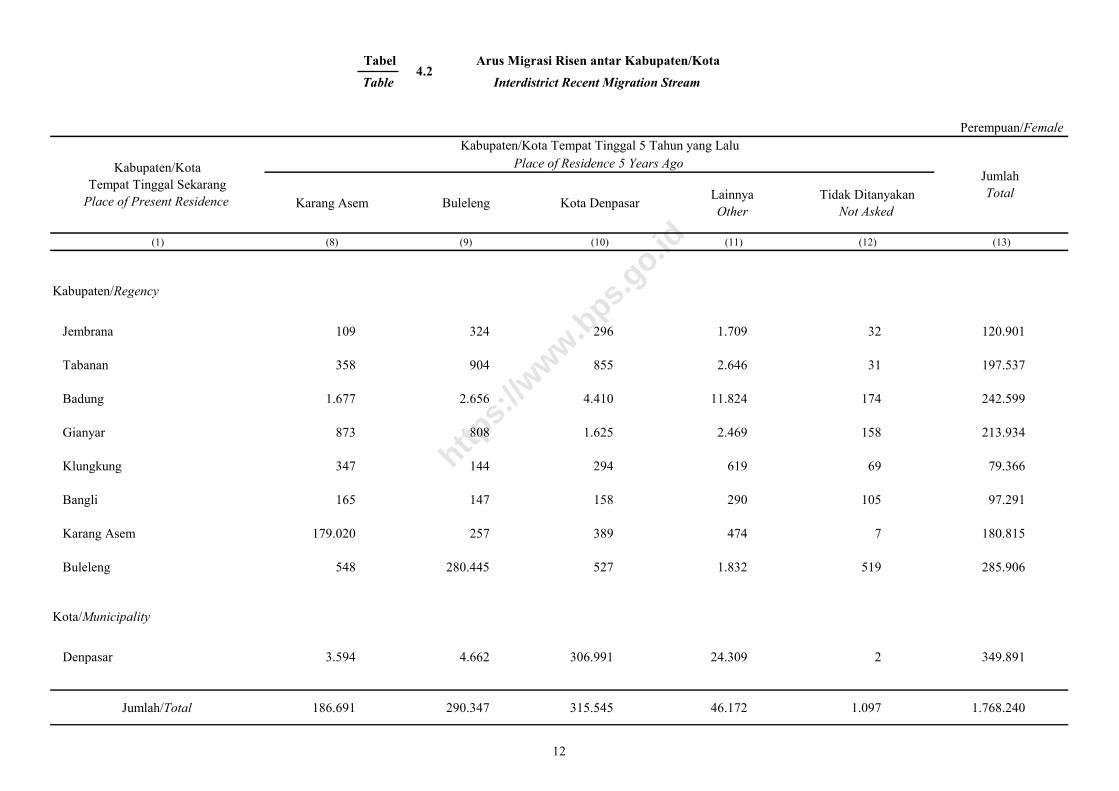
Tabel Arus Migrasi Risen antar Kabupaten/Kota
Table Interdistrict Recent Migration Stream
Karang Asem Buleleng Kota DenpasarLainnya
Other
Tidak Ditanyakan
Not Asked
(1) (8) (9) (10) (11) (12) (13)
Kabupaten/Regency
Jembrana 109 324 296 1.709 32 120.901
Tabanan 358 904 855 2.646 31 197.537
Badung 1.677 2.656 4.410 11.824 174 242.599
Gianyar 873 808 1.625 2.469 158 213.934
Klungkung 347 144 294 619 69 79.366
Bangli 165 147 158 290 105 97.291
Karang Asem 179.020 257 389 474 7 180.815
Buleleng 548 280.445 527 1.832 519 285.906
Kota/Municipality
Denpasar 3.594 4.662 306.991 24.309 2 349.891
Jumlah/Total 186.691 290.347 315.545 46.172 1.097 1.768.240
Perempuan/Female
Kabupaten/Kota
Tempat Tinggal Sekarang
Place of Present Residence
Jumlah
Total
Kabupaten/Kota Tempat Tinggal 5 Tahun yang Lalu
Place of Residence 5 Years Ago
4.2
12
https:
//www.b
ps.go.id
Tabel
Table
Laki-laki+Perempuan/Male+Female
Jembrana Tabanan Badung Gianyar Klungkung Bangli
(1) (2) (3) (4) (5) (6) (7)
Kabupaten/Regency
Jembrana 234.009 209 223 111 98 46
Tabanan 625 378.771 1.327 286 109 121
Badung 1.754 3.162 440.892 1.422 1.055 831
Gianyar 270 446 702 415.880 662 663
Klungkung 91 80 144 245 152.886 115
Bangli 44 68 129 270 83 194.246
Karang Asem 137 112 342 230 163 113
Buleleng 573 958 603 703 487 450
Kota/Municipality
Denpasar 2.466 3.732 6.223 2.911 2.575 1.868
Jumlah/Total 239.969 387.538 450.585 422.058 158.118 198.453
Interdistrict Recent Migration Stream
Arus Migrasi Risen antar Kabupaten/Kota
Kabupaten/Kota
Tempat Tinggal Sekarang
Place of Present Residence
Kabupaten/Kota Tempat Tinggal 5 Tahun yang Lalu
Place of Residence 5 Years Ago
4.3
13
https:
//www.b
ps.go.id
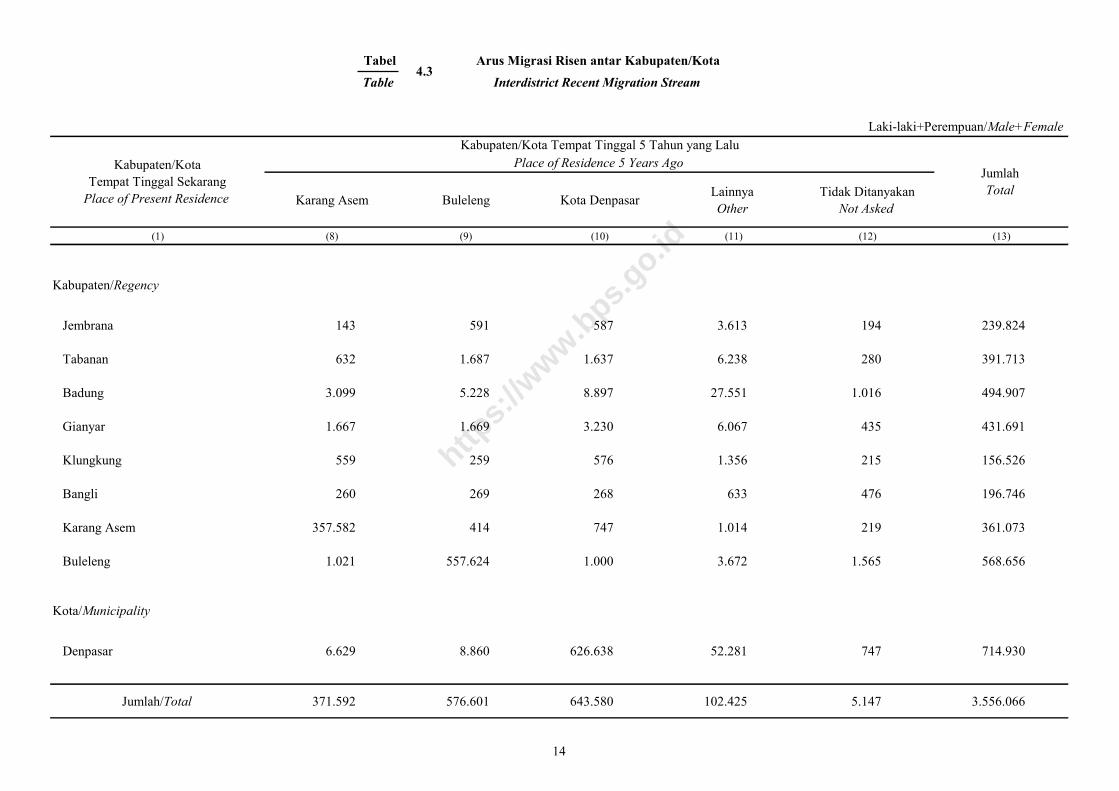
Tabel Arus Migrasi Risen antar Kabupaten/Kota
Table Interdistrict Recent Migration Stream
Laki-laki+Perempuan/Male+Female Laki-laki+Perempuan/Male+Female
Karang Asem Buleleng Kota DenpasarLainnya
Other
Tidak Ditanyakan
Not Asked
(1) (8) (9) (10) (11) (12) (13)
Kabupaten/Regency
Jembrana 143 591 587 3.613 194 239.824
Tabanan 632 1.687 1.637 6.238 280 391.713
Badung 3.099 5.228 8.897 27.551 1.016 494.907
Gianyar 1.667 1.669 3.230 6.067 435 431.691
Klungkung 559 259 576 1.356 215 156.526
Bangli 260 269 268 633 476 196.746
Karang Asem 357.582 414 747 1.014 219 361.073
Buleleng 1.021 557.624 1.000 3.672 1.565 568.656
Kota/Municipality
Denpasar 6.629 8.860 626.638 52.281 747 714.930
Jumlah/Total 371.592 576.601 643.580 102.425 5.147 3.556.066
Kabupaten/Kota
Tempat Tinggal Sekarang
Place of Present Residence
Jumlah
Total
Kabupaten/Kota Tempat Tinggal 5 Tahun yang Lalu
Place of Residence 5 Years Ago
4.3
14
https:
//www.b
ps.go.id
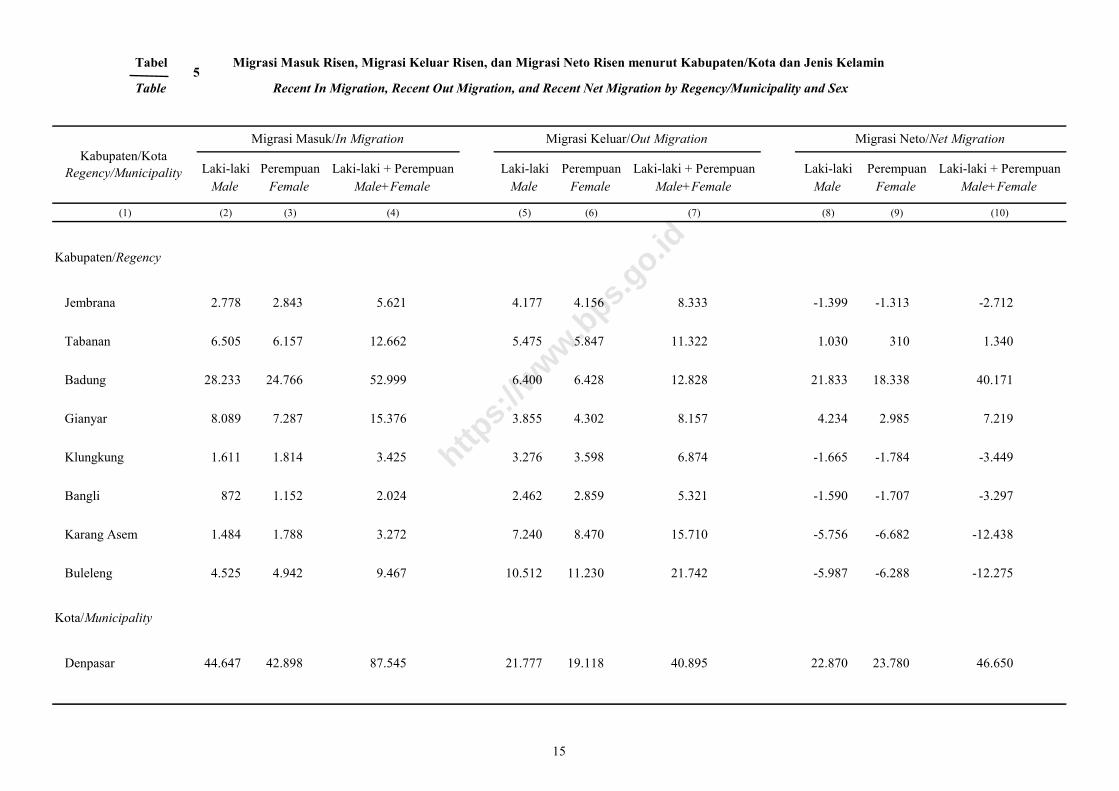
Tabel Migrasi Masuk Risen, Migrasi Keluar Risen, dan Migrasi Neto Risen menurut Kabupaten/Kota dan Jenis Kelamin
Table Recent In Migration, Recent Out Migration, and Recent Net Migration by Regency/Municipality and Sex
Laki-laki Perempuan Laki-laki + Perempuan Laki-laki Perempuan Laki-laki + Perempuan Laki-laki Perempuan Laki-laki + Perempuan
Male Female Male+Female Male Female Male+Female Male Female Male+Female
(1) (2) (3) (4) (5) (6) (7) (8) (9) (10)
Kabupaten/Regency
Jembrana 2.778 2.843 5.621 4.177 4.156 8.333 -1.399 -1.313 -2.712
Tabanan 6.505 6.157 12.662 5.475 5.847 11.322 1.030 310 1.340
Badung 28.233 24.766 52.999 6.400 6.428 12.828 21.833 18.338 40.171
Gianyar 8.089 7.287 15.376 3.855 4.302 8.157 4.234 2.985 7.219
Klungkung 1.611 1.814 3.425 3.276 3.598 6.874 -1.665 -1.784 -3.449
Bangli 872 1.152 2.024 2.462 2.859 5.321 -1.590 -1.707 -3.297
Karang Asem 1.484 1.788 3.272 7.240 8.470 15.710 -5.756 -6.682 -12.438
Buleleng 4.525 4.942 9.467 10.512 11.230 21.742 -5.987 -6.288 -12.275
Kota/Municipality
Denpasar 44.647 42.898 87.545 21.777 19.118 40.895 22.870 23.780 46.650
Kabupaten/Kota
Regency/Municipality
Migrasi Masuk/In Migration Migrasi Keluar/Out Migration Migrasi Neto/Net Migration
5
15
https:
//www.b
ps.go.id
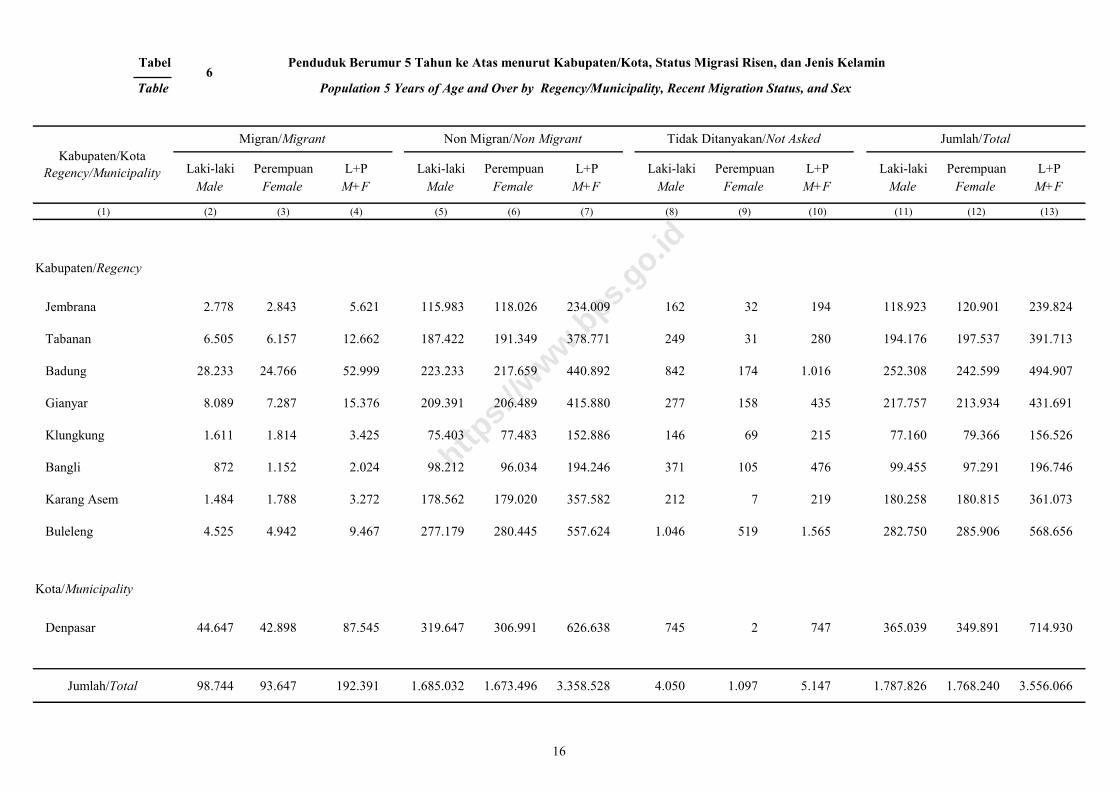
Tabel Penduduk Berumur 5 Tahun ke Atas menurut Kabupaten/Kota, Status Migrasi Risen, dan Jenis Kelamin
Table Population 5 Years of Age and Over by Regency/Municipality, Recent Migration Status, and Sex
Laki-laki Perempuan L+P Laki-laki Perempuan L+P Laki-laki Perempuan L+P Laki-laki Perempuan L+P
Male Female M+F Male Female M+F Male Female M+F Male Female M+F
(1) (2) (3) (4) (5) (6) (7) (8) (9) (10) (11) (12) (13)
Kabupaten/Regency
Jembrana 2.778 2.843 5.621 115.983 118.026 234.009 162 32 194 118.923 120.901 239.824
Tabanan 6.505 6.157 12.662 187.422 191.349 378.771 249 31 280 194.176 197.537 391.713
Badung 28.233 24.766 52.999 223.233 217.659 440.892 842 174 1.016 252.308 242.599 494.907
Gianyar 8.089 7.287 15.376 209.391 206.489 415.880 277 158 435 217.757 213.934 431.691
Klungkung 1.611 1.814 3.425 75.403 77.483 152.886 146 69 215 77.160 79.366 156.526
Bangli 872 1.152 2.024 98.212 96.034 194.246 371 105 476 99.455 97.291 196.746
Karang Asem 1.484 1.788 3.272 178.562 179.020 357.582 212 7 219 180.258 180.815 361.073
Buleleng 4.525 4.942 9.467 277.179 280.445 557.624 1.046 519 1.565 282.750 285.906 568.656
Kota/Municipality
Denpasar 44.647 42.898 87.545 319.647 306.991 626.638 745 2 747 365.039 349.891 714.930
Jumlah/Total 98.744 93.647 192.391 1.685.032 1.673.496 3.358.528 4.050 1.097 5.147 1.787.826 1.768.240 3.556.066
Migran/Migrant Non Migran/Non Migrant Jumlah/Total
Kabupaten/Kota
Regency/Municipality
Tidak Ditanyakan/Not Asked
6
16
https:
//www.b
ps.go.id
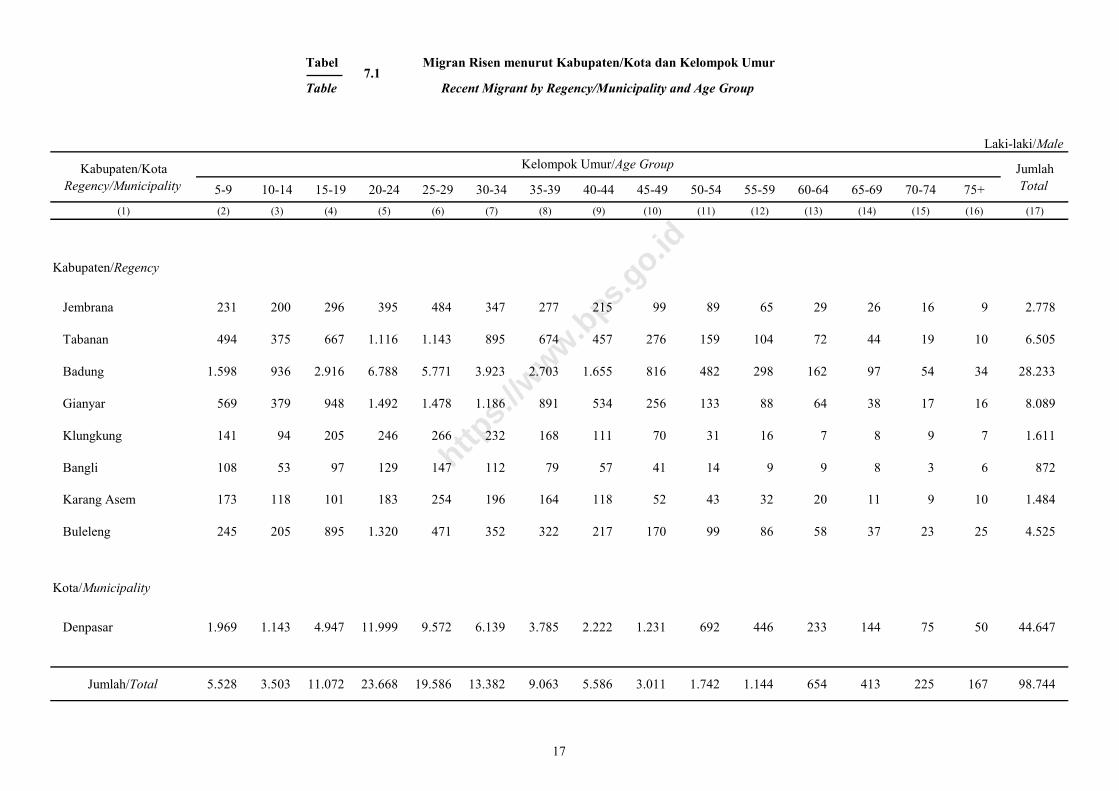
Tabel Migran Risen menurut Kabupaten/Kota dan Kelompok Umur
Table Recent Migrant by Regency/Municipality and Age Group
Kabupaten/Kota Jumlah
Regency/Municipality 5-9 10-14 15-19 20-24 25-29 30-34 35-39 40-44 45-49 50-54 55-59 60-64 65-69 70-74 75+ Total
(1) (2) (3) (4) (5) (6) (7) (8) (9) (10) (11) (12) (13) (14) (15) (16) (17)
Kabupaten/Regency
Jembrana 231 200 296 395 484 347 277 215 99 89 65 29 26 16 9 2.778
Tabanan 494 375 667 1.116 1.143 895 674 457 276 159 104 72 44 19 10 6.505
Badung 1.598 936 2.916 6.788 5.771 3.923 2.703 1.655 816 482 298 162 97 54 34 28.233
Gianyar 569 379 948 1.492 1.478 1.186 891 534 256 133 88 64 38 17 16 8.089
Klungkung 141 94 205 246 266 232 168 111 70 31 16 7 8 9 7 1.611
Bangli 108 53 97 129 147 112 79 57 41 14 9 9 8 3 6 872
Karang Asem 173 118 101 183 254 196 164 118 52 43 32 20 11 9 10 1.484
Buleleng 245 205 895 1.320 471 352 322 217 170 99 86 58 37 23 25 4.525
Kota/Municipality
Denpasar 1.969 1.143 4.947 11.999 9.572 6.139 3.785 2.222 1.231 692 446 233 144 75 50 44.647
Jumlah/Total 5.528 3.503 11.072 23.668 19.586 13.382 9.063 5.586 3.011 1.742 1.144 654 413 225 167 98.744
Kelompok Umur/Age Group
Laki-laki/Male
7.1
17
https:
//www.b
ps.go.id
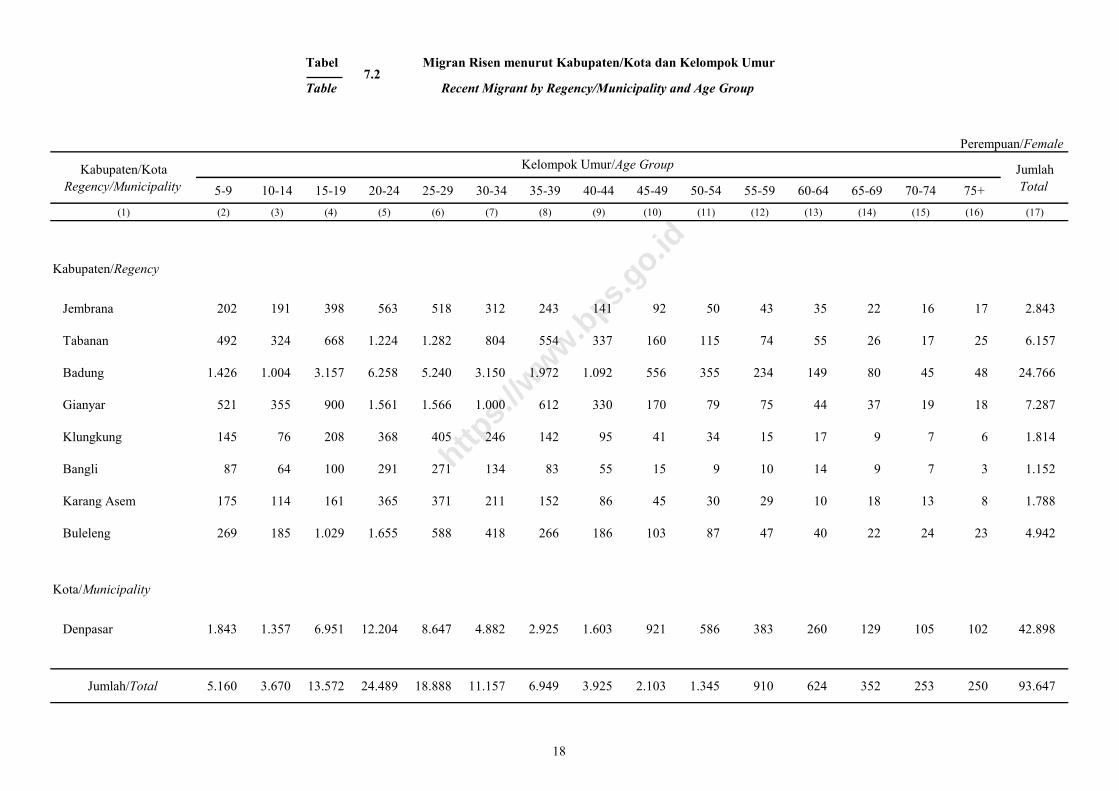
Tabel Migran Risen menurut Kabupaten/Kota dan Kelompok Umur
Table Recent Migrant by Regency/Municipality and Age Group
Kabupaten/Kota Jumlah
Regency/Municipality 5-9 10-14 15-19 20-24 25-29 30-34 35-39 40-44 45-49 50-54 55-59 60-64 65-69 70-74 75+ Total
(1) (2) (3) (4) (5) (6) (7) (8) (9) (10) (11) (12) (13) (14) (15) (16) (17)
Kabupaten/Regency
Jembrana 202 191 398 563 518 312 243 141 92 50 43 35 22 16 17 2.843
Tabanan 492 324 668 1.224 1.282 804 554 337 160 115 74 55 26 17 25 6.157
Badung 1.426 1.004 3.157 6.258 5.240 3.150 1.972 1.092 556 355 234 149 80 45 48 24.766
Gianyar 521 355 900 1.561 1.566 1.000 612 330 170 79 75 44 37 19 18 7.287
Klungkung 145 76 208 368 405 246 142 95 41 34 15 17 9 7 6 1.814
Bangli 87 64 100 291 271 134 83 55 15 9 10 14 9 7 3 1.152
Karang Asem 175 114 161 365 371 211 152 86 45 30 29 10 18 13 8 1.788
Buleleng 269 185 1.029 1.655 588 418 266 186 103 87 47 40 22 24 23 4.942
Kota/Municipality
Denpasar 1.843 1.357 6.951 12.204 8.647 4.882 2.925 1.603 921 586 383 260 129 105 102 42.898
Jumlah/Total 5.160 3.670 13.572 24.489 18.888 11.157 6.949 3.925 2.103 1.345 910 624 352 253 250 93.647
Perempuan/Female
Kelompok Umur/Age Group
7.2
18
https:
//www.b
ps.go.id
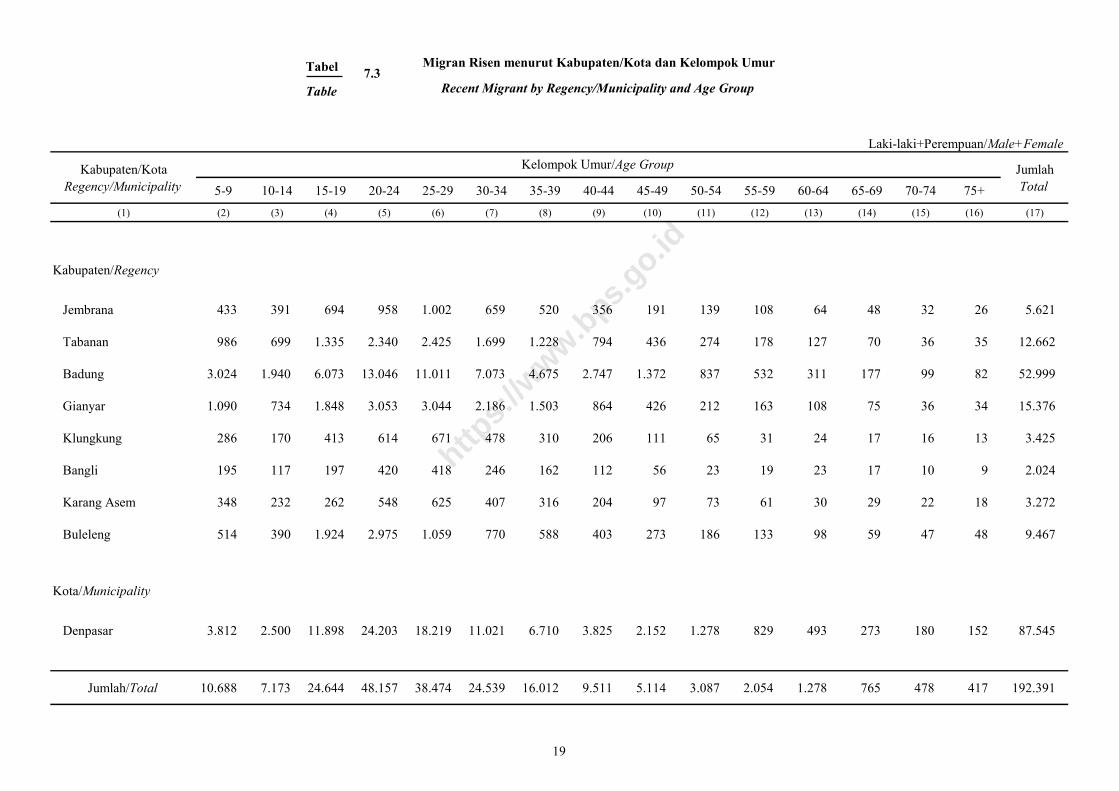
Tabel Migran Risen menurut Kabupaten/Kota dan Kelompok Umur
Table Recent Migrant by Regency/Municipality and Age Group
Kabupaten/Kota Jumlah
Regency/Municipality 5-9 10-14 15-19 20-24 25-29 30-34 35-39 40-44 45-49 50-54 55-59 60-64 65-69 70-74 75+ Total
(1) (2) (3) (4) (5) (6) (7) (8) (9) (10) (11) (12) (13) (14) (15) (16) (17)
Kabupaten/Regency
Jembrana 433 391 694 958 1.002 659 520 356 191 139 108 64 48 32 26 5.621
Tabanan 986 699 1.335 2.340 2.425 1.699 1.228 794 436 274 178 127 70 36 35 12.662
Badung 3.024 1.940 6.073 13.046 11.011 7.073 4.675 2.747 1.372 837 532 311 177 99 82 52.999
Gianyar 1.090 734 1.848 3.053 3.044 2.186 1.503 864 426 212 163 108 75 36 34 15.376
Klungkung 286 170 413 614 671 478 310 206 111 65 31 24 17 16 13 3.425
Bangli 195 117 197 420 418 246 162 112 56 23 19 23 17 10 9 2.024
Karang Asem 348 232 262 548 625 407 316 204 97 73 61 30 29 22 18 3.272
Buleleng 514 390 1.924 2.975 1.059 770 588 403 273 186 133 98 59 47 48 9.467
Kota/Municipality
Denpasar 3.812 2.500 11.898 24.203 18.219 11.021 6.710 3.825 2.152 1.278 829 493 273 180 152 87.545
Jumlah/Total 10.688 7.173 24.644 48.157 38.474 24.539 16.012 9.511 5.114 3.087 2.054 1.278 765 478 417 192.391
Kelompok Umur/Age Group
Laki-laki+Perempuan/Male+Female
7.3
19
https:
//www.b
ps.go.id
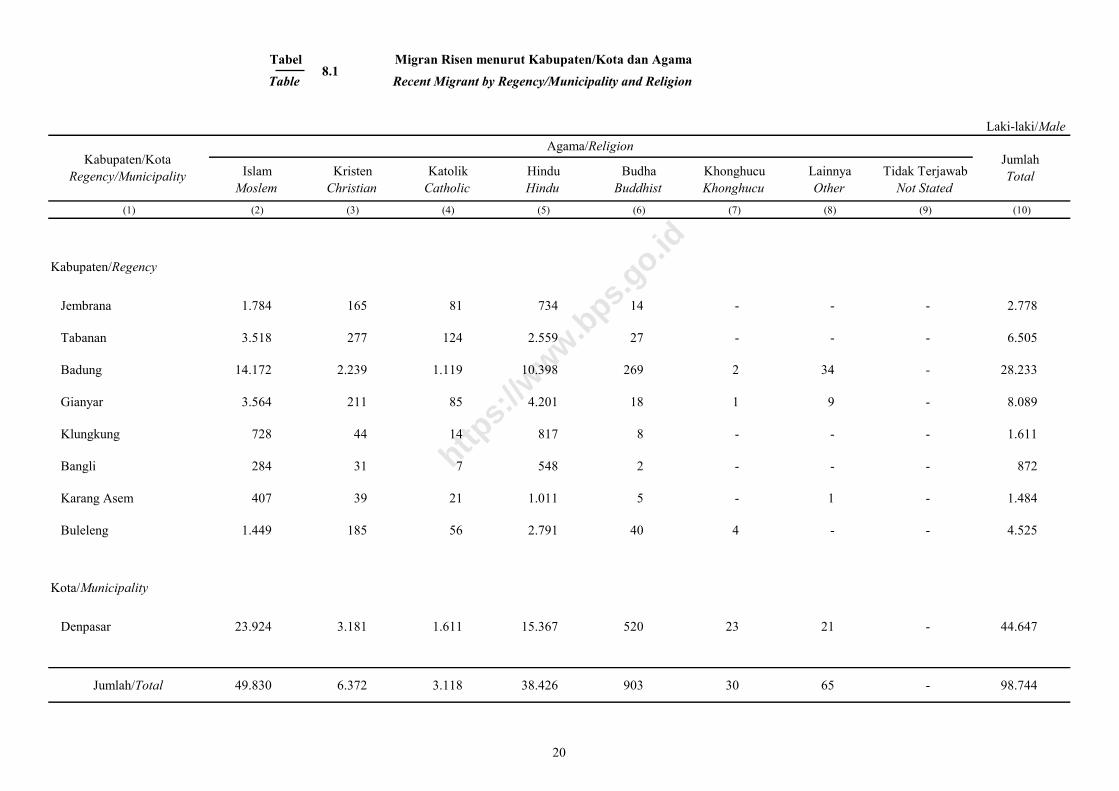
Tabel Migran Risen menurut Kabupaten/Kota dan Agama
Table Recent Migrant by Regency/Municipality and Religion
Islam Kristen Katolik Hindu Budha Khonghucu Lainnya Tidak Terjawab
Moslem Christian Catholic Hindu Buddhist Khonghucu Other Not Stated
(1) (2) (3) (4) (5) (6) (7) (8) (9) (10)
Kabupaten/Regency
Jembrana 1.784 165 81 734 14 - - - 2.778
Tabanan 3.518 277 124 2.559 27 - - - 6.505
Badung 14.172 2.239 1.119 10.398 269 2 34 - 28.233
Gianyar 3.564 211 85 4.201 18 1 9 - 8.089
Klungkung 728 44 14 817 8 - - - 1.611
Bangli 284 31 7 548 2 - - - 872
Karang Asem 407 39 21 1.011 5 - 1 - 1.484
Buleleng 1.449 185 56 2.791 40 4 - - 4.525
Kota/Municipality
Denpasar 23.924 3.181 1.611 15.367 520 23 21 - 44.647
Jumlah/Total 49.830 6.372 3.118 38.426 903 30 65 - 98.744
Kabupaten/Kota
Regency/Municipality
Jumlah
Total
Laki-laki/Male
Agama/Religion
8.1
20
https:
//www.b
ps.go.id
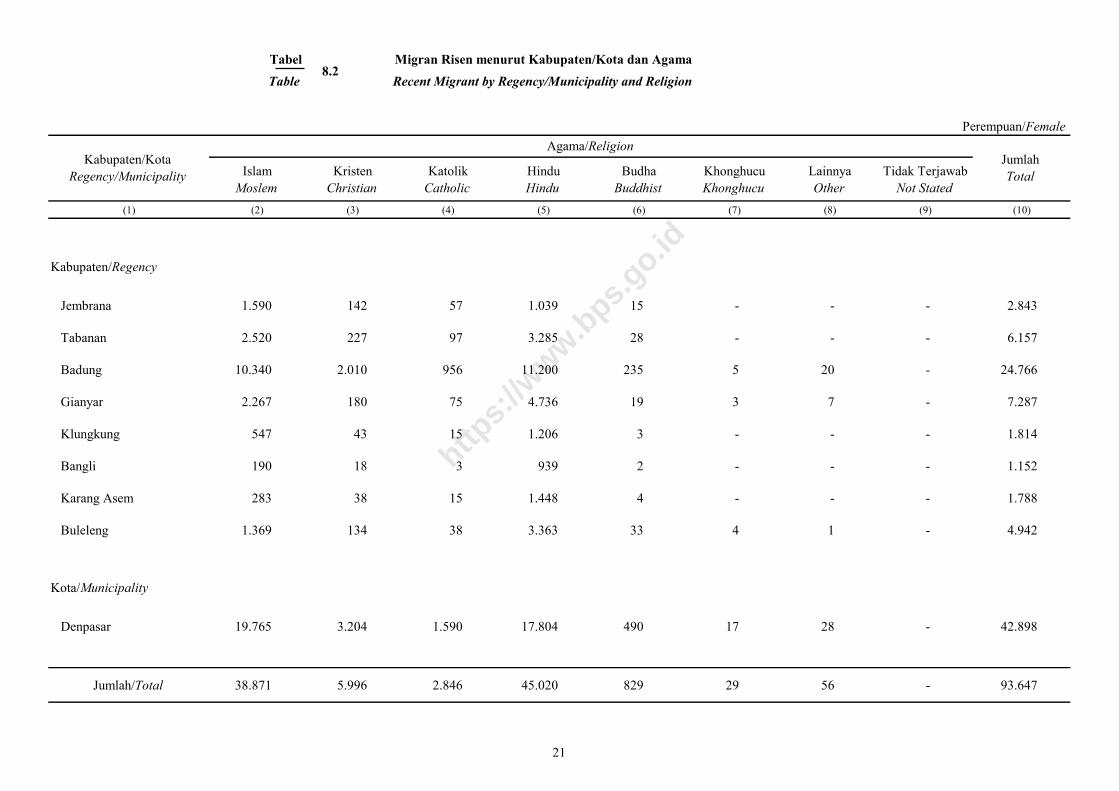
Tabel Migran Risen menurut Kabupaten/Kota dan Agama
Table Recent Migrant by Regency/Municipality and Religion
Islam Kristen Katolik Hindu Budha Khonghucu Lainnya Tidak Terjawab
Moslem Christian Catholic Hindu Buddhist Khonghucu Other Not Stated
(1) (2) (3) (4) (5) (6) (7) (8) (9) (10)
Kabupaten/Regency
Jembrana 1.590 142 57 1.039 15 - - - 2.843
Tabanan 2.520 227 97 3.285 28 - - - 6.157
Badung 10.340 2.010 956 11.200 235 5 20 - 24.766
Gianyar 2.267 180 75 4.736 19 3 7 - 7.287
Klungkung 547 43 15 1.206 3 - - - 1.814
Bangli 190 18 3 939 2 - - - 1.152
Karang Asem 283 38 15 1.448 4 - - - 1.788
Buleleng 1.369 134 38 3.363 33 4 1 - 4.942
Kota/Municipality
Denpasar 19.765 3.204 1.590 17.804 490 17 28 - 42.898
Jumlah/Total 38.871 5.996 2.846 45.020 829 29 56 - 93.647
Perempuan/Female
Kabupaten/Kota
Regency/Municipality
Jumlah
Total
Agama/Religion
8.2
21
https:
//www.b
ps.go.id
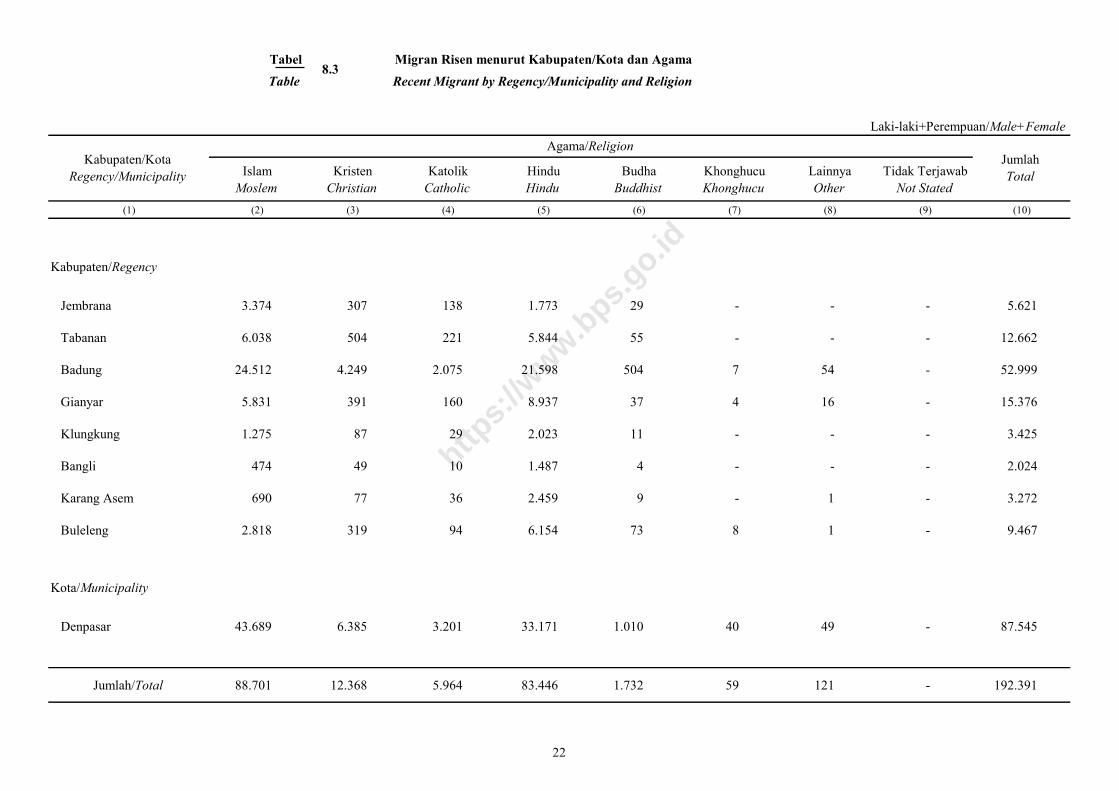
Tabel Migran Risen menurut Kabupaten/Kota dan Agama
Table Recent Migrant by Regency/Municipality and Religion
Islam Kristen Katolik Hindu Budha Khonghucu Lainnya Tidak Terjawab
Moslem Christian Catholic Hindu Buddhist Khonghucu Other Not Stated
(1) (2) (3) (4) (5) (6) (7) (8) (9) (10)
Kabupaten/Regency
Jembrana 3.374 307 138 1.773 29 - - - 5.621
Tabanan 6.038 504 221 5.844 55 - - - 12.662
Badung 24.512 4.249 2.075 21.598 504 7 54 - 52.999
Gianyar 5.831 391 160 8.937 37 4 16 - 15.376
Klungkung 1.275 87 29 2.023 11 - - - 3.425
Bangli 474 49 10 1.487 4 - - - 2.024
Karang Asem 690 77 36 2.459 9 - 1 - 3.272
Buleleng 2.818 319 94 6.154 73 8 1 - 9.467
Kota/Municipality
Denpasar 43.689 6.385 3.201 33.171 1.010 40 49 - 87.545
Jumlah/Total 88.701 12.368 5.964 83.446 1.732 59 121 - 192.391
Kabupaten/Kota
Regency/Municipality
Jumlah
Total
Laki-laki+Perempuan/Male+Female
Agama/Religion
8.3
22
https:
//www.b
ps.go.id
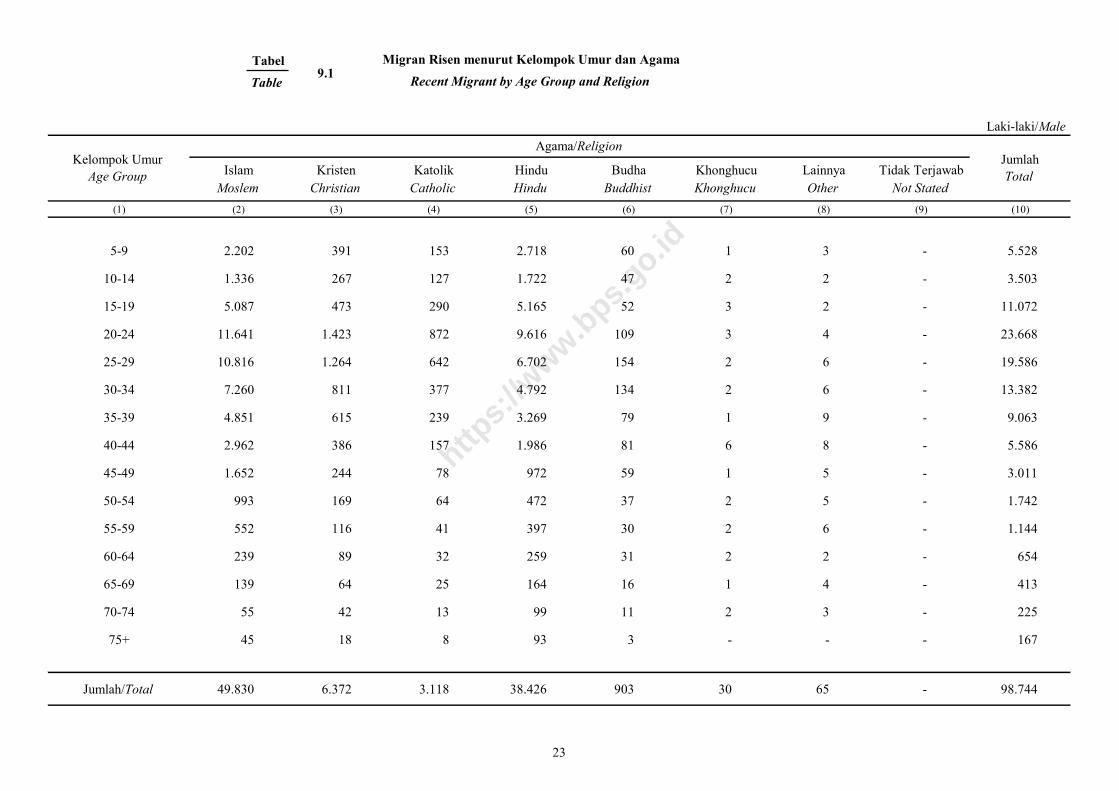
Tabel Migran Risen menurut Kelompok Umur dan Agama
Table Recent Migrant by Age Group and Religion
Islam Kristen Katolik Hindu Budha Khonghucu Lainnya Tidak Terjawab
Moslem Christian Catholic Hindu Buddhist Khonghucu Other Not Stated
(1) (2) (3) (4) (5) (6) (7) (8) (9) (10)
5-9 2.202 391 153 2.718 60 1 3 - 5.528
10-14 1.336 267 127 1.722 47 2 2 - 3.503
15-19 5.087 473 290 5.165 52 3 2 - 11.072
20-24 11.641 1.423 872 9.616 109 3 4 - 23.668
25-29 10.816 1.264 642 6.702 154 2 6 - 19.586
30-34 7.260 811 377 4.792 134 2 6 - 13.382
35-39 4.851 615 239 3.269 79 1 9 - 9.063
40-44 2.962 386 157 1.986 81 6 8 - 5.586
45-49 1.652 244 78 972 59 1 5 - 3.011
50-54 993 169 64 472 37 2 5 - 1.742
55-59 552 116 41 397 30 2 6 - 1.144
60-64 239 89 32 259 31 2 2 - 654
65-69 139 64 25 164 16 1 4 - 413
70-74 55 42 13 99 11 2 3 - 225
75+ 45 18 8 93 3 - - - 167
Jumlah/Total 49.830 6.372 3.118 38.426 903 30 65 - 98.744
Kelompok Umur
Age Group
Jumlah
Total
Laki-laki/Male
Agama/Religion
9.1
23
https:
//www.b
ps.go.id
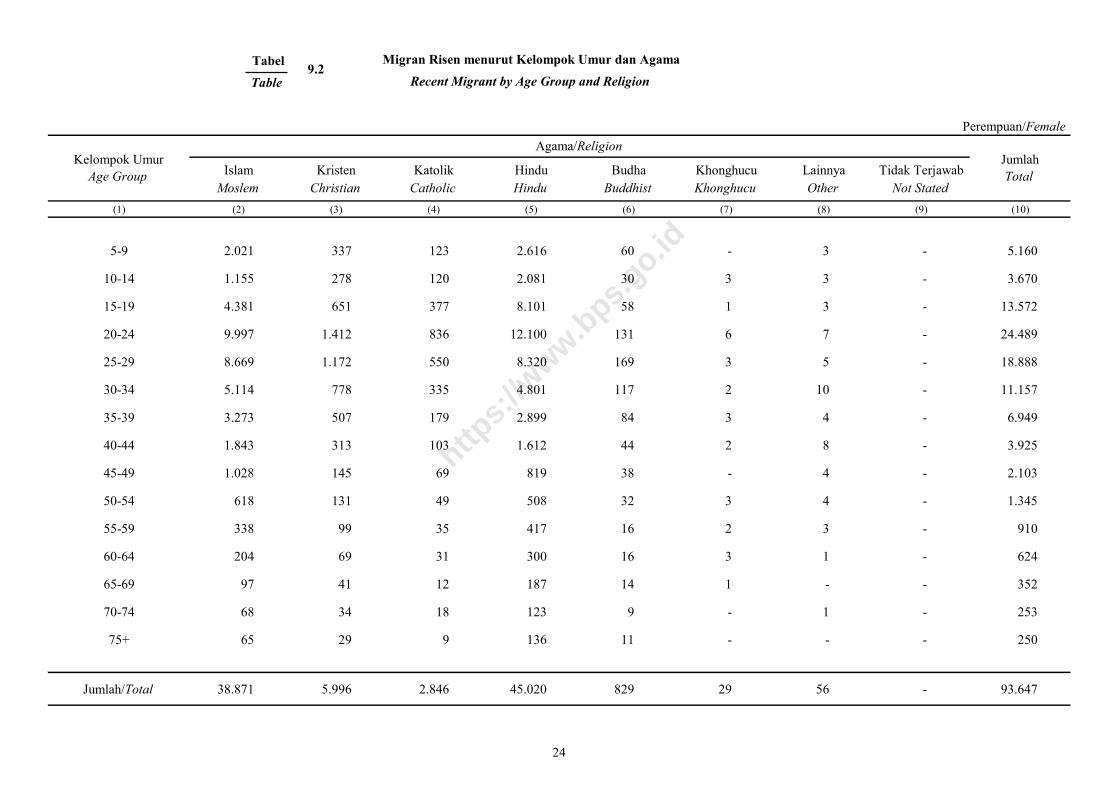
Tabel Migran Risen menurut Kelompok Umur dan Agama
Table Recent Migrant by Age Group and Religion
Islam Kristen Katolik Hindu Budha Khonghucu Lainnya Tidak Terjawab
Moslem Christian Catholic Hindu Buddhist Khonghucu Other Not Stated
(1) (2) (3) (4) (5) (6) (7) (8) (9) (10)
5-9 2.021 337 123 2.616 60 - 3 - 5.160
10-14 1.155 278 120 2.081 30 3 3 - 3.670
15-19 4.381 651 377 8.101 58 1 3 - 13.572
20-24 9.997 1.412 836 12.100 131 6 7 - 24.489
25-29 8.669 1.172 550 8.320 169 3 5 - 18.888
30-34 5.114 778 335 4.801 117 2 10 - 11.157
35-39 3.273 507 179 2.899 84 3 4 - 6.949
40-44 1.843 313 103 1.612 44 2 8 - 3.925
45-49 1.028 145 69 819 38 - 4 - 2.103
50-54 618 131 49 508 32 3 4 - 1.345
55-59 338 99 35 417 16 2 3 - 910
60-64 204 69 31 300 16 3 1 - 624
65-69 97 41 12 187 14 1 - - 352
70-74 68 34 18 123 9 - 1 - 253
75+ 65 29 9 136 11 - - - 250
Jumlah/Total 38.871 5.996 2.846 45.020 829 29 56 - 93.647
Perempuan/Female
Kelompok Umur
Age Group
Jumlah
Total
Agama/Religion
9.2
24
https:
//www.b
ps.go.id
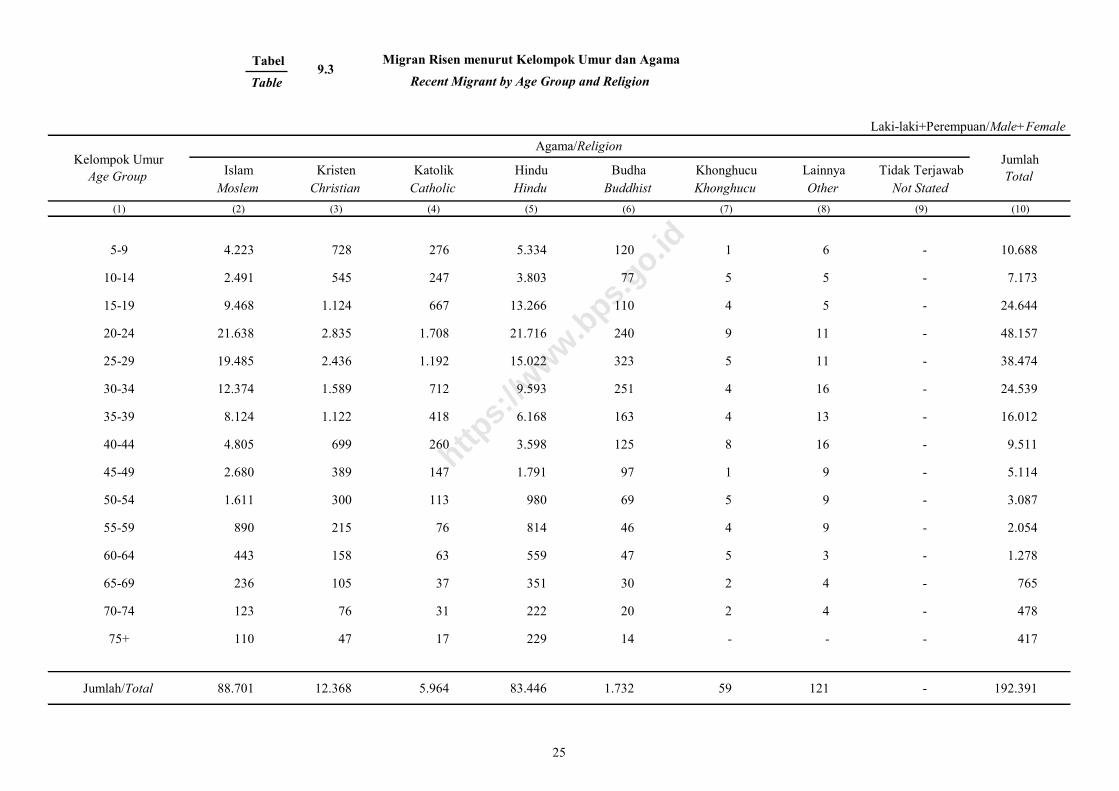
Tabel Migran Risen menurut Kelompok Umur dan Agama
Table Recent Migrant by Age Group and Religion
Islam Kristen Katolik Hindu Budha Khonghucu Lainnya Tidak Terjawab
Moslem Christian Catholic Hindu Buddhist Khonghucu Other Not Stated
(1) (2) (3) (4) (5) (6) (7) (8) (9) (10)
5-9 4.223 728 276 5.334 120 1 6 - 10.688
10-14 2.491 545 247 3.803 77 5 5 - 7.173
15-19 9.468 1.124 667 13.266 110 4 5 - 24.644
20-24 21.638 2.835 1.708 21.716 240 9 11 - 48.157
25-29 19.485 2.436 1.192 15.022 323 5 11 - 38.474
30-34 12.374 1.589 712 9.593 251 4 16 - 24.539
35-39 8.124 1.122 418 6.168 163 4 13 - 16.012
40-44 4.805 699 260 3.598 125 8 16 - 9.511
45-49 2.680 389 147 1.791 97 1 9 - 5.114
50-54 1.611 300 113 980 69 5 9 - 3.087
55-59 890 215 76 814 46 4 9 - 2.054
60-64 443 158 63 559 47 5 3 - 1.278
65-69 236 105 37 351 30 2 4 - 765
70-74 123 76 31 222 20 2 4 - 478
75+ 110 47 17 229 14 - - - 417
Jumlah/Total 88.701 12.368 5.964 83.446 1.732 59 121 - 192.391
Kelompok Umur
Age Group
Jumlah
Total
Laki-laki+Perempuan/Male+Female
Agama/Religion
9.3
25
https:
//www.b
ps.go.id
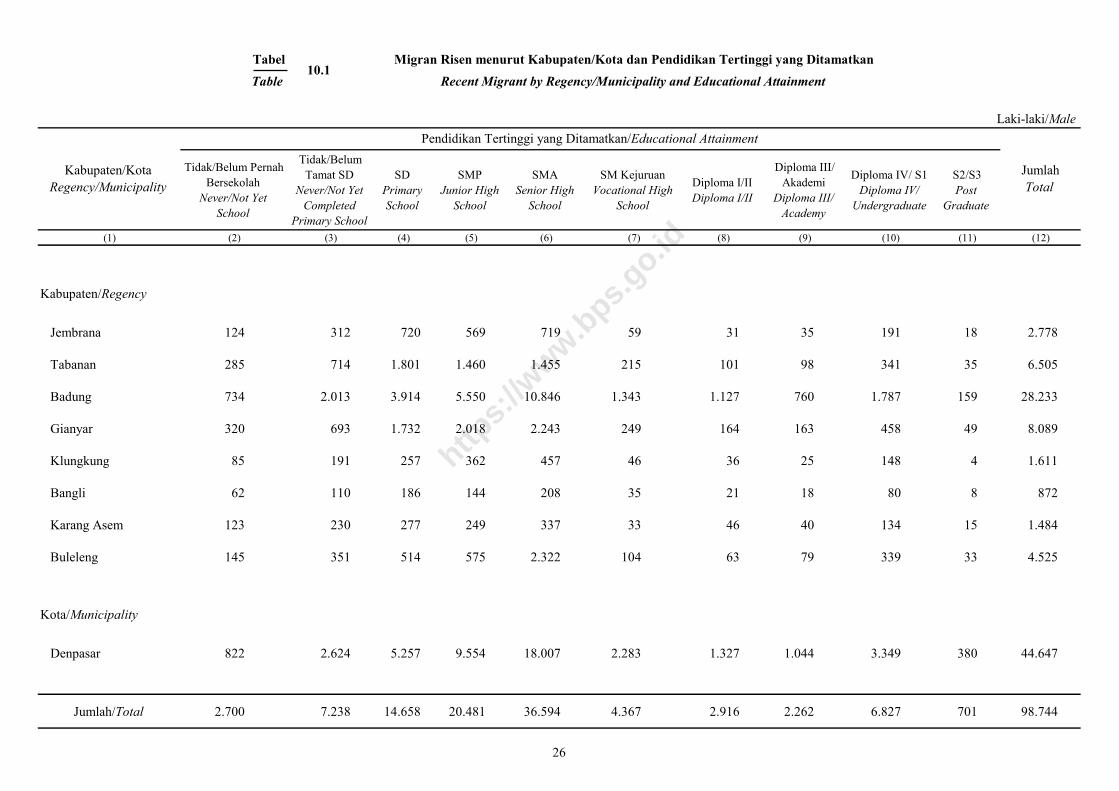
Tabel Migran Risen menurut Kabupaten/Kota dan Pendidikan Tertinggi yang Ditamatkan
Table Recent Migrant by Regency/Municipality and Educational Attainment
Tidak/Belum Pernah
Bersekolah
Never/Not Yet
School
Tidak/Belum
Tamat SD
Never/Not Yet
Completed
Primary School
SD
Primary
School
SMP
Junior High
School
SMA
Senior High
School
SM Kejuruan
Vocational High
School
Diploma I/II
Diploma I/II
Diploma III/
Akademi
Diploma III/
Academy
Diploma IV/ S1
Diploma IV/
Undergraduate
S2/S3
Post
Graduate
(1) (2) (3) (4) (5) (6) (7) (8) (9) (10) (11) (12)
Kabupaten/Regency
Jembrana 124 312 720 569 719 59 31 35 191 18 2.778
Tabanan 285 714 1.801 1.460 1.455 215 101 98 341 35 6.505
Badung 734 2.013 3.914 5.550 10.846 1.343 1.127 760 1.787 159 28.233
Gianyar 320 693 1.732 2.018 2.243 249 164 163 458 49 8.089
Klungkung 85 191 257 362 457 46 36 25 148 4 1.611
Bangli 62 110 186 144 208 35 21 18 80 8 872
Karang Asem 123 230 277 249 337 33 46 40 134 15 1.484
Buleleng 145 351 514 575 2.322 104 63 79 339 33 4.525
Kota/Municipality
Denpasar 822 2.624 5.257 9.554 18.007 2.283 1.327 1.044 3.349 380 44.647
Jumlah/Total 2.700 7.238 14.658 20.481 36.594 4.367 2.916 2.262 6.827 701 98.744
Kabupaten/Kota
Regency/Municipality
Jumlah
Total
Laki-laki/Male
Pendidikan Tertinggi yang Ditamatkan/Educational Attainment
10.1
26
https:
//www.b
ps.go.id
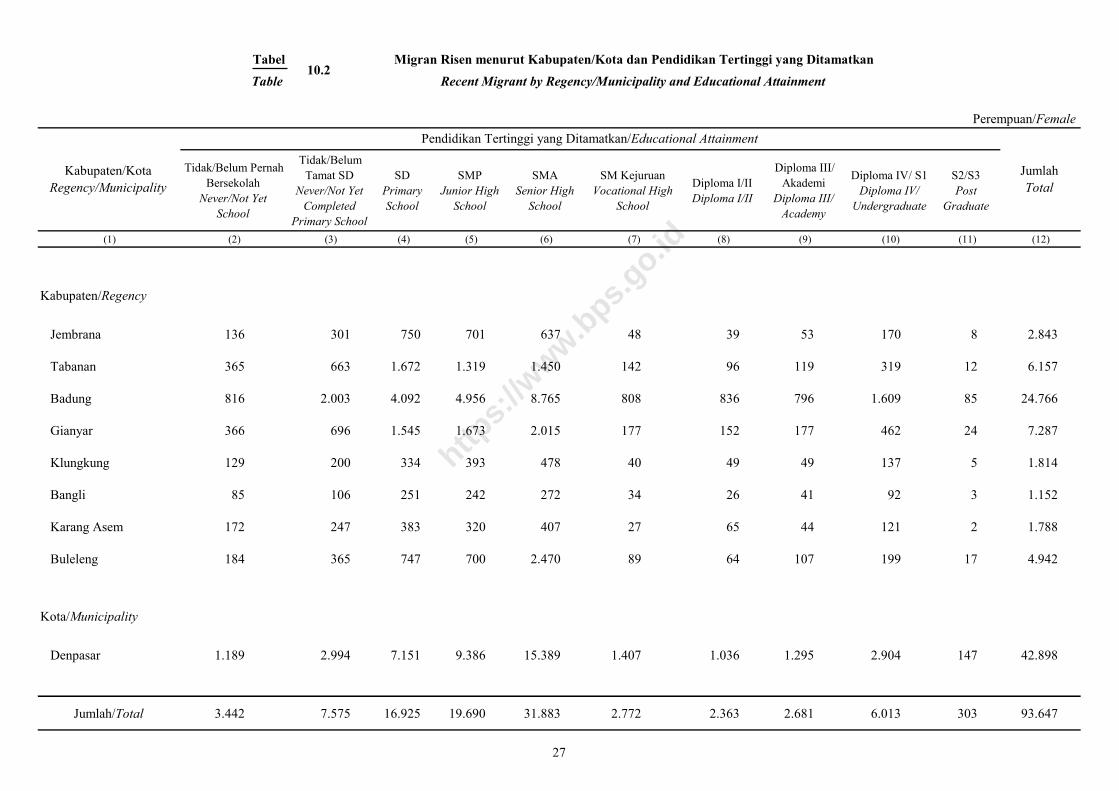
Tabel Migran Risen menurut Kabupaten/Kota dan Pendidikan Tertinggi yang Ditamatkan
Table Recent Migrant by Regency/Municipality and Educational Attainment
Tidak/Belum Pernah
Bersekolah
Never/Not Yet
School
Tidak/Belum
Tamat SD
Never/Not Yet
Completed
Primary School
SD
Primary
School
SMP
Junior High
School
SMA
Senior High
School
SM Kejuruan
Vocational High
School
Diploma I/II
Diploma I/II
Diploma III/
Akademi
Diploma III/
Academy
Diploma IV/ S1
Diploma IV/
Undergraduate
S2/S3
Post
Graduate
(1) (2) (3) (4) (5) (6) (7) (8) (9) (10) (11) (12)
Kabupaten/Regency
Jembrana 136 301 750 701 637 48 39 53 170 8 2.843
Tabanan 365 663 1.672 1.319 1.450 142 96 119 319 12 6.157
Badung 816 2.003 4.092 4.956 8.765 808 836 796 1.609 85 24.766
Gianyar 366 696 1.545 1.673 2.015 177 152 177 462 24 7.287
Klungkung 129 200 334 393 478 40 49 49 137 5 1.814
Bangli 85 106 251 242 272 34 26 41 92 3 1.152
Karang Asem 172 247 383 320 407 27 65 44 121 2 1.788
Buleleng 184 365 747 700 2.470 89 64 107 199 17 4.942
Kota/Municipality
Denpasar 1.189 2.994 7.151 9.386 15.389 1.407 1.036 1.295 2.904 147 42.898
Jumlah/Total 3.442 7.575 16.925 19.690 31.883 2.772 2.363 2.681 6.013 303 93.647
Perempuan/Female
Kabupaten/Kota
Regency/Municipality
Jumlah
Total
Pendidikan Tertinggi yang Ditamatkan/Educational Attainment
10.2
27
https:
//www.b
ps.go.id
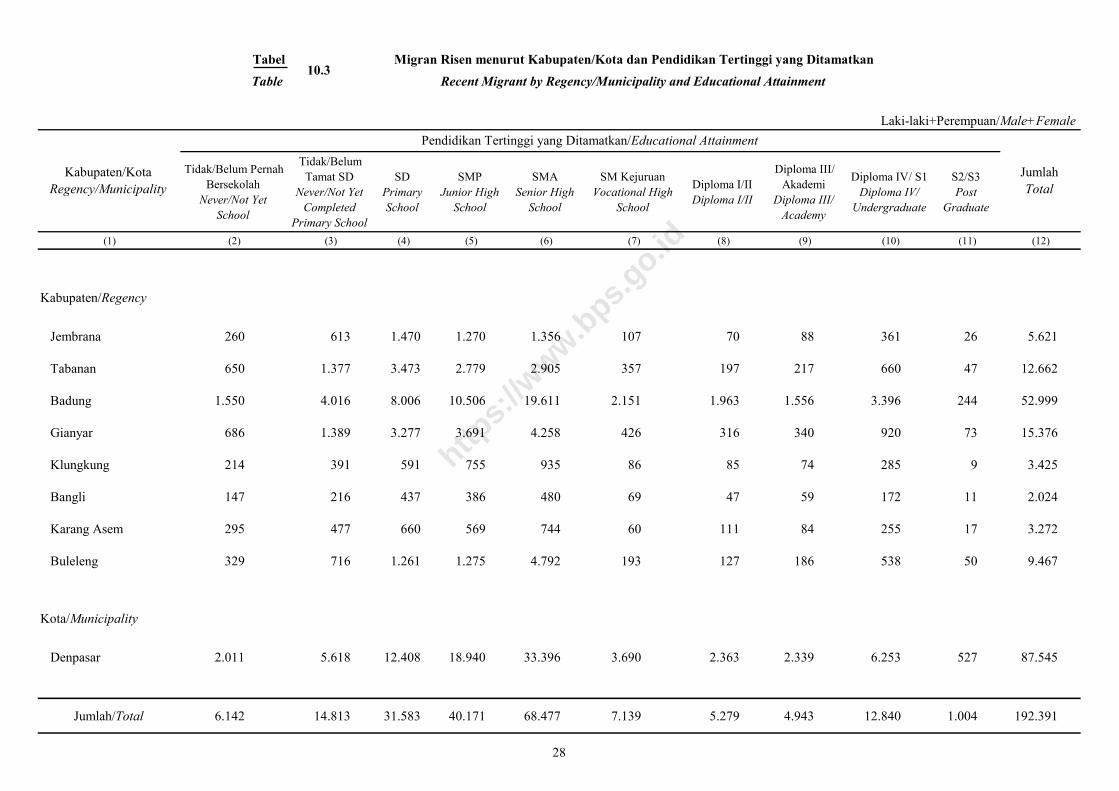
Tabel Migran Risen menurut Kabupaten/Kota dan Pendidikan Tertinggi yang Ditamatkan
Table Recent Migrant by Regency/Municipality and Educational Attainment
Tidak/Belum Pernah
Bersekolah
Never/Not Yet
School
Tidak/Belum
Tamat SD
Never/Not Yet
Completed
Primary School
SD
Primary
School
SMP
Junior High
School
SMA
Senior High
School
SM Kejuruan
Vocational High
School
Diploma I/II
Diploma I/II
Diploma III/
Akademi
Diploma III/
Academy
Diploma IV/ S1
Diploma IV/
Undergraduate
S2/S3
Post
Graduate
(1) (2) (3) (4) (5) (6) (7) (8) (9) (10) (11) (12)
Kabupaten/Regency
Jembrana 260 613 1.470 1.270 1.356 107 70 88 361 26 5.621
Tabanan 650 1.377 3.473 2.779 2.905 357 197 217 660 47 12.662
Badung 1.550 4.016 8.006 10.506 19.611 2.151 1.963 1.556 3.396 244 52.999
Gianyar 686 1.389 3.277 3.691 4.258 426 316 340 920 73 15.376
Klungkung 214 391 591 755 935 86 85 74 285 9 3.425
Bangli 147 216 437 386 480 69 47 59 172 11 2.024
Karang Asem 295 477 660 569 744 60 111 84 255 17 3.272
Buleleng 329 716 1.261 1.275 4.792 193 127 186 538 50 9.467
Kota/Municipality
Denpasar 2.011 5.618 12.408 18.940 33.396 3.690 2.363 2.339 6.253 527 87.545
Jumlah/Total 6.142 14.813 31.583 40.171 68.477 7.139 5.279 4.943 12.840 1.004 192.391
Kabupaten/Kota
Regency/Municipality
Jumlah
Total
Laki-laki+Perempuan/Male+Female
Pendidikan Tertinggi yang Ditamatkan/Educational Attainment
10.3
28
https:
//www.b
ps.go.id
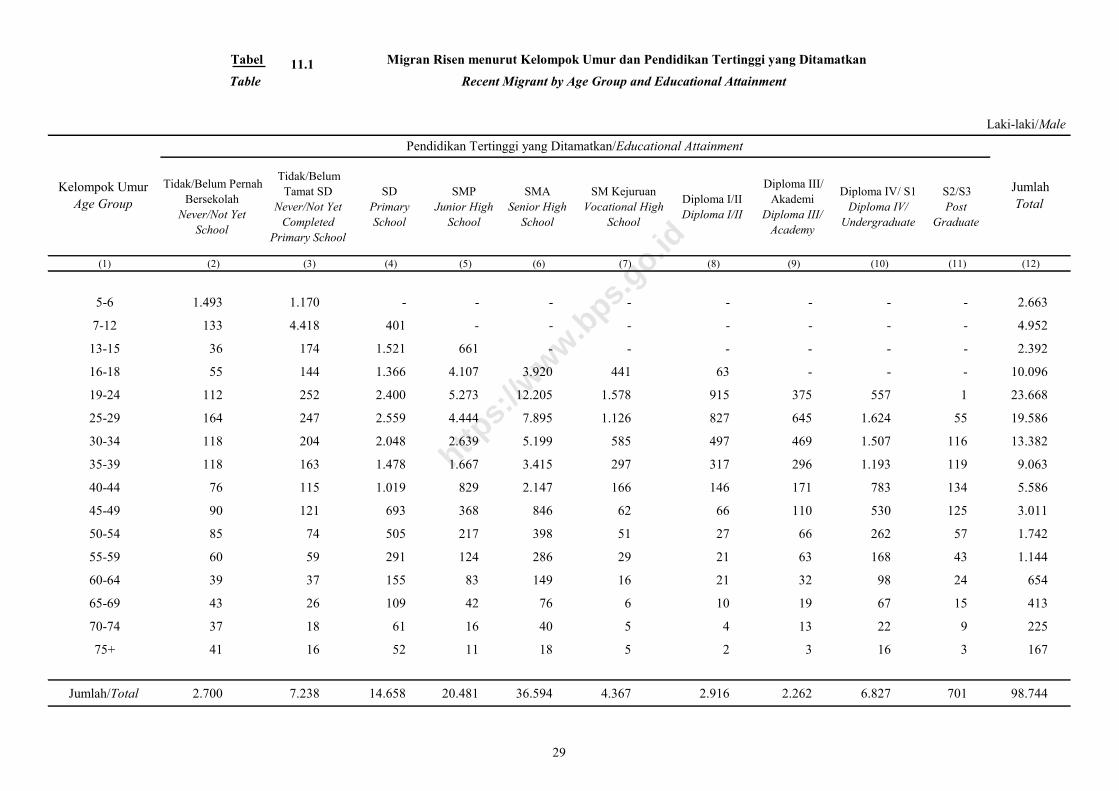
Tabel Migran Risen menurut Kelompok Umur dan Pendidikan Tertinggi yang Ditamatkan
Table Recent Migrant by Age Group and Educational Attainment
Tidak/Belum Pernah
Bersekolah
Never/Not Yet
School
Tidak/Belum
Tamat SD
Never/Not Yet
Completed
Primary School
SD
Primary
School
SMP
Junior High
School
SMA
Senior High
School
SM Kejuruan
Vocational High
School
Diploma I/II
Diploma I/II
Diploma III/
Akademi
Diploma III/
Academy
Diploma IV/ S1
Diploma IV/
Undergraduate
S2/S3
Post
Graduate
(1) (2) (3) (4) (5) (6) (7) (8) (9) (10) (11) (12)
5-6 1.493 1.170 - - - - - - - - 2.663
7-12 133 4.418 401 - - - - - - - 4.952
13-15 36 174 1.521 661 - - - - - - 2.392
16-18 55 144 1.366 4.107 3.920 441 63 - - - 10.096
19-24 112 252 2.400 5.273 12.205 1.578 915 375 557 1 23.668
25-29 164 247 2.559 4.444 7.895 1.126 827 645 1.624 55 19.586
30-34 118 204 2.048 2.639 5.199 585 497 469 1.507 116 13.382
35-39 118 163 1.478 1.667 3.415 297 317 296 1.193 119 9.063
40-44 76 115 1.019 829 2.147 166 146 171 783 134 5.586
45-49 90 121 693 368 846 62 66 110 530 125 3.011
50-54 85 74 505 217 398 51 27 66 262 57 1.742
55-59 60 59 291 124 286 29 21 63 168 43 1.144
60-64 39 37 155 83 149 16 21 32 98 24 654
65-69 43 26 109 42 76 6 10 19 67 15 413
70-74 37 18 61 16 40 5 4 13 22 9 225
75+ 41 16 52 11 18 5 2 3 16 3 167
Jumlah/Total 2.700 7.238 14.658 20.481 36.594 4.367 2.916 2.262 6.827 701 98.744
Kelompok Umur
Age Group
Jumlah
Total
Laki-laki/Male
Pendidikan Tertinggi yang Ditamatkan/Educational Attainment
11.1
29
https:
//www.b
ps.go.id
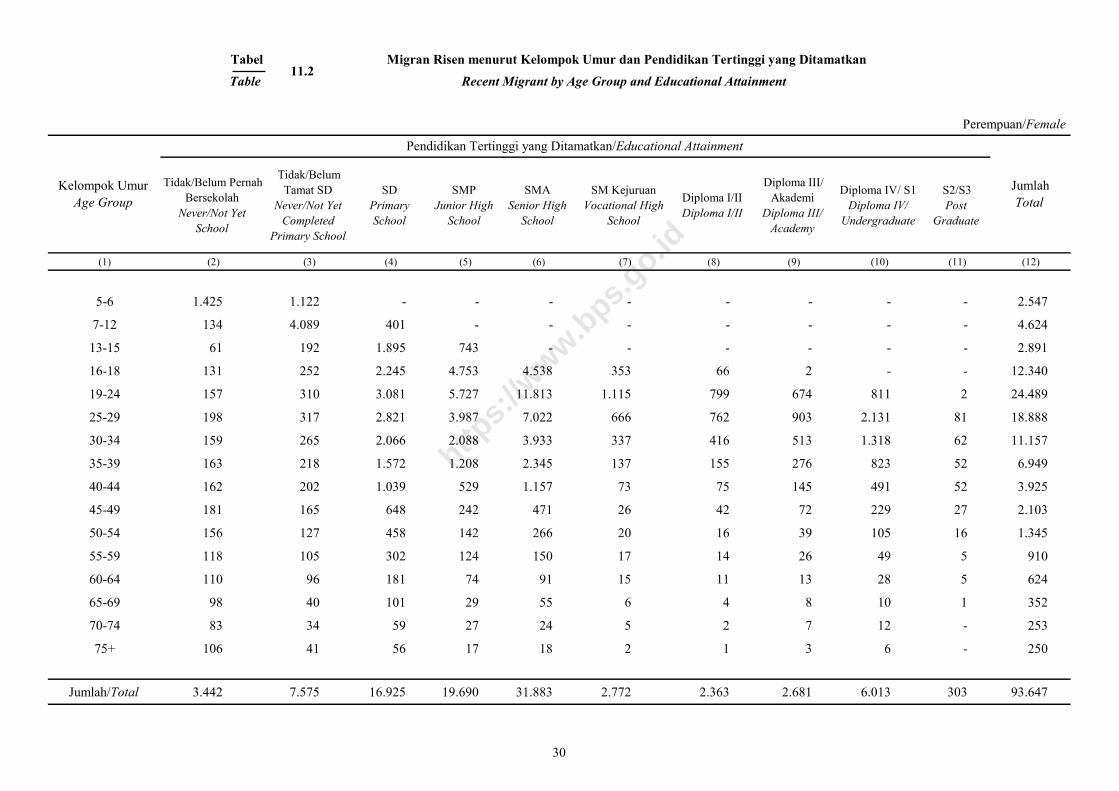
Tabel Migran Risen menurut Kelompok Umur dan Pendidikan Tertinggi yang Ditamatkan
Table Recent Migrant by Age Group and Educational Attainment
Tidak/Belum Pernah
Bersekolah
Never/Not Yet
School
Tidak/Belum
Tamat SD
Never/Not Yet
Completed
Primary School
SD
Primary
School
SMP
Junior High
School
SMA
Senior High
School
SM Kejuruan
Vocational High
School
Diploma I/II
Diploma I/II
Diploma III/
Akademi
Diploma III/
Academy
Diploma IV/ S1
Diploma IV/
Undergraduate
S2/S3
Post
Graduate
(1) (2) (3) (4) (5) (6) (7) (8) (9) (10) (11) (12)
5-6 1.425 1.122 - - - - - - - - 2.547
7-12 134 4.089 401 - - - - - - - 4.624
13-15 61 192 1.895 743 - - - - - - 2.891
16-18 131 252 2.245 4.753 4.538 353 66 2 - - 12.340
19-24 157 310 3.081 5.727 11.813 1.115 799 674 811 2 24.489
25-29 198 317 2.821 3.987 7.022 666 762 903 2.131 81 18.888
30-34 159 265 2.066 2.088 3.933 337 416 513 1.318 62 11.157
35-39 163 218 1.572 1.208 2.345 137 155 276 823 52 6.949
40-44 162 202 1.039 529 1.157 73 75 145 491 52 3.925
45-49 181 165 648 242 471 26 42 72 229 27 2.103
50-54 156 127 458 142 266 20 16 39 105 16 1.345
55-59 118 105 302 124 150 17 14 26 49 5 910
60-64 110 96 181 74 91 15 11 13 28 5 624
65-69 98 40 101 29 55 6 4 8 10 1 352
70-74 83 34 59 27 24 5 2 7 12 - 253
75+ 106 41 56 17 18 2 1 3 6 - 250
Jumlah/Total 3.442 7.575 16.925 19.690 31.883 2.772 2.363 2.681 6.013 303 93.647
Perempuan/Female
Kelompok Umur
Age Group
Jumlah
Total
Pendidikan Tertinggi yang Ditamatkan/Educational Attainment
11.2
30
https:
//www.b
ps.go.id
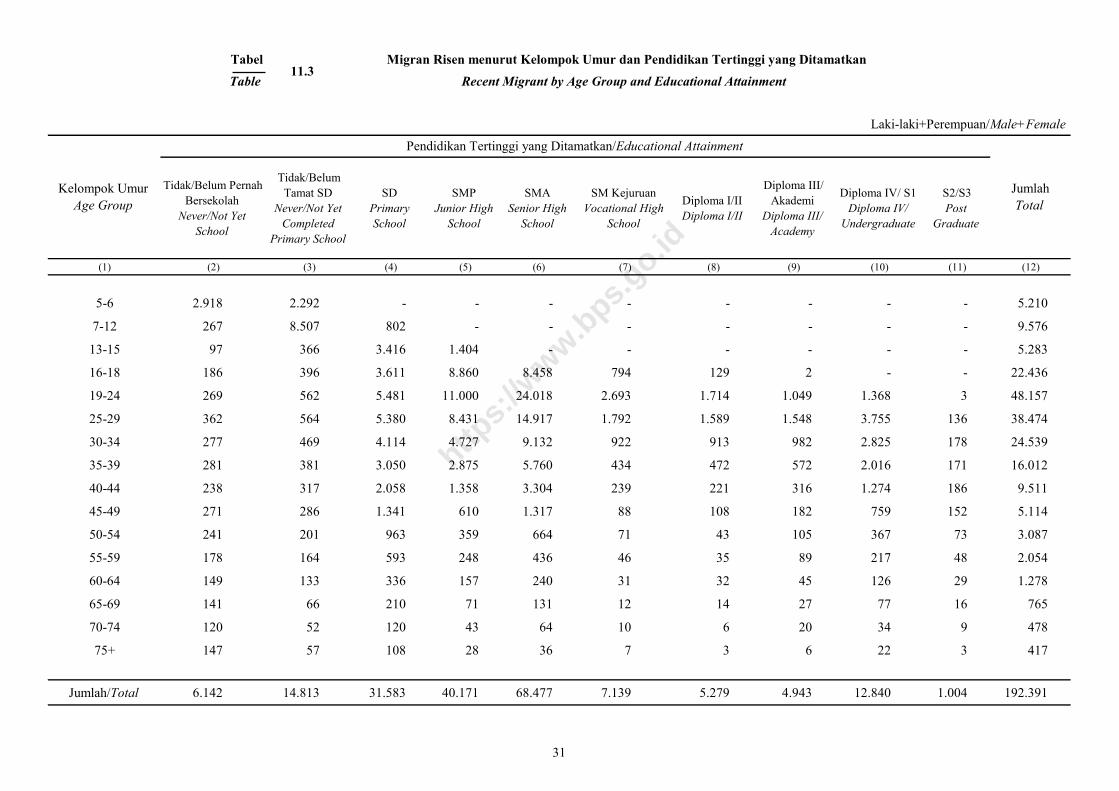
Tabel Migran Risen menurut Kelompok Umur dan Pendidikan Tertinggi yang Ditamatkan
Table Recent Migrant by Age Group and Educational Attainment
Tidak/Belum Pernah
Bersekolah
Never/Not Yet
School
Tidak/Belum
Tamat SD
Never/Not Yet
Completed
Primary School
SD
Primary
School
SMP
Junior High
School
SMA
Senior High
School
SM Kejuruan
Vocational High
School
Diploma I/II
Diploma I/II
Diploma III/
Akademi
Diploma III/
Academy
Diploma IV/ S1
Diploma IV/
Undergraduate
S2/S3
Post
Graduate
(1) (2) (3) (4) (5) (6) (7) (8) (9) (10) (11) (12)
5-6 2.918 2.292 - - - - - - - - 5.210
7-12 267 8.507 802 - - - - - - - 9.576
13-15 97 366 3.416 1.404 - - - - - - 5.283
16-18 186 396 3.611 8.860 8.458 794 129 2 - - 22.436
19-24 269 562 5.481 11.000 24.018 2.693 1.714 1.049 1.368 3 48.157
25-29 362 564 5.380 8.431 14.917 1.792 1.589 1.548 3.755 136 38.474
30-34 277 469 4.114 4.727 9.132 922 913 982 2.825 178 24.539
35-39 281 381 3.050 2.875 5.760 434 472 572 2.016 171 16.012
40-44 238 317 2.058 1.358 3.304 239 221 316 1.274 186 9.511
45-49 271 286 1.341 610 1.317 88 108 182 759 152 5.114
50-54 241 201 963 359 664 71 43 105 367 73 3.087
55-59 178 164 593 248 436 46 35 89 217 48 2.054
60-64 149 133 336 157 240 31 32 45 126 29 1.278
65-69 141 66 210 71 131 12 14 27 77 16 765
70-74 120 52 120 43 64 10 6 20 34 9 478
75+ 147 57 108 28 36 7 3 6 22 3 417
Jumlah/Total 6.142 14.813 31.583 40.171 68.477 7.139 5.279 4.943 12.840 1.004 192.391
Kelompok Umur
Age Group
Jumlah
Total
Laki-laki+Perempuan/Male+Female
Pendidikan Tertinggi yang Ditamatkan/Educational Attainment
11.3
31
https:
//www.b
ps.go.id
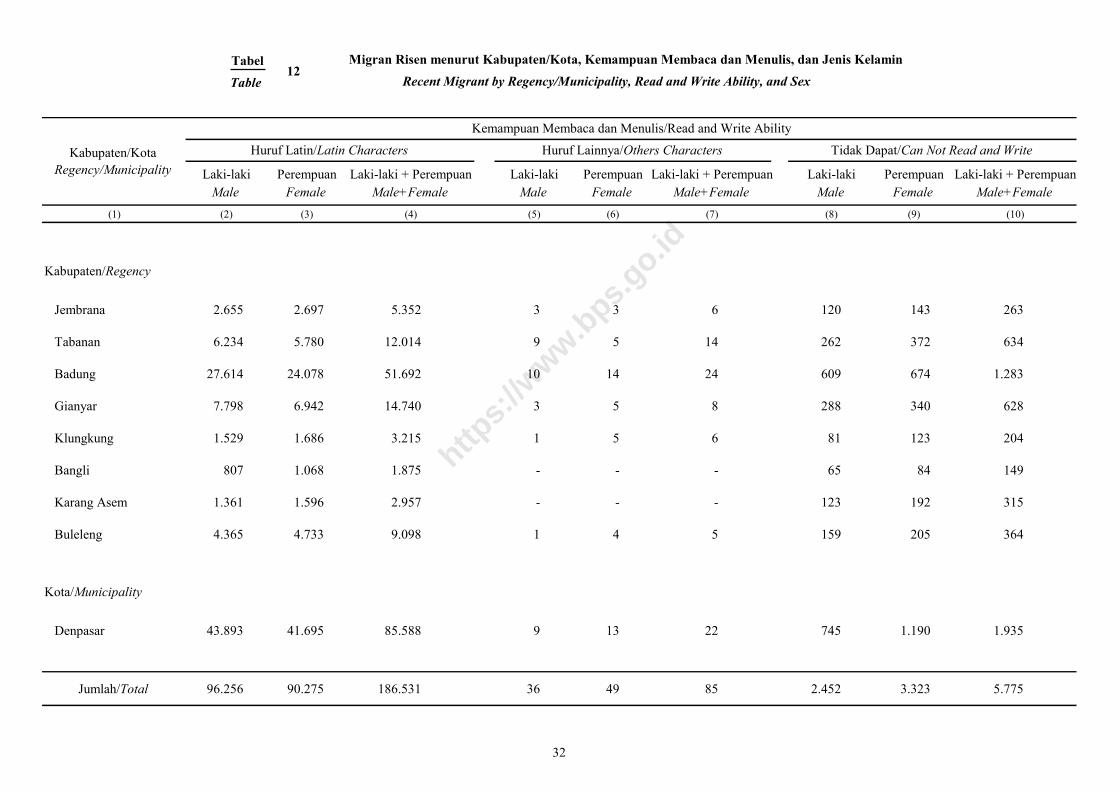
Tabel Migran Risen menurut Kabupaten/Kota, Kemampuan Membaca dan Menulis, dan Jenis Kelamin
Table Recent Migrant by Regency/Municipality, Read and Write Ability, and Sex
Laki-laki Perempuan Laki-laki + Perempuan Laki-laki Perempuan Laki-laki + Perempuan Laki-laki Perempuan Laki-laki + Perempuan
Male Female Male+Female Male Female Male+Female Male Female Male+Female
(1) (2) (3) (4) (5) (6) (7) (8) (9) (10)
Kabupaten/Regency
Jembrana 2.655 2.697 5.352 3 3 6 120 143 263
Tabanan 6.234 5.780 12.014 9 5 14 262 372 634
Badung 27.614 24.078 51.692 10 14 24 609 674 1.283
Gianyar 7.798 6.942 14.740 3 5 8 288 340 628
Klungkung 1.529 1.686 3.215 1 5 6 81 123 204
Bangli 807 1.068 1.875 - - - 65 84 149
Karang Asem 1.361 1.596 2.957 - - - 123 192 315
Buleleng 4.365 4.733 9.098 1 4 5 159 205 364
Kota/Municipality
Denpasar 43.893 41.695 85.588 9 13 22 745 1.190 1.935
Jumlah/Total 96.256 90.275 186.531 36 49 85 2.452 3.323 5.775
Kemampuan Membaca dan Menulis/Read and Write Ability
Kabupaten/Kota
Regency/Municipality
Tidak Dapat/Can Not Read and WriteHuruf Lainnya/Others CharactersHuruf Latin/Latin Characters
12
32
https:
//www.b
ps.go.id
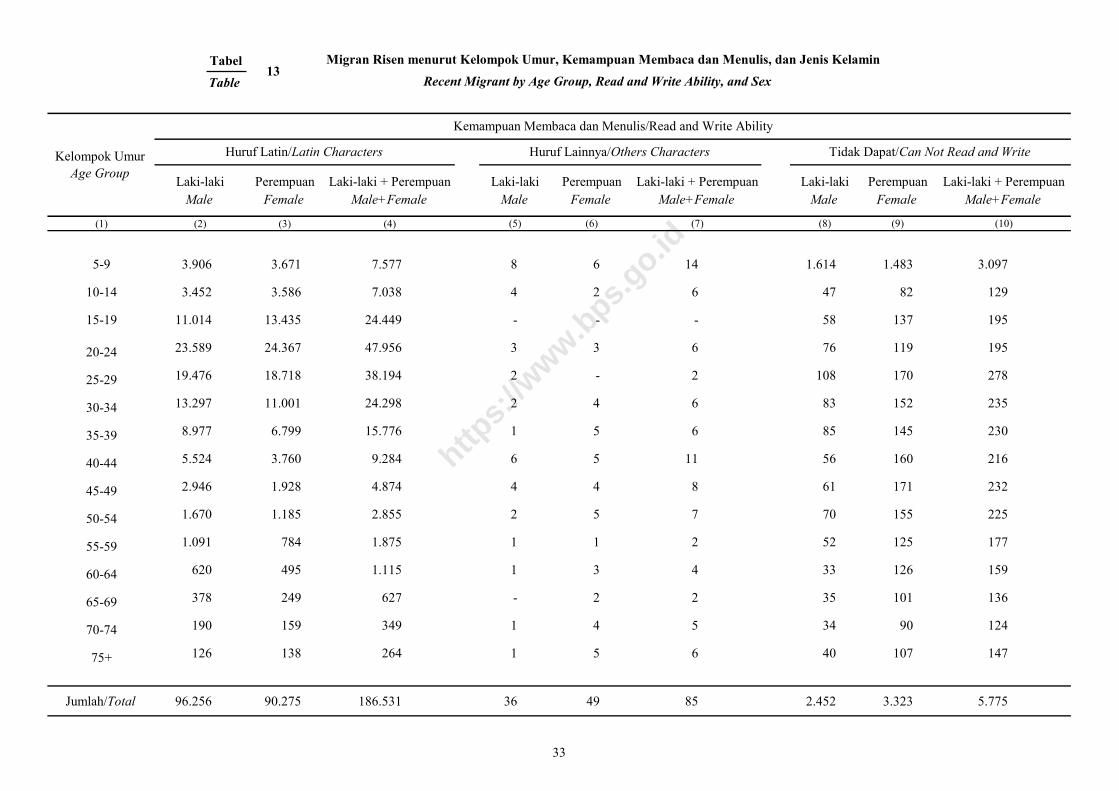
Tabel Migran Risen menurut Kelompok Umur, Kemampuan Membaca dan Menulis, dan Jenis Kelamin
Table Recent Migrant by Age Group, Read and Write Ability, and Sex
Laki-laki Perempuan Laki-laki + Perempuan Laki-laki Perempuan Laki-laki + Perempuan Laki-laki Perempuan Laki-laki + Perempuan
Male Female Male+Female Male Female Male+Female Male Female Male+Female
(1) (2) (3) (4) (5) (6) (7) (8) (9) (10)
5-9 3.906 3.671 7.577 8 6 14 1.614 1.483 3.097
10-14 3.452 3.586 7.038 4 2 6 47 82 129
15-19 11.014 13.435 24.449 - - - 58 137 195
20-24 23.589 24.367 47.956 3 3 6 76 119 195
25-29 19.476 18.718 38.194 2 - 2 108 170 278
30-34 13.297 11.001 24.298 2 4 6 83 152 235
35-39 8.977 6.799 15.776 1 5 6 85 145 230
40-44 5.524 3.760 9.284 6 5 11 56 160 216
45-49 2.946 1.928 4.874 4 4 8 61 171 232
50-54 1.670 1.185 2.855 2 5 7 70 155 225
55-59 1.091 784 1.875 1 1 2 52 125 177
60-64 620 495 1.115 1 3 4 33 126 159
65-69 378 249 627 - 2 2 35 101 136
70-74 190 159 349 1 4 5 34 90 124
75+ 126 138 264 1 5 6 40 107 147
Jumlah/Total 96.256 90.275 186.531 36 49 85 2.452 3.323 5.775
Kelompok Umur
Age Group
Kemampuan Membaca dan Menulis/Read and Write Ability
Huruf Latin/Latin Characters Huruf Lainnya/Others Characters Tidak Dapat/Can Not Read and Write
13
33
https:
//www.b
ps.go.id
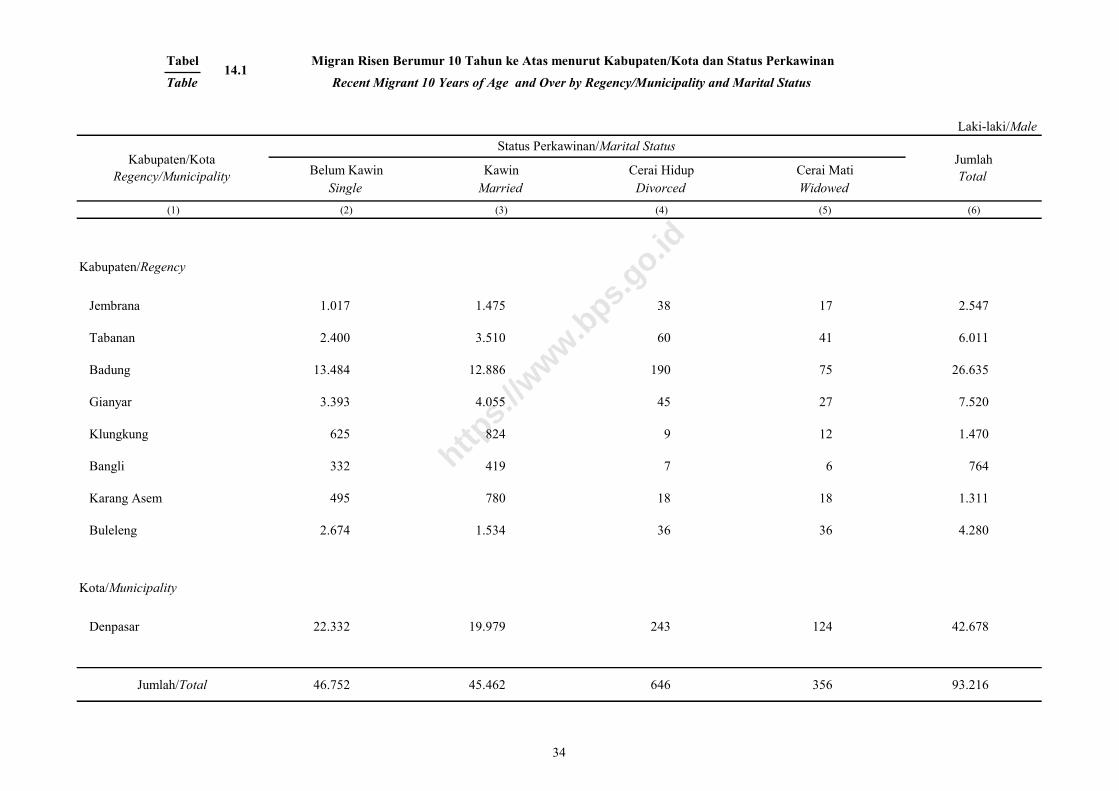
Tabel Migran Risen Berumur 10 Tahun ke Atas menurut Kabupaten/Kota dan Status Perkawinan
Table Recent Migrant 10 Years of Age and Over by Regency/Municipality and Marital Status
Belum Kawin Kawin Cerai Hidup Cerai Mati
Single Married Divorced Widowed
(1) (2) (3) (4) (5) (6)
Kabupaten/Regency
Jembrana 1.017 1.475 38 17 2.547
Tabanan 2.400 3.510 60 41 6.011
Badung 13.484 12.886 190 75 26.635
Gianyar 3.393 4.055 45 27 7.520
Klungkung 625 824 9 12 1.470
Bangli 332 419 7 6 764
Karang Asem 495 780 18 18 1.311
Buleleng 2.674 1.534 36 36 4.280
Kota/Municipality
Denpasar 22.332 19.979 243 124 42.678
Jumlah/Total 46.752 45.462 646 356 93.216
Status Perkawinan/Marital StatusKabupaten/Kota
Regency/Municipality
Jumlah
Total
Laki-laki/Male
14.1
34
https:
//www.b
ps.go.id
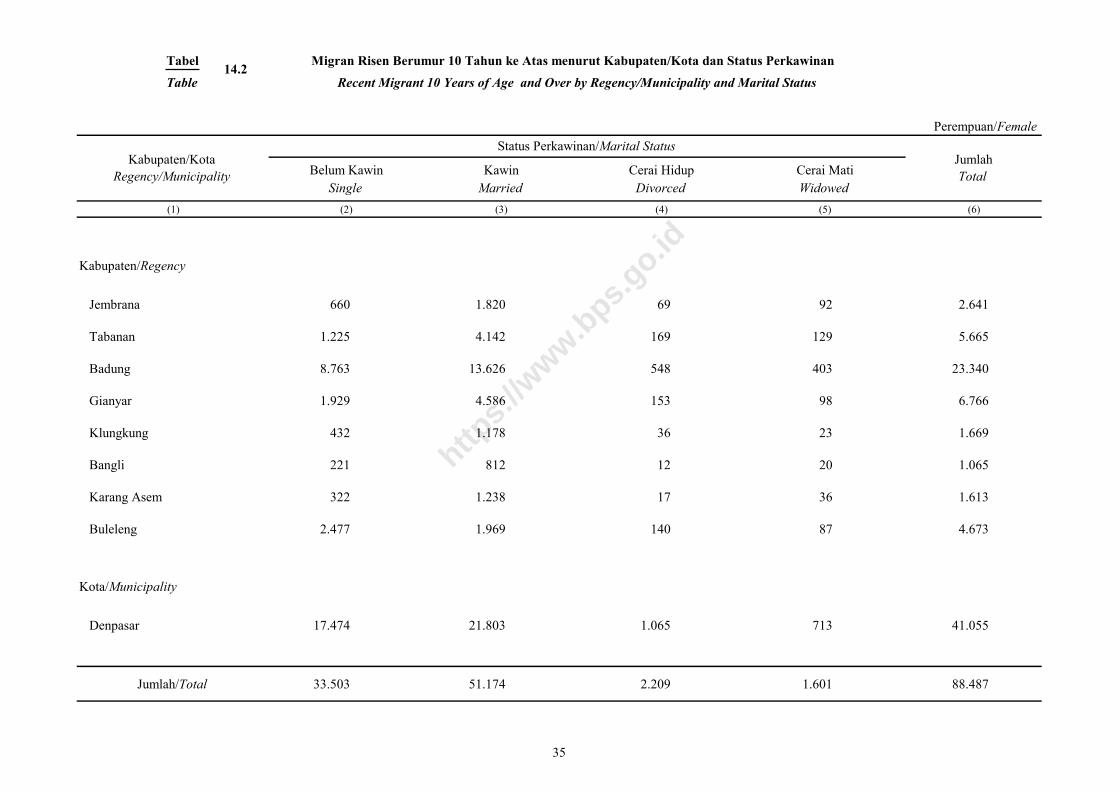
Tabel Migran Risen Berumur 10 Tahun ke Atas menurut Kabupaten/Kota dan Status Perkawinan
Table Recent Migrant 10 Years of Age and Over by Regency/Municipality and Marital Status
Belum Kawin Kawin Cerai Hidup Cerai Mati
Single Married Divorced Widowed
(1) (2) (3) (4) (5) (6)
Kabupaten/Regency
Jembrana 660 1.820 69 92 2.641
Tabanan 1.225 4.142 169 129 5.665
Badung 8.763 13.626 548 403 23.340
Gianyar 1.929 4.586 153 98 6.766
Klungkung 432 1.178 36 23 1.669
Bangli 221 812 12 20 1.065
Karang Asem 322 1.238 17 36 1.613
Buleleng 2.477 1.969 140 87 4.673
Kota/Municipality
Denpasar 17.474 21.803 1.065 713 41.055
Jumlah/Total 33.503 51.174 2.209 1.601 88.487
Perempuan/Female
Kabupaten/Kota
Regency/Municipality
Status Perkawinan/Marital StatusJumlah
Total
14.2
35
https:
//www.b
ps.go.id
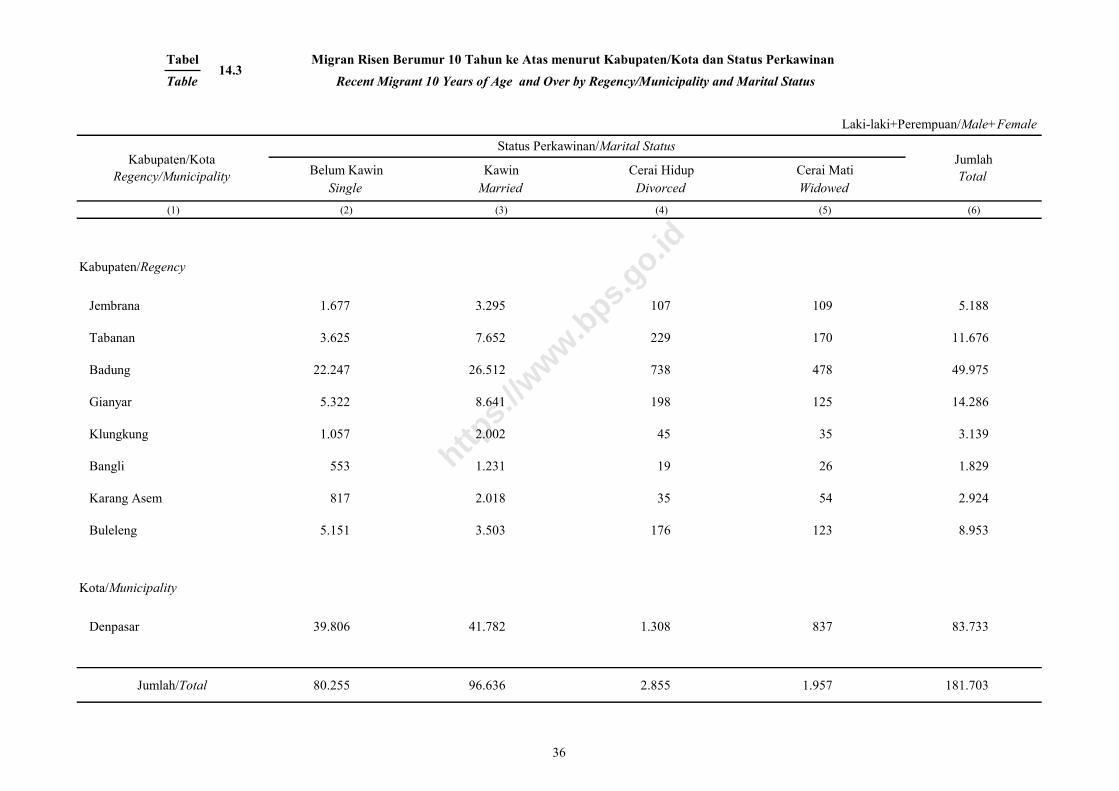
Tabel Migran Risen Berumur 10 Tahun ke Atas menurut Kabupaten/Kota dan Status Perkawinan
Table Recent Migrant 10 Years of Age and Over by Regency/Municipality and Marital Status
Belum Kawin Kawin Cerai Hidup Cerai Mati
Single Married Divorced Widowed
(1) (2) (3) (4) (5) (6)
Kabupaten/Regency
Jembrana 1.677 3.295 107 109 5.188
Tabanan 3.625 7.652 229 170 11.676
Badung 22.247 26.512 738 478 49.975
Gianyar 5.322 8.641 198 125 14.286
Klungkung 1.057 2.002 45 35 3.139
Bangli 553 1.231 19 26 1.829
Karang Asem 817 2.018 35 54 2.924
Buleleng 5.151 3.503 176 123 8.953
Kota/Municipality
Denpasar 39.806 41.782 1.308 837 83.733
Jumlah/Total 80.255 96.636 2.855 1.957 181.703
Laki-laki+Perempuan/Male+Female
Kabupaten/Kota
Regency/Municipality
Status Perkawinan/Marital StatusJumlah
Total
14.3
36
https:
//www.b
ps.go.id
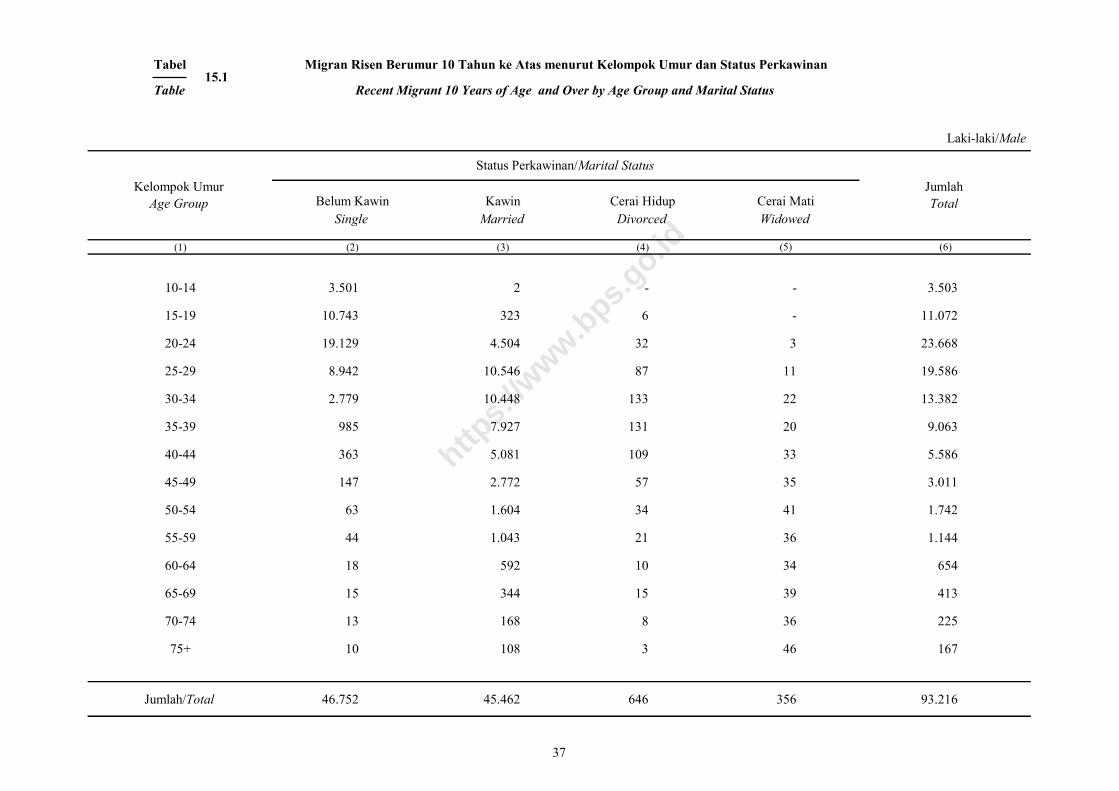
Tabel
Table
Laki-laki/Male
Belum Kawin Kawin Cerai Hidup Cerai Mati
Single Married Divorced Widowed
(1) (2) (3) (4) (5) (6)
10-14 3.501 2 - - 3.503
15-19 10.743 323 6 - 11.072
20-24 19.129 4.504 32 3 23.668
25-29 8.942 10.546 87 11 19.586
30-34 2.779 10.448 133 22 13.382
35-39 985 7.927 131 20 9.063
40-44 363 5.081 109 33 5.586
45-49 147 2.772 57 35 3.011
50-54 63 1.604 34 41 1.742
55-59 44 1.043 21 36 1.144
60-64 18 592 10 34 654
65-69 15 344 15 39 413
70-74 13 168 8 36 225
75+ 10 108 3 46 167
Jumlah/Total 46.752 45.462 646 356 93.216
Migran Risen Berumur 10 Tahun ke Atas menurut Kelompok Umur dan Status Perkawinan
Recent Migrant 10 Years of Age and Over by Age Group and Marital Status
Status Perkawinan/Marital Status
Kelompok Umur
Age Group
Jumlah
Total
15.1
37
https:
//www.b
ps.go.id
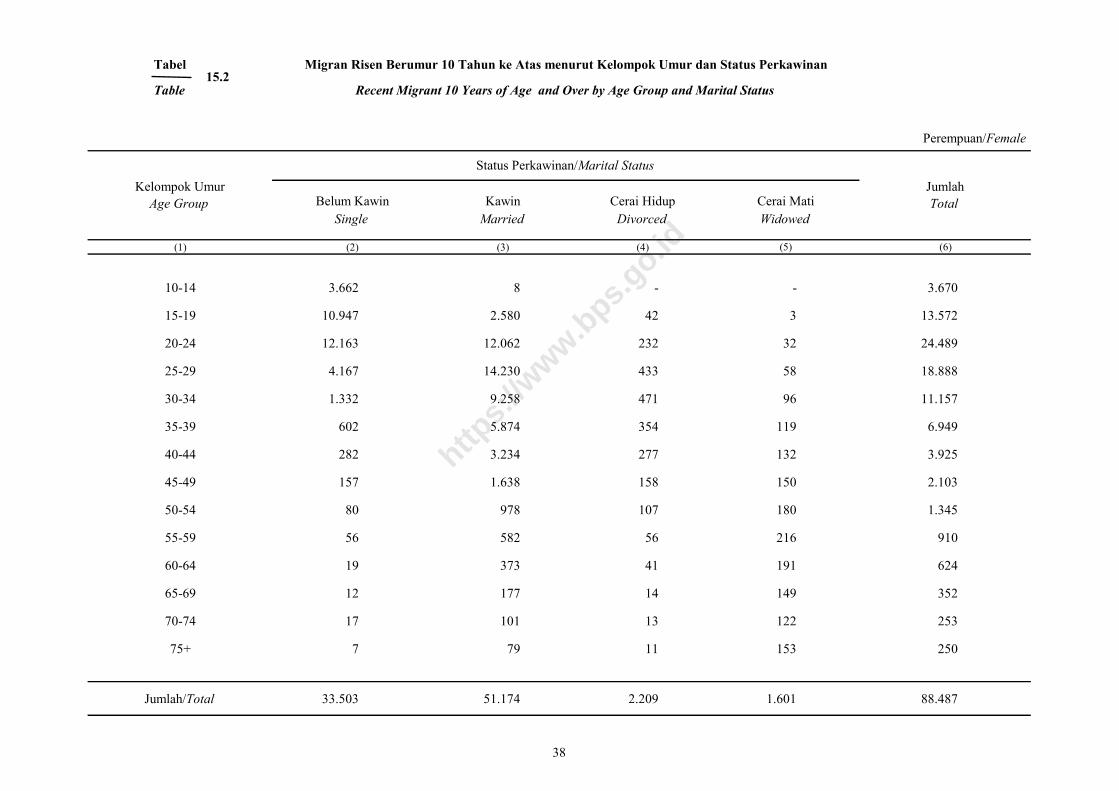
Tabel
Table
Perempuan/Female
Belum Kawin Kawin Cerai Hidup Cerai Mati
Single Married Divorced Widowed
(1) (2) (3) (4) (5) (6)
10-14 3.662 8 - - 3.670
15-19 10.947 2.580 42 3 13.572
20-24 12.163 12.062 232 32 24.489
25-29 4.167 14.230 433 58 18.888
30-34 1.332 9.258 471 96 11.157
35-39 602 5.874 354 119 6.949
40-44 282 3.234 277 132 3.925
45-49 157 1.638 158 150 2.103
50-54 80 978 107 180 1.345
55-59 56 582 56 216 910
60-64 19 373 41 191 624
65-69 12 177 14 149 352
70-74 17 101 13 122 253
75+ 7 79 11 153 250
Jumlah/Total 33.503 51.174 2.209 1.601 88.487
Migran Risen Berumur 10 Tahun ke Atas menurut Kelompok Umur dan Status Perkawinan
Recent Migrant 10 Years of Age and Over by Age Group and Marital Status
Kelompok Umur
Age Group
Status Perkawinan/Marital Status
Jumlah
Total
15.2
38
https:
//www.b
ps.go.id
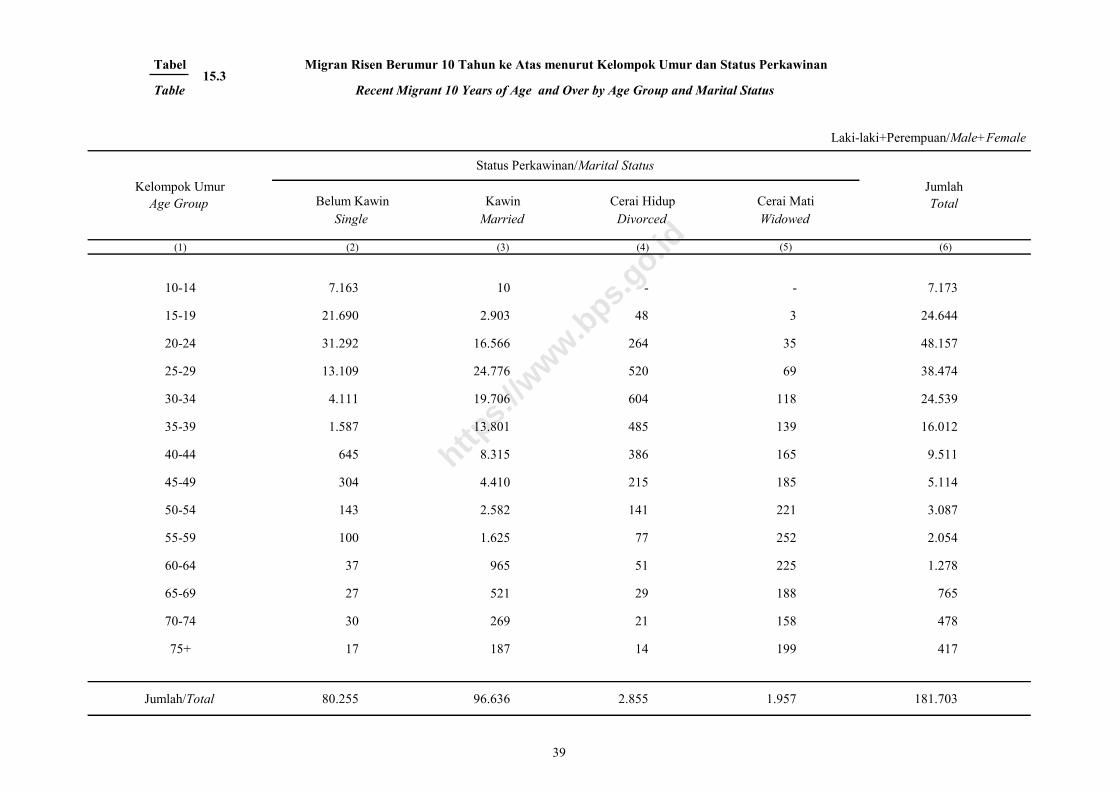
Tabel
Table
Belum Kawin Kawin Cerai Hidup Cerai Mati
Single Married Divorced Widowed
(1) (2) (3) (4) (5) (6)
10-14 7.163 10 - - 7.173
15-19 21.690 2.903 48 3 24.644
20-24 31.292 16.566 264 35 48.157
25-29 13.109 24.776 520 69 38.474
30-34 4.111 19.706 604 118 24.539
35-39 1.587 13.801 485 139 16.012
40-44 645 8.315 386 165 9.511
45-49 304 4.410 215 185 5.114
50-54 143 2.582 141 221 3.087
55-59 100 1.625 77 252 2.054
60-64 37 965 51 225 1.278
65-69 27 521 29 188 765
70-74 30 269 21 158 478
75+ 17 187 14 199 417
Jumlah/Total 80.255 96.636 2.855 1.957 181.703
Migran Risen Berumur 10 Tahun ke Atas menurut Kelompok Umur dan Status Perkawinan
Kelompok Umur
Age Group
Status Perkawinan/Marital Status
Jumlah
Total
Laki-laki+Perempuan/Male+Female
Recent Migrant 10 Years of Age and Over by Age Group and Marital Status15.3
39
https:
//www.b
ps.go.id
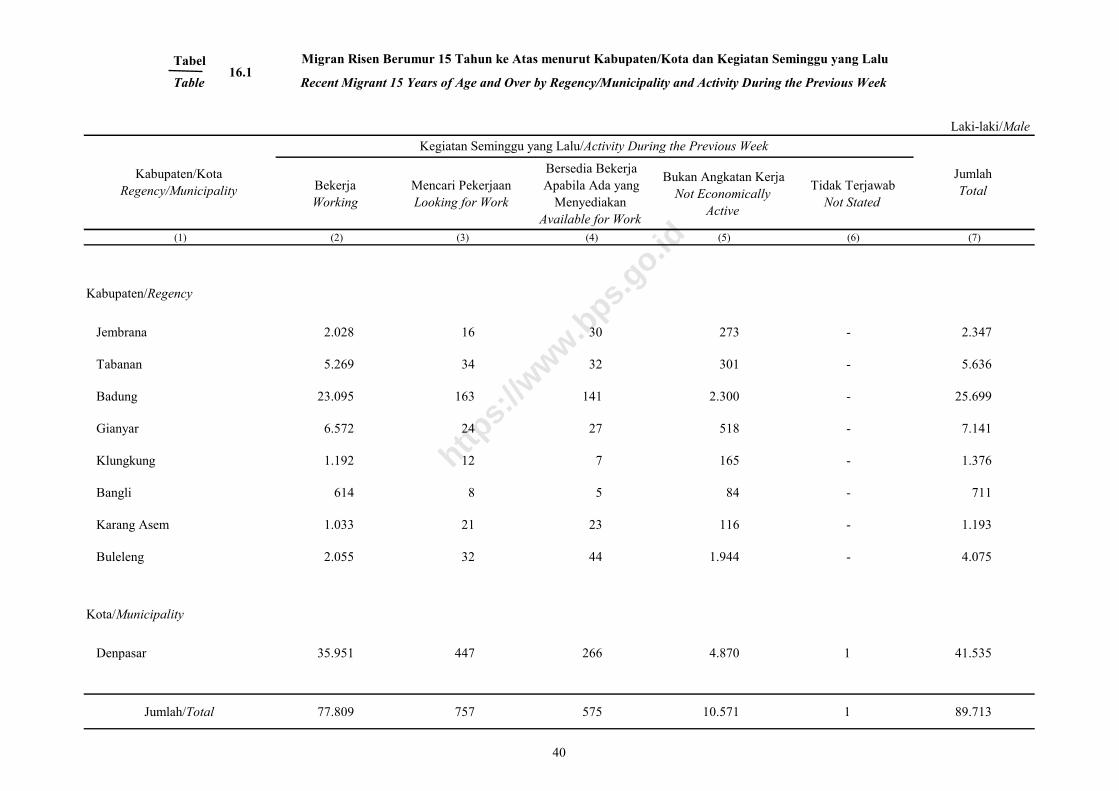
Tabel
Table
Bekerja
Working
Mencari Pekerjaan
Looking for Work
Bersedia Bekerja
Apabila Ada yang
Menyediakan
Available for Work
Bukan Angkatan Kerja
Not Economically
Active
Tidak Terjawab
Not Stated
(1) (2) (3) (4) (5) (6) (7)
Kabupaten/Regency
Jembrana 2.028 16 30 273 - 2.347
Tabanan 5.269 34 32 301 - 5.636
Badung 23.095 163 141 2.300 - 25.699
Gianyar 6.572 24 27 518 - 7.141
Klungkung 1.192 12 7 165 - 1.376
Bangli 614 8 5 84 - 711
Karang Asem 1.033 21 23 116 - 1.193
Buleleng 2.055 32 44 1.944 - 4.075
Kota/Municipality
Denpasar 35.951 447 266 4.870 1 41.535
Jumlah/Total 77.809 757 575 10.571 1 89.713
Migran Risen Berumur 15 Tahun ke Atas menurut Kabupaten/Kota dan Kegiatan Seminggu yang Lalu
Recent Migrant 15 Years of Age and Over by Regency/Municipality and Activity During the Previous Week
Kegiatan Seminggu yang Lalu/Activity During the Previous Week
Kabupaten/Kota
Regency/Municipality
Jumlah
Total
Laki-laki/Male
16.1
40
https:
//www.b
ps.go.id
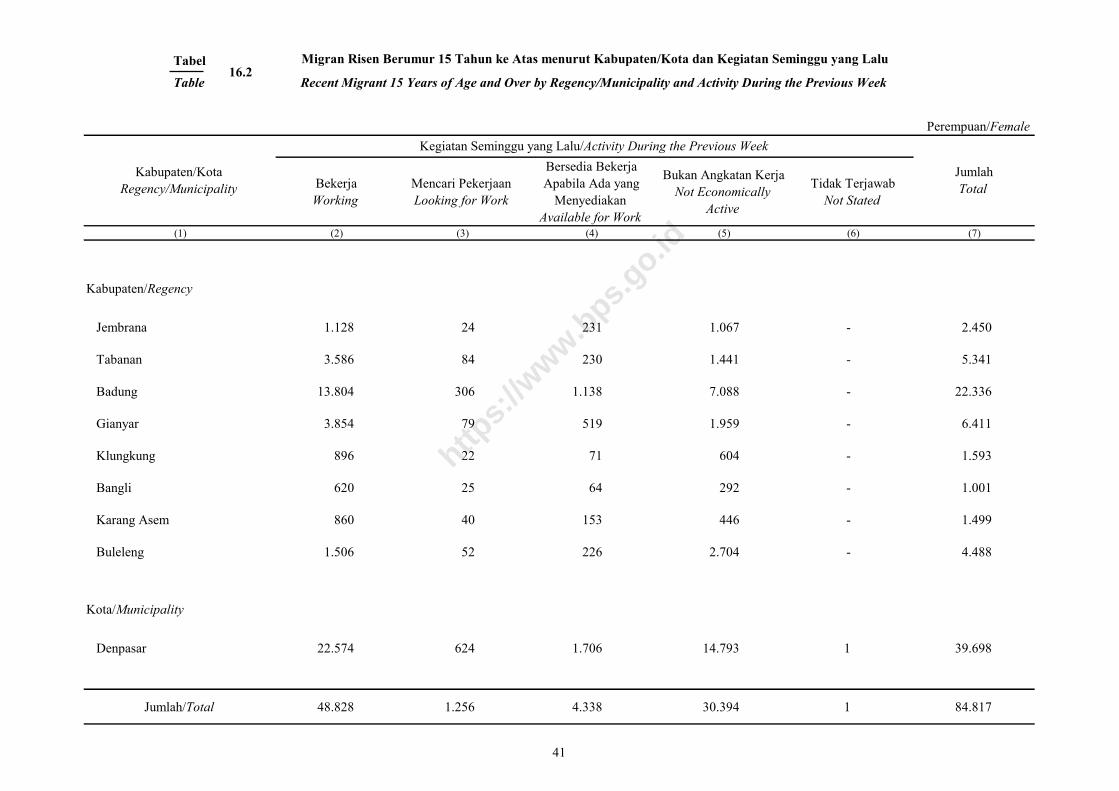
Tabel
Table
Bekerja
Working
Mencari Pekerjaan
Looking for Work
Bersedia Bekerja
Apabila Ada yang
Menyediakan
Available for Work
Bukan Angkatan Kerja
Not Economically
Active
Tidak Terjawab
Not Stated
(1) (2) (3) (4) (5) (6) (7)
Kabupaten/Regency
Jembrana 1.128 24 231 1.067 - 2.450
Tabanan 3.586 84 230 1.441 - 5.341
Badung 13.804 306 1.138 7.088 - 22.336
Gianyar 3.854 79 519 1.959 - 6.411
Klungkung 896 22 71 604 - 1.593
Bangli 620 25 64 292 - 1.001
Karang Asem 860 40 153 446 - 1.499
Buleleng 1.506 52 226 2.704 - 4.488
Kota/Municipality
Denpasar 22.574 624 1.706 14.793 1 39.698
Jumlah/Total 48.828 1.256 4.338 30.394 1 84.817
Migran Risen Berumur 15 Tahun ke Atas menurut Kabupaten/Kota dan Kegiatan Seminggu yang Lalu
Recent Migrant 15 Years of Age and Over by Regency/Municipality and Activity During the Previous Week
Perempuan/Female
Kabupaten/Kota
Regency/Municipality
Kegiatan Seminggu yang Lalu/Activity During the Previous Week
Jumlah
Total
16.216.2
41
https:
//www.b
ps.go.id
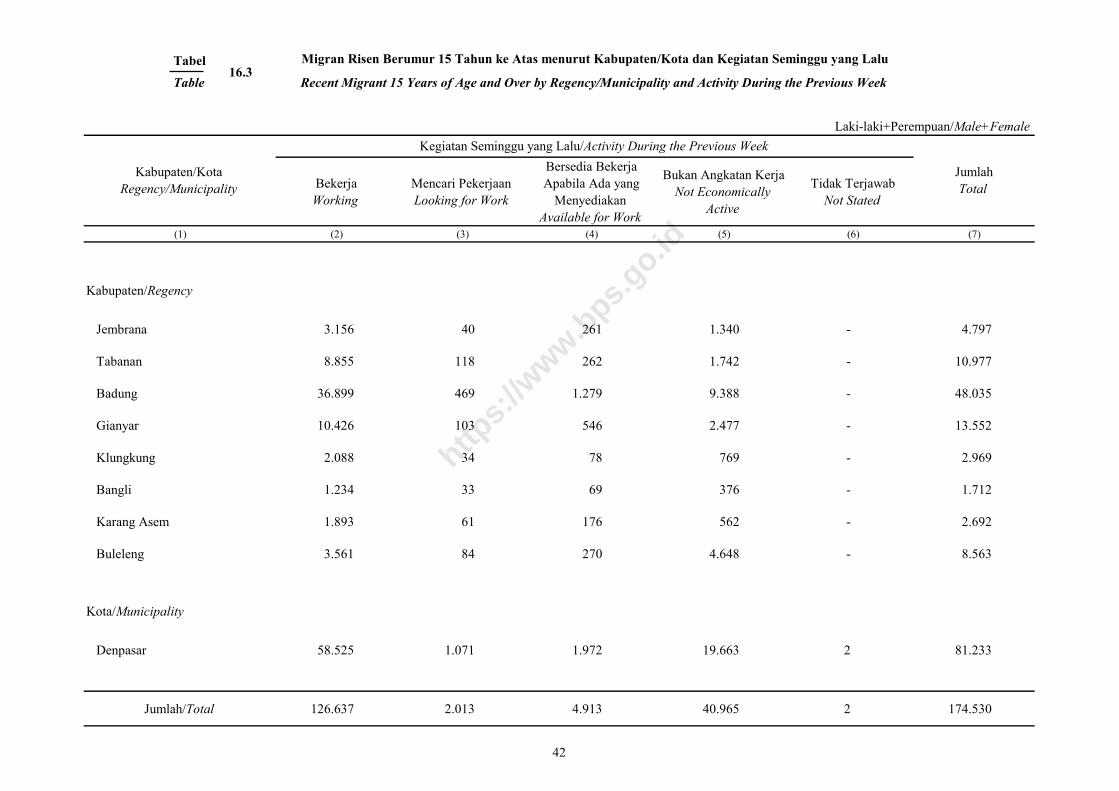
Tabel
Table
Bekerja
Working
Mencari Pekerjaan
Looking for Work
Bersedia Bekerja
Apabila Ada yang
Menyediakan
Available for Work
Bukan Angkatan Kerja
Not Economically
Active
Tidak Terjawab
Not Stated
(1) (2) (3) (4) (5) (6) (7)
Kabupaten/Regency
Jembrana 3.156 40 261 1.340 - 4.797
Tabanan 8.855 118 262 1.742 - 10.977
Badung 36.899 469 1.279 9.388 - 48.035
Gianyar 10.426 103 546 2.477 - 13.552
Klungkung 2.088 34 78 769 - 2.969
Bangli 1.234 33 69 376 - 1.712
Karang Asem 1.893 61 176 562 - 2.692
Buleleng 3.561 84 270 4.648 - 8.563
Kota/Municipality
Denpasar 58.525 1.071 1.972 19.663 2 81.233
Jumlah/Total 126.637 2.013 4.913 40.965 2 174.530
Migran Risen Berumur 15 Tahun ke Atas menurut Kabupaten/Kota dan Kegiatan Seminggu yang Lalu
Kabupaten/Kota
Regency/Municipality
Kegiatan Seminggu yang Lalu/Activity During the Previous Week
Jumlah
Total
Laki-laki+Perempuan/Male+Female
Recent Migrant 15 Years of Age and Over by Regency/Municipality and Activity During the Previous Week16.316.3
42
https:
//www.b
ps.go.id

Tabel
Tabel
Bekerja
Working
Mencari Pekerjaan
Looking for Work
Bersedia bekerja apabila ada
yang menyediakan
Available for Work
Bukan Angkatan Kerja
Not Economically Active
Tidak Terjawab
Not Stated
(1) (2) (3) (4) (5) (6) (7)
15 - 19 6.303 172 109 4.488 - 11.072
20 - 24 19.269 292 181 3.926 - 23.668
25 - 29 18.789 143 128 526 - 19.586
30 - 34 13.069 65 56 192 - 13.382
35 - 39 8.863 37 42 121 - 9.063
40 - 44 5.412 14 26 134 - 5.586
45 - 49 2.887 10 11 103 - 3.011
50 - 54 1.599 8 8 127 - 1.742
55 - 59 887 9 11 237 - 1.144
60 - 64 394 3 3 254 - 654
65 - 69 202 2 - 209 - 413
70 - 74 84 2 - 139 - 225
75+ 51 - - 115 1 167
Jumlah/Total 77.809 757 575 10.571 1 89.713
Migran Risen Berumur 15 Tahun ke Atas menurut Kelompok Umur dan Kegiatan Seminggu yang Lalu
Recent Migrant 15 Years of Age and Over by Age Group and Activity During the Previous Week
Laki-laki/Male
Kelompok Umur
Age Group
Kegiatan Seminggu yang Lalu/Activity During the Previous Week
Jumlah
Total
17.1
43
https:
//www.b
ps.go.id
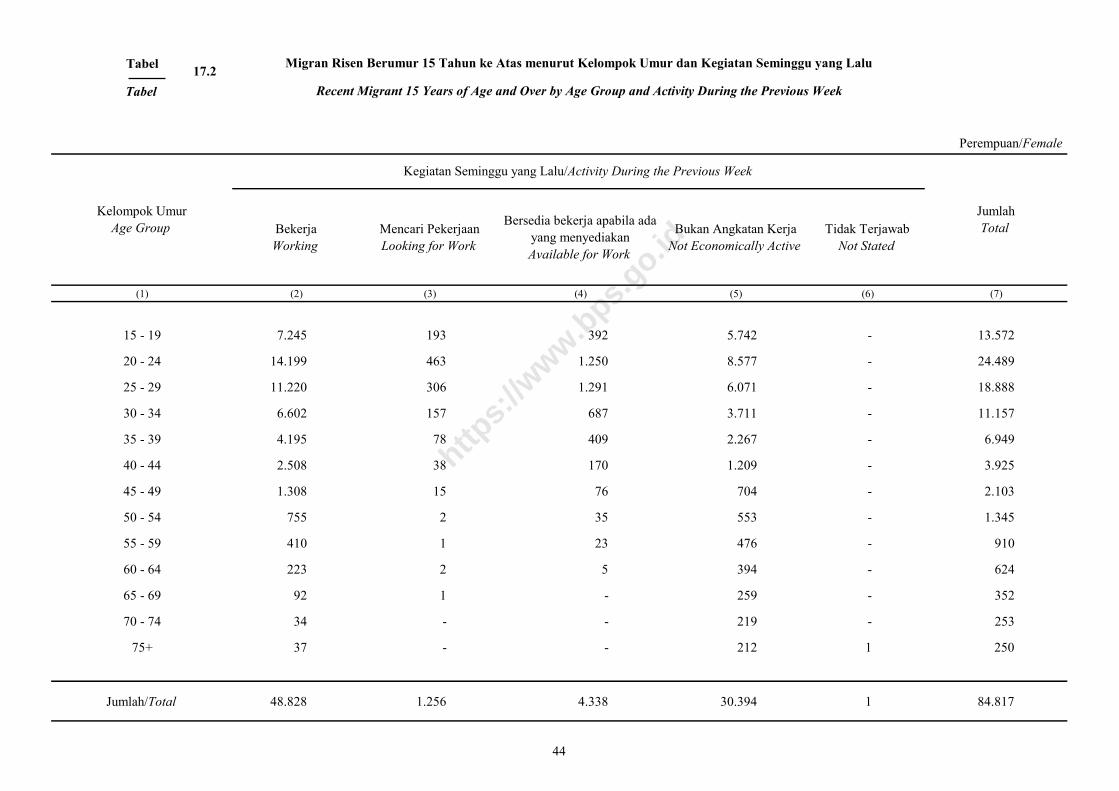
Tabel
Tabel
Bekerja
Working
Mencari Pekerjaan
Looking for Work
Bersedia bekerja apabila ada
yang menyediakan
Available for Work
Bukan Angkatan Kerja
Not Economically Active
Tidak Terjawab
Not Stated
(1) (2) (3) (4) (5) (6) (7)
15 - 19 7.245 193 392 5.742 - 13.572
20 - 24 14.199 463 1.250 8.577 - 24.489
25 - 29 11.220 306 1.291 6.071 - 18.888
30 - 34 6.602 157 687 3.711 - 11.157
35 - 39 4.195 78 409 2.267 - 6.949
40 - 44 2.508 38 170 1.209 - 3.925
45 - 49 1.308 15 76 704 - 2.103
50 - 54 755 2 35 553 - 1.345
55 - 59 410 1 23 476 - 910
60 - 64 223 2 5 394 - 624
65 - 69 92 1 - 259 - 352
70 - 74 34 - - 219 - 253
75+ 37 - - 212 1 250
Jumlah/Total 48.828 1.256 4.338 30.394 1 84.817
Perempuan/Female
Kelompok Umur
Age Group
Kegiatan Seminggu yang Lalu/Activity During the Previous Week
Jumlah
Total
Migran Risen Berumur 15 Tahun ke Atas menurut Kelompok Umur dan Kegiatan Seminggu yang Lalu
Recent Migrant 15 Years of Age and Over by Age Group and Activity During the Previous Week
17.2
44
https:
//www.b
ps.go.id
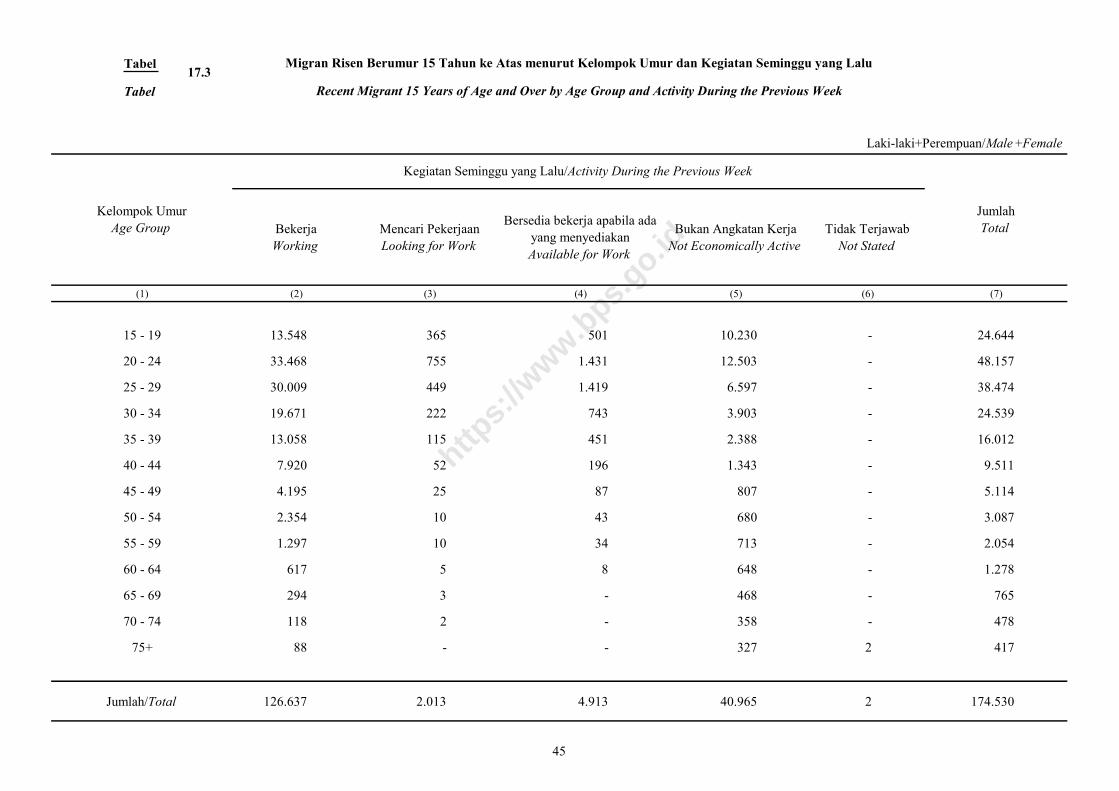
Tabel
Tabel
Bekerja
Working
Mencari Pekerjaan
Looking for Work
Bersedia bekerja apabila ada
yang menyediakan
Available for Work
Bukan Angkatan Kerja
Not Economically Active
Tidak Terjawab
Not Stated
(1) (2) (3) (4) (5) (6) (7)
15 - 19 13.548 365 501 10.230 - 24.644
20 - 24 33.468 755 1.431 12.503 - 48.157
25 - 29 30.009 449 1.419 6.597 - 38.474
30 - 34 19.671 222 743 3.903 - 24.539
35 - 39 13.058 115 451 2.388 - 16.012
40 - 44 7.920 52 196 1.343 - 9.511
45 - 49 4.195 25 87 807 - 5.114
50 - 54 2.354 10 43 680 - 3.087
55 - 59 1.297 10 34 713 - 2.054
60 - 64 617 5 8 648 - 1.278
65 - 69 294 3 - 468 - 765
70 - 74 118 2 - 358 - 478
75+ 88 - - 327 2 417
Jumlah/Total 126.637 2.013 4.913 40.965 2 174.530
Laki-laki+Perempuan/Male +Female
Kelompok Umur
Age Group
Kegiatan Seminggu yang Lalu/Activity During the Previous Week
Jumlah
Total
Migran Risen Berumur 15 Tahun ke Atas menurut Kelompok Umur dan Kegiatan Seminggu yang Lalu
Recent Migrant 15 Years of Age and Over by Age Group and Activity During the Previous Week
17.3
45
https:
//www.b
ps.go.id
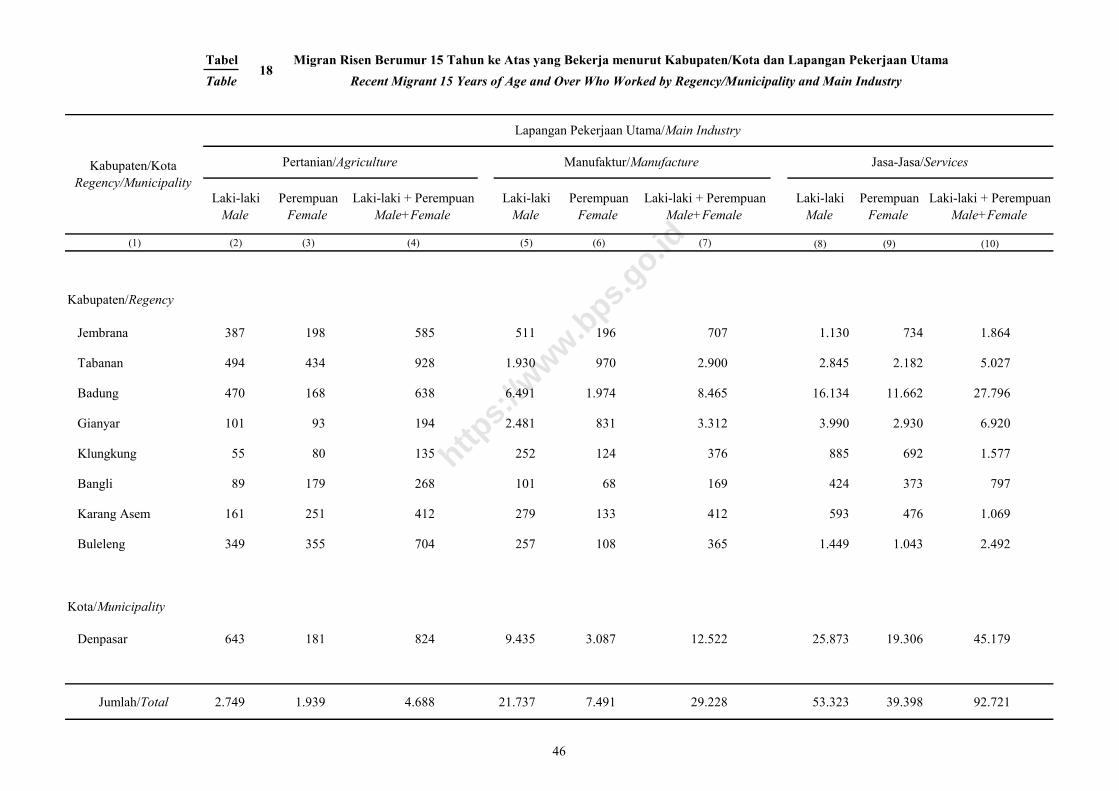
Tabel Migran Risen Berumur 15 Tahun ke Atas yang Bekerja menurut Kabupaten/Kota dan Lapangan Pekerjaan Utama
Table Recent Migrant 15 Years of Age and Over Who Worked by Regency/Municipality and Main Industry
Laki-laki Perempuan Laki-laki + Perempuan Laki-laki Perempuan Laki-laki + Perempuan Laki-laki Perempuan Laki-laki + Perempuan
Male Female Male+Female Male Female Male+Female Male Female Male+Female
(1) (2) (3) (4) (5) (6) (7) (8) (9) (10)
Kabupaten/Regency
Jembrana 387 198 585 511 196 707 1.130 734 1.864
Tabanan 494 434 928 1.930 970 2.900 2.845 2.182 5.027
Badung 470 168 638 6.491 1.974 8.465 16.134 11.662 27.796
Gianyar 101 93 194 2.481 831 3.312 3.990 2.930 6.920
Klungkung 55 80 135 252 124 376 885 692 1.577
Bangli 89 179 268 101 68 169 424 373 797
Karang Asem 161 251 412 279 133 412 593 476 1.069
Buleleng 349 355 704 257 108 365 1.449 1.043 2.492
Kota/Municipality
Denpasar 643 181 824 9.435 3.087 12.522 25.873 19.306 45.179
Jumlah/Total 2.749 1.939 4.688 21.737 7.491 29.228 53.323 39.398 92.721
Kabupaten/Kota
Regency/Municipality
Lapangan Pekerjaan Utama/Main Industry
Pertanian/Agriculture Manufaktur/Manufacture Jasa-Jasa/Services
18
46
https:
//www.b
ps.go.id
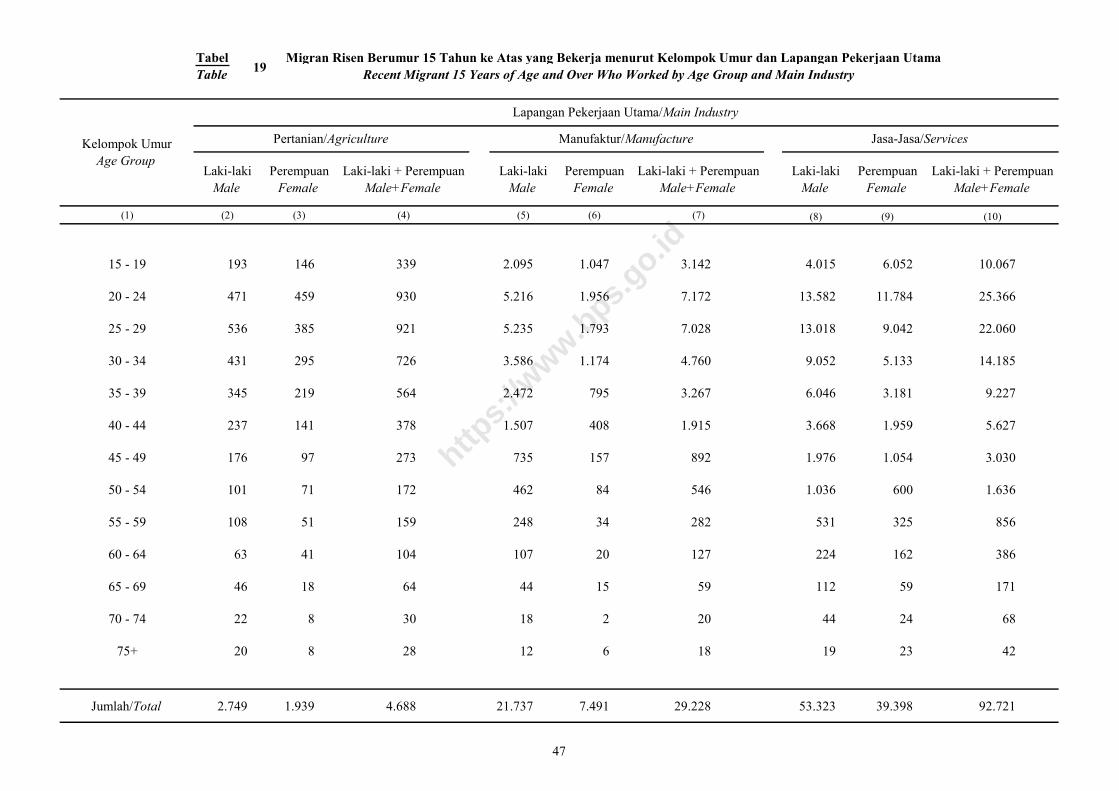
Tabel Migran Risen Berumur 15 Tahun ke Atas yang Bekerja menurut Kelompok Umur dan Lapangan Pekerjaan Utama
Table Recent Migrant 15 Years of Age and Over Who Worked by Age Group and Main Industry
Laki-laki Perempuan Laki-laki + Perempuan Laki-laki Perempuan Laki-laki + Perempuan Laki-laki Perempuan Laki-laki + Perempuan
Male Female Male+Female Male Female Male+Female Male Female Male+Female
(1) (2) (3) (4) (5) (6) (7) (8) (9) (10)
15 - 19 193 146 339 2.095 1.047 3.142 4.015 6.052 10.067
20 - 24 471 459 930 5.216 1.956 7.172 13.582 11.784 25.366
25 - 29 536 385 921 5.235 1.793 7.028 13.018 9.042 22.060
30 - 34 431 295 726 3.586 1.174 4.760 9.052 5.133 14.185
35 - 39 345 219 564 2.472 795 3.267 6.046 3.181 9.227
40 - 44 237 141 378 1.507 408 1.915 3.668 1.959 5.627
45 - 49 176 97 273 735 157 892 1.976 1.054 3.030
50 - 54 101 71 172 462 84 546 1.036 600 1.636
55 - 59 108 51 159 248 34 282 531 325 856
60 - 64 63 41 104 107 20 127 224 162 386
65 - 69 46 18 64 44 15 59 112 59 171
70 - 74 22 8 30 18 2 20 44 24 68
75+ 20 8 28 12 6 18 19 23 42
Jumlah/Total 2.749 1.939 4.688 21.737 7.491 29.228 53.323 39.398 92.721
Kelompok Umur
Age Group
Lapangan Pekerjaan Utama/Main Industry
Pertanian/Agriculture Manufaktur/Manufacture Jasa-Jasa/Services
19
47
https:
//www.b
ps.go.id
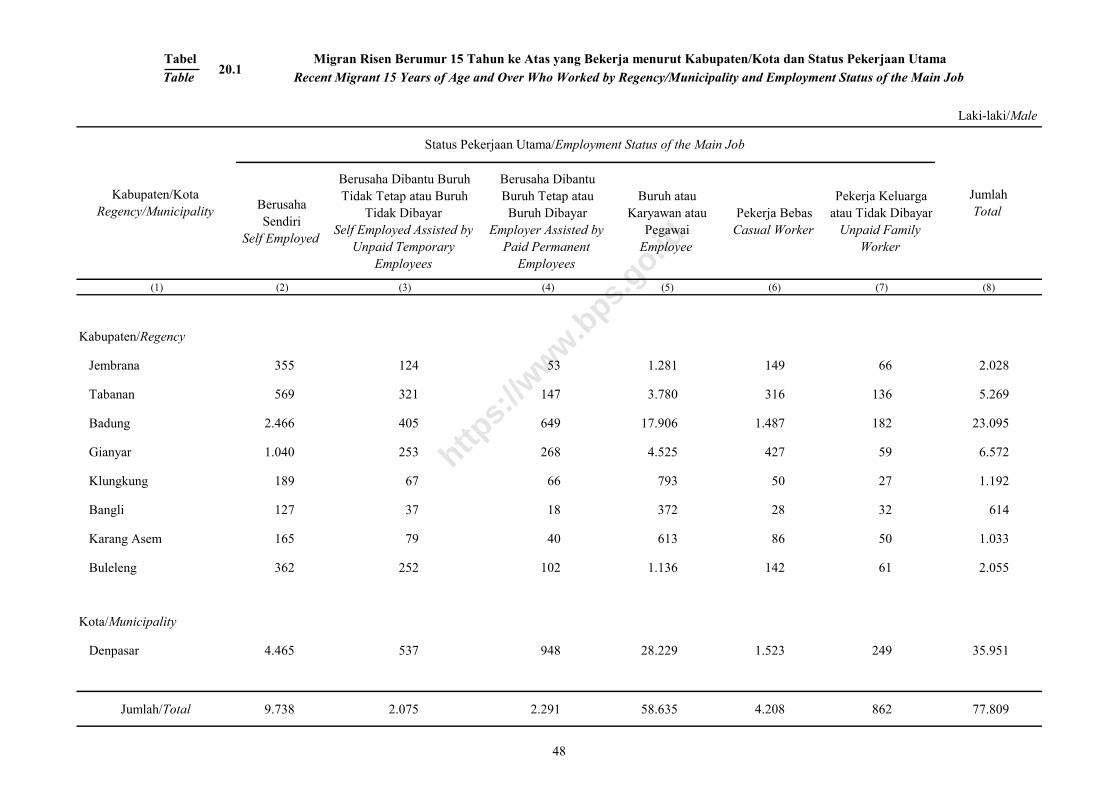
Tabel Migran Risen Berumur 15 Tahun ke Atas yang Bekerja menurut Kabupaten/Kota dan Status Pekerjaan Utama
Table Recent Migrant 15 Years of Age and Over Who Worked by Regency/Municipality and Employment Status of the Main Job
Berusaha
Sendiri
Self Employed
Berusaha Dibantu Buruh
Tidak Tetap atau Buruh
Tidak Dibayar
Self Employed Assisted by
Unpaid Temporary
Employees
Berusaha Dibantu
Buruh Tetap atau
Buruh Dibayar
Employer Assisted by
Paid Permanent
Employees
Buruh atau
Karyawan atau
Pegawai
Employee
Pekerja Bebas
Casual Worker
Pekerja Keluarga
atau Tidak Dibayar
Unpaid Family
Worker
(1) (2) (3) (4) (5) (6) (7) (8)
Kabupaten/Regency
Jembrana 355 124 53 1.281 149 66 2.028
Tabanan 569 321 147 3.780 316 136 5.269
Badung 2.466 405 649 17.906 1.487 182 23.095
Gianyar 1.040 253 268 4.525 427 59 6.572
Klungkung 189 67 66 793 50 27 1.192
Bangli 127 37 18 372 28 32 614
Karang Asem 165 79 40 613 86 50 1.033
Buleleng 362 252 102 1.136 142 61 2.055
Kota/Municipality
Denpasar 4.465 537 948 28.229 1.523 249 35.951
Jumlah/Total 9.738 2.075 2.291 58.635 4.208 862 77.809
Laki-laki/Male
Kabupaten/Kota
Regency/Municipality
Status Pekerjaan Utama/Employment Status of the Main Job
Jumlah
Total
20.1
48
https:
//www.b
ps.go.id
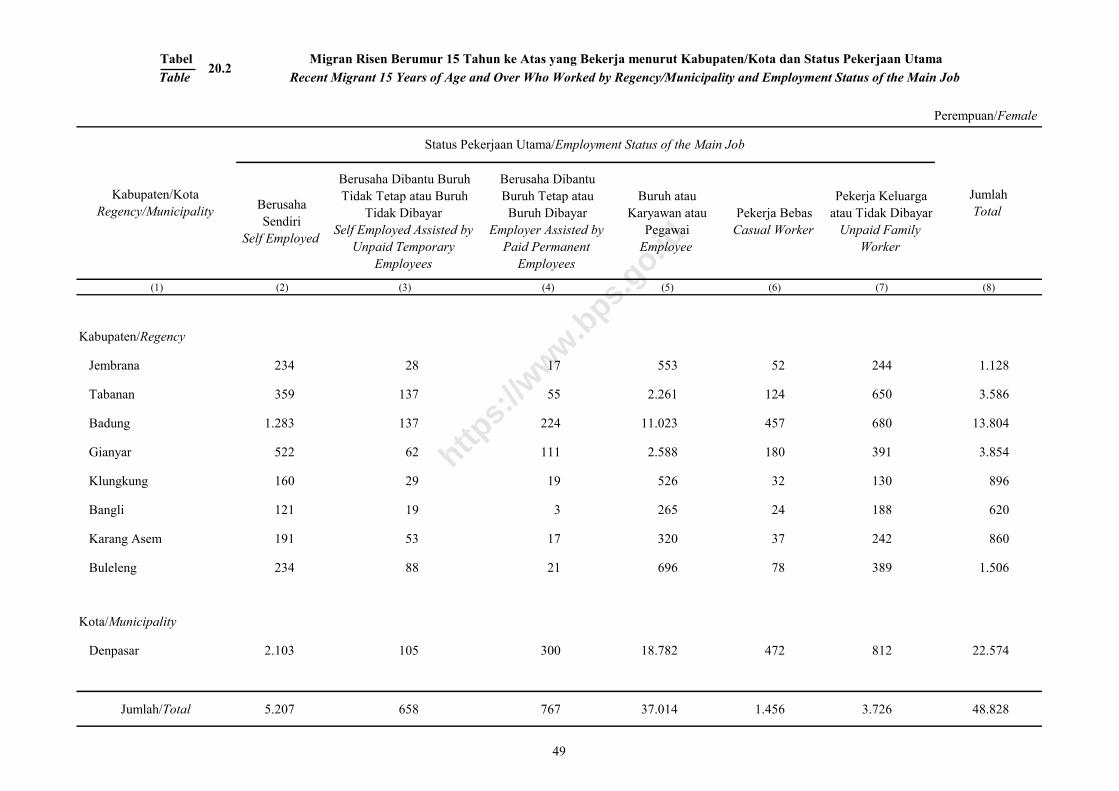
Tabel Migran Risen Berumur 15 Tahun ke Atas yang Bekerja menurut Kabupaten/Kota dan Status Pekerjaan Utama
Table Recent Migrant 15 Years of Age and Over Who Worked by Regency/Municipality and Employment Status of the Main Job
Berusaha
Sendiri
Self Employed
Berusaha Dibantu Buruh
Tidak Tetap atau Buruh
Tidak Dibayar
Self Employed Assisted by
Unpaid Temporary
Employees
Berusaha Dibantu
Buruh Tetap atau
Buruh Dibayar
Employer Assisted by
Paid Permanent
Employees
Buruh atau
Karyawan atau
Pegawai
Employee
Pekerja Bebas
Casual Worker
Pekerja Keluarga
atau Tidak Dibayar
Unpaid Family
Worker
(1) (2) (3) (4) (5) (6) (7) (8)
Kabupaten/Regency
Jembrana 234 28 17 553 52 244 1.128
Tabanan 359 137 55 2.261 124 650 3.586
Badung 1.283 137 224 11.023 457 680 13.804
Gianyar 522 62 111 2.588 180 391 3.854
Klungkung 160 29 19 526 32 130 896
Bangli 121 19 3 265 24 188 620
Karang Asem 191 53 17 320 37 242 860
Buleleng 234 88 21 696 78 389 1.506
Kota/Municipality
Denpasar 2.103 105 300 18.782 472 812 22.574
Jumlah/Total 5.207 658 767 37.014 1.456 3.726 48.828
Perempuan/Female
Kabupaten/Kota
Regency/Municipality
Status Pekerjaan Utama/Employment Status of the Main Job
Jumlah
Total
20.2
49
https:
//www.b
ps.go.id
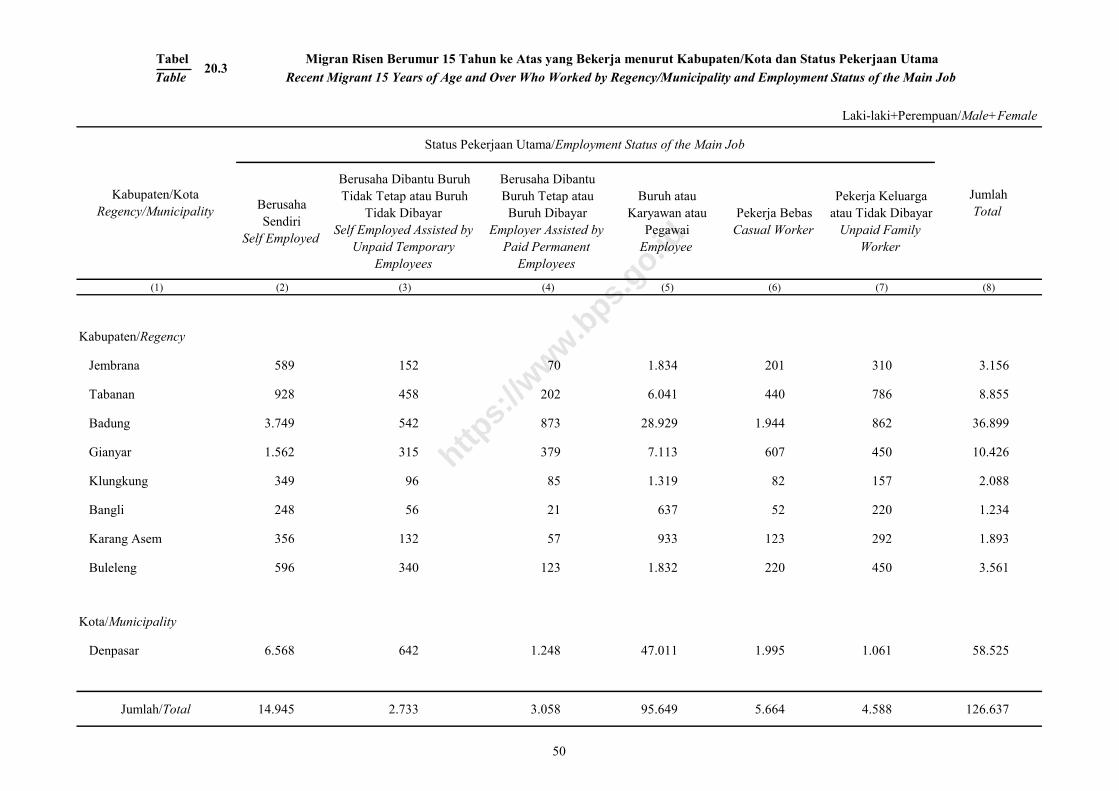
Tabel Migran Risen Berumur 15 Tahun ke Atas yang Bekerja menurut Kabupaten/Kota dan Status Pekerjaan Utama
Table Recent Migrant 15 Years of Age and Over Who Worked by Regency/Municipality and Employment Status of the Main Job
Berusaha
Sendiri
Self Employed
Berusaha Dibantu Buruh
Tidak Tetap atau Buruh
Tidak Dibayar
Self Employed Assisted by
Unpaid Temporary
Employees
Berusaha Dibantu
Buruh Tetap atau
Buruh Dibayar
Employer Assisted by
Paid Permanent
Employees
Buruh atau
Karyawan atau
Pegawai
Employee
Pekerja Bebas
Casual Worker
Pekerja Keluarga
atau Tidak Dibayar
Unpaid Family
Worker
(1) (2) (3) (4) (5) (6) (7) (8)
Kabupaten/Regency
Jembrana 589 152 70 1.834 201 310 3.156
Tabanan 928 458 202 6.041 440 786 8.855
Badung 3.749 542 873 28.929 1.944 862 36.899
Gianyar 1.562 315 379 7.113 607 450 10.426
Klungkung 349 96 85 1.319 82 157 2.088
Bangli 248 56 21 637 52 220 1.234
Karang Asem 356 132 57 933 123 292 1.893
Buleleng 596 340 123 1.832 220 450 3.561
Kota/Municipality
Denpasar 6.568 642 1.248 47.011 1.995 1.061 58.525
Jumlah/Total 14.945 2.733 3.058 95.649 5.664 4.588 126.637
Laki-laki+Perempuan/Male+Female
Kabupaten/Kota
Regency/Municipality
Status Pekerjaan Utama/Employment Status of the Main Job
Jumlah
Total
20.3
50
https:
//www.b
ps.go.id
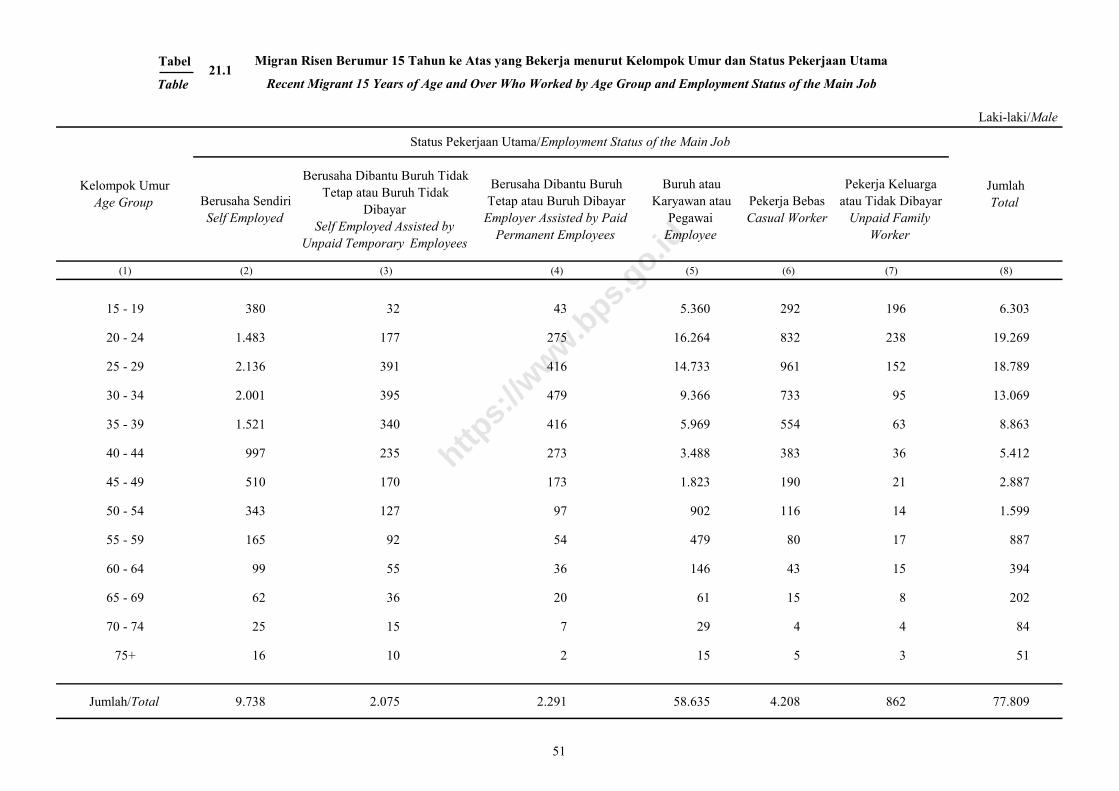
Tabel
Table
Berusaha Sendiri
Self Employed
Berusaha Dibantu Buruh Tidak
Tetap atau Buruh Tidak
Dibayar
Self Employed Assisted by
Unpaid Temporary Employees
Berusaha Dibantu Buruh
Tetap atau Buruh Dibayar
Employer Assisted by Paid
Permanent Employees
Buruh atau
Karyawan atau
Pegawai
Employee
Pekerja Bebas
Casual Worker
Pekerja Keluarga
atau Tidak Dibayar
Unpaid Family
Worker
(1) (2) (3) (4) (5) (6) (7) (8)
15 - 19 380 32 43 5.360 292 196 6.303
20 - 24 1.483 177 275 16.264 832 238 19.269
25 - 29 2.136 391 416 14.733 961 152 18.789
30 - 34 2.001 395 479 9.366 733 95 13.069
35 - 39 1.521 340 416 5.969 554 63 8.863
40 - 44 997 235 273 3.488 383 36 5.412
45 - 49 510 170 173 1.823 190 21 2.887
50 - 54 343 127 97 902 116 14 1.599
55 - 59 165 92 54 479 80 17 887
60 - 64 99 55 36 146 43 15 394
65 - 69 62 36 20 61 15 8 202
70 - 74 25 15 7 29 4 4 84
75+ 16 10 2 15 5 3 51
Jumlah/Total 9.738 2.075 2.291 58.635 4.208 862 77.809
Laki-laki/Male
Kelompok Umur
Age Group
Status Pekerjaan Utama/Employment Status of the Main Job
Jumlah
Total
Migran Risen Berumur 15 Tahun ke Atas yang Bekerja menurut Kelompok Umur dan Status Pekerjaan Utama
Recent Migrant 15 Years of Age and Over Who Worked by Age Group and Employment Status of the Main Job21.1
51
https:
//www.b
ps.go.id
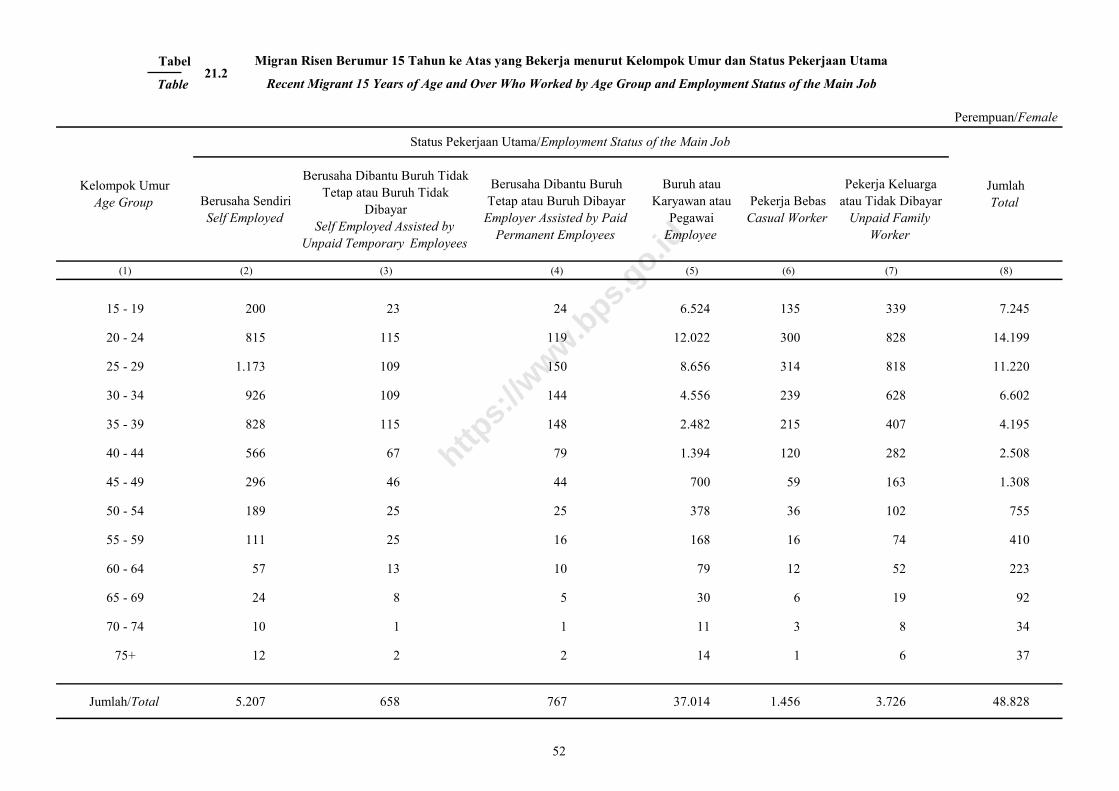
Tabel
Table
Berusaha Sendiri
Self Employed
Berusaha Dibantu Buruh Tidak
Tetap atau Buruh Tidak
Dibayar
Self Employed Assisted by
Unpaid Temporary Employees
Berusaha Dibantu Buruh
Tetap atau Buruh Dibayar
Employer Assisted by Paid
Permanent Employees
Buruh atau
Karyawan atau
Pegawai
Employee
Pekerja Bebas
Casual Worker
Pekerja Keluarga
atau Tidak Dibayar
Unpaid Family
Worker
(1) (2) (3) (4) (5) (6) (7) (8)
15 - 19 200 23 24 6.524 135 339 7.245
20 - 24 815 115 119 12.022 300 828 14.199
25 - 29 1.173 109 150 8.656 314 818 11.220
30 - 34 926 109 144 4.556 239 628 6.602
35 - 39 828 115 148 2.482 215 407 4.195
40 - 44 566 67 79 1.394 120 282 2.508
45 - 49 296 46 44 700 59 163 1.308
50 - 54 189 25 25 378 36 102 755
55 - 59 111 25 16 168 16 74 410
60 - 64 57 13 10 79 12 52 223
65 - 69 24 8 5 30 6 19 92
70 - 74 10 1 1 11 3 8 34
75+ 12 2 2 14 1 6 37
Jumlah/Total 5.207 658 767 37.014 1.456 3.726 48.828
Perempuan/Female
Kelompok Umur
Age Group
Status Pekerjaan Utama/Employment Status of the Main Job
Jumlah
Total
Migran Risen Berumur 15 Tahun ke Atas yang Bekerja menurut Kelompok Umur dan Status Pekerjaan Utama
Recent Migrant 15 Years of Age and Over Who Worked by Age Group and Employment Status of the Main Job21.2
52
https:
//www.b
ps.go.id
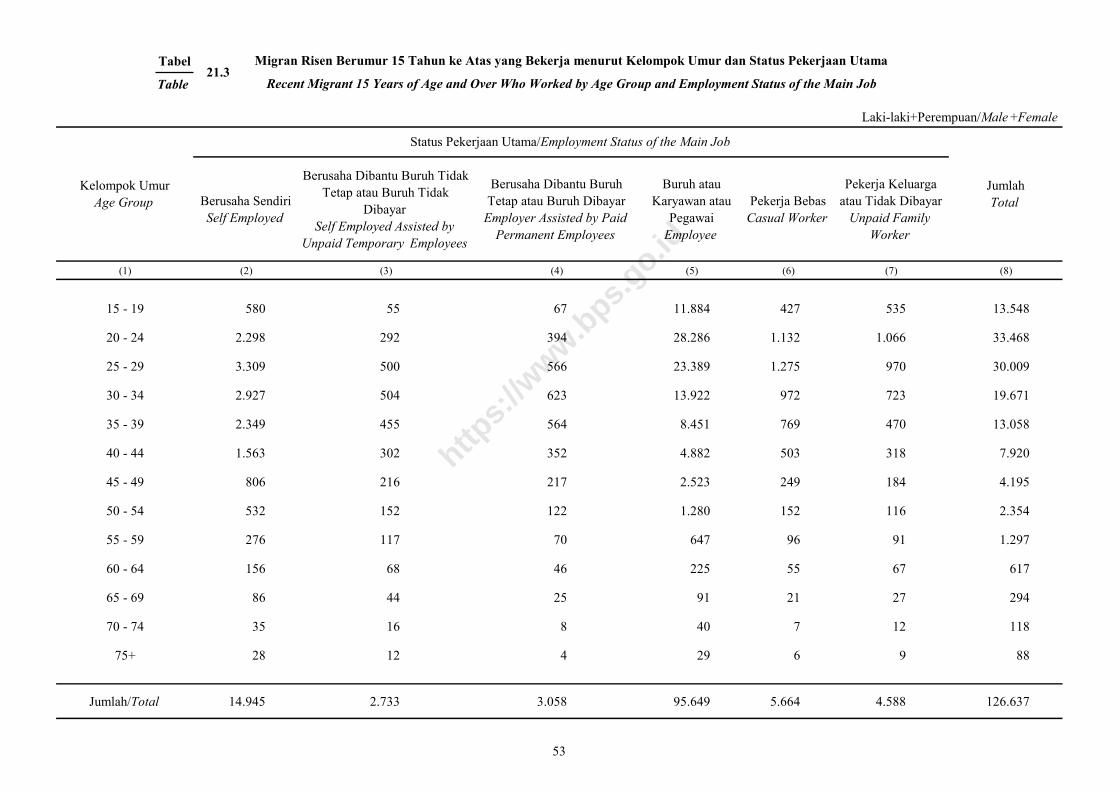
Tabel
Table
Berusaha Sendiri
Self Employed
Berusaha Dibantu Buruh Tidak
Tetap atau Buruh Tidak
Dibayar
Self Employed Assisted by
Unpaid Temporary Employees
Berusaha Dibantu Buruh
Tetap atau Buruh Dibayar
Employer Assisted by Paid
Permanent Employees
Buruh atau
Karyawan atau
Pegawai
Employee
Pekerja Bebas
Casual Worker
Pekerja Keluarga
atau Tidak Dibayar
Unpaid Family
Worker
(1) (2) (3) (4) (5) (6) (7) (8)
15 - 19 580 55 67 11.884 427 535 13.548
20 - 24 2.298 292 394 28.286 1.132 1.066 33.468
25 - 29 3.309 500 566 23.389 1.275 970 30.009
30 - 34 2.927 504 623 13.922 972 723 19.671
35 - 39 2.349 455 564 8.451 769 470 13.058
40 - 44 1.563 302 352 4.882 503 318 7.920
45 - 49 806 216 217 2.523 249 184 4.195
50 - 54 532 152 122 1.280 152 116 2.354
55 - 59 276 117 70 647 96 91 1.297
60 - 64 156 68 46 225 55 67 617
65 - 69 86 44 25 91 21 27 294
70 - 74 35 16 8 40 7 12 118
75+ 28 12 4 29 6 9 88
Jumlah/Total 14.945 2.733 3.058 95.649 5.664 4.588 126.637
Laki-laki+Perempuan/Male +Female
Kelompok Umur
Age Group
Status Pekerjaan Utama/Employment Status of the Main Job
Jumlah
Total
Migran Risen Berumur 15 Tahun ke Atas yang Bekerja menurut Kelompok Umur dan Status Pekerjaan Utama
Recent Migrant 15 Years of Age and Over Who Worked by Age Group and Employment Status of the Main Job21.3
53
https:
//www.b
ps.go.id
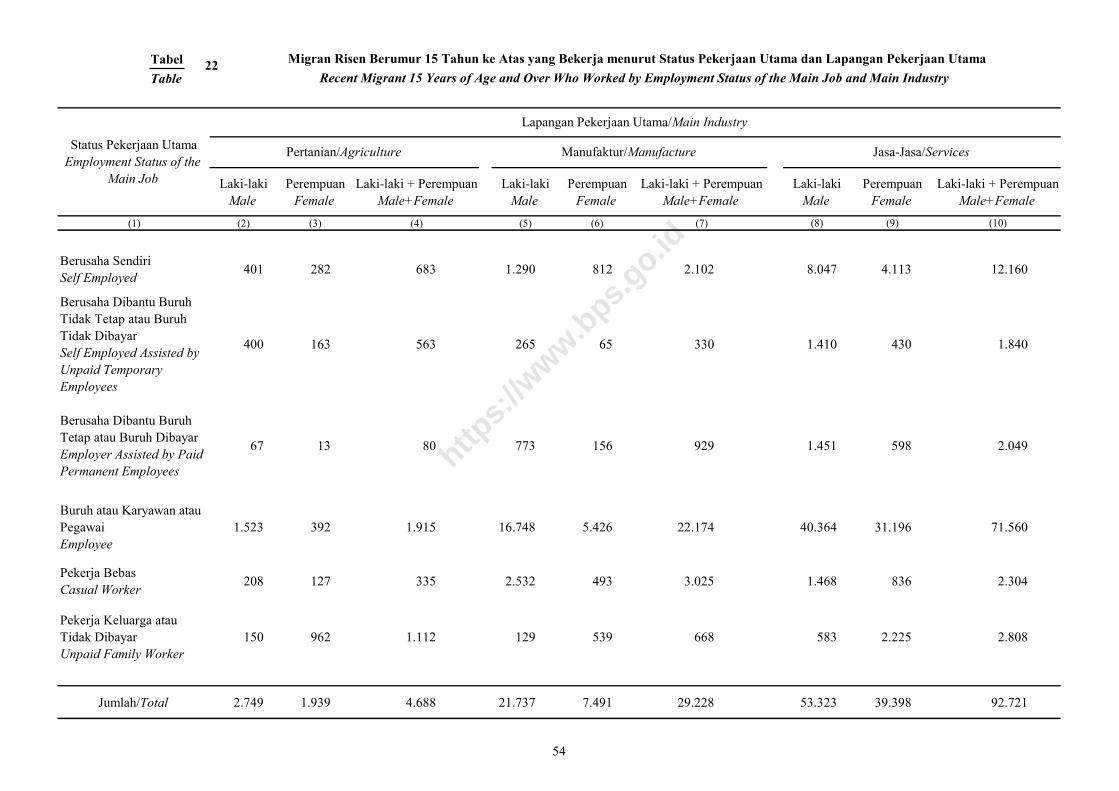
Tabel
Table
Laki-laki Perempuan Laki-laki + Perempuan Laki-laki Perempuan Laki-laki + Perempuan Laki-laki Perempuan Laki-laki + Perempuan
Male Female Male+Female Male Female Male+Female Male Female Male+Female
(1) (2) (3) (4) (5) (6) (7) (8) (9) (10)
Berusaha Sendiri
Self Employed401 282 683 1.290 812 2.102 8.047 4.113 12.160
Berusaha Dibantu Buruh
Tidak Tetap atau Buruh
Tidak Dibayar
Self Employed Assisted by
Unpaid Temporary
Employees
400 163 563 265 65 330 1.410 430 1.840
Berusaha Dibantu Buruh
Tetap atau Buruh Dibayar
Employer Assisted by Paid
Permanent Employees
67 13 80 773 156 929 1.451 598 2.049
Buruh atau Karyawan atau
Pegawai
Employee
1.523 392 1.915 16.748 5.426 22.174 40.364 31.196 71.560
Pekerja Bebas
Casual Worker208 127 335 2.532 493 3.025 1.468 836 2.304
Pekerja Keluarga atau
Tidak Dibayar
Unpaid Family Worker
150 962 1.112 129 539 668 583 2.225 2.808
Jumlah/Total 2.749 1.939 4.688 21.737 7.491 29.228 53.323 39.398 92.721
Migran Risen Berumur 15 Tahun ke Atas yang Bekerja menurut Status Pekerjaan Utama dan Lapangan Pekerjaan Utama
Recent Migrant 15 Years of Age and Over Who Worked by Employment Status of the Main Job and Main Industry
Status Pekerjaan Utama
Employment Status of the
Main Job
Lapangan Pekerjaan Utama/Main Industry
Pertanian/Agriculture Manufaktur/Manufacture Jasa-Jasa/Services
22
54
https:
//www.b
ps.go.id

Tabel
Table
Berusaha Sendiri
Self Employed
Berusaha Dibantu Buruh Tidak Tetap
atau Buruh Tidak Dibayar
Self Employed Assisted by Unpaid
Temporary Employees
Berusaha Dibantu Buruh Tetap
atau Buruh Dibayar
Employer Assisted by Paid
Permanent Employees
Buruh atau
Karyawan atau
Pegawai
Employee
Pekerja Bebas
Casual Worker
Pekerja Keluarga
atau Tidak Dibayar
Unpaid Family
Worker
(1) (2) (3) (4) (5) (6) (7) (8)
Tidak/belum pernah sekolah
Never/Not Yet Schooled187 96 14 489 114 29 929
Tidak/belum tamat SD
Never/Not Yet Completed Primary
School
255 79 30 806 157 36 1.363
SD / Primary School 2.104 605 274 7.905 1.383 189 12.460
SMP / Junior High School 2.485 500 436 13.098 1.264 261 18.044
SMA / Senior High School 3.392 581 837 23.366 964 238 29.378
SM Kejuruan
Vocational High School302 63 86 3.412 132 30 4.025
Diploma I/II
Diploma I/II174 30 76 2.349 34 12 2.675
Diploma III/Akademi
Diploma III/Academy180 29 106 1.695 36 18 2.064
Diploma IV/S1
Diploma IV/Undergraduate605 88 393 4.991 112 44 6.233
S2/S3 / Post Graduate 54 4 39 524 12 5 638
Jumlah/Total 9.738 2.075 2.291 58.635 4.208 862 77.809
Laki-laki/Male
Pendidikan Tertinggi yang Ditamatkan
Educational Attainment
Status Pekerjaan Utama/Employment Status of the Main Job
Jumlah
Total
Migran Risen Berumur 15 Tahun ke Atas yang Bekerja menurut Pendidikan Tertinggi yang Ditamatkan dan Status Pekerjaan Utama
Recent Migrant 15 Years of Age and Over Who Worked by Educational Attainment and Employment Status of the Main Job23.1
55
https:
//www.b
ps.go.id
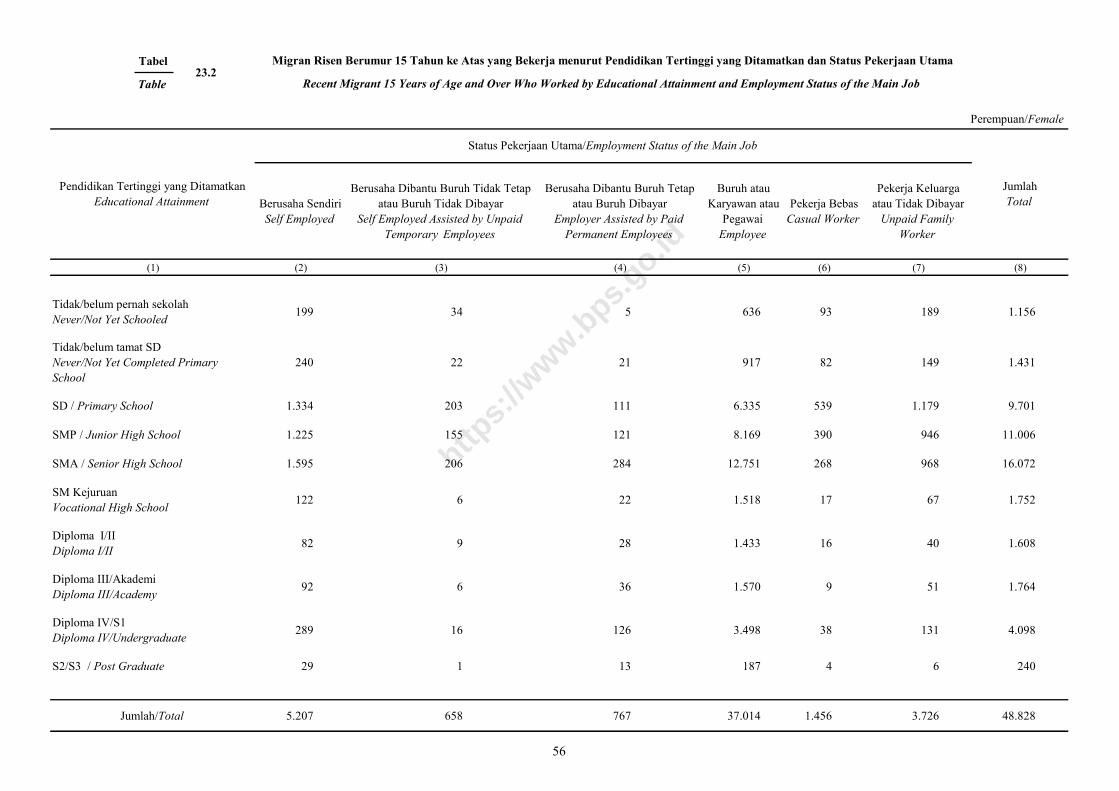
Tabel
Table
Berusaha Sendiri
Self Employed
Berusaha Dibantu Buruh Tidak Tetap
atau Buruh Tidak Dibayar
Self Employed Assisted by Unpaid
Temporary Employees
Berusaha Dibantu Buruh Tetap
atau Buruh Dibayar
Employer Assisted by Paid
Permanent Employees
Buruh atau
Karyawan atau
Pegawai
Employee
Pekerja Bebas
Casual Worker
Pekerja Keluarga
atau Tidak Dibayar
Unpaid Family
Worker
(1) (2) (3) (4) (5) (6) (7) (8)
Tidak/belum pernah sekolah
Never/Not Yet Schooled199 34 5 636 93 189 1.156
Tidak/belum tamat SD
Never/Not Yet Completed Primary
School
240 22 21 917 82 149 1.431
SD / Primary School 1.334 203 111 6.335 539 1.179 9.701
SMP / Junior High School 1.225 155 121 8.169 390 946 11.006
SMA / Senior High School 1.595 206 284 12.751 268 968 16.072
SM Kejuruan
Vocational High School122 6 22 1.518 17 67 1.752
Diploma I/II
Diploma I/II82 9 28 1.433 16 40 1.608
Diploma III/Akademi
Diploma III/Academy92 6 36 1.570 9 51 1.764
Diploma IV/S1
Diploma IV/Undergraduate289 16 126 3.498 38 131 4.098
S2/S3 / Post Graduate 29 1 13 187 4 6 240
Jumlah/Total 5.207 658 767 37.014 1.456 3.726 48.828
Perempuan/Female
Pendidikan Tertinggi yang Ditamatkan
Educational Attainment
Status Pekerjaan Utama/Employment Status of the Main Job
Jumlah
Total
Migran Risen Berumur 15 Tahun ke Atas yang Bekerja menurut Pendidikan Tertinggi yang Ditamatkan dan Status Pekerjaan Utama
Recent Migrant 15 Years of Age and Over Who Worked by Educational Attainment and Employment Status of the Main Job23.2
56
https:
//www.b
ps.go.id
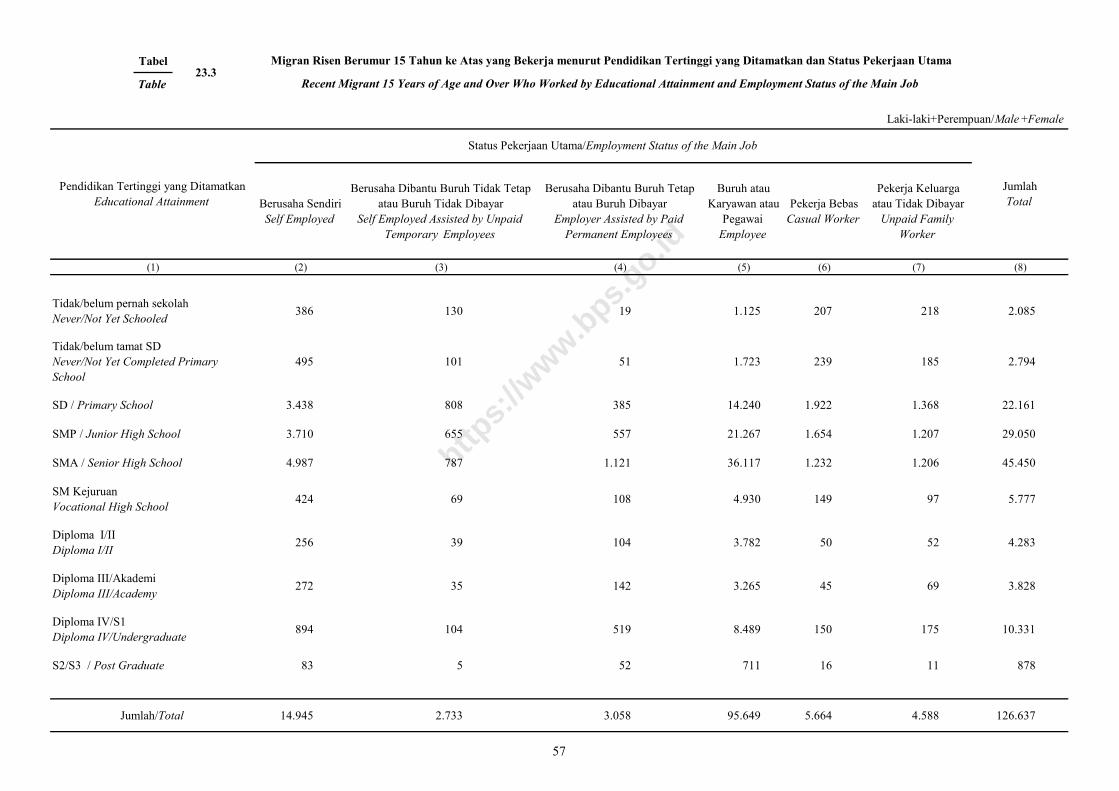
Tabel
Table
Berusaha Sendiri
Self Employed
Berusaha Dibantu Buruh Tidak Tetap
atau Buruh Tidak Dibayar
Self Employed Assisted by Unpaid
Temporary Employees
Berusaha Dibantu Buruh Tetap
atau Buruh Dibayar
Employer Assisted by Paid
Permanent Employees
Buruh atau
Karyawan atau
Pegawai
Employee
Pekerja Bebas
Casual Worker
Pekerja Keluarga
atau Tidak Dibayar
Unpaid Family
Worker
(1) (2) (3) (4) (5) (6) (7) (8)
Tidak/belum pernah sekolah
Never/Not Yet Schooled386 130 19 1.125 207 218 2.085
Tidak/belum tamat SD
Never/Not Yet Completed Primary
School
495 101 51 1.723 239 185 2.794
SD / Primary School 3.438 808 385 14.240 1.922 1.368 22.161
SMP / Junior High School 3.710 655 557 21.267 1.654 1.207 29.050
SMA / Senior High School 4.987 787 1.121 36.117 1.232 1.206 45.450
SM Kejuruan
Vocational High School424 69 108 4.930 149 97 5.777
Diploma I/II
Diploma I/II256 39 104 3.782 50 52 4.283
Diploma III/Akademi
Diploma III/Academy272 35 142 3.265 45 69 3.828
Diploma IV/S1
Diploma IV/Undergraduate894 104 519 8.489 150 175 10.331
S2/S3 / Post Graduate 83 5 52 711 16 11 878
Jumlah/Total 14.945 2.733 3.058 95.649 5.664 4.588 126.637
Laki-laki+Perempuan/Male +Female
Pendidikan Tertinggi yang Ditamatkan
Educational Attainment
Status Pekerjaan Utama/Employment Status of the Main Job
Jumlah
Total
Migran Risen Berumur 15 Tahun ke Atas yang Bekerja menurut Pendidikan Tertinggi yang Ditamatkan dan Status Pekerjaan Utama
Recent Migrant 15 Years of Age and Over Who Worked by Educational Attainment and Employment Status of the Main Job23.3
57
https:
//www.b
ps.go.id
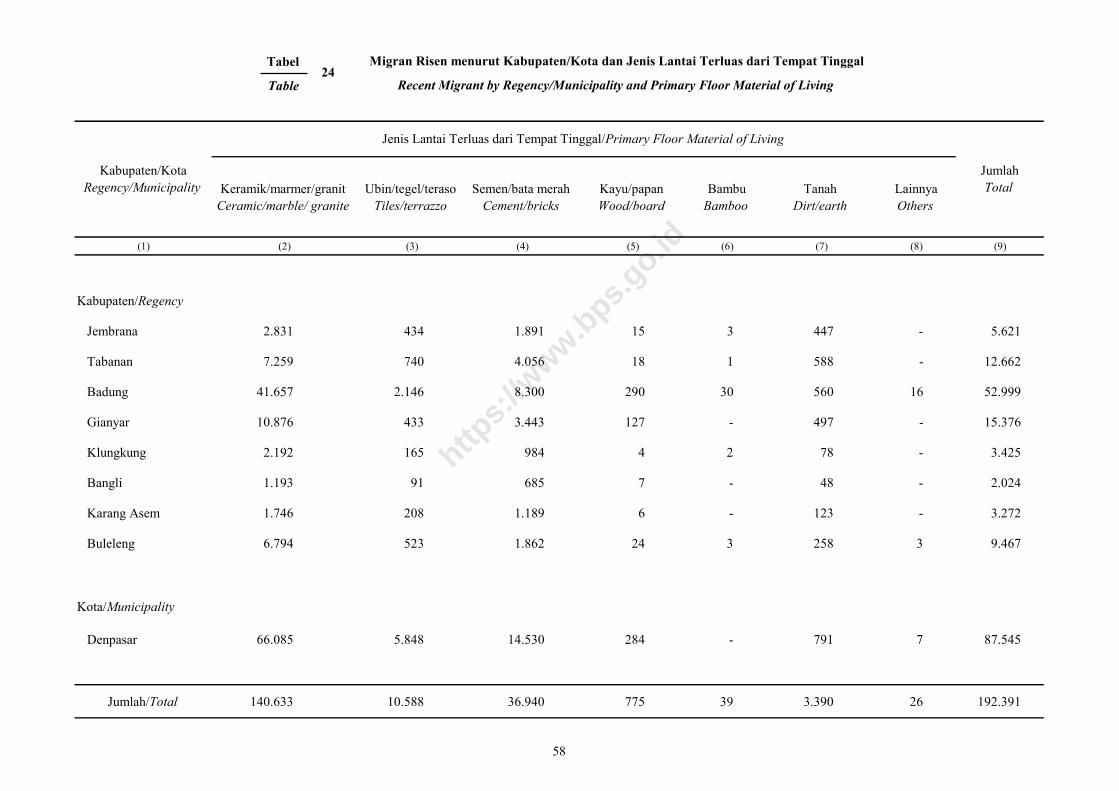
Tabel
Table
Keramik/marmer/granit
Ceramic/marble/ granite
Ubin/tegel/teraso
Tiles/terrazzo
Semen/bata merah
Cement/bricks
Kayu/papan
Wood/board
Bambu
Bamboo
Tanah
Dirt/earth
Lainnya
Others
(1) (2) (3) (4) (5) (6) (7) (8) (9)
Kabupaten/Regency
Jembrana 2.831 434 1.891 15 3 447 - 5.621
Tabanan 7.259 740 4.056 18 1 588 - 12.662
Badung 41.657 2.146 8.300 290 30 560 16 52.999
Gianyar 10.876 433 3.443 127 - 497 - 15.376
Klungkung 2.192 165 984 4 2 78 - 3.425
Bangli 1.193 91 685 7 - 48 - 2.024
Karang Asem 1.746 208 1.189 6 - 123 - 3.272
Buleleng 6.794 523 1.862 24 3 258 3 9.467
Kota/Municipality
Denpasar 66.085 5.848 14.530 284 - 791 7 87.545
Jumlah/Total 140.633 10.588 36.940 775 39 3.390 26 192.391
Kabupaten/Kota
Regency/Municipality
Jenis Lantai Terluas dari Tempat Tinggal/Primary Floor Material of Living
Jumlah
Total
Migran Risen menurut Kabupaten/Kota dan Jenis Lantai Terluas dari Tempat Tinggal
Recent Migrant by Regency/Municipality and Primary Floor Material of Living24
58
https:
//www.b
ps.go.id
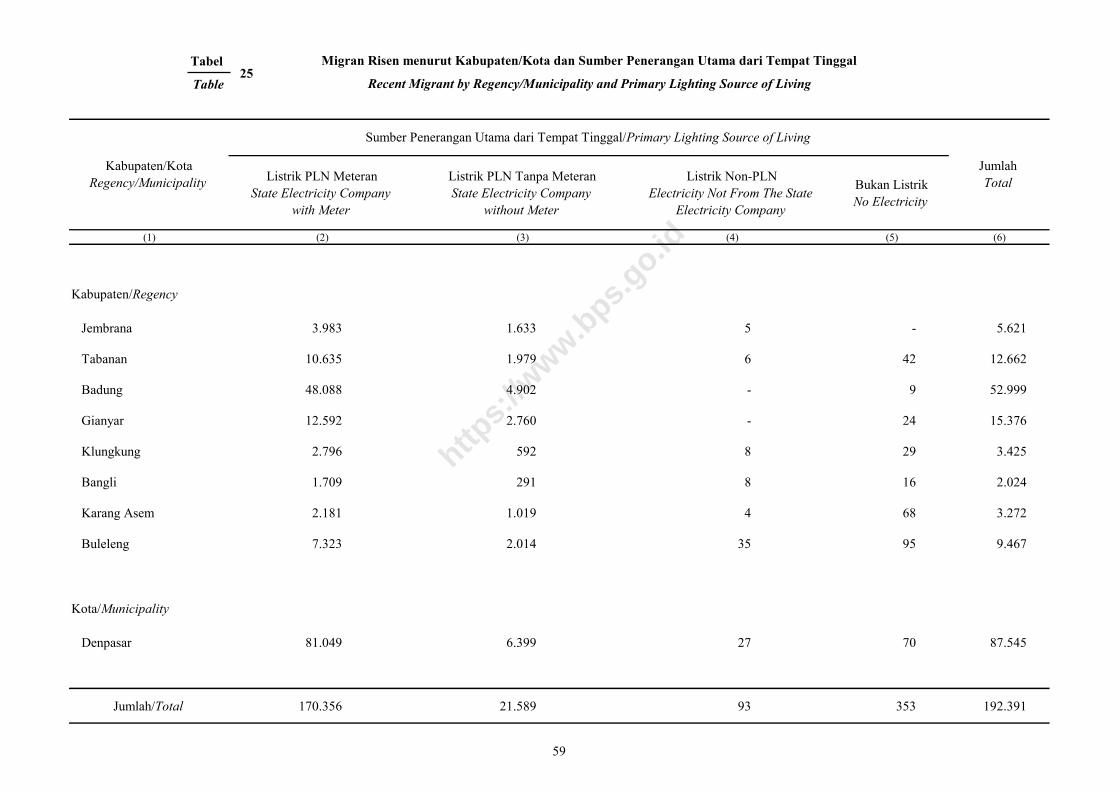
Tabel
Table
Listrik PLN Meteran
State Electricity Company
with Meter
Listrik PLN Tanpa Meteran
State Electricity Company
without Meter
Listrik Non-PLN
Electricity Not From The State
Electricity Company
Bukan Listrik
No Electricity
(1) (2) (3) (4) (5) (6)
Kabupaten/Regency
Jembrana 3.983 1.633 5 - 5.621
Tabanan 10.635 1.979 6 42 12.662
Badung 48.088 4.902 - 9 52.999
Gianyar 12.592 2.760 - 24 15.376
Klungkung 2.796 592 8 29 3.425
Bangli 1.709 291 8 16 2.024
Karang Asem 2.181 1.019 4 68 3.272
Buleleng 7.323 2.014 35 95 9.467
Kota/Municipality
Denpasar 81.049 6.399 27 70 87.545
Jumlah/Total 170.356 21.589 93 353 192.391
Kabupaten/Kota
Regency/Municipality
Sumber Penerangan Utama dari Tempat Tinggal/Primary Lighting Source of Living
Jumlah
Total
Migran Risen menurut Kabupaten/Kota dan Sumber Penerangan Utama dari Tempat Tinggal
Recent Migrant by Regency/Municipality and Primary Lighting Source of Living25
59
https:
//www.b
ps.go.id
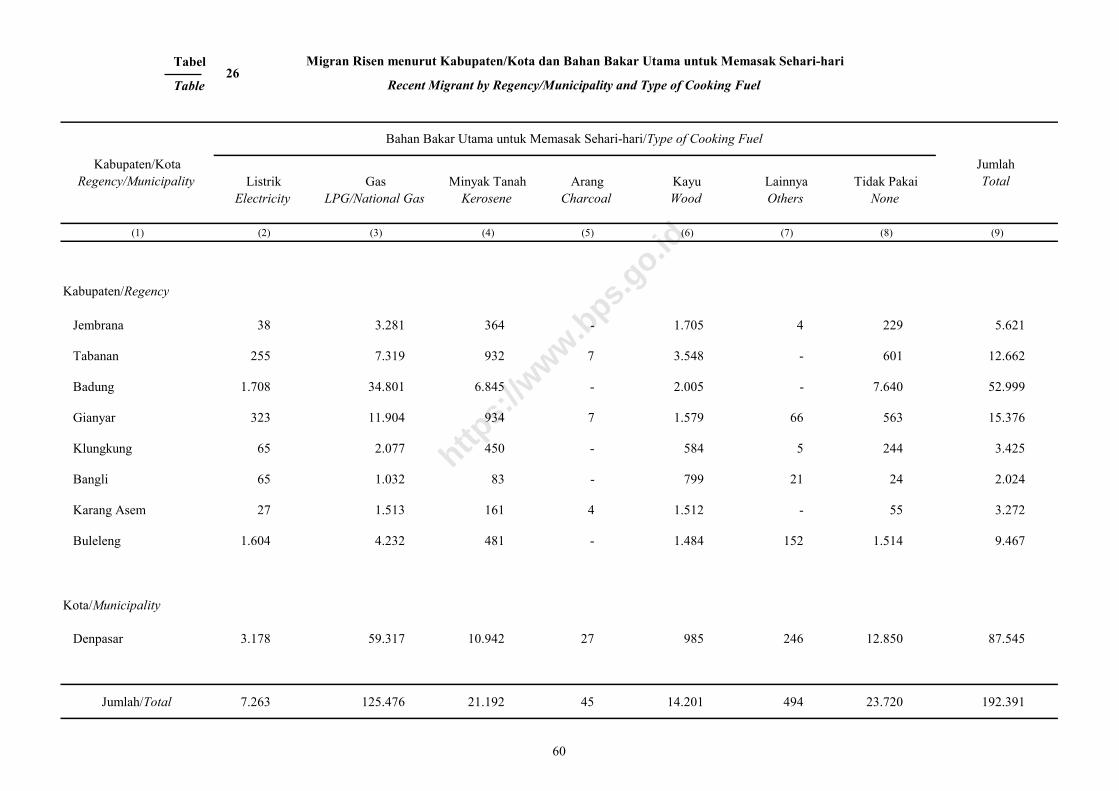
Tabel
Table
Listrik
Electricity
Gas
LPG/National Gas
Minyak Tanah
Kerosene
Arang
Charcoal
Kayu
Wood
Lainnya
Others
Tidak Pakai
None
(1) (2) (3) (4) (5) (6) (7) (8) (9)
Kabupaten/Regency
Jembrana 38 3.281 364 - 1.705 4 229 5.621
Tabanan 255 7.319 932 7 3.548 - 601 12.662
Badung 1.708 34.801 6.845 - 2.005 - 7.640 52.999
Gianyar 323 11.904 934 7 1.579 66 563 15.376
Klungkung 65 2.077 450 - 584 5 244 3.425
Bangli 65 1.032 83 - 799 21 24 2.024
Karang Asem 27 1.513 161 4 1.512 - 55 3.272
Buleleng 1.604 4.232 481 - 1.484 152 1.514 9.467
Kota/Municipality
Denpasar 3.178 59.317 10.942 27 985 246 12.850 87.545
Jumlah/Total 7.263 125.476 21.192 45 14.201 494 23.720 192.391
Kabupaten/Kota
Regency/Municipality
Bahan Bakar Utama untuk Memasak Sehari-hari/Type of Cooking Fuel
Jumlah
Total
Migran Risen menurut Kabupaten/Kota dan Bahan Bakar Utama untuk Memasak Sehari-hari
Recent Migrant by Regency/Municipality and Type of Cooking Fuel26
60
https:
//www.b
ps.go.id
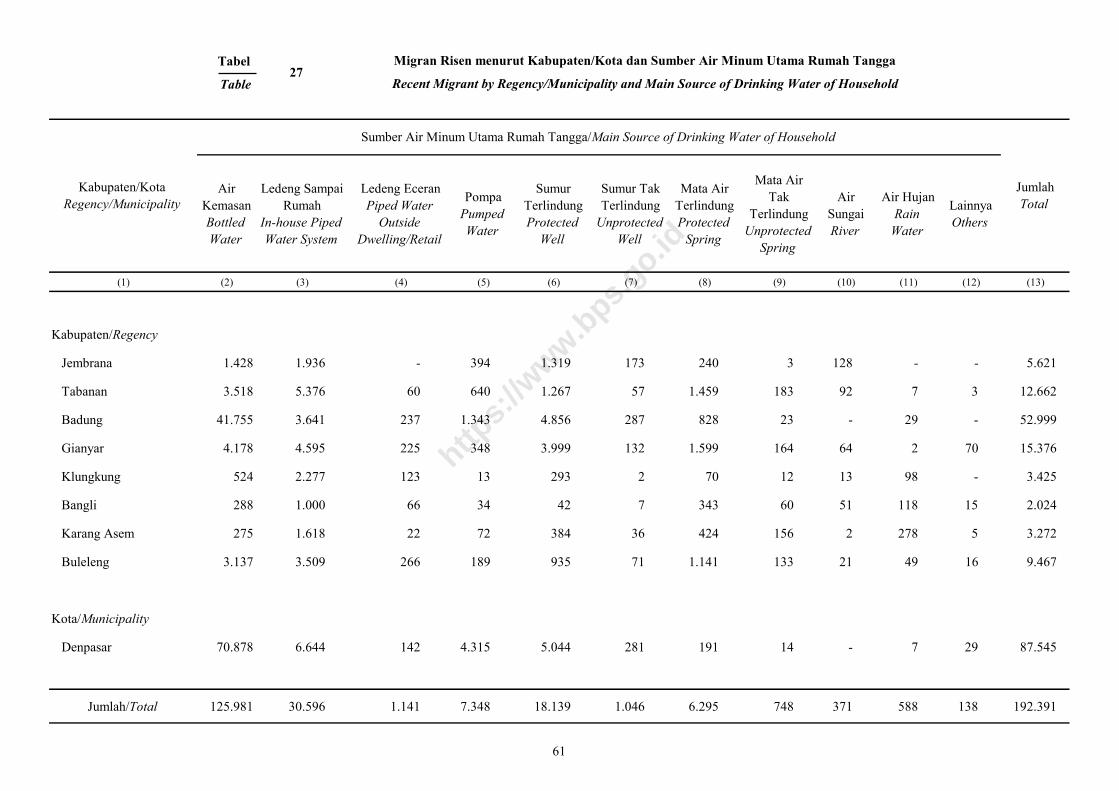
Tabel
Table
Air
Kemasan
Bottled
Water
Ledeng Sampai
Rumah
In-house Piped
Water System
Ledeng Eceran
Piped Water
Outside
Dwelling/Retail
Pompa
Pumped
Water
Sumur
Terlindung
Protected
Well
Sumur Tak
Terlindung
Unprotected
Well
Mata Air
Terlindung
Protected
Spring
Mata Air
Tak
Terlindung
Unprotected
Spring
Air
Sungai
River
Air Hujan
Rain
Water
Lainnya
Others
(1) (2) (3) (4) (5) (6) (7) (8) (9) (10) (11) (12) (13)
Kabupaten/Regency
Jembrana 1.428 1.936 - 394 1.319 173 240 3 128 - - 5.621
Tabanan 3.518 5.376 60 640 1.267 57 1.459 183 92 7 3 12.662
Badung 41.755 3.641 237 1.343 4.856 287 828 23 - 29 - 52.999
Gianyar 4.178 4.595 225 348 3.999 132 1.599 164 64 2 70 15.376
Klungkung 524 2.277 123 13 293 2 70 12 13 98 - 3.425
Bangli 288 1.000 66 34 42 7 343 60 51 118 15 2.024
Karang Asem 275 1.618 22 72 384 36 424 156 2 278 5 3.272
Buleleng 3.137 3.509 266 189 935 71 1.141 133 21 49 16 9.467
Kota/Municipality
Denpasar 70.878 6.644 142 4.315 5.044 281 191 14 - 7 29 87.545
Jumlah/Total 125.981 30.596 1.141 7.348 18.139 1.046 6.295 748 371 588 138 192.391
Kabupaten/Kota
Regency/Municipality
Sumber Air Minum Utama Rumah Tangga/Main Source of Drinking Water of Household
Jumlah
Total
Migran Risen menurut Kabupaten/Kota dan Sumber Air Minum Utama Rumah Tangga
Recent Migrant by Regency/Municipality and Main Source of Drinking Water of Household27
61
https:
//www.b
ps.go.id
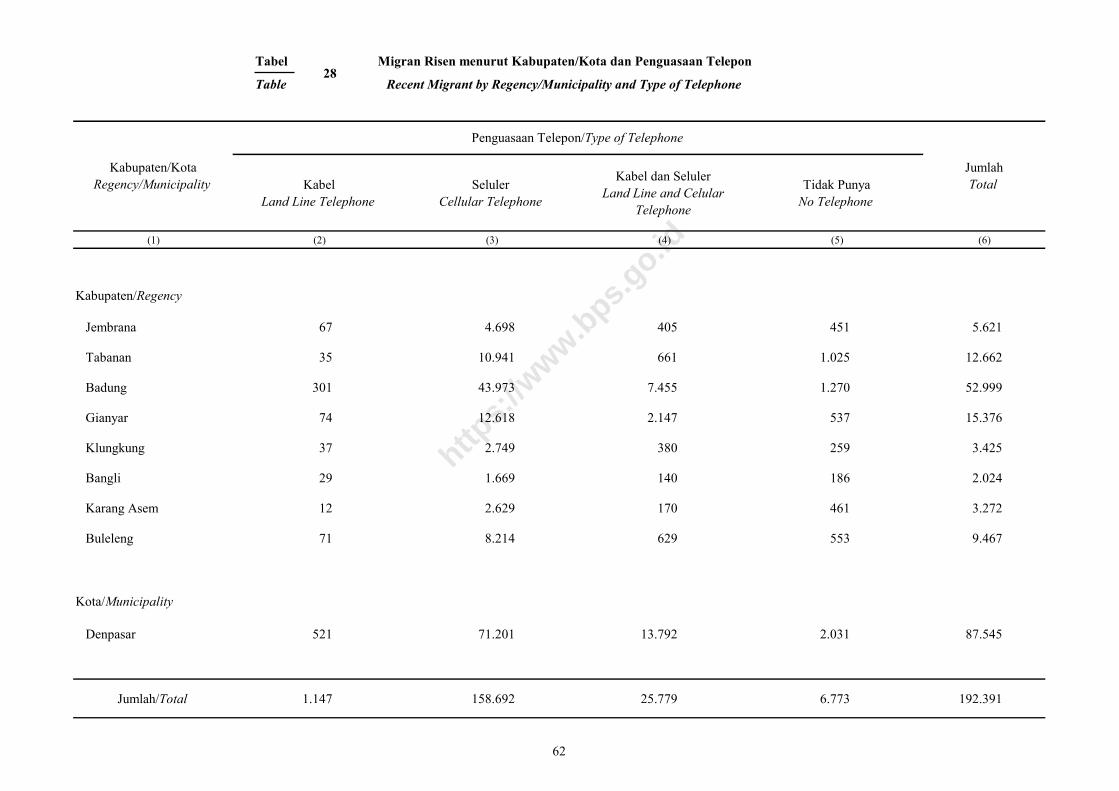
Tabel Migran Risen menurut Kabupaten/Kota dan Penguasaan Telepon
Table Recent Migrant by Regency/Municipality and Type of Telephone
Kabel
Land Line Telephone
Seluler
Cellular Telephone
Kabel dan Seluler
Land Line and Celular
Telephone
Tidak Punya
No Telephone
(1) (2) (3) (4) (5) (6)
Kabupaten/Regency
Jembrana 67 4.698 405 451 5.621
Tabanan 35 10.941 661 1.025 12.662
Badung 301 43.973 7.455 1.270 52.999
Gianyar 74 12.618 2.147 537 15.376
Klungkung 37 2.749 380 259 3.425
Bangli 29 1.669 140 186 2.024
Karang Asem 12 2.629 170 461 3.272
Buleleng 71 8.214 629 553 9.467
Kota/Municipality
Denpasar 521 71.201 13.792 2.031 87.545
Jumlah/Total 1.147 158.692 25.779 6.773 192.391
Kabupaten/Kota
Regency/Municipality
Penguasaan Telepon/Type of Telephone
Jumlah
Total
28
62
https:
//www.b
ps.go.id
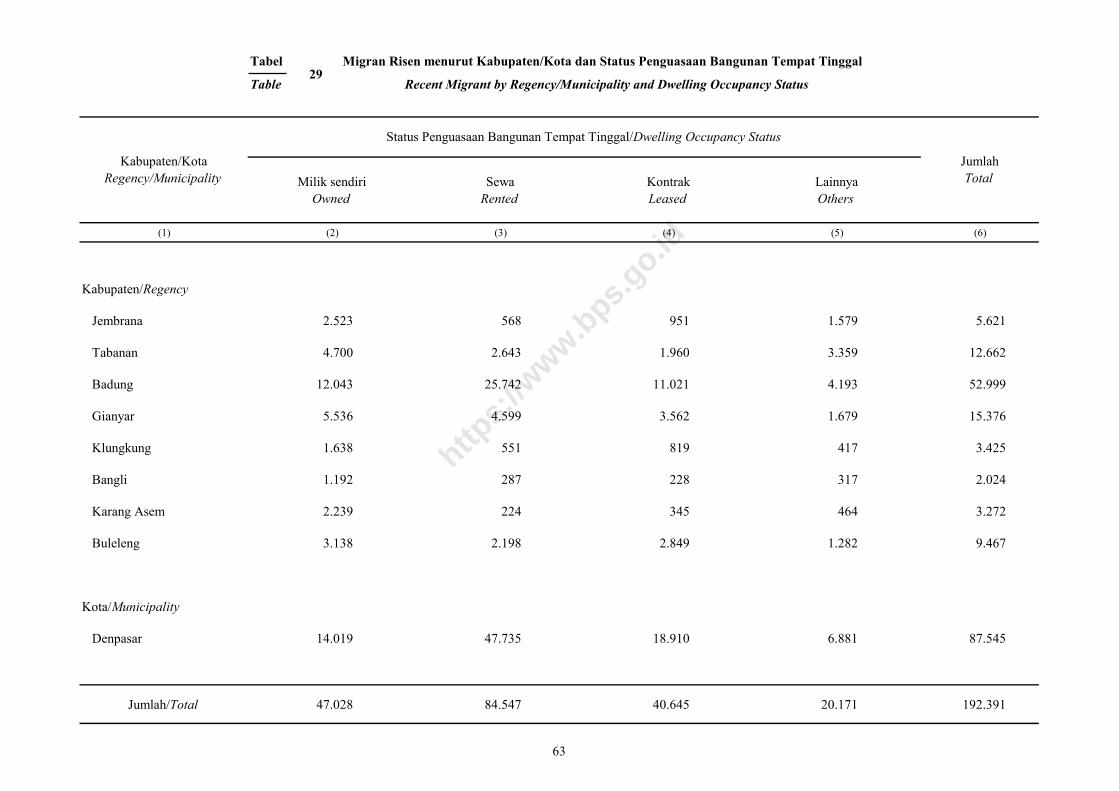
Tabel Migran Risen menurut Kabupaten/Kota dan Status Penguasaan Bangunan Tempat Tinggal
Table Recent Migrant by Regency/Municipality and Dwelling Occupancy Status
Milik sendiri
Owned
Sewa
Rented
Kontrak
Leased
Lainnya
Others
(1) (2) (3) (4) (5) (6)
Kabupaten/Regency
Jembrana 2.523 568 951 1.579 5.621
Tabanan 4.700 2.643 1.960 3.359 12.662
Badung 12.043 25.742 11.021 4.193 52.999
Gianyar 5.536 4.599 3.562 1.679 15.376
Klungkung 1.638 551 819 417 3.425
Bangli 1.192 287 228 317 2.024
Karang Asem 2.239 224 345 464 3.272
Buleleng 3.138 2.198 2.849 1.282 9.467
Kota/Municipality
Denpasar 14.019 47.735 18.910 6.881 87.545
Jumlah/Total 47.028 84.547 40.645 20.171 192.391
Kabupaten/Kota
Regency/Municipality
Status Penguasaan Bangunan Tempat Tinggal/Dwelling Occupancy Status
Jumlah
Total
29
63
https:
//www.b
ps.go.id
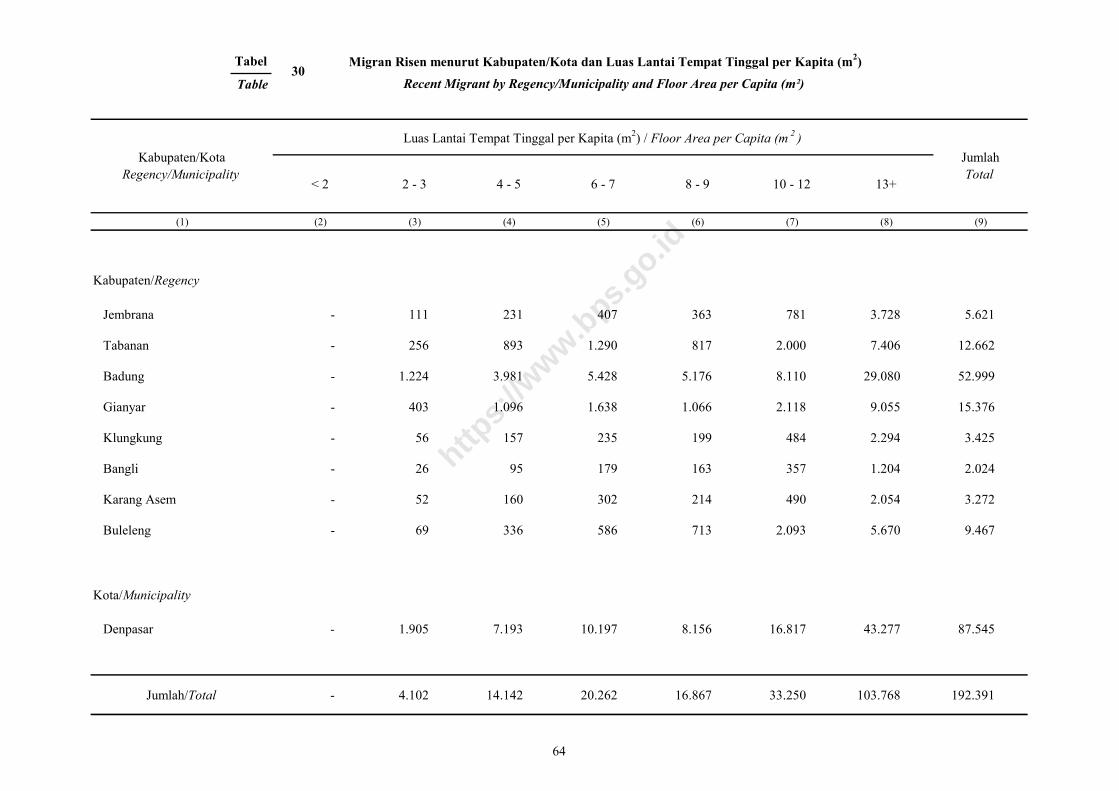
Tabel
Table
< 2 2 - 3 4 - 5 6 - 7 8 - 9 10 - 12 13+
(1) (2) (3) (4) (5) (6) (7) (8) (9)
Kabupaten/Regency
Jembrana - 111 231 407 363 781 3.728 5.621
Tabanan - 256 893 1.290 817 2.000 7.406 12.662
Badung - 1.224 3.981 5.428 5.176 8.110 29.080 52.999
Gianyar - 403 1.096 1.638 1.066 2.118 9.055 15.376
Klungkung - 56 157 235 199 484 2.294 3.425
Bangli - 26 95 179 163 357 1.204 2.024
Karang Asem - 52 160 302 214 490 2.054 3.272
Buleleng - 69 336 586 713 2.093 5.670 9.467
Kota/Municipality
Denpasar - 1.905 7.193 10.197 8.156 16.817 43.277 87.545
Jumlah/Total - 4.102 14.142 20.262 16.867 33.250 103.768 192.391
Kabupaten/Kota
Regency/Municipality
Luas Lantai Tempat Tinggal per Kapita (m2) / Floor Area per Capita (m
2)
Jumlah
Total
Migran Risen menurut Kabupaten/Kota dan Luas Lantai Tempat Tinggal per Kapita (m2)
Recent Migrant by Regency/Municipality and Floor Area per Capita (m²)30
64
https:
//www.b
ps.go.id
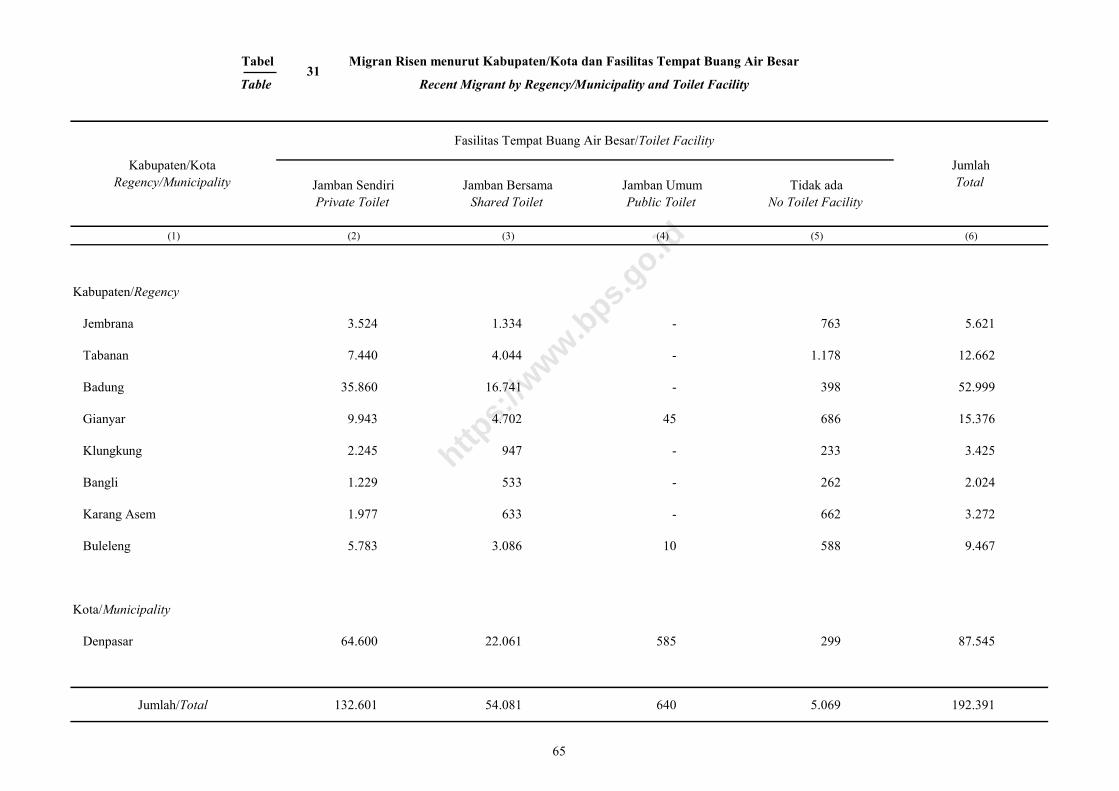
Tabel Migran Risen menurut Kabupaten/Kota dan Fasilitas Tempat Buang Air Besar
Table Recent Migrant by Regency/Municipality and Toilet Facility
Jamban Sendiri
Private Toilet
Jamban Bersama
Shared Toilet
Jamban Umum
Public Toilet
Tidak ada
No Toilet Facility
(1) (2) (3) (4) (5) (6)
Kabupaten/Regency
Jembrana 3.524 1.334 - 763 5.621
Tabanan 7.440 4.044 - 1.178 12.662
Badung 35.860 16.741 - 398 52.999
Gianyar 9.943 4.702 45 686 15.376
Klungkung 2.245 947 - 233 3.425
Bangli 1.229 533 - 262 2.024
Karang Asem 1.977 633 - 662 3.272
Buleleng 5.783 3.086 10 588 9.467
Kota/Municipality
Denpasar 64.600 22.061 585 299 87.545
Jumlah/Total 132.601 54.081 640 5.069 192.391
Kabupaten/Kota
Regency/Municipality
Fasilitas Tempat Buang Air Besar/Toilet Facility
Jumlah
Total
31
65
https:
//www.b
ps.go.id
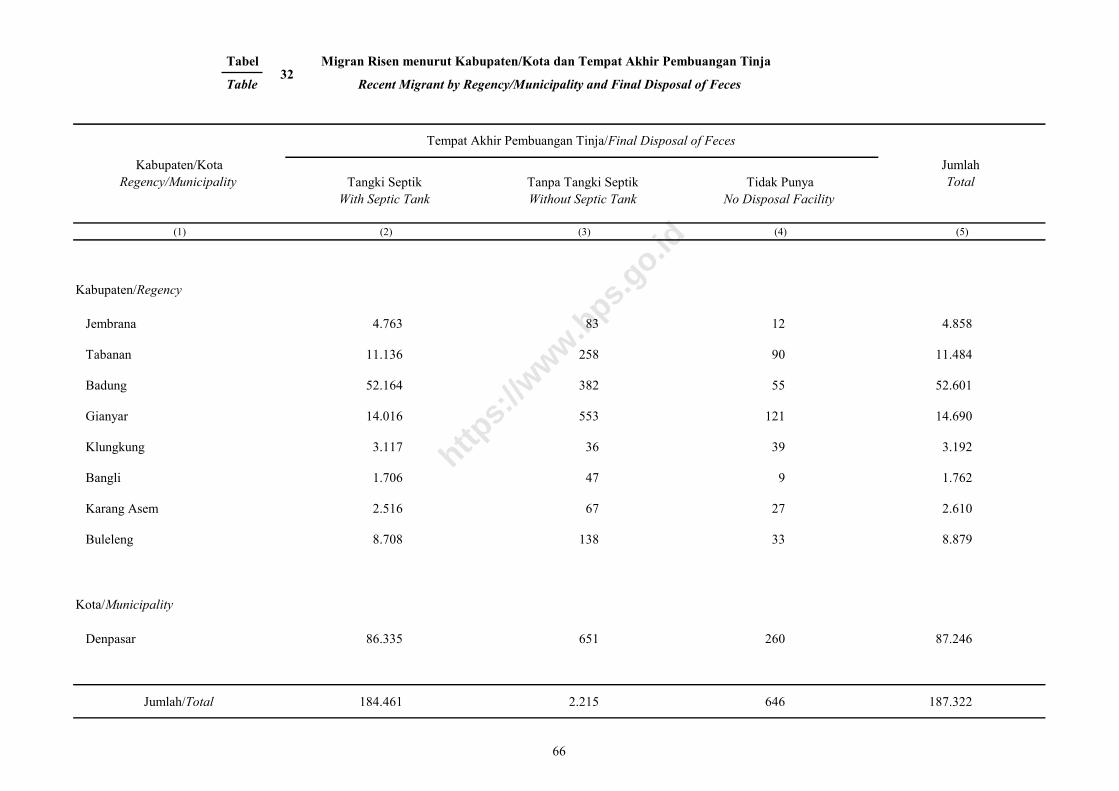
Tabel Migran Risen menurut Kabupaten/Kota dan Tempat Akhir Pembuangan Tinja
Table Recent Migrant by Regency/Municipality and Final Disposal of Feces
Tangki Septik
With Septic Tank
Tanpa Tangki Septik
Without Septic Tank
Tidak Punya
No Disposal Facility
(1) (2) (3) (4) (5)
Kabupaten/Regency
Jembrana 4.763 83 12 4.858
Tabanan 11.136 258 90 11.484
Badung 52.164 382 55 52.601
Gianyar 14.016 553 121 14.690
Klungkung 3.117 36 39 3.192
Bangli 1.706 47 9 1.762
Karang Asem 2.516 67 27 2.610
Buleleng 8.708 138 33 8.879
Kota/Municipality
Denpasar 86.335 651 260 87.246
Jumlah/Total 184.461 2.215 646 187.322
Kabupaten/Kota
Regency/Municipality
Tempat Akhir Pembuangan Tinja/Final Disposal of Feces
Jumlah
Total
32
66
https:
//www.b
ps.go.id

https:
//www.b
ps.go.id
MENCERDASKAN BANGSA
BADAN PUSAT STATISTIKJl. Dr. Sutomo No. 6-8 Jakarta 10710Telp. : (021) 3841195, 3842508, 3810291, Fax : (021) 3857046Homepage : http://www.bps.go.id Email : [email protected]
https:
//www.b
ps.go.id