Embed Size (px)
Citation preview

INTERIM REPORT2018FOR THE SIX MONTHS ENDED
31 DECEMBER 2017

Barramundi Lim
ited | Interim Rep
ort | 31 Decem
ber 2017
2CALENDARCONTENTS
This report is dated 16 March 2018 and is signed on behalf of the Board of Barramundi Limited by Alistair Ryan, Chair, and Carmel Fisher, Director.
Alistair Ryan / Chair
Carmel Fisher / Director
04 Directors’ Overview
08 Manager’s Report
13 Portfolio Holdings
14 Financial Statements Contents
15 Statement of Comprehensive Income
16 Statement of Changes in Equity
17 Statement of Financial Position
18 Statement of Cash Flows
19 Notes to the Interim Financial Statements
27 Independent Review Report
31 Directory
29 MARCH 2018
Next Dividend Payable
Financial Year End
30 JUNE 2018
Barramundi Lim
ited | Interim Rep
ort | 31 Decem
ber 2017
36 MONTHS ENDED 31 DECEMBER 2017
BEST PERFORMING INVESTMENT
+105%
DIVIDENDS PAID
29 SEPTEMBER 2017 22 DECEMBER 2017
NET PROFIT
$12.7mTOTAL SHAREHOLDER
R E T U R N
+6.7%GROSS
PERFORMANCE
RE T U RN
+14.8%
$ $$
AS AT 31 DECEMBER 2017
S H A R E P R I C E
$0.61
SHARE PRICE DISCOUNT TO NAV
11.6%(including warrant price on a pro-rated basis)$0.69
PER SHARE
1.30cents per
share
1.31cents per
share
Barramundi Lim
ited | Interim Rep
ort | 31 Decem
ber 2017
4
The second half of 2017 has been a good one for Australian equities and an even better one for Barramundi. After a somewhat sluggish start to the year, the market picked up its pace in the second half of 2017 delivering returns of 10.2%¹. Pleasingly, the Barramundi portfolio outperformed its benchmark¹ over the period generating gross performance of 14.8%.
DIRECTORS’ OVERVIEWAlistair Ryan / Chair
The strong performance of Australian equities in the second half of the year was largely driven by solid performances in the technology sector, mirroring moves overseas and also buoyed by resilient resources and a higher oil price. As we’ve discussed in the past, Barramundi’s focus on quality, growing Australian companies means typically the portfolio will have significant exposure to the technology and health sectors. This approach, coupled with good stock selection, has benefitted the portfolio over the interim period, with Barramundi generating a return 4.6% ahead of its benchmark¹. This is a positive result for shareholders who have backed the Fisher Funds STEEPP investment approach.
As a result of Barramundi’s strong portfolio performance, the healthy net profit of $12.7m was significantly up on the previous corresponding net profit of $1.1m. The key components of the 2018 interim result were gains on financial assets of $12.5m, dividend and interest income of $1.5m, a tax benefit of $0.7m, offset by operating expenses of $2.0m.
The 12 month result for Barramundi was equally attractive, with a gross performance return of 18.4% for the 12 months to 31 December 2017 compared to the benchmark¹ which was up 14.3%. This translated to a profit of $14.2m, which was significantly ahead of the $2.1m net profit for the previous corresponding period (12 months ended 31 December 2016).
As at 31 December 2017, the Barramundi portfolio was valued at $99.7m plus cash on hand of $12.6m. Barramundi’s investment philosophy is to be relatively fully invested in equities (more than 90%) so that shareholders can make their own asset/investment allocation decisions depending on how they perceive the economic outlook. Acquisitions since year end have resulted in the equity invested percentage moving back above the 90% level.
Barramundi has a number of capital initiatives in place (share buybacks, warrants programme and a managed distribution policy) designed to help
Barramundi Lim
ited | Interim Rep
ort | 31 Decem
ber 2017
5reduce the discount between share price and the net asset value of the portfolio. Nevertheless, at market close on 2 March 2018 there was still a significant gap between price ($0.60) and net asset value ($0.68). This discount does however present an opportunity for Barramundi to acquire its own shares and the company took advantage of the discount between net asset value and share price by acquiring 2.6m shares during the period.
Under the Barramundi Distribution Policy, the company continues to distribute 2.0% of average net asset value per quarter. Over the six month period to 31 December 2017, Barramundi paid 2.61 cents per share in dividends (1.30 cents per share on 29 September and 1.31 cents per share on 22 December). The next dividend will be 1.38 cents per share to be paid on 29 March 2018 with a record date of 15 March 2018. Barramundi also has a dividend reinvestment plan available which provides shareholders with the option to reinvest all or part of any cash dividends in fully paid ordinary shares. Currently, shares issued under the reinvestment plan will be issued at a 3% discount².
On 24 November 2017, 41% of Barramundi warrants were exercised and converted into shares, bringing in an additional $8.6m which has been invested across the portfolio. The Board believes warrants are viewed favourably by shareholders and we monitor a range of factors, including the discount levels, to determine the potential timing for a further warrants issue.
A good number of shareholders attended the Annual Shareholders Meeting in November 2017 where we had the opportunity to discuss Barramundi’s investment objectives, portfolio performance and respond to shareholders’ questions. Shareholders voted to re-elect Andy Coupe as an independent director of Barramundi.
Since the Annual Shareholders Meeting, Manuel Greenland announced his resignation as the portfolio manager of Barramundi. As noted in the Barramundi December monthly update, Manuel was with Fisher Funds for five years, three of which he was responsible for managing the Barramundi portfolio as the Senior Portfolio Manager. The Board wishes Manuel all the best for his future and thanks him for his efforts to restructure the Barramundi portfolio. A recruitment search is underway for Manuel’s replacement. In the meantime, Frank Jasper, Fisher Funds’ Chief Investment Officer, is responsible for the Barramundi portfolio and is well supported by equities analysts Terry Tolich (Barramundi’s Senior Investment Analyst since the company first listed on the NZX) and Delano Gallagher.
Thank you for your continued support of Barramundi.
On behalf of the Board,
Alistair Ryan, Chair Barramundi Limited 16 March 2018
¹ Benchmark index: S&P/ASX 200 Index (hedged 70% to NZD) ² To participate in the dividend reinvestment plan, a completed participation notice must be received by Barramundi
before the next record date. Full details of the dividend reinvestment plan can be found in the Barramundi Dividend Reinvestment Plan Offer Document, a copy of which is available at www.barramundi.co.nz/investor-centre/capital-management-strategies/.
DIRECTORS’ OVERVIEW

Barramundi Lim
ited | Interim Rep
ort | 31 Decem
ber 2017
6 FIGURE 1: FIVE YE AR PERFORMANCE SUMMARY
Corporate Performance
SIX MONTH PERIOD ENDED 31 DECEMBER
2017 2016 2015 2014 2013
Total Shareholder Return 6.7% 8.6% (2.7%) 4.6% 6.3%
Adjusted NAV Return 13.9% 1.1% 5.1% 1.9% (2.2%)
Dividend Return 4.4% 4.5% 4.1% 4.3% 4.7%
Net Profit After Tax / (Loss) $12.7m $1.1m $4.5m $1.7m ($2.0m)
Basic Earnings per Share 8.35cps 0.77cps 3.51cps 1.36cps -1.66cps
AS AT 31 DECEMBER 2017 2016 2015 2014 2013
NAV $0.69 $0.65 $0.70 $0.67 $0.75
Adjusted NAV $1.50 $1.30 $1.27 $1.12 $1.15
Share Price $0.61 $0.64 $0.63 $0.64 $0.69
Share Price Discount to NAV¹ 11.6% 0.9% 9.6% 4.5% 8.0%
Manager Performance
SIX MONTH PERIOD ENDED 31 DECEMBER
2017 2016 2015 2014 2013
Gross Performance Return 14.8% 2.7% 7.7% 4.1% 0.4%
Benchmark Index² 10.2% 10.6% 2.7% 1.5% 5.4%
NB: All returns have been reviewed by an independent actuary.
¹ Share price discount/(premium) to NAV (including warrant price on a pro-rated basis)
² Benchmark index: S&P/ASX Small Ords Industrial Gross Index until 30 September 2015 & S&P/ASX 200 Index (hedged 70% to NZD) from 1 October 2015
DIR ECTOR S’ OVERVIE W CONTINUED
Barramundi Lim
ited | Interim Rep
ort | 31 Decem
ber 2017
7Comparative information Barramundi’s share price discount to NAV historical information has been restated following a change in calculation methodology from using data inputs of four decimal places to two decimal places.
Non-GAAP Financial Information Barramundi uses non-GAAP measures, including adjusted net asset value, gross performance return and total shareholder return. The rationale for using such non-GAAP measures is as follows:
» adjusted net asset value – the underlying value of the investment portfolio adjusted for capital allocation decisions,
» gross performance return – the Manager’s portfolio performance in terms of stock selection and hedging of currency movements, and
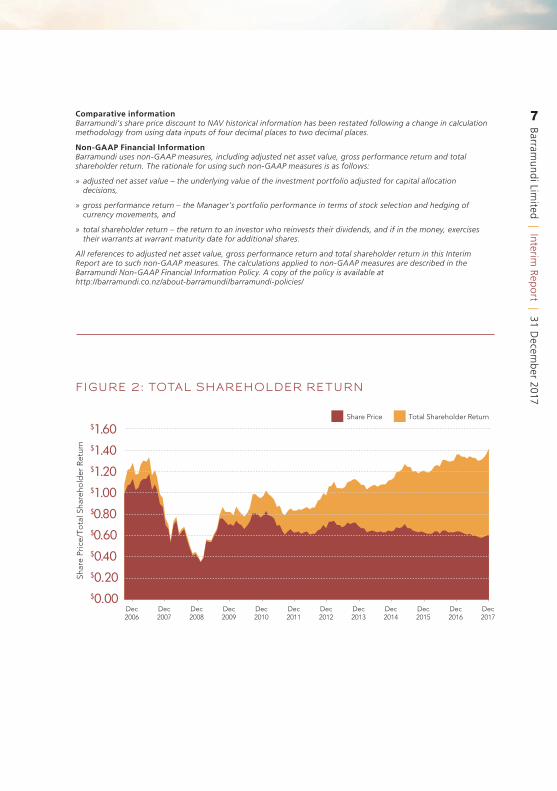
» total shareholder return – the return to an investor who reinvests their dividends, and if in the money, exercises their warrants at warrant maturity date for additional shares.
All references to adjusted net asset value, gross performance return and total shareholder return in this Interim Report are to such non-GAAP measures. The calculations applied to non-GAAP measures are described in the Barramundi Non-GAAP Financial Information Policy. A copy of the policy is available at http://barramundi.co.nz/about-barramundi/barramundi-policies/
FIGURE 2: TOTAL SHAREHOLDER RETURN
Dec2006
Dec2007
Dec2008
Dec2009
Dec2010
Dec2011
Dec2012
Dec2013
Dec2015
Dec2016
Dec2014
Shar
e Pr
ice/
Tota
l Sha
reho
lder
Ret
urn
$1.00
$1.20
$0.80$0.60$0.40
Share Price Total Shareholder Return$1.60
$0.20$0.00
$1.40
Dec2017
Barramundi Lim
ited | Interim Rep
ort | 31 Decem
ber 2017
8
Barramundi enjoyed a strong return in the second half of 2017. Driven in part by Barramundi’s investments in technology companies such as WiseTech, Carsales.com and NextDC, the portfolio delivered gross performance of 14.8% and comfortably outperformed its benchmark¹, which rose 10.2% over the same time period. It was a pleasing end to what has been a strong year for Barramundi which enjoyed a rise in its adjusted net asset value of 13.9% over the six months to 31 December 2017.
MANAGER’S REPORT
While Australia doesn’t have a technology sector as broad and deep as the United States it does have a number of technology companies that are competing on the international stage. Barramundi has exposure to a number of these companies whose performance enhanced Barramundi’s returns over the period. The top three contributors to Barramundi’s return over the six months were technology-based firms – Wisetech (+105%), Carsales.com (+28%) and NextDC (+44%). The other key contributor to returns over the period was long time portfolio holding ToxFree Solutions (47%), which received an attractive takeover offer from listed waste management firm Cleanaway in December.
MARKET ENVIRONMENT 2017 was the first year in over a decade where every country in the OECD was growing, with growth rates in a majority of those countries inflecting higher.
Investors have embraced this resurgent economic growth outlook. Over the course of 2017, we saw share prices pushed higher and markets around the globe performing impressively. Australia was no exception. The S&P/ASX 200 rose 11.8% (in Australian dollar terms including dividends for the year), up an impressive 8.4% over the last six months. With this economic backdrop, sectors most sensitive to growth performed most strongly. The energy and materials sectors, which
Frank Jasper / Chief Investment Officer
1 Benchmark index: S&P/ASX 200 Index (hedged 70% to NZD)

Barramundi Lim
ited | Interim Rep
ort | 31 Decem
ber 2017
9include Australia’s heavyweight resources companies, led the way, benefitting from increased demand for basic commodities and a higher oil price.
One of the consequences of increased global economic activity is higher interest rates. Sectors of the share market that act as high yielding alternatives to fixed income investments, like shares in real estate companies or high yielding utilities, tend to perform poorly as interest rates rise. Such dynamic is precisely what we saw in the second half of 2017, with the telecommunications and utilities sectors lagging over the half.
Barramundi’s focus on high quality, growing companies means we typically sit between these two extremes. We prefer companies that can grow earnings regardless of the strength of the economy. Similarly, we don’t focus on buying high dividend payers simply to get exposure to income. The ideal investment for Barramundi is a high quality company led by management with a clear strategic vision and the ability to grow earnings over the long term.
A strong economic environment is often not the most supportive of our investment style given that investor attention is often focused on more economically sensitive companies. It was pleasing we were able to identify enough attractive opportunities that fit well with the STEEPP investment framework that delivered sound investment performance over the period.
COMPANY NEWS At the heart of our STEEPP investment process is the idea that investing in quality, growing companies will generate market beating returns over the medium term. One of the key avenues for growth that many companies employ is acquiring other companies either to add new customers or to bring new products or competencies to the firm.
While this is an important avenue for growth, it is a strategy that comes with risk. It can be challenging to consolidate acquired companies. Ensuring alignment of potentially diverse corporate cultures is invariably more difficult than it appears. Data gathered over thousands of acquisitions around the world suggests that smaller “tuck in” style acquisitions are typically more successful than large scale, transformative “hero” transactions. Our observations based on companies we have owned would support this.
We are therefore comfortable owning companies that pursue active, but measured, acquisition strategies as an element of their growth algorithm.
Over the period a number of the companies in the Barramundi portfolio made acquisitions that we believe will enhance the strength, quality and growth prospects of their businesses over the medium term.
In 2014 Carsales.com acquired a 49.9% stake in South Korean company SK Encar. SK Encar owns and operates
MANAGER’S REPORT

Barramundi Lim
ited | Interim Rep
ort | 31 Decem
ber 2017
10 the leading South Korean automotive classifieds website. Over the period, Carsales acquired the remaining 50.1% of SK Encar that it didn’t own. This was a strategically important move for Carsales. Not only does it give the company more exposure to the rapidly growing South Korean online car market but with full control Carsales can pivot the Encar business model towards pay per lead which we believe will result in material earnings upside.
Credit Corp is Australia’s leading purchaser of defaulted debt ledgers, primarily from the banks. It collects these debts along the way generating healthy returns for shareholders. CEO Thomas Beregi has done a wonderful job adding to this market leading position by building an early stage, but rapidly scaling, business in the United States that similarly purchases defaulted debt. Closer to home he has developed a lending business for credit impaired consumers. This has been a very successful initiative. Over the period, Credit Corp added to this business buying “Cash First” from Thorn Group. Cash First provides small unsecured personal loans and cash advances to customers. This is a classic “tuck in” acquisition that fits well within Credit Corp’s core competence.
Wisetech has a clearly articulated acquisition strategy that involves tucking in smaller local logistics and customs offerings in markets where Wisetech
is seeking to build depth. Wisetech’s approach is then to port the acquired technology and customers over its core CargoWise One platform. This is a strategically sound approach in our view and means that CargoWise One builds additional scale, customer reach and functionality, further widening Wisetech’s moat. Over the half, Wisetech announced no fewer than 10 acquisitions in a range of countries. These were typically smaller companies that fit well with the “tuck in” philosophy discussed above. We continue to be very comfortable with Wisetech’s business momentum and strategic execution.
The other major news for the quarter was a takeover offer for long term Barramundi portfolio company, ToxFree Solutions. Barramundi’s investment in ToxFree has been a somewhat bumpy ride as ToxFree’s earnings were greatly impacted by a slowdown in resources and oil and gas activity over the past few years. However, ToxFree’s management fought back from that challenge, pivoting the business towards medical waste with the Daniels acquisition and in the process restored significant shareholder value. In December, listed waste management firm Cleanaway made an attractive offer to take over ToxFree. It was pleasing to see ToxFree’s strategy, and our patience, rewarded with the company acquired at a healthy premium; an outcome that we had long thought was likely.
MANAGER ’ S R EPORT CONTINUED

Barramundi Lim
ited | Interim Rep
ort | 31 Decem
ber 2017
11PORTFOLIO CHANGES We added one new company to the Barramundi portfolio in the six months to 31 December 2017. NextDC develops and operates multi-tenant, carrier neutral, secure and scalable data centres. NextDC’s data centres host the internet and computing capacity for a number of Australia’s leading companies, but more importantly they provide fast, cheap and easy access to a rich interconnect ecosystem. This enables companies to more cost effectively deliver fast, content rich applications both for internal and external use. Datacentres play a crucial role in the modern cloud centric internet.
Our investment thesis for NextDC is predicated on its strong market position in Australia, the richness of its interconnected environment, which confers a wide moat on the company, the rapid movement of corporate IT volumes to the cloud and away from on premise solutions and increasing demand for carrier neutral datacentres in preference to those owned by telecommunication or IT services companies. NextDC is a high quality business with a strong multiyear growth outlook.
Over the period, as discussed in the 2017 Annual Report, we exited the portfolio’s investments in Baby Bunting and Reliance Worldwide. Later in the year, we also made the decision to exit the investment in private health insurance provider Medibank. Our decision to exit Medibank was predicated on a
disappointing health insurance reform package announced by the government that intends to make health insurance “simpler and more affordable”. We felt this reform was unlikely to encourage increased participation of younger people in the health insurance market. Participation of this demographic is needed to improve the long term sustainability of the system. This dynamic, along with constant healthcare cost inflation, is bad news for insurers. Selling Medibank was the obvious outcome in our view.
OUTLOOKWe think 2018 will echo many of the same themes that were evident in the Australian economy and equity market over 2017. While we think Australia will likely lag the resurgent global economy, we do expect it to continue posting sound economic growth. However, as was the case in 2017, such growth varies across the economy.
Although employment growth is strong, Australian consumers remain over geared and with house price growth slowing and wages flat, they are disinclined to spend. This trend is not particularly supportive of a stronger domestic economy.
Businesses, on the other hand, are much more upbeat. Where they are exposed to export markets, companies are benefitting from stronger economic growth in the rest of the world. The fact that the Reserve Bank of Australia looks set to hold interest rates at current low
Barramundi Lim
ited | Interim Rep
ort | 31 Decem
ber 2017
12 2. Selected domestic exposures benefitting from higher business confidence – business confidence is close to all-time highs and companies are increasing investment in both capital projects and staff. Barramundi’s investments including APN Outdoor, AUB Group, Ooh Media and Seek are all well positioned to benefit from this.
3. Disruption – disruption to existing business models by innovative firms is an important theme not just in Australia but also globally. Nanosonics, Technology One and Wisetech are global leaders in replacing legacy processes in their respective areas of focus. These are exciting long term opportunities for Barramundi.
4. The rest – the balance of the portfolio doesn’t so neatly fit into one of these themes but consists of high quality businesses with healthy medium term growth outlooks that we believe will enhance returns over the next year.
Frank Jasper, Chief Investment Officer Fisher Funds Management Limited 16 March 2018
levels and that wage growth is muted adds to confidence. This renewed energy is giving companies the impetus to invest in growth, which we see in the capital expenditure numbers, and in M&A activity, both of which have been picking up recently.
While our views on the Australian economy don’t drive how we select shares for Barramundi, they are an input into our research process. Ultimately, the health of the economy flows through to company earnings and it’s the long run outlook for company earnings that is at the heart of the STEEPP investment process.
That said, it is interesting to look at Barramundi through the lens of key themes rather than just as a collection of individual stocks. The way the portfolio fits into those thematic “buckets” dovetails well with our broad economic and market outlook and gives us confidence in how the Barramundi portfolio is positioned for the year ahead.
1. Offshore earners – the global economy is experiencing synchronised economic growth for the first time in 12 years. While Australia is growing, we expect it will lag the rest of the world, making exposure to companies that generate earnings offshore appealing. Barramundi has investments in a number of offshore earners. In particular, companies like Ansell, ARB and Brambles benefit from more economic activity offshore while healthcare providers Ramsay Healthcare, Resmed, Sonic and CSL all gain if the Australian dollar weakens, as we suspect it might.
MANAGER ’ S R EPORT CONTINUED
Barramundi Lim
ited | Interim Rep
ort | 31 Decem
ber 2017
13
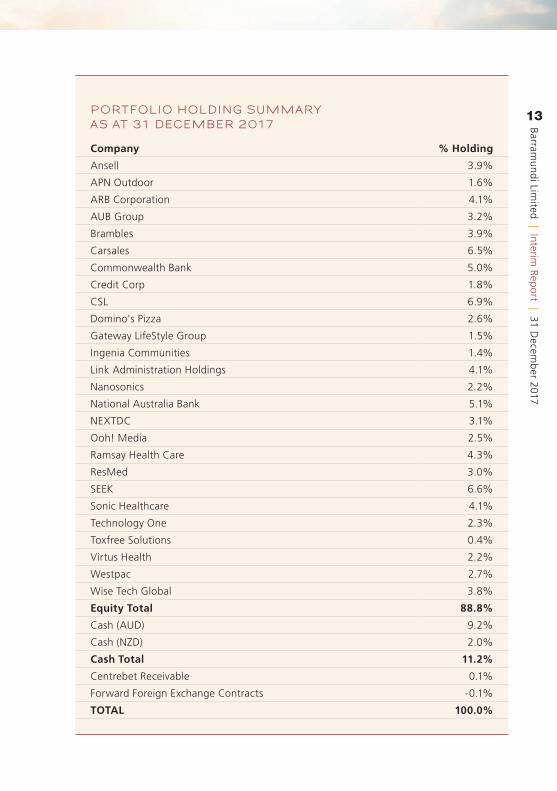
Company % Holding
Ansell 3.9%
APN Outdoor 1.6%
ARB Corporation 4.1%
AUB Group 3.2%
Brambles 3.9%
Carsales 6.5%
Commonwealth Bank 5.0%
Credit Corp 1.8%
CSL 6.9%
Domino's Pizza 2.6%
Gateway LifeStyle Group 1.5%
Ingenia Communities 1.4%
Link Administration Holdings 4.1%
Nanosonics 2.2%
National Australia Bank 5.1%
NEXTDC 3.1%
Ooh! Media 2.5%
Ramsay Health Care 4.3%
ResMed 3.0%
SEEK 6.6%
Sonic Healthcare 4.1%
Technology One 2.3%
Toxfree Solutions 0.4%
Virtus Health 2.2%
Westpac 2.7%
Wise Tech Global 3.8%
Equity Total 88.8%
Cash (AUD) 9.2%
Cash (NZD) 2.0%
Cash Total 11.2%
Centrebet Receivable 0.1%
Forward Foreign Exchange Contracts -0.1%
TOTAL 100.0%
PORTFOLIO HOLDING SUMMARY AS AT 31 DECEMBER 2017

Barramundi Lim
ited | Interim Rep
ort | 31 Decem
ber 2017
14FINANCIAL STATEMENTS
CONTENTS
15 Statement of Comprehensive Income
16 Statement of Changes in Equity
17 Statement of Financial Position
18 Statement of Cash Flows
19 Notes to the Interim Financial Statements

Barramundi Lim
ited | Interim Rep
ort | 31 Decem
ber 2017
15
The Notes to the Interim Financial Statements set out on pages 19 to 26 should be read in conjunction with this Statement of Comprehensive Income.
BAR R AMUNDI LIMITED
FOR THE SIX MONTHS ENDED 31 DECEMBER 2017STATEMENT OF COMPREHENSIVE INCOME
NOTES
6 MONTHSENDED
31/12/17UNAUDITED
6 MONTHSENDED
31/12/16UNAUDITED
$000 $000
Interest income 52 69
Dividend income 1,386 1,236
Other income/(losses) 1(i) 127 (131)
Net changes in fair value of financial assets and liabilities 1(ii) 12,404 1,500
Total net income 13,969 2,674
Operating expenses 1(iii) (2,029) (1,261)
Operating profit before tax 11,940 1,413
Tax income/(expense) 719 (300)
Net operating profit after tax attributable to shareholders
12,659 1,113
Other comprehensive income 0 0
Total comprehensive profit after tax attributable to shareholders
12,659 1,113
Earnings per shareBasic earnings per shareProfit attributable to owners of the company ($000) 12,659 1,113
Weighted average number of ordinary shares on issue net of treasury stock ('000)
151,562 145,051
Basic earnings per share 8.35c 0.77c
Diluted earnings per shareProfit attributable to owners of the company ($000) 12,659 1,113
Weighted average number of ordinary shares on issue net of treasury stock ('000)
151,562 145,051
Diluted effect of warrants on issue ('000) 494 289
152,056 145,340
Diluted earnings per share 8.33c 0.77c
Barramundi Lim
ited | Interim Rep
ort | 31 Decem
ber 2017
16
The Notes to the Interim Financial Statements set out on pages 19 to 26 should be read in conjunction with this Statement of Changes in Equity.
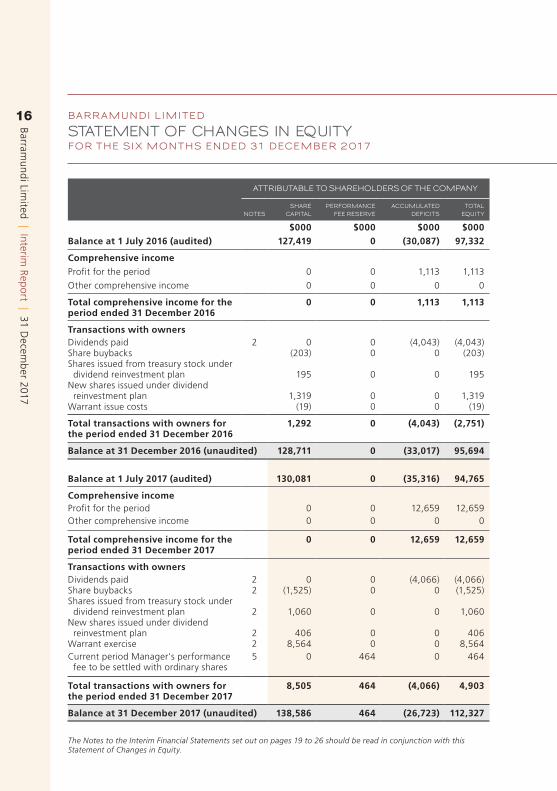
BAR R AMUNDI LIMITED
FOR THE SIX MONTHS ENDED 31 DECEMBER 2017STATEMENT OF CHANGES IN EQUITY
ATTRIBUTABLE TO SHAREHOLDERS OF THE COMPANY
NOTESSHARE
CAPITALPERFORMANCE
FEE RESERVEACCUMULATED
DEFICITSTOTAL
EQUITY
$000 $000 $000 $000Balance at 1 July 2016 (audited) 127,419 0 (30,087) 97,332
Comprehensive incomeProfit for the period 0 0 1,113 1,113
Other comprehensive income 0 0 0 0
Total comprehensive income for the period ended 31 December 2016
0 0 1,113 1,113
Transactions with ownersDividends paid 2 0 0 (4,043) (4,043)Share buybacks (203) 0 0 (203)Shares issued from treasury stock under dividend reinvestment plan 195 0 0 195 New shares issued under dividend reinvestment plan 1,319 0 0 1,319 Warrant issue costs (19) 0 0 (19)
Total transactions with owners for the period ended 31 December 2016
1,292 0 (4,043) (2,751)
Balance at 31 December 2016 (unaudited) 128,711 0 (33,017) 95,694
Balance at 1 July 2017 (audited) 130,081 0 (35,316) 94,765
Comprehensive incomeProfit for the period 0 0 12,659 12,659 Other comprehensive income 0 0 0 0
Total comprehensive income for the period ended 31 December 2017
0 0 12,659 12,659
Transactions with ownersDividends paid 2 0 0 (4,066) (4,066)Share buybacks 2 (1,525) 0 0 (1,525)Shares issued from treasury stock under dividend reinvestment plan 2 1,060 0 0 1,060 New shares issued under dividend reinvestment plan 2 406 0 0 406 Warrant exercise 2 8,564 0 0 8,564 Current period Manager's performance fee to be settled with ordinary shares
5 0 464 0 464
Total transactions with owners for the period ended 31 December 2017
8,505 464 (4,066) 4,903
Balance at 31 December 2017 (unaudited) 138,586 464 (26,723) 112,327

Barramundi Lim
ited | Interim Rep
ort | 31 Decem
ber 2017
17STATEMENT OF CHANGES IN EQUITY
The Notes to the Interim Financial Statements set out on pages 19 to 26 should be read in conjunction with this Statement of Financial Position.
BAR R AMUNDI LIMITED
A S AT 31 DECEMBER 2017STATEMENT OF FINANCIAL POSITION
NOTES31/12/17
UNAUDITED 30/06/17
AUDITED
ASSETS $000 $000Current AssetsCash and cash equivalents 12,613 7,703 Trade and other receivables 183 234 Financial assets at fair value through profit or loss 3 99,653 88,343 Current tax receivable 1 0
Deferred tax asset 710 0
Total Current Assets 113,160 96,280
Non-current AssetsOther receivable 0 186
Total Non-current Assets 0 186
TOTAL ASSETS 113,160 96,466
LIABILITIESCurrent Liabilities Trade and other payables 640 1,144 Financial liabilities at fair value through profit or loss 3 193 10
Current tax payable 0 513
Total Current Liabilities 833 1,667
Non-current Liabilities
Deferred tax liability 0 34
Total Non-Current Liabilities 0 34
TOTAL LIABILITIES 833 1,701
EQUITYShare capital 2 138,586 130,081 Performance fee reserve 5 464 0 Accumulated deficits (26,723) (35,316)
TOTAL EQUITY 112,327 94,765
TOTAL EQUITY AND LIABILITIES 113,160 96,466
These interim financial statements have been authorised for issue for and on behalf of the Board by:
A B Ryan — Chair C A Campbell — Chair of the Audit and Risk Committee 19 February 2018 19 February 2018
Barramundi Lim
ited | Interim Rep
ort | 31 Decem
ber 2017
18
The Notes to the Interim Financial Statements set out on pages 19 to 26 should be read in conjunction with this Statement of Cash Flows.
BAR R AMUNDI LIMITED
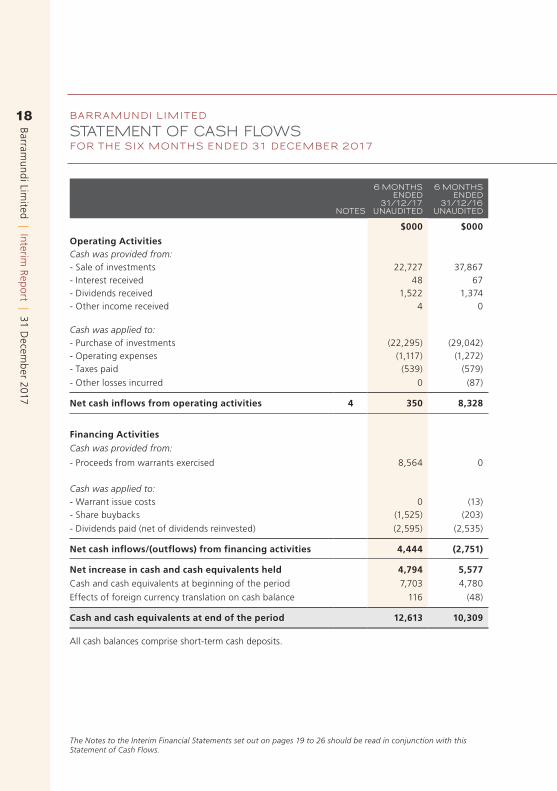
FOR THE SIX MONTHS ENDED 31 DECEMBER 2017STATEMENT OF CASH FLOWS
NOTES
6 MONTHSENDED
31/12/17UNAUDITED
6 MONTHSENDED
31/12/16UNAUDITED
$000 $000
Operating ActivitiesCash was provided from:- Sale of investments 22,727 37,867 - Interest received 48 67 - Dividends received 1,522 1,374 - Other income received 4 0 Cash was applied to:- Purchase of investments (22,295) (29,042)- Operating expenses (1,117) (1,272)- Taxes paid (539) (579)
- Other losses incurred 0 (87)
Net cash inflows from operating activities 4 350 8,328
Financing ActivitiesCash was provided from:
- Proceeds from warrants exercised 8,564 0
Cash was applied to:- Warrant issue costs 0 (13)- Share buybacks (1,525) (203)
- Dividends paid (net of dividends reinvested) (2,595) (2,535)
Net cash inflows/(outflows) from financing activities 4,444 (2,751)
Net increase in cash and cash equivalents held 4,794 5,577 Cash and cash equivalents at beginning of the period 7,703 4,780
Effects of foreign currency translation on cash balance 116 (48)
Cash and cash equivalents at end of the period 12,613 10,309
All cash balances comprise short-term cash deposits.
Barramundi Lim
ited | Interim Rep
ort | 31 Decem
ber 2017
19
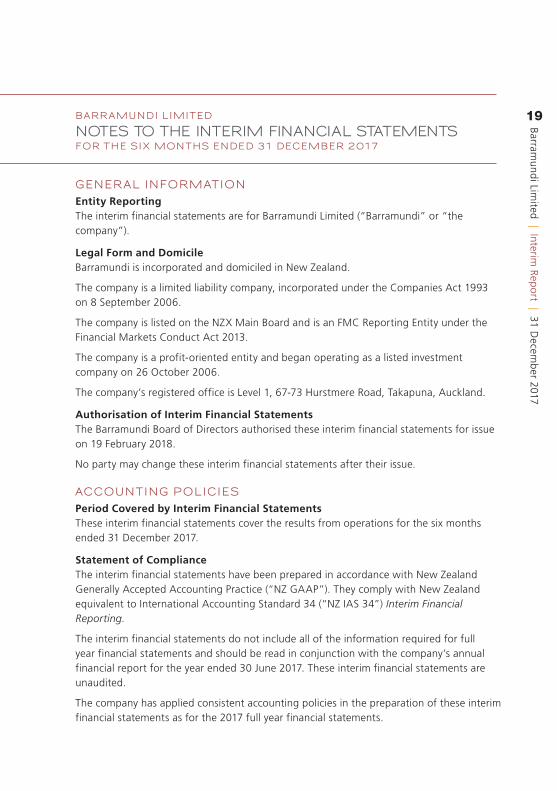
GENER AL INFORMATION
Entity ReportingThe interim financial statements are for Barramundi Limited (“Barramundi” or “the company”).
Legal Form and Domicile Barramundi is incorporated and domiciled in New Zealand.
The company is a limited liability company, incorporated under the Companies Act 1993 on 8 September 2006.
The company is listed on the NZX Main Board and is an FMC Reporting Entity under the Financial Markets Conduct Act 2013.
The company is a profit-oriented entity and began operating as a listed investment company on 26 October 2006.
The company’s registered office is Level 1, 67-73 Hurstmere Road, Takapuna, Auckland.
Authorisation of Interim Financial StatementsThe Barramundi Board of Directors authorised these interim financial statements for issue on 19 February 2018.
No party may change these interim financial statements after their issue.
ACCOUNTING POLICIES
Period Covered by Interim Financial StatementsThese interim financial statements cover the results from operations for the six months ended 31 December 2017.
Statement of ComplianceThe interim financial statements have been prepared in accordance with New Zealand Generally Accepted Accounting Practice (“NZ GAAP”). They comply with New Zealand equivalent to International Accounting Standard 34 (“NZ IAS 34”) Interim Financial Reporting.
The interim financial statements do not include all of the information required for full year financial statements and should be read in conjunction with the company’s annual financial report for the year ended 30 June 2017. These interim financial statements are unaudited.
The company has applied consistent accounting policies in the preparation of these interim financial statements as for the 2017 full year financial statements.
BAR R AMUNDI LIMITED
FOR THE SIX MONTHS ENDED 31 DECEMBER 2017NOTES TO THE INTERIM FINANCIAL STATEMENTS
BAR R AMUNDI LIMITED
FOR THE SIX MONTHS ENDED 31 DECEMBER 2017
NOTES TO THE INTERIM FINANCIAL STATEMENTS CONTINUED
Barramundi Lim
ited | Interim Rep
ort | 31 Decem
ber 2017
20
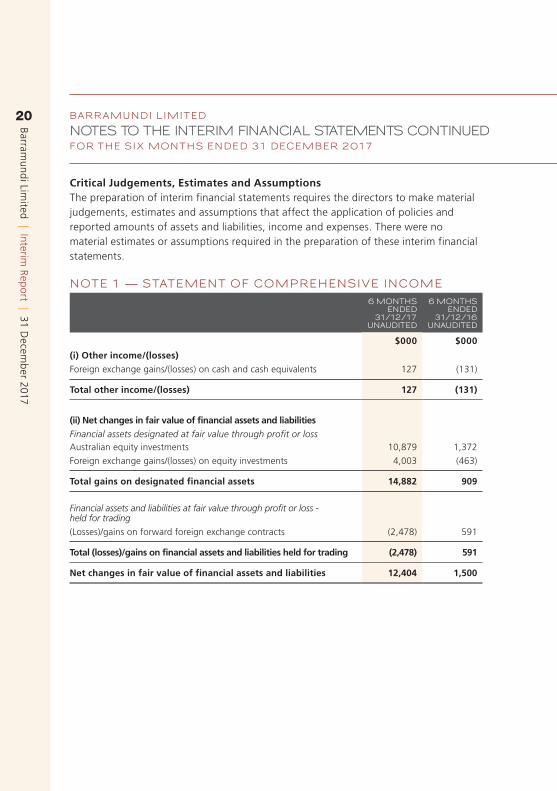
Critical Judgements, Estimates and Assumptions The preparation of interim financial statements requires the directors to make material judgements, estimates and assumptions that affect the application of policies and reported amounts of assets and liabilities, income and expenses. There were no material estimates or assumptions required in the preparation of these interim financial statements.
NOTE 1 — STATEMENT OF COMPREHENSIVE INCOME
6 MONTHSENDED
31/12/17UNAUDITED
6 MONTHSENDED
31/12/16UNAUDITED
$000 $000
(i) Other income/(losses)Foreign exchange gains/(losses) on cash and cash equivalents 127 (131)
Total other income/(losses) 127 (131)
(ii) Net changes in fair value of financial assets and liabilitiesFinancial assets designated at fair value through profit or lossAustralian equity investments 10,879 1,372
Foreign exchange gains/(losses) on equity investments 4,003 (463)
Total gains on designated financial assets 14,882 909
Financial assets and liabilities at fair value through profit or loss - held for trading
(Losses)/gains on forward foreign exchange contracts (2,478) 591
Total (losses)/gains on financial assets and liabilities held for trading (2,478) 591
Net changes in fair value of financial assets and liabilities 12,404 1,500

NOTES TO THE INTERIM FINANCIAL STATEMENTS CONTINUED
Barramundi Lim
ited | Interim Rep
ort | 31 Decem
ber 2017
21
NOTE 1 — STATEMENT OF COMPREHENSIVE INCOME CONTINUED
6 MONTHSENDED
31/12/17UNAUDITED
6 MONTHSENDED
31/12/16UNAUDITED
$000 $000
(iii) Operating ExpensesManagement fees (note 5) 659 714
Performance fees (note 5) 941 0
Administration services (note 5) 79 80
Directors' fees (note 5) 60 72
Custody, brokerage and transaction fees 155 241
Investor relations and communications 69 76
NZX fees 21 20
Fees paid to the auditor:
Statutory audit and review of financial statements 17 17
Non-assurance services 0 2
Professional fees 14 24
Other operating expenses 14 15
Total operating expenses 2,029 1,261
Non-assurance services relate to annual shareholders meeting procedures. No other fees were paid to the auditor during the period (31 December 2016: nil).
BAR R AMUNDI LIMITED
FOR THE SIX MONTHS ENDED 31 DECEMBER 2017
NOTES TO THE INTERIM FINANCIAL STATEMENTS CONTINUED
Barramundi Lim
ited | Interim Rep
ort | 31 Decem
ber 2017
22
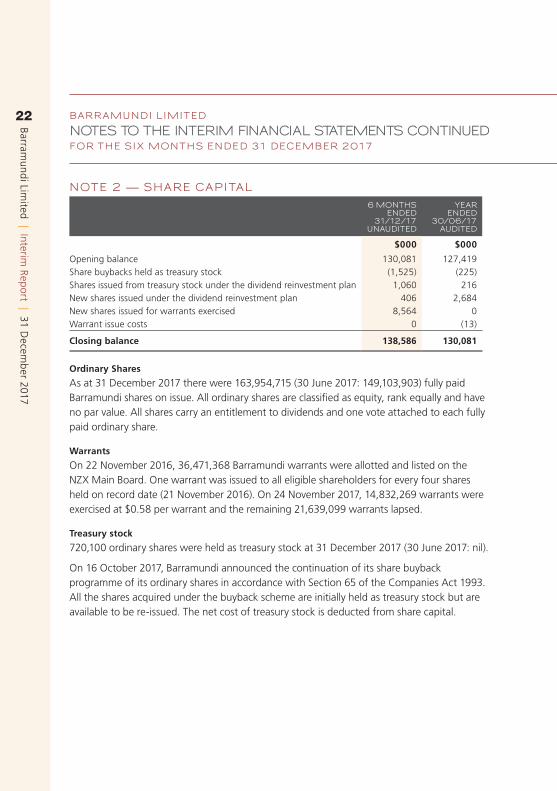
NOTE 2 — SHARE CAPITAL
6 MONTHSENDED
31/12/17UNAUDITED
YEAR ENDED
30/06/17 AUDITED
$000 $000
Opening balance 130,081 127,419 Share buybacks held as treasury stock (1,525) (225)Shares issued from treasury stock under the dividend reinvestment plan 1,060 216 New shares issued under the dividend reinvestment plan 406 2,684 New shares issued for warrants exercised 8,564 0 Warrant issue costs 0 (13)
Closing balance 138,586 130,081
Ordinary Shares
As at 31 December 2017 there were 163,954,715 (30 June 2017: 149,103,903) fully paid Barramundi shares on issue. All ordinary shares are classified as equity, rank equally and have no par value. All shares carry an entitlement to dividends and one vote attached to each fully paid ordinary share.
Warrants
On 22 November 2016, 36,471,368 Barramundi warrants were allotted and listed on the NZX Main Board. One warrant was issued to all eligible shareholders for every four shares held on record date (21 November 2016). On 24 November 2017, 14,832,269 warrants were exercised at $0.58 per warrant and the remaining 21,639,099 warrants lapsed.
Treasury stock
720,100 ordinary shares were held as treasury stock at 31 December 2017 (30 June 2017: nil).
On 16 October 2017, Barramundi announced the continuation of its share buyback programme of its ordinary shares in accordance with Section 65 of the Companies Act 1993. All the shares acquired under the buyback scheme are initially held as treasury stock but are available to be re-issued. The net cost of treasury stock is deducted from share capital.

NOTES TO THE INTERIM FINANCIAL STATEMENTS CONTINUED
Barramundi Lim
ited | Interim Rep
ort | 31 Decem
ber 2017
23
Dividends
Barramundi has a distribution policy where 2% of average NAV is distributed each quarter. Total dividends per share for the period ended 31 December 2017 were 2.61 cents per share (31 December 2016: 2.79 cents per share). Dividends paid for the period ended 31 December 2017, prior to any reinvestment, totalled $4,065,528 (31 December 2016: $4,043,464). Dividends paid for the period ended 31 December 2017 were 1.30 cents per share on 29 September 2017 and 1.31 cents per share on 22 December 2017.
Dividend reinvestment plan Barramundi has a dividend reinvestment plan which provides ordinary shareholders with the option to reinvest all or part of any cash dividends in fully paid ordinary shares at a 3% discount. During the period ended 31 December 2017, 1,470,887 ordinary shares (December 2016: 2,451,733 ordinary shares) were issued in relation to the plan for the quarterly dividends paid. To participate in the dividend reinvestment plan, a completed participation notice must be received by Barramundi before the next record date.
NOTE 3 — FINANCIAL A SSETS AND LIABILITIES AT FAIR VALUE THROUGH PROFIT OR LOSS
31/12/17UNAUDITED
30/06/17 AUDITED
$000 $000
Financial assets designated at fair value through profit or loss
Australian listed equity investments 99,653 88,343
Total financial assets at fair value through profit or loss 99,653 88,343
Financial liabilities at fair value through profit or loss - held for trading
Fair value of forward foreign exchange contracts 193 10
Total financial liabilities at fair value through profit or loss 193 10
Although Australian listed equity investments are treated as current assets from an accounting point of view, the investment strategy of the company is to hold for the medium to long-term.
Australian listed equity investments designated at fair value through profit or loss are valued using last sale prices from an active market and are classified as Level 1 in the fair value hierarchy.
Forward foreign exchange contracts are valued using observable market prices (as they are not quoted), and they are classified as Level 2 in the fair value hierarchy. The notional value of forward foreign exchange contracts held at 31 December 2017 was $61,890,559 (30 June 2017: $50,191,641).
BAR R AMUNDI LIMITED
FOR THE SIX MONTHS ENDED 31 DECEMBER 2017
NOTES TO THE INTERIM FINANCIAL STATEMENTS CONTINUED
Barramundi Lim
ited | Interim Rep
ort | 31 Decem
ber 2017
24
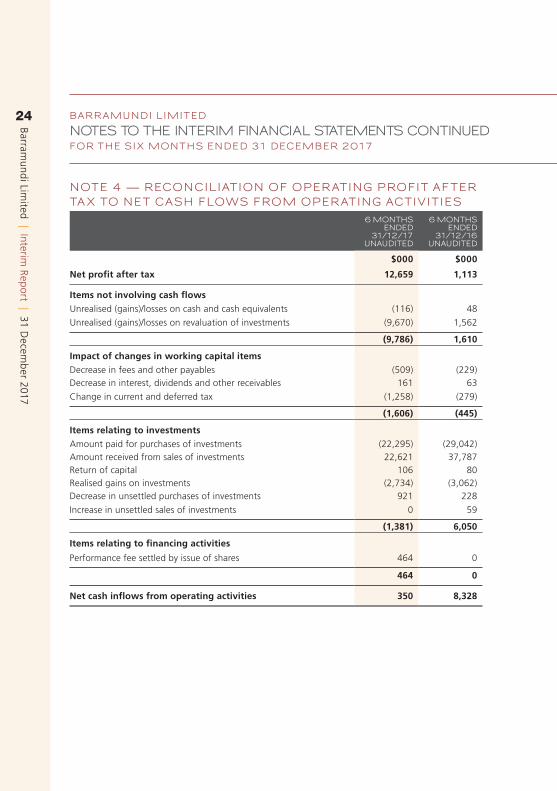
NOTE 4 — RECONCILIATION OF OPER ATING PROFIT AFTER TA X TO NET CA SH FLOWS FROM OPER ATING ACTIVITIES
6 MONTHS ENDED
31/12/17 UNAUDITED
6 MONTHS ENDED
31/12/16 UNAUDITED
$000 $000
Net profit after tax 12,659 1,113
Items not involving cash flowsUnrealised (gains)/losses on cash and cash equivalents (116) 48
Unrealised (gains)/losses on revaluation of investments (9,670) 1,562
(9,786) 1,610
Impact of changes in working capital itemsDecrease in fees and other payables (509) (229)Decrease in interest, dividends and other receivables 161 63
Change in current and deferred tax (1,258) (279)
(1,606) (445)
Items relating to investmentsAmount paid for purchases of investments (22,295) (29,042)Amount received from sales of investments 22,621 37,787 Return of capital 106 80 Realised gains on investments (2,734) (3,062)Decrease in unsettled purchases of investments 921 228
Increase in unsettled sales of investments 0 59
(1,381) 6,050
Items relating to financing activities
Performance fee settled by issue of shares 464 0
464 0
Net cash inflows from operating activities 350 8,328

NOTES TO THE INTERIM FINANCIAL STATEMENTS CONTINUED
Barramundi Lim
ited | Interim Rep
ort | 31 Decem
ber 2017
25
NOTE 5 — REL ATED PART Y INFORMATIONParties are considered to be related if one party has the ability to control or exercise significant influence over the other party in making financial or operational decisions.
The Manager of Barramundi is Fisher Funds Management Limited (“Fisher Funds” or “the Manager”). Fisher Funds is a related party by virtue of the Management Agreement and having a director in common.
The Management Agreement with Fisher Funds provides for the provisional payment of a management fee equal to 1.25% (plus GST) per annum of the gross asset value, calculated weekly and payable monthly in arrears. This management fee is reduced by 0.10% for each 1.0% per annum by which the Gross Return achieved on the portfolio during each financial year is less than the change in the NZ 90 Day Bank Bill Index over the same period but subject to a minimum management fee of 0.75% (plus GST) per annum of the average gross asset value for that period. The annual management fee is finalised at 30 June each year and any adjustment (where the management fee is less than 1.25%) is offset against future management fee payments due to Fisher Funds. For the six months ended 31 December 2017, no management fee adjustment was necessary (31 December 2016: no adjustment). Management fees for the six months ended 31 December 2017 totalled $658,543 (31 December 2016: $714,173).
A performance fee may be earned by the Manager provided the performance fee hurdle and a high water mark test have been met. A performance fee of $941,241 has been accrued for the six months ended 31 December 2017 (31 December 2016: nil and 30 June 2017: nil). This performance fee will only be payable if the performance criteria are met for the whole year.
In accordance with the terms of the Management Agreement, half of any performance fee payable (exclusive of GST) will be applied by the Manager to subscribe for shares in Barramundi, issued at a price equal to the volume weighted average traded price of ordinary shares over the last five trading days ended 30 June 2018. Included in trade and other payables is a provision of $477,575 (31 December 2016: nil and 30 June 2017: nil) for the performance fee, being the net of the total fee of $941,241 (31 December 2016: nil and 30 June 2017: nil) less the amount expected to be settled in shares of $463,666 (31 December 2016: nil and 30 June 2017: nil) which is included in the performance fee reserve. Full details of the performance fee calculation methodology are included in the Barramundi annual report for the year ended 30 June 2017.
Barramundi Lim
ited | Interim Rep
ort | 31 Decem
ber 2017
26
NOTE 5 — REL ATED PART Y INFORMATION CONTINUEDFisher Funds provides administration services to Barramundi and during the six months ended 31 December 2017 payments totaling $79,350 were made (31 December 2016: $80,002).
The amount payable to Fisher Funds at 31 December 2017 in respect of management fees, performance fees to be paid in cash and administration services was $610,991 (31 December 2016: $129,185 and 30 June 2017: $126,194).
Fisher Funds held shares in the company at 31 December 2017 which total 0.36% of the total shares on issue (31 December 2016: 0.40% of the total shares on issue and 0.41% of the total warrants on issue and 30 June 2017: 0.40% of the total shares on issue and 0.41% of the total warrants on issue). Dividends were also received by Fisher Funds as a result of its shareholding.
The directors of Barramundi are the only key management personnel as defined by NZ IAS 24 Related Party Disclosures and they earn a fee for their services which is disclosed in note 1(iii) under directors’ fees (only independent directors earn a director’s fee). The directors also held shares in the company at 31 December 2017 which total 1.23% of total shares on issue (31 December 2016: 1.08% of the total shares on issue and 1.49% of the total warrants on issue and 30 June 2017: 1.07% of the total shares on issue and 1.09% of the total warrants on issue). Dividends were also received by the directors as a result of their shareholding. The directors did not receive any other benefits which may have necessitated disclosure under NZ IAS 24.
NOTE 6 — NET A SSET VALUEThe unaudited net asset value of Barramundi as at 31 December 2017 was $0.69 per share (31 December 2016: $0.65 per share unaudited, 30 June 2017: $0.64 per share audited).
NOTE 7 — SUBSEQUENT EVENTSOn 19 February 2018 the Board declared a dividend of 1.38 cents per share. The record date for this dividend is 15 March 2018 with a payment date of 29 March 2018.
There were no other events which require adjustment to or disclosure in these interim financial statements.
BAR R AMUNDI LIMITED
FOR THE SIX MONTHS ENDED 31 DECEMBER 2017
NOTES TO THE INTERIM FINANCIAL STATEMENTS CONTINUED

Barramundi Lim
ited | Interim Rep
ort | 31 Decem
ber 2017
27
PricewaterhouseCoopers, 188 Quay Street, Private Bag 92162, Auckland 1142, New ZealandT: +64 9 355 8000, F: +64 9 355 8001, pwc.co.nz
Independent review reportto the shareholders of Barramundi Limited
Report on the Interim Financial StatementsWe have reviewed the accompanying interim financial statements of Barramundi Limited (theCompany) on pages 15 to 26, which comprise the statement of financial position as at 31 December2017, and the statement of comprehensive income, the statement of changes in equity and thestatement of cash flows for the period ended on that date, and notes to the interim financial statements.
Directors’ responsibility for the interim financial statementsThe Directors are responsible on behalf of the Company for the preparation and presentation of these interim financial statements in accordance with New Zealand Equivalent to International AccountingStandard 34 Interim Financial Reporting (NZ IAS 34) and for such internal control as the Directors determine is necessary to enable the preparation of interim financial statements that are free frommaterial misstatement, whether due to fraud or error.
Our responsibilityOur responsibility is to express a conclusion on the accompanying interim financial statements based on our review. We conducted our review in accordance with the New Zealand Standard on ReviewEngagements 2410 Review of Financial Statements Performed by the Independent Auditor of theEntity (NZ SRE 2410). NZ SRE 2410 requires us to conclude whether anything has come to ourattention that causes us to believe that the interim financial statements, taken as a whole, are notprepared in all material respects, in accordance with NZ IAS 34. As the auditor of the Company, NZ SRE2410 requires that we comply with the ethical requirements relevant to the audit of the annual financialstatements.
A review of interim financial statements in accordance with NZ SRE 2410 is a limited assuranceengagement. The auditor performs procedures, primarily consisting of making enquiries, primarily of persons responsible for financial and accounting matters, and applying analytical and other reviewprocedures. The procedures performed in a review are substantially less than those performed in an audit conducted in accordance with International Standards on Auditing (New Zealand) andInternational Standards on Auditing. Accordingly, we do not express an audit opinion on these interimfinancial statements.
We are independent of the Company. Other than in our capacity as auditor, we have no relationshipwith, or interests in, the Company.
ConclusionBased on our review, nothing has come to our attention that causes us to believe that these interimfinancial statements of the Company are not prepared, in all material respects, in accordance with NZIAS 34.
Who we report toThis report is made solely to the Company’s shareholders, as a body. Our review work has beenundertaken so that we might state to the Company’s shareholders those matters which we are requiredto state to them in our review report and for no other purpose. To the fullest extent permitted by law, wedo not accept or assume responsibility to anyone other than the shareholders, as a body, for our review procedures, for this report, or for the conclusion we have formed.
For and on behalf of:
Chartered Accountants Auckland 19 February 2018
NOTES TO THE INTERIM FINANCIAL STATEMENTS CONTINUED
PricewaterhouseCoopers, 188 Quay Street, Private Bag 92162, Auckland 1142, New ZealandT: +64 9 355 8000, F: +64 9 355 8001, pwc.co.nz
Independent Review Report to the shareholders of Barramundi Limited
Report on the Interim Financial StatementsWe have reviewed the accompanying financial statements of Barramundi Limited (the Company) on pages 15 to 26, which comprise the statement of financial position as at 31 December 2016, and the statement of comprehensive income, the statement of changes in equity and the statement of cash flows for the period ended on that date, and a summary of significant accounting policies and selected explanatory notes.
Directors’ Responsibility for the Financial StatementsThe Directors are responsible on behalf of the Company for the preparation and presentation of these financial statements in accordance with New Zealand Equivalent to International Accounting Standard 34 Interim Financial Reporting (NZ IAS 34) and for such internal controls as the Directors determine are necessary to enable the preparation of financial statements that are free from material misstatement, whether due to fraud or error.
Our ResponsibilityOur responsibility is to express a conclusion on the accompanying financial statements based on our review. We conducted our review in accordance with the New Zealand Standard on Review Engagements 2410 Review of Financial Statements Performed by the Independent Auditor of the Entity (NZ SRE 2410). NZ SRE 2410 requires us to conclude whether anything has come to our attention that causes us to believe that the financial statements, taken as a whole, are not prepared in all material respects, in accordance with NZ IAS 34. As the auditor of the Company, NZ SRE 2410 requires that we comply with the ethical requirements relevant to the audit of the annual financial statements.
A review of financial statements in accordance with NZ SRE 2410 is a limited assurance engagement. The auditor performs procedures, primarily consisting of making enquiries, primarily of persons responsible for financial and accounting matters, and applying analytical and other review procedures. The procedures performed in a review are substantially less than those performed in an audit conducted in accordance with International Standards on Auditing (New Zealand) and International Standards on Auditing. Accordingly, we do not express an audit opinion on these financial statements.
ConclusionBased on our review, nothing has come to our attention that causes us to believe that these financial statements of the Company are not prepared, in all material respects, in accordance with NZ IAS 34.
Restriction on Distribution or UseThis report is made solely to the Company’s shareholders, as a body. Our review work has been undertaken so that we might state to the Company’s shareholders those matters which we are required to state to them in our review report and for no other purpose. To the fullest extent permitted by law, we do not accept or assume responsibility to anyone other than the shareholders, as a body, for our review procedures, for this report, or for the conclusion we have formed.
For and on behalf of:
Chartered Accountants Auckland20 February 2017

Barramundi Lim
ited | Interim Rep
ort | 31 Decem
ber 2017
28NOTES

Barramundi Lim
ited | Interim Rep
ort | 31 Decem
ber 2017
29NOTES

Barramundi Lim
ited | Interim Rep
ort | 31 Decem
ber 2017
30NOTES

Barramundi Lim
ited | Interim Rep
ort | 31 Decem
ber 2017
31DIRECTORYREGISTERED OFFICELevel 1 67 – 73 Hurstmere RoadTakapunaAuckland 0622
DIRECTORSIndependent DirectorsAlistair Ryan (Chair)Carol CampbellAndy Coupe
Director Carmel Fisher
CORPOR ATE MANAGERJody Kaye
MANAGERFisher Funds Management LimitedLevel 167 – 73 Hurstmere RoadTakapunaAuckland 0622
SHARE REGISTR ARComputershare Investor Services LimitedLevel 2159 Hurstmere RoadTakapunaAuckland 0622
Phone: +64 9 488 8777Email: [email protected]
FOR MORE INFORMATIONFor enquiries about transactions, changes of address and dividend payments, contact the share registrar above. Alternatively, to change your address, update your payment instructions and to view your investment portfolio including transactions online, please visit: www.computershare.co.nz/investorcentre
AUDITORPricewaterhouseCoopers 188 Quay StreetAuckland 1010
SOLICITORBell GullyLevel 21, Vero Centre48 Shortland StreetAuckland 1010
BANKERANZ Bank New Zealand Limited23-29 Albert StreetAuckland 1010
NATURE OF BUSINESSThe principal activity of Barramundi is investment in quality, growing Australian companies.
FOR ENQUIRIES ABOUT BARR AMUNDI CONTACT
Barramundi LimitedLevel 1, 67 – 73 Hurstmere Road, Takapuna, Auckland 0622 Private Bag 93502, Takapuna, Auckland 0740
Phone: +64 9 489 7074 | Fax: +64 9 489 7139 | Email: [email protected]
The interim report is provided for information purposes only and does not constitute an offer, invitation, basis for a contract, financial advice, other advice or recommendation to conclude any transaction for the purchase or sale of any security, loan or other instrument. In particular, the information contained in this interim report is not financial advice for the purposes of the Financial Advisers Act 2008 and should not be relied upon when making an investment decision. Professional financial advice from an authorised financial adviser should be taken before making an investment.

Printed onto Advance laser, which is produced from Elemental Chlorine Free (ECF) pulp from virgin wood. This wood is sourced from managed farmed trees in an ISO14001 and ISO9001 (International Quality Management Standard) accredited mill, that generates a portion of their power from tree waste, saving 200 million litres of diesel oil annually.
![Annua epor 2074075 1 - prabhucapital.com Agm Book... · Annua epor 2074075 3 (A Sbsidiary of rabh ank Limited) IL Prabhu apital Limited k|e' Soflk6n lnld6]8 cWoIfHo"sf] dGtJo ljgf]b](https://img.pdfslide.tips/doc/110x75/6094681c8b1ed85d601d167c/annua-epor-2074075-1-agm-book-annua-epor-2074075-3-a-sbsidiary-of-rabh-ank.jpg)