Embed Size (px)
Citation preview
BBVA adjunta la información detallada de los resultados del ejercicio de transparencia que publica hoy la Autoridad Bancaria Europea (EBA por sus siglas en inglés). Este ejercicio constituye una actualización de información con respecto al ejercicio realizado en 2013 y no contiene ningún elemento de stress-test. Las fechas de referencia de la información actualizada son diciembre de 2014 y junio de 2015. Para más información consulte la página web de la EBA (www.eba.europa.eu) Madrid, a 24 de noviembre de 2015 Nota La información del ejercicio de transparencia está recogida en las tablas siguientes de acuerdo con el formato común proporcionado por la EBA.
Round_3
Master_version_2015 TRA Templates 26102015Bank Name Banco Bilbao Vizcaya Argentaria, SA
Name_of_submitted_file_Name_of_submitted_file_ITS_ES_K8MS7FD7N5Z2WQ51AZ71.xlsx_08/09/2015 09:13:46LEI Code K8MS7FD7N5Z2WQ51AZ71
ITS_update_09_Nov_2015 at 08:51:51Country Code ES
Merge_manual_input_09_Nov_2015 at 09:45:52 Ba
2015 EU-wide Transparency Exercise
2015 EU-wide Transparency Exercise 201412 201506
Capital
Banco Bilbao Vizcaya Argentaria, SA
CRR / CRDIV DEFINITION OF CAPITALAs of
31/12/2014
As of
30/06/2015COREP CODE REGULATION
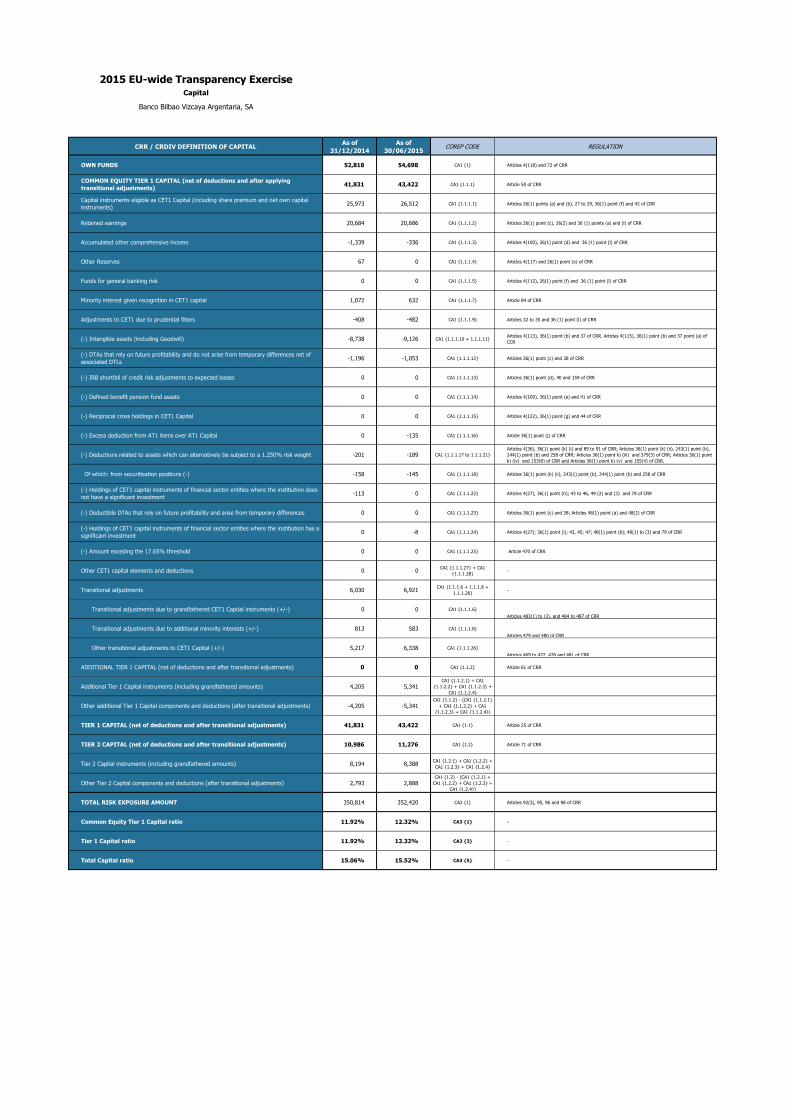
OWN FUNDS 52,818 54,698 CA1 {1} Articles 4(118) and 72 of CRR
COMMON EQUITY TIER 1 CAPITAL (net of deductions and after applying
transitional adjustments)41,831 43,422 CA1 {1.1.1} Article 50 of CRR
Capital instruments eligible as CET1 Capital (including share premium and net own capital
instruments)25,973 26,512 CA1 {1.1.1.1} Articles 26(1) points (a) and (b), 27 to 29, 36(1) point (f) and 42 of CRR
Retained earnings 20,684 20,686 CA1 {1.1.1.2} Articles 26(1) point (c), 26(2) and 36 (1) points (a) and (l) of CRR
Accumulated other comprehensive income -1,339 -336 CA1 {1.1.1.3} Articles 4(100), 26(1) point (d) and 36 (1) point (l) of CRR
Other Reserves 67 0 CA1 {1.1.1.4} Articles 4(117) and 26(1) point (e) of CRR
Funds for general banking risk 0 0 CA1 {1.1.1.5} Articles 4(112), 26(1) point (f) and 36 (1) point (l) of CRR
Minority interest given recognition in CET1 capital 1,072 632 CA1 {1.1.1.7} Article 84 of CRR
Adjustments to CET1 due to prudential filters -408 -482 CA1 {1.1.1.9} Articles 32 to 35 and 36 (1) point (l) of CRR
(-) Intangible assets (including Goodwill) -8,738 -9,126 CA1 {1.1.1.10 + 1.1.1.11}Articles 4(113), 36(1) point (b) and 37 of CRR. Articles 4(115), 36(1) point (b) and 37 point (a) of
CCR
(-) DTAs that rely on future profitability and do not arise from temporary differences net of
associated DTLs -1,196 -1,053 CA1 {1.1.1.12} Articles 36(1) point (c) and 38 of CRR
(-) IRB shortfall of credit risk adjustments to expected losses 0 0 CA1 {1.1.1.13} Articles 36(1) point (d), 40 and 159 of CRR
(-) Defined benefit pension fund assets 0 0 CA1 {1.1.1.14} Articles 4(109), 36(1) point (e) and 41 of CRR
(-) Reciprocal cross holdings in CET1 Capital 0 0 CA1 {1.1.1.15} Articles 4(122), 36(1) point (g) and 44 of CRR
(-) Excess deduction from AT1 items over AT1 Capital 0 -135 CA1 {1.1.1.16} Article 36(1) point (j) of CRR
(-) Deductions related to assets which can alternatively be subject to a 1.250% risk weight -201 -189 CA1 {1.1.1.17 to 1.1.1.21}
Articles 4(36), 36(1) point (k) (i) and 89 to 91 of CRR; Articles 36(1) point (k) (ii), 243(1) point (b),
244(1) point (b) and 258 of CRR; Articles 36(1) point k) (iii) and 379(3) of CRR; Articles 36(1) point
k) (iv) and 153(8) of CRR and Articles 36(1) point k) (v) and 155(4) of CRR.
Of which: from securitisation positions (-) -158 -145 CA1 {1.1.1.18} Articles 36(1) point (k) (ii), 243(1) point (b), 244(1) point (b) and 258 of CRR
(-) Holdings of CET1 capital instruments of financial sector entities where the institiution does
not have a significant investment-113 0 CA1 {1.1.1.22} Articles 4(27), 36(1) point (h); 43 to 46, 49 (2) and (3) and 79 of CRR
(-) Deductible DTAs that rely on future profitability and arise from temporary differences 0 0 CA1 {1.1.1.23} Articles 36(1) point (c) and 38; Articles 48(1) point (a) and 48(2) of CRR
(-) Holdings of CET1 capital instruments of financial sector entities where the institiution has a
significant investment0 -8 CA1 {1.1.1.24} Articles 4(27); 36(1) point (i); 43, 45; 47; 48(1) point (b); 49(1) to (3) and 79 of CRR
(-) Amount exceding the 17.65% threshold 0 0 CA1 {1.1.1.25} Article 470 of CRR
Other CET1 capital elements and deductions 0 0CA1 {1.1.1.27} + CA1
{1.1.1.28}-
Transitional adjustments 6,030 6,921CA1 {1.1.1.6 + 1.1.1.8 +
1.1.1.26}-
Transitional adjustments due to grandfathered CET1 Capital instruments (+/-) 0 0 CA1 {1.1.1.6}
Articles 483(1) to (3), and 484 to 487 of CRR
Transitional adjustments due to additional minority interests (+/-) 813 583 CA1 {1.1.1.8}
Articles 479 and 480 of CRR
Other transitional adjustments to CET1 Capital (+/-) 5,217 6,338 CA1 {1.1.1.26}
Articles 469 to 472, 478 and 481 of CRR
ADDITIONAL TIER 1 CAPITAL (net of deductions and after transitional adjustments) 0 0 CA1 {1.1.2} Article 61 of CRR
Additional Tier 1 Capital instruments (including grandfathered amounts) 4,205 5,341CA1 {1.1.2.1} + CA1
{1.1.2.2} + CA1 {1.1.2.3} +
CA1 {1.1.2.4}
Other additional Tier 1 Capital components and deductions (after transitional adjustments) -4,205 -5,341CA1 {1.1.2} - (CA1 {1.1.2.1}
+ CA1 {1.1.2.2} + CA1
{1.1.2.3} + CA1 {1.1.2.4})
TIER 1 CAPITAL (net of deductions and after transitional adjustments) 41,831 43,422 CA1 {1.1} Article 25 of CRR
TIER 2 CAPITAL (net of deductions and after transitional adjustments) 10,986 11,276 CA1 {1.2} Article 71 of CRR
Tier 2 Capital instruments (including grandfathered amounts) 8,194 8,388CA1 {1.2.1} + CA1 {1.2.2} +
CA1 {1.2.3} + CA1 {1.2.4}
Other Tier 2 Capital components and deductions (after transitional adjustments) 2,793 2,888CA1 {1.2} - (CA1 {1.2.1} +
CA1 {1.2.2} + CA1 {1.2.3} +
CA1 {1.2.4})
TOTAL RISK EXPOSURE AMOUNT 350,814 352,420 CA2 {1} Articles 92(3), 95, 96 and 98 of CRR
Common Equity Tier 1 Capital ratio 11.92% 12.32% CA3 {1} -
Tier 1 Capital ratio 11.92% 12.32% CA3 {3} -
Total Capital ratio 15.06% 15.52% CA3 {5} -
(mln EUR)
as of
31/12/2014
as of
30/06/2015
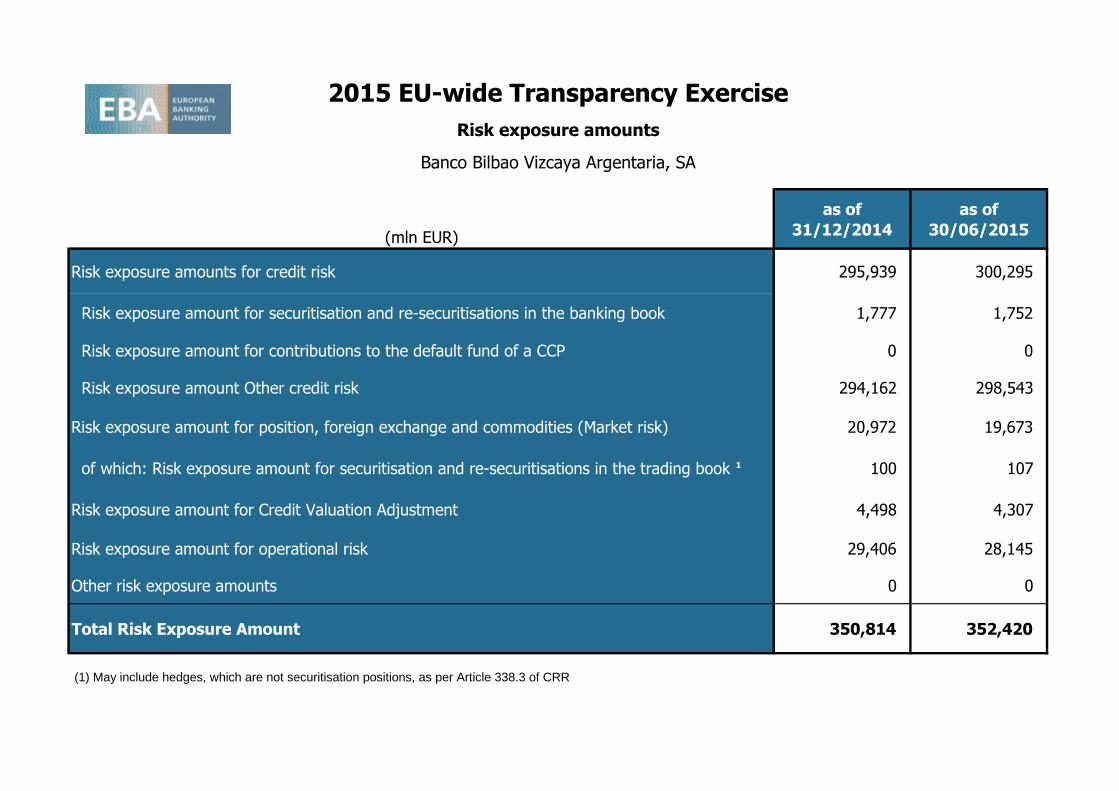
Risk exposure amounts for credit risk 295,939 300,295
Risk exposure amount for securitisation and re-securitisations in the banking book 1,777 1,752
Risk exposure amount for contributions to the default fund of a CCP 0 0
Risk exposure amount Other credit risk 294,162 298,543
Risk exposure amount for position, foreign exchange and commodities (Market risk) 20,972 19,673
of which: Risk exposure amount for securitisation and re-securitisations in the trading book 1 100 107
Risk exposure amount for Credit Valuation Adjustment 4,498 4,307
Risk exposure amount for operational risk 29,406 28,145
Other risk exposure amounts 0 0
Total Risk Exposure Amount 350,814 352,420
(1) May include hedges, which are not securitisation positions, as per Article 338.3 of CRR
2015 EU-wide Transparency Exercise
Risk exposure amounts
Banco Bilbao Vizcaya Argentaria, SA
201412 201506
(mln EUR)
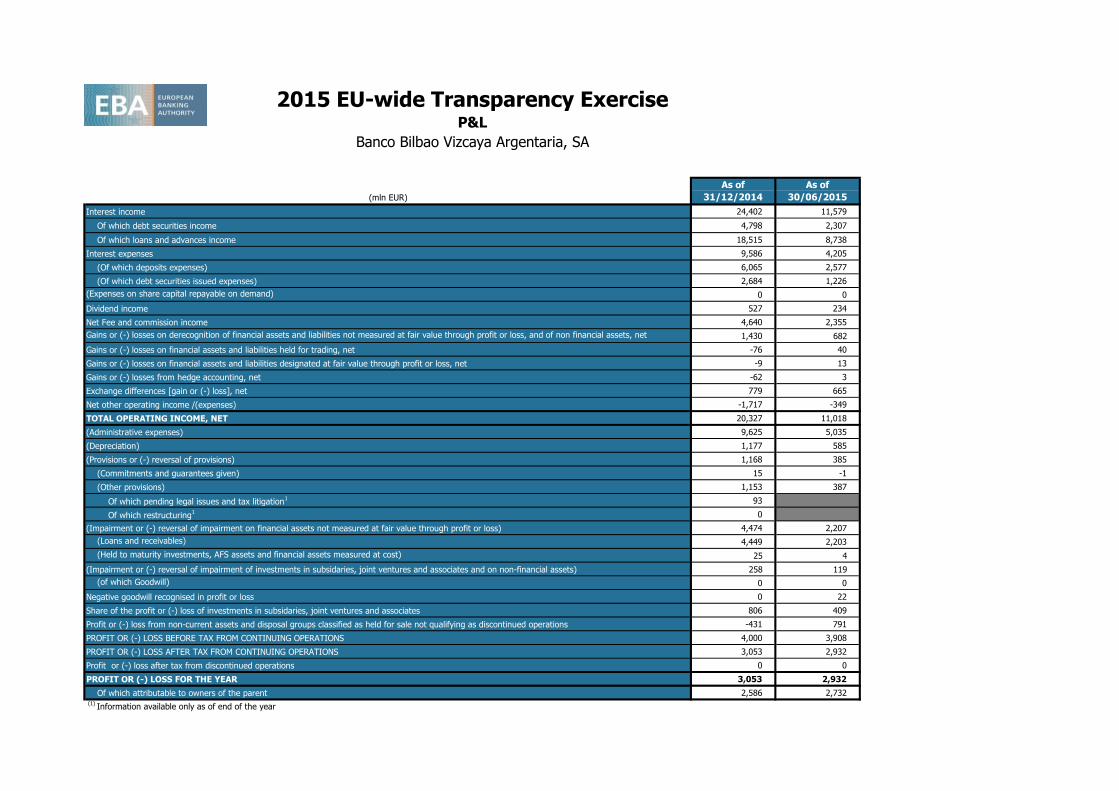
Interest income 24,402 11,579
Of which debt securities income 4,798 2,307
Of which loans and advances income 18,515 8,738
Interest expenses 9,586 4,205
(Of which deposits expenses) 6,065 2,577
(Of which debt securities issued expenses) 2,684 1,226
(Expenses on share capital repayable on demand) 0 0
Dividend income 527 234
Net Fee and commission income 4,640 2,355
Gains or (-) losses on derecognition of financial assets and liabilities not measured at fair value through profit or loss, and of non financial assets, net 1,430 682
Gains or (-) losses on financial assets and liabilities held for trading, net -76 40
Gains or (-) losses on financial assets and liabilities designated at fair value through profit or loss, net -9 13
Gains or (-) losses from hedge accounting, net -62 3
Exchange differences [gain or (-) loss], net 779 665
Net other operating income /(expenses) -1,717 -349
TOTAL OPERATING INCOME, NET 20,327 11,018
(Administrative expenses) 9,625 5,035
(Depreciation) 1,177 585
(Provisions or (-) reversal of provisions) 1,168 385
(Commitments and guarantees given) 15 -1
(Other provisions) 1,153 387
Of which pending legal issues and tax litigation1 93
Of which restructuring1 0
(Impairment or (-) reversal of impairment on financial assets not measured at fair value through profit or loss) 4,474 2,207
(Loans and receivables) 4,449 2,203
(Held to maturity investments, AFS assets and financial assets measured at cost) 25 4
(Impairment or (-) reversal of impairment of investments in subsidaries, joint ventures and associates and on non-financial assets) 258 119
(of which Goodwill) 0 0
Negative goodwill recognised in profit or loss 0 22
Share of the profit or (-) loss of investments in subsidaries, joint ventures and associates 806 409
Profit or (-) loss from non-current assets and disposal groups classified as held for sale not qualifying as discontinued operations -431 791
PROFIT OR (-) LOSS BEFORE TAX FROM CONTINUING OPERATIONS 4,000 3,908
PROFIT OR (-) LOSS AFTER TAX FROM CONTINUING OPERATIONS 3,053 2,932
Profit or (-) loss after tax from discontinued operations 0 0
PROFIT OR (-) LOSS FOR THE YEAR 3,053 2,932
Of which attributable to owners of the parent 2,586 2,732 (1)
Information available only as of end of the year
2015 EU-wide Transparency ExerciseP&L
Banco Bilbao Vizcaya Argentaria, SA
As of
31/12/2014
As of
30/06/2015
201412 201506 201412 201412 201412 201412 201412 201412 201412 201412 201412 201412 201506 201506 201506 201506 201506 201506 201506 201506 201506 201506
As of
31/12/2014
As of
30/06/2015
(mln EUR)
MULTIPLICATION
FACTOR (mc) x
AVERAGE OF
PREVIOUS 60
WORKING DAYS
(VaRavg)
PREVIOUS
DAY (VaRt-1)
MULTIPLICATION
FACTOR (ms) x
AVERAGE OF
PREVIOUS 60
WORKING DAYS
(SVaRavg)
LATEST
AVAILABLE
(SVaRt-1)
12 WEEKS
AVERAGE
MEASURE
LAST
MEASUREFLOOR
12 WEEKS
AVERAGE
MEASURE
LAST
MEASURE
MULTIPLICATION
FACTOR (mc) x
AVERAGE OF
PREVIOUS 60
WORKING DAYS
(VaRavg)
PREVIOUS
DAY (VaRt-1)
MULTIPLICATION
FACTOR (ms) x
AVERAGE OF
PREVIOUS 60
WORKING DAYS
(SVaRavg)
LATEST
AVAILABLE
(SVaRt-1)
12 WEEKS
AVERAGE
MEASURE
LAST
MEASUREFLOOR
12 WEEKS
AVERAGE
MEASURE
LAST
MEASURE
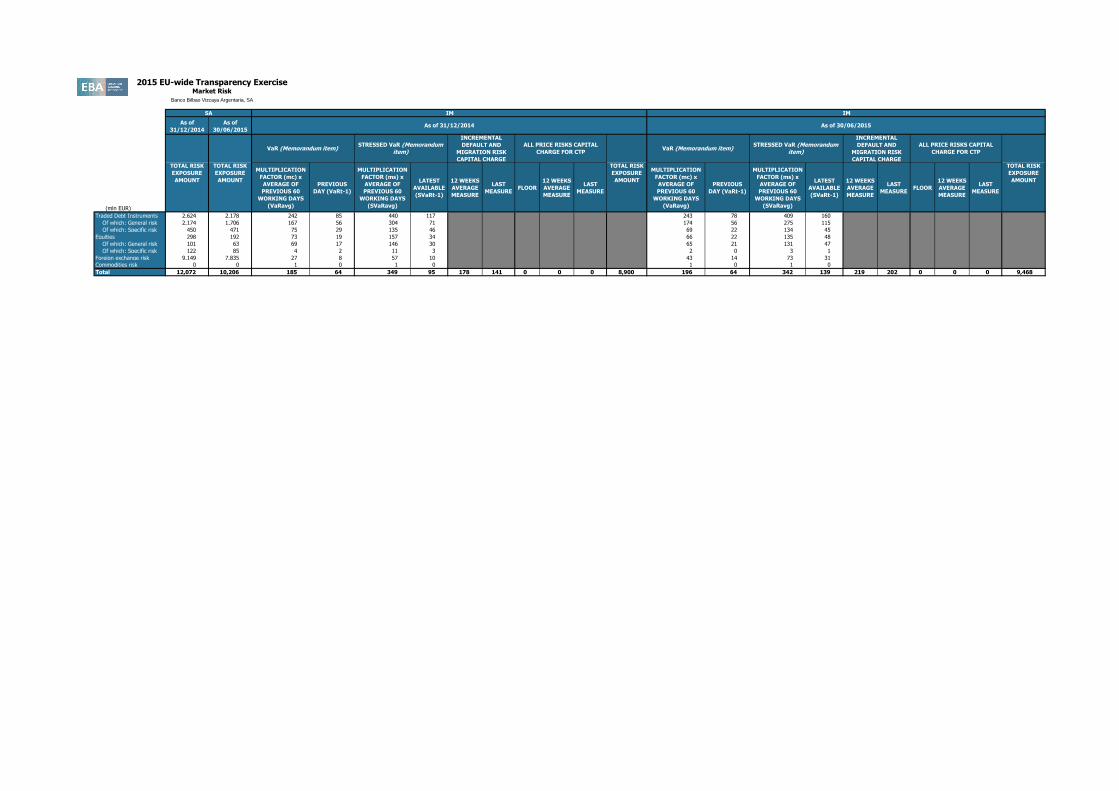
Traded Debt Instruments 2,624 2,178 242 85 440 117 243 78 409 160
Of which: General risk 2,174 1,706 167 56 304 71 174 56 275 115
Of which: Specific risk 450 471 75 29 135 46 69 22 134 45
Equities 298 192 73 19 157 34 66 22 135 48
Of which: General risk 101 63 69 17 146 30 65 21 131 47
Of which: Specific risk 122 85 4 2 11 3 2 0 3 1
Foreign exchange risk 9,149 7,835 27 8 57 10 43 14 73 31
Commodities risk 0 0 1 0 1 0 1 0 1 0
Total 12,072 10,206 185 64 349 95 178 141 0 0 0 8,900 196 64 342 139 219 202 0 0 0 9,468
STRESSED VaR (Memorandum
item)
INCREMENTAL
DEFAULT AND
MIGRATION RISK
CAPITAL CHARGE
ALL PRICE RISKS CAPITAL
CHARGE FOR CTP
TOTAL RISK
EXPOSURE
AMOUNT
As of 31/12/2014 As of 30/06/2015
ALL PRICE RISKS CAPITAL
CHARGE FOR CTP
TOTAL RISK
EXPOSURE
AMOUNT
VaR (Memorandum item)
TOTAL RISK
EXPOSURE
AMOUNT
TOTAL RISK
EXPOSURE
AMOUNT
VaR (Memorandum item)STRESSED VaR (Memorandum
item)
INCREMENTAL
DEFAULT AND
MIGRATION RISK
CAPITAL CHARGE
IM
2015 EU-wide Transparency ExerciseMarket Risk
Banco Bilbao Vizcaya Argentaria, SA
SA IM
201412 201412 201412 201412 201506 201506 201506 201506
2015 EU-wide Transparency Exercise
Credit Risk - Standardised Approach
Banco Bilbao Vizcaya Argentaria, SA
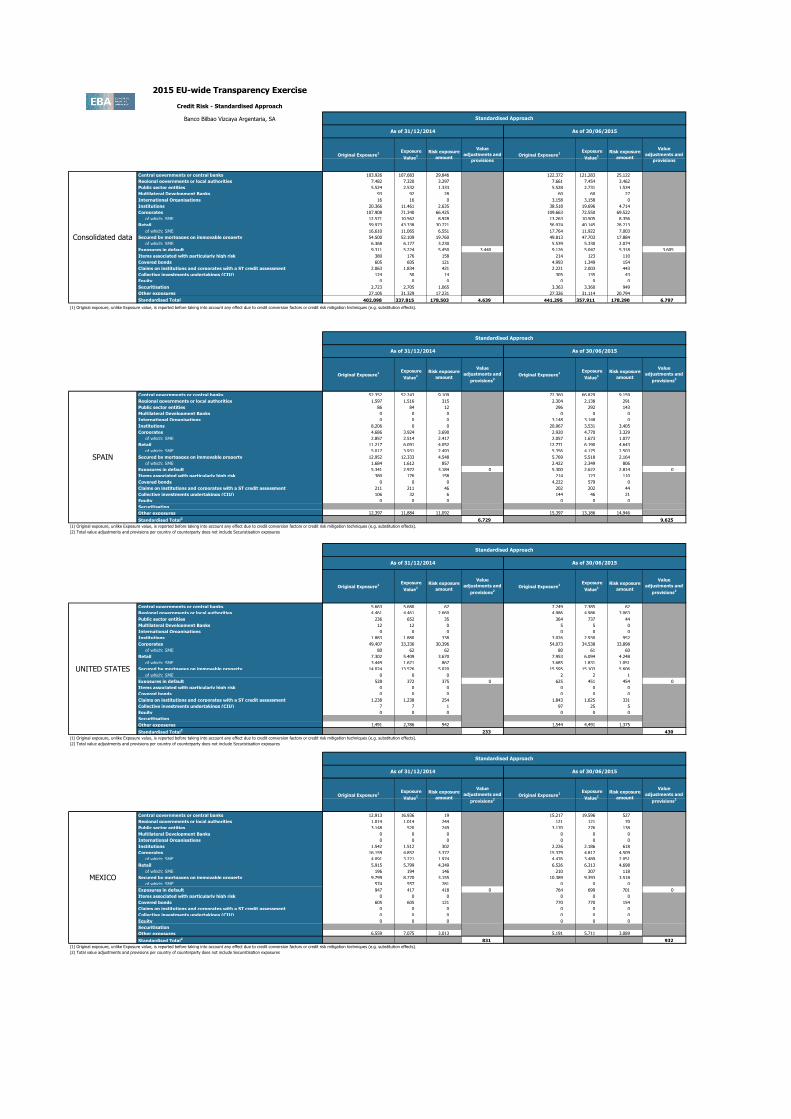
Central governments or central banks 103,926 107,683 29,846 122,372 121,283 25,122
Regional governments or local authorities 7,482 7,320 3,297 7,661 7,454 3,462
Public sector entities 5,524 2,532 1,333 5,528 2,731 1,534
Multilateral Development Banks 93 92 28 60 60 27
International Organisations 16 16 0 3,158 3,158 0
Institutions 20,366 11,461 2,635 38,518 19,696 4,714
Corporates 107,908 71,340 66,425 109,663 72,550 69,522
of which: SME 12,571 10,562 8,928 13,263 10,505 8,356
Retail 59,973 43,338 30,721 56,974 40,145 28,213
of which: SME 16,610 11,065 6,551 17,764 11,922 7,003
Secured by mortgages on immovable property 54,500 52,109 19,760 49,813 47,703 17,884
of which: SME 6,368 6,177 3,230 5,539 5,330 2,074
Exposures in default 9,311 5,224 5,450 3,440 9,126 5,047 5,318 3,605
Items associated with particularly high risk 380 176 158 214 123 110
Covered bonds 605 605 121 4,993 1,349 154
Claims on institutions and corporates with a ST credit assessment 2,063 1,834 421 2,221 2,003 443
Collective investments undertakings (CIU) 124 50 14 305 135 43
Equity 0 0 0 0 0 0
Securitisation 2,723 2,705 1,065 3,363 3,360 949
Other exposures 27,105 31,329 17,231 27,326 31,114 20,794
Standardised Total 402,098 337,815 178,503 4,639 441,295 357,911 178,290 6,797
(1) Original exposure, unlike Exposure value, is reported before taking into account any effect due to credit conversion factors or credit risk mitigation techniques (e.g. substitution effects).
1
Central governments or central banks 52,352 52,243 9,109 72,360 66,829 9,159
Regional governments or local authorities 1,597 1,516 315 2,304 2,138 291
Public sector entities 86 84 12 296 292 143
Multilateral Development Banks 0 0 0 0 0 0
International Organisations 0 0 0 3,148 3,148 0
Institutions 8,206 0 0 20,967 3,531 3,405
Corporates 4,686 3,924 3,690 2,920 4,770 3,329
of which: SME 2,857 2,514 2,417 2,057 1,673 1,077
Retail 11,217 6,091 4,052 12,771 6,190 4,643
of which: SME 5,017 3,931 2,493 5,356 4,175 2,503
Secured by mortgages on immovable property 12,952 12,333 4,548 5,769 5,518 2,164
of which: SME 1,684 1,612 857 2,422 2,349 806
Exposures in default 5,341 2,972 3,184 0 5,300 2,622 2,814 0
Items associated with particularly high risk 380 176 158 214 123 110
Covered bonds 0 0 0 4,222 579 0
Claims on institutions and corporates with a ST credit assessment 211 211 46 202 202 44
Collective investments undertakings (CIU) 106 32 6 144 46 21
Equity 0 0 0 0 0 0
Securitisation
Other exposures 12,397 11,884 11,092 15,397 13,186 14,946
Standardised Total2 6,729 9,625
(1) Original exposure, unlike Exposure value, is reported before taking into account any effect due to credit conversion factors or credit risk mitigation techniques (e.g. substitution effects).
(2) Total value adjustments and provisions per country of counterparty does not include Securistisation exposures
2
Central governments or central banks 5,663 5,680 67 7,249 7,385 62
Regional governments or local authorities 4,461 4,461 2,660 4,986 4,986 3,063
Public sector entities 236 652 35 364 737 44
Multilateral Development Banks 12 12 0 5 5 0
International Organisations 0 0 0 0 0 0
Institutions 1,883 1,880 338 3,026 2,930 952
Corporates 49,407 33,336 30,396 54,073 34,538 33,898
of which: SME 80 62 62 80 61 60
Retail 7,302 5,409 3,670 7,953 6,094 4,248
of which: SME 3,449 1,671 867 3,685 1,831 1,051
Secured by mortgages on immovable property 14,024 13,576 5,020 15,595 15,103 5,606
of which: SME 0 0 0 2 2 1
Exposures in default 528 372 375 0 625 451 454 0
Items associated with particularly high risk 0 0 0 0 0 0
Covered bonds 0 0 0 0 0 0
Claims on institutions and corporates with a ST credit assessment 1,238 1,238 254 1,843 1,625 331
Collective investments undertakings (CIU) 7 7 1 97 25 5
Equity 0 0 0 0 0 0
Securitisation
Other exposures 1,491 2,786 942 1,544 4,491 1,375
Standardised Total2 233 430
(1) Original exposure, unlike Exposure value, is reported before taking into account any effect due to credit conversion factors or credit risk mitigation techniques (e.g. substitution effects).
(2) Total value adjustments and provisions per country of counterparty does not include Securistisation exposures
3
Central governments or central banks 12,913 16,936 19 15,217 19,596 527
Regional governments or local authorities 1,014 1,014 244 121 121 70
Public sector entities 3,148 520 249 3,170 276 138
Multilateral Development Banks 0 0 0 0 0 0
International Organisations 0 0 0 0 0 0
Institutions 1,542 1,512 302 2,226 2,186 618
Corporates 16,159 4,852 3,377 15,379 4,817 4,509
of which: SME 4,091 3,221 1,974 4,476 3,489 2,051
Retail 5,915 5,799 4,349 6,526 6,313 4,698
of which: SME 196 194 146 210 207 118
Secured by mortgages on immovable property 9,799 8,770 3,155 10,389 9,393 3,518
of which: SME 574 557 281 0 0 0
Exposures in default 947 417 418 0 764 699 701 0
Items associated with particularly high risk 0 0 0 0 0 0
Covered bonds 605 605 121 770 770 154
Claims on institutions and corporates with a ST credit assessment 0 0 0 0 0 0
Collective investments undertakings (CIU) 0 0 0 0 0 0
Equity 0 0 0 0 0 0
Securitisation
Other exposures 6,559 7,075 3,013 5,191 5,711 3,089
Standardised Total2 831 932
(1) Original exposure, unlike Exposure value, is reported before taking into account any effect due to credit conversion factors or credit risk mitigation techniques (e.g. substitution effects).
(2) Total value adjustments and provisions per country of counterparty does not include Securistisation exposures
Risk exposure
amount
Value
adjustments and
provisions2
MEXICO
Original Exposure1
Exposure
Value1
Risk exposure
amount
Value
adjustments and
provisions2
Original Exposure1
Exposure
Value1
Risk exposure
amount
Value
adjustments and
provisions2
UNITED STATES
Standardised Approach
As of 31/12/2014 As of 30/06/2015
Original Exposure1
Exposure
Value1
Risk exposure
amount
Value
adjustments and
provisions2
Original Exposure1
Exposure
Value1
Exposure
Value1
Risk exposure
amount
Value
adjustments and
provisions2
SPAIN
Standardised Approach
As of 31/12/2014 As of 30/06/2015
Value
adjustments and
provisions
Consolidated data
Standardised Approach
As of 31/12/2014 As of 30/06/2015
Original Exposure1
Exposure
Value1
Risk exposure
amount
Value
adjustments and
provisions2
Original Exposure1
Standardised Approach
As of 31/12/2014 As of 30/06/2015
Original Exposure1
Exposure
Value1
Risk exposure
amount
Value
adjustments and
provisionsOriginal Exposure
1 Exposure
Value1
Risk exposure
amount
4
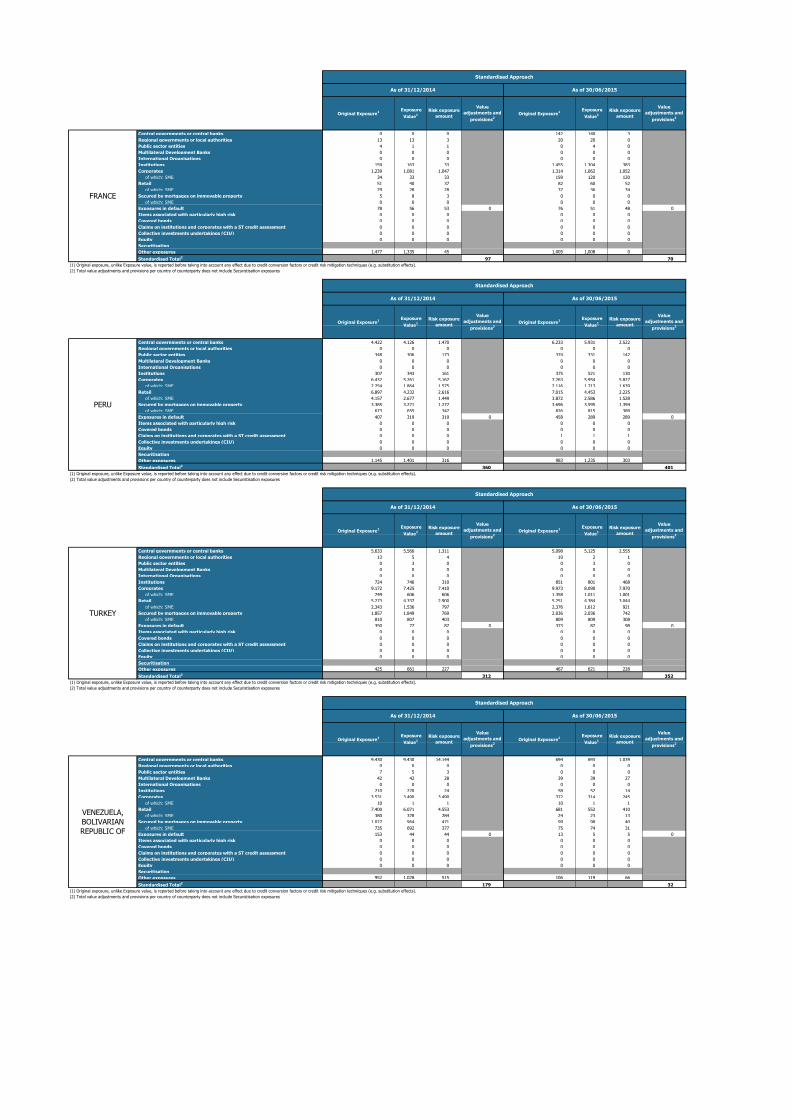
Central governments or central banks 0 0 0 142 140 3
Regional governments or local authorities 13 13 3 20 20 0
Public sector entities 4 1 1 0 4 0
Multilateral Development Banks 0 0 0 0 0 0
International Organisations 0 0 0 0 0 0
Institutions 159 163 33 1,455 1,304 383
Corporates 1,239 1,081 1,047 1,314 1,062 1,052
of which: SME 34 33 33 159 120 120
Retail 51 40 37 82 60 52
of which: SME 29 28 28 37 36 34
Secured by mortgages on immovable property 5 8 3 0 0 0
of which: SME 0 0 0 0 0 0
Exposures in default 78 56 53 0 76 51 48 0
Items associated with particularly high risk 0 0 0 0 0 0
Covered bonds 0 0 0 0 0 0
Claims on institutions and corporates with a ST credit assessment 0 0 0 0 0 0
Collective investments undertakings (CIU) 0 0 0 0 0 0
Equity 0 0 0 0 0 0
Securitisation
Other exposures 1,477 1,335 45 1,005 1,008 0
Standardised Total2 97 70
(1) Original exposure, unlike Exposure value, is reported before taking into account any effect due to credit conversion factors or credit risk mitigation techniques (e.g. substitution effects).
(2) Total value adjustments and provisions per country of counterparty does not include Securistisation exposures
5
Central governments or central banks 4,422 4,126 1,470 6,233 5,931 2,522
Regional governments or local authorities 0 0 0 0 0 0
Public sector entities 348 306 173 374 331 142
Multilateral Development Banks 0 0 0 0 0 0
International Organisations 0 0 0 0 0 0
Institutions 307 343 161 375 521 130
Corporates 6,432 5,261 5,167 7,263 5,954 5,827
of which: SME 2,254 1,864 1,575 2,116 1,713 1,639
Retail 6,897 4,232 2,616 7,015 4,453 2,225
of which: SME 4,157 2,677 1,449 3,872 2,586 1,528
Secured by mortgages on immovable property 3,385 3,271 1,277 3,696 3,595 1,394
of which: SME 673 655 347 826 815 389
Exposures in default 407 319 319 0 458 289 289 0
Items associated with particularly high risk 0 0 0 0 0 0
Covered bonds 0 0 0 0 0 0
Claims on institutions and corporates with a ST credit assessment 0 0 0 1 1 1
Collective investments undertakings (CIU) 0 0 0 0 0 0
Equity 0 0 0 0 0 0
Securitisation
Other exposures 1,145 1,401 316 983 1,235 303
Standardised Total2 360 401
(1) Original exposure, unlike Exposure value, is reported before taking into account any effect due to credit conversion factors or credit risk mitigation techniques (e.g. substitution effects).
(2) Total value adjustments and provisions per country of counterparty does not include Securistisation exposures
6
Central governments or central banks 5,633 5,566 1,311 5,098 5,125 2,555
Regional governments or local authorities 13 5 4 10 2 1
Public sector entities 0 3 0 0 3 0
Multilateral Development Banks 0 0 0 0 0 0
International Organisations 0 0 0 0 0 0
Institutions 724 746 310 851 801 468
Corporates 9,172 7,425 7,410 9,973 8,090 7,970
of which: SME 749 606 606 1,358 1,011 1,001
Retail 5,273 4,337 2,900 5,251 4,384 3,044
of which: SME 2,343 1,536 797 2,376 1,612 921
Secured by mortgages on immovable property 1,857 1,849 769 2,036 2,036 742
of which: SME 810 807 403 809 809 308
Exposures in default 350 77 87 0 373 87 98 0
Items associated with particularly high risk 0 0 0 0 0 0
Covered bonds 0 0 0 0 0 0
Claims on institutions and corporates with a ST credit assessment 0 0 0 0 0 0
Collective investments undertakings (CIU) 0 0 0 0 0 0
Equity 0 0 0 0 0 0
Securitisation
Other exposures 425 661 227 467 621 228
Standardised Total2 312 352
(1) Original exposure, unlike Exposure value, is reported before taking into account any effect due to credit conversion factors or credit risk mitigation techniques (e.g. substitution effects).
(2) Total value adjustments and provisions per country of counterparty does not include Securistisation exposures
7
Central governments or central banks 9,430 9,430 14,144 694 693 1,039
Regional governments or local authorities 0 0 0 0 0 0
Public sector entities 7 5 3 0 0 0
Multilateral Development Banks 42 42 28 39 39 27
International Organisations 0 0 0 0 0 0
Institutions 210 220 24 58 52 14
Corporates 3,531 3,490 3,490 372 314 245
of which: SME 10 1 1 10 1 1
Retail 7,400 6,071 4,553 681 552 410
of which: SME 380 378 284 24 23 13
Secured by mortgages on immovable property 1,027 964 471 99 98 40
of which: SME 735 692 377 75 74 31
Exposures in default 153 44 44 0 13 5 5 0
Items associated with particularly high risk 0 0 0 0 0 0
Covered bonds 0 0 0 0 0 0
Claims on institutions and corporates with a ST credit assessment 0 0 0 0 0 0
Collective investments undertakings (CIU) 0 0 0 0 0 0
Equity 0 0 0 0 0 0
Securitisation
Other exposures 952 1,028 515 106 119 66
Standardised Total2 179 32
(1) Original exposure, unlike Exposure value, is reported before taking into account any effect due to credit conversion factors or credit risk mitigation techniques (e.g. substitution effects).
(2) Total value adjustments and provisions per country of counterparty does not include Securistisation exposures
Risk exposure
amount
Value
adjustments and
provisions2
VENEZUELA,
BOLIVARIAN
REPUBLIC OF
Original Exposure1
Exposure
Value1
Risk exposure
amount
Value
adjustments and
provisions2
Original Exposure1
Exposure
Value1
Risk exposure
amount
Value
adjustments and
provisions2
TURKEY
Standardised Approach
As of 31/12/2014 As of 30/06/2015
Original Exposure1
Exposure
Value1
Risk exposure
amount
Value
adjustments and
provisions2
Original Exposure1
Exposure
Value1
Risk exposure
amount
Value
adjustments and
provisions2
PERU
Standardised Approach
As of 31/12/2014 As of 30/06/2015
Original Exposure1
Exposure
Value1
Risk exposure
amount
Value
adjustments and
provisions2
Original Exposure1
Exposure
Value1
Risk exposure
amount
Value
adjustments and
provisions2
FRANCE
Standardised Approach
As of 31/12/2014 As of 30/06/2015
Original Exposure1
Exposure
Value1
Risk exposure
amount
Value
adjustments and
provisions2
Original Exposure1
Exposure
Value1
Standardised Approach
As of 31/12/2014 As of 30/06/2015
8
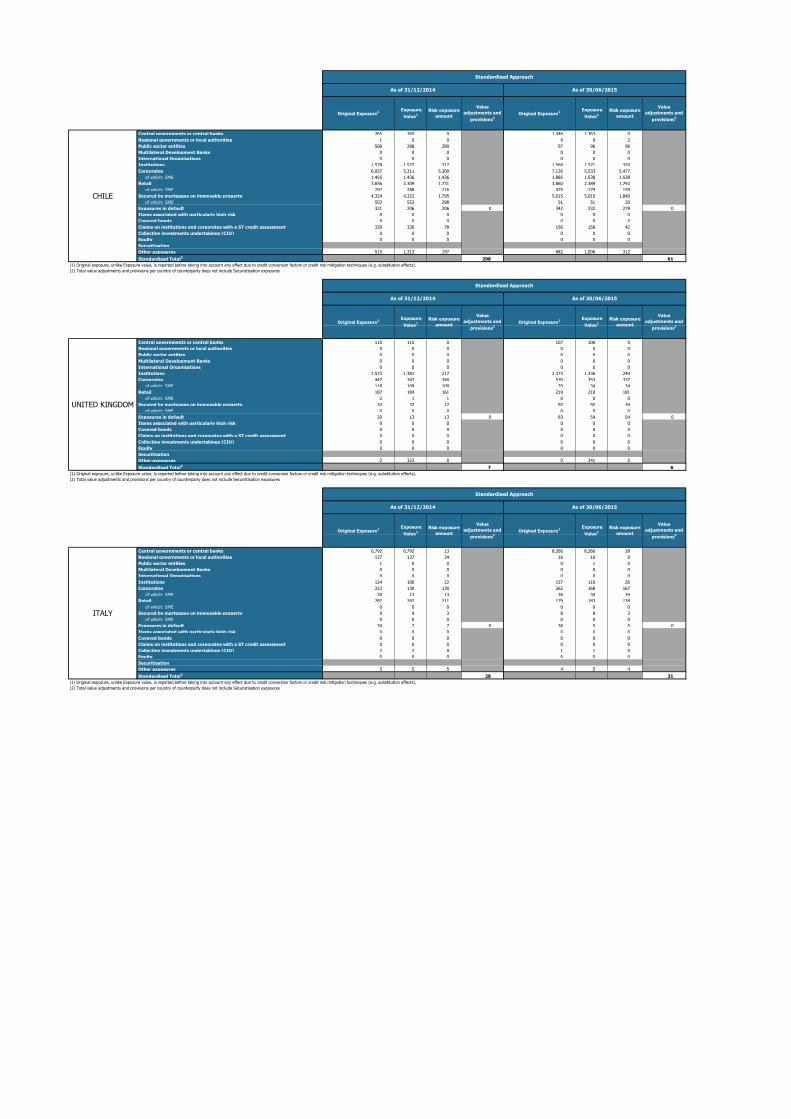
Central governments or central banks 765 765 0 1,346 1,363 0
Regional governments or local authorities 1 0 0 9 9 2
Public sector entities 568 288 280 97 96 96
Multilateral Development Banks 0 0 0 0 0 0
International Organisations 0 0 0 0 0 0
Institutions 1,578 1,577 317 1,568 1,571 320
Corporates 6,937 5,311 5,300 7,136 5,533 5,477
of which: SME 1,455 1,436 1,436 1,885 1,538 1,538
Retail 3,656 2,309 1,731 3,860 2,389 1,792
of which: SME 297 288 216 429 279 159
Secured by mortgages on immovable property 4,324 4,322 1,795 5,015 5,015 1,840
of which: SME 553 553 298 51 51 20
Exposures in default 321 206 206 0 342 232 279 0
Items associated with particularly high risk 0 0 0 0 0 0
Covered bonds 0 0 0 0 0 0
Claims on institutions and corporates with a ST credit assessment 330 330 78 156 156 42
Collective investments undertakings (CIU) 0 0 0 0 0 0
Equity 0 0 0 0 0 0
Securitisation
Other exposures 515 1,313 197 682 1,006 312
Standardised Total2 208 61
(1) Original exposure, unlike Exposure value, is reported before taking into account any effect due to credit conversion factors or credit risk mitigation techniques (e.g. substitution effects).
(2) Total value adjustments and provisions per country of counterparty does not include Securistisation exposures
9
Central governments or central banks 115 115 0 107 106 0
Regional governments or local authorities 0 0 0 0 0 0
Public sector entities 0 0 0 0 6 0
Multilateral Development Banks 0 0 0 0 0 0
International Organisations 0 0 0 0 0 0
Institutions 1,572 1,381 217 2,373 1,336 240
Corporates 447 347 340 570 353 337
of which: SME 118 109 109 35 34 34
Retail 187 184 161 219 210 181
of which: SME 2 1 1 0 0 0
Secured by mortgages on immovable property 32 32 12 92 92 34
of which: SME 0 0 0 0 0 0
Exposures in default 20 13 13 0 83 54 54 0
Items associated with particularly high risk 0 0 0 0 0 0
Covered bonds 0 0 0 0 0 0
Claims on institutions and corporates with a ST credit assessment 0 0 0 0 0 0
Collective investments undertakings (CIU) 0 0 0 0 0 0
Equity 0 0 0 0 0 0
Securitisation
Other exposures 2 323 0 0 341 0
Standardised Total2 7 6
(1) Original exposure, unlike Exposure value, is reported before taking into account any effect due to credit conversion factors or credit risk mitigation techniques (e.g. substitution effects).
(2) Total value adjustments and provisions per country of counterparty does not include Securistisation exposures
10
Central governments or central banks 6,792 6,792 13 8,266 8,266 28
Regional governments or local authorities 137 137 34 16 16 0
Public sector entities 1 0 0 0 1 0
Multilateral Development Banks 0 0 0 0 0 0
International Organisations 0 0 0 0 0 0
Institutions 124 100 22 157 116 26
Corporates 223 130 130 262 168 167
of which: SME 20 13 13 36 34 34
Retail 282 282 211 179 183 138
of which: SME 0 0 0 0 0 0
Secured by mortgages on immovable property 9 9 3 8 8 3
of which: SME 0 0 0 0 0 0
Exposures in default 34 7 7 0 36 5 5 0
Items associated with particularly high risk 0 0 0 0 0 0
Covered bonds 0 0 0 0 0 0
Claims on institutions and corporates with a ST credit assessment 0 0 0 0 0 0
Collective investments undertakings (CIU) 2 2 0 1 1 0
Equity 0 0 0 0 0 0
Securitisation
Other exposures 5 5 5 4 5 4
Standardised Total2 28 31
(1) Original exposure, unlike Exposure value, is reported before taking into account any effect due to credit conversion factors or credit risk mitigation techniques (e.g. substitution effects).
(2) Total value adjustments and provisions per country of counterparty does not include Securistisation exposures
Risk exposure
amount
Value
adjustments and
provisions2
ITALY
Original Exposure1
Exposure
Value1
Risk exposure
amount
Value
adjustments and
provisions2
Original Exposure1
Exposure
Value1
Risk exposure
amount
Value
adjustments and
provisions2
UNITED KINGDOM
Standardised Approach
As of 31/12/2014 As of 30/06/2015
Original Exposure1
Exposure
Value1
Risk exposure
amount
Value
adjustments and
provisions2
Original Exposure1
Exposure
Value1
Risk exposure
amount
Value
adjustments and
provisions2
CHILE
Standardised Approach
As of 31/12/2014 As of 30/06/2015
Original Exposure1
Exposure
Value1
Risk exposure
amount
Value
adjustments and
provisions2
Original Exposure1
Exposure
Value1
Standardised Approach
As of 31/12/2014 As of 30/06/2015
201412 201412 201412 201412 201412 201412 201506 201506 201506 201506 201506 201506
2015 EU-wide Transparency Exercise
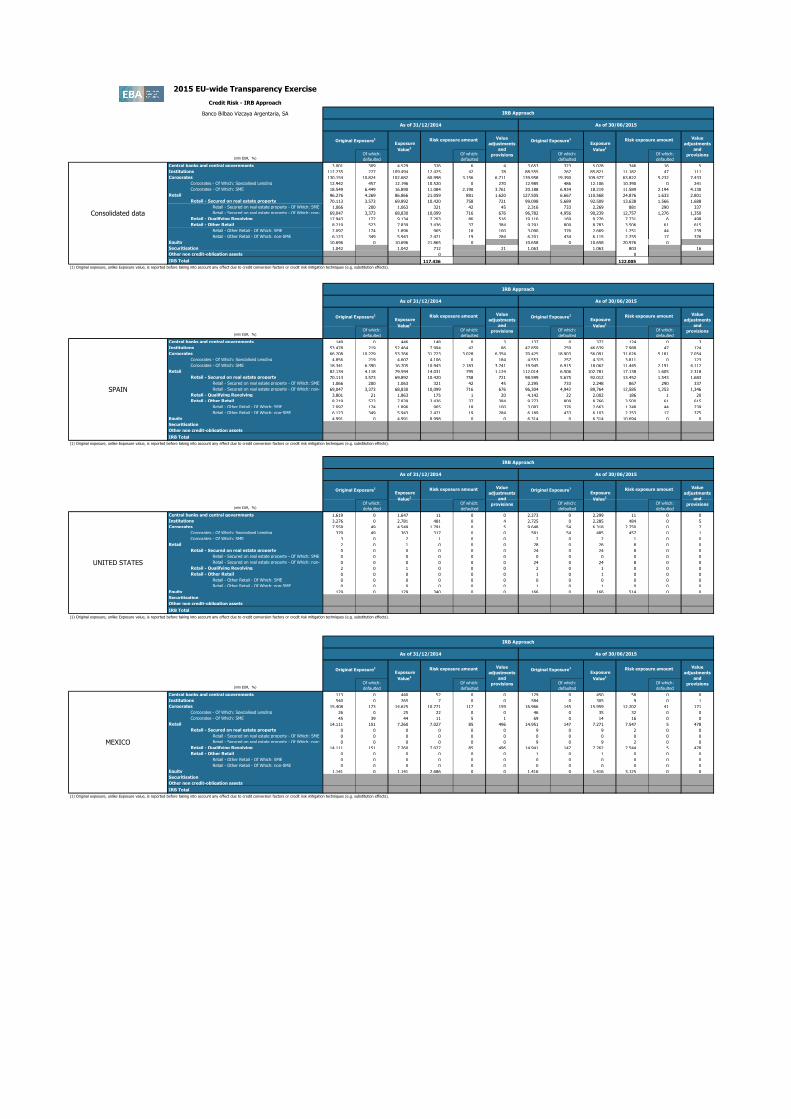
Credit Risk - IRB Approach
Banco Bilbao Vizcaya Argentaria, SA
(mln EUR, %)Of which:
defaulted
Of which:
defaulted
Of which:
defaulted
Of which:
defaulted
Central banks and central governments 3,001 309 4,529 376 6 4 3,653 323 5,078 346 16 5
Institutions 112,235 227 109,494 12,425 42 78 88,555 267 85,821 11,182 47 111
Corporates 130,154 10,824 102,682 60,998 3,156 6,711 139,958 19,390 109,477 63,822 5,232 7,433
Corporates - Of Which: Specialised Lending 12,942 457 12,196 10,520 0 270 12,985 486 12,106 10,390 0 241
Corporates - Of Which: SME 18,549 6,449 16,890 11,084 2,190 3,761 20,188 6,934 18,219 11,589 2,194 4,130
Retail 96,276 4,269 86,866 21,059 881 1,620 127,505 6,667 110,568 24,876 1,633 2,801
Retail - Secured on real estate property 70,113 3,573 69,892 10,420 758 721 99,098 5,689 92,509 13,638 1,566 1,688
Retail - Secured on real estate property - Of Which: SME 1,066 200 1,063 321 42 45 2,316 733 2,269 881 290 337
Retail - Secured on real estate property - Of Which: non-
SME
69,047 3,373 68,830 10,099 716 676 96,782 4,956 90,239 12,757 1,276 1,350
Retail - Qualifying Revolving 17,943 172 9,134 7,203 86 516 19,116 169 9,276 7,731 6 498
Retail - Other Retail 8,219 523 7,839 3,436 37 384 9,291 809 8,783 3,506 61 615
Retail - Other Retail - Of Which: SME 2,097 174 1,896 965 18 100 3,090 376 2,669 1,251 44 239
Retail - Other Retail - Of Which: non-SME 6,123 349 5,943 2,471 19 284 6,201 434 6,115 2,255 17 376
Equity 10,696 0 10,696 21,865 0 10,658 0 10,658 20,976 0
Securitisation 1,042 1,042 712 21 1,063 1,063 803 16
Other non credit-obligation assets 0 0
IRB Total 117,436 122,005
(1) Original exposure, unlike Exposure value, is reported before taking into account any effect due to credit conversion factors or credit risk mitigation techniques (e.g. substitution effects).
1 (mln EUR, %)Of which:
defaulted
Of which:
defaulted
Of which:
defaulted
Of which:
defaulted
Central banks and central governments 149 0 446 148 0 3 137 0 372 124 0 3
Institutions 53,478 219 52,464 7,994 42 86 47,859 259 46,639 7,988 47 124
Corporates 66,208 10,229 53,766 31,723 3,028 6,354 70,425 18,903 56,091 31,626 5,181 7,054
Corporates - Of Which: Specialised Lending 4,856 219 4,607 4,106 0 184 4,553 257 4,315 3,811 0 123
Corporates - Of Which: SME 18,341 6,390 16,705 10,943 2,183 3,741 19,945 6,915 18,062 11,445 2,191 4,112
Retail 82,134 4,118 79,594 14,031 795 1,124 112,014 6,506 102,781 17,138 1,605 2,318
Retail - Secured on real estate property 70,113 3,573 69,892 10,420 758 721 98,599 5,675 92,012 13,452 1,543 1,683
Retail - Secured on real estate property - Of Which: SME 1,066 200 1,063 321 42 45 2,295 733 2,248 867 290 337
Retail - Secured on real estate property - Of Which: non-
SME
69,047 3,373 68,830 10,099 716 676 96,304 4,942 89,764 12,585 1,253 1,346
Retail - Qualifying Revolving 3,801 21 1,863 175 1 20 4,142 22 2,002 186 1 20
Retail - Other Retail 8,219 523 7,839 3,436 37 384 9,273 809 8,766 3,500 61 615
Retail - Other Retail - Of Which: SME 2,097 174 1,896 965 18 100 3,083 376 2,663 1,248 44 239
Retail - Other Retail - Of Which: non-SME 6,123 349 5,943 2,471 19 284 6,189 433 6,103 2,253 17 375
Equity 4,991 0 4,991 8,998 0 0 6,314 0 6,314 10,694 0 0
Securitisation
Other non credit-obligation assets
IRB Total
(1) Original exposure, unlike Exposure value, is reported before taking into account any effect due to credit conversion factors or credit risk mitigation techniques (e.g. substitution effects).
2 (mln EUR, %)Of which:
defaulted
Of which:
defaulted
Of which:
defaulted
Of which:
defaulted
Central banks and central governments 1,619 0 1,647 11 0 0 2,273 0 2,299 11 0 0
Institutions 3,276 0 2,781 481 0 4 2,725 0 2,285 484 0 5
Corporates 7,558 49 4,549 1,791 0 5 9,648 54 6,318 2,750 0 7
Corporates - Of Which: Specialised Lending 379 49 363 317 0 0 581 54 485 457 0 1
Corporates - Of Which: SME 3 0 2 1 0 0 2 0 2 1 0 0
Retail 2 0 1 0 0 0 28 0 26 8 0 0
Retail - Secured on real estate property 0 0 0 0 0 0 24 0 24 8 0 0
Retail - Secured on real estate property - Of Which: SME 0 0 0 0 0 0 0 0 0 0 0 0
Retail - Secured on real estate property - Of Which: non-
SME
0 0 0 0 0 0 24 0 24 8 0 0
Retail - Qualifying Revolving 2 0 1 0 0 0 2 0 1 0 0 0
Retail - Other Retail 0 0 0 0 0 0 1 0 1 0 0 0
Retail - Other Retail - Of Which: SME 0 0 0 0 0 0 0 0 0 0 0 0
Retail - Other Retail - Of Which: non-SME 0 0 0 0 0 0 1 0 1 0 0 0
Equity 129 0 129 340 0 0 166 0 166 514 0 0
Securitisation
Other non credit-obligation assets
IRB Total
(1) Original exposure, unlike Exposure value, is reported before taking into account any effect due to credit conversion factors or credit risk mitigation techniques (e.g. substitution effects).
3 (mln EUR, %)Of which:
defaulted
Of which:
defaulted
Of which:
defaulted
Of which:
defaulted
Central banks and central governments 113 0 440 52 0 0 129 0 450 58 0 0
Institutions 540 0 265 7 0 0 584 0 305 9 0 1
Corporates 15,408 173 14,625 10,771 117 159 16,966 145 15,959 12,202 41 171
Corporates - Of Which: Specialised Lending 26 0 25 22 0 0 46 0 35 32 0 0
Corporates - Of Which: SME 45 39 44 11 5 1 69 0 14 16 0 0
Retail 14,111 151 7,260 7,027 85 496 14,951 147 7,271 7,547 5 478
Retail - Secured on real estate property 0 0 0 0 0 0 9 0 9 2 0 0
Retail - Secured on real estate property - Of Which: SME 0 0 0 0 0 0 0 0 0 0 0 0
Retail - Secured on real estate property - Of Which: non-
SME
0 0 0 0 0 0 9 0 9 2 0 0
Retail - Qualifying Revolving 14,111 151 7,260 7,027 85 496 14,941 147 7,262 7,544 5 478
Retail - Other Retail 0 0 0 0 0 0 1 0 1 0 0 0
Retail - Other Retail - Of Which: SME 0 0 0 0 0 0 0 0 0 0 0 0
Retail - Other Retail - Of Which: non-SME 0 0 0 0 0 0 0 0 0 0 0 0
Equity 1,141 0 1,141 2,686 0 0 1,416 0 1,416 3,125 0 0
Securitisation
Other non credit-obligation assets
IRB Total
(1) Original exposure, unlike Exposure value, is reported before taking into account any effect due to credit conversion factors or credit risk mitigation techniques (e.g. substitution effects).
Risk exposure amount Value
adjustments
and
provisions
MEXICO
Original Exposure1
Exposure
Value1
Risk exposure amount Value
adjustments
and
provisions
Original Exposure1
Exposure
Value1
Risk exposure amount Value
adjustments
and
provisions
UNITED STATES
IRB Approach
As of 31/12/2014 As of 30/06/2015
Original Exposure1
Exposure
Value1
Risk exposure amount Value
adjustments
and
provisions
Original Exposure1
Exposure
Value1
Exposure
Value1
Risk exposure amount Value
adjustments
and
provisions
SPAIN
IRB Approach
As of 31/12/2014 As of 30/06/2015
Value
adjustments
and
provisions
Consolidated data
IRB Approach
As of 31/12/2014 As of 30/06/2015
Original Exposure1
Exposure
Value1
Risk exposure amount Value
adjustments
and
provisions
Original Exposure1
IRB Approach
As of 31/12/2014 As of 30/06/2015
Original Exposure1
Exposure
Value1
Risk exposure amount Value
adjustments
and
provisions
Original Exposure1
Exposure
Value1
Risk exposure amount
4 (mln EUR, %)Of which:
defaulted
Of which:
defaulted
Of which:
defaulted
Of which:
defaulted
Central banks and central governments 0 0 2 0 0 0 0 0 6 0 0 0
Institutions 27,369 0 27,026 720 0 0 13,220 0 12,985 455 0 0
Corporates 6,907 19 4,850 2,500 3 11 6,601 18 4,571 2,469 3 9
Corporates - Of Which: Specialised Lending 1,899 0 1,697 1,268 0 2 1,854 0 1,638 1,257 0 2
Corporates - Of Which: SME 78 4 78 98 2 2 77 2 75 95 1 1
Retail 3 0 1 0 0 0 35 1 33 16 2 1
Retail - Secured on real estate property 0 0 0 0 0 0 30 1 30 15 2 0
Retail - Secured on real estate property - Of Which: SME 0 0 0 0 0 0 1 0 1 3 0 0
Retail - Secured on real estate property - Of Which: non-
SME
0 0 0 0 0 0 29 1 29 12 2 0
Retail - Qualifying Revolving 3 0 1 0 0 0 3 0 1 0 0 0
Retail - Other Retail 0 0 0 0 0 0 2 0 2 1 0 0
Retail - Other Retail - Of Which: SME 0 0 0 0 0 0 1 0 1 0 0 0
Retail - Other Retail - Of Which: non-SME 0 0 0 0 0 0 1 0 1 0 0 0
Equity 54 0 54 158 0 0 57 0 57 201 0 0
Securitisation
Other non credit-obligation assets
IRB Total
(1) Original exposure, unlike Exposure value, is reported before taking into account any effect due to credit conversion factors or credit risk mitigation techniques (e.g. substitution effects).
5 (mln EUR, %)Of which:
defaulted
Of which:
defaulted
Of which:
defaulted
Of which:
defaulted
Central banks and central governments 1 0 166 16 0 0 1 0 180 21 0 0
Institutions 13 0 6 1 0 0 8 0 4 1 0 0
Corporates 688 0 469 257 0 1 640 0 421 284 0 1
Corporates - Of Which: Specialised Lending 261 0 246 182 0 0 271 0 254 189 0 0
Corporates - Of Which: SME 2 0 2 1 0 0 2 0 2 1 0 0
Retail 0 0 0 0 0 0 2 0 2 0 0 0
Retail - Secured on real estate property 0 0 0 0 0 0 2 0 2 0 0 0
Retail - Secured on real estate property - Of Which: SME 0 0 0 0 0 0 0 0 0 0 0 0
Retail - Secured on real estate property - Of Which: non-
SME
0 0 0 0 0 0 2 0 2 0 0 0
Retail - Qualifying Revolving 0 0 0 0 0 0 0 0 0 0 0 0
Retail - Other Retail 0 0 0 0 0 0 0 0 0 0 0 0
Retail - Other Retail - Of Which: SME 0 0 0 0 0 0 0 0 0 0 0 0
Retail - Other Retail - Of Which: non-SME 0 0 0 0 0 0 0 0 0 0 0 0
Equity 14 0 14 38 0 0 15 0 15 42 0 0
Securitisation
Other non credit-obligation assets
IRB Total
(1) Original exposure, unlike Exposure value, is reported before taking into account any effect due to credit conversion factors or credit risk mitigation techniques (e.g. substitution effects).
6 (mln EUR, %)Of which:
defaulted
Of which:
defaulted
Of which:
defaulted
Of which:
defaulted
Central banks and central governments 3 0 143 3 0 0 2 0 152 3 0 0
Institutions 18 0 13 5 0 0 9 0 5 2 0 0
Corporates 347 0 136 83 0 0 528 0 275 201 0 0
Corporates - Of Which: Specialised Lending 134 0 67 47 0 0 279 0 178 140 0 0
Corporates - Of Which: SME 14 0 2 0 0 0 14 0 2 0 0 0
Retail 0 0 0 0 0 0 0 0 0 0 0 0
Retail - Secured on real estate property 0 0 0 0 0 0 0 0 0 0 0 0
Retail - Secured on real estate property - Of Which: SME 0 0 0 0 0 0 0 0 0 0 0 0
Retail - Secured on real estate property - Of Which: non-
SME
0 0 0 0 0 0 0 0 0 0 0 0
Retail - Qualifying Revolving 0 0 0 0 0 0 0 0 0 0 0 0
Retail - Other Retail 0 0 0 0 0 0 0 0 0 0 0 0
Retail - Other Retail - Of Which: SME 0 0 0 0 0 0 0 0 0 0 0 0
Retail - Other Retail - Of Which: non-SME 0 0 0 0 0 0 0 0 0 0 0 0
Equity 79 0 79 193 0 0 96 0 96 235 0 0
Securitisation
Other non credit-obligation assets
IRB Total
(1) Original exposure, unlike Exposure value, is reported before taking into account any effect due to credit conversion factors or credit risk mitigation techniques (e.g. substitution effects).
7 (mln EUR, %)Of which:
defaulted
Of which:
defaulted
Of which:
defaulted
Of which:
defaulted
Central banks and central governments 178 178 95 0 0 0 178 178 95 13 13 0
Institutions 21 0 18 4 0 0 38 0 35 9 0 0
Corporates 4 0 4 2 0 0 17 0 7 2 0 0
Corporates - Of Which: Specialised Lending 0 0 0 0 0 0 0 0 0 0 0 0
Corporates - Of Which: SME 0 0 0 0 0 0 0 0 0 0 0 0
Retail 4 0 2 0 0 0 18 0 15 3 0 0
Retail - Secured on real estate property 0 0 0 0 0 0 12 0 12 3 0 0
Retail - Secured on real estate property - Of Which: SME 0 0 0 0 0 0 0 0 0 0 0 0
Retail - Secured on real estate property - Of Which: non-
SME
0 0 0 0 0 0 12 0 12 3 0 0
Retail - Qualifying Revolving 4 0 1 0 0 0 4 0 2 0 0 0
Retail - Other Retail 0 0 0 0 0 0 1 0 1 0 0 0
Retail - Other Retail - Of Which: SME 0 0 0 0 0 0 0 0 0 0 0 0
Retail - Other Retail - Of Which: non-SME 0 0 0 0 0 0 1 0 1 0 0 0
Equity 56 0 56 138 0 0 10 0 10 24 0 0
Securitisation
Other non credit-obligation assets
IRB Total
(1) Original exposure, unlike Exposure value, is reported before taking into account any effect due to credit conversion factors or credit risk mitigation techniques (e.g. substitution effects).
Risk exposure amount Value
adjustments
and
provisions
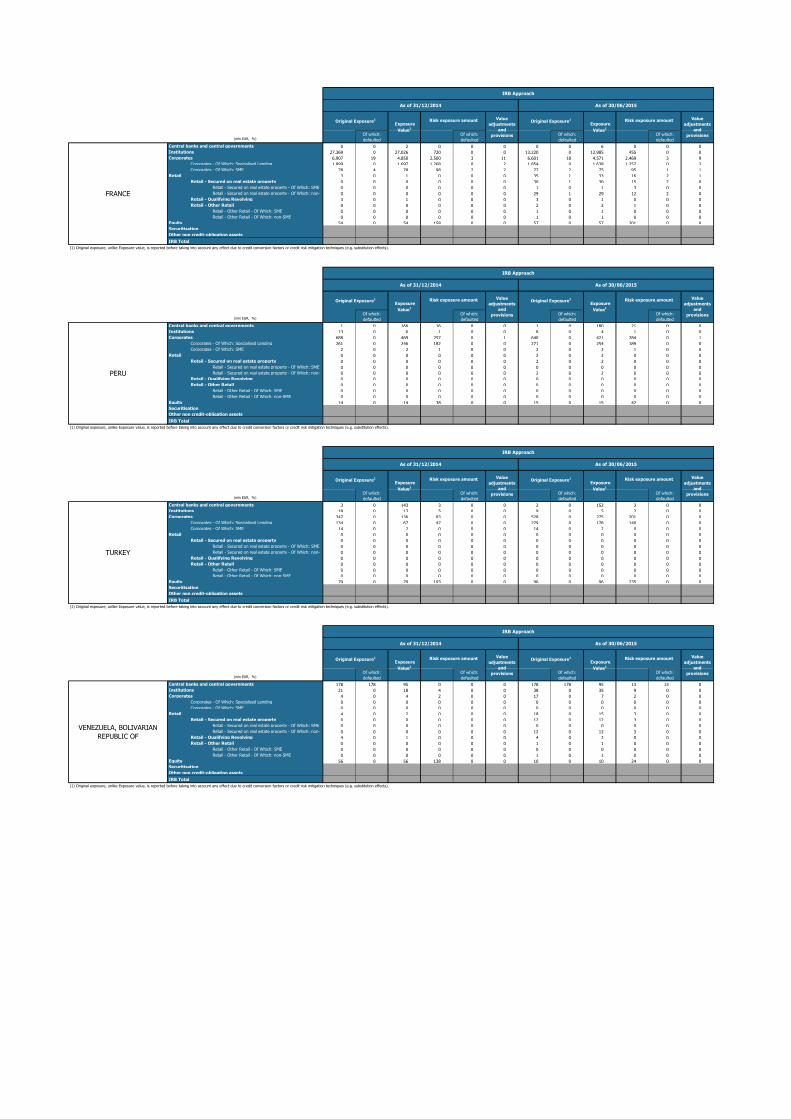
VENEZUELA, BOLIVARIAN
REPUBLIC OF
Original Exposure1
Exposure
Value1
Risk exposure amount Value
adjustments
and
provisions
Original Exposure1
Exposure
Value1
Risk exposure amount Value
adjustments
and
provisions
TURKEY
IRB Approach
As of 31/12/2014 As of 30/06/2015
Original Exposure1
Exposure
Value1
Risk exposure amount Value
adjustments
and
provisions
Original Exposure1
Exposure
Value1
Risk exposure amount Value
adjustments
and
provisions
PERU
IRB Approach
As of 31/12/2014 As of 30/06/2015
Original Exposure1
Exposure
Value1
Risk exposure amount Value
adjustments
and
provisions
Original Exposure1
Exposure
Value1
Risk exposure amount Value
adjustments
and
provisions
FRANCE
IRB Approach
As of 31/12/2014 As of 30/06/2015
Original Exposure1
Exposure
Value1
Risk exposure amount Value
adjustments
and
provisions
Original Exposure1
Exposure
Value1
IRB Approach
As of 31/12/2014 As of 30/06/2015
8 (mln EUR, %)Of which:
defaulted
Of which:
defaulted
Of which:
defaulted
Of which:
defaulted
Central banks and central governments 1 0 4 0 0 0 0 0 4 0 0 0
Institutions 40 0 38 1 0 0 51 0 49 4 0 0
Corporates 476 0 382 197 0 1 610 0 442 217 0 1
Corporates - Of Which: Specialised Lending 0 0 0 0 0 0 0 0 0 0 0 0
Corporates - Of Which: SME 0 0 0 0 0 0 1 0 0 0 0 0
Retail 0 0 0 0 0 0 3 0 3 1 0 0
Retail - Secured on real estate property 0 0 0 0 0 0 2 0 2 1 0 0
Retail - Secured on real estate property - Of Which: SME 0 0 0 0 0 0 0 0 0 0 0 0
Retail - Secured on real estate property - Of Which: non-
SME
0 0 0 0 0 0 2 0 2 1 0 0
Retail - Qualifying Revolving 0 0 0 0 0 0 0 0 0 0 0 0
Retail - Other Retail 0 0 0 0 0 0 1 0 1 0 0 0
Retail - Other Retail - Of Which: SME 0 0 0 0 0 0 0 0 0 0 0 0
Retail - Other Retail - Of Which: non-SME 0 0 0 0 0 0 1 0 1 0 0 0
Equity 77 0 77 190 0 0 81 0 81 202 0 0
Securitisation
Other non credit-obligation assets
IRB Total
(1) Original exposure, unlike Exposure value, is reported before taking into account any effect due to credit conversion factors or credit risk mitigation techniques (e.g. substitution effects).
9 (mln EUR, %)Of which:
defaulted
Of which:
defaulted
Of which:
defaulted
Of which:
defaulted
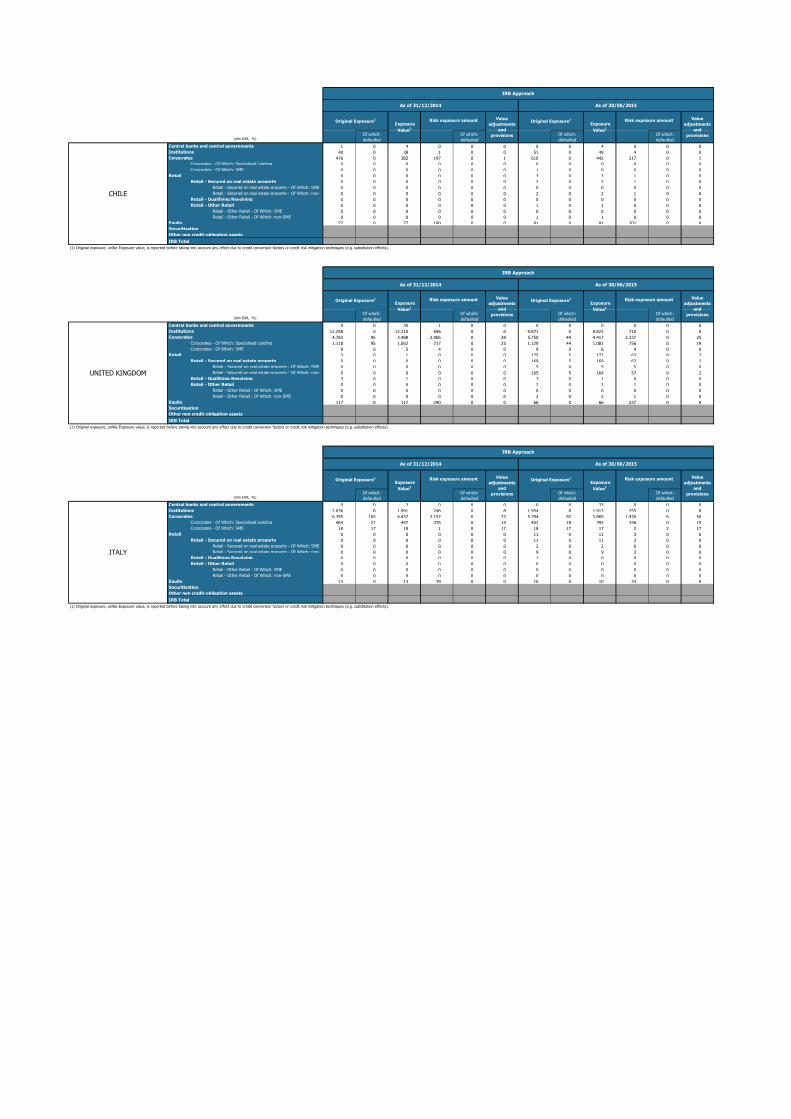
Central banks and central governments 0 0 35 1 0 0 0 0 0 0 0 0
Institutions 12,258 0 12,210 696 0 0 9,871 0 9,822 710 0 0
Corporates 4,783 95 3,488 2,006 0 28 5,750 44 4,417 2,337 0 25
Corporates - Of Which: Specialised Lending 1,118 95 1,062 717 0 25 1,129 44 1,081 756 0 19
Corporates - Of Which: SME 9 0 5 4 0 0 9 0 6 4 0 0
Retail 3 0 1 0 0 0 175 5 172 63 9 2
Retail - Secured on real estate property 0 0 0 0 0 0 169 5 169 62 9 2
Retail - Secured on real estate property - Of Which: SME 0 0 0 0 0 0 5 0 5 5 0 0
Retail - Secured on real estate property - Of Which: non-
SME
0 0 0 0 0 0 165 5 164 57 9 2
Retail - Qualifying Revolving 3 0 1 0 0 0 3 0 1 0 0 0
Retail - Other Retail 0 0 0 0 0 0 2 0 2 1 0 0
Retail - Other Retail - Of Which: SME 0 0 0 0 0 0 0 0 0 0 0 0
Retail - Other Retail - Of Which: non-SME 0 0 0 0 0 0 2 0 2 1 0 0
Equity 117 0 117 340 0 0 66 0 66 237 0 0
Securitisation
Other non credit-obligation assets
IRB Total
(1) Original exposure, unlike Exposure value, is reported before taking into account any effect due to credit conversion factors or credit risk mitigation techniques (e.g. substitution effects).
10 (mln EUR, %)Of which:
defaulted
Of which:
defaulted
Of which:
defaulted
Of which:
defaulted
Central banks and central governments 0 0 3 0 0 0 0 0 33 0 0 0
Institutions 2,036 8 1,991 246 0 8 1,954 8 1,913 255 0 8
Corporates 6,395 165 4,437 2,157 6 77 5,794 92 3,865 1,976 6 50
Corporates - Of Which: Specialised Lending 464 21 447 376 0 14 402 18 392 336 0 15
Corporates - Of Which: SME 18 17 18 1 0 17 18 17 17 2 2 17
Retail 0 0 0 0 0 0 11 0 11 3 0 0
Retail - Secured on real estate property 0 0 0 0 0 0 11 0 11 3 0 0
Retail - Secured on real estate property - Of Which: SME 0 0 0 0 0 0 2 0 2 0 0 0
Retail - Secured on real estate property - Of Which: non-
SME
0 0 0 0 0 0 9 0 9 3 0 0
Retail - Qualifying Revolving 0 0 0 0 0 0 1 0 0 0 0 0
Retail - Other Retail 0 0 0 0 0 0 0 0 0 0 0 0
Retail - Other Retail - Of Which: SME 0 0 0 0 0 0 0 0 0 0 0 0
Retail - Other Retail - Of Which: non-SME 0 0 0 0 0 0 0 0 0 0 0 0
Equity 13 0 13 39 0 0 10 0 10 33 0 0
Securitisation
Other non credit-obligation assets
IRB Total
(1) Original exposure, unlike Exposure value, is reported before taking into account any effect due to credit conversion factors or credit risk mitigation techniques (e.g. substitution effects).
Risk exposure amount Value
adjustments
and
provisions
ITALY
Original Exposure1
Exposure
Value1
Risk exposure amount Value
adjustments
and
provisions
Original Exposure1
Exposure
Value1
Risk exposure amount Value
adjustments
and
provisions
UNITED KINGDOM
IRB Approach
As of 31/12/2014 As of 30/06/2015
Original Exposure1
Exposure
Value1
Risk exposure amount Value
adjustments
and
provisions
Original Exposure1
Exposure
Value1
Risk exposure amount Value
adjustments
and
provisions
CHILE
IRB Approach
As of 31/12/2014 As of 30/06/2015
Original Exposure1
Exposure
Value1
Risk exposure amount Value
adjustments
and
provisions
Original Exposure1
Exposure
Value1
IRB Approach
As of 31/12/2014 As of 30/06/2015
(mln EUR)
[ 0 - 3M [ 0 0 0 0 0 0 0 0 0 0 0 0 0 0[ 3M - 1Y [ 0 0 0 0 0 0 0 0 0 0 40 0 -40 0[ 1Y - 2Y [ 6 0 6 4 0 1 0 0 0 0 1 0 -10 0[ 2Y - 3Y [ 1 0 1 0 0 1 0 0 0 0 0 0 0 0[3Y - 5Y [ 2 0 2 0 0 2 0 0 0 0 0 0 0 0
[5Y - 10Y [ 9 0 4 0 0 4 0 0 0 0 0 0 0 0[10Y - more 4 0 4 0 0 4 0 0 0 0 0 0 0 0
Total 22 0 17 4 0 12 0 0 0 0 42 0 -50 0
[ 0 - 3M [ 32 0 32 18 0 14 0 0 0 0 50 0 -100 0[ 3M - 1Y [ 0 0 -13 0 0 -13 0 0 0 0 32 0 -36 0[ 1Y - 2Y [ 266 0 127 0 0 127 0 0 0 0 10 0 -10 0[ 2Y - 3Y [ 87 0 85 15 0 70 0 0 0 0 41 1 -48 -1[3Y - 5Y [ 13 0 11 0 0 11 0 0 0 0 126 4 -66 -2
[5Y - 10Y [ 38 0 -54 0 0 -54 0 0 0 0 77 6 -1 -6[10Y - more 32 32 -4 0 0 -4 0 0 0 0 0 0 0 0
Total 468 32 185 33 0 152 0 0 0 0 336 11 -261 -9
[ 0 - 3M [ 0 0 0 0 0 0 0 0 0 0 0 0 0 0[ 3M - 1Y [ 0 0 0 0 0 0 0 0 0 0 0 0 0 0[ 1Y - 2Y [ 0 0 0 0 0 0 0 0 0 0 0 0 0 0[ 2Y - 3Y [ 0 0 0 0 0 0 0 0 0 0 0 0 0 0[3Y - 5Y [ 0 0 0 0 0 0 0 0 0 0 0 0 0 0
[5Y - 10Y [ 0 0 0 0 0 0 0 0 0 0 0 0 0 0[10Y - more 0 0 0 0 0 0 0 0 0 0 0 0 0 0
Total 0 0 0 0 0 0 0 0 0 0 0 0 0 0
[ 0 - 3M [ 0 0 0 0 0 0 0 0 0 0 0 0 0 0[ 3M - 1Y [ 0 0 0 0 0 0 0 0 0 0 7 0 -7 0[ 1Y - 2Y [ 0 0 0 0 0 0 0 0 0 0 1 0 -1 0[ 2Y - 3Y [ 0 0 0 0 0 0 0 0 0 0 0 0 0 0[3Y - 5Y [ 0 0 0 0 0 0 0 0 0 0 0 0 0 0
[5Y - 10Y [ 0 0 0 0 0 0 0 0 0 0 0 0 0 0[10Y - more 0 0 0 0 0 0 0 0 0 0 0 0 0 0
Total 0 0 0 0 0 0 0 0 0 0 9 0 -9 0
[ 0 - 3M [ 0 0 0 0 0 0 0 0 0 0 0 0 0 0[ 3M - 1Y [ 0 0 0 0 0 0 0 0 0 0 0 0 0 0[ 1Y - 2Y [ 0 0 0 0 0 0 0 0 0 0 0 0 0 0[ 2Y - 3Y [ 0 0 0 0 0 0 0 0 0 0 0 0 0 0[3Y - 5Y [ 0 0 0 0 0 0 0 0 0 0 0 0 0 0
[5Y - 10Y [ 0 0 0 0 0 0 0 0 0 0 0 0 0 0[10Y - more 0 0 0 0 0 0 0 0 0 0 0 0 0 0
Total 0 0 0 0 0 0 0 0 0 0 0 0 0 0
[ 0 - 3M [ 0 0 0 0 0 0 0 0 0 0 0 0 0 0[ 3M - 1Y [ 0 0 0 0 0 0 0 0 0 0 7 0 -7 0[ 1Y - 2Y [ 0 0 0 0 0 0 0 0 0 0 10 0 -10 0[ 2Y - 3Y [ 12 0 12 12 0 0 0 0 0 0 0 0 0 0[3Y - 5Y [ 0 0 0 0 0 0 0 0 0 0 0 0 0 0
[5Y - 10Y [ 0 0 0 0 0 0 0 0 0 0 0 0 0 0[10Y - more 0 0 0 0 0 0 0 0 0 0 0 0 0 0
Total 12 0 12 12 0 0 0 0 0 0 17 0 -17 0
[ 0 - 3M [ 91 0 71 0 0 71 0 0 0 0 41 0 -38 0[ 3M - 1Y [ 615 0 532 40 0 492 0 0 0 0 83 0 -38 0[ 1Y - 2Y [ 52 0 -156 0 0 -156 0 0 0 0 3 0 -1 0[ 2Y - 3Y [ 66 0 -33 0 0 -33 0 0 0 0 24 1 5 -1[3Y - 5Y [ 32 0 -8 0 0 -8 0 0 0 0 101 1 -50 0
[5Y - 10Y [ 39 0 -105 0 0 -105 0 0 0 0 0 0 0 0[10Y - more 44 28 4 0 0 4 0 0 0 0 0 0 0 0
Total 939 28 304 40 0 264 0 0 0 0 253 2 -123 -1
Belgium
Bulgaria
Cyprus
Czech Republic
Denmark
Estonia
Finland
France
Austria
Fair-value (-) Notional value Fair-value (+) Notional value Fair-value (-)
INDIRECT SOVEREIGN EXPOSURES (3) (on and off balance sheet)
Derivatives with positive fair valueDerivatives with negative fair
value
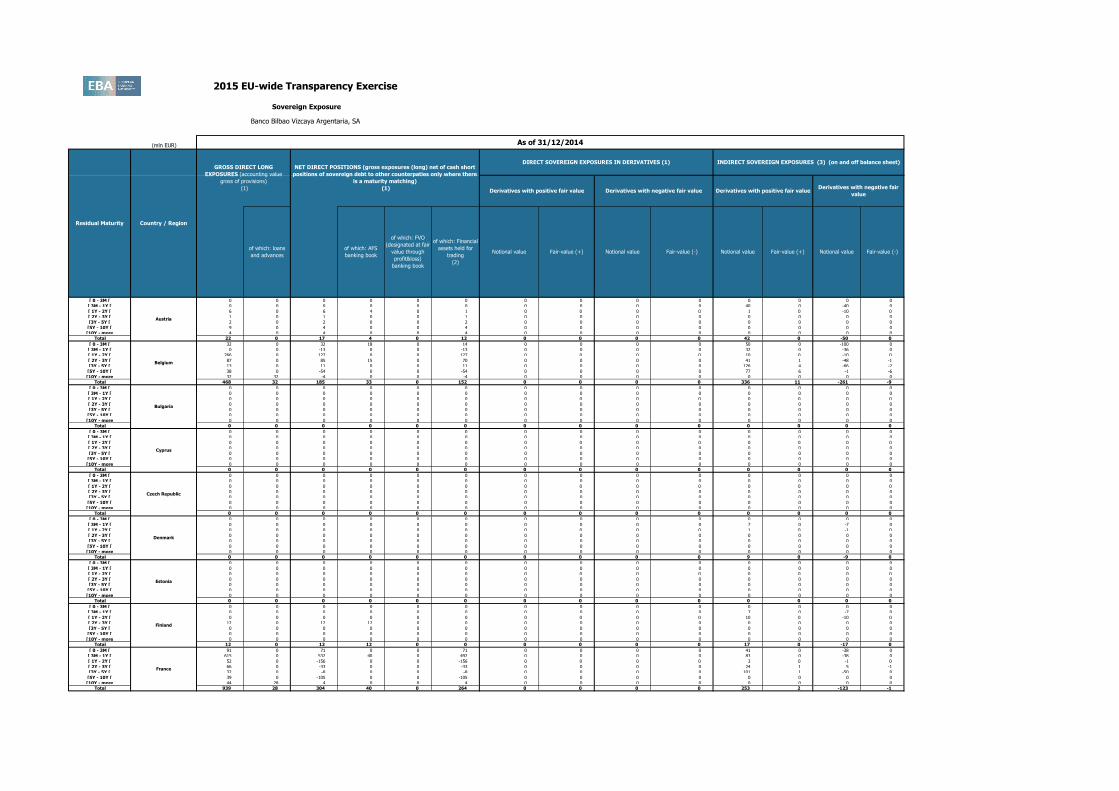
2015 EU-wide Transparency Exercise
Sovereign Exposure
Banco Bilbao Vizcaya Argentaria, SA
As of 31/12/2014
Residual Maturity Country / Region
GROSS DIRECT LONG
EXPOSURES (accounting value
gross of provisions)
(1)
NET DIRECT POSITIONS (gross exposures (long) net of cash short
positions of sovereign debt to other counterpaties only where there
is a maturity matching)
(1)
DIRECT SOVEREIGN EXPOSURES IN DERIVATIVES (1)
of which: loans
and advances
of which: AFS
banking book
of which: FVO
(designated at fair
value through
profit&loss)
banking book
of which: Financial
assets held for
trading
(2)
Notional value Fair-value (+) Notional value
Derivatives with positive fair value Derivatives with negative fair value

(mln EUR)
Austria
Fair-value (-) Notional value Fair-value (+) Notional value Fair-value (-)
INDIRECT SOVEREIGN EXPOSURES (3) (on and off balance sheet)
Derivatives with positive fair valueDerivatives with negative fair
value
2015 EU-wide Transparency Exercise
Sovereign Exposure
Banco Bilbao Vizcaya Argentaria, SA
As of 31/12/2014
Residual Maturity Country / Region
GROSS DIRECT LONG
EXPOSURES (accounting value
gross of provisions)
(1)
NET DIRECT POSITIONS (gross exposures (long) net of cash short
positions of sovereign debt to other counterpaties only where there
is a maturity matching)
(1)
DIRECT SOVEREIGN EXPOSURES IN DERIVATIVES (1)
of which: loans
and advances
of which: AFS
banking book
of which: FVO
(designated at fair
value through
profit&loss)
banking book
of which: Financial
assets held for
trading
(2)
Notional value Fair-value (+) Notional value
Derivatives with positive fair value Derivatives with negative fair value
[ 0 - 3M [ 38 0 23 0 0 23 0 0 0 0 21 0 -824 0[ 3M - 1Y [ 142 0 84 84 0 0 0 0 0 0 48 0 -44 0[ 1Y - 2Y [ 42 0 -254 0 0 -254 0 0 0 0 1 0 -1 0[ 2Y - 3Y [ 78 0 32 0 0 32 0 0 0 0 26 0 -26 0[3Y - 5Y [ 49 0 -56 0 0 -56 0 0 0 0 25 0 -47 -1
[5Y - 10Y [ 189 0 -61 8 0 -69 0 0 0 0 -1 0 0 0[10Y - more 36 0 -6 0 0 -6 0 0 0 0 0 0 0 0
Total 574 0 -239 92 0 -331 0 0 0 0 120 0 -941 -1
[ 0 - 3M [ 0 0 0 0 0 0 0 0 0 0 0 0 0 0[ 3M - 1Y [ 0 0 0 0 0 0 0 0 0 0 0 0 0 0[ 1Y - 2Y [ 0 0 0 0 0 0 0 0 0 0 0 0 0 0[ 2Y - 3Y [ 0 0 0 0 0 0 0 0 0 0 0 0 0 0[3Y - 5Y [ 0 0 0 0 0 0 0 0 0 0 0 0 0 0
[5Y - 10Y [ 0 0 0 0 0 0 0 0 0 0 0 0 0 0[10Y - more 0 0 0 0 0 0 0 0 0 0 0 0 0 0
Total 0 0 0 0 0 0 0 0 0 0 0 0 0 0
[ 0 - 3M [ 0 0 0 0 0 0 0 0 0 0 0 0 0 0[ 3M - 1Y [ 0 0 0 0 0 0 0 0 0 0 7 0 -7 0[ 1Y - 2Y [ 0 0 0 0 0 0 0 0 0 0 1 0 -1 0[ 2Y - 3Y [ 0 0 0 0 0 0 0 0 0 0 0 0 0 0[3Y - 5Y [ 0 0 0 0 0 0 0 0 0 0 0 0 0 0
[5Y - 10Y [ 0 0 0 0 0 0 0 0 0 0 0 0 0 0[10Y - more 0 0 0 0 0 0 0 0 0 0 0 0 0 0
Total 0 0 0 0 0 0 0 0 0 0 9 0 -9 0
[ 0 - 3M [ 0 0 0 0 0 0 0 0 0 0 1 0 0 0[ 3M - 1Y [ 0 0 0 0 0 0 0 0 0 0 1 0 -2 0[ 1Y - 2Y [ 0 0 0 0 0 0 0 0 0 0 0 0 0 0[ 2Y - 3Y [ 0 0 0 0 0 0 0 0 0 0 0 0 0 0[3Y - 5Y [ 0 0 0 0 0 0 0 0 0 0 0 0 0 0
[5Y - 10Y [ 0 0 0 0 0 0 0 0 0 0 0 0 0 0[10Y - more 0 0 0 0 0 0 0 0 0 0 0 0 0 0
Total 0 0 0 0 0 0 0 0 0 0 2 0 -2 0
[ 0 - 3M [ 0 0 0 0 0 0 0 0 0 0 0 0 0 0[ 3M - 1Y [ 0 0 0 0 0 0 0 0 0 0 7 0 -7 0[ 1Y - 2Y [ 0 0 0 0 0 0 0 0 0 0 1 0 -1 0[ 2Y - 3Y [ 0 0 0 0 0 0 0 0 0 0 0 0 0 0[3Y - 5Y [ 1 0 1 0 0 1 0 0 0 0 0 0 0 0
[5Y - 10Y [ 167 0 167 167 0 0 0 0 0 0 0 0 0 0[10Y - more 0 0 0 0 0 0 0 0 0 0 0 0 0 0
Total 168 0 168 167 0 1 0 0 0 0 9 0 -9 0
[ 0 - 3M [ 191 4 187 51 0 136 0 0 0 0 40 0 -299 0[ 3M - 1Y [ 241 45 -42 15 0 -57 0 0 0 0 655 3 -201 -6[ 1Y - 2Y [ 266 23 -134 34 0 -169 0 0 0 0 333 1 -187 -1[ 2Y - 3Y [ 598 0 311 177 0 134 0 0 0 0 -96 0 50 0[3Y - 5Y [ 4,217 0 4,081 4,091 0 -11 0 0 0 0 -46 2 -187 -4
[5Y - 10Y [ 2,704 69 2,444 1,418 0 1,026 0 0 0 0 1,593 228 -2,961 -347[10Y - more 989 0 895 815 0 80 0 0 0 0 61 2 -50 -7
Total 9,206 141 7,742 6,601 0 1,139 0 0 0 0 2,541 235 -3,834 -366
[ 0 - 3M [ 0 0 0 0 0 0 0 0 0 0 0 0 0 0[ 3M - 1Y [ 0 0 0 0 0 0 0 0 0 0 0 0 0 0[ 1Y - 2Y [ 0 0 0 0 0 0 0 0 0 0 0 0 0 0[ 2Y - 3Y [ 0 0 0 0 0 0 0 0 0 0 0 0 0 0[3Y - 5Y [ 0 0 0 0 0 0 0 0 0 0 0 0 0 0
[5Y - 10Y [ 0 0 0 0 0 0 0 0 0 0 0 0 0 0[10Y - more 0 0 0 0 0 0 0 0 0 0 0 0 0 0
Total 0 0 0 0 0 0 0 0 0 0 0 0 0 0
Ireland
Italy
Latvia
Lithuania
Luxembourg
Hungary
Germany
Croatia
Greece

(mln EUR)
Austria
Fair-value (-) Notional value Fair-value (+) Notional value Fair-value (-)
INDIRECT SOVEREIGN EXPOSURES (3) (on and off balance sheet)
Derivatives with positive fair valueDerivatives with negative fair
value
2015 EU-wide Transparency Exercise
Sovereign Exposure
Banco Bilbao Vizcaya Argentaria, SA
As of 31/12/2014
Residual Maturity Country / Region
GROSS DIRECT LONG
EXPOSURES (accounting value
gross of provisions)
(1)
NET DIRECT POSITIONS (gross exposures (long) net of cash short
positions of sovereign debt to other counterpaties only where there
is a maturity matching)
(1)
DIRECT SOVEREIGN EXPOSURES IN DERIVATIVES (1)
of which: loans
and advances
of which: AFS
banking book
of which: FVO
(designated at fair
value through
profit&loss)
banking book
of which: Financial
assets held for
trading
(2)
Notional value Fair-value (+) Notional value
Derivatives with positive fair value Derivatives with negative fair value
[ 0 - 3M [ 0 0 0 0 0 0 0 0 0 0 0 0 0 0[ 3M - 1Y [ 0 0 0 0 0 0 0 0 0 0 0 0 0 0[ 1Y - 2Y [ 0 0 0 0 0 0 0 0 0 0 0 0 0 0[ 2Y - 3Y [ 0 0 0 0 0 0 0 0 0 0 0 0 0 0[3Y - 5Y [ 0 0 0 0 0 0 0 0 0 0 0 0 0 0
[5Y - 10Y [ 0 0 0 0 0 0 0 0 0 0 0 0 0 0[10Y - more 0 0 0 0 0 0 0 0 0 0 0 0 0 0
Total 0 0 0 0 0 0 0 0 0 0 0 0 0 0
[ 0 - 3M [ 13 0 3 0 0 3 0 0 0 0 0 0 10 0[ 3M - 1Y [ 41 0 -31 0 0 -31 0 0 0 0 7 0 -7 0[ 1Y - 2Y [ 13 0 -3 0 0 -3 0 0 0 0 1 0 -1 0[ 2Y - 3Y [ 96 0 34 0 0 34 0 0 0 0 8 0 -4 0[3Y - 5Y [ 8 0 2 4 0 -3 0 0 0 0 20 1 -12 0
[5Y - 10Y [ 137 0 -21 3 0 -24 0 0 0 0 0 0 -1 0[10Y - more 10 0 -2 0 0 -2 0 0 0 0 0 0 0 0
Total 318 0 -17 7 0 -25 0 0 0 0 37 1 -16 0
[ 0 - 3M [ 0 0 0 0 0 0 0 0 0 0 0 0 0 0[ 3M - 1Y [ 4 0 4 4 0 0 0 0 0 0 0 0 0 0[ 1Y - 2Y [ 0 0 0 0 0 0 0 0 0 0 0 0 0 0[ 2Y - 3Y [ 0 0 0 0 0 0 0 0 0 0 0 0 0 0[3Y - 5Y [ 0 0 0 0 0 0 0 0 0 0 0 0 0 0
[5Y - 10Y [ 0 0 0 0 0 0 0 0 0 0 0 0 0 0[10Y - more 4 0 4 4 0 0 0 0 0 0 0 0 0 0
Total 8 0 8 8 0 0 0 0 0 0 0 0 0 0
[ 0 - 3M [ 19 0 19 0 0 19 0 0 0 0 12 0 -12 0[ 3M - 1Y [ 409 280 110 0 0 110 0 0 0 0 12 0 -12 0[ 1Y - 2Y [ 28 0 28 0 0 28 0 0 0 0 1 0 -1 0[ 2Y - 3Y [ 46 0 46 0 0 46 0 0 0 0 0 0 0 0[3Y - 5Y [ 2 0 -3 0 0 -3 0 0 0 0 -25 1 20 -1
[5Y - 10Y [ 94 0 91 23 0 67 0 0 842 -101 25 2 -55 -3[10Y - more 6 0 1 0 0 1 0 0 0 0 0 0 0 0
Total 604 280 292 23 0 268 0 0 842 -101 26 3 -61 -4
[ 0 - 3M [ 6 0 6 0 0 6 0 0 0 0 0 0 0 0[ 3M - 1Y [ 1 0 1 1 0 0 0 0 0 0 0 0 0 0[ 1Y - 2Y [ 16 0 16 0 0 16 0 0 0 0 0 0 0 0[ 2Y - 3Y [ 0 0 0 0 0 0 0 0 0 0 0 0 0 0[3Y - 5Y [ 10 0 10 9 0 1 0 0 0 0 0 0 0 0
[5Y - 10Y [ 56 1 55 55 0 0 0 0 0 0 0 0 0 0[10Y - more 0 0 0 0 0 0 0 0 0 0 0 0 0 0
Total 89 1 88 65 0 23 0 0 0 0 0 0 0 0
[ 0 - 3M [ 0 0 0 0 0 0 0 0 0 0 0 0 0 0[ 3M - 1Y [ 0 0 0 0 0 0 0 0 0 0 0 0 0 0[ 1Y - 2Y [ 0 0 0 0 0 0 0 0 0 0 0 0 0 0[ 2Y - 3Y [ 0 0 0 0 0 0 0 0 0 0 0 0 0 0[3Y - 5Y [ 0 0 0 0 0 0 0 0 0 0 0 0 0 0
[5Y - 10Y [ 0 0 0 0 0 0 0 0 0 0 0 0 0 0[10Y - more 0 0 0 0 0 0 0 0 0 0 0 0 0 0
Total 0 0 0 0 0 0 0 0 0 0 0 0 0 0
[ 0 - 3M [ 7,328 6,926 402 91 0 312 1,221 7 728 -1 171 0 -31 -3[ 3M - 1Y [ 5,142 2,749 2,315 1,142 0 1,172 21 0 0 0 14 0 -31 0[ 1Y - 2Y [ 5,514 720 4,570 4,314 0 256 221 5 38 -6 54 0 -63 0[ 2Y - 3Y [ 4,609 1,555 2,582 2,351 0 154 146 11 0 0 289 0 -232 0[3Y - 5Y [ 9,342 3,097 5,976 4,759 0 354 701 18 1 0 236 0 -1,176 -22
[5Y - 10Y [ 23,489 5,036 17,796 14,821 0 1,390 487 64 200 -1 1,991 76 -6,157 -247[10Y - more 5,761 3,339 2,209 1,379 0 780 243 59 0 0 469 64 -1,538 -275
Total 61,185 23,422 35,851 28,857 0 4,419 3,040 165 967 -8 3,226 141 -9,228 -548
[ 0 - 3M [ 0 0 0 0 0 0 0 0 0 0 0 0 0 0[ 3M - 1Y [ 0 0 0 0 0 0 0 0 0 0 7 0 -7 0[ 1Y - 2Y [ 0 0 0 0 0 0 0 0 0 0 1 0 -1 0[ 2Y - 3Y [ 0 0 0 0 0 0 0 0 0 0 0 0 0 0[3Y - 5Y [ 0 0 0 0 0 0 0 0 0 0 0 0 0 0
[5Y - 10Y [ 0 0 0 0 0 0 0 0 0 0 0 0 0 0[10Y - more 0 0 0 0 0 0 0 0 0 0 0 0 0 0
Total 0 0 0 0 0 0 0 0 0 0 9 0 -9 0
Spain
Sweden
Slovenia
Malta
Netherlands
Poland
Portugal
Romania
Slovakia

(mln EUR)
Austria
Fair-value (-) Notional value Fair-value (+) Notional value Fair-value (-)
INDIRECT SOVEREIGN EXPOSURES (3) (on and off balance sheet)
Derivatives with positive fair valueDerivatives with negative fair
value
2015 EU-wide Transparency Exercise
Sovereign Exposure
Banco Bilbao Vizcaya Argentaria, SA
As of 31/12/2014
Residual Maturity Country / Region
GROSS DIRECT LONG
EXPOSURES (accounting value
gross of provisions)
(1)
NET DIRECT POSITIONS (gross exposures (long) net of cash short
positions of sovereign debt to other counterpaties only where there
is a maturity matching)
(1)
DIRECT SOVEREIGN EXPOSURES IN DERIVATIVES (1)
of which: loans
and advances
of which: AFS
banking book
of which: FVO
(designated at fair
value through
profit&loss)
banking book
of which: Financial
assets held for
trading
(2)
Notional value Fair-value (+) Notional value
Derivatives with positive fair value Derivatives with negative fair value
[ 0 - 3M [ 0 0 0 0 0 0 0 0 0 0 0 0 0 0[ 3M - 1Y [ 115 0 115 115 0 0 0 0 0 0 50 0 -37 0[ 1Y - 2Y [ 0 0 0 0 0 0 0 0 0 0 1 0 -1 0[ 2Y - 3Y [ 0 0 0 0 0 0 0 0 0 0 21 0 -21 0[3Y - 5Y [ 0 0 0 0 0 0 0 0 0 0 11 2 -12 0
[5Y - 10Y [ 0 0 0 0 0 0 0 0 0 0 0 0 0 0[10Y - more 0 0 0 0 0 0 0 0 0 0 0 0 0 0
Total 115 0 115 115 0 0 0 0 0 0 82 3 -71 -1
[ 0 - 3M [ 0 0 0 0 0 0 0 0 0 0 0 0 0 0[ 3M - 1Y [ 0 0 0 0 0 0 0 0 0 0 0 0 0 0[ 1Y - 2Y [ 0 0 0 0 0 0 0 0 0 0 0 0 0 0[ 2Y - 3Y [ 0 0 0 0 0 0 0 0 0 0 0 0 0 0[3Y - 5Y [ 0 0 0 0 0 0 0 0 0 0 0 0 0 0
[5Y - 10Y [ 0 0 0 0 0 0 0 0 0 0 0 0 0 0[10Y - more 0 0 0 0 0 0 0 0 0 0 0 0 0 0
Total 0 0 0 0 0 0 0 0 0 0 0 0 0 0
[ 0 - 3M [ 0 0 0 0 0 0 0 0 0 0 0 0 0 0[ 3M - 1Y [ 0 0 0 0 0 0 0 0 0 0 7 0 -7 0[ 1Y - 2Y [ 0 0 0 0 0 0 0 0 0 0 1 0 -1 0[ 2Y - 3Y [ 0 0 0 0 0 0 0 0 0 0 0 0 0 0[3Y - 5Y [ 0 0 0 0 0 0 0 0 0 0 0 0 0 0
[5Y - 10Y [ 0 0 0 0 0 0 0 0 0 0 0 0 0 0[10Y - more 0 0 0 0 0 0 0 0 0 0 0 0 0 0
Total 0 0 0 0 0 0 0 0 0 0 9 0 -9 0
[ 0 - 3M [ 0 0 0 0 0 0 0 0 0 0 0 0 0 0[ 3M - 1Y [ 0 0 0 0 0 0 0 0 0 0 31 0 -18 0[ 1Y - 2Y [ 0 0 0 0 0 0 0 0 0 0 0 0 0 0[ 2Y - 3Y [ 0 0 0 0 0 0 0 0 0 0 0 0 0 0[3Y - 5Y [ 0 0 0 0 0 0 0 0 0 0 -1 1 0 0
[5Y - 10Y [ 0 0 0 0 0 0 0 0 0 0 0 0 0 0[10Y - more 0 0 0 0 0 0 0 0 0 0 0 0 0 0
Total 0 0 0 0 0 0 0 0 0 0 31 1 -18 0
[ 0 - 3M [ 0 0 0 0 0 0 0 0 0 0 0 0 0 0[ 3M - 1Y [ 0 0 0 0 0 0 0 0 0 0 0 0 0 0[ 1Y - 2Y [ 0 0 0 0 0 0 0 0 0 0 0 0 0 0[ 2Y - 3Y [ 0 0 0 0 0 0 0 0 0 0 0 0 0 0[3Y - 5Y [ 0 0 0 0 0 0 0 0 0 0 0 0 0 0
[5Y - 10Y [ 0 0 0 0 0 0 0 0 0 0 0 0 0 0[10Y - more 0 0 0 0 0 0 0 0 0 0 0 0 0 0
Total 0 0 0 0 0 0 0 0 0 0 0 0 0 0
[ 0 - 3M [ 79 0 79 79 0 0 0 0 0 0 0 0 0 0[ 3M - 1Y [ 0 0 0 0 0 0 0 0 0 0 0 0 0 0[ 1Y - 2Y [ 0 0 0 0 0 0 0 0 0 0 0 0 0 0[ 2Y - 3Y [ 0 0 0 0 0 0 0 0 0 0 0 0 0 0[3Y - 5Y [ 0 0 0 0 0 0 0 0 0 0 0 0 0 0
[5Y - 10Y [ 0 0 0 0 0 0 0 0 0 0 0 0 0 0[10Y - more 0 0 0 0 0 0 0 0 0 0 0 0 0 0
Total 79 0 79 79 0 0 0 0 0 0 0 0 0 0
[ 0 - 3M [ 0 0 0 0 0 0 0 0 0 0 0 0 0 0[ 3M - 1Y [ 0 0 0 0 0 0 0 0 0 0 22 0 -10 0[ 1Y - 2Y [ 0 0 0 0 0 0 0 0 0 0 0 0 0 0[ 2Y - 3Y [ 0 0 0 0 0 0 0 0 0 0 0 0 0 0[3Y - 5Y [ 0 0 0 0 0 0 0 0 0 0 -1 1 0 0
[5Y - 10Y [ 0 0 0 0 0 0 0 0 0 0 0 0 0 0[10Y - more 0 0 0 0 0 0 0 0 0 0 0 0 0 0
Total 0 0 0 0 0 0 0 0 0 0 21 1 -10 0
[ 0 - 3M [ 140 0 140 139 0 0 0 0 0 0 -37 0 -24 0[ 3M - 1Y [ 3,443 2,354 1,089 371 0 716 0 0 0 0 1,528 2 0 0[ 1Y - 2Y [ 200 0 172 20 0 151 0 0 0 0 2,479 1 -2,479 -1[ 2Y - 3Y [ 378 0 97 11 0 70 0 0 0 0 0 0 0 0[3Y - 5Y [ 911 0 790 365 0 387 0 0 0 0 0 0 5 0
[5Y - 10Y [ 3,561 1,637 1,883 925 0 816 0 0 0 0 -171 0 152 0[10Y - more 2,609 0 2,603 2,400 0 1 0 0 0 0 2 0 -2 0
Total 11,242 3,991 6,773 4,231 0 2,140 0 0 0 0 3,801 3 -2,347 -1
United Kingdom
Iceland
Liechtenstein
Norway
Australia
Canada
Hong Kong
Japan
U.S.

(mln EUR)
Austria
Fair-value (-) Notional value Fair-value (+) Notional value Fair-value (-)
INDIRECT SOVEREIGN EXPOSURES (3) (on and off balance sheet)
Derivatives with positive fair valueDerivatives with negative fair
value
2015 EU-wide Transparency Exercise
Sovereign Exposure
Banco Bilbao Vizcaya Argentaria, SA
As of 31/12/2014
Residual Maturity Country / Region
GROSS DIRECT LONG
EXPOSURES (accounting value
gross of provisions)
(1)
NET DIRECT POSITIONS (gross exposures (long) net of cash short
positions of sovereign debt to other counterpaties only where there
is a maturity matching)
(1)
DIRECT SOVEREIGN EXPOSURES IN DERIVATIVES (1)
of which: loans
and advances
of which: AFS
banking book
of which: FVO
(designated at fair
value through
profit&loss)
banking book
of which: Financial
assets held for
trading
(2)
Notional value Fair-value (+) Notional value
Derivatives with positive fair value Derivatives with negative fair value
[ 0 - 3M [ 0 0 0 0 0 0 0 0 0 0 0 0 0 0[ 3M - 1Y [ 0 0 0 0 0 0 0 0 0 0 87 0 -27 0[ 1Y - 2Y [ 0 0 0 0 0 0 0 0 0 0 17 0 -17 0[ 2Y - 3Y [ 0 0 0 0 0 0 0 0 0 0 0 0 0 0[3Y - 5Y [ 0 0 0 0 0 0 0 0 0 0 13 9 -7 0
[5Y - 10Y [ 0 0 0 0 0 0 0 0 0 0 0 0 0 0[10Y - more 0 0 0 0 0 0 0 0 0 0 0 0 0 0
Total 0 0 0 0 0 0 0 0 0 0 116 9 -50 0
[ 0 - 3M [ 0 0 0 0 0 0 0 0 0 0 0 0 0 0[ 3M - 1Y [ 0 0 0 0 0 0 0 0 0 0 0 0 0 0[ 1Y - 2Y [ 0 0 0 0 0 0 0 0 0 0 0 0 0 0[ 2Y - 3Y [ 0 0 0 0 0 0 0 0 0 0 0 0 0 0[3Y - 5Y [ 0 0 0 0 0 0 0 0 0 0 0 0 0 0
[5Y - 10Y [ 0 0 0 0 0 0 0 0 0 0 0 0 0 0[10Y - more 0 0 0 0 0 0 0 0 0 0 0 0 0 0
Total 0 0 0 0 0 0 0 0 0 0 0 0 0 0
[ 0 - 3M [ 248 1 247 247 0 0 0 0 0 0 0 0 0 0[ 3M - 1Y [ 96 11 84 61 0 23 0 0 0 0 0 0 0 0[ 1Y - 2Y [ 368 7 334 357 0 -23 0 0 0 0 0 0 0 0[ 2Y - 3Y [ 54 0 54 52 0 2 0 0 0 0 0 0 0 0[3Y - 5Y [ 428 1 426 425 0 1 0 0 0 0 -1 1 0 0
[5Y - 10Y [ 1,823 68 1,754 1,748 0 6 0 0 0 0 0 0 0 0[10Y - more 450 7 440 439 0 1 0 0 0 0 0 0 0 0
Total 3,466 94 3,340 3,329 0 11 0 0 0 0 -1 1 0 0
[ 0 - 3M [ 0 0 0 0 0 0 0 0 0 0 0 0 0 0[ 3M - 1Y [ 0 0 0 0 0 0 0 0 0 0 0 0 0 0[ 1Y - 2Y [ 0 0 0 0 0 0 0 0 0 0 0 0 0 0[ 2Y - 3Y [ 0 0 0 0 0 0 0 0 0 0 0 0 0 0[3Y - 5Y [ 1 0 1 1 0 0 0 0 0 0 0 0 0 0
[5Y - 10Y [ 1 0 1 1 0 0 0 0 0 0 0 0 0 0[10Y - more 1 0 1 1 0 0 0 0 0 0 0 0 0 0
Total 3 0 3 3 0 0 0 0 0 0 0 0 0 0
[ 0 - 3M [ 0 0 0 0 0 0 0 0 150 -4 0 0 0 0[ 3M - 1Y [ 0 0 0 0 0 0 0 0 0 0 0 0 0 0[ 1Y - 2Y [ 0 0 0 0 0 0 0 0 0 0 0 0 0 0[ 2Y - 3Y [ 0 0 0 0 0 0 0 0 0 0 0 0 0 0[3Y - 5Y [ 0 0 0 0 0 0 0 0 0 0 4 1 0 0
[5Y - 10Y [ 0 0 0 0 0 0 0 0 0 0 0 0 0 0[10Y - more 0 0 0 0 0 0 0 0 0 0 0 0 0 0
Total 0 0 0 0 0 0 0 0 150 -4 4 1 0 0
[ 0 - 3M [ 468 1 467 324 0 135 4 2 95 -1 0 0 0 0[ 3M - 1Y [ 1,921 521 1,400 117 0 1,216 94 10 0 0 140 0 -144 0[ 1Y - 2Y [ 3,001 227 2,774 184 0 2,345 103 6 0 0 21 0 -21 0[ 2Y - 3Y [ 5,340 0 5,340 665 0 4,566 92 4 0 0 -16 0 10 -1[3Y - 5Y [ 7,721 29 7,692 4,165 0 3,520 47 8 24 -1 0 0 4 0
[5Y - 10Y [ 13,989 8,214 5,599 3,833 0 419 15 0 56 -23 -29 0 44 -1[10Y - more 1,042 9 982 275 0 722 0 0 8 -18 -2 0 17 0
Total 33,482 9,001 24,254 9,563 0 12,923 355 29 184 -43 114 1 -89 -2
[ 0 - 3M [ 5 5 0 0 0 0 0 0 0 0 0 0 0 0[ 3M - 1Y [ 25 25 0 0 0 0 0 0 0 0 0 0 0 0[ 1Y - 2Y [ 18 18 0 0 0 0 0 0 0 0 0 0 0 0[ 2Y - 3Y [ 18 18 0 0 0 0 0 0 0 0 0 0 0 0[3Y - 5Y [ 27 27 0 0 0 0 0 0 0 0 0 0 0 0
[5Y - 10Y [ 61 61 0 0 0 0 0 0 0 0 0 0 0 0[10Y - more 0 0 0 0 0 0 0 0 0 0 0 0 0 0
Total 154 154 0 0 0 0 0 0 0 0 0 0 0 0
[ 0 - 3M [ 7 3 4 0 0 4 0 0 0 0 0 0 0 0
[ 3M - 1Y [ 27 14 13 0 0 13 0 0 0 0 0 0 0 0
[ 1Y - 2Y [ 48 0 48 0 0 48 0 0 0 0 47 1 -47 -1
[ 2Y - 3Y [ 33 6 27 13 0 24 0 0 0 0 37 1 -62 -1
[3Y - 5Y [ 45 9 36 0 0 36 0 0 0 0 0 0 0 0
[5Y - 10Y [ 55 22 33 0 0 33 0 0 0 0 0 0 0 0
[10Y - more 41 0 41 0 0 41 0 0 0 0 0 0 0 0
Total 256 54 202 13 0 199 0 0 0 0 84 1 -108 -2
Notes and definitions(1) The exposures reported cover only exposures to central, regional and local governments on immediate borrower basis, and do not include exposures to other counterparts with full or partial government guarantees (2) The banks disclose the exposures in the "Financial assets held for trading" portfolio after offsetting the cash short positions having the same maturities. (3) The exposures reported include the positions towards counterparts (other than sovereign) on sovereign credit risk (i.e. CDS, financial guarantees) booked in all the accounting portfolio (on-off balance sheet). Irrespective of the denomination and or accounting classification of the positions the economic substance over the form must be used as a criteria for the identification of the exposures to be included in this column. This item does not include exposures to counterparts (other than sovereign) with full or partial government guarantees by central, regional and local governments
Others
Switzerland
Other advanced economies
non EEA
Other Central and eastern
Europe countries non EEA
Middle East
Latin America and the
Caribbean
Africa
China

(mln EUR)
[ 0 - 3M [[ 3M - 1Y [[ 1Y - 2Y [[ 2Y - 3Y [[3Y - 5Y [
[5Y - 10Y [[10Y - more
Total
[ 0 - 3M [[ 3M - 1Y [[ 1Y - 2Y [[ 2Y - 3Y [[3Y - 5Y [
[5Y - 10Y [[10Y - more
Total
[ 0 - 3M [[ 3M - 1Y [[ 1Y - 2Y [[ 2Y - 3Y [[3Y - 5Y [
[5Y - 10Y [[10Y - more
Total
[ 0 - 3M [[ 3M - 1Y [[ 1Y - 2Y [[ 2Y - 3Y [[3Y - 5Y [
[5Y - 10Y [[10Y - more
Total
[ 0 - 3M [[ 3M - 1Y [[ 1Y - 2Y [[ 2Y - 3Y [[3Y - 5Y [
[5Y - 10Y [[10Y - more
Total
[ 0 - 3M [[ 3M - 1Y [[ 1Y - 2Y [[ 2Y - 3Y [[3Y - 5Y [
[5Y - 10Y [[10Y - more
Total
[ 0 - 3M [[ 3M - 1Y [[ 1Y - 2Y [[ 2Y - 3Y [[3Y - 5Y [
[5Y - 10Y [[10Y - more
Total
[ 0 - 3M [[ 3M - 1Y [[ 1Y - 2Y [[ 2Y - 3Y [[3Y - 5Y [
[5Y - 10Y [[10Y - more
Total
[ 0 - 3M [[ 3M - 1Y [[ 1Y - 2Y [[ 2Y - 3Y [[3Y - 5Y [
[5Y - 10Y [[10Y - more
Total
Belgium
Bulgaria
Cyprus
Czech Republic
Denmark
Estonia
Finland
France
Austria
2015 EU-wide Transparency Exercise
Sovereign Exposure
Banco Bilbao Vizcaya Argentaria, SA
Residual Maturity Country / Region
0 0 0 0 0 0 0 0 0 0 0 0 0 00 0 0 0 0 0 0 0 0 0 5 0 -5 06 0 6 5 0 1 0 0 0 0 0 0 -9 03 0 3 0 0 3 0 0 0 0 0 0 0 01 0 1 0 0 1 0 0 0 0 0 0 0 09 0 4 0 0 4 0 0 0 0 0 0 0 04 0 4 0 0 4 0 0 0 0 0 0 0 0
24 0 19 5 0 14 0 0 0 0 5 0 -14 -1
22 0 0 0 0 0 0 0 0 0 64 0 99 0307 0 299 0 0 299 0 0 0 0 5 0 -5 023 0 23 0 0 23 0 0 0 0 54 1 -47 -115 0 15 15 0 0 0 0 0 0 0 0 -10 014 0 0 0 0 0 0 0 0 0 160 5 -70 -244 0 0 0 0 0 0 0 0 0 53 5 11 -674 32 0 0 0 0 0 0 0 0 0 0 0 0
499 32 337 15 0 322 0 0 0 0 337 11 -22 -9
0 0 0 0 0 0 0 0 0 0 0 0 0 00 0 0 0 0 0 0 0 0 0 0 0 0 00 0 0 0 0 0 0 0 0 0 0 0 0 00 0 0 0 0 0 0 0 0 0 0 0 0 00 0 0 0 0 0 0 0 0 0 0 0 0 0
2 0 2 2 0 0 0 0 0 0 0 0 0 02 0 2 2 0 0 0 0 0 0 0 0 0 05 0 5 5 0 0 0 0 0 0 0 0 0 0
0 0 0 0 0 0 0 0 0 0 0 0 0 00 0 0 0 0 0 0 0 0 0 0 0 0 00 0 0 0 0 0 0 0 0 0 0 0 0 00 0 0 0 0 0 0 0 0 0 0 0 0 00 0 0 0 0 0 0 0 0 0 0 0 0 00 0 0 0 0 0 0 0 0 0 0 0 0 00 0 0 0 0 0 0 0 0 0 0 0 0 00 0 0 0 0 0 0 0 0 0 0 0 0 0
0 0 0 0 0 0 0 0 0 0 0 0 0 00 0 0 0 0 0 0 0 0 0 0 0 0 00 0 0 0 0 0 0 0 0 0 0 0 0 00 0 0 0 0 0 0 0 0 0 0 0 0 00 0 0 0 0 0 0 0 0 0 0 0 0 00 0 0 0 0 0 0 0 0 0 0 0 0 00 0 0 0 0 0 0 0 0 0 0 0 0 00 0 0 0 0 0 0 0 0 0 0 0 0 0
0 0 0 0 0 0 0 0 0 0 0 0 0 00 0 0 0 0 0 0 0 0 0 5 0 -5 00 0 0 0 0 0 0 0 0 0 0 0 0 00 0 0 0 0 0 0 0 0 0 0 0 0 00 0 0 0 0 0 0 0 0 0 0 0 0 00 0 0 0 0 0 0 0 0 0 0 0 0 00 0 0 0 0 0 0 0 0 0 0 0 0 00 0 0 0 0 0 0 0 0 0 5 0 -5 0
0 0 0 0 0 0 0 0 0 0 0 0 0 00 0 0 0 0 0 0 0 0 0 0 0 0 00 0 0 0 0 0 0 0 0 0 0 0 0 00 0 0 0 0 0 0 0 0 0 0 0 0 00 0 0 0 0 0 0 0 0 0 0 0 0 00 0 0 0 0 0 0 0 0 0 0 0 0 00 0 0 0 0 0 0 0 0 0 0 0 0 00 0 0 0 0 0 0 0 0 0 0 0 0 0
0 0 0 0 0 0 0 0 0 0 0 0 0 00 0 0 0 0 0 0 0 0 0 5 0 -5 0
13 0 13 13 0 0 0 0 0 0 9 0 -9 00 0 0 0 0 0 0 0 0 0 0 0 0 00 0 0 0 0 0 0 0 0 0 0 0 0 00 0 0 0 0 0 0 0 0 0 0 0 0 00 0 0 0 0 0 0 0 0 0 0 0 0 0
14 0 14 13 0 0 0 0 0 0 14 0 -14 0
51 0 51 0 0 51 0 0 0 0 -33 0 -26 0387 0 301 111 0 190 0 0 0 0 10 0 -10 0109 7 77 0 0 77 0 0 0 0 8 0 5 0324 0 248 0 0 248 0 0 0 0 30 1 -11 028 0 3 0 0 3 0 0 0 0 1 0 0 087 0 52 2 0 50 0 0 0 0 0 0 0 077 28 0 0 0 0 0 0 0 0 0 0 0 0
1,062 35 732 113 0 619 0 0 0 0 15 2 -42 -1
Fair-value (-) Notional value Fair-value (+) Notional value Fair-value (-)of which: AFS
banking book
of which: FVO
(designated at fair
value through
profit&loss)
banking book
of which: Financial
assets held for
trading
(2)
Notional value Fair-value (+) Notional valueof which: loans
and advances
GROSS DIRECT LONG
EXPOSURES (accounting value
gross of provisions)
(1)
NET DIRECT POSITIONS (gross exposures (long) net of cash short
positions of sovereign debt to other counterpaties only where there
is a maturity matching)
(1)
DIRECT SOVEREIGN EXPOSURES IN DERIVATIVES (1) INDIRECT SOVEREIGN EXPOSURES (3) (on and off balance sheet)
Derivatives with positive fair value Derivatives with negative fair value Derivatives with positive fair valueDerivatives with negative fair
value
As of 30/06/2015

(mln EUR)
[ 0 - 3M [
Austria
2015 EU-wide Transparency Exercise
Sovereign Exposure
Banco Bilbao Vizcaya Argentaria, SA
Residual Maturity Country / Region
[ 0 - 3M [[ 3M - 1Y [[ 1Y - 2Y [[ 2Y - 3Y [[3Y - 5Y [
[5Y - 10Y [[10Y - more
Total
[ 0 - 3M [[ 3M - 1Y [[ 1Y - 2Y [[ 2Y - 3Y [[3Y - 5Y [
[5Y - 10Y [[10Y - more
Total
[ 0 - 3M [[ 3M - 1Y [[ 1Y - 2Y [[ 2Y - 3Y [[3Y - 5Y [
[5Y - 10Y [[10Y - more
Total
[ 0 - 3M [[ 3M - 1Y [[ 1Y - 2Y [[ 2Y - 3Y [[3Y - 5Y [
[5Y - 10Y [[10Y - more
Total
[ 0 - 3M [[ 3M - 1Y [[ 1Y - 2Y [[ 2Y - 3Y [[3Y - 5Y [
[5Y - 10Y [[10Y - more
Total
[ 0 - 3M [[ 3M - 1Y [[ 1Y - 2Y [[ 2Y - 3Y [[3Y - 5Y [
[5Y - 10Y [[10Y - more
Total
[ 0 - 3M [[ 3M - 1Y [[ 1Y - 2Y [[ 2Y - 3Y [[3Y - 5Y [
[5Y - 10Y [[10Y - more
Total
[ 0 - 3M [[ 3M - 1Y [[ 1Y - 2Y [[ 2Y - 3Y [[3Y - 5Y [
[5Y - 10Y [[10Y - more
Total
[ 0 - 3M [[ 3M - 1Y [[ 1Y - 2Y [[ 2Y - 3Y [[3Y - 5Y [
[5Y - 10Y [[10Y - more
Total
Ireland
Italy
Latvia
Lithuania
Luxembourg
Hungary
Germany
Croatia
Greece
Fair-value (-) Notional value Fair-value (+) Notional value Fair-value (-)of which: AFS
banking book
of which: FVO
(designated at fair
value through
profit&loss)
banking book
of which: Financial
assets held for
trading
(2)
Notional value Fair-value (+) Notional valueof which: loans
and advances
GROSS DIRECT LONG
EXPOSURES (accounting value
gross of provisions)
(1)
NET DIRECT POSITIONS (gross exposures (long) net of cash short
positions of sovereign debt to other counterpaties only where there
is a maturity matching)
(1)
DIRECT SOVEREIGN EXPOSURES IN DERIVATIVES (1) INDIRECT SOVEREIGN EXPOSURES (3) (on and off balance sheet)
Derivatives with positive fair value Derivatives with negative fair value Derivatives with positive fair valueDerivatives with negative fair
value
As of 30/06/2015
140 0 140 0 0 140 0 0 0 0 -4,190 79 3,436 -22143 0 74 0 0 74 0 0 0 0 5 0 -5 0120 0 48 0 0 48 0 0 0 0 0 0 0 035 0 0 0 0 0 0 0 0 0 95 0 -95 -117 0 0 0 0 0 0 0 0 0 0 0 0 095 0 0 0 0 0 0 0 0 0 0 0 0 024 0 18 0 0 18 0 0 0 0 0 0 0 0
575 0 280 0 0 280 0 0 0 0 -4,090 80 3,336 -23
0 0 0 0 0 0 0 0 0 0 0 0 0 00 0 0 0 0 0 0 0 0 0 0 0 0 00 0 0 0 0 0 0 0 0 0 0 0 0 00 0 0 0 0 0 0 0 0 0 0 0 0 00 0 0 0 0 0 0 0 0 0 0 0 0 00 0 0 0 0 0 0 0 0 0 0 0 0 00 0 0 0 0 0 0 0 0 0 0 0 0 00 0 0 0 0 0 0 0 0 0 0 0 0 0
0 0 0 0 0 0 0 0 0 0 0 0 0 00 0 0 0 0 0 0 0 0 0 5 0 -5 00 0 0 0 0 0 0 0 0 0 0 0 0 00 0 0 0 0 0 0 0 0 0 0 0 0 00 0 0 0 0 0 0 0 0 0 0 0 0 0
0 0 0 0 0 0 0 0 0 0 0 0 0 00 0 0 0 0 0 0 0 0 0 0 0 0 00 0 0 0 0 0 0 0 0 0 5 0 -5 0
0 0 0 0 0 0 0 0 0 0 0 0 0 00 0 0 0 0 0 0 0 0 0 0 0 0 00 0 0 0 0 0 0 0 0 0 0 0 0 00 0 0 0 0 0 0 0 0 0 0 0 0 00 0 0 0 0 0 0 0 0 0 0 0 0 00 0 0 0 0 0 0 0 0 0 0 0 0 00 0 0 0 0 0 0 0 0 0 0 0 0 00 0 0 0 0 0 0 0 0 0 0 0 0 0
0 0 0 0 0 0 0 0 0 0 0 0 0 00 0 0 0 0 0 0 0 0 0 5 0 -5 00 0 0 0 0 0 0 0 0 0 0 0 0 00 0 0 0 0 0 0 0 0 0 0 0 0 01 0 1 0 0 1 0 0 0 0 0 0 0 0
175 0 175 175 0 0 0 0 0 0 0 0 0 00 0 0 0 0 0 0 0 0 0 0 0 0 0
176 0 176 175 0 1 0 0 0 0 5 0 -5 0
197 11 186 0 0 186 0 0 0 0 669 78 -1,537 -161,033 23 940 45 0 894 0 0 0 0 132 3 -89 -9
577 0 290 20 0 270 0 0 0 0 27 0 -23 0387 0 181 181 0 0 0 0 0 0 -28 1 50 -1
4,143 0 4,094 4,053 0 41 0 0 0 0 -150 2 133 -12,022 69 1,662 1,662 0 0 0 0 0 0 -218 12 154 -82,365 0 2,278 2,267 0 11 0 0 0 0 -75 12 86 -15
10,723 103 9,632 8,229 0 1,403 0 0 0 0 357 107 -1,226 -50
0 0 0 0 0 0 0 0 0 0 0 0 0 00 0 0 0 0 0 0 0 0 0 0 0 0 00 0 0 0 0 0 0 0 0 0 0 0 0 00 0 0 0 0 0 0 0 0 0 0 0 0 00 0 0 0 0 0 0 0 0 0 0 0 0 00 0 0 0 0 0 0 0 0 0 0 0 0 00 0 0 0 0 0 0 0 0 0 0 0 0 00 0 0 0 0 0 0 0 0 0 0 0 0 0
0 0 0 0 0 0 0 0 0 0 0 0 0 00 0 0 0 0 0 0 0 0 0 0 0 0 00 0 0 0 0 0 0 0 0 0 0 0 0 00 0 0 0 0 0 0 0 0 0 0 0 0 00 0 0 0 0 0 0 0 0 0 0 0 0 00 0 0 0 0 0 0 0 0 0 0 0 0 00 0 0 0 0 0 0 0 0 0 0 0 0 00 0 0 0 0 0 0 0 0 0 0 0 0 0
0 0 0 0 0 0 0 0 0 0 0 0 0 00 0 0 0 0 0 0 0 0 0 0 0 0 00 0 0 0 0 0 0 0 0 0 0 0 0 00 0 0 0 0 0 0 0 0 0 0 0 0 00 0 0 0 0 0 0 0 0 0 0 0 0 00 0 0 0 0 0 0 0 0 0 0 0 0 00 0 0 0 0 0 0 0 0 0 0 0 0 00 0 0 0 0 0 0 0 0 0 0 0 0 0

(mln EUR)
[ 0 - 3M [
Austria
2015 EU-wide Transparency Exercise
Sovereign Exposure
Banco Bilbao Vizcaya Argentaria, SA
Residual Maturity Country / Region
[ 0 - 3M [[ 3M - 1Y [[ 1Y - 2Y [[ 2Y - 3Y [[3Y - 5Y [
[5Y - 10Y [[10Y - more
Total
[ 0 - 3M [[ 3M - 1Y [[ 1Y - 2Y [[ 2Y - 3Y [[3Y - 5Y [
[5Y - 10Y [[10Y - more
Total
[ 0 - 3M [[ 3M - 1Y [[ 1Y - 2Y [[ 2Y - 3Y [[3Y - 5Y [
[5Y - 10Y [[10Y - more
Total
[ 0 - 3M [[ 3M - 1Y [[ 1Y - 2Y [[ 2Y - 3Y [[3Y - 5Y [
[5Y - 10Y [[10Y - more
Total
[ 0 - 3M [[ 3M - 1Y [[ 1Y - 2Y [[ 2Y - 3Y [[3Y - 5Y [
[5Y - 10Y [[10Y - more
Total
[ 0 - 3M [[ 3M - 1Y [[ 1Y - 2Y [[ 2Y - 3Y [[3Y - 5Y [
[5Y - 10Y [[10Y - more
Total
[ 0 - 3M [[ 3M - 1Y [[ 1Y - 2Y [[ 2Y - 3Y [[3Y - 5Y [
[5Y - 10Y [[10Y - more
Total
[ 0 - 3M [[ 3M - 1Y [[ 1Y - 2Y [[ 2Y - 3Y [[3Y - 5Y [
[5Y - 10Y [[10Y - more
Total
[ 0 - 3M [[ 3M - 1Y [[ 1Y - 2Y [[ 2Y - 3Y [[3Y - 5Y [
[5Y - 10Y [[10Y - more
Total
Spain
Sweden
Slovenia
Malta
Netherlands
Poland
Portugal
Romania
Slovakia
Fair-value (-) Notional value Fair-value (+) Notional value Fair-value (-)of which: AFS
banking book
of which: FVO
(designated at fair
value through
profit&loss)
banking book
of which: Financial
assets held for
trading
(2)
Notional value Fair-value (+) Notional valueof which: loans
and advances
GROSS DIRECT LONG
EXPOSURES (accounting value
gross of provisions)
(1)
NET DIRECT POSITIONS (gross exposures (long) net of cash short
positions of sovereign debt to other counterpaties only where there
is a maturity matching)
(1)
DIRECT SOVEREIGN EXPOSURES IN DERIVATIVES (1) INDIRECT SOVEREIGN EXPOSURES (3) (on and off balance sheet)
Derivatives with positive fair value Derivatives with negative fair value Derivatives with positive fair valueDerivatives with negative fair
value
As of 30/06/2015
0 0 0 0 0 0 0 0 0 0 0 0 0 00 0 0 0 0 0 0 0 0 0 0 0 0 00 0 0 0 0 0 0 0 0 0 0 0 0 00 0 0 0 0 0 0 0 0 0 0 0 0 00 0 0 0 0 0 0 0 0 0 0 0 0 00 0 0 0 0 0 0 0 0 0 0 0 0 00 0 0 0 0 0 0 0 0 0 0 0 0 00 0 0 0 0 0 0 0 0 0 0 0 0 0
68 0 68 0 0 68 0 0 0 0 198 0 -143 066 0 66 0 0 66 0 0 0 0 5 0 -5 0
228 0 228 10 0 218 0 0 0 0 0 0 0 0328 0 86 0 0 86 0 0 0 0 20 2 -13 014 0 4 4 0 0 0 0 0 0 0 0 0 0
143 0 1 0 0 1 0 0 0 0 0 0 0 011 0 7 0 0 7 0 0 0 0 0 0 0 0
857 0 461 14 0 447 0 0 0 0 223 2 -162 -1
0 0 0 0 0 0 0 0 0 0 0 0 0 00 0 0 0 0 0 0 0 0 0 0 0 0 00 0 0 0 0 0 0 0 0 0 0 0 0 08 0 8 8 0 0 0 0 0 0 0 0 0 00 0 0 0 0 0 0 0 0 0 0 0 0 0
0 0 0 0 0 0 0 0 0 0 0 0 0 06 0 6 6 0 0 0 0 0 0 0 0 0 0
14 0 14 14 0 0 0 0 0 0 0 0 0 0
98 23 75 0 0 75 0 0 0 0 36 0 -81 0354 275 79 0 0 79 0 0 0 0 5 0 -5 015 0 15 0 0 15 0 0 0 0 0 0 0 040 0 40 0 0 40 0 0 0 0 -25 1 25 -124 0 1 1 0 1 0 0 0 0 0 0 0 081 0 75 0 0 75 0 0 842 -197 0 0 0 038 0 0 0 0 0 0 0 0 0 0 0 0 0
650 298 285 1 0 285 0 0 842 -197 17 1 -61 -1
0 0 0 0 0 0 0 0 0 0 0 0 0 00 0 0 0 0 0 0 0 0 0 0 0 0 00 0 0 0 0 0 0 0 0 0 0 0 0 00 0 0 0 0 0 0 0 0 0 0 0 0 09 0 9 9 0 0 0 0 0 0 0 0 0 0
64 1 63 63 0 0 0 0 0 0 0 0 0 00 0 0 0 0 0 0 0 0 0 0 0 0 0
73 1 72 72 0 0 0 0 0 0 0 0 0 0
0 0 0 0 0 0 0 0 0 0 0 0 0 00 0 0 0 0 0 0 0 0 0 0 0 0 00 0 0 0 0 0 0 0 0 0 0 0 0 00 0 0 0 0 0 0 0 0 0 0 0 0 00 0 0 0 0 0 0 0 0 0 0 0 0 00 0 0 0 0 0 0 0 0 0 0 0 0 00 0 0 0 0 0 0 0 0 0 0 0 0 00 0 0 0 0 0 0 0 0 0 0 0 0 0
0 0 0 0 0 0 0 0 0 0 0 0 0 00 0 0 0 0 0 0 0 0 0 0 0 0 00 0 0 0 0 0 0 0 0 0 0 0 0 00 0 0 0 0 0 0 0 0 0 0 0 0 00 0 0 0 0 0 0 0 0 0 0 0 0 00 0 0 0 0 0 0 0 0 0 0 0 0 00 0 0 0 0 0 0 0 0 0 0 0 0 00 0 0 0 0 0 0 0 0 0 0 0 0 0
9,025 6,383 2,642 1,387 0 1,255 90 2 1,128 -1 513 658 -1,051 -386,840 3,128 3,384 1,286 0 2,098 115 3 0 0 -245 53 75 -429,745 1,331 8,019 8,019 0 0 84 1 38 -6 1 0 321 -203,961 1,562 2,005 1,034 0 519 259 15 0 0 -7 0 -4 0
12,948 3,232 8,772 7,714 0 0 485 13 201 -1 0 0 -1 017,957 4,497 12,262 11,974 0 0 352 63 30 -12 50 2 -57 -25,825 2,943 2,330 2,082 0 248 255 50 75 -17 -75 14 -95 -7
66,301 23,077 39,413 33,496 0 4,119 1,640 146 1,472 -37 236 726 -811 -108
0 0 0 0 0 0 0 0 0 0 0 0 0 00 0 0 0 0 0 0 0 0 0 5 0 -5 00 0 0 0 0 0 0 0 0 0 0 0 0 00 0 0 0 0 0 0 0 0 0 0 0 0 00 0 0 0 0 0 0 0 0 0 0 0 0 00 0 0 0 0 0 0 0 0 0 0 0 0 00 0 0 0 0 0 0 0 0 0 0 0 0 00 0 0 0 0 0 0 0 0 0 5 0 -5 0

(mln EUR)
[ 0 - 3M [
Austria
2015 EU-wide Transparency Exercise
Sovereign Exposure
Banco Bilbao Vizcaya Argentaria, SA
Residual Maturity Country / Region
[ 0 - 3M [[ 3M - 1Y [[ 1Y - 2Y [[ 2Y - 3Y [[3Y - 5Y [
[5Y - 10Y [[10Y - more
Total
[ 0 - 3M [[ 3M - 1Y [[ 1Y - 2Y [[ 2Y - 3Y [[3Y - 5Y [
[5Y - 10Y [[10Y - more
Total
[ 0 - 3M [[ 3M - 1Y [[ 1Y - 2Y [[ 2Y - 3Y [[3Y - 5Y [
[5Y - 10Y [[10Y - more
Total
[ 0 - 3M [[ 3M - 1Y [[ 1Y - 2Y [[ 2Y - 3Y [[3Y - 5Y [
[5Y - 10Y [[10Y - more
Total
[ 0 - 3M [[ 3M - 1Y [[ 1Y - 2Y [[ 2Y - 3Y [[3Y - 5Y [
[5Y - 10Y [[10Y - more
Total
[ 0 - 3M [[ 3M - 1Y [[ 1Y - 2Y [[ 2Y - 3Y [[3Y - 5Y [
[5Y - 10Y [[10Y - more
Total
[ 0 - 3M [[ 3M - 1Y [[ 1Y - 2Y [[ 2Y - 3Y [[3Y - 5Y [
[5Y - 10Y [[10Y - more
Total
[ 0 - 3M [[ 3M - 1Y [[ 1Y - 2Y [[ 2Y - 3Y [[3Y - 5Y [
[5Y - 10Y [[10Y - more
Total
[ 0 - 3M [[ 3M - 1Y [[ 1Y - 2Y [[ 2Y - 3Y [[3Y - 5Y [
[5Y - 10Y [[10Y - more
Total
United Kingdom
Iceland
Liechtenstein
Norway
Australia
Canada
Hong Kong
Japan
U.S.
Fair-value (-) Notional value Fair-value (+) Notional value Fair-value (-)of which: AFS
banking book
of which: FVO
(designated at fair
value through
profit&loss)
banking book
of which: Financial
assets held for
trading
(2)
Notional value Fair-value (+) Notional valueof which: loans
and advances
GROSS DIRECT LONG
EXPOSURES (accounting value
gross of provisions)
(1)
NET DIRECT POSITIONS (gross exposures (long) net of cash short
positions of sovereign debt to other counterpaties only where there
is a maturity matching)
(1)
DIRECT SOVEREIGN EXPOSURES IN DERIVATIVES (1) INDIRECT SOVEREIGN EXPOSURES (3) (on and off balance sheet)
Derivatives with positive fair value Derivatives with negative fair value Derivatives with positive fair valueDerivatives with negative fair
value
As of 30/06/2015
0 0 0 0 0 0 0 0 0 0 0 0 0 0255 0 255 255 0 0 0 0 0 0 5 0 -5 0
0 0 0 0 0 0 0 0 0 0 22 0 -22 00 0 0 0 0 0 0 0 0 0 12 2 -13 00 0 0 0 0 0 0 0 0 0 0 0 0 00 0 0 0 0 0 0 0 0 0 0 0 0 00 0 0 0 0 0 0 0 0 0 0 0 0 0
255 0 255 255 0 0 0 0 0 0 40 3 -41 -1
0 0 0 0 0 0 0 0 0 0 0 0 0 00 0 0 0 0 0 0 0 0 0 0 0 0 00 0 0 0 0 0 0 0 0 0 0 0 0 00 0 0 0 0 0 0 0 0 0 0 0 0 00 0 0 0 0 0 0 0 0 0 0 0 0 00 0 0 0 0 0 0 0 0 0 0 0 0 00 0 0 0 0 0 0 0 0 0 0 0 0 00 0 0 0 0 0 0 0 0 0 0 0 0 0
0 0 0 0 0 0 0 0 0 0 0 0 0 00 0 0 0 0 0 0 0 0 0 0 0 0 00 0 0 0 0 0 0 0 0 0 0 0 0 00 0 0 0 0 0 0 0 0 0 0 0 0 00 0 0 0 0 0 0 0 0 0 0 0 0 0
0 0 0 0 0 0 0 0 0 0 0 0 0 00 0 0 0 0 0 0 0 0 0 0 0 0 00 0 0 0 0 0 0 0 0 0 0 0 0 0
0 0 0 0 0 0 0 0 0 0 0 0 0 00 0 0 0 0 0 0 0 0 0 5 0 -5 00 0 0 0 0 0 0 0 0 0 0 0 0 00 0 0 0 0 0 0 0 0 0 0 0 0 00 0 0 0 0 0 0 0 0 0 0 0 0 00 0 0 0 0 0 0 0 0 0 0 0 0 00 0 0 0 0 0 0 0 0 0 0 0 0 00 0 0 0 0 0 0 0 0 0 5 0 -5 0
0 0 0 0 0 0 0 0 0 0 13 0 0 00 0 0 0 0 0 0 0 0 0 0 0 0 00 0 0 0 0 0 0 0 0 0 0 0 0 00 0 0 0 0 0 0 0 0 0 -1 1 0 00 0 0 0 0 0 0 0 0 0 0 0 0 00 0 0 0 0 0 0 0 0 0 0 0 0 00 0 0 0 0 0 0 0 0 0 0 0 0 00 0 0 0 0 0 0 0 0 0 13 1 0 0
0 0 0 0 0 0 0 0 0 0 0 0 0 00 0 0 0 0 0 0 0 0 0 0 0 0 00 0 0 0 0 0 0 0 0 0 0 0 0 00 0 0 0 0 0 0 0 0 0 0 0 0 00 0 0 0 0 0 0 0 0 0 0 0 0 00 0 0 0 0 0 0 0 0 0 0 0 0 00 0 0 0 0 0 0 0 0 0 0 0 0 00 0 0 0 0 0 0 0 0 0 0 0 0 0
85 0 85 85 0 0 0 0 0 0 0 0 0 00 0 0 0 0 0 0 0 0 0 0 0 0 00 0 0 0 0 0 0 0 0 0 0 0 0 00 0 0 0 0 0 0 0 0 0 0 0 0 00 0 0 0 0 0 0 0 0 0 0 0 0 00 0 0 0 0 0 0 0 0 0 0 0 0 00 0 0 0 0 0 0 0 0 0 0 0 0 0
85 0 85 85 0 0 0 0 0 0 0 0 0 0
0 0 0 0 0 0 0 0 0 0 0 0 0 00 0 0 0 0 0 0 0 0 0 0 0 0 09 0 9 9 0 0 0 0 0 0 0 0 0 00 0 0 0 0 0 0 0 0 0 -2 1 0 00 0 0 0 0 0 0 0 0 0 0 0 0 00 0 0 0 0 0 0 0 0 0 0 0 0 00 0 0 0 0 0 0 0 0 0 0 0 0 09 0 9 9 0 0 0 0 0 0 -2 1 0 0
307 0 163 163 0 0 0 0 0 0 2,517 3 -2,563 -293,784 2,689 938 218 0 720 0 0 0 0 2,606 7 -2,336 -1
506 0 20 20 0 0 0 0 0 0 584 1 -359 0356 0 321 11 0 290 0 0 0 0 0 0 0 0
1,556 0 1,479 156 0 1,274 0 0 0 0 0 0 0 04,737 1,758 1,345 1,334 0 0 24 1 0 0 45 46 -45 -463,397 0 3,397 3,195 0 7 36 1 0 0 0 0 0 0
14,644 4,448 7,662 5,097 0 2,291 60 1 0 0 5,752 56 -5,303 -76
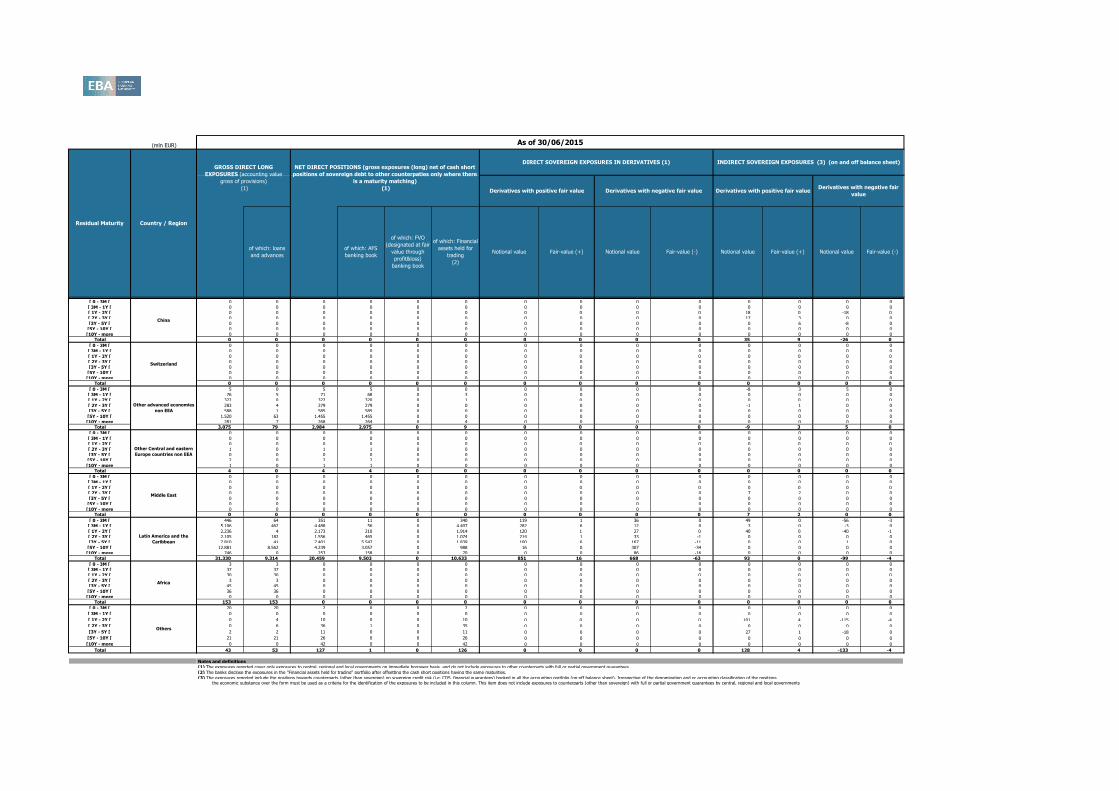
(mln EUR)
[ 0 - 3M [
Austria
2015 EU-wide Transparency Exercise
Sovereign Exposure
Banco Bilbao Vizcaya Argentaria, SA
Residual Maturity Country / Region
[ 0 - 3M [[ 3M - 1Y [[ 1Y - 2Y [[ 2Y - 3Y [[3Y - 5Y [
[5Y - 10Y [[10Y - more
Total
[ 0 - 3M [[ 3M - 1Y [[ 1Y - 2Y [[ 2Y - 3Y [[3Y - 5Y [
[5Y - 10Y [[10Y - more
Total
[ 0 - 3M [[ 3M - 1Y [[ 1Y - 2Y [[ 2Y - 3Y [[3Y - 5Y [
[5Y - 10Y [[10Y - more
Total
[ 0 - 3M [[ 3M - 1Y [[ 1Y - 2Y [[ 2Y - 3Y [[3Y - 5Y [
[5Y - 10Y [[10Y - more
Total
[ 0 - 3M [[ 3M - 1Y [[ 1Y - 2Y [[ 2Y - 3Y [[3Y - 5Y [
[5Y - 10Y [[10Y - more
Total
[ 0 - 3M [[ 3M - 1Y [[ 1Y - 2Y [[ 2Y - 3Y [[3Y - 5Y [
[5Y - 10Y [[10Y - more
Total
[ 0 - 3M [[ 3M - 1Y [[ 1Y - 2Y [[ 2Y - 3Y [[3Y - 5Y [
[5Y - 10Y [[10Y - more
Total
[ 0 - 3M [
[ 3M - 1Y [
[ 1Y - 2Y [
[ 2Y - 3Y [
[3Y - 5Y [
[5Y - 10Y [
[10Y - more
Total
Others
Switzerland
Other advanced economies
non EEA
Other Central and eastern
Europe countries non EEA
Middle East
Latin America and the
Caribbean
Africa
China
Fair-value (-) Notional value Fair-value (+) Notional value Fair-value (-)of which: AFS
banking book
of which: FVO
(designated at fair
value through
profit&loss)
banking book
of which: Financial
assets held for
trading
(2)
Notional value Fair-value (+) Notional valueof which: loans
and advances
GROSS DIRECT LONG
EXPOSURES (accounting value
gross of provisions)
(1)
NET DIRECT POSITIONS (gross exposures (long) net of cash short
positions of sovereign debt to other counterpaties only where there
is a maturity matching)
(1)
DIRECT SOVEREIGN EXPOSURES IN DERIVATIVES (1) INDIRECT SOVEREIGN EXPOSURES (3) (on and off balance sheet)
Derivatives with positive fair value Derivatives with negative fair value Derivatives with positive fair valueDerivatives with negative fair
value
As of 30/06/2015
0 0 0 0 0 0 0 0 0 0 0 0 0 00 0 0 0 0 0 0 0 0 0 0 0 0 00 0 0 0 0 0 0 0 0 0 18 0 -18 00 0 0 0 0 0 0 0 0 0 17 3 0 00 0 0 0 0 0 0 0 0 0 0 6 -8 00 0 0 0 0 0 0 0 0 0 0 0 0 00 0 0 0 0 0 0 0 0 0 0 0 0 00 0 0 0 0 0 0 0 0 0 35 9 -26 0
0 0 0 0 0 0 0 0 0 0 0 0 0 00 0 0 0 0 0 0 0 0 0 0 0 0 00 0 0 0 0 0 0 0 0 0 0 0 0 00 0 0 0 0 0 0 0 0 0 0 0 0 00 0 0 0 0 0 0 0 0 0 0 0 0 00 0 0 0 0 0 0 0 0 0 0 0 0 00 0 0 0 0 0 0 0 0 0 0 0 0 00 0 0 0 0 0 0 0 0 0 0 0 0 0
5 0 5 5 0 0 0 0 0 0 -8 3 5 076 5 71 68 0 3 0 0 0 0 0 0 0 0
322 0 322 320 0 1 0 0 0 0 0 0 0 0283 4 279 279 0 0 0 0 0 0 -1 1 0 0588 1 585 585 0 0 0 0 0 0 0 0 0 0
1,520 63 1,455 1,455 0 0 0 0 0 0 0 0 0 0281 7 268 264 0 4 0 0 0 0 0 0 0 0
3,075 79 2,984 2,975 0 9 0 0 0 0 -9 3 5 0
0 0 0 0 0 0 0 0 0 0 0 0 0 00 0 0 0 0 0 0 0 0 0 0 0 0 00 0 0 0 0 0 0 0 0 0 0 0 0 01 0 1 1 0 0 0 0 0 0 0 0 0 00 0 0 0 0 0 0 0 0 0 0 0 0 02 0 2 2 0 0 0 0 0 0 0 0 0 01 0 1 1 0 0 0 0 0 0 0 0 0 04 0 4 4 0 0 0 0 0 0 0 0 0 0
0 0 0 0 0 0 0 0 0 0 0 0 0 00 0 0 0 0 0 0 0 0 0 0 0 0 00 0 0 0 0 0 0 0 0 0 0 0 0 00 0 0 0 0 0 0 0 0 0 7 2 0 00 0 0 0 0 0 0 0 0 0 0 0 0 00 0 0 0 0 0 0 0 0 0 0 0 0 00 0 0 0 0 0 0 0 0 0 0 0 0 00 0 0 0 0 0 0 0 0 0 7 2 0 0
446 64 351 11 0 340 119 1 36 0 49 0 -56 -35,106 462 4,488 56 0 4,407 282 6 12 0 3 0 -3 02,236 4 2,173 210 0 1,914 120 1 27 0 40 0 -40 -12,105 182 1,556 465 0 1,074 214 1 33 -1 0 0 0 07,810 41 7,401 5,547 0 1,839 100 6 167 -11 0 0 1 0
12,881 8,562 4,239 3,057 0 988 16 0 307 -34 0 0 0 0746 0 253 158 0 70 0 0 86 -16 0 0 0 0
31,330 9,314 20,459 9,503 0 10,633 851 16 668 -63 93 0 -99 -4
3 3 0 0 0 0 0 0 0 0 0 0 0 037 37 0 0 0 0 0 0 0 0 0 0 0 030 30 0 0 0 0 0 0 0 0 0 0 0 03 3 0 0 0 0 0 0 0 0 0 0 0 0
45 45 0 0 0 0 0 0 0 0 0 0 0 036 36 0 0 0 0 0 0 0 0 0 0 0 00 0 0 0 0 0 0 0 0 0 0 0 0 0
153 153 0 0 0 0 0 0 0 0 0 0 0 0
20 20 2 0 0 2 0 0 0 0 0 0 0 0
0 0 0 0 0 0 0 0 0 0 0 0 0 0
0 4 10 0 0 10 0 0 0 0 101 4 -115 -4
0 6 36 1 0 35 0 0 0 0 0 0 0 0
2 2 11 0 0 11 0 0 0 0 27 1 -18 0
21 21 26 0 0 26 0 0 0 0 0 0 0 0
0 0 42 0 0 42 0 0 0 0 0 0 0 0
43 53 127 1 0 126 0 0 0 0 128 4 -133 -4
Notes and definitions(1) The exposures reported cover only exposures to central, regional and local governments on immediate borrower basis, and do not include exposures to other counterparts with full or partial government guarantees (2) The banks disclose the exposures in the "Financial assets held for trading" portfolio after offsetting the cash short positions having the same maturities. (3) The exposures reported include the positions towards counterparts (other than sovereign) on sovereign credit risk (i.e. CDS, financial guarantees) booked in all the accounting portfolio (on-off balance sheet). Irrespective of the denomination and or accounting classification of the positions the economic substance over the form must be used as a criteria for the identification of the exposures to be included in this column. This item does not include exposures to counterparts (other than sovereign) with full or partial government guarantees by central, regional and local governments
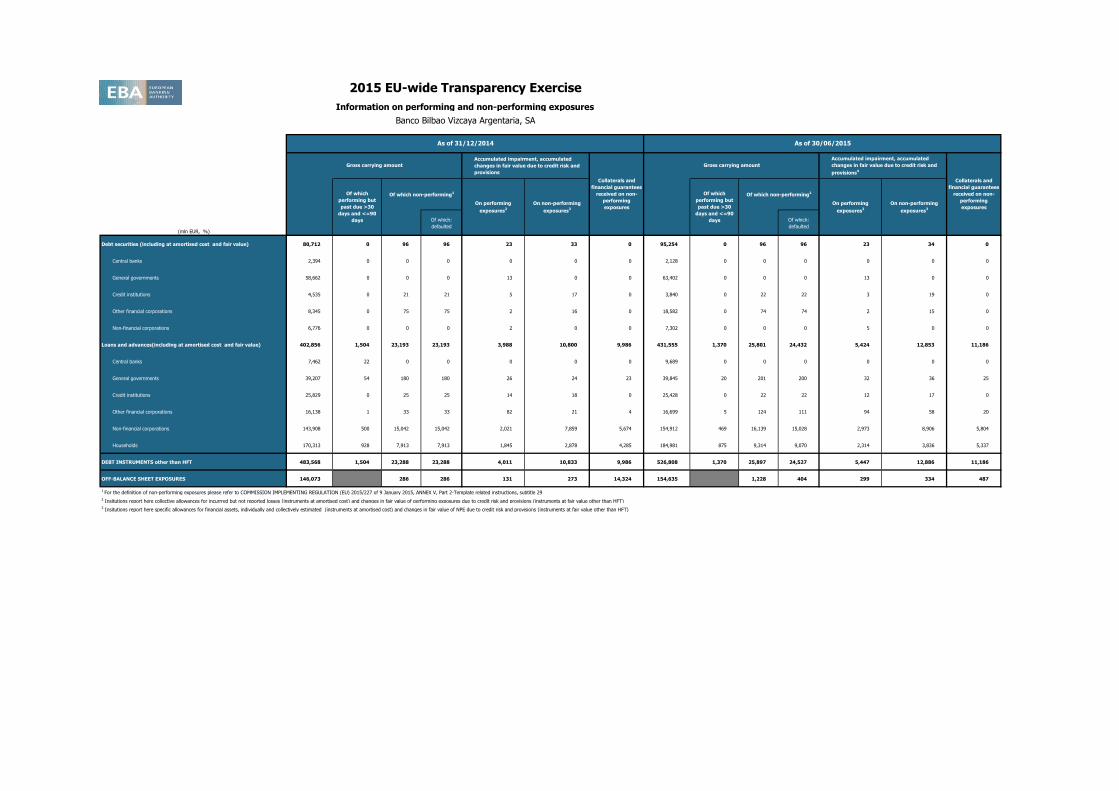
201412 201412 201412 201412 201412 201412 201412 201506 201506 201506 201506 201506 201506 201506
(mln EUR, %)
Of which:
defaulted
Of which:
defaulted
Debt securities (including at amortised cost and fair value) 80,712 0 96 96 23 33 0 95,254 0 96 96 23 34 0
Central banks 2,394 0 0 0 0 0 0 2,128 0 0 0 0 0 0
General governments 58,662 0 0 0 13 0 0 63,402 0 0 0 13 0 0
Credit institutions 4,535 0 21 21 5 17 0 3,840 0 22 22 3 19 0
Other financial corporations 8,345 0 75 75 2 16 0 18,582 0 74 74 2 15 0
Non-financial corporations 6,776 0 0 0 2 0 0 7,302 0 0 0 5 0 0
Loans and advances(including at amortised cost and fair value) 402,856 1,504 23,193 23,193 3,988 10,800 9,986 431,555 1,370 25,801 24,432 5,424 12,853 11,186
Central banks 7,462 22 0 0 0 0 0 9,689 0 0 0 0 0 0
General governments 39,207 54 180 180 26 24 23 39,845 20 201 200 32 36 25
Credit institutions 25,829 0 25 25 14 18 0 25,428 0 22 22 12 17 0
Other financial corporations 16,138 1 33 33 82 21 4 16,699 5 124 111 94 58 20
Non-financial corporations 143,908 500 15,042 15,042 2,021 7,859 5,674 154,912 469 16,139 15,028 2,973 8,906 5,804
Households 170,313 928 7,913 7,913 1,845 2,878 4,285 184,981 875 9,314 9,070 2,314 3,836 5,337
DEBT INSTRUMENTS other than HFT 483,568 1,504 23,288 23,288 4,011 10,833 9,986 526,808 1,370 25,897 24,527 5,447 12,886 11,186
OFF-BALANCE SHEET EXPOSURES 146,073 286 286 131 273 14,324 154,635 1,228 404 299 334 487
1 For the definition of non-performing exposures please refer to COMMISSION IMPLEMENTING REGULATION (EU) 2015/227 of 9 January 2015, ANNEX V, Part 2-Template related instructions, subtitle 29
2 Insitutions report here collective allowances for incurrred but not reported losses (instruments at amortised cost) and changes in fair value of performing exposures due to credit risk and provisions (instruments at fair value other than HFT)
3 Insitutions report here specific allowances for financial assets, individually and collectively estimated (instruments at amortised cost) and changes in fair value of NPE due to credit risk and provisions (instruments at fair value other than HFT)
On non-performing
exposures3
Of which
performing but
past due >30
days and <=90
days
Of which non-performing1
On performing
exposures2
On non-performing
exposures3
Collaterals and
financial guarantees
received on non-
performing
exposures
Gross carrying amount
Accumulated impairment, accumulated
changes in fair value due to credit risk and
provisions
Collaterals and
financial guarantees
received on non-
performing
exposures
Gross carrying amount
Accumulated impairment, accumulated
changes in fair value due to credit risk and
provisions4
Of which
performing but
past due >30
days and <=90
days
Of which non-performing1
On performing
exposures2
2015 EU-wide Transparency Exercise
Information on performing and non-performing exposures
Banco Bilbao Vizcaya Argentaria, SA
As of 31/12/2014 As of 30/06/2015
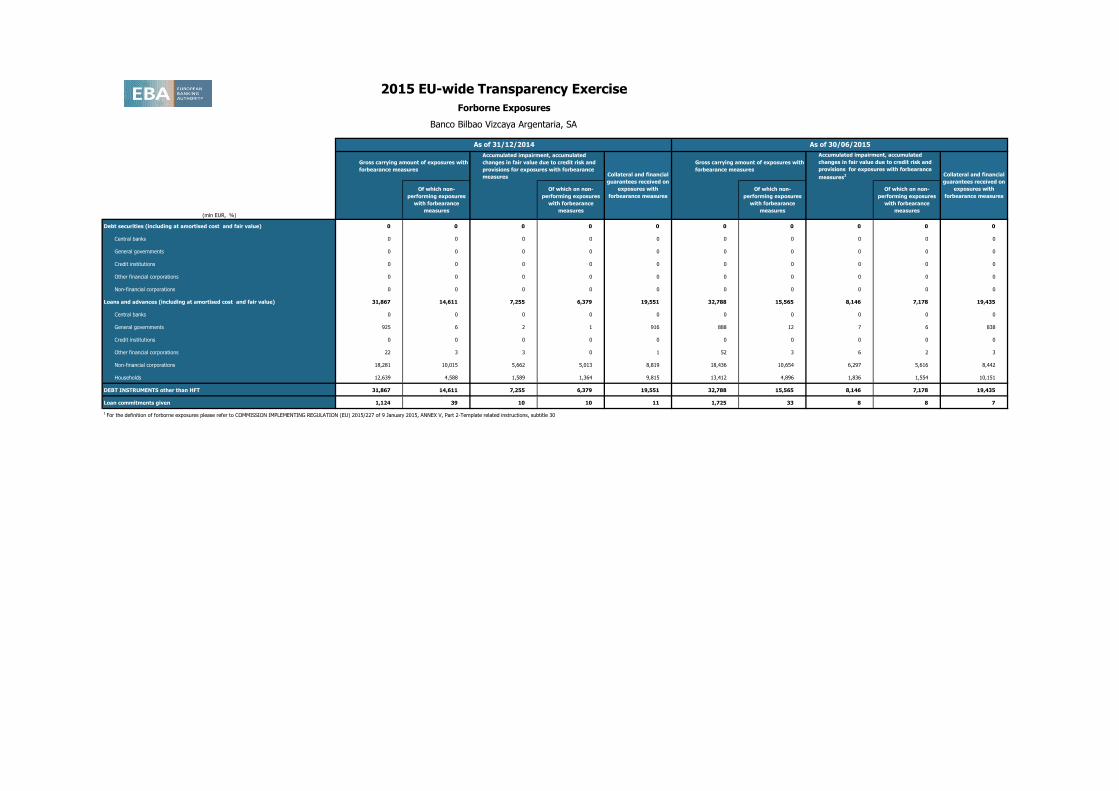
201412 201412 201412 201412 201412 201506 201506 201506 201506 201506
(mln EUR, %)
Debt securities (including at amortised cost and fair value) 0 0 0 0 0 0 0 0 0 0
Central banks 0 0 0 0 0 0 0 0 0 0
General governments 0 0 0 0 0 0 0 0 0 0
Credit institutions 0 0 0 0 0 0 0 0 0 0
Other financial corporations 0 0 0 0 0 0 0 0 0 0
Non-financial corporations 0 0 0 0 0 0 0 0 0 0
Loans and advances (including at amortised cost and fair value) 31,867 14,611 7,255 6,379 19,551 32,788 15,565 8,146 7,178 19,435
Central banks 0 0 0 0 0 0 0 0 0 0
General governments 925 6 2 1 916 888 12 7 6 838
Credit institutions 0 0 0 0 0 0 0 0 0 0
Other financial corporations 22 3 3 0 1 52 3 6 2 3
Non-financial corporations 18,281 10,015 5,662 5,013 8,819 18,436 10,654 6,297 5,616 8,442
Households 12,639 4,588 1,589 1,364 9,815 13,412 4,896 1,836 1,554 10,151
DEBT INSTRUMENTS other than HFT 31,867 14,611 7,255 6,379 19,551 32,788 15,565 8,146 7,178 19,435
Loan commitments given 1,124 39 10 10 11 1,725 33 8 8 7
1 For the definition of forborne exposures please refer to COMMISSION IMPLEMENTING REGULATION (EU) 2015/227 of 9 January 2015, ANNEX V, Part 2-Template related instructions, subtitle 30
Collateral and financial
guarantees received on
exposures with
forbearance measures
Of which non-
performing exposures
with forbearance
measures
Of which on non-
performing exposures
with forbearance
measures
Of which non-
performing exposures
with forbearance
measures
Of which on non-
performing exposures
with forbearance
measures
Gross carrying amount of exposures with
forbearance measures
Accumulated impairment, accumulated
changes in fair value due to credit risk and
provisions for exposures with forbearance
measures Collateral and financial
guarantees received on
exposures with
forbearance measures
Gross carrying amount of exposures with
forbearance measures
Accumulated impairment, accumulated
changes in fair value due to credit risk and
provisions for exposures with forbearance
measures2
2015 EU-wide Transparency Exercise
Forborne Exposures
Banco Bilbao Vizcaya Argentaria, SA
As of 31/12/2014 As of 30/06/2015
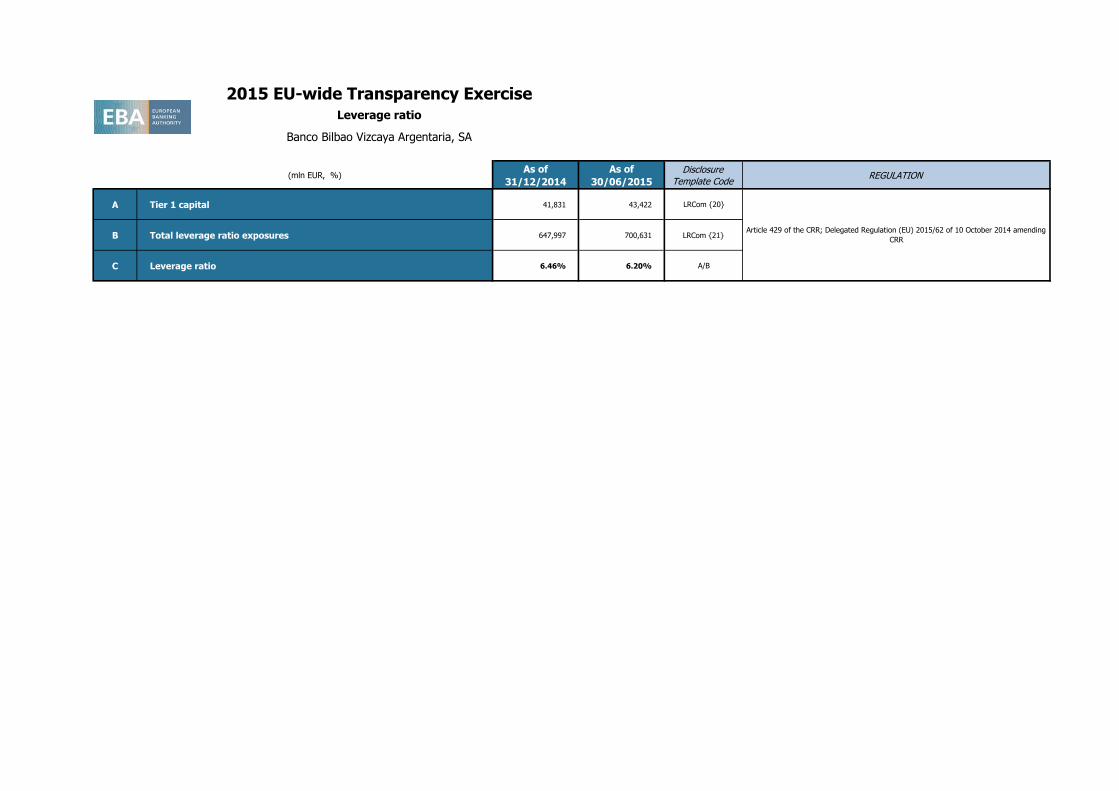
201412 201506
(mln EUR, %)As of
31/12/2014
As of
30/06/2015
Disclosure
Template CodeREGULATION
A Tier 1 capital 41,831 43,422 LRCom {20}
B Total leverage ratio exposures 647,997 700,631 LRCom {21}
C Leverage ratio 6.46% 6.20% A/B
2015 EU-wide Transparency ExerciseLeverage ratio
Banco Bilbao Vizcaya Argentaria, SA
Article 429 of the CRR; Delegated Regulation (EU) 2015/62 of 10 October 2014 amending
CRR
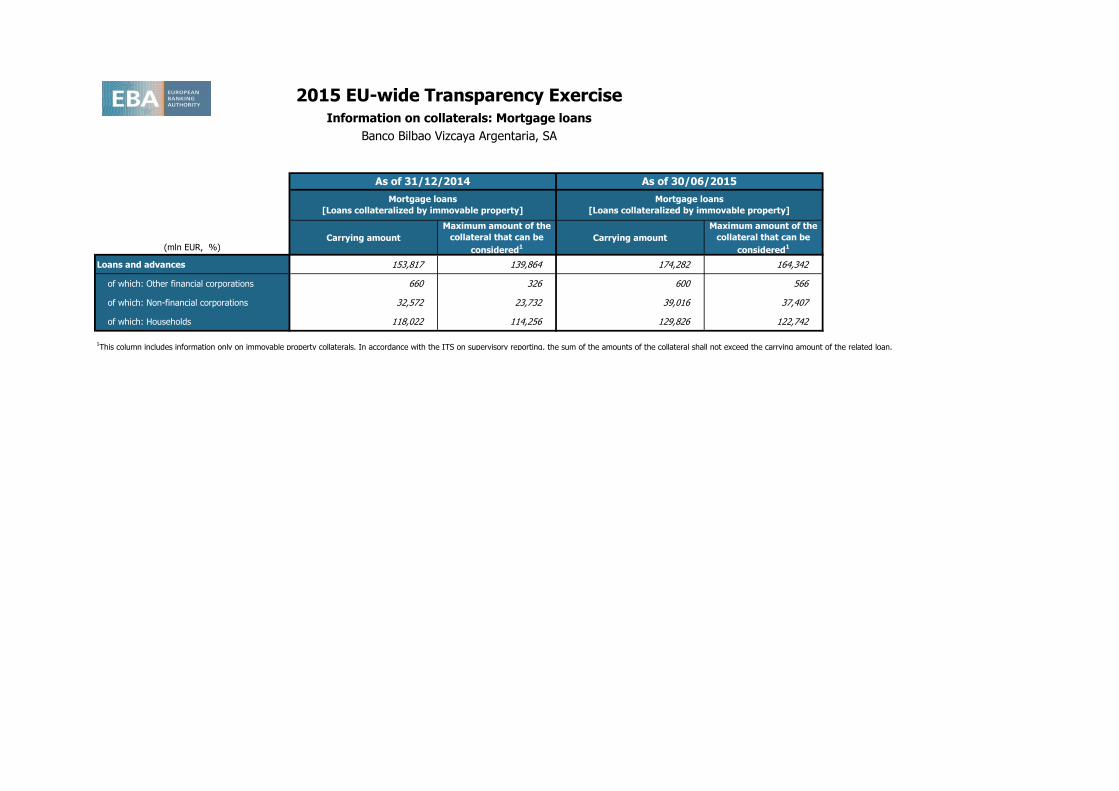
201412 201412 201506 201506
(mln EUR, %)Carrying amount
Maximum amount of the
collateral that can be
considered1
Carrying amount
Maximum amount of the
collateral that can be
considered1
Loans and advances 153,817 139,864 174,282 164,342
of which: Other financial corporations 660 326 600 566
of which: Non-financial corporations 32,572 23,732 39,016 37,407
of which: Households 118,022 114,256 129,826 122,742
1This column includes information only on immovable property collaterals. In accordance with the ITS on supervisory reporting, the sum of the amounts of the collateral shall not exceed the carrying amount of the related loan.
Mortgage loans
[Loans collateralized by immovable property]
Mortgage loans
[Loans collateralized by immovable property]
2015 EU-wide Transparency ExerciseInformation on collaterals: Mortgage loans
Banco Bilbao Vizcaya Argentaria, SA
As of 31/12/2014 As of 30/06/2015