Embed Size (px)
Citation preview
Beginsels vir lekaanvulling om goeiediereprestasie te verseker en minerale
wanbalanse en tekorte te voorkomHINNER KÖSTER (Ph.D.)
Animate Animal Health
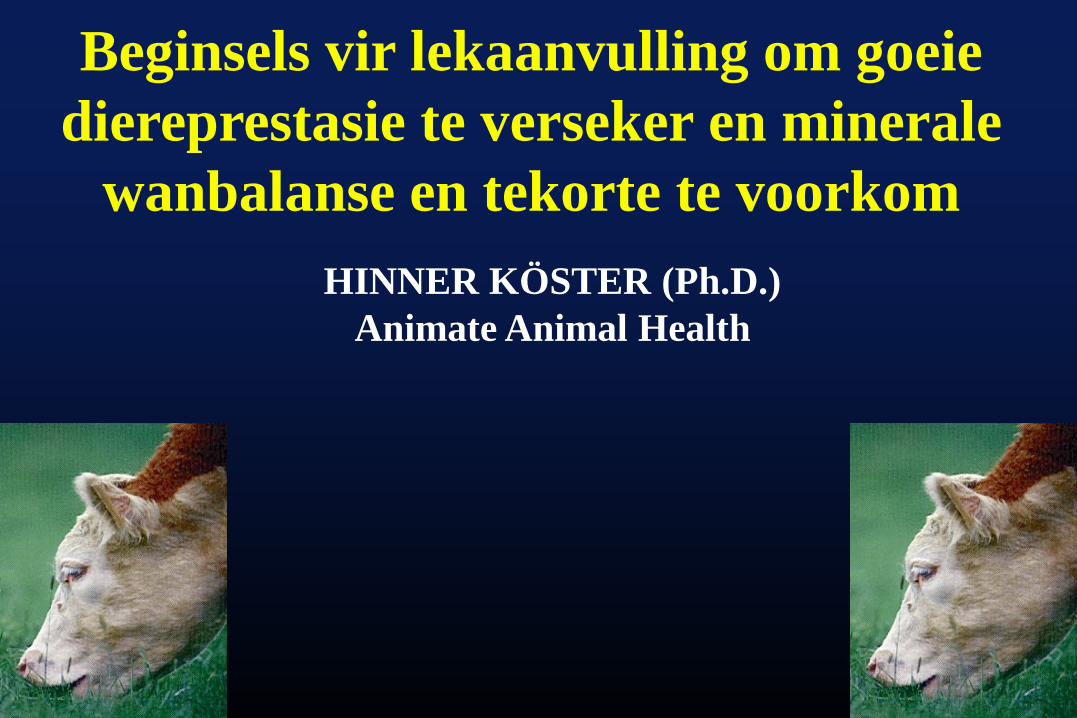
Minerale en Vitamiene aanvulling op weidings
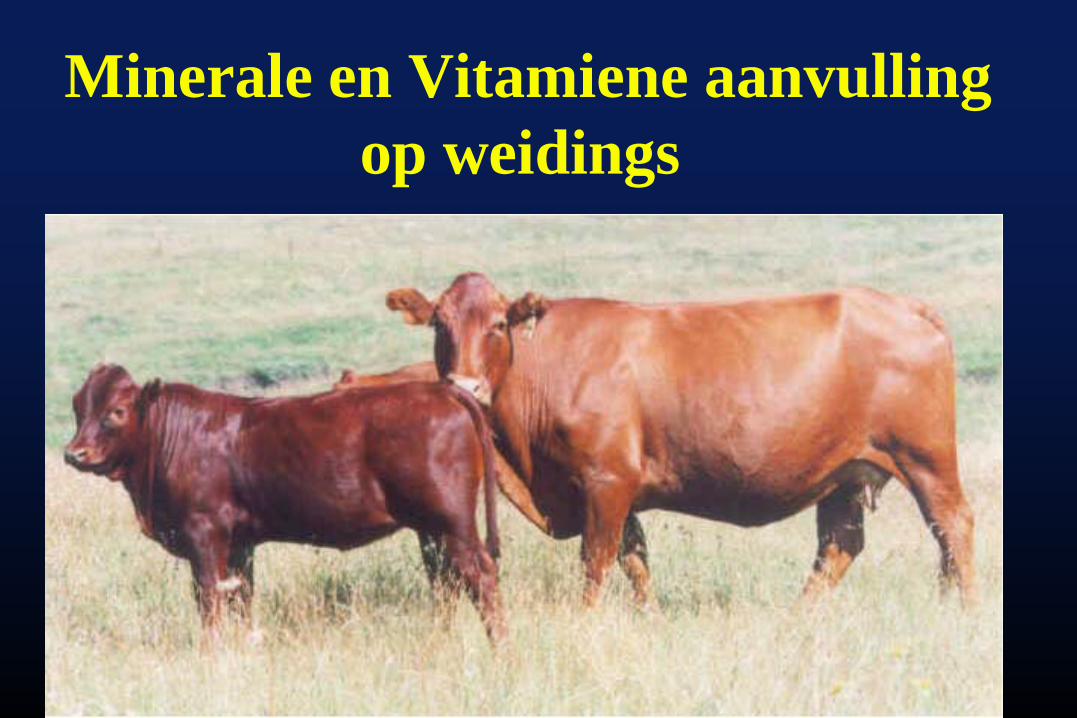
• Word in relatief kleiner hoeveelhede benodig • Noodsaaklik vir alle fisiologiese stelsels en veral krities vir groei,
ontwikkeling, immuniteit, ensiem funksies, sel regulering, ens. • Subkliniese tekorte grootste probleem – sien nie simptome
Minerale word in twee groepe verdeel:
Makrominerale (>100 ppm)• Groter hoeveelhede benodig veral vir groei (bene, tande),
senuweetransmissie, waterbalans in die selle, ens. • Kalsium, fosfor, magnesium, kalium, natrium, chloor en swael
Mikrominerale of spoorelemente (<100 ppm)• Baie kleiner hoeveelhede vereis en oral in liggaam benut • Sluit in yster, mangaan, koper, sink, selenium, kobalt en jodium• Ander mikrominerale wat benodig mag word, maar minder goed
verstaan word, sluit in chroom, nikkel en molibdeen• Boor?
Minerale
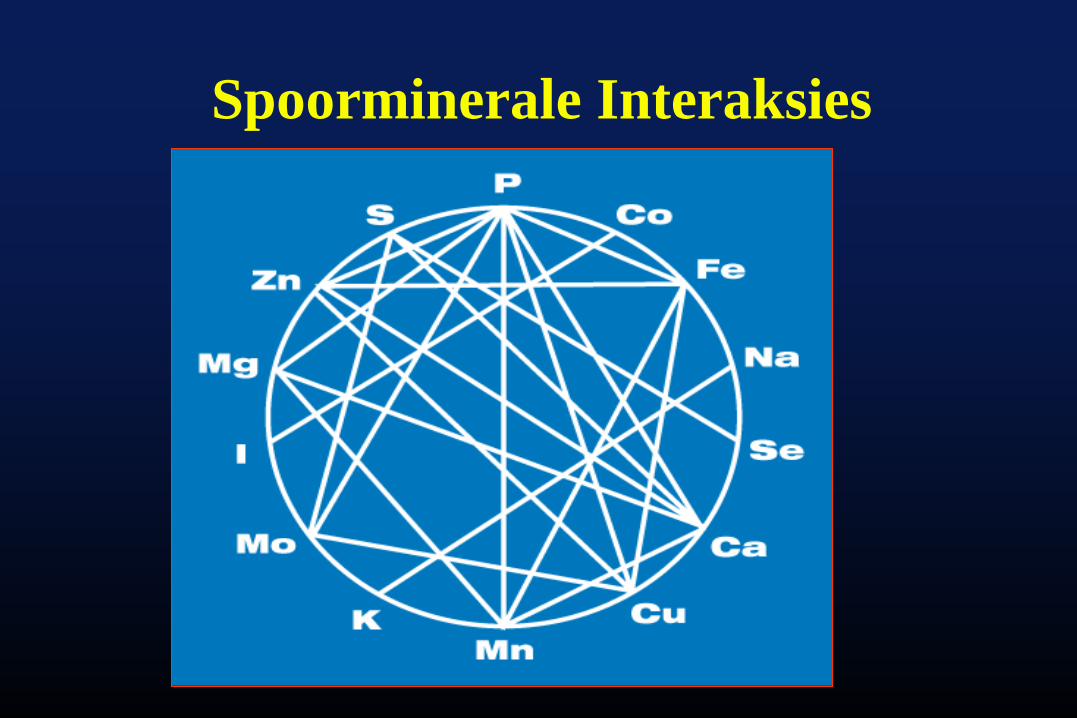
Spoorminerale Interaksies
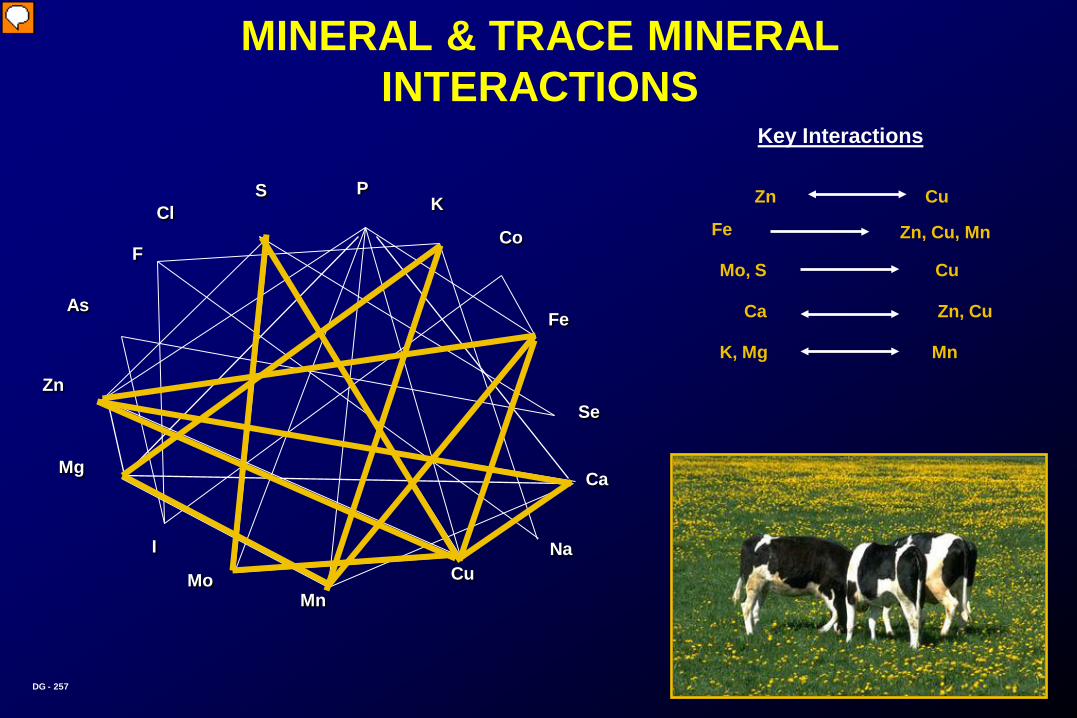
MINERAL & TRACE MINERAL INTERACTIONS
Key Interactions
Zn Cu
Fe Zn, Cu, Mn
Mo, S Cu
Ca Zn, Cu
K, Mg Mn
Co
P
Se
Fe
Ca
CuMn
Mo
I
Mg
Zn
As
S
F
Na
Cl K
DG - 257
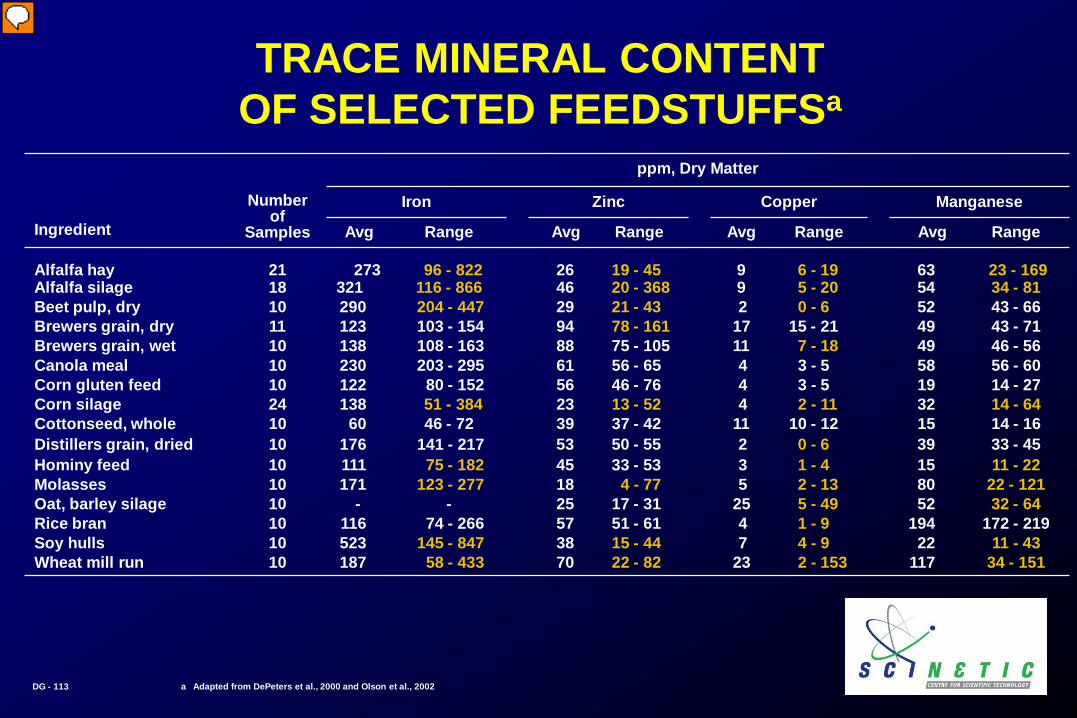
TRACE MINERAL CONTENT OF SELECTED FEEDSTUFFSa
ppm, Dry Matter
Number of
Samples
Iron Zinc Copper Manganese
Ingredient Avg Range Avg Range Avg Range Avg Range
Alfalfa hay 21 273 96 - 822 26 19 - 45 9 6 - 19 63 23 - 169Alfalfa silage 18 321 116 - 866 46 20 - 368 9 5 - 20 54 34 - 81Beet pulp, dry 10 290 204 - 447 29 21 - 43 2 0 - 6 52 43 - 66Brewers grain, dry 11 123 103 - 154 94 78 - 161 17 15 - 21 49 43 - 71Brewers grain, wet 10 138 108 - 163 88 75 - 105 11 7 - 18 49 46 - 56Canola meal 10 230 203 - 295 61 56 - 65 4 3 - 5 58 56 - 60Corn gluten feed 10 122 80 - 152 56 46 - 76 4 3 - 5 19 14 - 27 Corn silage 24 138 51 - 384 23 13 - 52 4 2 - 11 32 14 - 64Cottonseed, whole 10 60 46 - 72 39 37 - 42 11 10 - 12 15 14 - 16 Distillers grain, dried 10 176 141 - 217 53 50 - 55 2 0 - 6 39 33 - 45Hominy feed 10 111 75 - 182 45 33 - 53 3 1 - 4 15 11 - 22Molasses 10 171 123 - 277 18 4 - 77 5 2 - 13 80 22 - 121Oat, barley silage 10 - - 25 17 - 31 25 5 - 49 52 32 - 64Rice bran 10 116 74 - 266 57 51 - 61 4 1 - 9 194 172 - 219Soy hulls 10 523 145 - 847 38 15 - 44 7 4 - 9 22 11 - 43Wheat mill run 10 187 58 - 433 70 22 - 82 23 2 - 153 117 34 - 151
a Adapted from DePeters et al., 2000 and Olson et al., 2002DG - 113
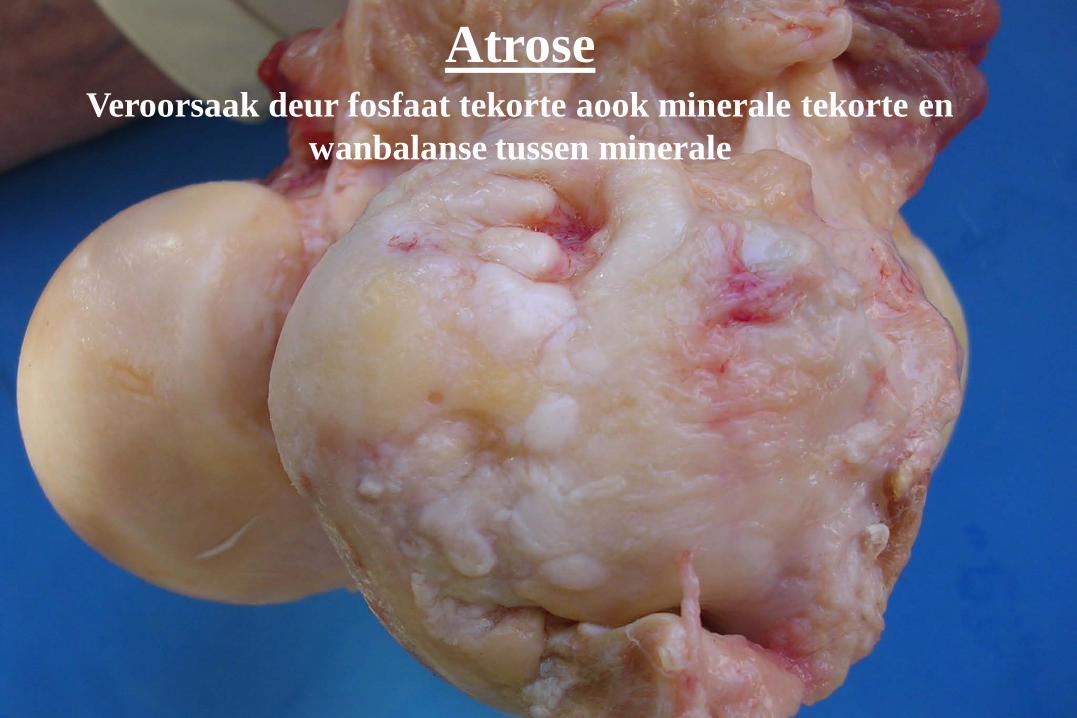
AtroseVeroorsaak deur fosfaat tekorte aook minerale tekorte en
wanbalanse tussen minerale
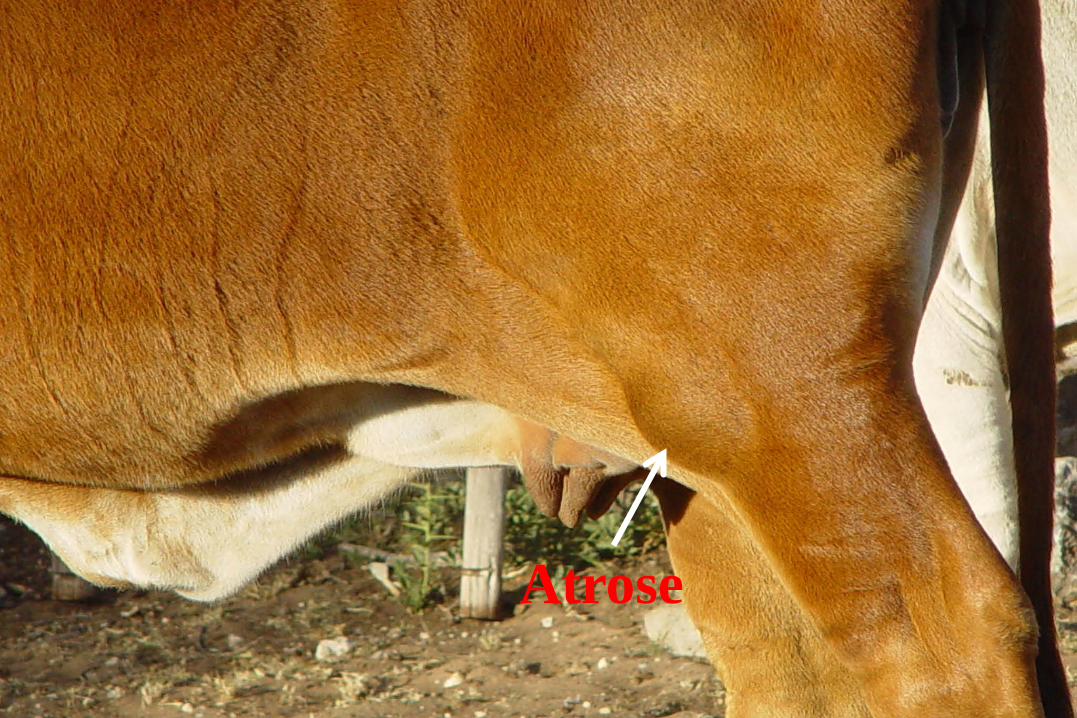
Atrose
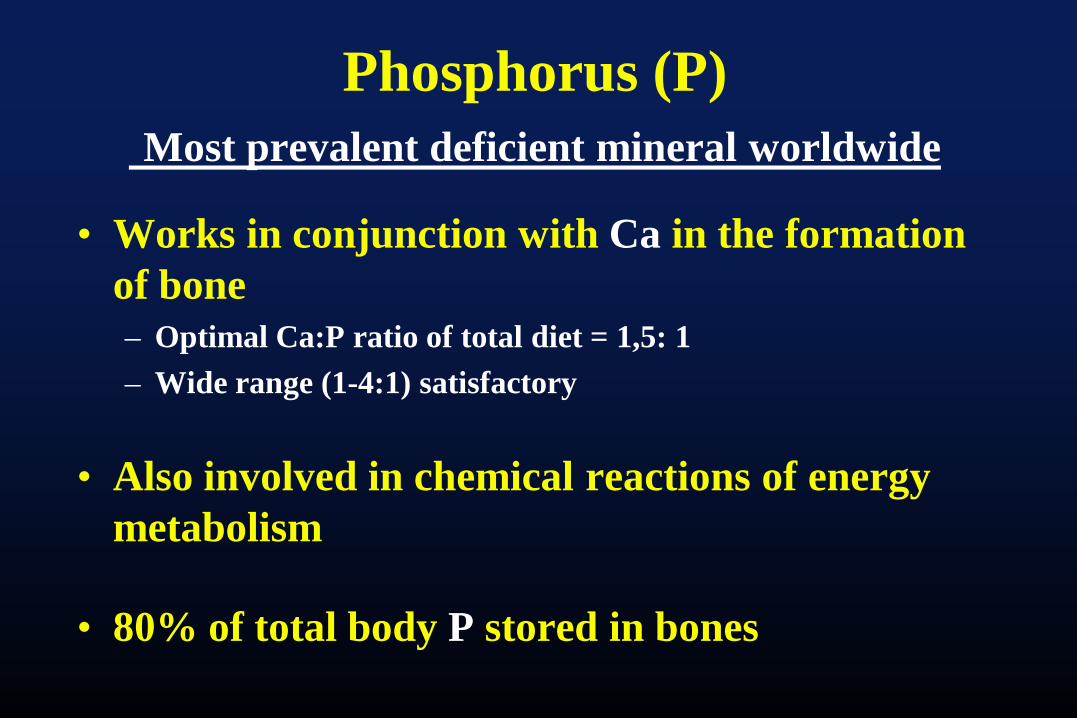
Phosphorus (P)Most prevalent deficient mineral worldwide
• Works in conjunction with Ca in the formation of bone– Optimal Ca:P ratio of total diet = 1,5: 1– Wide range (1-4:1) satisfactory
• Also involved in chemical reactions of energy metabolism
• 80% of total body P stored in bones
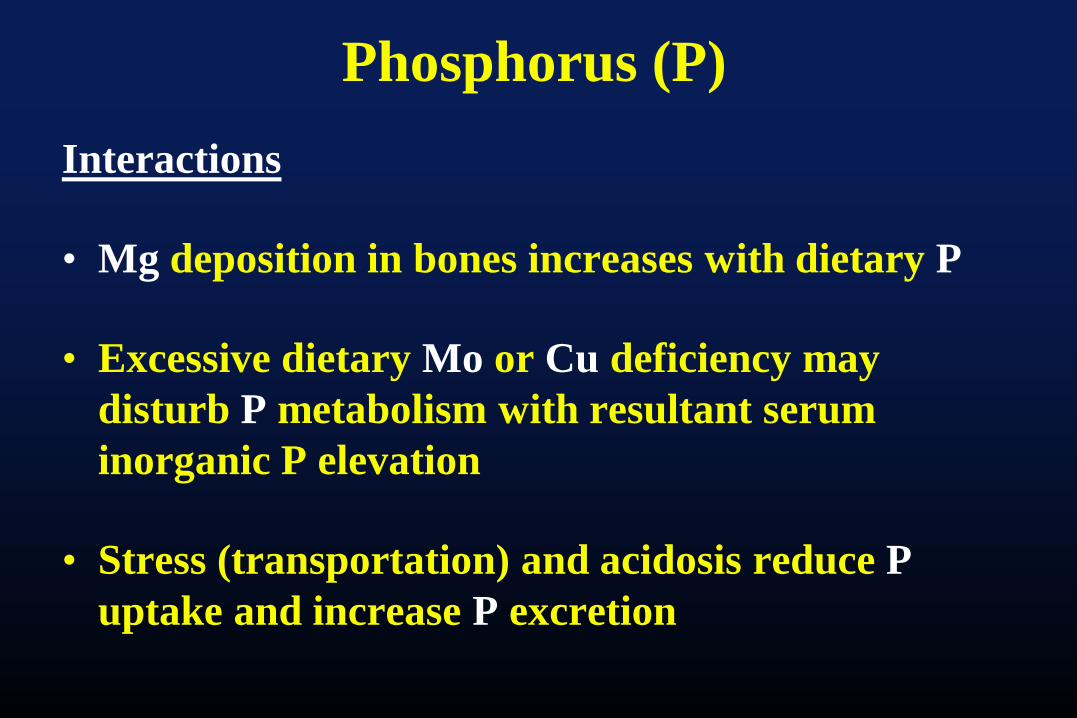
Phosphorus (P)Interactions
• Mg deposition in bones increases with dietary P
• Excessive dietary Mo or Cu deficiency may disturb P metabolism with resultant serum inorganic P elevation
• Stress (transportation) and acidosis reduce Puptake and increase P excretion
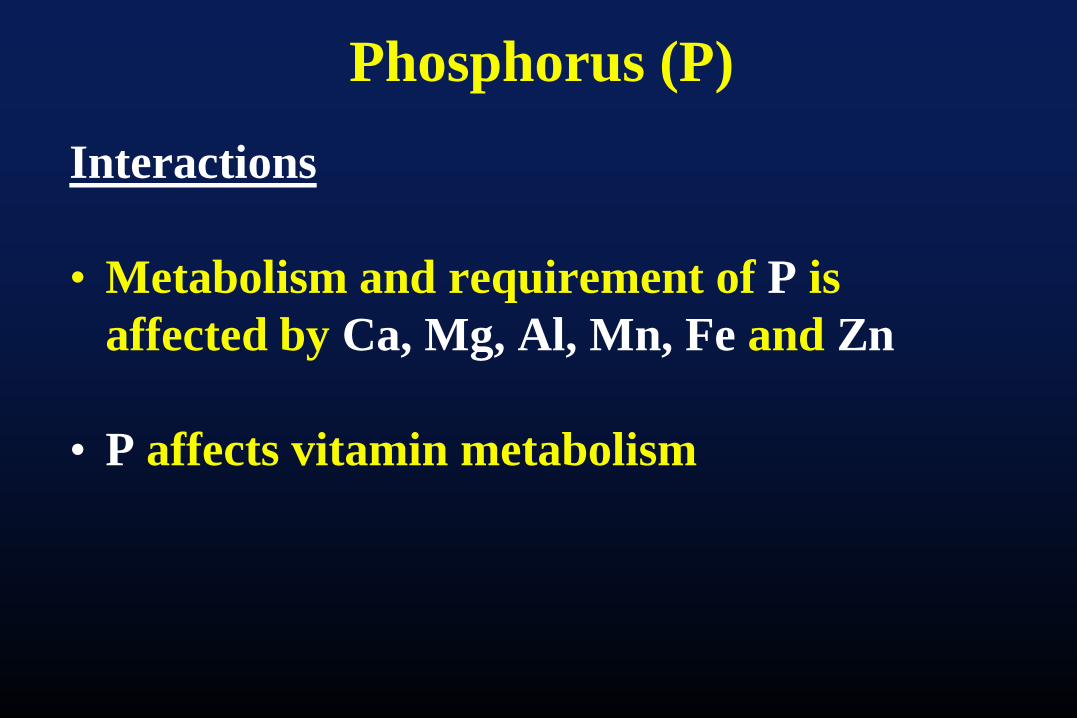
Phosphorus (P)
Interactions
• Metabolism and requirement of P is affected by Ca, Mg, Al, Mn, Fe and Zn
• P affects vitamin metabolism
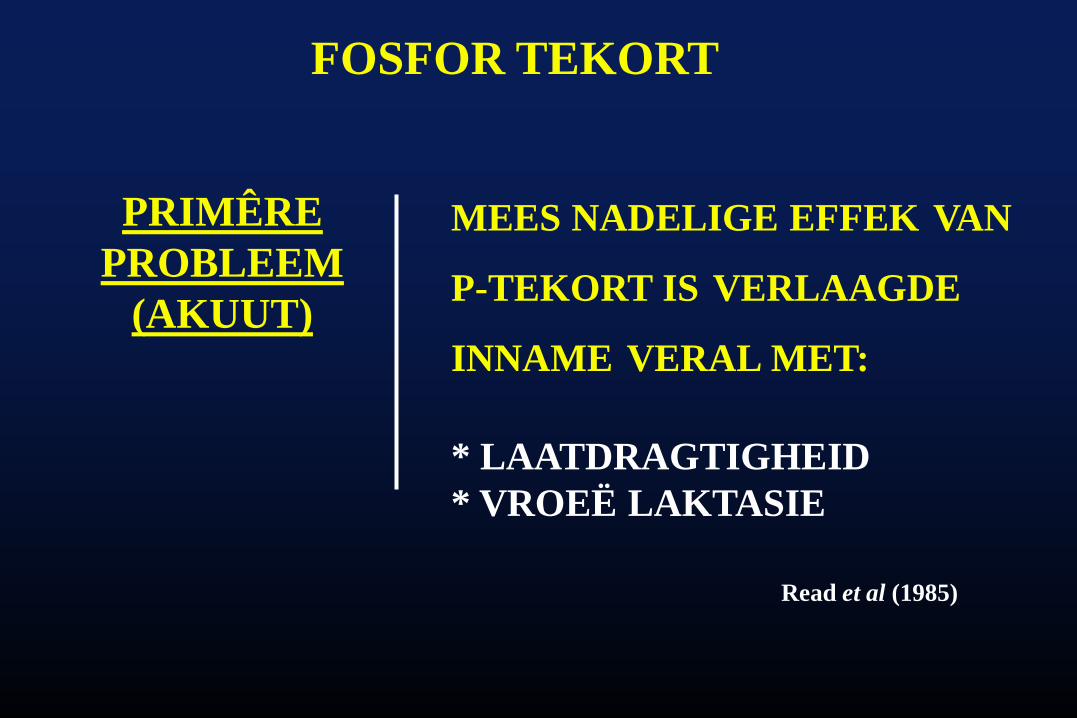
FOSFOR TEKORT
PRIMÊREPROBLEEM
(AKUUT)
Read et al (1985)
MEES NADELIGE EFFEK VAN
P-TEKORT IS VERLAAGDE
INNAME VERAL MET:
* LAATDRAGTIGHEID* VROEË LAKTASIE
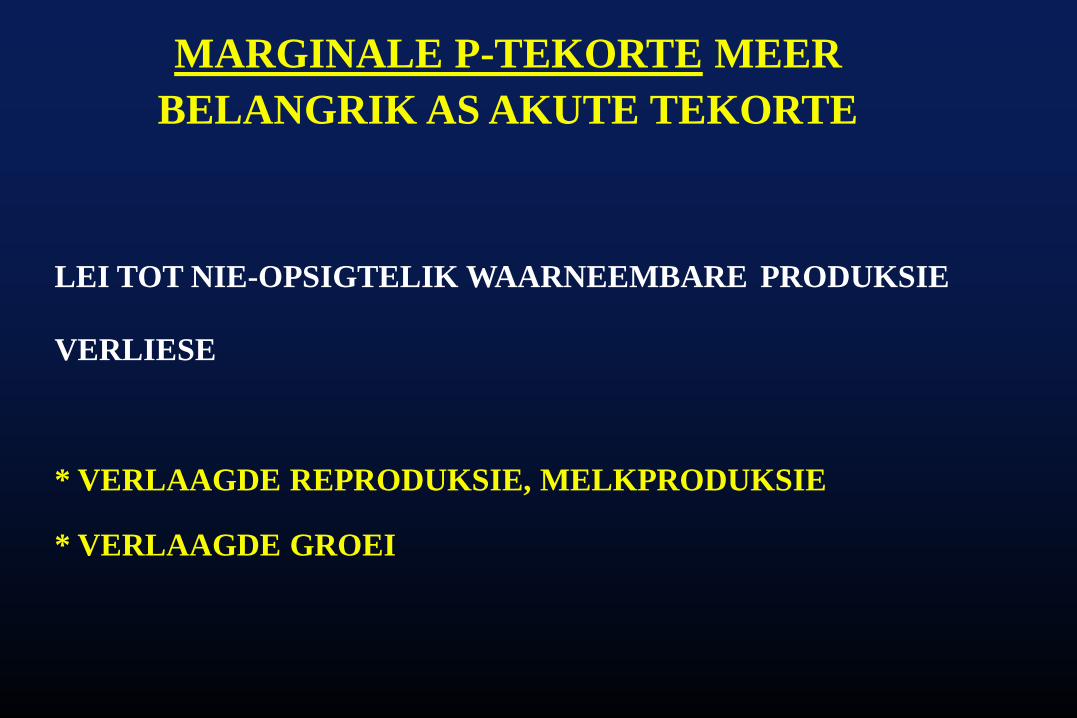
MARGINALE P-TEKORTE MEERBELANGRIK AS AKUTE TEKORTE
LEI TOT NIE-OPSIGTELIK WAARNEEMBARE PRODUKSIE
VERLIESE
* VERLAAGDE REPRODUKSIE, MELKPRODUKSIE
* VERLAAGDE GROEI
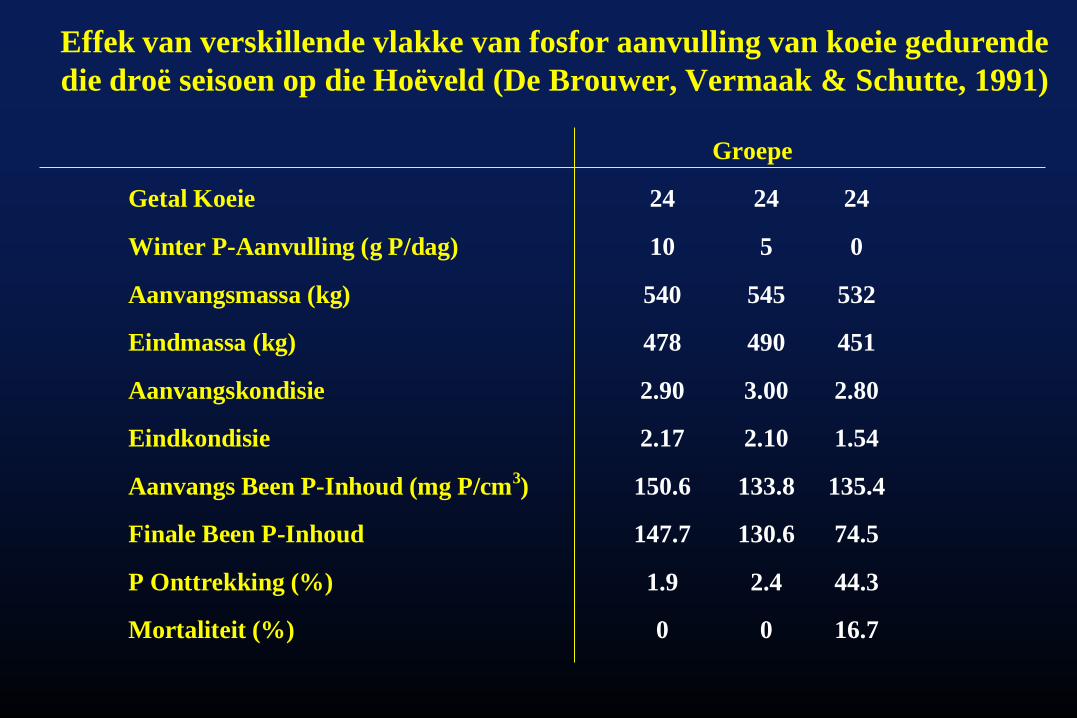
Effek van verskillende vlakke van fosfor aanvulling van koeie gedurende die droë seisoen op die Hoëveld (De Brouwer, Vermaak & Schutte, 1991)
Groepe
Getal Koeie 24 24 24
Winter P-Aanvulling (g P/dag) 10 5 0
Aanvangsmassa (kg) 540 545 532
Eindmassa (kg) 478 490 451
Aanvangskondisie 2.90 3.00 2.80
Eindkondisie 2.17 2.10 1.54
Aanvangs Been P-Inhoud (mg P/cm3) 150.6 133.8 135.4
Finale Been P-Inhoud 147.7 130.6 74.5
P Onttrekking (%) 1.9 2.4 44.3
Mortaliteit (%) 0 0 16.7
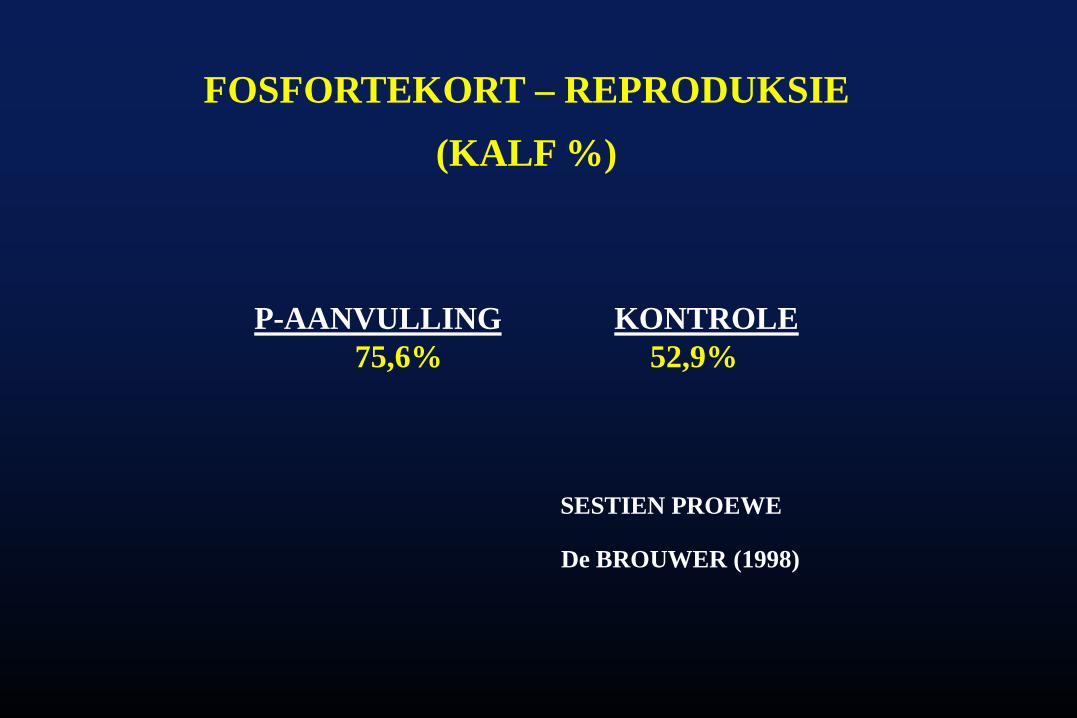
FOSFORTEKORT – REPRODUKSIE(KALF %)
P-AANVULLING KONTROLE75,6% 52,9%
SESTIEN PROEWE
De BROUWER (1998)
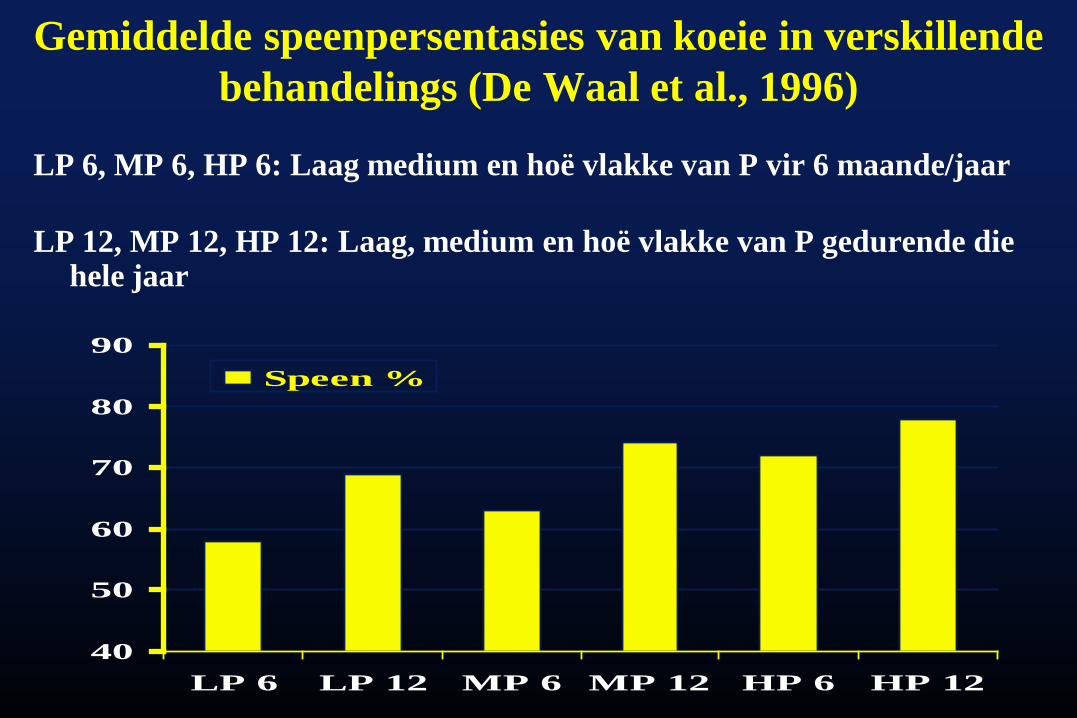
Gemiddelde speenpersentasies van koeie in verskillende behandelings (De Waal et al., 1996)
LP 6, MP 6, HP 6: Laag medium en hoë vlakke van P vir 6 maande/jaar
LP 12, MP 12, HP 12: Laag, medium en hoë vlakke van P gedurende die hele jaar
40
50
60
70
80
90
LP 6 LP 12 MP 6 MP 12 HP 6 HP 12
Speen %
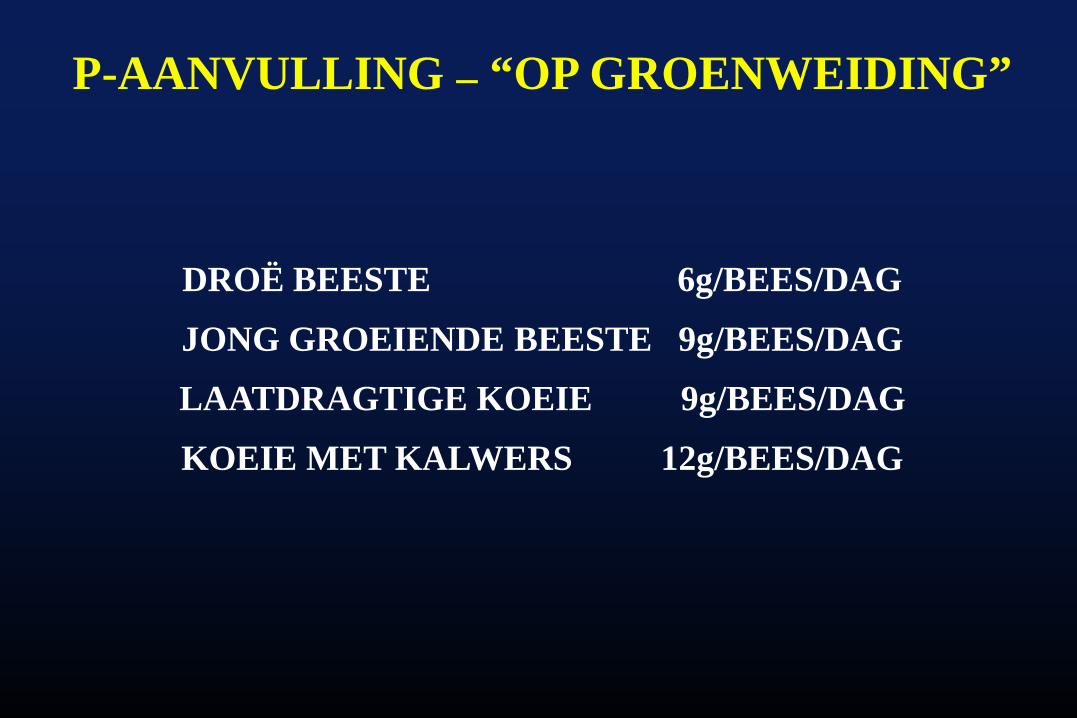
P-AANVULLING – “OP GROENWEIDING”
DROË BEESTE 6g/BEES/DAG
JONG GROEIENDE BEESTE 9g/BEES/DAG
LAATDRAGTIGE KOEIE 9g/BEES/DAG
KOEIE MET KALWERS 12g/BEES/DAG
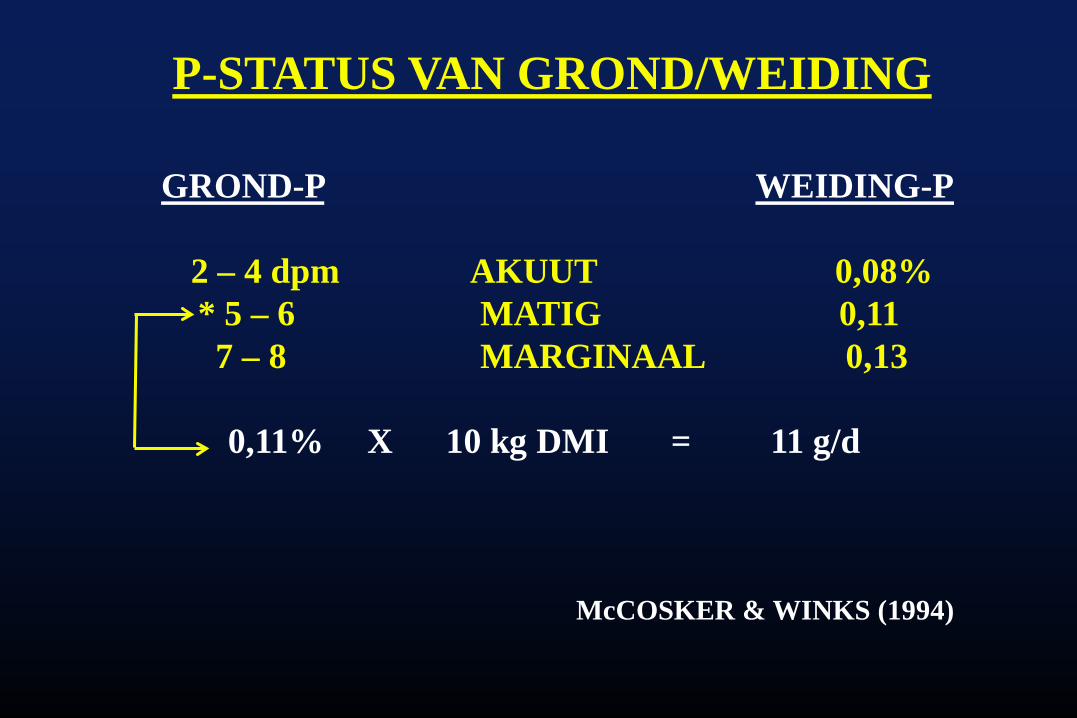
P-STATUS VAN GROND/WEIDING
GROND-P WEIDING-P
2 – 4 dpm AKUUT 0,08%* 5 – 6 MATIG 0,117 – 8 MARGINAAL 0,13
0,11% X 10 kg DMI = 11 g/d
McCOSKER & WINKS (1994)
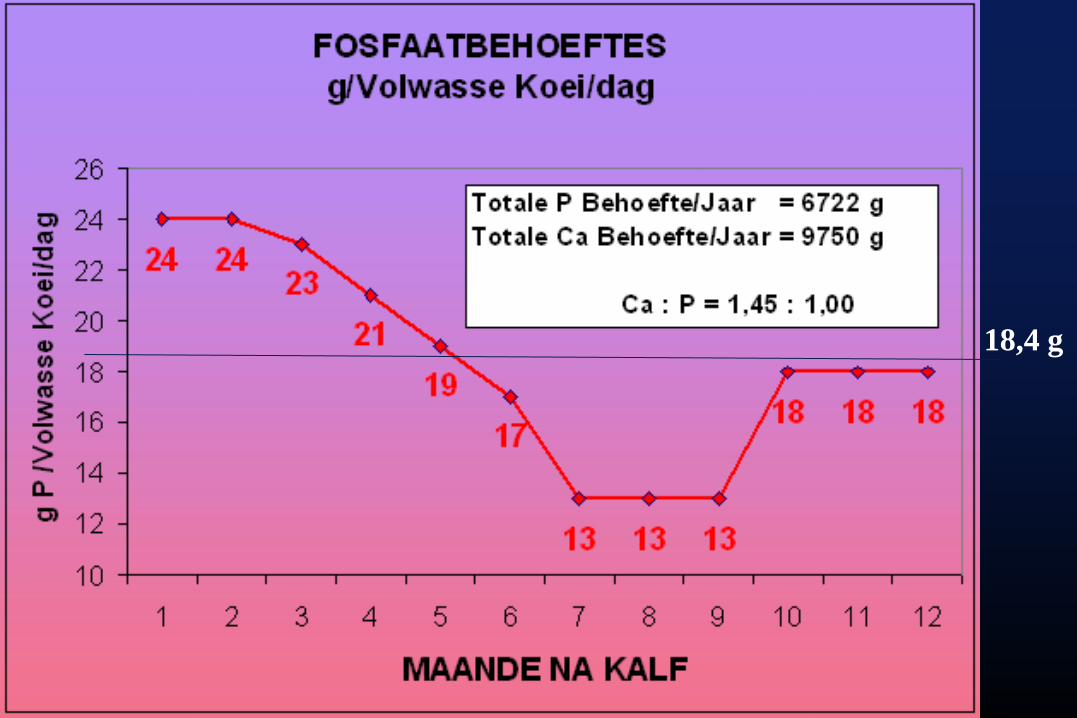
18,4 g
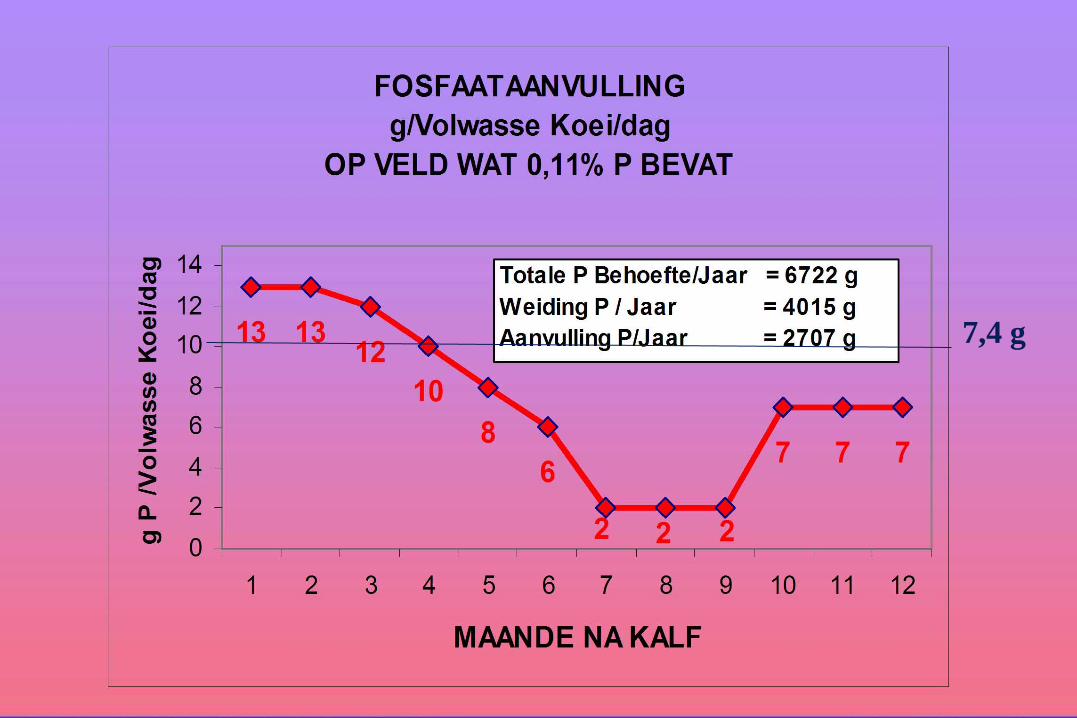
7,4 g
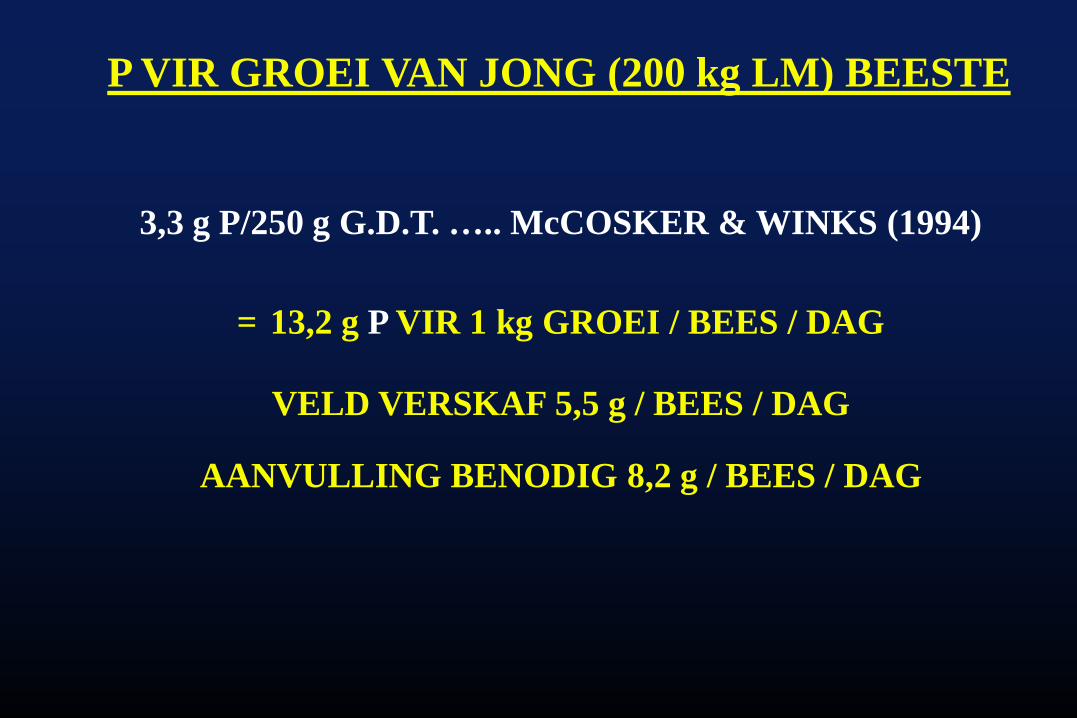
P VIR GROEI VAN JONG (200 kg LM) BEESTE
3,3 g P/250 g G.D.T. ….. McCOSKER & WINKS (1994)
= 13,2 g P VIR 1 kg GROEI / BEES / DAG
VELD VERSKAF 5,5 g / BEES / DAG
AANVULLING BENODIG 8,2 g / BEES / DAG
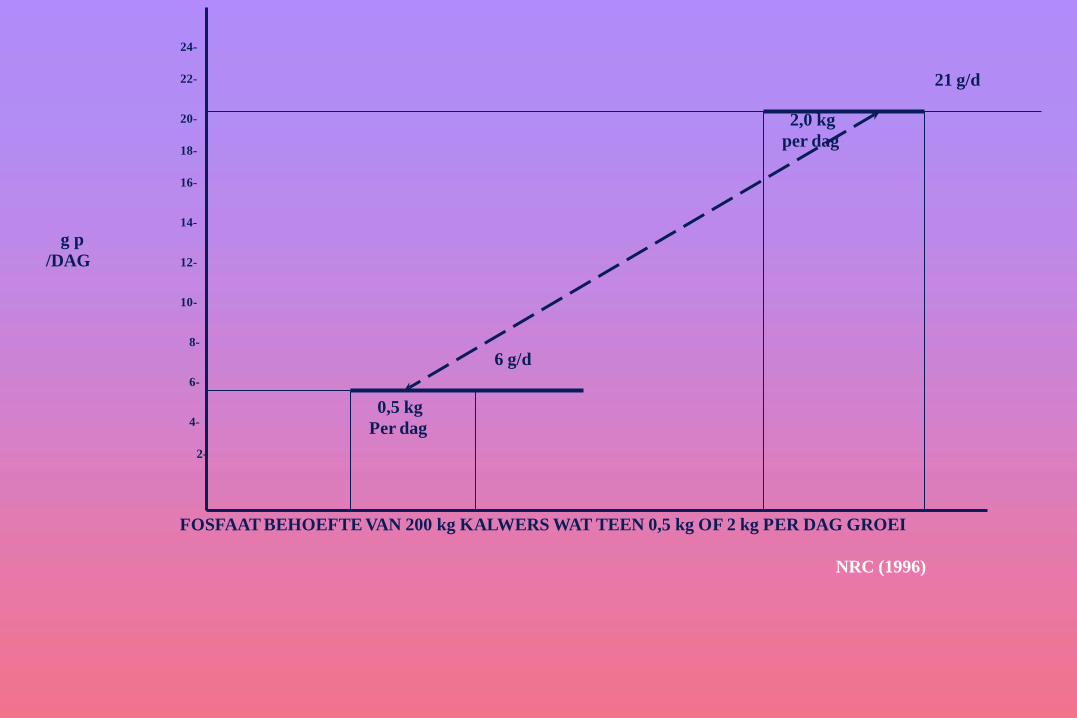
21 g/d
2,0 kgper dag
6 g/d
0,5 kgPer dag
g p/DAG
24-
22-
18-
16-
20-
14-
2-
12-
10-
6-
8-
4-
FOSFAAT BEHOEFTE VAN 200 kg KALWERS WAT TEEN 0,5 kg OF 2 kg PER DAG GROEI
NRC (1996)
Fosfaat (P)
• Krities om te verstaan dat Fosfatebrone verkil in die hoeveelheid opneembare fosfaat vlakke• Miskien nie noodwendig in totale P vlakke nie
• Daar is goeie laboratoriummetodes om verskille tussengoeie en swakker P bronne uit te wys
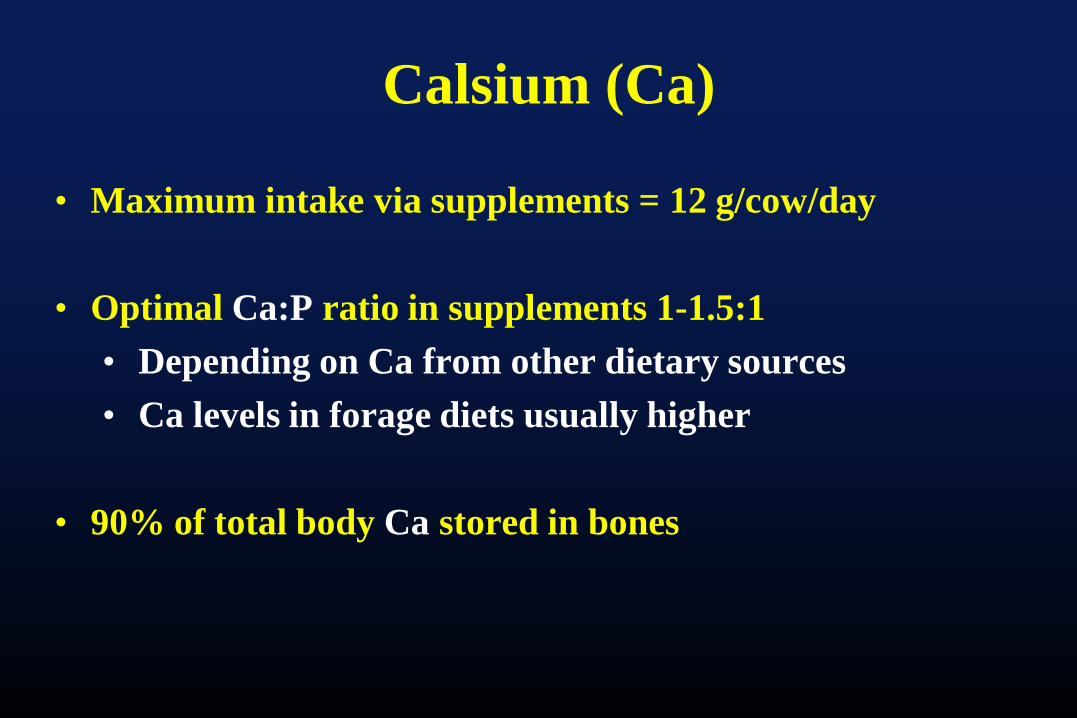
Calsium (Ca)
• Maximum intake via supplements = 12 g/cow/day
• Optimal Ca:P ratio in supplements 1-1.5:1 • Depending on Ca from other dietary sources• Ca levels in forage diets usually higher
• 90% of total body Ca stored in bones
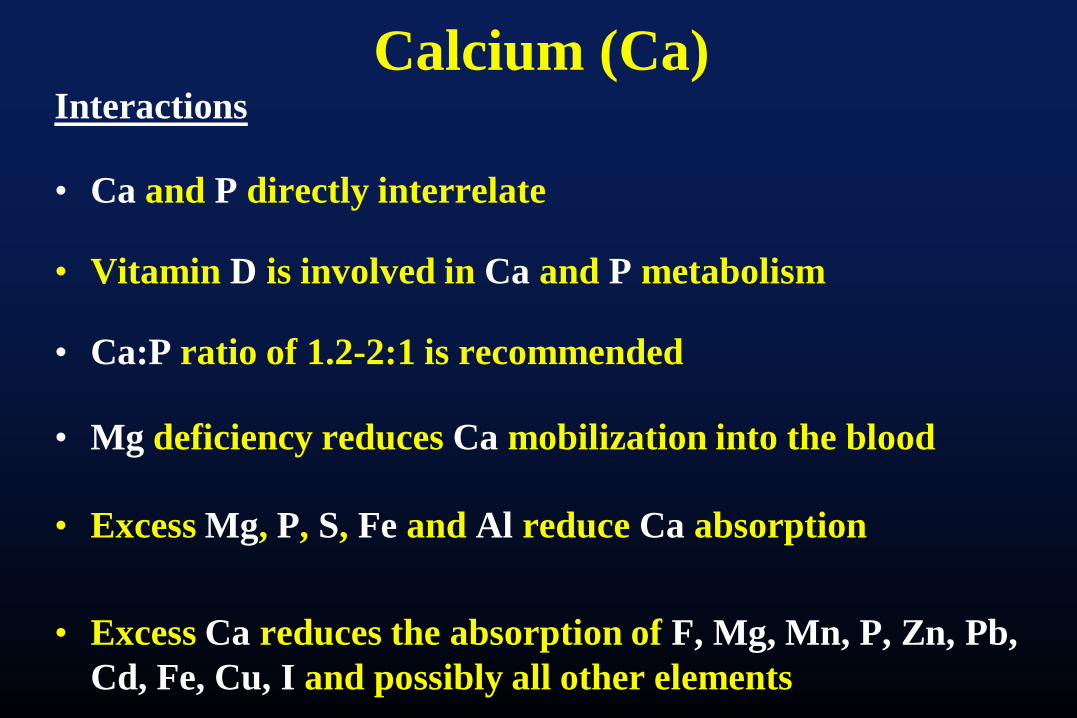
Calcium (Ca)Interactions
• Ca and P directly interrelate
• Vitamin D is involved in Ca and P metabolism
• Ca:P ratio of 1.2-2:1 is recommended
• Mg deficiency reduces Ca mobilization into the blood
• Excess Mg, P, S, Fe and Al reduce Ca absorption
• Excess Ca reduces the absorption of F, Mg, Mn, P, Zn, Pb, Cd, Fe, Cu, I and possibly all other elements