Embed Size (px)
Citation preview

1
BENCH BERM DESIGN USING PROBABILISTIC KEYBLOCK ANALYSIS
E. Hormazabal, SRK Consulting, Chile.
Abstract
In operational open pit mines, large rock surfaces are exposed daily and hundreds or thousands of new discontinuities are exposed, all of which may results in the formation of unstable keyblocks and wedges. It is impractical to attempt to map each discontinuity and carry out a stability analysis by the traditional kinematic analysis and wedge/planar failure analysis for each discontinuity mapped. The approach presented in this paper is to design the bench berm configuration in such a manner that sufficient keyblocks and wedges will be analyzed by probabilistic methods so that an acceptable level of safety is achieved. Geotechnical engineers therefore require a design tool which will allow them to evaluate the type and frequency of keyblocks that may be formed and the effect of decreasing the bench angle or increasing the berm width on the probability of failure of the keyblocks.
This paper describes a computer program, SBlock in which a probabilistic method is applied to determine the potential keyblock dimensions, the back break and the berm width for given acceptability criteria. Also, three case histories of operational open pit mines are presented to validate the methodology and calibrate the results.
It is concluded that a probabilistic approach is suitable for the evaluation and design of the bench berm configuration in situations where a large numbers of discontinuities are exposed in the operational open pit benches.
1 Introduction
In operational open pit mines, large rock surfaces are exposed daily and hundreds or thousands of new discontinuities are exposed, all of which may result in the formation of unstable keyblocks and wedges. It is impractical to attempt to map each discontinuity and carry out a stability analysis by the traditional kinematic analysis and wedge/planar failure analysis for each discontinuity exposed. The approach presented in this paper is to design the bench berm configuration in such a manner that sufficient keyblocks and wedges will be analyzed by probabilistic methods so that an acceptable level of safety is achieved. Geotechnical engineers therefore require a design tool which will allow them to evaluate the type and frequency of keyblocks that may be formed and the effect of decreasing the bench angle or increasing the berm width on the probability of failure of the keyblocks, failure volumes and effective berm widths.
The SBlock program (Esterhuizen, 2004) is a tool that can be used to conduct probabilistic analysis of the effects of discontinuities on bench scale stability. Knowledge of the distribution of the orientation, spacing and length characteristics of discontinuities makes it possible to simulate blocks in the slope face of a bench. SBlock makes use of up to six discontinuity sets to generate blocks that can potentially form along a bench face. Each block is generated independently of previous or following blocks. It is assumed that a block may contain smaller blocks, resulting in large blocks which are limited in size only by the length of the joints. By applying the keyblock analysis method of Goodman & Shi (1985) each simulated block is evaluated to determine whether it is removable from the surrounding rock mass. Once a keyblock has been identified, its removability and sliding stability is assessed and accumulated so that the stability of a pit bench can be evaluated. The program reports failure volumes, back break, remaining berm widths and rubble accumulation at the toe of each bench.

2
This paper describes how probabilistic bench analysis has been conducted using the SBlock to optimize bench design for given acceptability criteria. Three cases histories of operational open pit mines are presented to validate the methodology and calibrate the results.
2 Method of Analysis
The implementation of the keyblock method in SBlock allows blocks of any convex shape to be evaluated (see Figure 1).Blocks can fail by two‐plane sliding or single plane sliding, depending on the shape and location relative to the free face of the bench slope. The keyblock method is used to identify removability of the blocks. Once removability has been established, the program uses vector methods to determine the sliding direction, normal and shear forces on the sliding planes and the safety factor of the block. Sliding can occur along a single plane (planar failure) or along two planes (wedge failure) and sometimes along three planes (block failure). The user does not have to identify which type of sliding and failure mode to consider – the program identifies blocks and finds whether they can slide out of the face, and the sliding mode.
2.1 The Keyblock Method
Joints and other discontinuities in rock delineate blocks which are enclosed within the rock mass. When an excavation is created, these blocks are exposed in the surface of the excavation. A keyblock is a block that can displace into an excavation without being obstructed by rock. Keyblocks are important from a stability point of view, because they are typically the first blocks to be liberated into the excavation. Such keyblocks represent a safety and operational hazard and are of fundamental interest in excavation design.
When designing excavations in jointed rock, it is important to identify the number and size of potential keyblocks in the excavation walls. Once keyblocks have been identified, it is necessary to establish whether they are likely to be stable, or whether they can slide into the excavation under gravity. Knowledge of the discontinuity orientations and lengths is necessary to identify potential keyblocks. The orientation of likely sliding planes and the sliding resistance must be known to conduct a stability analysis of the keyblocks. Figure 1 illustrates examples of keyblocks that can be formed within a slope face.
a) b) Figure 1 Some types of blocks in a rock slope. a) Types of blocks in a slope: (1) key blocks; (2)
removable blocks with parallel faces; (3) joint blocks. b) Removable blocks in a rock slope.

3
The keybock method was formalized by Goodman and Shi (19865) who used principles of topology to identify potential keyblocks from joint orientations. Blocks are identified that can be infinite or finite. The finite blocks may be removable or not. The removable blocks are further subdivided into stable or unstable blocks depending on the direction of sliding and frictional resistance. The unstable blocks are called keyblocks. Once a removable has been identified, vector methods are used to evaluate its sliding stability, or in the case of underground excavations, the potential for the block to be released from the roof. The mathematical basis described by Goodman and Shi for identifying convex removable blocks and evaluating their stability, was used in the development of the SBlock software.
2.2 Block Formation from Joint Orientations and Trace Lengths
During the development of the SBlock software it was recognized that at an operational site information on discontinuity set orientations, their scatter, the spacing between discontinuities and trace length distributions is likely to be available. Detailed characteristics such as joint area extent or cross‐cutting relationships are unlikely to be available. These types of relationships are needed if a full fracture network is to be reconstructed for discrete fracture network modeling (Derschowitz et al., 1996). SBlock only considers a single block at a time and does not attempt to reconstruct the entire interlocked rock mass. It reconstructs one block at a time by replicating the observed trace lengths and orientations, and projecting the discontinuity surfaces back into the rock to determine whether a block is formed. This approach requires that only the distribution of joint orientations, spacing and trace lengths, need to be known to conduct an SBlock analysis. These parameters can be directly observed by standard scan line mapping of excavation surfaces.
In principle Sblock creates one block at a time block by locating joint traces on the surface of the bench slope and determining whether the traces intersect to form a block. Traces are selected based on the apparent frequency of each joint set in the slope surface. Each trace belongs to a joint set and is assigned a random orientation and trace length drawn from the statistics of the set. Joint spacing and trace length is assumed to follow a truncated negative exponential distribution. Joint orientation and strength properties are assumed to follow a normal distribution.
The location and intersections of traces are considered to determine whether a block is outlined on the excavation surface. The potential for cut‐off planes to exist, that limit the extent of the block into the rock mass, is tested by considering the location of joint planes along the intersection lines of the traces exposed on the excavation surface. Figure 2 outlines the detailed procedure for identifying a block within the excavation surface and includes the steps that follow to conduct a bench stability analysis.
Once a potential block is identified, an analysis, following the procedures of Goodman and Shi (1985), is conducted to determine whether the block is removable. Removable blocks are further evaluated for stability. If they are unstable, they are counted as keyblocks.
2.3 Block stability
The stability of a removable block is evaluated by first identifying the sliding direction. The surfaces that are in contact are identified and the distribution of weight onto each surface is determined. A simple Coulomb analysis is conducted to establish whether the shear resistance can resist sliding. Usually the sliding analysis is conducted by conservatively assuming frictional resistance only. Single or double plane sliding is automatically identified, based on the orientation of the block relative to the gravity vector.
2.4 Probabilistic Analysis of Bench Stability
Knowledge of the stability or instability of a single block is of limited use when thousands are exposed daily in an operating pit. It is only when many thousands of potential blocks are evaluated that their cumulative influence on bench stability becomes apparent.
Bench stability is evaluated by considering a 200 m long bench. The SBlock software is used to create many thousands of blocks along the 200 m long bench. A portion of the blocks will be keyblocks while many block

4
will be non‐removable. Blocks are located at random locations in the bench face. Figure 3 demonstrates how a classical wedge‐type block might be formed when a six‐sided block is randomly located within a bench face.
Blocks may overlap, but the failure volume is only accumulated once if failure occurs. Three horizontal ‘scan lines’ are simulated near the top, middle and bottom of the bench face and the joint trace intersections with the scan lines are counted. The number of joints intersecting the scan lines is checked against the expected joint frequency along the scan lines. When a sufficient number of joints have been “sampled” by the scan lines, a new bench will be started.
The failure volume and other statistics are accumulated for each bench, and a summary is provided at the end of each run. Several hundred benches can be sampled to obtain representative statistics of bench stability. Figure 4 shows a view onto a 200m bench face showing the outline of blocks – red outlines show unstable blocks and blue ones are stable. It does not show every joint however – but only joints that form block edges.
STAR NEW
BLOCK
FIND APPARENT FREQUENCY OF EACH
JOINT SET IN PLANE OF FACE (PLANE 6)
USE MONTECARLO METHOD (MC) TO SELECT
JOINT 1 BASED ON APPARENT FREQUENCIES
MC SELECT TRACE LENGTH OF JOINT 1 &
2 AND CALCULATE COORDS OF UPPER
ENDPOINTS
APPLY RANDOM VARIATION OF
DIP/DIPDIR FOR ALL JOINTS PLANES
BASED ON JOINT SETS STATISTICS
CALCULATE BLOCK CORNERS, EDGES, VOLUME
AND REMOVABILITY
FIND ORIENTATION OF INTERSECTION LINE
BETWEEN JOINT 1 AND PLANE 6
FIND FREQUENCY OF REMAINING JOINTS SETS
ALONG INTERSECTION LINE 1/6
MC SELECT JOINT 2 BASED ON FREQUENCIES
ALONG INTERSECTION LINE 1/6
LOCATE ENDPOINT OF JOINT 1 AND 2 AT ORIGIN
(LOWEST POINT OF BLOCK
MC SELECT MOST LIKELY JOINT SET
ALONG INTERSECTION LINE OF PLANE 2 AND
BENCH FACE = JOINT 3
MC SELECT TRACE LENGTH FOR JOINT 3
AND CALCULATE ENDPOINTS IN PLANE 6
REPEAT FOR JOINT 5 ALONG PLANE 1
FIND MOST LIKELY JOINT ALONG INTERSECTION LINE OF JOINTS 1 & 2 =
JOINT 4
LOCATE JOINT 4 ALONG INTERSECTION LINE 1/2
AT DISTANCE EXCEEDING TRACE LENGTH OF
JOINTS 1, 2
APPLY MC SELECTED FRICTION AND
COHESION FOR ALL PLANES
LOCATE BLOCK ORIGIN AT RANDOM
HEIGHT RELATIVE TO BENCH TOE AND 200 m
BENCH WIDTH
CHECK IF JOINT FREQUENCY ALONG
SCANLINES SATISFIED
CALCULATE AND COUNT ALL INTERSECTIONS OF JOINT TRACE LINES IN BENCH FACE WITH 3 SCANLINES ALONG
BENCH FACE
CHECK IS BLOCK IS FINITE AND REMOVABLE
FIND LENGTH OF EVERY EDGE OF BLOCK
CHECK IF JOINT TRACE LENGTHS EXCEED ALL BLOCK EDGE LENGTHS
DETERMINE SLIDING MODE, FRICTIONAL RESISTENCE, DISTURBING FORCE AND
FACTOR SAFETY
ACCUMULATE FAILED AND UNFAILED VOLUME AND
OTHERS STATISTICSYES
YES
YES
Figure 2 Flow chart for block formation from trace length and orientation statistics.

5
Figure 3 Example showing how a classic wedge shaped block may be formed.
BENCH CREST
BENCH TOE
Figure 4 Random location of blocks along a bench. Red blocks are unstable.
2.5 The SBlock input data set
The following input parameters need to be included in the analysis:
Orientation : Joint set orientations are defined by the average Dip (0‐90 degrees), the Dip direction (0 360 degrees) clockwise from North. The Range specifies the scatter of the dip and dip direction in degrees. A scatter of 40 degrees means the dip and dip direction vary by 20 degrees above and below the average value.

6
Spacing : The average joint set spacing is entered as the mean spacing; the minimum spacing and maximum spacing are required. Program assumes the joint spacings follow a negative exponential distribution, truncated at the minimum and maximum values
Length : Joint trace length is considered as the mean length; also the minimum and maximum trace length is considered. Program assumes the joint trace length follows a negative exponential distribution, truncated at the minimum and maximum values.
Shear Strength Properties : The joint set average friction angle and cohesion are needed for the analysis. A simple linear Mohr‐Coulomb criterion is used to calculate the resistance to shearing.
Bench Geometry : The data required for the bench geometry is the following: Bench Face Dip; Bench face dip Direction; bench height and Bench Width.
4.3 Results of the Failure Analysis
The following results can obtained from the analysis:
Average failure volume: Average volume of failed rock calculated by a 1m wide slice taken every 2m along the strike of the benches simulated. This includes parts of the bench where zero failure occurred. Failure volume is expressed as a volume per 1m run along the bench strike.
Average factor of safety of blocks/wedges: A simple average of all factors of safety of blocks that can slide towards the free face. This includes stable and unstable blocks but excludes blocks that slide towards the solid rock (that is sliding away from the bench free‐face)
Bench crest failure depth: the depth of failure of the bench crest is expressed as a probability of failure (see Figure 6).
Average effective bench width: This is the average horizontal dimension of all benches simulated and shows the effect of crest failures on bench width. If the benches were designed to be 15m wide and the effective width is 11m, it means that on average 4m of bench crest has fallen away, also known as back break.
Failure Free Bench length: Length of bench crest that did not experience any failure expressed as a percentage.
Average non‐zero failure volume: Average failure volume obtained by dividing the total failure volume by the length of crest affected by failure (excludes unaffected crest length from the calculation). This gives a good idea of the amount of failed rock at each failure location. Sometimes only one or two large failures occur and expressed as an average over the entire bench length they may seem small, but each individual failure might be large.
Average required bench width: The width of bench required to hold the average failure volume, based on an angle of repose of 30º and 40% swell. It is assumed that the failed rock is in the form of rubble and lies in a pile at the toe of each bench. This gives an indication of how wide the benches should be to hold the failed volume. It should be compared to the Effective Bench Width. The cumulative distribution of berm width is also provided (see Figure 7).

7
Figure 6 Depth of failure of a bench expressed as a probability of failure. The figure shows that
there is a 53% probability that the crest will be failed and the probability drops to about 20% at a depth of 6 m. it also shows the pile of rubble that will form at the toe of the slope – based on the average volume of failure. This shows that the bench effectiveness is reduced by about 95%.
Figure 7 Cumulative distribution of bench widths for berms that were originally 12 m wide. The
figure shows, for example, that 80% of the benches are greater than 7 m wide.

8
5 Examples of Application at Mining Operations and Projects
The SBlock methodology has been applied in several operating mines and projects at different stages of development. Three of those mines have been selected to illustrate the use of the methodology in real case situations.
5.1 Carmen de Andacollo Open Pit (Teck)
The Carmen de Andacollo (CDA) pit is located in central Chile, adjacent to the town of Andacollo, approximately 55 kilometres southeast of La Serena and 350 km north of Santiago. The mine is located near the southern limit of the Atacama Desert at an elevation of 1,000 m. Carmen de Andacollo is an open pit mine which produces copper in concentrates from the hypogene portion of the orebody. Copper cathode production from the supergene portion of the orebody is currently approaching completion.
According to the geotechnical information provided from surface mapping and logging of several campaigns in the past in “Carmen de Andacollo” pit, 7 structural domains had been defined (see Hormazabal et al. 2011). Recognized structural features correspond to 1st order regional faults (Carmen, Hermosa, Andacollo & Twila faults), 2nd order faults (NS and N) and 3rd order (NW and lithology contacts). Table 1 summarizes the structural parameters for the Southwest sector.
Table 1: Structural data for West Domain.
Set DipDir Dip Spacing (m) Persistence (m)
Mean Min Max Mean Min Max
Joint 1 65º ± 20º 245º ± 30º 10 5 15 30 15 45
Joint 2 72º ± 20º 278º ± 30º 10 5 15 30 15 45
Joint 3 72º ± 20º 313º ± 30º 10 5 15 30 15 45
Joint 4 86º ± 20º 007º ± 10º 5 1 15 10 5 15
Joint 5 86º ± 20º 033º ± 10º 5 1 15 10 5 15
Joint 6 86º ± 20º 214º ± 10º 5 1 15 12 6 18
Notes:
Bench face dip = 70º; bench face dip direction = 240º; bench height = 10 m; bench berm width = 6.5m.
Friction angle = 20º and cohesion = 0, for all joints.
An on‐site calibration was carried out using values shown in Table 1 for the different slope orientations in the Southwest domain. A 3D plot of the benches indicates the location of failures identified by the program (see Figure 8). This output from the program shows a good visual correlation with the slope benches, and provided realistic estimates of the total failure volume, which helped to validate the methodology.
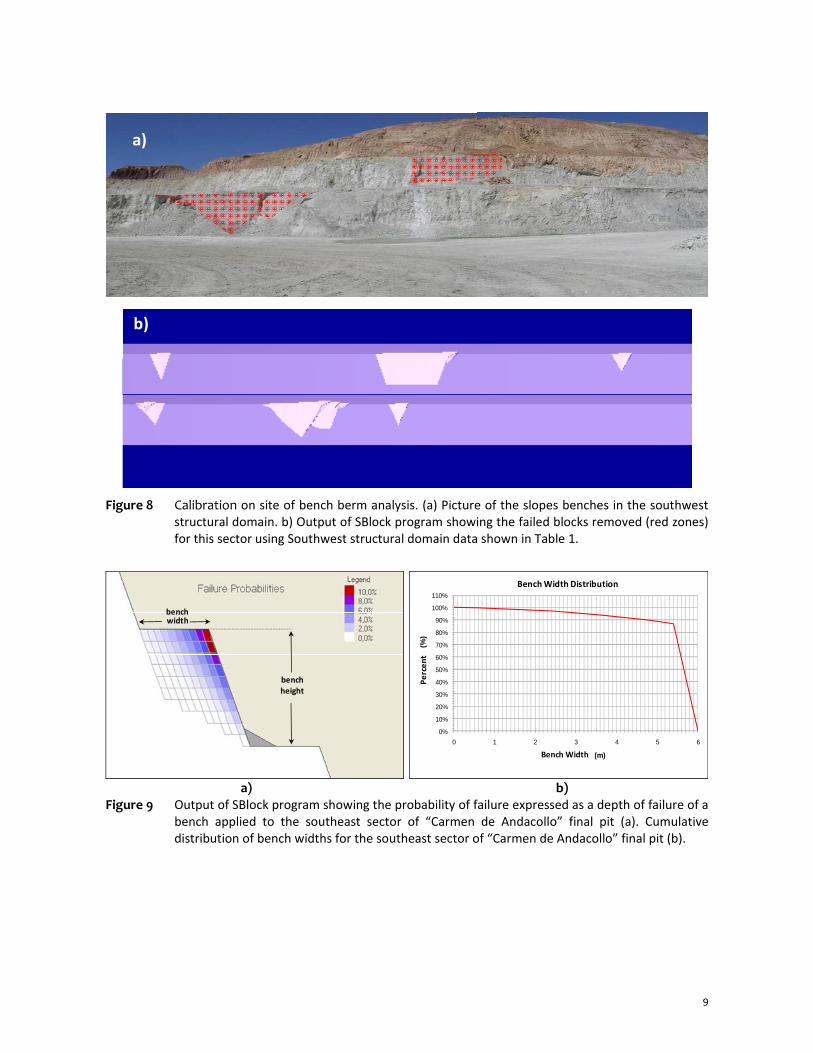
After the calibration was complete, the methodology was applied for different push‐backs in the same structural domain. Figure 9 shows the application to the Southwest sector (final pit). This figure shows the probability of failure expressed as a depth of failure of a bench. The results show that there is a 10% probability that the crest will fail and the probability drops to about 4% at a depth of 3.6m. It also can be note the pile of rubble that will form at the toe of the slope – based on the average volume of failure. The bench effectiveness is reduced by about 40%. This result shows that 90% of benches can be expected to be greater than 5.5m wide. These dimensions and expected failure volumes are considered to be acceptable by the mine operational management.
9
a)
b)
Figure 8 Calibration on site of bench berm analysis. (a) Picture of the slopes benches in the southwest structural domain. b) Output of SBlock program showing the failed blocks removed (red zones) for this sector using Southwest structural domain data shown in Table 1.
0%
10%
20%
30%
40%
50%
60%
70%
80%
90%
100%
110%
0 1 2 3 4 5 6
Po
rcen
tag
e (%
)
Ancho Berma (m)
Distribución Ancho de Berma
benchheight
Bench Width
Percent
BenchWidth Distribution
benchwidth
a) b) Figure 9 Output of SBlock program showing the probability of failure expressed as a depth of failure of a
bench applied to the southeast sector of “Carmen de Andacollo” final pit (a). Cumulative distribution of bench widths for the southeast sector of “Carmen de Andacollo” final pit (b).

10
5.2 Cuajone pit (SPCC)
The Cuajone porphyry copper deposit is located on the western slopes of Cordillera Occidental, the southern Andes of Peru. The current pit measures about 2.5 km east‐west, 3.0 km north‐south, and at the end of 2012, had a maximum depth of 900 m. Mining by open pit methods commenced in 1976 and has continued since that time. Ore production is 80 ktpd.
According to the geotechnical information provided from surface mapping and logging of several campaigns in the past in “Cuajone” pit, 9 structural domains had been defined (SRK, 2012). Table 2 summaries the structural parameters for the West sector.
Table 2: Structural data for West Sector (Domain A).
Set DipDir Dip Spacing (m) Persistence (m)
Mean Min Max Mean Min Max
Joint 1 82º ± 15º 159º ± 15º 7 3 11 30 15 45
Joint 2 88º ± 15º 097º ± 15º 7 3 11 30 15 45
Joint 3 83º ± 15º 279º ± 15º 7 3 11 30 15 45
Joint 4 44º ± 15º 226º ± 15º 7 3 11 30 15 45
Joint 5 44º ± 15º 271º ± 15º 7 3 11 30 15 45
Joint 6 842º ± 15º 189º ± 15º 3 1 5 15 7 23
Notes:
Bench face dip = 67º; bench face dip direction = 180º; bench height = 15 m; bench berm width = 9.0m.
Friction angle = 25º and cohesion = 0, for all joints.
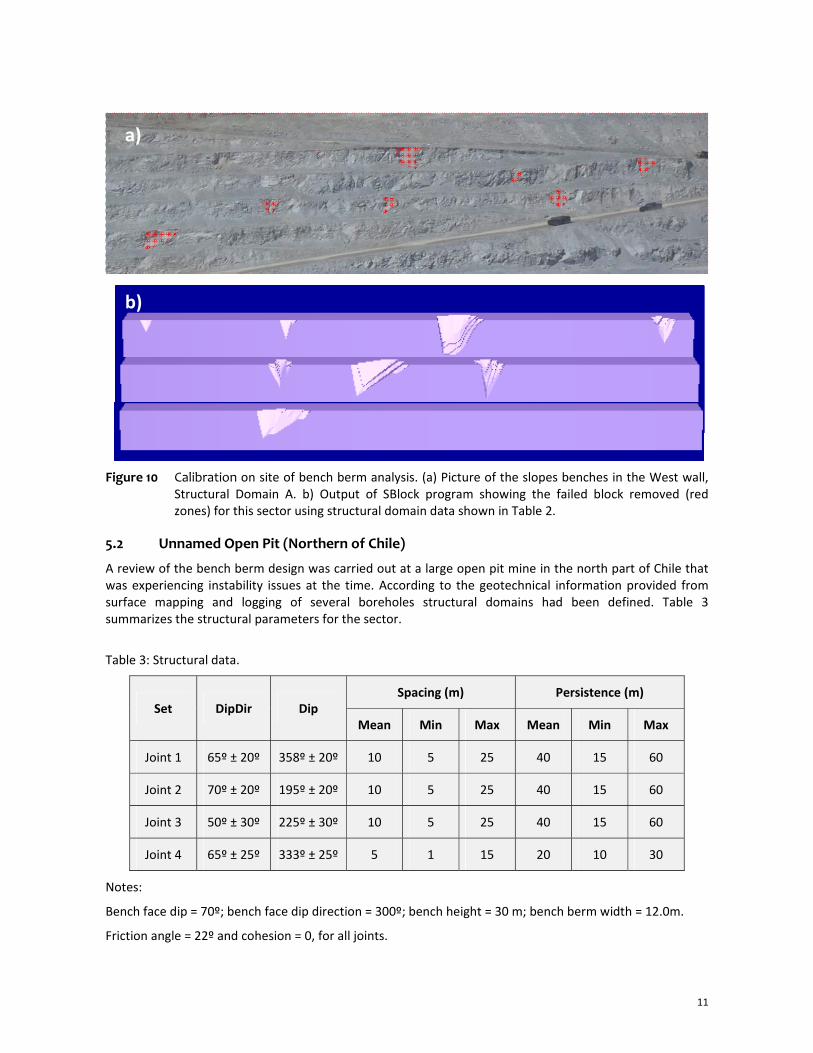
A calibration on site was carried out using values shown in Table 2 for the different slope orientations in the structural domain A. A 3D plot of the benches indicates the location of failures identified by the program (see Figure 10). This output from the program shows a good visual correlation with the observed frequency and type of failure observed in the pit benches. The failure volume and bench widths predicted by the SBlock outputs agree sufficiently with the observed instabilities of the slope benches. This initial study validated the adequacy of the methodology and further bench stability will be evaluated using the SBlock approach.
11
a)
b)
Figure 10 Calibration on site of bench berm analysis. (a) Picture of the slopes benches in the West wall, Structural Domain A. b) Output of SBlock program showing the failed block removed (red zones) for this sector using structural domain data shown in Table 2.
5.2 Unnamed Open Pit (Northern of Chile)
A review of the bench berm design was carried out at a large open pit mine in the north part of Chile that was experiencing instability issues at the time. According to the geotechnical information provided from surface mapping and logging of several boreholes structural domains had been defined. Table 3 summarizes the structural parameters for the sector.
Table 3: Structural data.
Set DipDir Dip Spacing (m) Persistence (m)
Mean Min Max Mean Min Max
Joint 1 65º ± 20º 358º ± 20º 10 5 25 40 15 60
Joint 2 70º ± 20º 195º ± 20º 10 5 25 40 15 60
Joint 3 50º ± 30º 225º ± 30º 10 5 25 40 15 60
Joint 4 65º ± 25º 333º ± 25º 5 1 15 20 10 30
Notes:
Bench face dip = 70º; bench face dip direction = 300º; bench height = 30 m; bench berm width = 12.0m.
Friction angle = 22º and cohesion = 0, for all joints.

12
A calibration on site was carried out using values shown in Table 3 for the different slope orientations in the structural domain A. A 3D plot of the benches indicates the location of failures identified by the program (see Figure 11). This output from the program shows a good correlation with the intensity and extent of failure observed in the slope benches, which helped to validate the methodology. All further evaluation of potential bench scale instability will be conducted using this approach.
a)
b)
Figure 11 Calibration on site of bench berm analysis. (a) Picture of the slopes benches in the structural
domain. b) Output of SBlock program showing the failed blocks removed (red zones) for this sector using structural domain data shown in Table 3.
6 Conclusions
Owing to the large number of discontinuities exposed daily in producing open pit mines, a probabilistic approach to evaluating the potential for blocks/wedges to fail is required. A computer program which uses joints orientation, persistence and spacing statistics was implemented to develop a probabilistic approach which allows rapid determination of the probability of failure of blocks/wedges for different benches geometries.
The output of the program provides insight into the effective berm width, back‐break, probability of failure and cumulative distribution of bench widths. The effect of increasing/decreasing the bench angle, increasing/decreasing the berm width and varying the slope orientation may be evaluated. Results of the application in 3 real cases presented in the paper show that the approach is able to provide useful results for practical mining situations and optimize interramp angles.
The methodology presented can help to answer these common types of questions in operative’s mines:
By how much will the failure volume increase if we increase the bench face angle by 5 degrees?
By how much will the catch bench width be reduced because of crest failures?
How will catch bench effectiveness be changed if we increase the interramp angle by 3 degrees?
How will the effective bench width change if I allow them to increase the single bench height to double bench height?

13
Acknowledgement
The author would like to thank: Gabriel Esterhuizen, formerly of SRK Consulting, Denver for his support and review of this paper; TECK Carmen de Andacollo – Chile for permission and authorization to publish the paper; and especially Carmen de Andacollo, Planning Superintendent; Javier Escuti and Geotechnical Team Chief, Mauricio Tapia who shared their mining experience and practical knowledge in this project. The author would also like to thank the of SPCC ‐ Perú, for permission and authorization to publish the paper, and especially Cuajone Mine Geotechnical Superintendent Raul Veramendi and Geotechnical Engineer, Jorge Barrios who were willing to share their mining experience and practical knowledge in this project.
References
Esterhuizen, G. (2004): SBLOCK v. 2.01. User Guide and Reference Manual. Goodman, R. & Shi, GH. (1985): “Block theory and its application to rock engineering”. Prentice Hall. USA. Dershowitz, W., G. Lee, J. Geier, T. Foxford, P. La Pointe and A. Thomas, (1996): FracMan Interactive Discrete Feature
Data Analysis, Geometric Modeling, and Exploration Simulation: User Documentation Version 2.5. Golder Associates Inc., Redmond, WA.
Hormazabal, E., Tapia, M., Fuenzalida, R. & Zuñiga, G. (2011): Slope optimization for the Hypogene Project at Carmen de Andacollo pit, Chile. Slope Stability Conference Vancouver, Canada.
SRK Consulting (Chile) S.A. (2012): “Estudio Geotécnico rajo Cuajone ". Technical Report for SPCC. March.