Embed Size (px)
Citation preview
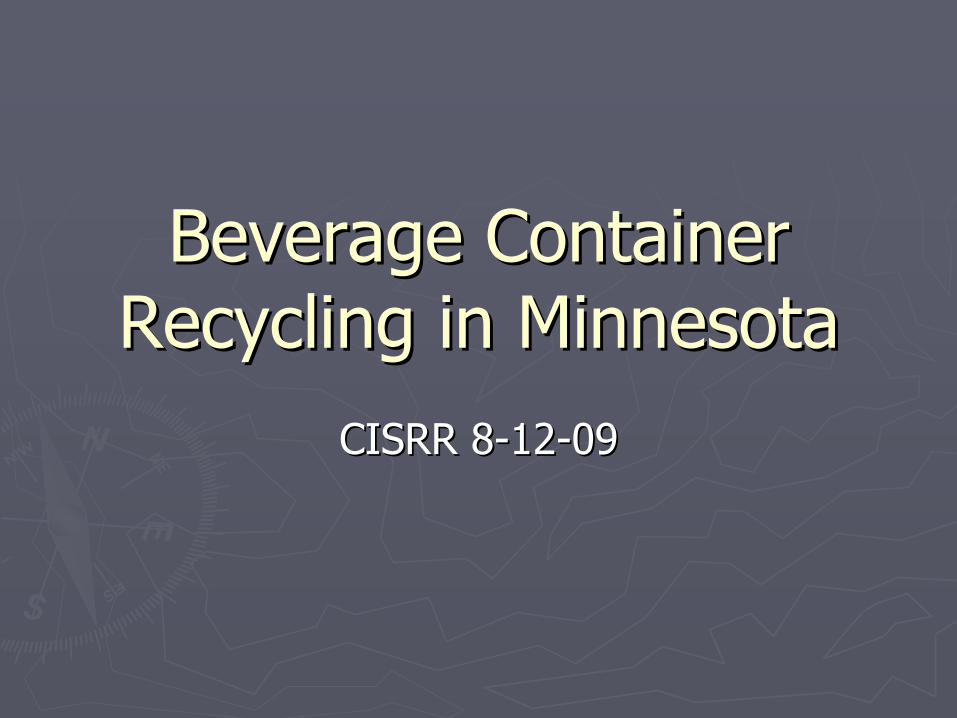
Beverage Container Beverage Container Recycling in MinnesotaRecycling in Minnesota
CISRR 8CISRR 8--1212--0909

Beverage Container Product Beverage Container Product Stewardship InitiativeStewardship Initiative
►► Process began in response to the 2007 SW Policy Process began in response to the 2007 SW Policy Report recommendation shown below:Report recommendation shown below:
►► “If progress is not satisfactory toward the 80 “If progress is not satisfactory toward the 80 percent goal, the MPCA will recommend stronger percent goal, the MPCA will recommend stronger action be taken, and consider these options: action be taken, and consider these options:
A producer responsibility program for the collection and A producer responsibility program for the collection and recycling of beverage containers. Such a program would recycling of beverage containers. Such a program would place the financial and programmatic responsibility on place the financial and programmatic responsibility on beverage producers to attain the 80 percent recycling beverage producers to attain the 80 percent recycling rate.rate.A traditional container deposit program.A traditional container deposit program.A disposal ban on beverage containers that bears in A disposal ban on beverage containers that bears in mind the need for enforceability and fairness.”mind the need for enforceability and fairness.”

Beverage Container Product Beverage Container Product Stewardship Initiative Cont.Stewardship Initiative Cont.
►►Held 4 stakeholder meetings between Held 4 stakeholder meetings between September 2008 and January 2009.September 2008 and January 2009.
►►Stakeholders were responsible for Stakeholders were responsible for developing strategies that could achieve an developing strategies that could achieve an 80% recycling rate of beverage containers.80% recycling rate of beverage containers.
►►Container deposit was not addressed.Container deposit was not addressed.►►Complete report is available here: Complete report is available here:
http://www.pca.state.mn.us/oea/publications/whttp://www.pca.state.mn.us/oea/publications/w--ps1ps1--02.pdf02.pdf

Data SourcesData Sources
► (SCORE) –
The Governor’s Select Committee on Recycling and Environment
► (MRF) Material Recovery Facilities► (CRI) The Container Recycling Institute► Statewide Waste Composition Studies► Curbside Recycling Rate Studies (Capture Rate)► City Recycling Data►Waste-To-Energy Facility Waste Sorts► Sales Data from the MN Beverage Association► Liquor Tax Data
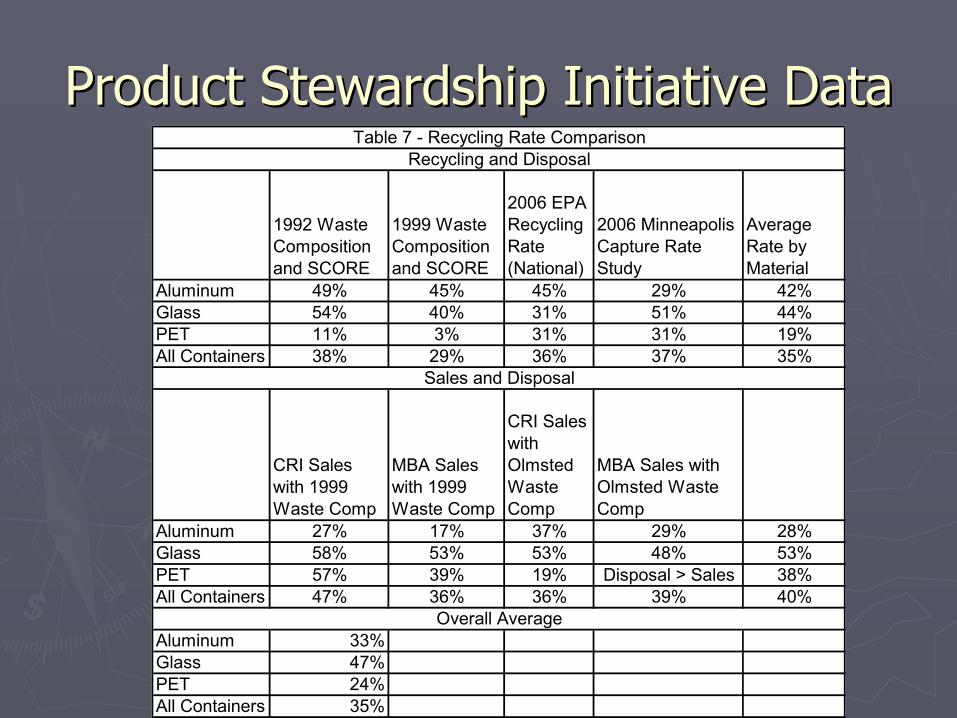
Product Stewardship Initiative DataProduct Stewardship Initiative Data
1992 Waste Composition and SCORE
1999 Waste Composition and SCORE
2006 EPA Recycling Rate (National)
2006 Minneapolis Capture Rate Study
Average Rate by Material
Aluminum 49% 45% 45% 29% 42%Glass 54% 40% 31% 51% 44%PET 11% 3% 31% 31% 19%All Containers 38% 29% 36% 37% 35%
CRI Sales with 1999 Waste Comp
MBA Sales with 1999 Waste Comp
CRI Sales with Olmsted Waste Comp
MBA Sales with Olmsted Waste Comp
Aluminum 27% 17% 37% 29% 28%Glass 58% 53% 53% 48% 53%PET 57% 39% 19% Disposal > Sales 38%All Containers 47% 36% 36% 39% 40%
Aluminum 33%Glass 47%PET 24%All Containers 35%
Overall Average
Sales and Disposal
Recycling and DisposalTable 7 - Recycling Rate Comparison

SCORESCORE
►►MN recycling rate for all materials has MN recycling rate for all materials has remained between 40% and 45% since remained between 40% and 45% since 1999. 1999.
►►SCORE data is not beverage container SCORE data is not beverage container specific, but trends and progress can be specific, but trends and progress can be shown. Dates back to 1993shown. Dates back to 1993

Capture Rate StudyCapture Rate Study
•Minneapolis completed a capture rate study in 2005. Curbside data with 870 random homes selected in 69 of the 81 neighborhoods of Minneapolis.•May and October samples collected from the same addresses with door to door education in between.•The recycling rates for major recyclables: metal cans(29.32%); plastic bottles (30.59%); glass (51.45%)•The total recycling rate for all recyclables was 44.47%•Best data source we have for accurate recycling rates, recommended by Kevin Dietly
from Northbridge Consulting.
•Overall recycling rate for recyclables fits within the 40% to 45% range of SCORE for the past 10 years.

Capture Rate Cont.Capture Rate Cont.
Total Recycling Recovery Rate by Material MAY and OCTOBER
0%10%20%30%40%50%60%70%80%90%
100%
Mix Pap
er
Cans
Glas
s
Plas
tic
Newsp
aper
Magaz
ines
Phon
eboo
k
Cardb
oard
Material
%
May
October

City of Minneapolis Tonnage DataCity of Minneapolis Tonnage Data
►►The city of Minneapolis has recycling The city of Minneapolis has recycling tonnages dating back to 1993. Since 1993:tonnages dating back to 1993. Since 1993:
Minneapolis has recycled less glass by 800 tons Minneapolis has recycled less glass by 800 tons Minneapolis has recycled less aluminum by 130 Minneapolis has recycled less aluminum by 130 tonstonsMinneapolis has recycled more plastic by 1,400 Minneapolis has recycled more plastic by 1,400 tonstons

Minneapolis Tonnages Cont.Minneapolis Tonnages Cont.
Minneapolis Container Recycling
0.00
1,000.00
2,000.00
3,000.00
4,000.00
5,000.00
6,000.00
7,000.00
1993 1994 1995 1996 1997 1998 1999 2000 2001 2002 2003 2004 2005 2006 2007
Year
Tons
Aluminum Cans Glass Plastic

Waste Composition StudyWaste Composition Study
►►
Minnesota’s most recent Minnesota’s most recent waste composition study waste composition study was completed in 1999. was completed in 1999. Previous was 1992.Previous was 1992.
►►
Beverage containers are Beverage containers are well detailed in this study.well detailed in this study.
►►
All #s are postAll #s are post--diversiondiversion►►
128,160 tons of containers 128,160 tons of containers disposed based on 3.56 disposed based on 3.56 million tons of waste million tons of waste disposed.disposed.
Table: 1999 Waste Composition Table: 1999 Waste Composition Study Study Statewide Aggregate Composition Statewide Aggregate Composition
Material CategoriesMaterial Categories % Composition % Composition
PET Bottles/Jars PET Bottles/Jars --
Clear Clear 0.4% 0.4%
PET Bottles/Jars PET Bottles/Jars --
ColoredColored 0.2%0.2%
HDPE Bottles HDPE Bottles ––
NaturalNatural 0.3%0.3%
Aluminum Beverage Aluminum Beverage ContainersContainers
0.7%0.7%
Clear Glass ContainersClear Glass Containers 1.3%1.3%
Green Glass ContainersGreen Glass Containers 0.3%0.3%
Brown Glass ContainersBrown Glass Containers 0.4%0.4%
TotalTotal 3.6%3.6%
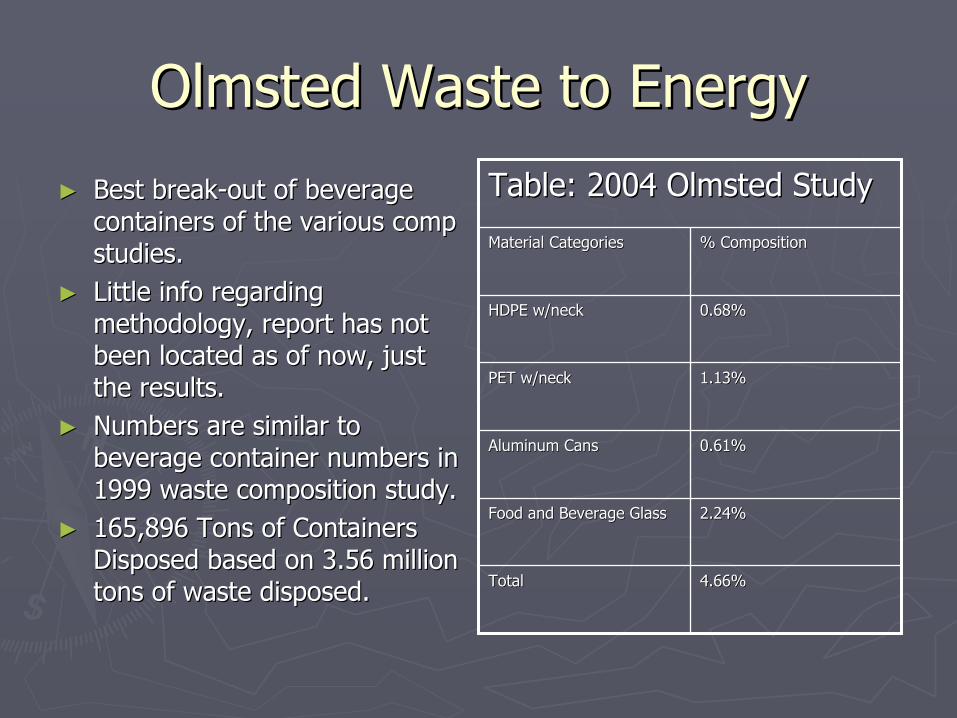
Olmsted Waste to EnergyOlmsted Waste to EnergyTable: 2004 Olmsted StudyTable: 2004 Olmsted Study
Material CategoriesMaterial Categories % Composition% Composition
HDPE w/neckHDPE w/neck 0.68%0.68%
PET w/neckPET w/neck 1.13%1.13%
Aluminum CansAluminum Cans 0.61%0.61%
Food and Beverage GlassFood and Beverage Glass 2.24%2.24%
TotalTotal 4.66%4.66%
►►
Best breakBest break--out of beverage out of beverage containers of the various comp containers of the various comp studies.studies.
►►
Little info regarding Little info regarding methodology, report has not methodology, report has not been located as of now, just been located as of now, just the results.the results.
►►
Numbers are similar to Numbers are similar to beverage container numbers in beverage container numbers in 1999 waste composition study.1999 waste composition study.
►►
165,896 Tons of Containers 165,896 Tons of Containers Disposed based on 3.56 million Disposed based on 3.56 million tons of waste disposed.tons of waste disposed.

HERC Waste To Energy SortHERC Waste To Energy Sort
►► Waste sort from the Waste sort from the tipping floor of HERCtipping floor of HERC
►► Similar to 1999 waste Similar to 1999 waste comp study, but fewer comp study, but fewer categoriescategories
►► Beverage containers Beverage containers are not specifically are not specifically called outcalled out
Table: 2007 HERC StudyTable: 2007 HERC Study
Material CategoriesMaterial Categories % Composition% Composition
Plastic Plastic ––
HDPEHDPE 4.2%4.2%
Plastic Plastic ––
PETPET 3.2%3.2%
NonNon--Ferrous Metals Ferrous Metals ––
AluminumAluminum1.7%1.7%
GlassGlass 4.4%4.4%
TotalTotal 13.5%13.5%
CRI CRI ––
BMDABMDA
►► CRI has an abundance of state level data that is CRI has an abundance of state level data that is extrapolated from national sources.extrapolated from national sources.
►► Sales data is the most beneficial for the Sales data is the most beneficial for the workgroups purposes, but CRI also details workgroups purposes, but CRI also details estimated recovery from container deposits and estimated recovery from container deposits and estimated revenue from unredeemed deposits estimated revenue from unredeemed deposits under 5 and 10 cent scenarios.under 5 and 10 cent scenarios.
►► According to CRI, Minnesota sold 4.52 Billion units. According to CRI, Minnesota sold 4.52 Billion units. ►► More inclusive than Beverage Association Sales More inclusive than Beverage Association Sales
figures because MBA numbers only include figures because MBA numbers only include carbonated alcohol and noncarbonated alcohol and non--alcoholic beverages.alcoholic beverages.
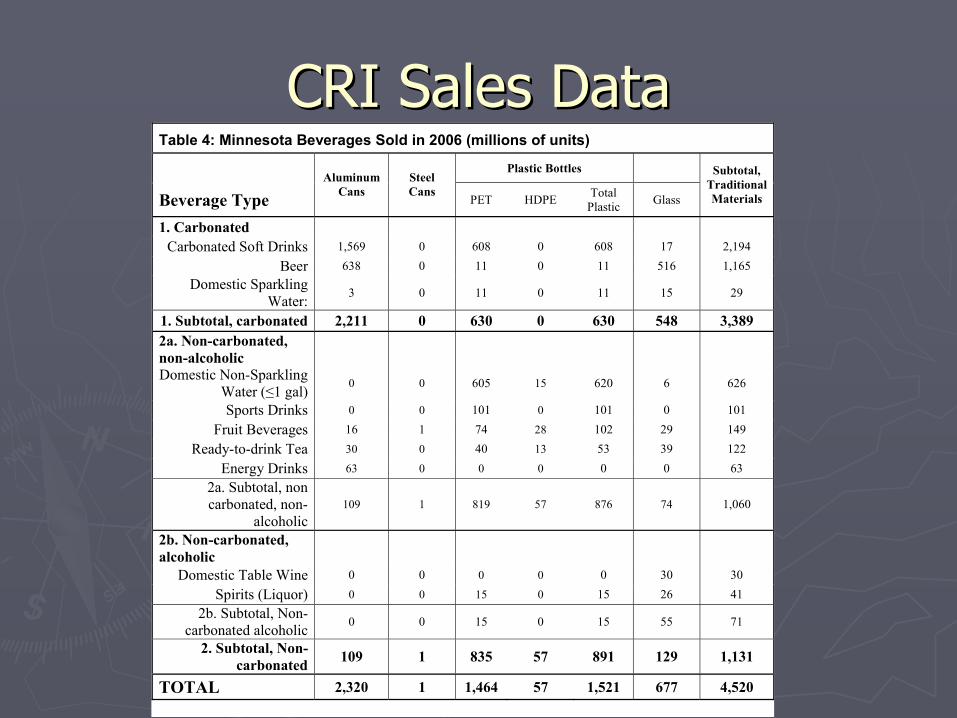
CRI Sales DataCRI Sales DataTable 4: Minnesota Beverages Sold in 2006 (millions of units)
Plastic Bottles
Beverage Type Aluminum
Cans Steel Cans
PET HDPE Total Plastic Glass
Subtotal, Traditional Materials
1. Carbonated Carbonated Soft Drinks 1,569 0 608 0 608 17 2,194
Beer 638 0 11 0 11 516 1,165 Domestic Sparkling
Water: 3 0 11 0 11 15 29
1. Subtotal, carbonated 2,211 0 630 0 630 548 3,389 2a. Non-carbonated, non-alcoholic
Domestic Non-Sparkling
Water (≤1 gal) 0 0 605 15 620 6 626
Sports Drinks 0 0 101 0 101 0 101
Fruit Beverages 16 1 74 28 102 29 149
Ready-to-drink Tea 30 0 40 13 53 39 122
Energy Drinks 63 0 0 0 0 0 63 2a. Subtotal, non carbonated, non-
alcoholic109 1 819 57 876 74 1,060
2b. Non-carbonated, alcoholic
Domestic Table Wine 0 0 0 0 0 30 30
Spirits (Liquor) 0 0 15 0 15 26 41 2b. Subtotal, Non-
carbonated alcoholic 0 0 15 0 15 55 71
2. Subtotal, Non-carbonated 109 1 835 57 891 129 1,131
TOTAL 2,320 1 1,464 57 1,521 677 4,520

Beverage Association DataBeverage Association Data
Exhibit A-2: Beverage Containers in Minnesota - Tons Generated/Sold
MBA/Northbridge Estimates 2007/8
State Estimates 2006 (All Containers, Not Only
Beverages)
Carbonated Beverages*
Other Beverages** Total Beverage
Total - All Types** Midpoint Low High
Aluminum 28,400 1,700 30,100 30,100 62,966 53,836 72,096
PET 12,000 23,300 35,300 41,800 35,813 27,256 44,369
Glass 95,100 57,900 153,000 186,600 175,142 143,966 206,318
Total 135,500 82,900 218,400 258,500 273,921 225,058 322,783
*MN survey of CSDs; state-specific beer data from Beer Institute
** Aluminum NCB share from CMI and Beverage Marketing 2007 totals; Glass from Beverage Marketing data on other glass beverage containers, Northbridge data on container weights, EPA on total containers; PET from CCI data on PET usage in 2007
•Sales data generated from Beverage Marketing Data. •Only measured carbonated alcohol and non-alcoholic beverages. •Does not include non-carbonated, that number is estimated•Sticking point on the aluminum discrepancy with our estimate for
recycled aluminum in MN•SCORE includes all aluminum including scrap aluminum, not just beverage containers•Their sales estimates are lower than CRI for all three categories
Exhibit A-1: Carbonated Beverage Container Packaging Sold in Minnesota Containers % Tons %
Aluminum 1,928,000,000 70.8% 28,400 21.0%
PET 356,000,000 13.1% 12,000 8.8%
Glass 438,000,000 16.1% 95,100 70.2%
Total 2,722,000,000 100.0% 135,500 100.0%
Sources: Northbridge survey of Minnesota Beverage Association members 4Q 2007 through 3Q 2008; Beer Institute data from Brewers Almanac for 2007

Liquor Tax DataLiquor Tax Data
►►
Tracks the sales of alcoholic beverages in MN.Tracks the sales of alcoholic beverages in MN.►►
Data reported as gallons soldData reported as gallons sold►►
Can be converted to units and tonsCan be converted to units and tons►►
Sales are not increasing at a rapid rate since 2003.Sales are not increasing at a rapid rate since 2003.

State of MN CalculationsState of MN Calculations
Notes: ; 24.5%* - estimate applied annual average growth rate=-3.81% between 1992 and 1999 of MN containers recycle rate. ; 24.2%** - CRI (Container Recycling Institute) estimation is based on non-deposit states average beverage containers recycle rate and regional factor in 2005 CRI Glass recycle rate, 1.5% underestimates MN Glass recycle rate. When US Glass recycle rate 25.2% in 2005 is applied, four material recycle rate is 24.2% : 19.5%*** -When nation-wide plastic recycle rate,19.1% is applied instead of PET recycle rate 0.6%, HDPE recycle rate:0.1%. (It seems that Hennepin Comp study 2007 has measuring and sampling errors in estimating plastic recycle rate)

Conclusion of Product Stewardship Conclusion of Product Stewardship InitiativeInitiative
►► Currently recycling 35% of beverage containers in Currently recycling 35% of beverage containers in MN.MN.
►► In order to achieve 80% recycling of these In order to achieve 80% recycling of these containers, collection needs to more than double.containers, collection needs to more than double.
►► Many of the strategies require legislative actionMany of the strategies require legislative action►► Due to the complexity and cost of the strategies Due to the complexity and cost of the strategies
developed, along with substantial stakeholder developed, along with substantial stakeholder commitment, the State is unlikely to achieve the commitment, the State is unlikely to achieve the 80% goal by 2012.80% goal by 2012.
Container Deposit ResearchContainer Deposit Research
►►Members of the solid waste stakeholder Members of the solid waste stakeholder process were interested in knowing what process were interested in knowing what increases could be expected by increases could be expected by implementing a container deposit in implementing a container deposit in Minnesota. Minnesota.
►►This is factThis is fact--sharing of public data, not an sharing of public data, not an Agency endorsement of Container Deposit Agency endorsement of Container Deposit Legislation.Legislation.
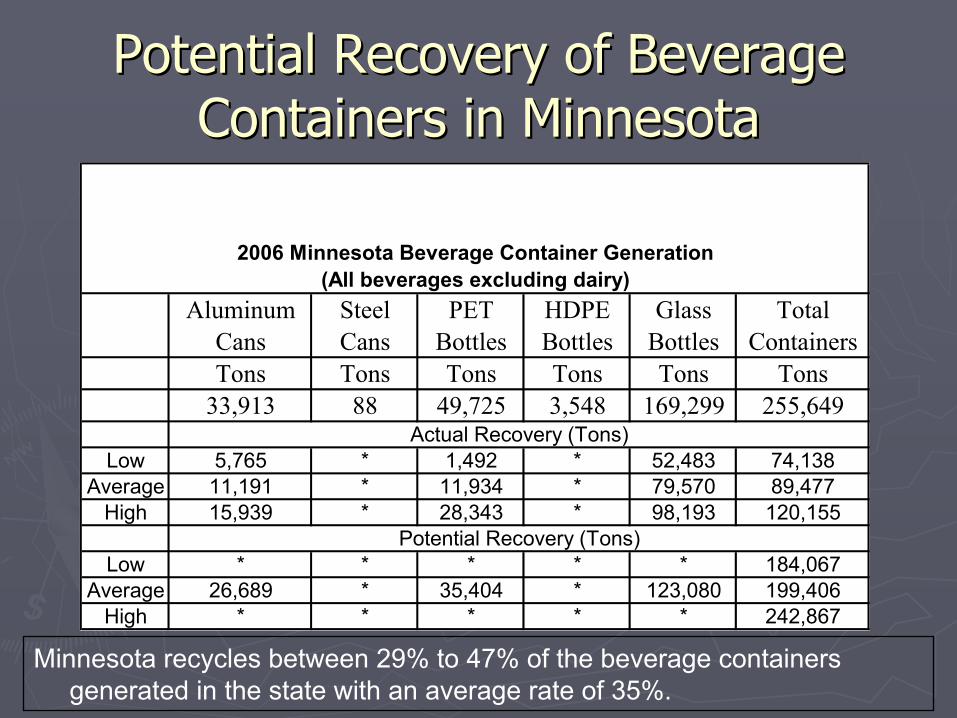
Potential Recovery of Beverage Potential Recovery of Beverage Containers in MinnesotaContainers in Minnesota
Aluminum Cans
Steel Cans
PET Bottles
HDPE Bottles
Glass Bottles
Total Containers
Tons Tons Tons Tons Tons Tons33,913 88 49,725 3,548 169,299 255,649
Low 5,765 * 1,492 * 52,483 74,138Average 11,191 * 11,934 * 79,570 89,477
High 15,939 * 28,343 * 98,193 120,155
Low * * * * * 184,067Average 26,689 * 35,404 * 123,080 199,406
High * * * * * 242,867
Actual Recovery (Tons)
2006 Minnesota Beverage Container Generation (All beverages excluding dairy)
Potential Recovery (Tons)
Minnesota recycles between 29% to 47% of the beverage containers
generated in the state with an average rate of 35%.

Average Recovery Rates for the 11 Average Recovery Rates for the 11 Deposit StatesDeposit States
Aluminum cans
PET plastic bottles Glass bottles Total
Carbonated 78.70% 71.20% 72.70% 76.10%
Low (MA) * * * 72.00%Average * * * 78.00%High (MI) * * * 95.00%
2006 Recovery Rates for the 11 Deposit States (CRI)
1999 RW Beck Deposit State Recovery Rates
In 1999, traditional deposit systems had an average redemption rate of 78 percent (varying from a high of 95 percent in Michigan to a low of 72 percent in Massachusetts), and targeted on average 79percent of all container types2, for an overall recovery rate of 61.6 percent (422 containers per capita)

Sales Per CapitaSales Per Capita
►►The national average is 721 units sold per The national average is 721 units sold per person per year.person per year.
►►The deposit state average is 717 units sold The deposit state average is 717 units sold per person per year.per person per year.
►►Is this difference statistically significant?Is this difference statistically significant?

CaliforniaCaliforniaName California Beverage Container Recycling and Litter Reduction Act (AB
2020)Purpose To encourage recycling and reduce litterEnacted 9/29/1986Implemented 9/1/1987
Beverages Covered beer, malt, wine & distilled spirits coolers, all non-alcoholic beverages, except milk
Containers Covered Aluminum. glass, plastic and bi-metal. Exempts refillablesAmount of Deposit (10¢: 24oz. and greater) and (5¢: under 24oz.)Redemption Rate Overall 74%; Aluminum 84%; Glass 76%; PET 62%; HDPE 91% in 2008Reclamation System
State certified redemption centers, registered curbside operations, dropoffs
Unredeemed Deposits
Property of state: used for program administration and grants to non-profits
Handling Fee
Beverage manufacturers pay Processing Fees to offset recyclers costs when the cost of recycling exceeds the value of material. Processing Payments (variable rate) paid by state to redemption centers to help cover their costs. (b)
2007 stats http://www.cawrecycles.org/files/recycling%20levels%20factsheet%20050708_0.docSales per Capita 649 Units
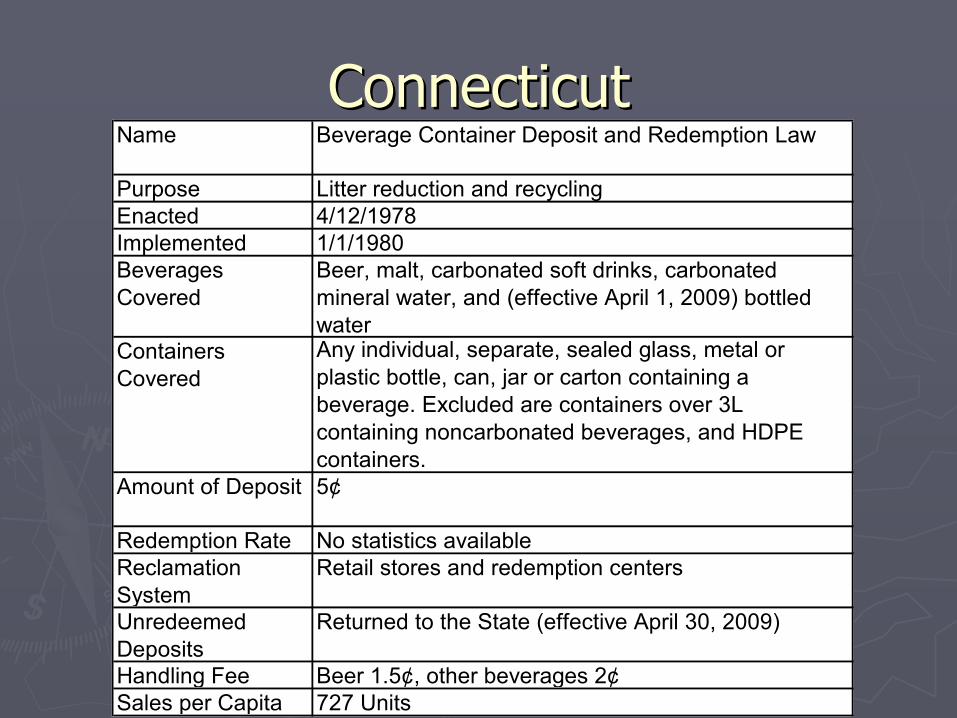
ConnecticutConnecticutName Beverage Container Deposit and Redemption Law
Purpose Litter reduction and recyclingEnacted 4/12/1978Implemented 1/1/1980Beverages Covered
Beer, malt, carbonated soft drinks, carbonated mineral water, and (effective April 1, 2009) bottled water
Containers Covered
Any individual, separate, sealed glass, metal or plastic bottle, can, jar or carton containing a beverage. Excluded are containers over 3L containing noncarbonated beverages, and HDPE containers.
Amount of Deposit 5¢
Redemption Rate No statistics availableReclamation System
Retail stores and redemption centers
Unredeemed Deposits
Returned to the State (effective April 30, 2009)
Handling Fee Beer 1.5¢, other beverages 2¢Sales per Capita 727 Units
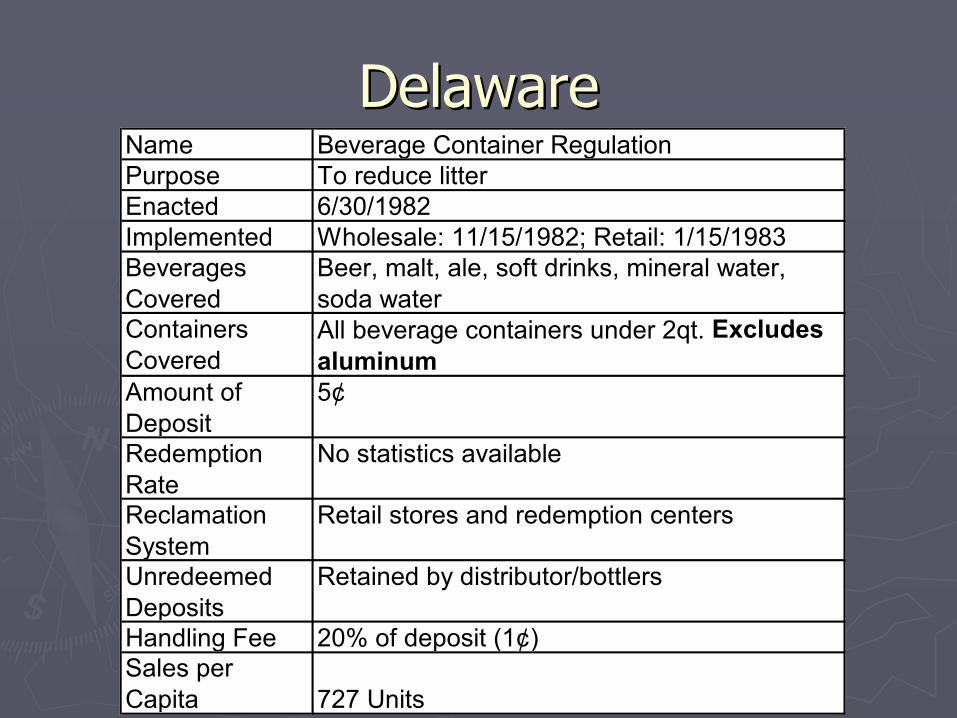
DelawareDelawareName Beverage Container RegulationPurpose To reduce litterEnacted 6/30/1982Implemented Wholesale: 11/15/1982; Retail: 1/15/1983Beverages Covered
Beer, malt, ale, soft drinks, mineral water, soda water
Containers Covered
All beverage containers under 2qt. Excludes aluminum
Amount of Deposit
5¢
Redemption Rate
No statistics available
Reclamation System
Retail stores and redemption centers
Unredeemed Deposits
Retained by distributor/bottlers
Handling Fee 20% of deposit (1¢)Sales per Capita 727 Units

HawaiiHawaiiName Solid Waste Management; Deposit Beverage Container Law (Act 176)
Purpose To increase participation and recycling rates for specified deposit beverage containers, provide a connection between manufacturing decisions and recycling program management, and reduce litter.
Enacted 6/25/2002Implemented 1/1/2005Beverages Covered Beer, mixed spirits, mixed wine, coffee & teas, carbonated soft drinks,
water. Excludes dairy, wine, and liquorContainers Covered Metal, glass, PET, or HDPE container containing sixty-four fluid
ounces or lessAmount of Deposit 5¢Redemption Rate 72% overall, 75% Alluminum, 71% Glass, 69% Plastic in FY08Reclamation System State certified redemption centers (RC), see note (c)Unredeemed Deposits Property of state: used for program administrationHandling Fee 1-1.5¢ non-refundable container fee (added to price of beverage) paid
to the state. See note (d)
FY08 Report to Legislature http://hawaii.gov/health/environmental/waste/sw/hi5/support/2009ReportToLeg.pdf
Sales per Capita 649 Units
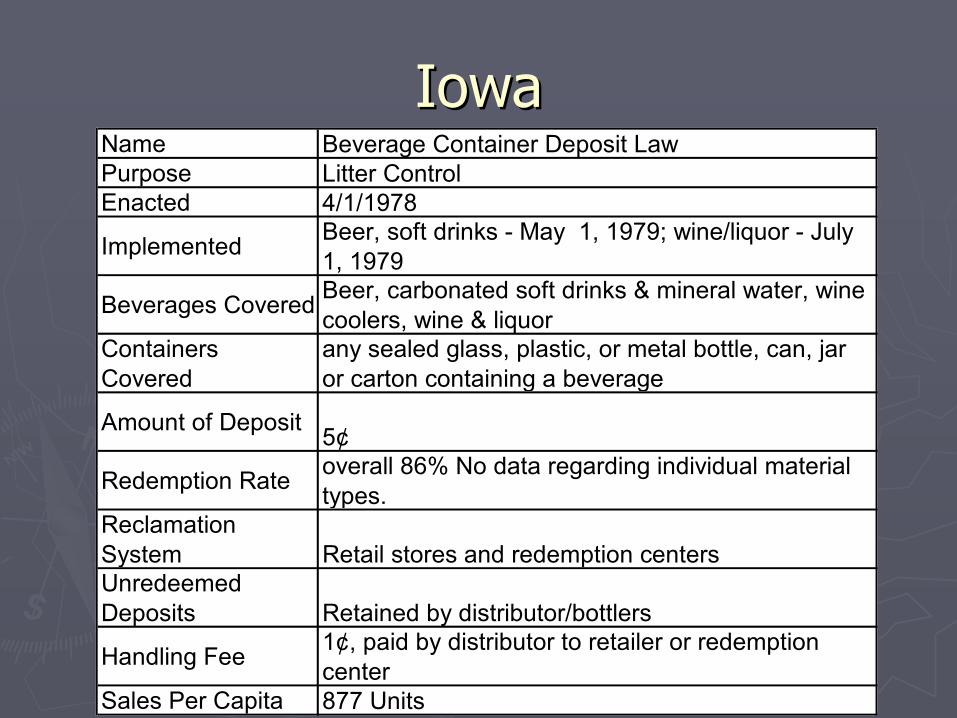
IowaIowaName Beverage Container Deposit LawPurpose Litter ControlEnacted 4/1/1978
Implemented Beer, soft drinks - May 1, 1979; wine/liquor - July 1, 1979
Beverages Covered Beer, carbonated soft drinks & mineral water, wine coolers, wine & liquor
Containers Covered
any sealed glass, plastic, or metal bottle, can, jar or carton containing a beverage
Amount of Deposit 5¢
Redemption Rate overall 86% No data regarding individual material types.
Reclamation System Retail stores and redemption centersUnredeemed Deposits Retained by distributor/bottlers
Handling Fee 1¢, paid by distributor to retailer or redemption center
Sales Per Capita 877 Units

MaineMaineName Maine Returnable Beverage Container LawPurpose Reduce litter and solid waste generation,
create incentives for recycling and reuseEnacted 11/2/1976Implemented 6/1/1978Beverages Covered All beverages except dairy products and
unprocessed ciderContainers Covered all sealed containers made of glass, metal or
plastic, containing 4 liters or less, excluding aseptics
Amount of Deposit Wine/liquor: 15¢ All others: 5¢Redemption Rate A survey by the Maine Department of
Agriculture contains some redemption and sales information, but was unable to find any "reliable conclusions" due to lack of participation
Reclamation System Retail stores and redemption centers; Dealers may refuse containers if they have an agreement with a nearby redemption center
Unredeemed Deposits Property of state (more information)Handling Fee 3.5¢ (3¢ if qualified commingling agreement)
(viii)Sales per Capita 727 Units

MassachusettsMassachusettsName Beverage Container Recovery LawPurpose To provide an economic incentive for consumers
to return used beverage containers and encourage conservation of materials and energy through recycling and reuse
Enacted Legislative override of governor's veto, 6/4/81Implemented 1/1/1983Beverages Covered
Beer, malt, carbonated soft drinks, & mineral water
Containers Covered
Any sealable bottle, can, jar, or carton of glass, metal, plastic, or combo. Excludes biodegradables.
Amount of Deposit
5¢
Redemption Rate Overall 66% not including containers recovered in the curbside program. No material specific estimates are available.
Reclamation System
Retail stores and redemption centers
Unredeemed Deposits
Property of state general fund (more information)
Handling Fee 2.25¢Sales per Capita 727 Units

MichiganMichiganName Michigan Beverage Container ActPurpose To reduce roadside litter, clean up
the environment, and conserve energy and natural resources
Enacted 11/2/1976Implemented 12/3/1978Beverages Covered Beer, soft drinks, carbonated &
mineral water, wine coolers, canned cocktails
Containers Covered Any airtight metal, glass, paper, or plastic container, or a combination, under 1 gallon
Amount of Deposit 10¢Redemption Rate overall 96.08% in 2006 Material type
data not collected.Reclamation System Retail storesUnredeemed Deposits 75% to state for envt'l programs,
25% to retailers (more information)Handling Fee NoneSales per Capita 699 Units
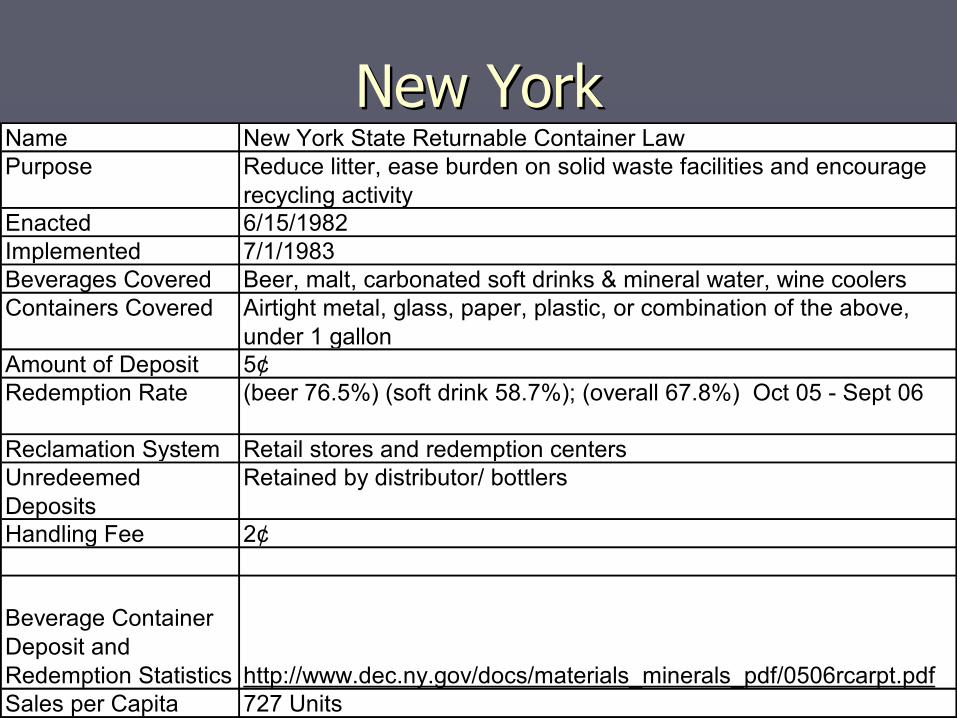
New YorkNew YorkName New York State Returnable Container LawPurpose Reduce litter, ease burden on solid waste facilities and encourage
recycling activityEnacted 6/15/1982Implemented 7/1/1983Beverages Covered Beer, malt, carbonated soft drinks & mineral water, wine coolersContainers Covered Airtight metal, glass, paper, plastic, or combination of the above,
under 1 gallonAmount of Deposit 5¢Redemption Rate (beer 76.5%) (soft drink 58.7%); (overall 67.8%) Oct 05 - Sept 06
Reclamation System Retail stores and redemption centersUnredeemed Deposits
Retained by distributor/ bottlers
Handling Fee 2¢
Beverage Container Deposit and Redemption Statistics http://www.dec.ny.gov/docs/materials_minerals_pdf/0506rcarpt.pdfSales per Capita 727 Units
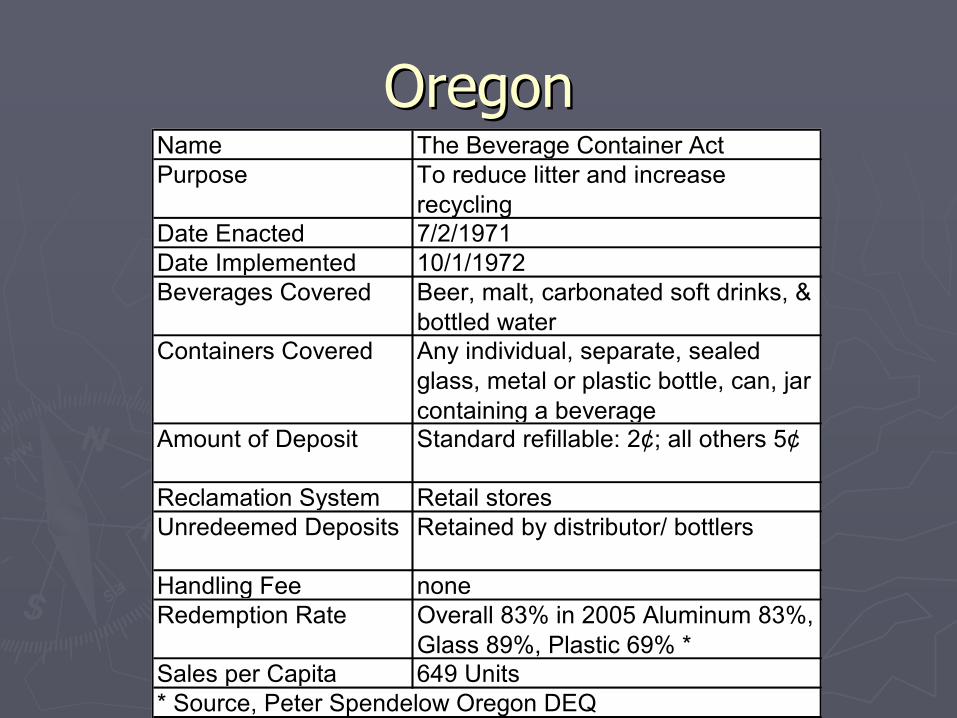
OregonOregonName The Beverage Container ActPurpose To reduce litter and increase
recyclingDate Enacted 7/2/1971Date Implemented 10/1/1972Beverages Covered Beer, malt, carbonated soft drinks, &
bottled waterContainers Covered Any individual, separate, sealed
glass, metal or plastic bottle, can, jar containing a beverage
Amount of Deposit Standard refillable: 2¢; all others 5¢
Reclamation System Retail storesUnredeemed Deposits Retained by distributor/ bottlers
Handling Fee noneRedemption Rate Overall 83% in 2005 Aluminum 83%,
Glass 89%, Plastic 69% *Sales per Capita 649 Units* Source, Peter Spendelow Oregon DEQ

VermontVermontName Beverage Container LawPurpose Reduce litter, increase recycling,
reduce waste disposal costs, create local jobs and save energy
Enacted 4/7/1972Implemented 7/1/1973Beverages Covered Beer, malt, carbonated soft drinks,
mixed wine drinks; liquorContainers Covered Any bottle, can, jar or carton
composed of glass, metal, paper, plastic or any combination (Biodegradables excluded)
Amount of Deposit liquor: 15¢ All others: 5¢Redemption Rate overall 90-95% (vii)Reclamation System Retail stores and redemption
centers, If retailer is located conveniently near a licensed center and thereby gains state approval, retailer may refuse containers
Unredeemed Deposits Retained by distributor/bottlers
Handling Fee 3.5¢Sales per Capita 727 Units