Embed Size (px)
Citation preview
Inflation Dynamics and Monetary Policy Transmission in Vietnam and Emerging Asia
Rina Bhattacharya
WP/13/155
© 2013 International Monetary Fund WP/13/155
IMF Working Paper
Monetary and Capital Markets Department
Inflation Dynamics and Monetary Policy Transmission in Vietnam and Emerging Asia
Prepared by Rina Bhattacharya 1
Authorized for distribution by Cheng Hoon Lim
July 2013
Abstract
This paper provides an overview of inflation developments in Vietnam in the years followingthe doi moi reforms, and uses empirical analysis to answer two key questions: (i) what are the key drivers of inflation in Vietnam, and what role does monetary policy play? and (ii) why has inflation in Vietnam been persistently higher than in most other emerging marketeconomies in the region? It focuses on understanding the monetary policy transmission mechanism in Vietnam, and in understanding the extent to which monetary policy canexplain why inflation in Vietnam has been higher than in other Asian emerging markets overthe past decade.
JEL Classification Numbers: E31; E41; E52
Keywords: Vietnam; inflation; monetary policy effectiveness; emerging Asian economies
Author’s E-Mail Address: [email protected]
1The author would like to thank Ashvin Ahuja, Kelly Eckhold, Sanjay Kalra, Heedon Kang, Tho Nguyen, Sam Ouliaris, Masahiko Takeda, and Chris Towe for very helpful comments and suggestions. All errors and omissions are the sole responsibility of the author.
This Working Paper should not be reported as representing the views of the IMF. The views expressed in this Working Paper are those of the author(s) and do not necessarily represent those of the IMF or IMF policy. Working Papers describe research in progress by the author(s) and are published to elicit comments and to further debate.
2
Contents Page
Abstract ......................................................................................................................................1
I. Introduction ............................................................................................................................3
II. Inflation Developments .........................................................................................................4
III. Literature Review .................................................................................................................5
IV. The Model ............................................................................................................................7
V. Data and Econometric Estimation.........................................................................................8 A. What are the Key Drivers of Inflation in Vietnam? ................................................10 B. What Explains Vietnam’s Relatively High Inflation Compared to Other Emerging Market Economies in the Region? ...............................................................................14
VI. Policy Implications and Conclusions .................................................................................17
References ................................................................................................................................20 Tables 1. Unit Root Tests ......................................................................................................................9 2. Elasticities of Headline Inflation to Shocks in Endogenous Variables ................................12 3. Endogenous Variable Response Elasticities to Shocks in Nominal Interest Rate ...............13 4. Sources of Inflation in Vietnam and Selected Asian Countries 1/ .......................................16 Figures 1. Emerging Asia: Headline Inflation, 2000-2012 .....................................................................3 2. Vietnam: CPI Inflation, 1999-2012 .......................................................................................5 3. Vietnam: CPI Inflation, the Nominal Interest Rate, and Growth in Credit to the Economy .9 4. Impulse Response of Inflation from VAR Estimation .........................................................12 5. Accumulated Response to One Standard Deviation Interest Rate Shock ............................13 6. Persistence of a One-Time Increase in Inflation ..................................................................17 Appendixes Data Appendix .........................................................................................................................19
3
I. INTRODUCTION
Vietnam has been in transition from a centrally-planned to a ‘socialist oriented market economy’ since the introduction of the doi moi economic reforms in 1986. In the early-to-mid 1990s, liberalization measures resulted in rapidly expanding exports and high economic growth, with real GDP growth averaging 9 percent per year. Growth slowed in the late 1990s but the momentum picked up again, with real GDP growth rising more-or-less steadily and reaching a high of 8.5 percent in 2007. Since then, growth has slowed down, reaching 5.0 percent in 2012, largely as a result of tighter monetary and fiscal policies and spillovers from the global economic crisis. At the same time inflation fell sharply through the course of 2012, with CPI inflation falling from 18.1 percent at end-2011 to 6.8 percent at end-2012, and core inflation falling from 14.3 percent to 9.6 percent over the same period.
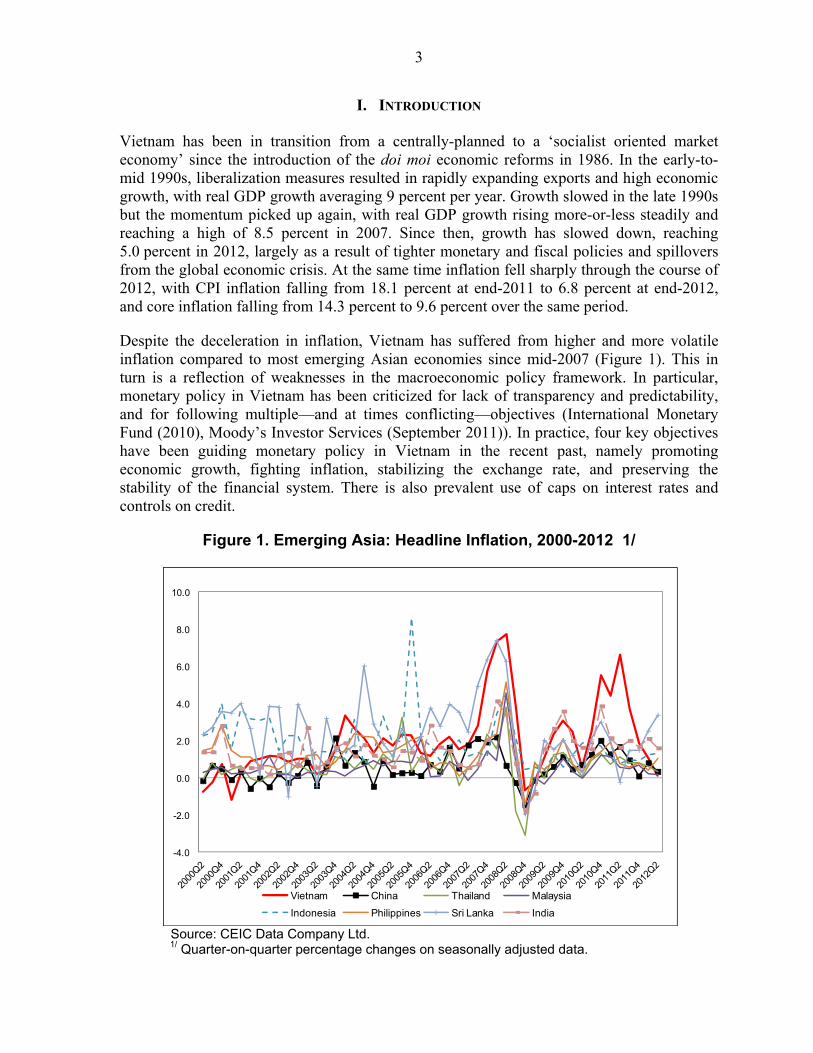
Despite the deceleration in inflation, Vietnam has suffered from higher and more volatile inflation compared to most emerging Asian economies since mid-2007 (Figure 1). This in turn is a reflection of weaknesses in the macroeconomic policy framework. In particular, monetary policy in Vietnam has been criticized for lack of transparency and predictability, and for following multiple—and at times conflicting—objectives (International Monetary Fund (2010), Moody’s Investor Services (September 2011)). In practice, four key objectives have been guiding monetary policy in Vietnam in the recent past, namely promoting economic growth, fighting inflation, stabilizing the exchange rate, and preserving the stability of the financial system. There is also prevalent use of caps on interest rates and controls on credit.
Figure 1. Emerging Asia: Headline Inflation, 2000-2012 1/
Source: CEIC Data Company Ltd.
1/ Quarter-on-quarter percentage changes on seasonally adjusted data.
-4.0
-2.0
0.0
2.0
4.0
6.0
8.0
10.0
Vietnam China Thailand Malaysia
Indonesia Philippines Sri Lanka India
4
Although the monetary policy framework in Vietnam has been criticized by various (internal and external) observers, empirical work to see how the monetary policy transmission mechanism operates in practice and affects inflation has been relatively limited to date. Moreover, it has at times provided conflicting results and policy conclusions. This paper aims to make a contribution in this area.
Section II provides an overview of inflation developments in Vietnam in the years following the doi moi reforms. This is followed by a brief review of the existing empirical literature on inflation in Vietnam in Section III. Section IV presents a very simple theoretical model of inflation, and Section V presents and discusses the empirical results obtained from an econometric analysis of the data. The empirical analysis seeks to answer two key questions: (i) what are the key drivers of inflation in Vietnam, and what role does monetary policy play? and (ii) why has inflation in Vietnam been persistently higher than in most other emerging market economies in the region? The final section presents the conclusions and discusses the policy implications of the empirical analysis presented in this paper.
II. INFLATION DEVELOPMENTS
Vietnam experienced a bout of hyperinflation in the second half of the 1980s and early 1990s, but a major stabilization effort brought inflation under control. Tight monetary and fiscal policy played a key role in bringing inflation down from annual rates exceeding 300 percent in 1986-88 to below 20 percent in 1992 and to close to 10 percent in 1995 (Camen, 2006). Stabilization efforts led to a strong growth performance in the early 1990s.
Inflation remained subdued while growth slowed down in the late 1990s and early 2000s. While the Asian crisis was the principal cause of the slowdown in growth in the late 1990s, it was also partly due to the increasingly unsustainable composition of growth in the past which was heavily dependent on capital-intensive investment, mainly by state-owned enterprises in uncompetitive sectors. The economy began to rebound in late 1999—largely due to a revival of domestic investment—but it was growing at a slower rate than in the early 1990s. Vietnam experienced two years of mild deflation in 2000 and 2001 owing to excess capacity and depressed commodity prices, and both the headline and core inflation rates remained low in 2002 and 2003 (Maliszewski, 2010).
Inflation rose sharply as growth picked up strongly between 2004 and mid-2008, reflecting sustained increases in international commodity prices and growing excess demand, due in large part to heavy investment by state-owned enterprises and a surge in foreign direct investment in the run-up to Vietnam’s accession to the World Trade Organisation. Headline inflation reached a peak of almost 25 percent in the third quarter of 2008 but then started to decline sharply as a result of weakening domestic demand and lower food and energy prices, falling to 2.4 percent by the third quarter of 2009.
However, headline inflation then started to pick up again towards the end of 2009, reflecting in part the impact of the economic stimulus package introduced in response to the global crisis. A sizeable fiscal policy stimulus amounting to around 5 percent of GDP was executed in 2009, while the base (prime) rate was cut by a total of 700 basis points between October 2008 and February 2009 and kept at 7 percent until November 2009. Meanwhile, liquidity
5
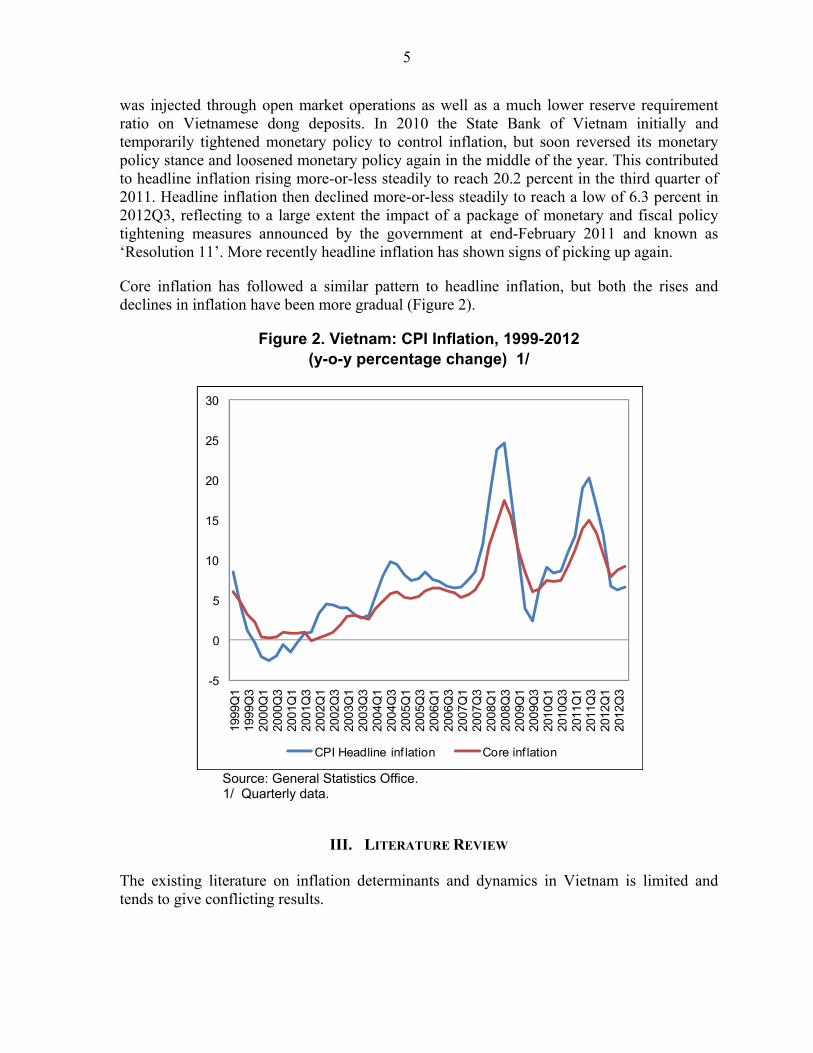
was injected through open market operations as well as a much lower reserve requirement ratio on Vietnamese dong deposits. In 2010 the State Bank of Vietnam initially and temporarily tightened monetary policy to control inflation, but soon reversed its monetary policy stance and loosened monetary policy again in the middle of the year. This contributed to headline inflation rising more-or-less steadily to reach 20.2 percent in the third quarter of 2011. Headline inflation then declined more-or-less steadily to reach a low of 6.3 percent in 2012Q3, reflecting to a large extent the impact of a package of monetary and fiscal policy tightening measures announced by the government at end-February 2011 and known as ‘Resolution 11’. More recently headline inflation has shown signs of picking up again.
Core inflation has followed a similar pattern to headline inflation, but both the rises and declines in inflation have been more gradual (Figure 2).
Figure 2. Vietnam: CPI Inflation, 1999-2012 (y-o-y percentage change) 1/
Source: General Statistics Office.
1/ Quarterly data.
III. LITERATURE REVIEW
The existing literature on inflation determinants and dynamics in Vietnam is limited and tends to give conflicting results.
-5
0
5
10
15
20
25
30
1999
Q1
1999
Q3
2000
Q1
2000
Q3
2001
Q1
2001
Q3
2002
Q1
2002
Q3
2003
Q1
2003
Q3
2004
Q1
2004
Q3
2005
Q1
2005
Q3
2006
Q1
2006
Q3
2007
Q1
2007
Q3
2008
Q1
2008
Q3
2009
Q1
2009
Q3
2010
Q1
2010
Q3
2011
Q1
2011
Q3
2012
Q1
2012
Q3
CPI Headline inf lation Core inf lation
6
Existing empirical studies do not agree on the role that monetary aggregates play in driving inflation in Vietnam, in part because this is likely to have changed over time. Hung and Pfau (2008) find that the M2 measure of money supply Granger-caused real output growth but not inflation over the period 1996–2005. IMF (2003) reports empirical findings that broad money growth can explain only 10 percent of the variation in core inflation over the period 1995–2003, and concludes that the role of monetary aggregates on consumer price inflation is neither robust nor very significant. By contrast, IMF (2006) concludes that growth of M2 money supply significantly affected inflation dynamics in Vietnam, with a twelve month lag, over the period 2001–2006. The differing conclusions of IMF (2003) and IMF (2006) is likely due to the liberalization of domestic prices over the period 2002-2004, which probably increased the responsiveness of domestic prices to monetary aggregates. IMF (2006) also finds that CPI inflation responds positively to a narrowing of the output gap (i.e., as actual GDP increases relative to potential, inflationary pressures begin to emerge). Minh (2009) and Nguyen and Nguyen (2010) both find that growth of M2 money supply has a modest and significant (positive) impact on CPI inflation, but after a significant delay of five months or longer. Camen (2006) finds that growth of M2 money supply explains less than 5 percent of the forecast variance of CPI inflation, but that growth of total credit to the economy explains around 25 percent of the forecast variance after 24 months, in an empirical study covering the period 1996–2005.
Most empirical studies have found no significant impact of the interest rate on inflation. Hung and Pfau (2008) study the role of the real (lending) interest rate and conclude that it had no statistically significant effect on either output growth or CPI inflation over the period 1996–2005. This is consistent with the empirical results reported by Nguyen and Nguyen (2010), who find that the effect of a change in the interest rate is almost immediate but very weak, and soon becomes insignificant. Camen (2006) reports that the interest rate (lending rate) explains less than 5 percent of the forecast variance of CPI inflation over the period 1997–2005.
Turning to the nominal exchange rate, existing empirical results present a wide range of estimates of its impact on inflation. For the period of the 1990s Goujon (2006) argues, on the basis of his empirical analysis, that inflation in Vietnam was induced by exchange rate variations and by an excess of broad money. IMF (2003) concludes that movements in the nominal effective exchange rate explain 10 percent of the variation in core inflation over the period 1995–2003, with a pass-through coefficient of 0.25 in the first year. By contrast, IMF (2006), in an empirical analysis of the period 2001–2006, reports a pass-through coefficient of only 0.03 in the first year for headline CPI inflation. Camen (2006) carries out VAR estimations and finds that fluctuations in the nominal effective exchange rate explain 19 percent of the forecast variance of CPI inflation after twelve months. Minh (2009) reports a pass-through coefficient of 0.08 in the first year, with the impact of exchange rate movements on inflation completely dying away after 15 months. His findings are based on impulse response functions calculated using monthly data covering the period 2001M1-2007M2. Compared to the earlier empirical studies Nguyen and Nguyen (2010) find a larger and more significant role of the exchange rate, and in particular devaluation, in increasing inflationary pressures. They explain this difference by arguing that the earlier studies used data from periods when the exchange rate was mostly kept rigid, whereas their study includes the period from 2008 to end-2010, when the exchange rate was more volatile.
7
With regard to world commodity prices, Camen (2006) estimates that movements in petrol and rice prices explain 21 percent and 11 percent respectively of the forecast variance of CPI inflation after twelve months. Minh (2009) also finds that oil prices have a significant impact on consumer price inflation. More recently Nguyen, Cavoli and Wilson (2012) use a range of time series estimation techniques and conclude that the money supply, oil prices, and rice prices present the strongest influences on CPI inflation in Vietnam.
IV. THE MODEL
The empirical analysis in this paper follows the inflation model developed by Goujon (2006), and modified by Nguyen, Cavoli and Wilson (2012), for a standard price-taking small open economy such as Vietnam. The structure of the model is explained in this section.
The CPI inflation rate is a weighted function of changes in the price of tradable and non-tradable goods, specified as
Δpt = θ ΔptT + (1- θ) Δpt
NT (1)
where p denotes the log of the consumer price index (CPI), pT and pNT are the logs of the prices of tradable and non-tradable goods, θ is the constant weight of the prices of tradable and non-tradable goods in the CPI (0 < θ < 1), and Δ is the first difference operator.
For a small, price-taking economy, the rate of change in the price of tradable goods is
ΔptT = λΔεt + μΔpt
W (2)
where ε is the log of the nominal exchange rate against the US dollar, and pW stands for the international price for tradable goods (in US dollars).
As the economy of Vietnam is highly dollarized, fluctuations in the exchange rate affect not only the prices of tradable goods but also those of non-tradable goods. For example, in Vietnam, some non-tradable goods - particularly durable goods and real estate - are prices in dollars. In addition, some services, including some long-term contracts and rents, are also quoted in dollars. As a result, exchange rate variations pass through to domestic inflation for a broader set of goods than in a non-dollarized economy. Moreover, following an exchange rate depreciation, a rise in the price of tradable goods and of non-tradable goods whose prices are indexed to the exchange rate affects the demand for, and supply of, other non-tradable goods. The change in the price of non-tradable goods is thus defined by Goujon (2006) as
ΔptNT = αECt-1 + ηΔεt (3)
where EC represents excess money and η the impact of the dollar-denominated price of particular non-tradable goods. EC is in lagged form, as it is presumed that those holding excess money at the beginning of the current period will adjust their holdings and fuel inflationary pressures at the end of the period.
The inflation equation is derived by substituting (2) and (3) into (1):
8
Δpt = [λθ + (1- θ)η] Δεt + θμ ΔptW + (1- θ)αECt-1 (4)
and can be written in reduced form as
Δpt = κ1 Δεt + κ2 ΔptW + κ3 ECt-1 (5)
Rather than following the two-step estimation approach advocated by Goujon (2006), we follow the more conventional approach adopted by Nguyen, Cavoli and Wilson (2012) by specifying money demand as a function of aggregate demand / output and the nominal interest rate. This results in a model of inflation as a function of foreign price inflation and of movements in the key economic variables - the money supply, aggregate demand / real output, the nominal effective exchange rate, and the nominal interest rate:
Δpt = κ1 Δεt + κ2 ΔptW + κ3 ΔMt + κ4 ΔYt + κ5 Δrt + ξt (6)
where M represents the money supply, r the nominal interest rate (the refinancing rate), Y the level of real output (GDP), and ξt denotes the error term.
Coefficients on the money supply and the interest rate should capture the effects of monetary policy on inflation. Economic theory would suggest that money supply growth, foreign price inflation and nominal exchange rate depreciation would have a positive effect on domestic inflation, while increases in the interest rate and higher output growth (to the extent that it reflects higher productive capacity and not excess demand) would have a negative effect on domestic inflation.
We go on to estimate Equation (6), measured in terms of percentage changes of the variables from the previous year, except for the interest rate, where the end-of-period nominal (refinancing) rate is used.
V. DATA AND ECONOMETRIC ESTIMATION
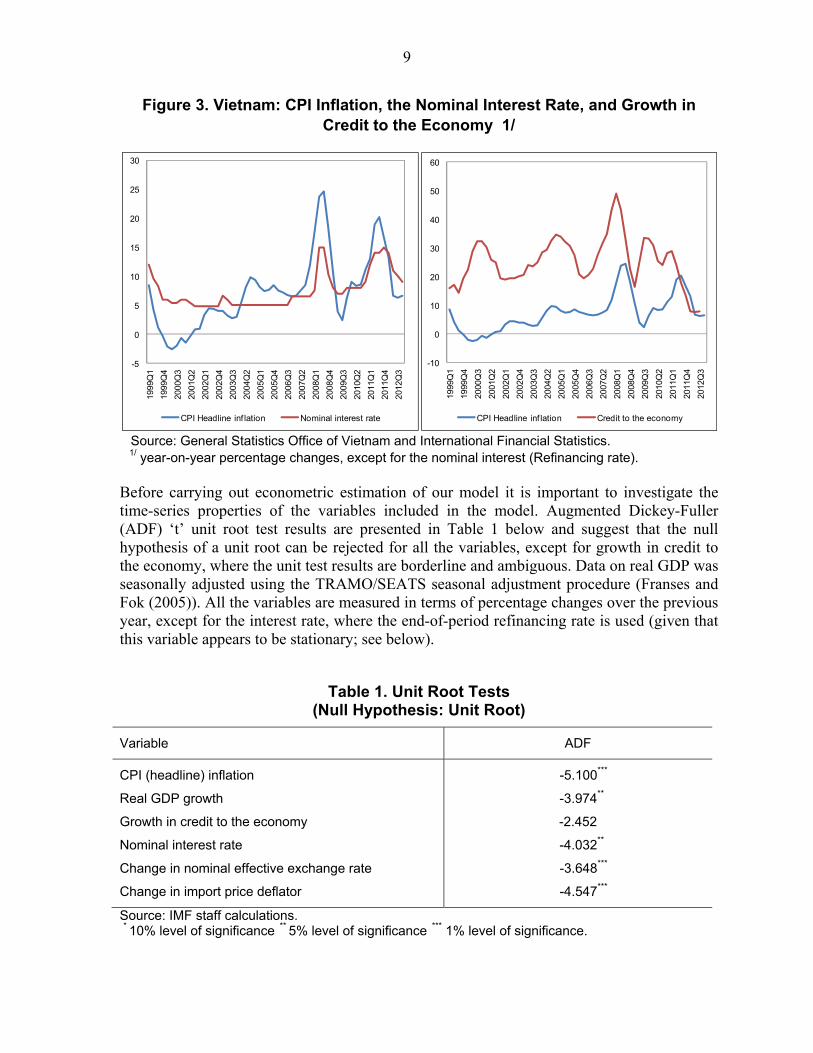
Prior to estimating the model, we take a quick graphical look at the relationship between headline inflation and the monetary policy variables (Figure 3). The interest rate we use is the refinancing rate. Figure 3 suggests a close positive relationship between inflation and growth in credit to the economy. The relationship between inflation and the nominal interest rate appears to have changed over time; until 2006 it is hard to see any relationship, but after this period there seems to be a positive and contemporaneous relationship, which is counter-intuitive at first sight. However, this finding is corroborated by the results of the VAR simulations discussed below and is not uncommon in the VAR literature, where it is known as the ‘price puzzle’ (see Sims (1992) and Eichenbaum (1992)). Castelnuovo and Surico (2006) show that the ‘price puzzle’ can arise when there is high persistence of expected inflation and the central bank is passive rather than forward-looking in responding to inflation.
9
Figure 3. Vietnam: CPI Inflation, the Nominal Interest Rate, and Growth in Credit to the Economy 1/
Source: General Statistics Office of Vietnam and International Financial Statistics. 1/ year-on-year percentage changes, except for the nominal interest (Refinancing rate).
Before carrying out econometric estimation of our model it is important to investigate the time-series properties of the variables included in the model. Augmented Dickey-Fuller (ADF) ‘t’ unit root test results are presented in Table 1 below and suggest that the null hypothesis of a unit root can be rejected for all the variables, except for growth in credit to the economy, where the unit test results are borderline and ambiguous. Data on real GDP was seasonally adjusted using the TRAMO/SEATS seasonal adjustment procedure (Franses and Fok (2005)). All the variables are measured in terms of percentage changes over the previous year, except for the interest rate, where the end-of-period refinancing rate is used (given that this variable appears to be stationary; see below).
Table 1. Unit Root Tests
(Null Hypothesis: Unit Root)
Variable ADF
CPI (headline) inflation
Real GDP growth
Growth in credit to the economy
Nominal interest rate
Change in nominal effective exchange rate
Change in import price deflator
-5.100***
-3.974**
-2.452
-4.032**
-3.648***
-4.547***
Source: IMF staff calculations. * 10% level of significance ** 5% level of significance *** 1% level of significance.
-5
0
5
10
15
20
25
3019
99Q
1
1999
Q4
2000
Q3
2001
Q2
2002
Q1
2002
Q4
2003
Q3
2004
Q2
2005
Q1
2005
Q4
2006
Q3
2007
Q2
2008
Q1
2008
Q4
2009
Q3
2010
Q2
2011
Q1
2011
Q4
2012
Q3
CPI Headline inf lation Nominal interest rate
-10
0
10
20
30
40
50
60
1999
Q1
1999
Q4
2000
Q3
2001
Q2
2002
Q1
2002
Q4
2003
Q3
2004
Q2
2005
Q1
2005
Q4
2006
Q3
2007
Q2
2008
Q1
2008
Q4
2009
Q3
2010
Q2
2011
Q1
2011
Q4
2012
Q3
CPI Headline inf lation Credit to the economy
10
A. What are the Key Drivers of Inflation in Vietnam?
A first step involved OLS estimation of an equation explaining CPI headline inflation over the period 2000Q1–2012Q2 as a function of GDP growth, growth in credit to the economy, percentage changes in the nominal effective exchange rate and in the import price deflator, and the nominal interest rate. Percentage changes in the import price deflator is used as a proxy for foreign price inflation, and total credit to the economy is used a proxy for money supply because it yielded results that were more statistically significant and robust than the standard money supply measures. The Quandt-Andrews tests for structural break, however, provided strong evidence for structural breaks in 2004Q1 and in 2007Q4.
A structural break in 2004 can be explained by the fact that prices of several important commodities, including rice, cement, urea fertilizer, and steel for construction, were liberalized to a great extent during 2002-2004.2 Moreover, this period also witnessed growing use of open market operations as well as liberalization of interest rates on dong deposits, and on dong and foreign currency lending. The structural break in 2007Q4 is probably linked to Vietnam joining the World Trade Organization (WTO) earlier in the year and implementing measures to fulfill its membership commitments. Moreover, the banking sector went through a period of fairly rapid restructuring in 2007 as it prepared for increased competition, with foreign banks gaining better access to the domestic financial market under Vietnam’s WTO commitments. More importantly, the surge in capital inflows that followed WTO membership compelled the authorities to allow the exchange rate to be more flexible and to serve as a shock absorber; as a result, since 2008 exchange rate devaluations have been more frequent and of larger magnitudes (Nguyen and Nguyen (2010)).
It was thought that a Vector Autoregressive (VAR) approach was suitable for looking at the main drivers of inflation in Vietnam, primarily because this approach allows us to fully capture the interaction among macroeconomic variables and their feedback effects. The endogenous variables in the VAR included CPI inflation, GDP growth, growth in credit to the economy, percentage change in the nominal effective exchange rate, and the nominal interest rate. The VAR was estimated over the period 2004Q1 to 2012Q2. Exogenous variables included the percentage change in the import price deflator as well as dummies for structural break in 2007Q4 (to allow for shifts in the intercept term and in the coefficient on the import price deflator). In light of the short time period involved a lag length of one was chosen, consistent with the results of the Schwarz Information Criterion for optimal lag length. The stability of the model was checked based on roots of the AR characteristic polynomial and all roots were found to be inside the unit circle, indicating that the model fulfills the stability condition.
Short- and medium-term elasticities of inflation to the other endogenous variables in our model were computed from the impulse responses of the estimated VAR regression, where the elasticities are obtained by dividing the cumulative impulse responses of inflation after j
2Ordinance No. 40 on prices, 2002; Decree No. 170 of December 12, 2003; and Circular 15 of March 9, 2004.
11
months by the cumulative responses of the shocks to the endogenous variables after j months (Leigh and Rossi (2002), Gueorguiev (2003)).
The impulse responses are based on a Cholesky decomposition of the variance-covariance matrix of the error terms from estimation of the VAR. Foreign price inflation is taken to be exogenous and affects all the other variables in the model, both in the short run and in the long run. The ordering of variables that was used for the Cholesky decomposition was the following: the nominal interest rate, real GDP growth, growth of total credit to the economy, percentage changes in the nominal effective exchange rate, and headline inflation. This implies that the nominal interest rate affects all the other endogenous variables in the model in the short run; real GDP growth does not impact the nominal interest rate contemporaneously but does impact the other three endogenous variables; growth of total credit to the economy affects only the nominal effective exchange rate and headline inflation in the short run; nominal effective exchange rate movements have a contemporaneous impact only on inflation; and inflation is affected in the short-run by all the other variables in the model, but does not a short-run contemporaneous impact on the other endogenous variables in the model.
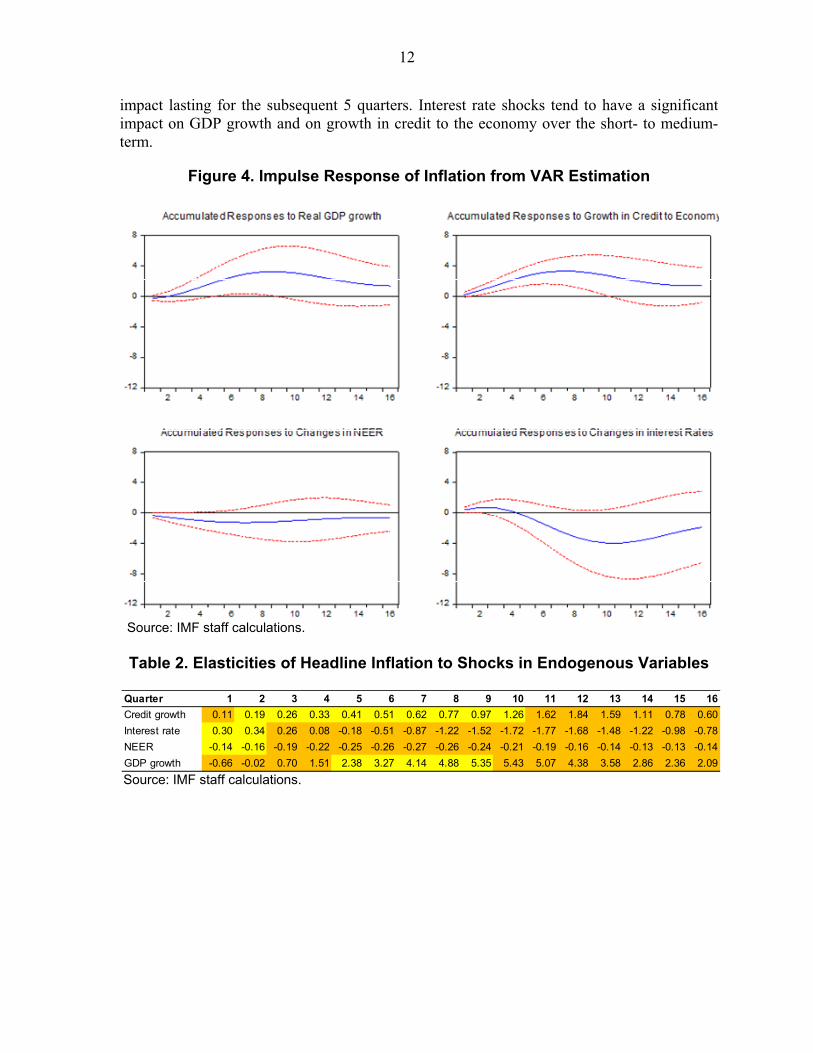
The impulse responses of headline inflation to shocks in the other endogenous variables are presented in Figure 4 below. The estimated elasticities are presented in Table 2, where elasticities that are statistically significant are colored in yellow, while those that are not statistically significant are colored in orange.
The impulse responses suggest that the key drivers of inflation in the short-term are movements in the nominal effective exchange rate, whereas over the medium-term (a two- to ten-quarter horizon) GDP growth and growth in credit to the economy are the principal factors driving inflation. The response of inflation to a rise in the nominal interest rate appears to be significant only in the first two quarters, and is—counter-intuitively—positive. Castelnuovo and Surico (2006) suggest that this could arise if there is high persistence of expected inflation and the central bank is passive rather than forward-looking in responding to inflation, which together can generate multiple equilibria. They show that the omission in the VARs of a variable capturing the high persistence of expected inflation under indeterminacy can account for the ‘price puzzle’.
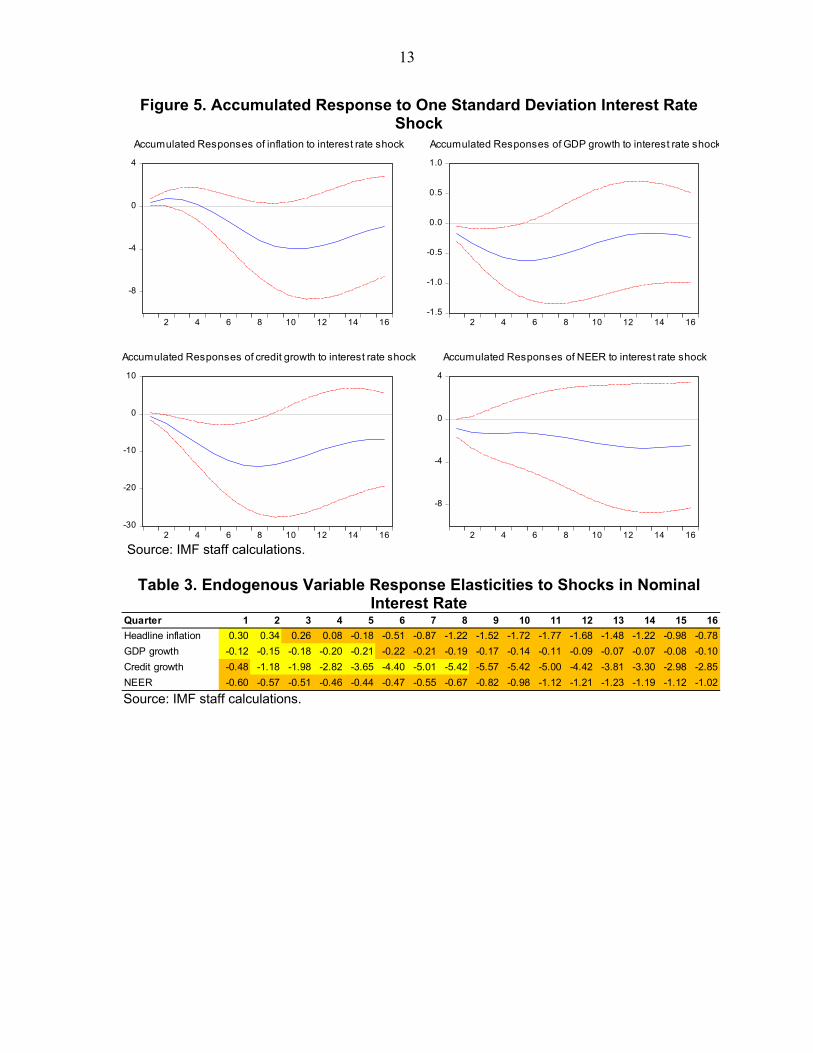
But what impact does monetary policy (movements in the interest rate) have on other endogenous variables in the model? Figure 5 below shows the impulse responses of the endogenous variables to a one standard deviation shock to the nominal interest rate, while the estimated elasticities are presented in Table 3; as before, elasticities that are statistically significant are colored in yellow, while those that are not statistically significant are colored in orange. The impulse responses suggest that shocks to the nominal interest rate have a significant negative impact on GDP growth over a five-quarter horizon, and on credit growth over an eight-quarter horizon.
To summarize, our empirical results suggest that the key drivers of inflation in the short-run are movements in the nominal effective exchange rate. Credit growth has a significant positive impact on inflation over a medium-term horizon of 2-10 quarters while positive shocks to real GDP growth tend to generate inflationary pressures after 4 quarters, with the
12
impact lasting for the subsequent 5 quarters. Interest rate shocks tend to have a significant impact on GDP growth and on growth in credit to the economy over the short- to medium-term.
Figure 4. Impulse Response of Inflation from VAR Estimation
Source: IMF staff calculations.
Table 2. Elasticities of Headline Inflation to Shocks in Endogenous Variables
Source: IMF staff calculations.
Quarter 1 2 3 4 5 6 7 8 9 10 11 12 13 14 15 16
Credit growth 0.11 0.19 0.26 0.33 0.41 0.51 0.62 0.77 0.97 1.26 1.62 1.84 1.59 1.11 0.78 0.60
Interest rate 0.30 0.34 0.26 0.08 -0.18 -0.51 -0.87 -1.22 -1.52 -1.72 -1.77 -1.68 -1.48 -1.22 -0.98 -0.78
NEER -0.14 -0.16 -0.19 -0.22 -0.25 -0.26 -0.27 -0.26 -0.24 -0.21 -0.19 -0.16 -0.14 -0.13 -0.13 -0.14
GDP growth -0.66 -0.02 0.70 1.51 2.38 3.27 4.14 4.88 5.35 5.43 5.07 4.38 3.58 2.86 2.36 2.09
13
Figure 5. Accumulated Response to One Standard Deviation Interest Rate Shock
Source: IMF staff calculations.
Table 3. Endogenous Variable Response Elasticities to Shocks in Nominal Interest Rate
Source: IMF staff calculations.
-8
-4
0
4
2 4 6 8 10 12 14 16
Accumulated Responses of inflation to interest rate shock
-1.5
-1.0
-0.5
0.0
0.5
1.0
2 4 6 8 10 12 14 16
Accumulated Responses of GDP growth to interest rate shock
-30
-20
-10
0
10
2 4 6 8 10 12 14 16
Accumulated Responses of credit growth to interest rate shock
-8
-4
0
4
2 4 6 8 10 12 14 16
Accumulated Responses of NEER to interest rate shock
Quarter 1 2 3 4 5 6 7 8 9 10 11 12 13 14 15 16
Headline inflation 0.30 0.34 0.26 0.08 -0.18 -0.51 -0.87 -1.22 -1.52 -1.72 -1.77 -1.68 -1.48 -1.22 -0.98 -0.78
GDP growth -0.12 -0.15 -0.18 -0.20 -0.21 -0.22 -0.21 -0.19 -0.17 -0.14 -0.11 -0.09 -0.07 -0.07 -0.08 -0.10
Credit growth -0.48 -1.18 -1.98 -2.82 -3.65 -4.40 -5.01 -5.42 -5.57 -5.42 -5.00 -4.42 -3.81 -3.30 -2.98 -2.85
NEER -0.60 -0.57 -0.51 -0.46 -0.44 -0.47 -0.55 -0.67 -0.82 -0.98 -1.12 -1.21 -1.23 -1.19 -1.12 -1.02
14
B. What Explains Vietnam’s Relatively High Inflation Compared to Other Emerging Market Economies in the Region?
For most of the period from early 2004 to end-2011, inflation in Vietnam has been significantly higher than the average for the rest of emerging Asia—defined in this paper to include China, India, Sri Lanka, Thailand, Philippines, Malaysia, and Indonesia. Inflation in Vietnam reached a peak in mid-2011, partly a consequence of accommodative domestic policies adding to higher commodity (and in particular food) prices. Throughout 2010 and 2011 Vietnam experienced a higher rate of inflation than any of the other Asian emerging markets, except in 2010Q2.
This section presents the results of estimating a cross-country dynamic panel model to cast light on how the sources of inflation in Vietnam may have differed from those of the other emerging countries in the region, listed above. The panel includes China, India, Sri Lanka, Thailand, Philippines, Malaysia, and Indonesia as well as Vietnam. The sample consists of quarterly data covering the period 2004Q1–2012Q2, and was estimated using a fixed effects model with a lagged dependent variable.
Current inflation, the dependent variable, is estimated as function of lagged inflation, which captures the inflation inertia element; lagged growth rates of GDP, to capture excess demand pressures; the nominal interest rate lagged one period and lagged growth in the M2 measure of the money supply, to capture lags in the transmission of monetary policy; lagged movements in the nominal effective exchange rate, which is intended to capture the degree of pass-through from the exchange rate to domestic prices; and contemporaneous movements in the import price deflator (taken to be an exogenous variable), to capture the importance of imported goods, and in particular world food and commodity prices, in the domestic consumption basket. All the variables—except for the nominal interest rate—are measured as quarter-on-quarter percentage changes on seasonally adjusted data. The model also includes dummy variables for structural changes, in 2007Q4 (Vietnam and India) or 2008Q3 (Philippines, Malaysia, Indonesia, and Thailand), in the intercept term. A single-period dummy variable was also included for Indonesia for the fourth quarter of 2005 to reflect the impact on inflation of a 127 percent rise in average retail fuel prices enacted on October 1, 2005.
In estimating the model differenced generalized method-of-moments (GMM) or system GMM were not used because consistency of results using these methodologies depends crucially on having a large number of cross-sectional units, regardless of the number of time-series observations; our sample by contrast has only eight cross-sectional observations and a relatively large number of time periods. On the other hand, standard fixed effects estimation yields estimates of the coefficient on the lagged dependent variable that are biased downwards, although Nickell (1981) has shown that the estimates are consistent and that the size of the bias gets smaller as T (the number of time periods) increases. We instead estimate the model—which incorporates country-specific dummy variables—using GMM-IV (General Method of Moments with instrumental variables) since this methodology gives us coefficient estimates that are corrected for endogeneity, heteroskedasticity and
15
autocorrelation.3 Lagged values of the endogenous variables and of the dependent variable were used as instruments.
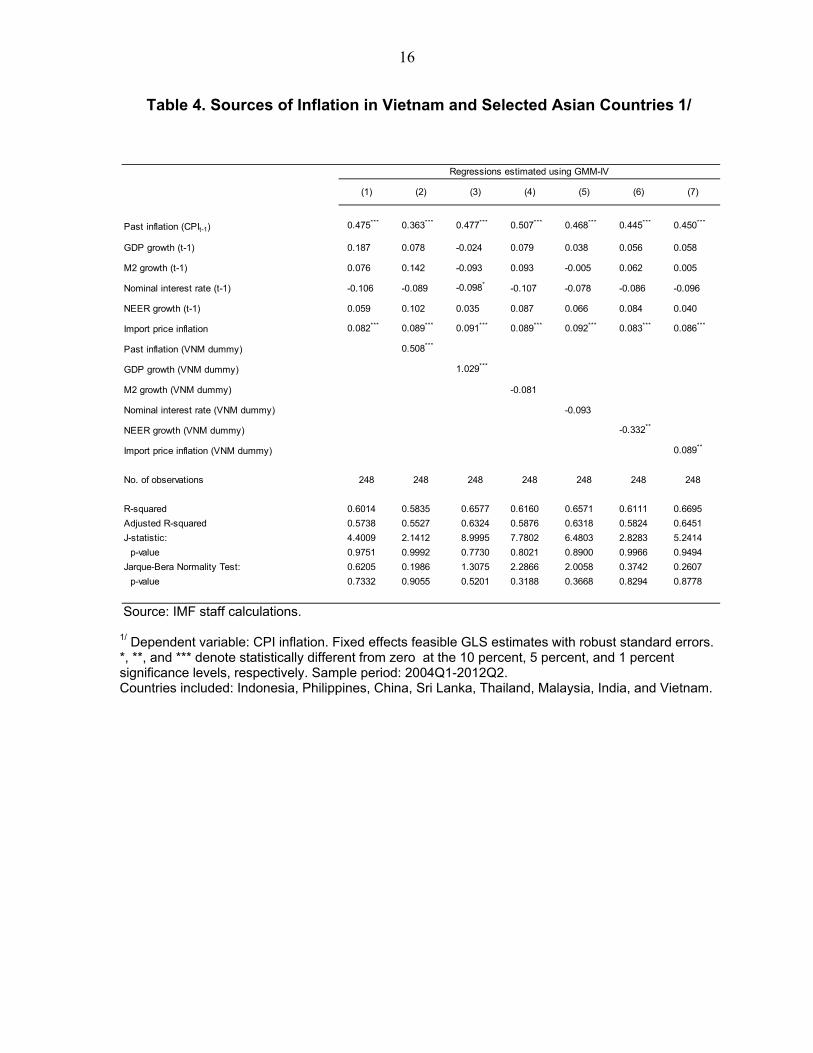
The econometric results are presented in Table 4, where, for the sake of brevity, the coefficients on the dummy variables are not reported. To examine the validity of our instruments we apply Hansen’s J test, where the null hypothesis is that the instruments as a group are exogenous. The p-values of the Hansen J statistics fail to reject the null hypothesis, implying that our instrument set is robust. Moreover, the Jarque-Bera statistics indicate that the residuals from the estimated equations are normally distributed.
The results reported in Table 4 suggest that, for all the countries in the sample, past inflation and contemporaneous movements in import prices are important determinants of inflation. Lagged growth rates of GDP or of the money supply, lagged movements in the nominal effective exchange rate, and lagged nominal interest rates seem to play no role in explaining inflation across the sample over the estimation period.
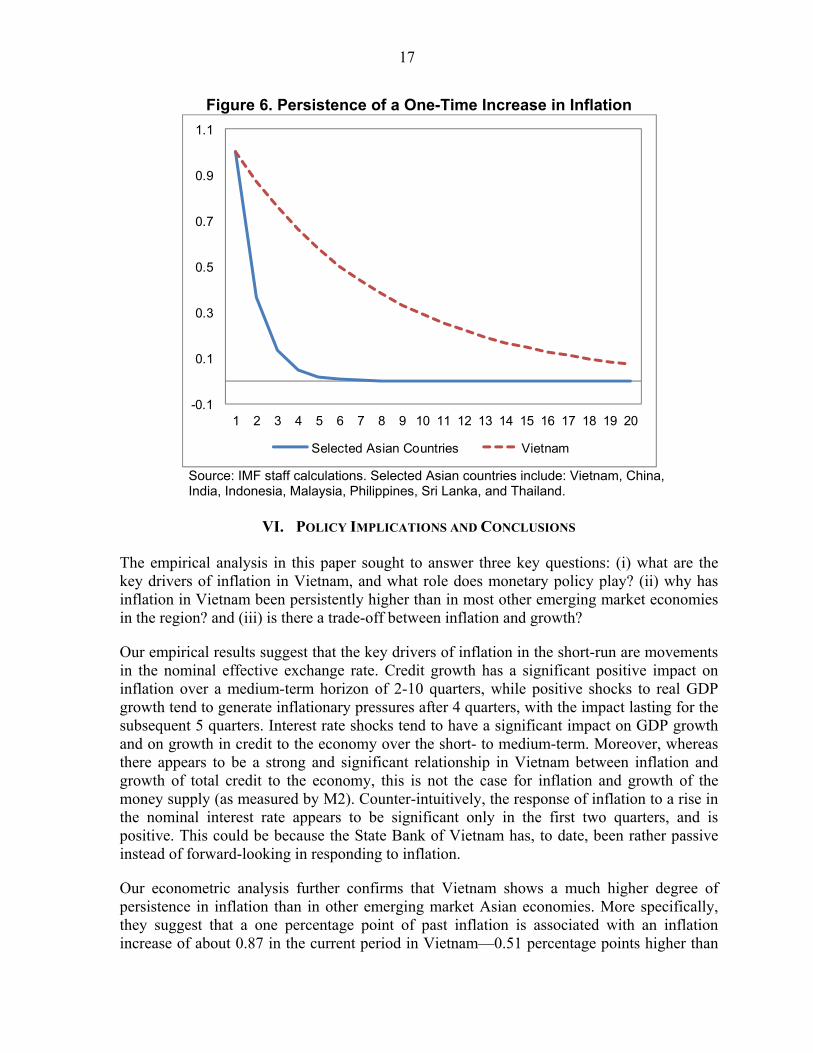
The econometric results on Vietnam show a much higher degree of persistence in inflation than in other countries (Table 4, regression 2). In particular, one percentage point of past inflation is associated with an inflation increase of about 0.87 in the current period in Vietnam—0.51 percentage points higher than the sample average.4 As a result, and as shown in Figure 6, the effects of a shock on inflation last much longer in Vietnam compared with the other emerging Asian economies. This may reflect sluggish adjustment of inflationary expectations, and/or monetary policy that is more accommodative in Vietnam compared to the other countries. Neither the nominal interest rate lagged one period, nor lagged growth of the money supply, have an impact on inflation in either Vietnam or in the other emerging Asian economies in the sample.
The econometric results also suggest that lagged GDP growth, and lagged movements of the nominal effective exchange rate, had an important impact on headline inflation in Vietnam, unlike in the other countries in the region, over the sample period. Liberalization of administered prices in Vietnam may have strengthened the transmission mechanism through which aggregate demand affected inflation from 2002 onwards (see IMF (2006)). The empirical results suggest that, over the sample period, a one percentage point increase in the growth rate of GDP is associated with an increase in the inflation rate of about 1.03 percentage points. The empirical results also suggest that, unlike in the other emerging market economies in Asia, a depreciation of the nominal effective exchange rate by one percentage point is associated with an increase in inflation of 0.33 percent in Vietnam. Foreign inflation (as proxied by movements in the import price deflator) also has a somewhat stronger impact on inflation in Vietnam compared with the other Asian emerging market economies in our sample.
3Since we are using lagged endogenous variables as instruments, the coefficient estimates corrected for autocorrelation are more efficient.
4This estimate is comparable to those reported in IMF (2006) and Nguyen, Cavoli and Wilson (2012)—which estimate the coefficient for past inflation at about 0.79 and 0.82 respectively for Vietnam.
16
Table 4. Sources of Inflation in Vietnam and Selected Asian Countries 1/
Source: IMF staff calculations. 1/ Dependent variable: CPI inflation. Fixed effects feasible GLS estimates with robust standard errors. *, **, and *** denote statistically different from zero at the 10 percent, 5 percent, and 1 percent significance levels, respectively. Sample period: 2004Q1-2012Q2. Countries included: Indonesia, Philippines, China, Sri Lanka, Thailand, Malaysia, India, and Vietnam.
(1) (2) (3) (4) (5) (6) (7)
Past inflation (CPIt-1) 0.475*** 0.363*** 0.477*** 0.507*** 0.468*** 0.445*** 0.450***
GDP growth (t-1) 0.187 0.078 -0.024 0.079 0.038 0.056 0.058
M2 growth (t-1) 0.076 0.142 -0.093 0.093 -0.005 0.062 0.005
Nominal interest rate (t-1) -0.106 -0.089 -0.098* -0.107 -0.078 -0.086 -0.096
NEER growth (t-1) 0.059 0.102 0.035 0.087 0.066 0.084 0.040
Import price inflation 0.082*** 0.089*** 0.091*** 0.089*** 0.092*** 0.083*** 0.086***
Past inflation (VNM dummy) 0.508***
GDP growth (VNM dummy) 1.029***
M2 growth (VNM dummy) -0.081
Nominal interest rate (VNM dummy) -0.093
NEER growth (VNM dummy) -0.332**
Import price inflation (VNM dummy) 0.089**
No. of observations 248 248 248 248 248 248 248
R-squared 0.6014 0.5835 0.6577 0.6160 0.6571 0.6111 0.6695
Adjusted R-squared 0.5738 0.5527 0.6324 0.5876 0.6318 0.5824 0.6451
J-statistic: 4.4009 2.1412 8.9995 7.7802 6.4803 2.8283 5.2414
p-value 0.9751 0.9992 0.7730 0.8021 0.8900 0.9966 0.9494
Jarque-Bera Normality Test: 0.6205 0.1986 1.3075 2.2866 2.0058 0.3742 0.2607
p-value 0.7332 0.9055 0.5201 0.3188 0.3668 0.8294 0.8778
Regressions estimated using GMM-IV
17
Figure 6. Persistence of a One-Time Increase in Inflation
Source: IMF staff calculations. Selected Asian countries include: Vietnam, China, India, Indonesia, Malaysia, Philippines, Sri Lanka, and Thailand.
VI. POLICY IMPLICATIONS AND CONCLUSIONS
The empirical analysis in this paper sought to answer three key questions: (i) what are the key drivers of inflation in Vietnam, and what role does monetary policy play? (ii) why has inflation in Vietnam been persistently higher than in most other emerging market economies in the region? and (iii) is there a trade-off between inflation and growth?
Our empirical results suggest that the key drivers of inflation in the short-run are movements in the nominal effective exchange rate. Credit growth has a significant positive impact on inflation over a medium-term horizon of 2-10 quarters, while positive shocks to real GDP growth tend to generate inflationary pressures after 4 quarters, with the impact lasting for the subsequent 5 quarters. Interest rate shocks tend to have a significant impact on GDP growth and on growth in credit to the economy over the short- to medium-term. Moreover, whereas there appears to be a strong and significant relationship in Vietnam between inflation and growth of total credit to the economy, this is not the case for inflation and growth of the money supply (as measured by M2). Counter-intuitively, the response of inflation to a rise in the nominal interest rate appears to be significant only in the first two quarters, and is positive. This could be because the State Bank of Vietnam has, to date, been rather passive instead of forward-looking in responding to inflation.
Our econometric analysis further confirms that Vietnam shows a much higher degree of persistence in inflation than in other emerging market Asian economies. More specifically, they suggest that a one percentage point of past inflation is associated with an inflation increase of about 0.87 in the current period in Vietnam—0.51 percentage points higher than
-0.1
0.1
0.3
0.5
0.7
0.9
1.1
1 2 3 4 5 6 7 8 9 10 11 12 13 14 15 16 17 18 19 20
Selected Asian Countries Vietnam
18
our sample average. This may reflect sluggish adjustment of inflationary expectations, and/or monetary policy that is more accommodative in Vietnam compared to the other countries. Furthermore, the evidence indicates that lagged GDP growth, and lagged movements of the nominal effective exchange rate, had an important impact on headline inflation in Vietnam, unlike in the other countries in the region, over the sample period 2004Q1–2012Q2. Foreign inflation, as proxied by movements in the import price deflator, also seems to have a somewhat stronger impact in Vietnam compared with other emerging market economies in Asia.
An important finding from our analysis is that interest rates in Vietnam do not have seem to have a significant impact on headline inflation (as opposed to growth), neither in the short- term nor in the medium-term; in this sense, it can be concluded that the monetary policy transmission mechanism is weak in Vietnam. Several measures can be taken if the authorities wish to make the interest rate a more effective tool for combating inflation. Three specific recommendations can be made in this regard:
• First, the State Bank and Vietnam should be given a clear mandate and greater autonomy to pursue price stability as its primary policy objective. The Law on the State Bank of Vietnam, passed in June 2010, did not give it such a clear mandate, stating in Paragraph 1 of Article 4 that “The operations of the State Bank shall aim at stabilizing the currency value; ensure the safety of banking activities and the system of credit institutions; ensure the safety and efficiency of national payment system; facilitate the socio-economic development in a manner consistent with the socialist orientation.”
• Second, use of administrative controls on interest rates and on credit allocation and growth should be faded away, with interest rates allowed to be more market-determined over time.
• Third, it would also be useful to establish an interest rate corridor, incorporating both a lending rate and a deposit rate, as an important tool of monetary policy; the ‘corridor’ introduced in May 2008, comprised of the refinancing rate and the discount rate, does not create a true corridor for the interbank interest rate since both are, in effect, lending rates. Here it is relevant to note that Mohanty and Turner (2008) conclude that the introduction of a new liquidity management framework in India in 2004, which established a corridor for the movement of the daily interbank rate, resulted in a significant improvement in the Reserve Bank of India’s control over market interest rates.
19
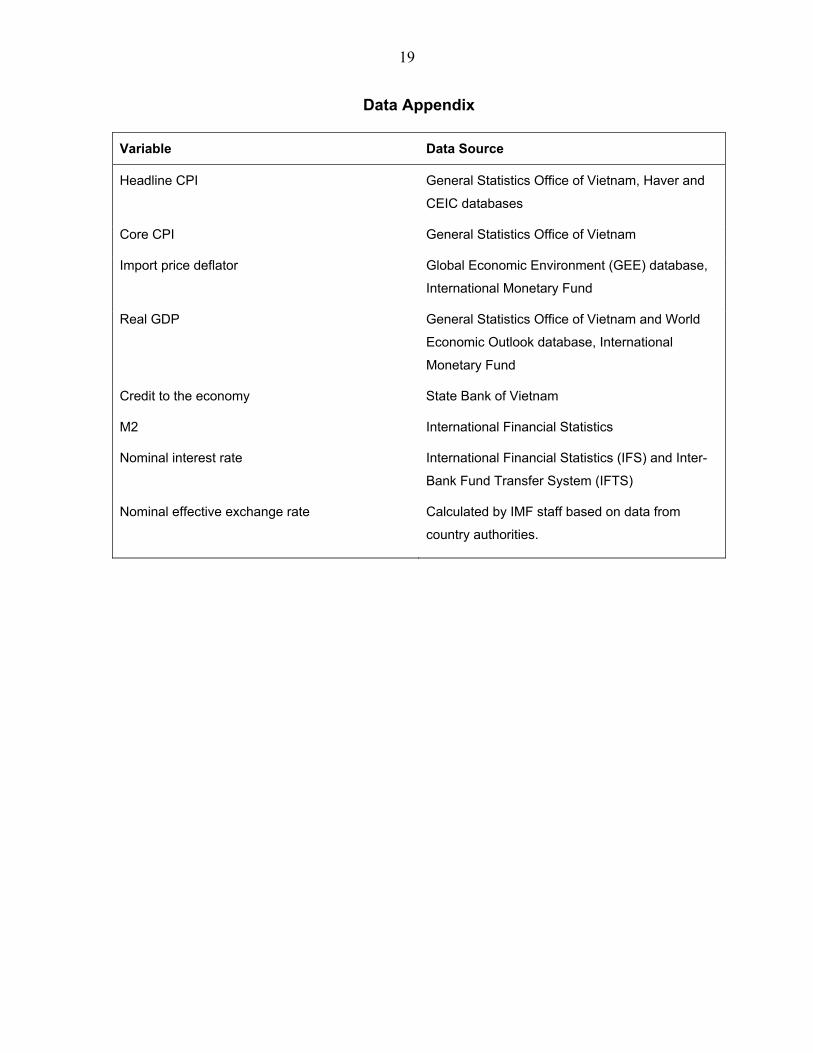
Data Appendix
Variable Data Source
Headline CPI General Statistics Office of Vietnam, Haver and
CEIC databases
Core CPI General Statistics Office of Vietnam
Import price deflator
Global Economic Environment (GEE) database,
International Monetary Fund
Real GDP General Statistics Office of Vietnam and World
Economic Outlook database, International
Monetary Fund
Credit to the economy State Bank of Vietnam
M2 International Financial Statistics
Nominal interest rate International Financial Statistics (IFS) and Inter-
Bank Fund Transfer System (IFTS)
Nominal effective exchange rate Calculated by IMF staff based on data from
country authorities.
20
REFERENCES
Camen, U., 2006, “Monetary Policy in Vietnam: The case of a transition country” in
“Monetary Policy in Asia: approaches and implementation”, BIS Papers, Vol. 31, pp. 232-
252, Bank for International Settlements, Basle, Switzerland.
Castelnuovo, Efrem and Paolo Surico, 2006, “The price puzzle: fact or artifact?”, Bank of
England Working Paper No. 288, January, Bank of England, London, United Kingdom.
Eichenbaum, Michael, 1992, “Comment on ‘Interpreting the Macroeconomic Time Series
Facts: The Effects of Monetary Policy’ by C.A. Sims”, European Economic Review, June,
Vol. 36 No. 5, pp. 1001-1011
Franses, P.H., R. Paap, and D. Fok, May 2005, “Performance of Seasonal Adjustment
Procedures: Simulation and empirical results”, European Commission and Organisation for
Economic Cooperation and Development.
Goujon, Michaël, 2006, “Fighting inflation in a dollarized economy: The case of Vietnam”,
Journal of Comparative Economics, Vol. 34, pp. 564-581.
Gueorguiev, Nikolay, 2003, “Exchange Rate Pass-Through in Romania”, IMF Working
Paper 04/223, International Monetary Fund, Washington, D.C., U.S.A.
Hung, Le Viet and Wade D. Pfau, 2008, “VAR Analysis of the Monetary Transmission
Mechanism in Vietnam”, February, State Bank of Vietnam, Hanoi, Vietnam and National
Graduate Institute for Policy Studies, Tokyo, Japan.
International Monetary Fund, 2003, “What Drives Inflation in Vietnam? A Regional
Approach”, in “Vietnam: Selected Issues”, IMF Country Report No. 06/422, November,
International Monetary Fund, Washington, D.C., U.S.A.
International Monetary Fund, 2006, “Inflation Dynamics in Vietnam”, in “Vietnam: Selected
Issues”, IMF Country Report No. 03/381, August, International Monetary Fund, Washington,
D.C., U.S.A.
International Monetary Fund, 2010, “Vietnam—Staff Report for the 2010 Article IV
Consultation”, July, International Monetary Fund, Washington, D.C., U.S.A.
21
Leigh and Rossi, 2002, “Exchange Rate Pass-Through in Turkey”, IMF Working Paper
02/204, International Monetary Fund, Washington, D.C., U.S.A.
Maliszewski, W. S., 2010, “Vietnam: Bayesian Estimation of Output Gap”, IMF Working
Paper 10/149, International Monetary Fund, Washington, D.C., U.S.A.
Minh, Vo Van, 2009, “Exchange rate pass-through and its implications for inflation in
Vietnam”, VDF Working Paper No. 0902, April, Vietnam Development Forum, Vietnam.
Mohanty, M. S., and P. Turner, 2008, “Monetary Policy Transmission in Emerging Market
Economies: What’s New?” in “Transmission Mechanisms for Monetary Policy in Emerging
Market Economies”, BIS Papers No. 35, January, Bank for International Settlements, Basle,
Switzerland.
Moody’s Investor Service, September 2011, “Vietnam: Banking System Outlook”.
Nguyen, Huu Minh, Tony Cavoli, and John K. Wilson, 2012, “The Determinants of Inflation
in Vietnam, 2001-09”, ASEAN Economic Bulletin, Vol. 29 No. 1, April, pp. 1-14.
Nguyen, Thi Thu Hang and Duc Thanh Nguyen, 2010, “Macroeconomic Determinants of
Vietnam’s Inflation 2000-2010: Evidence and Analysis”, December, Vietnam Centre for
Economic and Policy Research, University of Economics and Business, Vietnam National
University, Hanoi, Vietnam.
Nickell, Steve, 1981, “Biases in dynamic models with fixed effects”, Econometrica, Vol. 49,
Pesaran, Hashem H. and Yongcheol Shin, 1998, “Generalized impulse response analysis in
linear multivariate models”, Economic Letters, Vol. 58, pp. 17-29.
Sims, Christopher A, 1992, “Interpreting the Macroeconomic Time Series Facts: The Effects
of Monetary Policy”, European Economic Review, June, Vol. 36 No. 5, pp. 975-1011.
Stock, James H. and Mark W. Watson, 2001, “Vector Autoregressions”, Journal of
Economic Perspectives, Vol. 15 No. 4, Fall 2001, pp. 101-115.