Embed Size (px)
Citation preview
Big Data and R
2016.06.30한남대학교 통계학과 권세혁교수
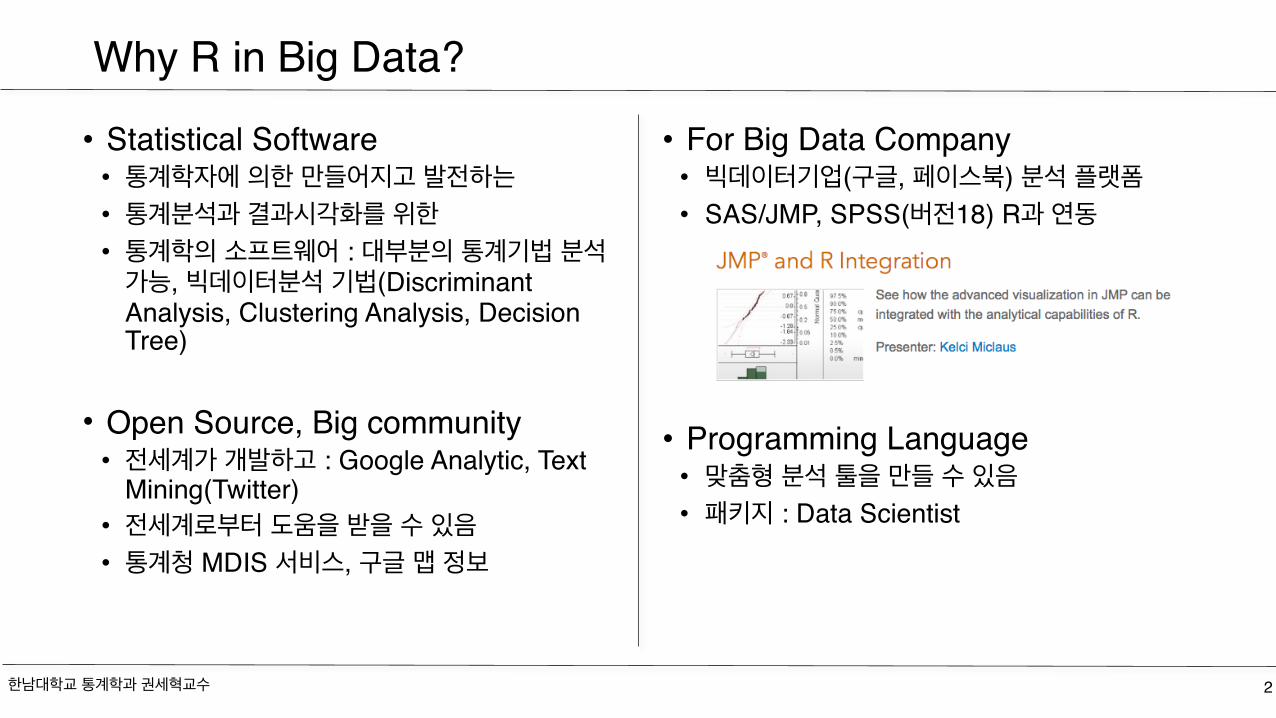
• Statistical Software • 통계학자에 의한 만들어지고 발전하는• 통계분석과 결과시각화를 위한• 통계학의 소프트웨어 : 대부분의 통계기법 분석 가능, 빅데이터분석 기법(Discriminant Analysis, Clustering Analysis, Decision Tree)
• Open Source, Big community• 전세계가 개발하고 : Google Analytic, Text
Mining(Twitter)• 전세계로부터 도움을 받을 수 있음• 통계청 MDIS 서비스, 구글 맵 정보
• For Big Data Company• 빅데이터기업(구글, 페이스북) 분석 플랫폼• SAS/JMP, SPSS(버전18) R과 연동
• Programming Language• 맞춤형 분석 툴을 만들 수 있음• 패키지 : Data Scientist
한남대학교 통계학과 권세혁교수 2
Why R in Big Data?
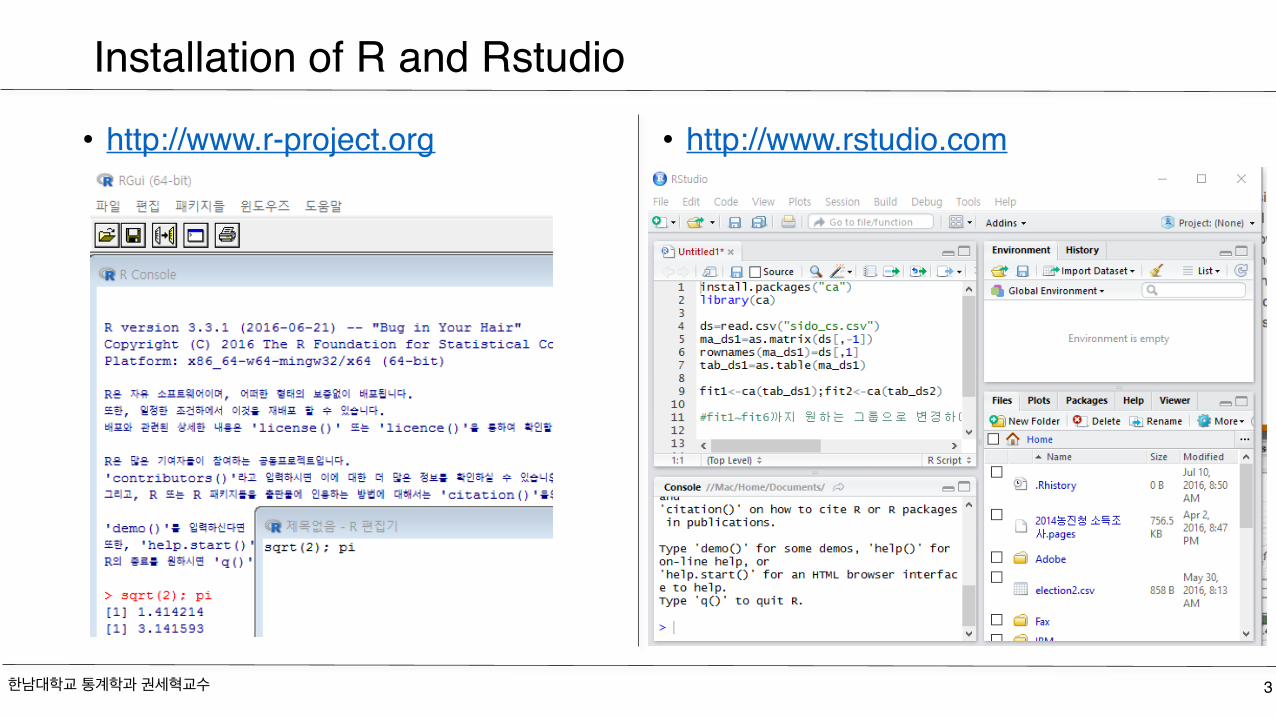
• http://www.r-project.org • http://www.rstudio.com
한남대학교 통계학과 권세혁교수 3
Installation of R and Rstudio
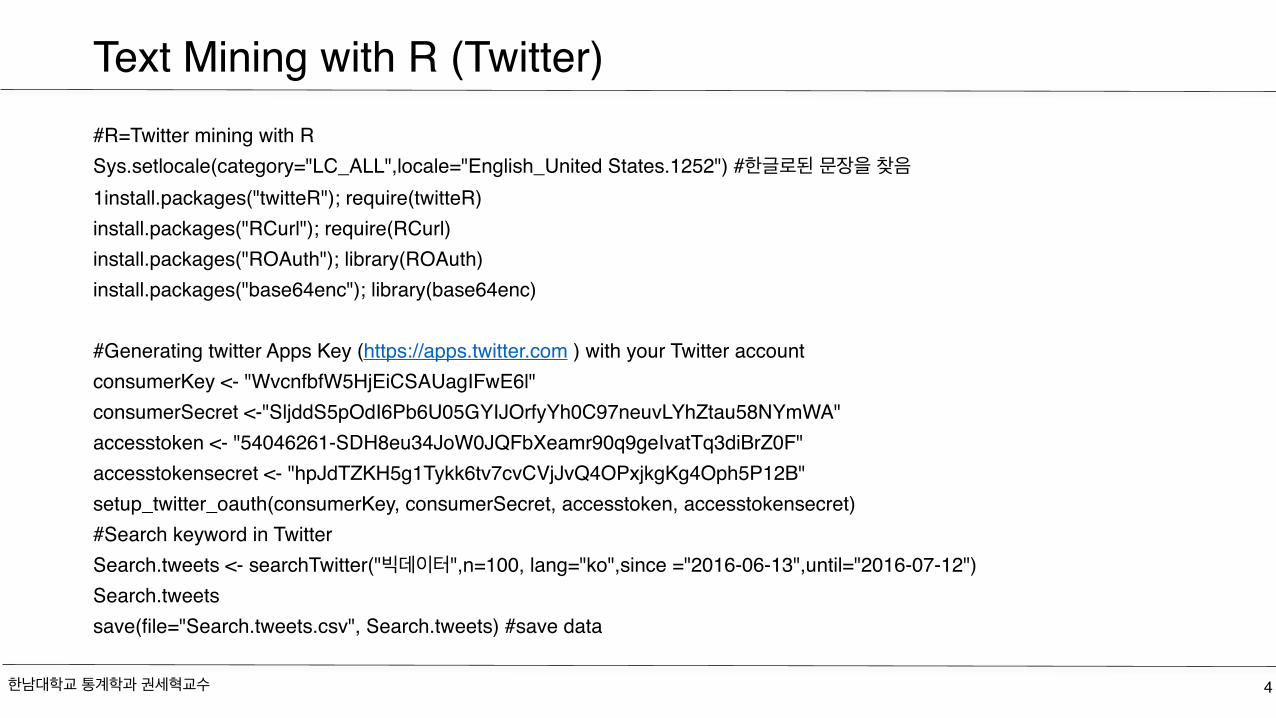
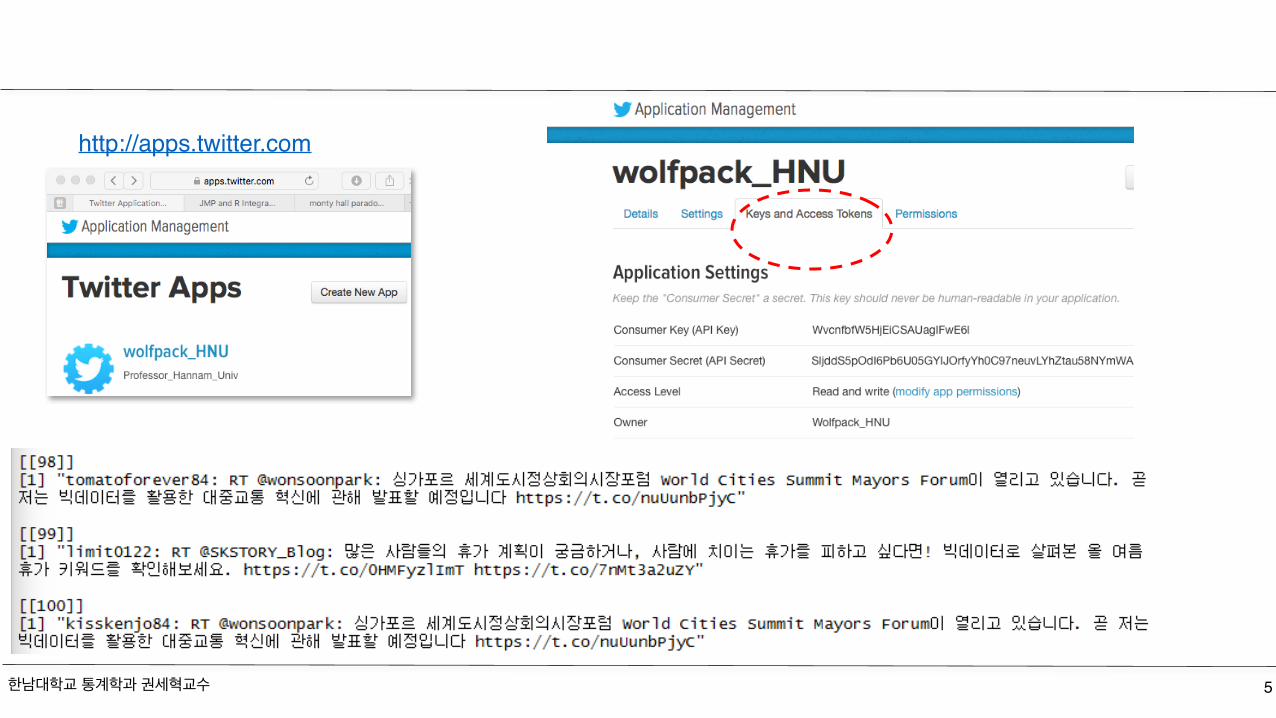
Text Mining with R (Twitter)#R=Twitter mining with RSys.setlocale(category="LC_ALL",locale="English_United States.1252") #한글로된 문장을 찾음1install.packages("twitteR"); require(twitteR)install.packages("RCurl"); require(RCurl)install.packages("ROAuth"); library(ROAuth)install.packages("base64enc"); library(base64enc)
#Generating twitter Apps Key (https://apps.twitter.com ) with your Twitter account consumerKey <- "WvcnfbfW5HjEiCSAUagIFwE6l"consumerSecret <-"SljddS5pOdI6Pb6U05GYIJOrfyYh0C97neuvLYhZtau58NYmWA"accesstoken <- "54046261-SDH8eu34JoW0JQFbXeamr90q9geIvatTq3diBrZ0F"accesstokensecret <- "hpJdTZKH5g1Tykk6tv7cvCVjJvQ4OPxjkgKg4Oph5P12B"setup_twitter_oauth(consumerKey, consumerSecret, accesstoken, accesstokensecret)#Search keyword in TwitterSearch.tweets <- searchTwitter("빅데이터",n=100, lang="ko",since ="2016-06-13",until="2016-07-12")Search.tweetssave(file="Search.tweets.csv", Search.tweets) #save data
한남대학교 통계학과 권세혁교수 4
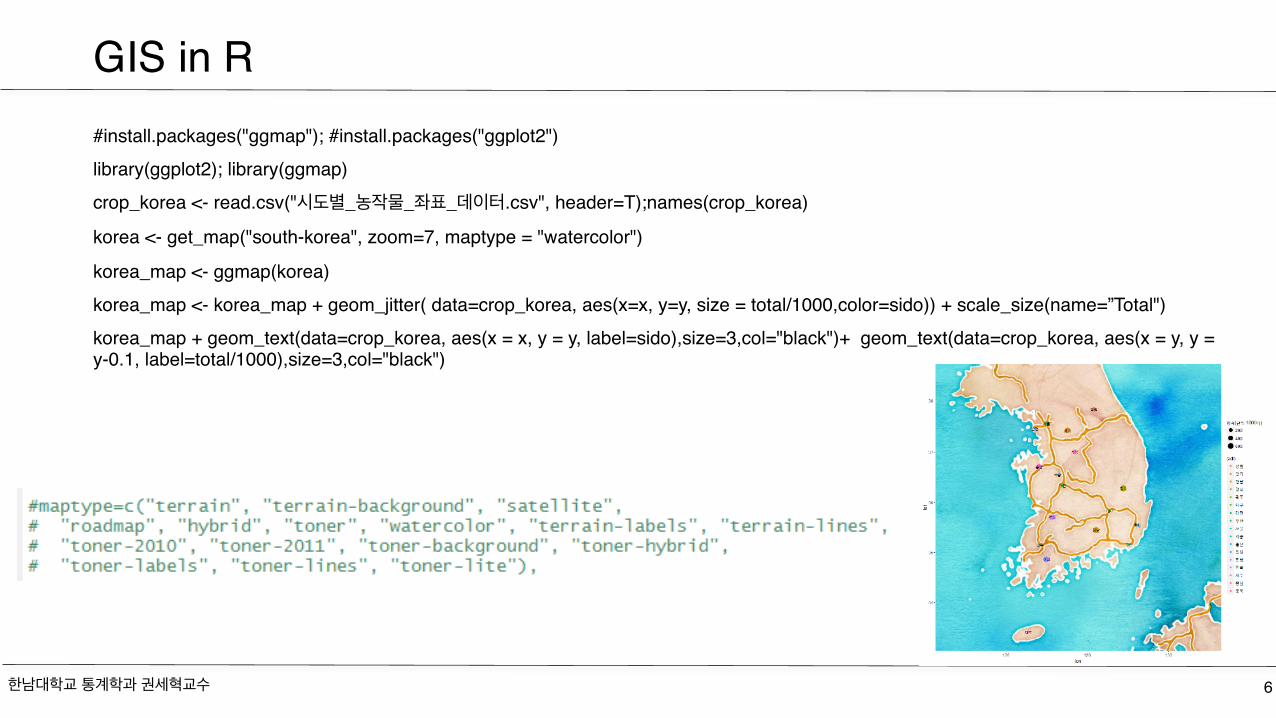
GIS in R#install.packages("ggmap"); #install.packages("ggplot2")library(ggplot2); library(ggmap)crop_korea <- read.csv("시도별_농작물_좌표_데이터.csv", header=T);names(crop_korea)
korea <- get_map("south-korea", zoom=7, maptype = "watercolor")
korea_map <- ggmap(korea)korea_map <- korea_map + geom_jitter( data=crop_korea, aes(x=x, y=y, size = total/1000,color=sido)) + scale_size(name=”Total")korea_map + geom_text(data=crop_korea, aes(x = x, y = y, label=sido),size=3,col="black")+ geom_text(data=crop_korea, aes(x = y, y = y-0.1, label=total/1000),size=3,col="black")
한남대학교 통계학과 권세혁교수 6
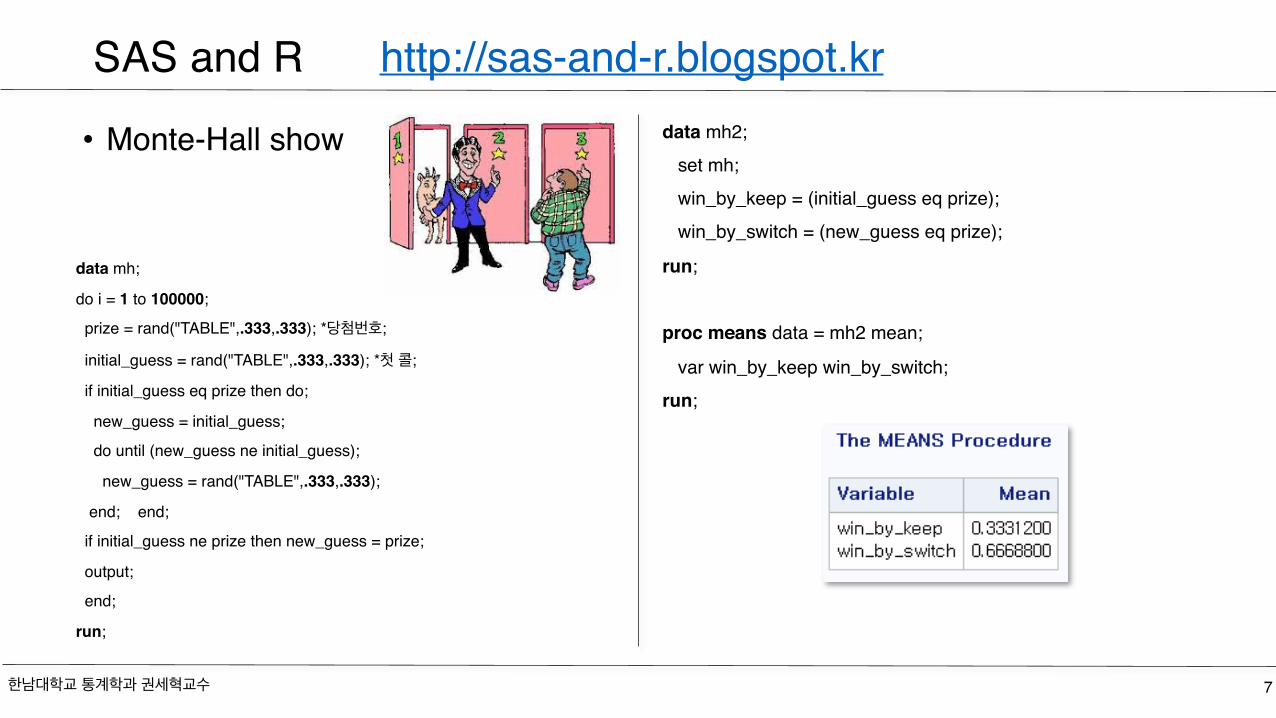
• Monte-Hall show data mh2; set mh; win_by_keep = (initial_guess eq prize); win_by_switch = (new_guess eq prize);
run;
proc means data = mh2 mean;
var win_by_keep win_by_switch;run;
한남대학교 통계학과 권세혁교수 7
SAS and R http://sas-and-r.blogspot.kr
data mh;
do i = 1 to 100000;
prize = rand("TABLE",.333,.333); *당첨번호;
initial_guess = rand("TABLE",.333,.333); *첫 콜;
if initial_guess eq prize then do;
new_guess = initial_guess;
do until (new_guess ne initial_guess);
new_guess = rand("TABLE",.333,.333);
end; end;
if initial_guess ne prize then new_guess = prize;
output;
end;
run;
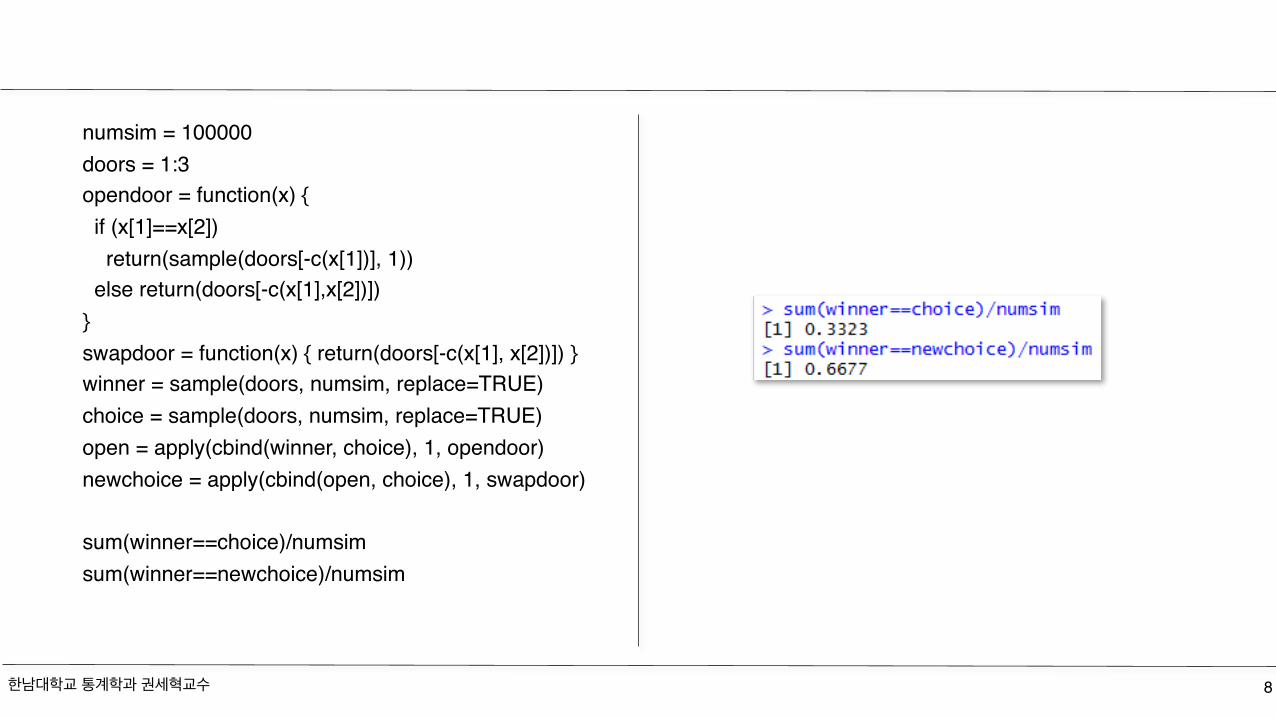
numsim = 100000doors = 1:3opendoor = function(x) { if (x[1]==x[2]) return(sample(doors[-c(x[1])], 1)) else return(doors[-c(x[1],x[2])])}swapdoor = function(x) { return(doors[-c(x[1], x[2])]) }winner = sample(doors, numsim, replace=TRUE)choice = sample(doors, numsim, replace=TRUE)open = apply(cbind(winner, choice), 1, opendoor)newchoice = apply(cbind(open, choice), 1, swapdoor)
sum(winner==choice)/numsimsum(winner==newchoice)/numsim
한남대학교 통계학과 권세혁교수 8
한남대학교 통계학과 권세혁교수 9
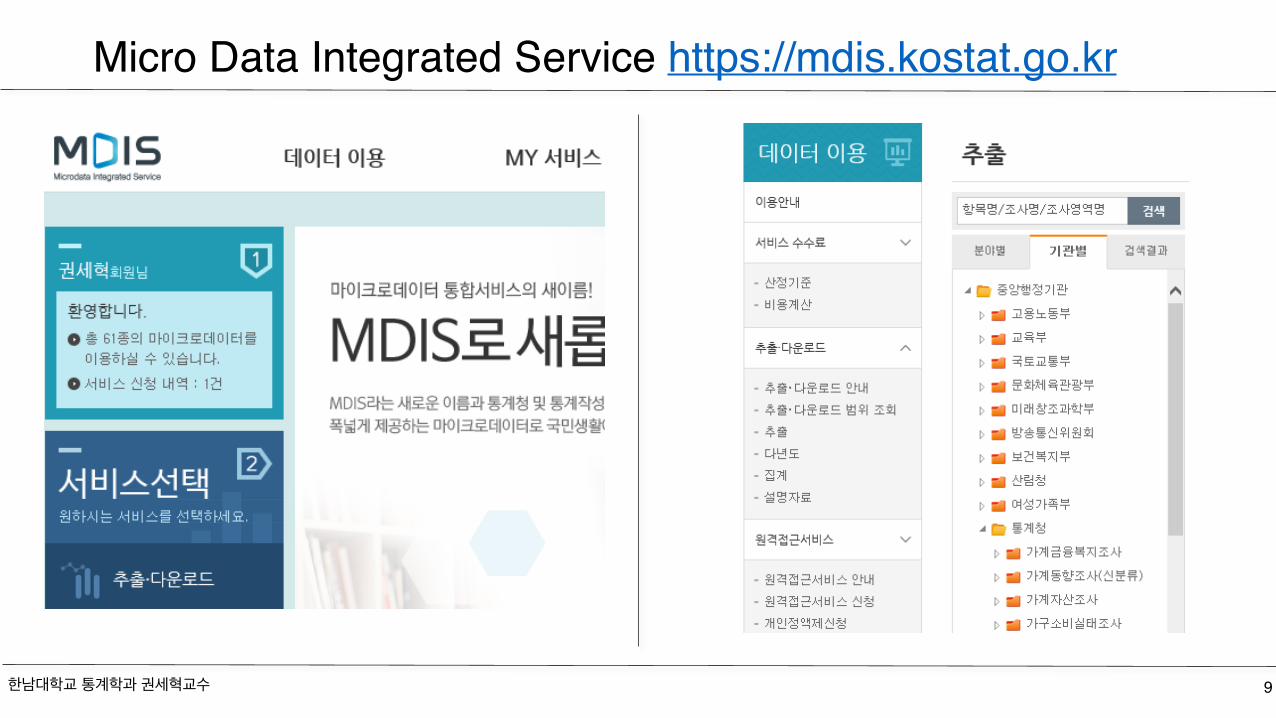
Micro Data Integrated Service https://mdis.kostat.go.kr
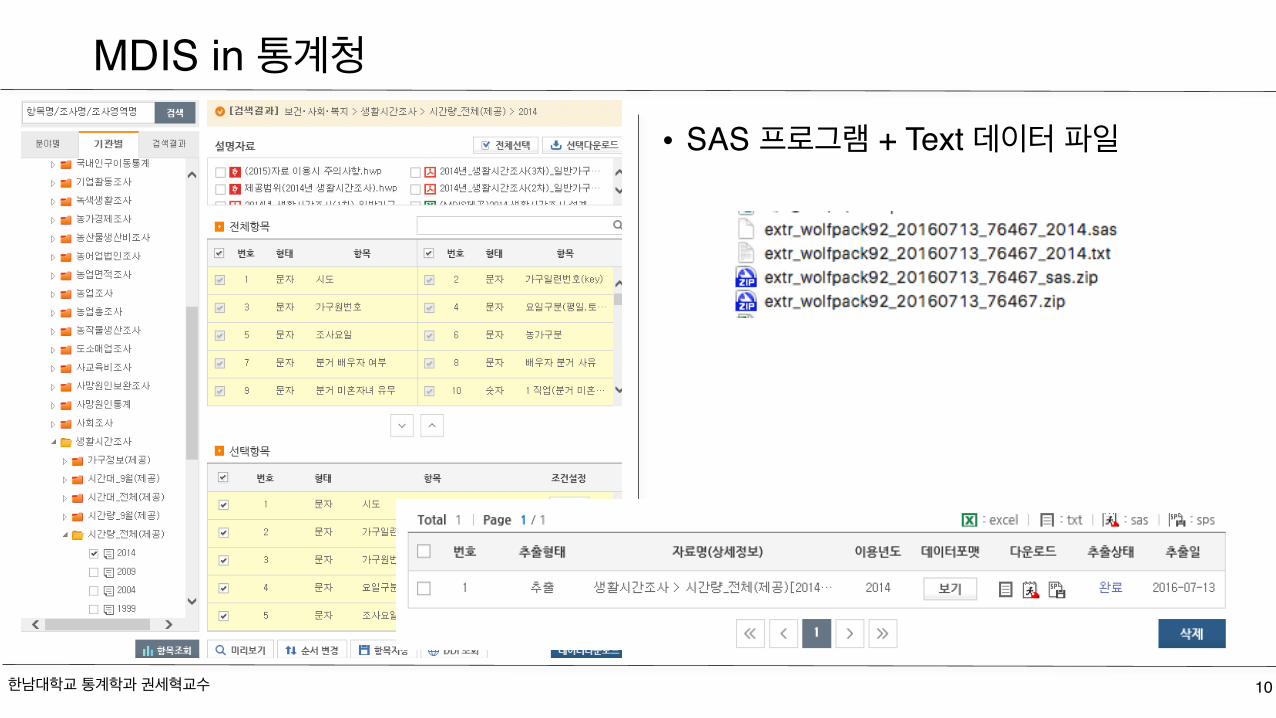
• SAS 프로그램 + Text 데이터 파일
한남대학교 통계학과 권세혁교수 10
MDIS in 통계청
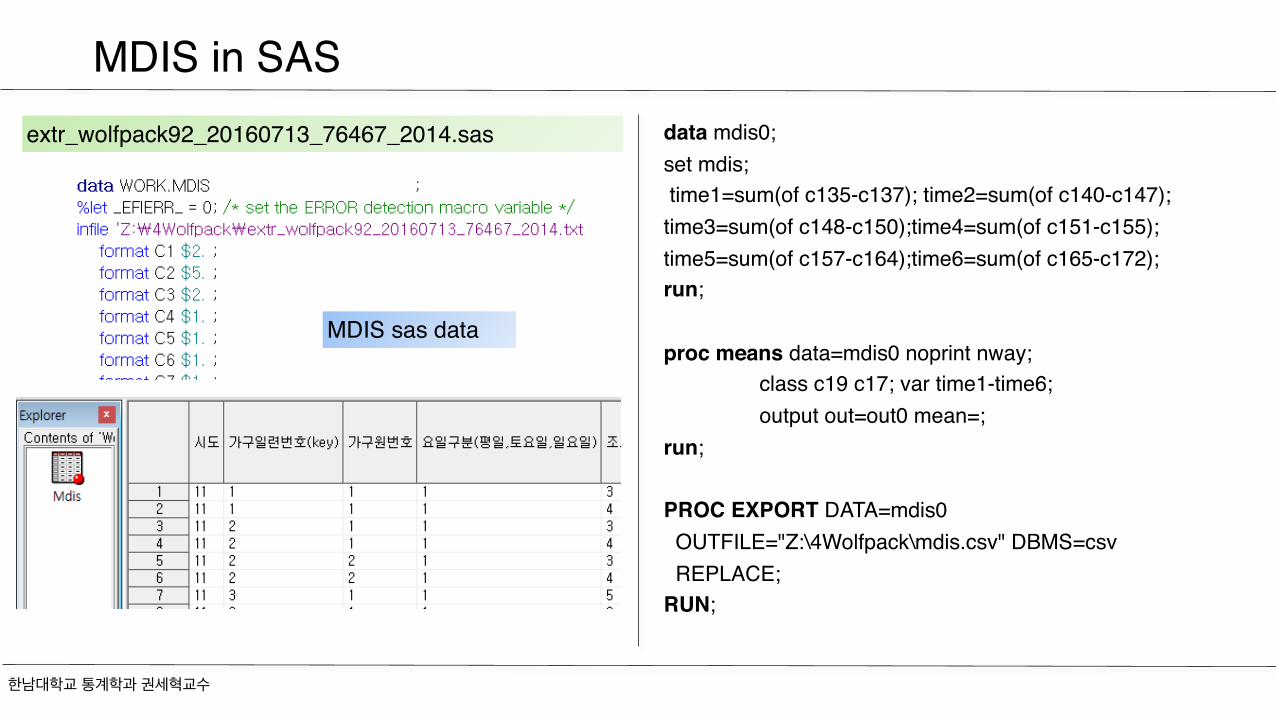
extr_wolfpack92_20160713_76467_2014.sas
한남대학교 통계학과 권세혁교수
MDIS in SAS
MDIS sas data
data mdis0;set mdis; time1=sum(of c135-c137); time2=sum(of c140-c147);time3=sum(of c148-c150);time4=sum(of c151-c155);time5=sum(of c157-c164);time6=sum(of c165-c172);run;
proc means data=mdis0 noprint nway;class c19 c17; var time1-time6;output out=out0 mean=;
run;
PROC EXPORT DATA=mdis0 OUTFILE="Z:\4Wolfpack\mdis.csv" DBMS=csv REPLACE; RUN;
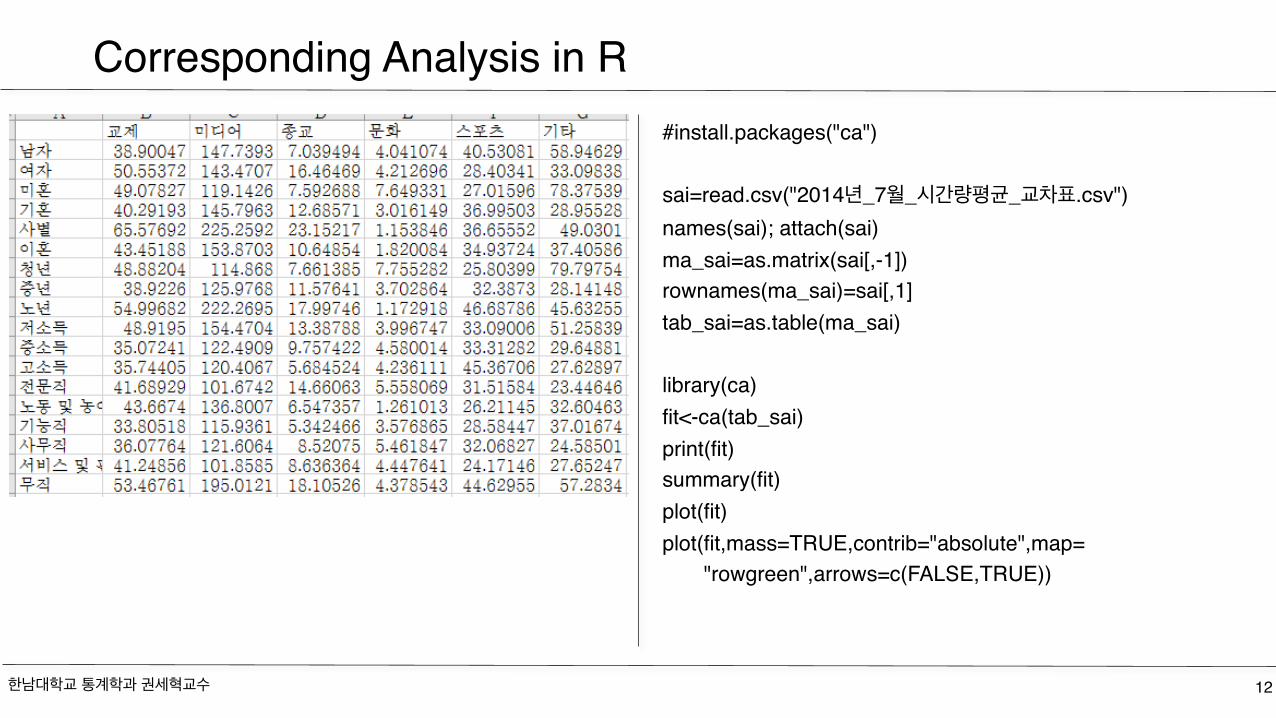
#install.packages("ca")
sai=read.csv("2014년_7월_시간량평균_교차표.csv")names(sai); attach(sai)ma_sai=as.matrix(sai[,-1])rownames(ma_sai)=sai[,1]tab_sai=as.table(ma_sai)
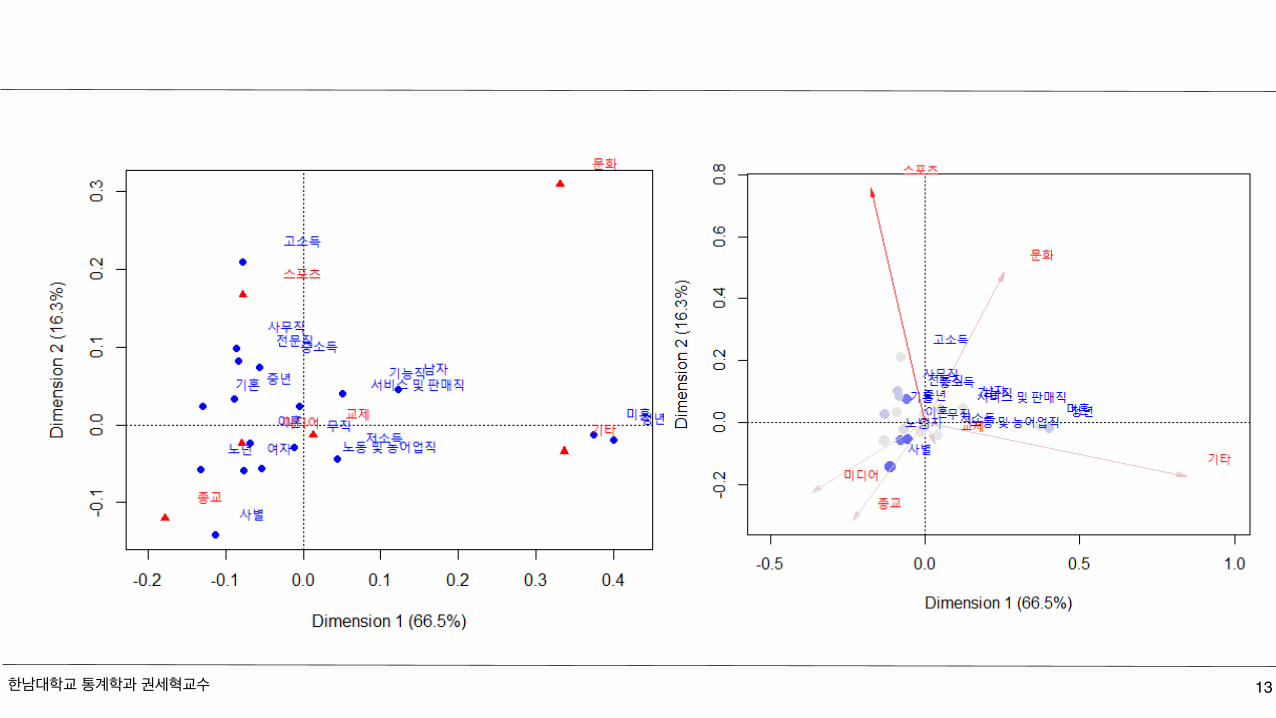
library(ca)fit<-ca(tab_sai)print(fit)summary(fit)plot(fit)plot(fit,mass=TRUE,contrib="absolute",map= "rowgreen",arrows=c(FALSE,TRUE))
한남대학교 통계학과 권세혁교수 12
Corresponding Analysis in R
한남대학교 통계학과 권세혁교수 13
한남대학교 통계학과 권세혁교수 14
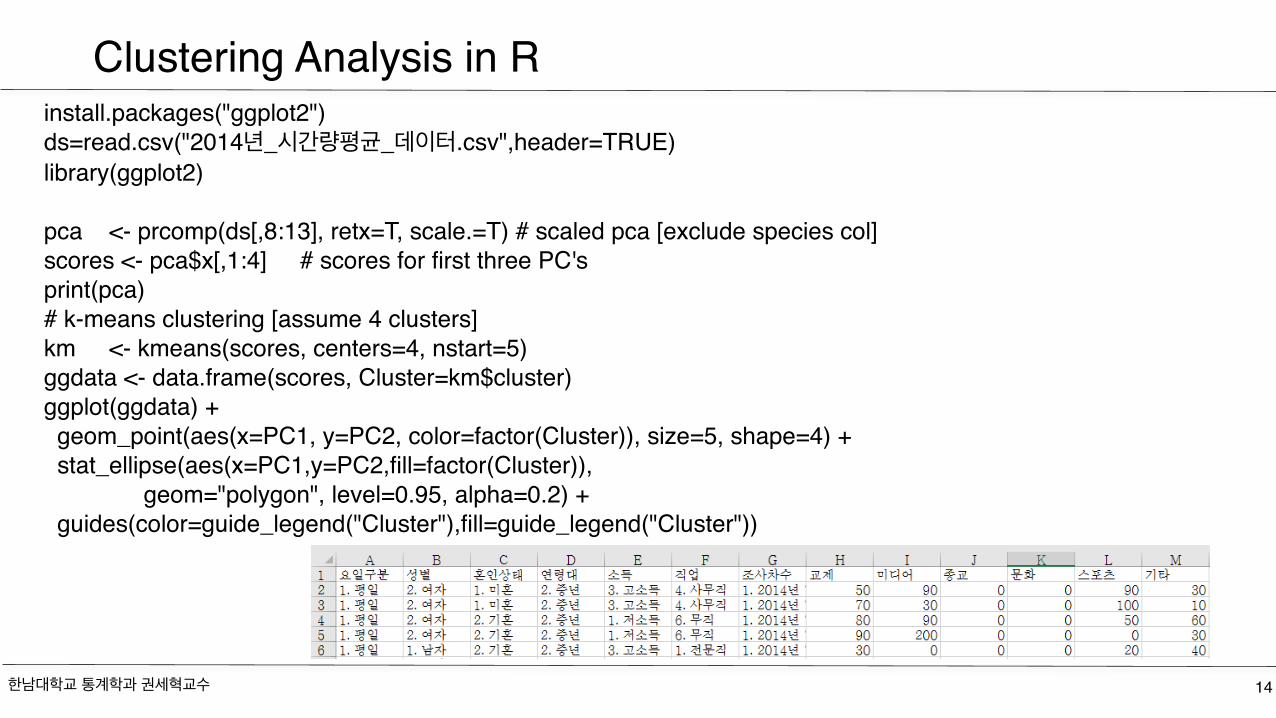
Clustering Analysis in Rinstall.packages("ggplot2")ds=read.csv("2014년_시간량평균_데이터.csv",header=TRUE)library(ggplot2)
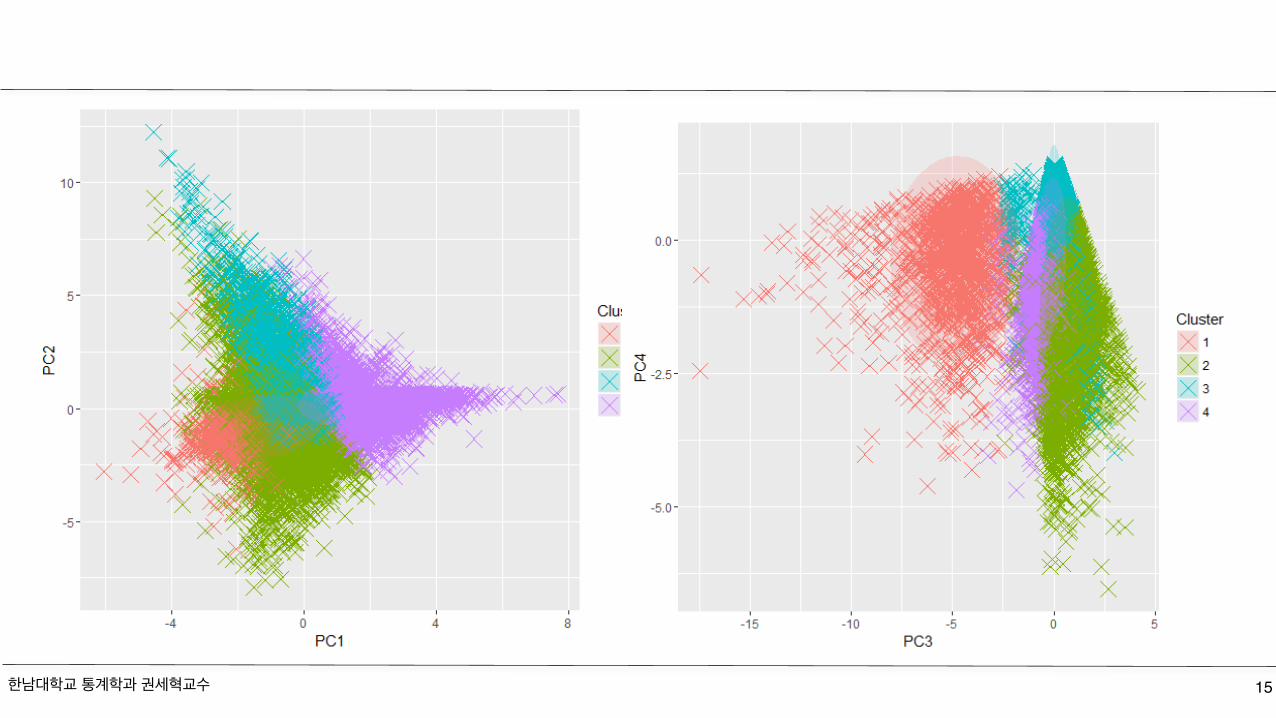
pca <- prcomp(ds[,8:13], retx=T, scale.=T) # scaled pca [exclude species col]scores <- pca$x[,1:4] # scores for first three PC'sprint(pca)# k-means clustering [assume 4 clusters]km <- kmeans(scores, centers=4, nstart=5)ggdata <- data.frame(scores, Cluster=km$cluster)ggplot(ggdata) + geom_point(aes(x=PC1, y=PC2, color=factor(Cluster)), size=5, shape=4) + stat_ellipse(aes(x=PC1,y=PC2,fill=factor(Cluster)), geom="polygon", level=0.95, alpha=0.2) + guides(color=guide_legend("Cluster"),fill=guide_legend("Cluster"))
한남대학교 통계학과 권세혁교수 15
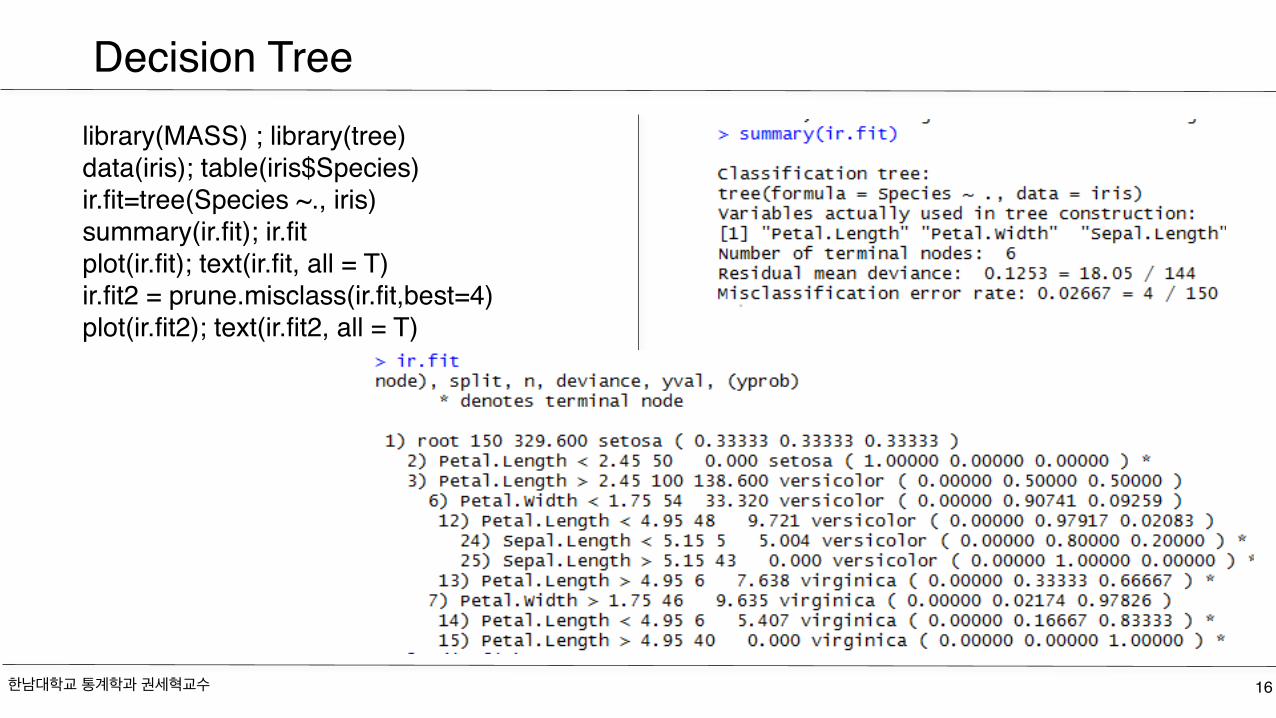
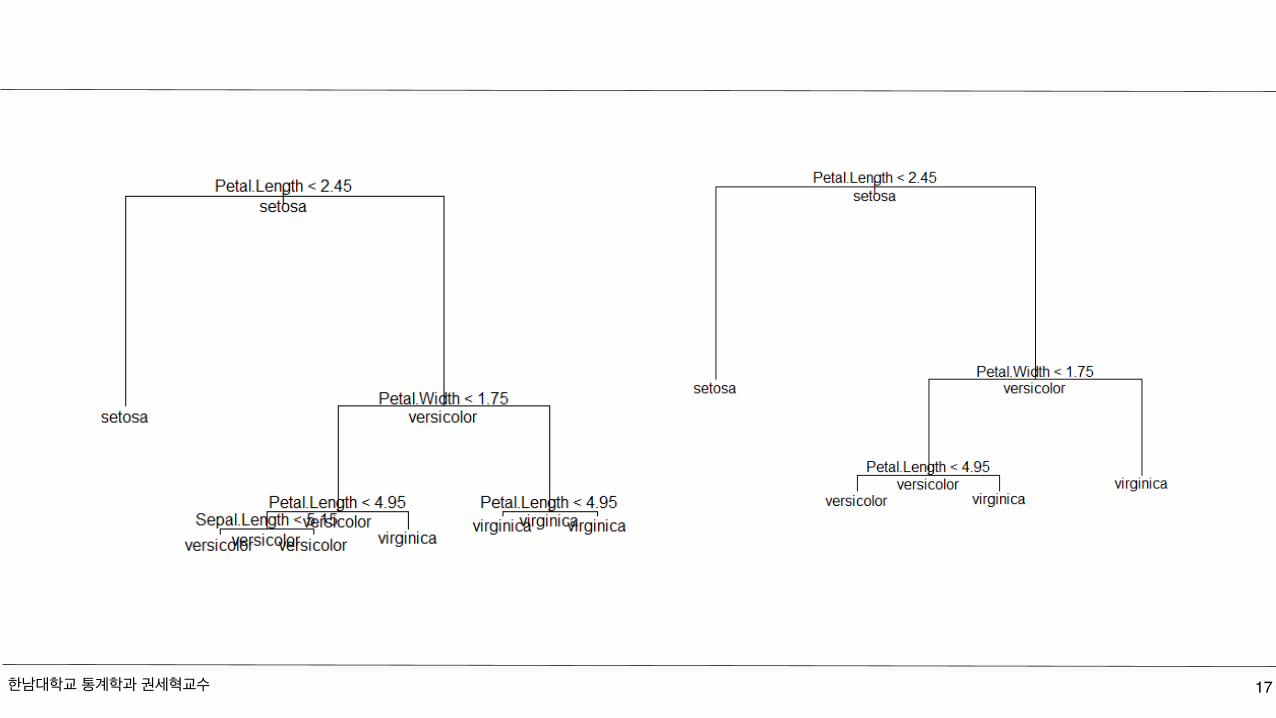
library(MASS) ; library(tree)data(iris); table(iris$Species)ir.fit=tree(Species ~., iris)summary(ir.fit); ir.fitplot(ir.fit); text(ir.fit, all = T)ir.fit2 = prune.misclass(ir.fit,best=4)plot(ir.fit2); text(ir.fit2, all = T)
한남대학교 통계학과 권세혁교수 16
Decision Tree
한남대학교 통계학과 권세혁교수 17
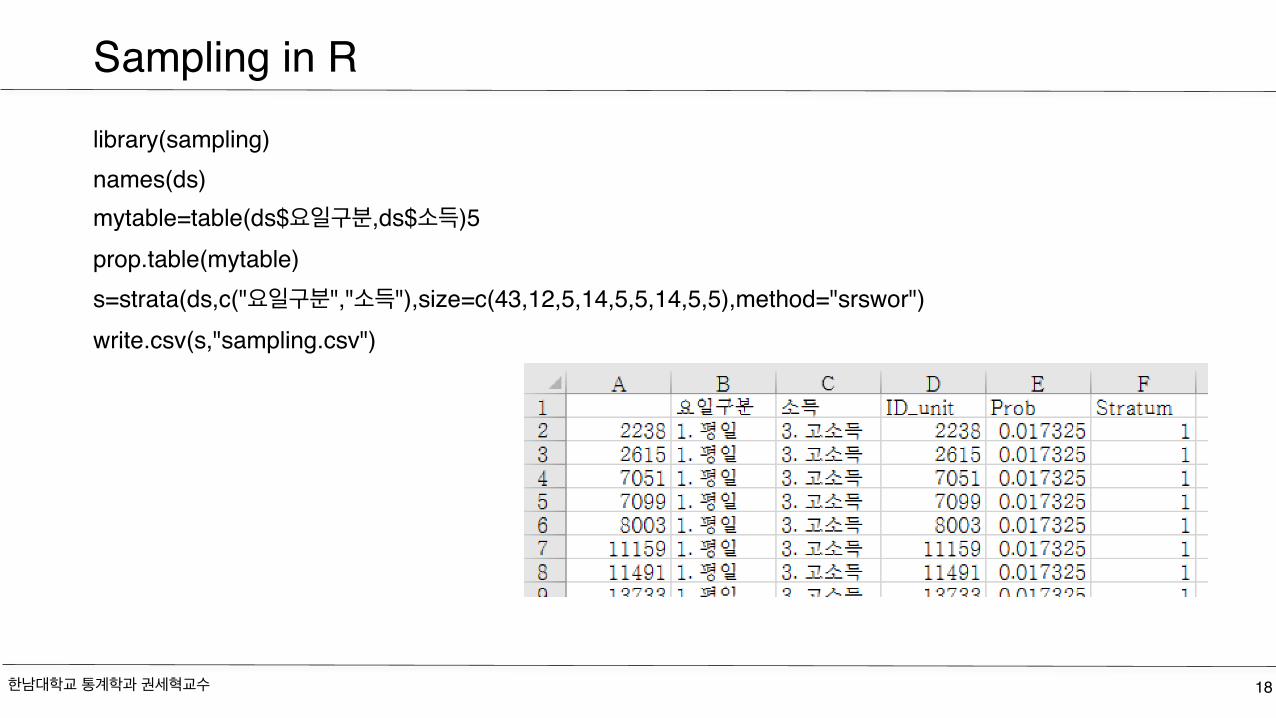
Sampling in Rlibrary(sampling)names(ds)mytable=table(ds$요일구분,ds$소득)5prop.table(mytable)s=strata(ds,c("요일구분","소득"),size=c(43,12,5,14,5,5,14,5,5),method="srswor")write.csv(s,"sampling.csv")
한남대학교 통계학과 권세혁교수 18


![[NDC2014] 친구들아 도와줘 - 다양한 툴을 이용해서 Cocos2d-x 생산성 높이기 (함동기)](https://img.pdfslide.tips/doc/110x75/58eff0ad1a28ab8e438b457f/ndc2014-cocos2d-x.jpg)


![[2013 체인지온] 당신의 비영리 우주선을 만들 때 필요한 자세 - 한운장](https://img.pdfslide.tips/doc/110x75/555a25c0d8b42a900d8b482b/2013--55849df535c32.jpg)
