Embed Size (px)
Citation preview
1
Ringvorlesung Bioorganische Chemie
Biomolekulare NMR-Spektroskopie
Armin GeyerFachbereich ChemiePhilipps-Universität
04. Feb. 20052
InhaltInhalt
1. Stunde (Studenten der Medizin, Folien 1-21)Wieso NMR ? Interpretation von NMR-Spektren Analyse von empfindlichen MolekülenFingerabdruck: Analyse von Molekülgemischen, von empfindlichen Molekülen in Gemischen (Cholesterin im Blut) Das NMR-Signal: FID (free induction decay), AudiofrequenzenStrukturaufklärung, 2D NMR Signale, große Moleküle
2. Stunde (Studenten der Chemie, Folien 22-64)Multinukleare NMR-Spektroskopie an Proteinen, Struktur + Dynamik = Funktion, Moleküle im Kristall und in Lösung, Cyclosporin A, Calonyctin A, Schleifenstrukturen in Proteinen, Peptidmimetika
Ringvorlesung Bioorganische Chemie
Biomolekulare NMR-Spektroskopie
3
Wieso NMR ?
A proton has achemical shift, an intensity, and a multiplicity.
NMR observables depend on molecular size and shape.
NMR methods observe the ligand and/or the receptor. Isotope labeling in the case of large molecules.
11H NMR:H NMR:Even strong
magnetic fields cannot resolve
all proton resonances of
a large molecule
4
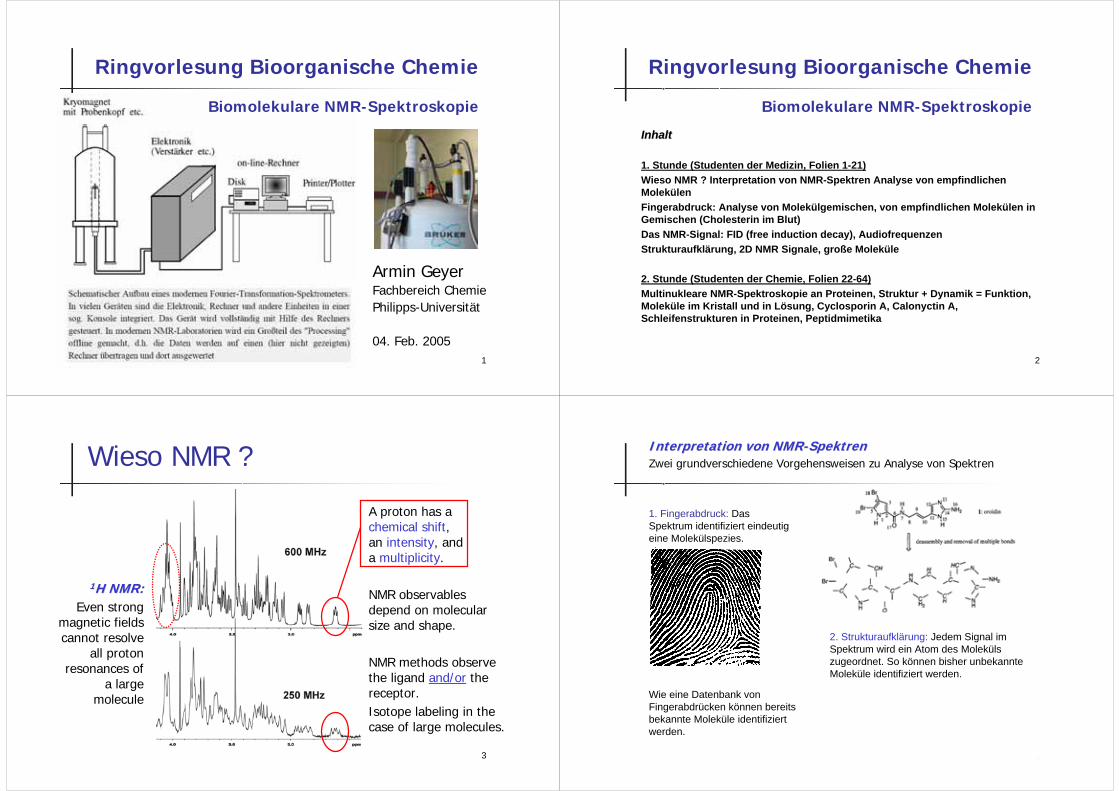
Interpretation von NMRInterpretation von NMR--SpektrenSpektrenZwei grundverschiedene Vorgehensweisen zu Analyse von Spektren
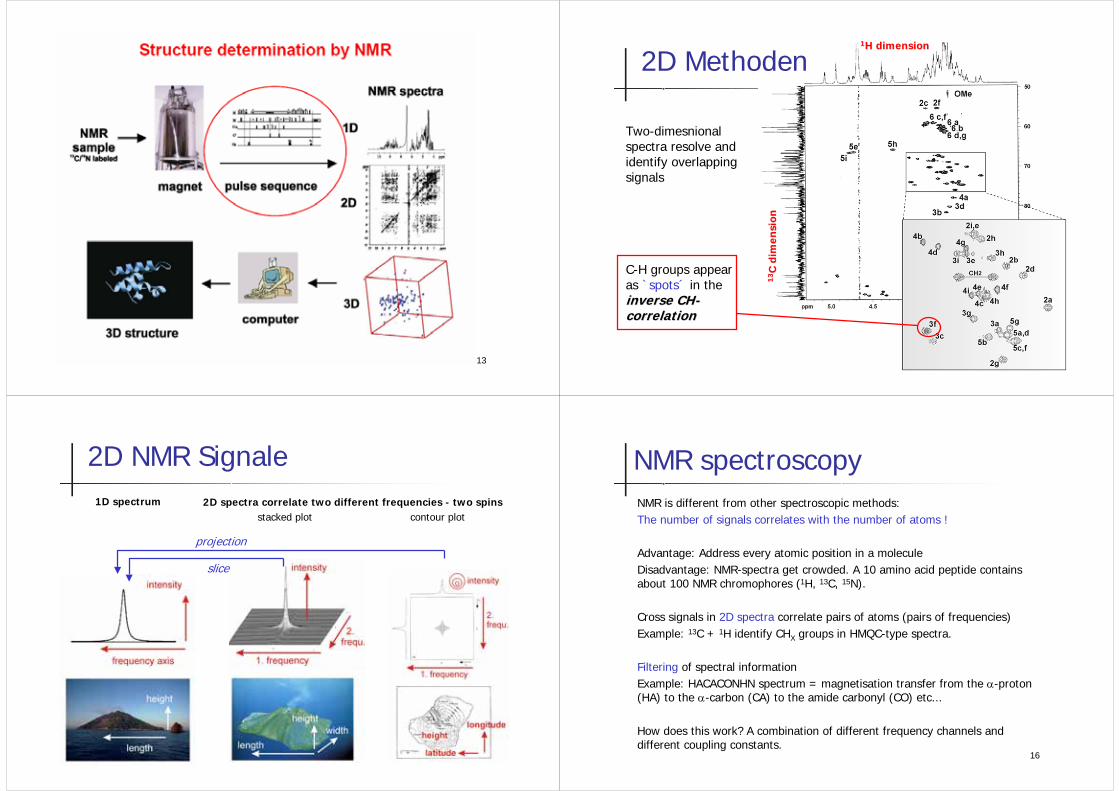
2. Strukturaufklärung: Jedem Signal im Spektrum wird ein Atom des Moleküls zugeordnet. So können bisher unbekannte Moleküle identifiziert werden.
Wie eine Datenbank von Fingerabdrücken können bereits bekannte Moleküle identifiziert werden.
1. Fingerabdruck: Das Spektrum identifiziert eindeutig eine Molekülspezies.
5
Analyse von empfindlichen MolekülenAnalyse von empfindlichen MolekülenFingerabdruck
6
Ladungsmuster und Immunstimulation
Lipoteichonsäure (LTA)
Analyse von empfindlichen MolekülenAnalyse von empfindlichen MolekülenFingerabdruck und Strukturanalyse S. Morath, A. Geyer, T. Hartung.
Structure-function relationship of cytokine induction by lipoteichoic acid from Staphylococcus aureus.J. Exp. Med. 2001, 193, 393-397.
70% D-Ala
7
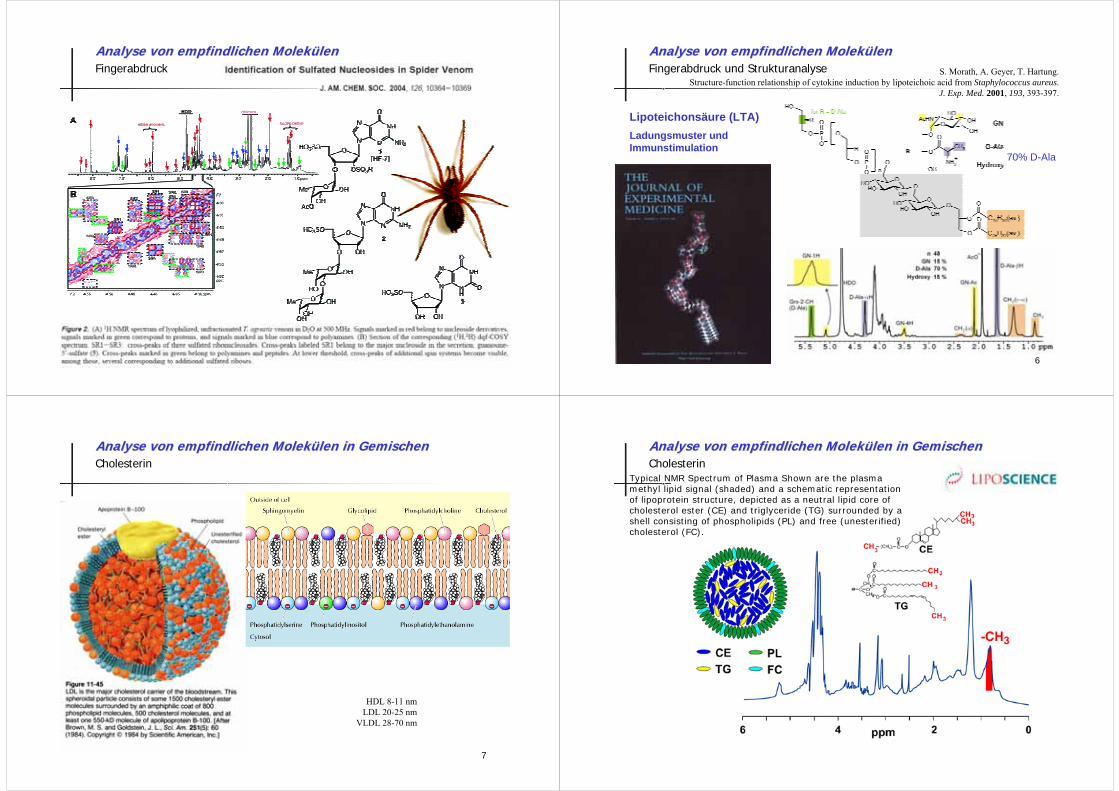
Analyse von empfindlichen Molekülen in GemischenAnalyse von empfindlichen Molekülen in GemischenCholesterin
HDL 8-11 nmLDL 20-25 nm
VLDL 28-70 nm
8
Analyse von empfindlichen Molekülen in GemischenAnalyse von empfindlichen Molekülen in GemischenCholesterin
Typical NMR Spectrum of Plasma Shown are the plasma methyl lipid signal (shaded) and a schematic representationof lipoprotein structure, depicted as a neutral lipid core ofcholesterol ester (CE) and triglyceride (TG) surrounded by ashell consisting of phospholipids (PL) and free (unesterified)cholesterol (FC).
9
Analyse von empfindlichen Molekülen in GemischenAnalyse von empfindlichen Molekülen in GemischenCholesterin
HDL 8-11 nmLDL 20-25 nm
VLDL 28-70 nm
Spreizung des Methylbereiches im 1H NMR zwischen 0.5 und 1 ppm
10
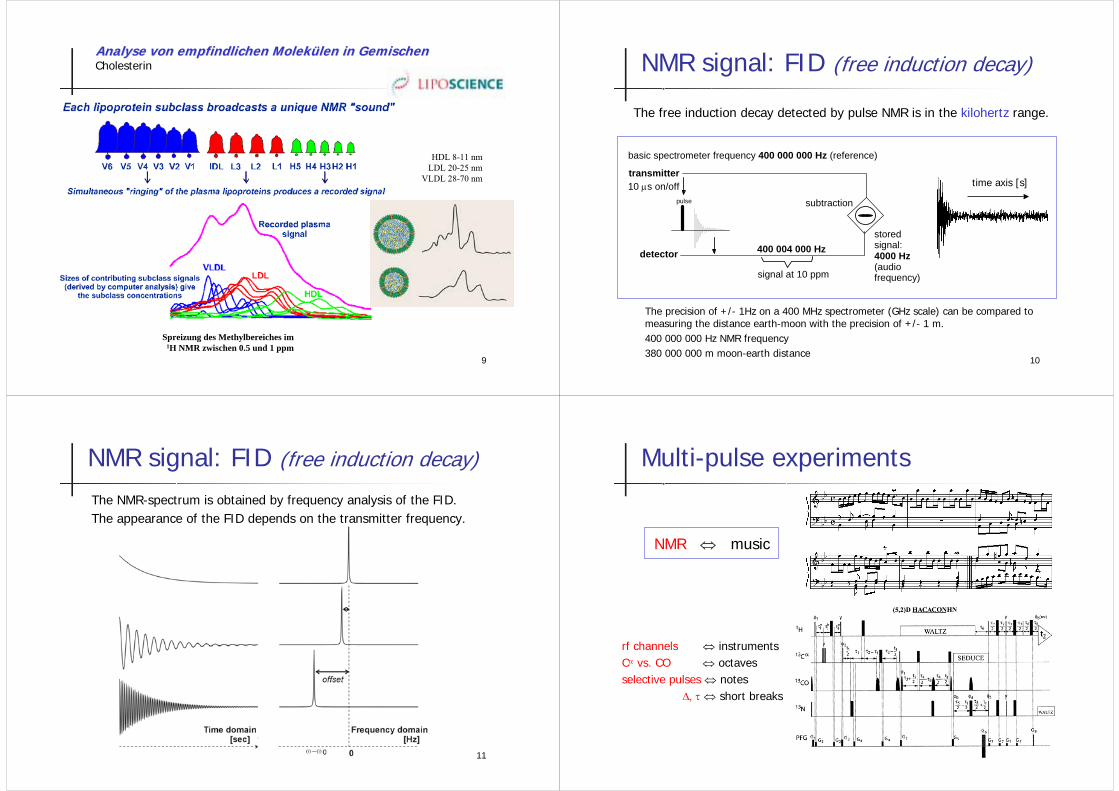
NMR signal: FID (free induction decay)
time axis [s]
The free induction decay detected by pulse NMR is in the kilohertz range.
The precision of +/- 1Hz on a 400 MHz spectrometer (GHz scale) can be compared tomeasuring the distance earth-moon with the precision of +/- 1 m.400 000 000 Hz NMR frequency380 000 000 m moon-earth distance
pulse
basic spectrometer frequency 400 000 000 Hz (reference)
10 µs on/off
400 004 000 Hz
signal at 10 ppm
stored signal: 4000 Hz (audio frequency)
subtraction
detector
transmitter
11
The NMR-spectrum is obtained by frequency analysis of the FID. The appearance of the FID depends on the transmitter frequency.
NMR signal: FID (free induction decay)
12
NMR ⇔ music
rf channels ⇔ instrumentsCα vs. CO ⇔ octavesselective pulses ⇔ notes
∆, τ ⇔ short breaks
Multi-pulse experiments
13 14
2D Methoden
Two-dimesnional spectra resolve andidentify overlapping signals
C-H groups appear as `spots´ in the inverseinverse CHCH--correlationcorrelation
11HH dimensiondimension
1313 CC
dim
ensi
ondi
men
sion
15
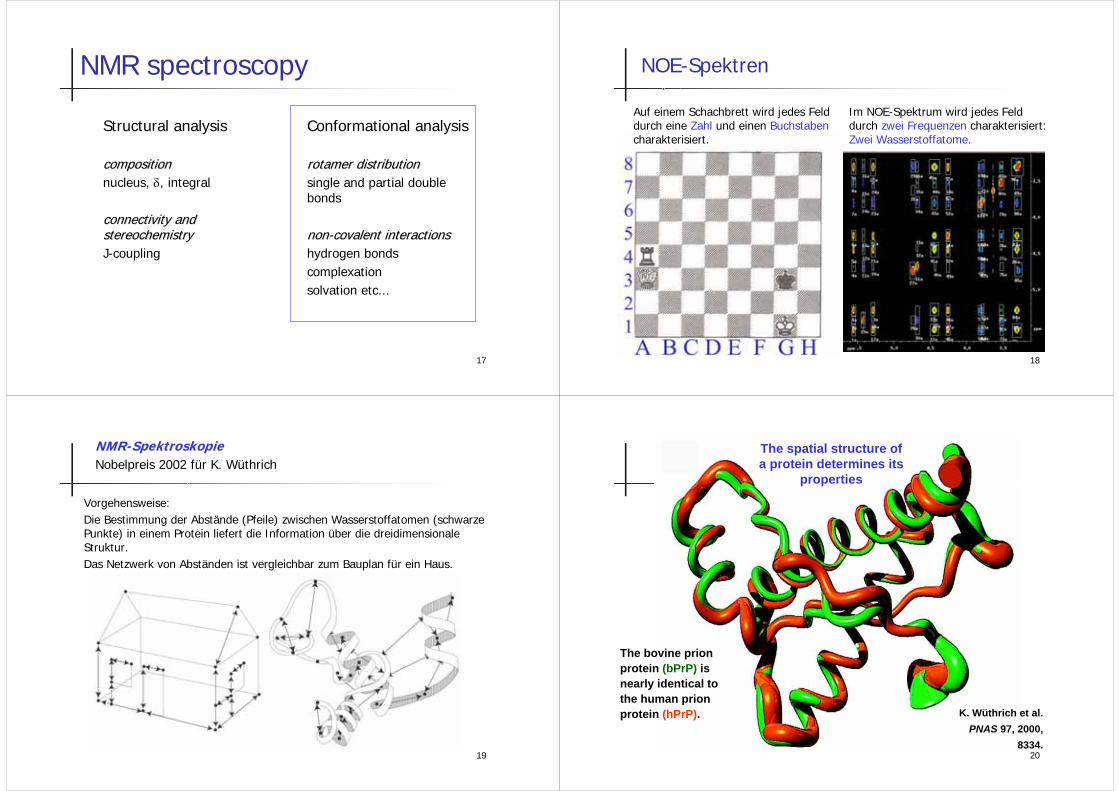
1D spectrum
projection
slice
2D spectra correlate two different frequencies - two spinsstacked plot contour plot
2D NMR Signale
16
NMR spectroscopyNMR is different from other spectroscopic methods:The number of signals correlates with the number of atoms !
Advantage: Address every atomic position in a moleculeDisadvantage: NMR-spectra get crowded. A 10 amino acid peptide contains about 100 NMR chromophores (1H, 13C, 15N).
Cross signals in 2D spectra correlate pairs of atoms (pairs of frequencies)Example: 13C + 1H identify CHX groups in HMQC-type spectra.
Filtering of spectral informationExample: HACACONHN spectrum = magnetisation transfer from the α-proton(HA) to the α-carbon (CA) to the amide carbonyl (CO) etc...
How does this work? A combination of different frequency channels anddifferent coupling constants.
17
NMR spectroscopy
Structural analysis
compositioncompositionnucleus, δ, integral
connectivityconnectivity andandstereochemistrystereochemistryJ-coupling
Conformational analysis
rotamer distributionrotamer distributionsingle and partial doublebonds
nonnon--covalent interactions covalent interactions hydrogen bondscomplexationsolvation etc...
18
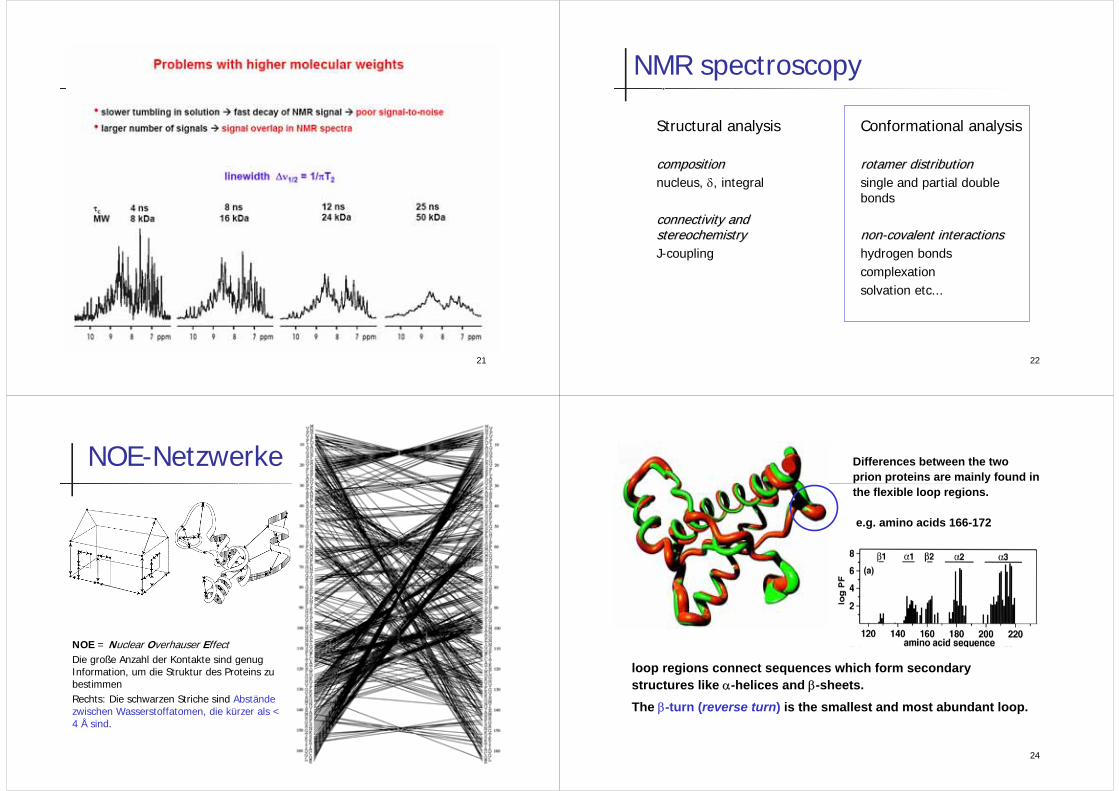
NOE-Spektren
Im NOE-Spektrum wird jedes Feld durch zwei Frequenzen charakterisiert: Zwei Wasserstoffatome.
Auf einem Schachbrett wird jedes Feld durch eine Zahl und einen Buchstaben charakterisiert.
19
Vorgehensweise:Die Bestimmung der Abstände (Pfeile) zwischen Wasserstoffatomen (schwarze Punkte) in einem Protein liefert die Information über die dreidimensionale Struktur. Das Netzwerk von Abständen ist vergleichbar zum Bauplan für ein Haus.
NMRNMR--SpektroskopieSpektroskopieNobelpreis 2002 für K. Wüthrich
20
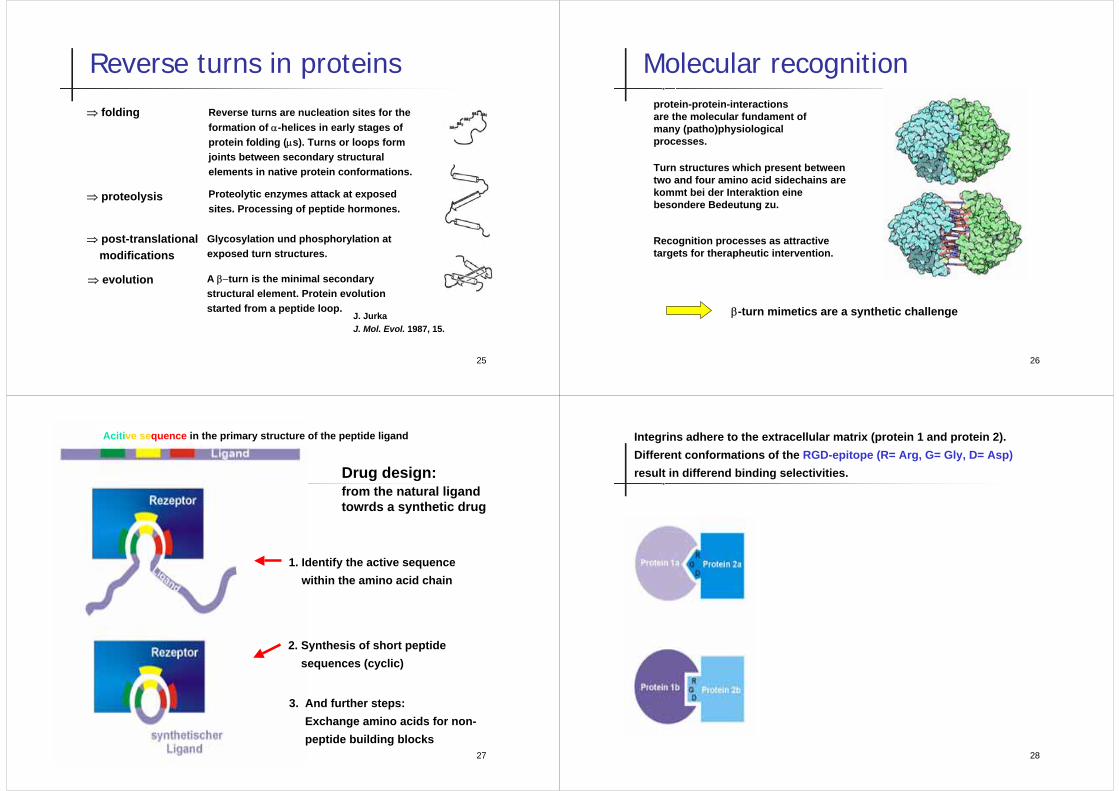
The bovine prion protein (bPrP) is nearly identical tothe human prion protein (hPrP). K. Wüthrich et al.
PNAS 97, 2000, 8334.
The spatial structure of a protein determines its
properties
21 22
NMR spectroscopy
Structural analysis
compositioncompositionnucleus, δ, integral
connectivityconnectivity andandstereochemistrystereochemistryJ-coupling
Conformational analysis
rotamer distributionrotamer distributionsingle and partial doublebonds
nonnon--covalent interactions covalent interactions hydrogen bondscomplexationsolvation etc...
23
NOE-Netzwerke
NOE = Nuclear Overhauser EffectDie große Anzahl der Kontakte sind genug Information, um die Struktur des Proteins zu bestimmenRechts: Die schwarzen Striche sind Abstände zwischen Wasserstoffatomen, die kürzer als < 4 Å sind.
24
Differences between the two prion proteins are mainly found inthe flexible loop regions.
e.g. amino acids 166-172
loop regions connect sequences which form secondary structures like α-helices and β-sheets.The β-turn (reverse turn) is the smallest and most abundant loop.
25
⇒ folding
Glycosylation und phosphorylation at exposed turn structures.
⇒ post-translationalmodifications
Reverse turns are nucleation sites for theformation of α-helices in early stages of protein folding (µs). Turns or loops formjoints between secondary structural elements in native protein conformations.
⇒ proteolysis Proteolytic enzymes attack at exposedsites. Processing of peptide hormones.
A β−turn is the minimal secondary structural element. Protein evolution started from a peptide loop.
⇒ evolution
J. Jurka J. Mol. Evol. 1987, 15.
Reverse turns in proteins
26
protein-protein-interactionsare the molecular fundament of many (patho)physiologicalprocesses.
Recognition processes as attractivetargets for therapheutic intervention.
Turn structures which present betweentwo and four amino acid sidechains arekommt bei der Interaktion eine besondere Bedeutung zu.
β-turn mimetics are a synthetic challenge
Molecular recognition
27
Drug design: from the natural ligand towrds a synthetic drug
1. Identify the active sequencewithin the amino acid chain
3. And further steps:Exchange amino acids for non-peptide building blocks
2. Synthesis of short peptidesequences (cyclic)
Acitive sequence in the primary structure of the peptide ligand
28
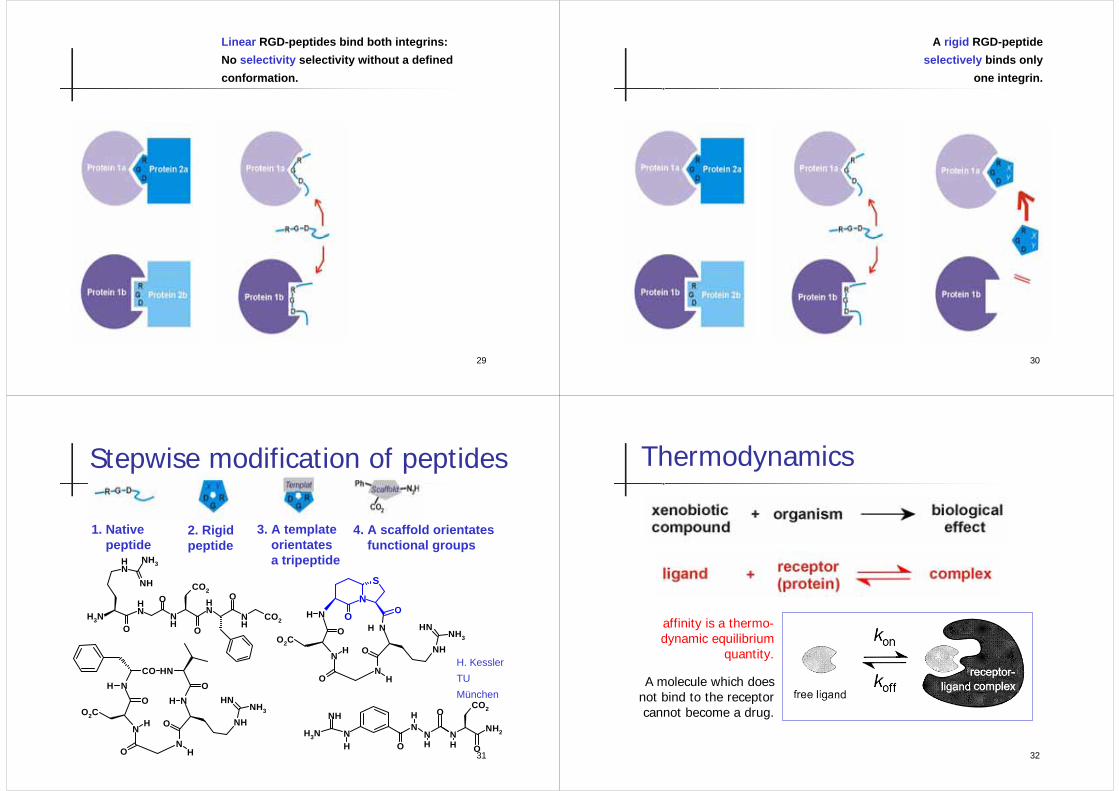
Integrins adhere to the extracellular matrix (protein 1 and protein 2). Different conformations of the RGD-epitope (R= Arg, G= Gly, D= Asp) result in differend binding selectivities.
29
Linear RGD-peptides bind both integrins: No selectivity selectivity without a defined conformation.
30
A rigid RGD-peptideselectively binds only
one integrin.
31
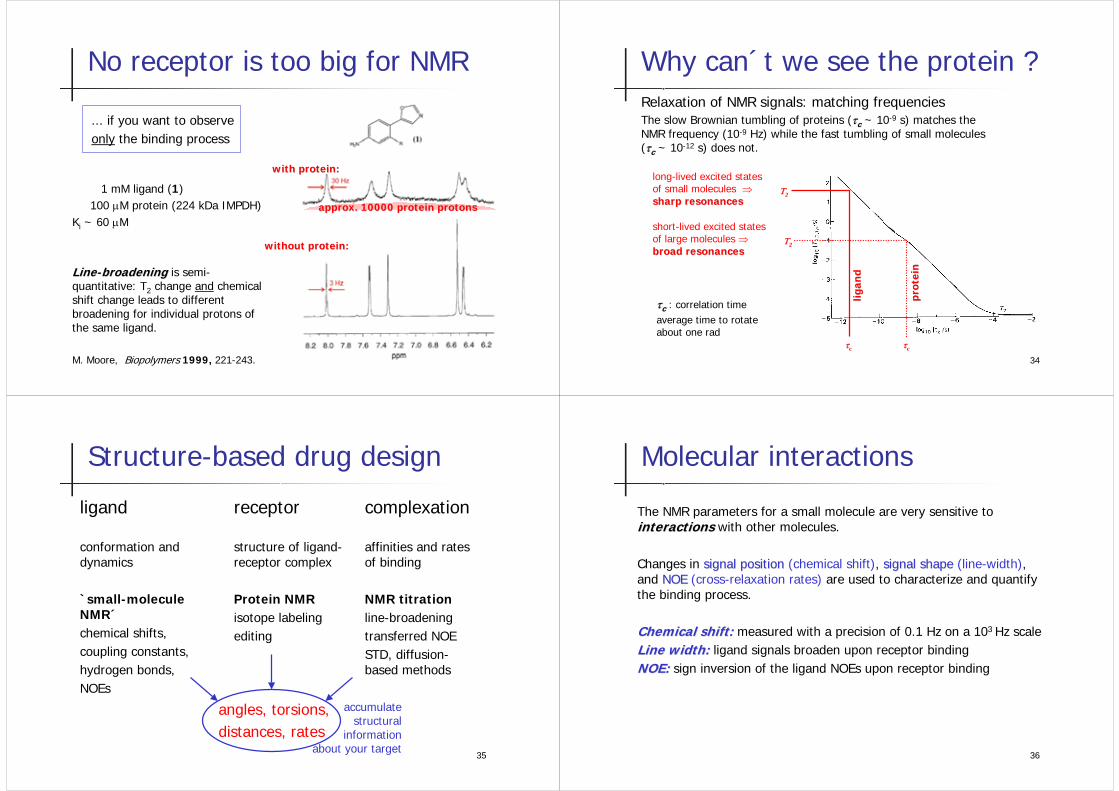
4. A scaffold orientates functional groups
1. Nativepeptide
2. Rigid peptide
3. A templateorientates a tripeptide
H3N
NH NH3
NH
NH
ONH
O
O
NH
CO2O
NH
CO2
NO
NH2
CO2
NH
NH
H3NO
NN
OH
H H
H. KesslerTU München
NHNH3
NHO2C
S
N
O
N
O
H
N
O
H
N H
O
NH
O
NHNH3
NH
N
O
H
HN
NO
H
N H
O
NCO
HO
O2C
Stepwise modification of peptides
32
Thermodynamics
affinity is a thermo-dynamic equilibrium
quantity.
A molecule which does not bind to the receptor cannot become a drug.
33
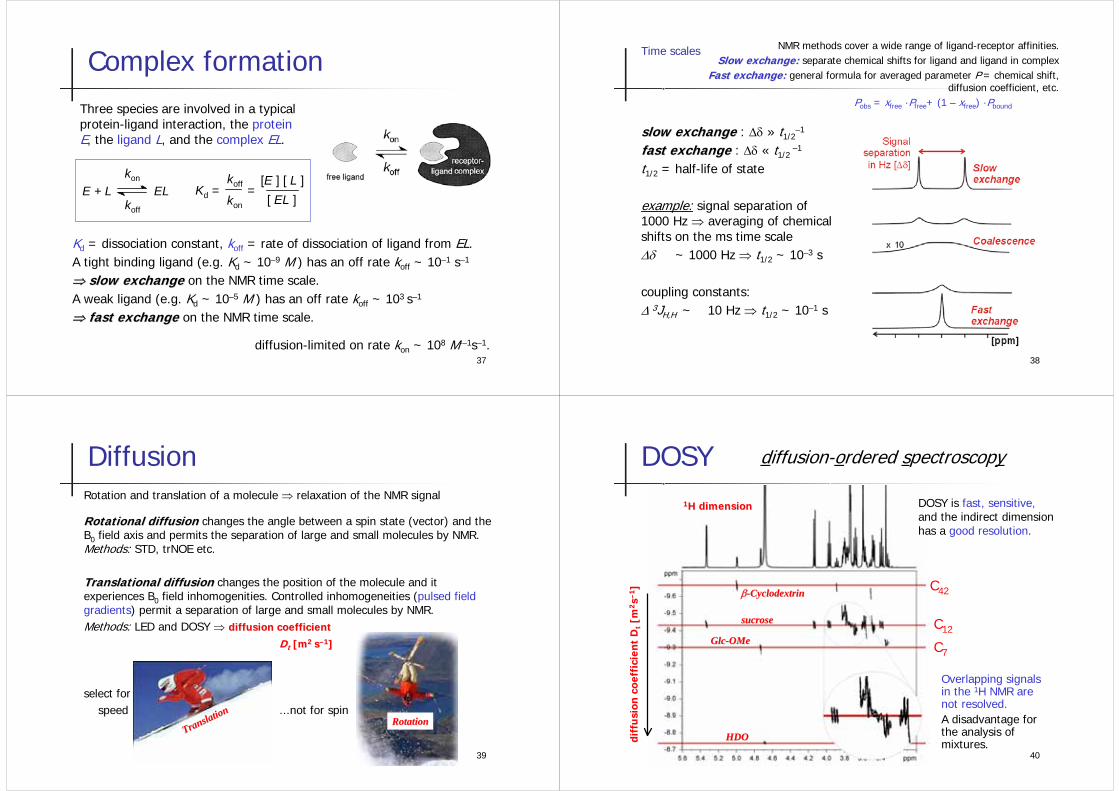
No receptor is too big for NMR
... if you want to observe only the binding process
1 mM ligand (1)100 µM protein (224 kDa IMPDH)
Ki ~ 60 µM
LineLine--broadeningbroadening is semi-quantitative: T2 change and chemical shift change leads to differentbroadening for individual protons ofthe same ligand.
M. Moore, Biopolymers 1999, 221-243.
without proteinwithout protein::
with proteinwith protein::
approxapprox. 10000. 10000 protein protonsprotein protons
34
Why can´t we see the protein ?Relaxation of NMR signals: matching frequencies The slow Brownian tumbling of proteins (ττcc ~ 10-9 s) matches theNMR frequency (10-9 Hz) while the fast tumbling of small molecules(ττcc ~ 10-12 s) does not.
long-lived excited statesof small molecules ⇒sharp resonancessharp resonances
short-lived excited statesof large molecules ⇒broad resonancesbroad resonances
ττcc
prot
ein
prot
ein
ligan
dlig
and
ττcc
ΤΤ22
ΤΤ22
ττcc : correlation timeaverage time to rotate about one rad
35
Structure-based drug design
ligand
conformation anddynamics
`small-moleculeNMR´chemical shifts, coupling constants,hydrogen bonds,NOEs
receptor
structure of ligand-receptor complex
Protein NMRisotope labelingediting
complexation
affinities and ratesof binding
NMR titrationline-broadeningtransferred NOESTD, diffusion-based methods
angles, torsions,distances, rates
accumulate structural
information about your target
36
Molecular interactions
The NMR parameters for a small molecule are very sensitive tointeractionsinteractions with other molecules.
Changes in signal positionsignal position (chemical shift), signal shapesignal shape (line-width), and NOENOE (cross-relaxation rates) are used to characterize and quantify the binding process.
Chemical shiftChemical shift:: measured with a precision of 0.1 Hz on a 103 Hz scaleLineLine widthwidth:: ligand signals broaden upon receptor bindingNOE:NOE: sign inversion of the ligand NOEs upon receptor binding
37
Complex formationThree species are involved in a typicalprotein-ligand interaction, the proteinE, the ligand L, and the complex EL.
Kd = dissociation constant, koff = rate of dissociation of ligand from EL. A tight binding ligand (e.g. Kd ~ 10–9 M ) has an off rate koff ~ 10–1 s–1
⇒⇒ slow exchangeslow exchange on the NMR time scale.A weak ligand (e.g. Kd ~ 10–5 M ) has an off rate koff ~ 103 s–1
⇒⇒ fastfast exchangeexchange on the NMR time scale.
diffusion-limited on rate kon ~ 108 M-–1s–1.
kon
koffKd = =[ EL ]
[E ] [ L ]E + L EL
kon
koff
38
Time scales
slow exchangeslow exchange : ∆δ » t1/2–1
fastfast exchangeexchange : ∆δ « t1/2 –1
t1/2 = half-life of state
example: signal separation of 1000 Hz ⇒ averaging of chemical shifts on the ms time scale∆δ ~ 1000 Hz ⇒ t1/2 ~ 10–3 s
coupling constants:∆ 3JH,H ~ 10 Hz ⇒ t1/2 ~ 10–1 s
NMR methods cover a wide range of ligand-receptor affinities.Slow exchangeSlow exchange:: separate chemical shifts for ligand and ligand in complex
FastFast exchangeexchange:: general formula for averaged parameter P = chemical shift,diffusion coefficient, etc.
Pobs = xfree ·Pfree+ (1 – xfree) ·Pbound
39
DiffusionRotation and translation of a molecule ⇒ relaxation of the NMR signal
Rotational diffusionRotational diffusion changes the angle between a spin state (vector) and theB0 field axis and permits the separation of large and small molecules by NMR.Methods: STD, trNOE etc.
Translational diffusionTranslational diffusion changes the position of the molecule and it experiences B0 field inhomogenities. Controlled inhomogeneities (pulsed field gradients) permit a separation of large and small molecules by NMR.Methods: LED and DOSY ⇒ diffusion coefficientdiffusion coefficient
DDtt [m[m2 2 ss––11]]
select for speed ...not for spin
RotationRotationTranslation
Translation
40
DOSY
HDOHDO
GlcGlc--OMeOMe
sucrosesucrose
ββ--CyclodextrinCyclodextrin
diffusion-ordered spectroscopy
11HH dimensiondimension
diff
usi
on c
oeff
icie
nt
Ddi
ffu
sion
coe
ffic
ien
t D
tt[m[m
22 ss––
11 ]]
Overlapping signalsin the 1H NMR are not resolved.A disadvantage for the analysis ofmixtures.
DOSY is fast, sensitive, and the indirect dimensionhas a good resolution.
C42
C12
C7
41 42
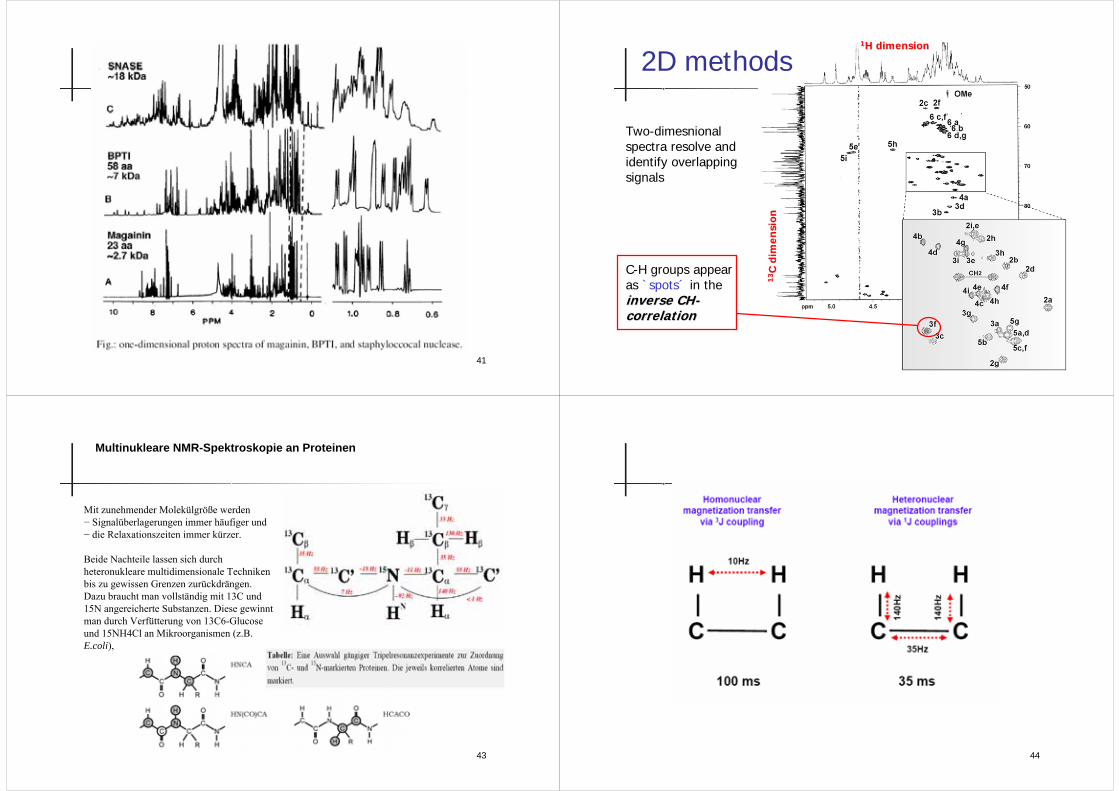
2D methods
Two-dimesnional spectra resolve andidentify overlapping signals
C-H groups appear as `spots´ in the inverseinverse CHCH--correlationcorrelation
11HH dimensiondimension
1313 CC
dim
ensi
ondi
men
sion
43
Multinukleare NMR-Spektroskopie an Proteinen
Mit zunehmender Molekülgröße werden − Signalüberlagerungen immer häufiger und − die Relaxationszeiten immer kürzer.
Beide Nachteile lassen sich durch heteronukleare multidimensionale Techniken bis zu gewissen Grenzen zurückdrängen. Dazu braucht man vollständig mit 13C und 15N angereicherte Substanzen. Diese gewinnt man durch Verfütterung von 13C6-Glucose und 15NH4Cl an Mikroorganismen (z.B. E.coli),
44
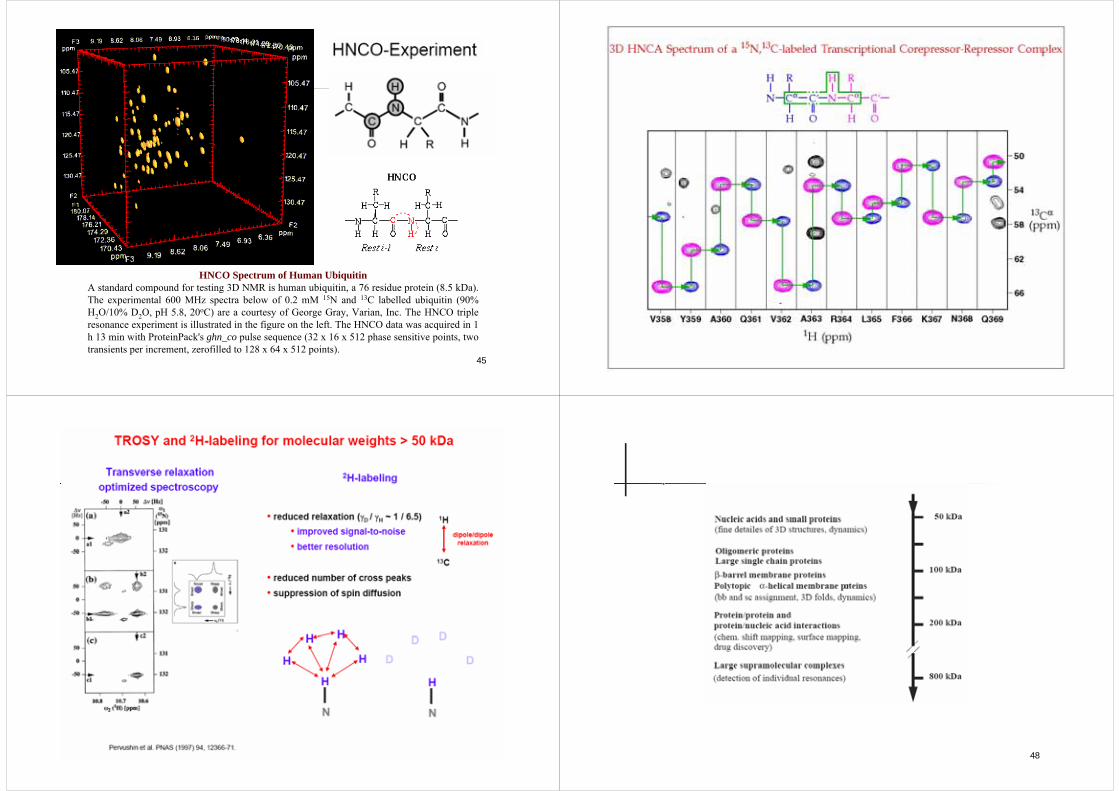
45
HNCO Spectrum of Human UbiquitinA standard compound for testing 3D NMR is human ubiquitin, a 76 residue protein (8.5 kDa).The experimental 600 MHz spectra below of 0.2 mM 15N and 13C labelled ubiquitin (90% H2O/10% D2O, pH 5.8, 20oC) are a courtesy of George Gray, Varian, Inc. The HNCO triple resonance experiment is illustrated in the figure on the left. The HNCO data was acquired in 1 h 13 min with ProteinPack's ghn_co pulse sequence (32 x 16 x 512 phase sensitive points, two transients per increment, zerofilled to 128 x 64 x 512 points).
46
47 48
49
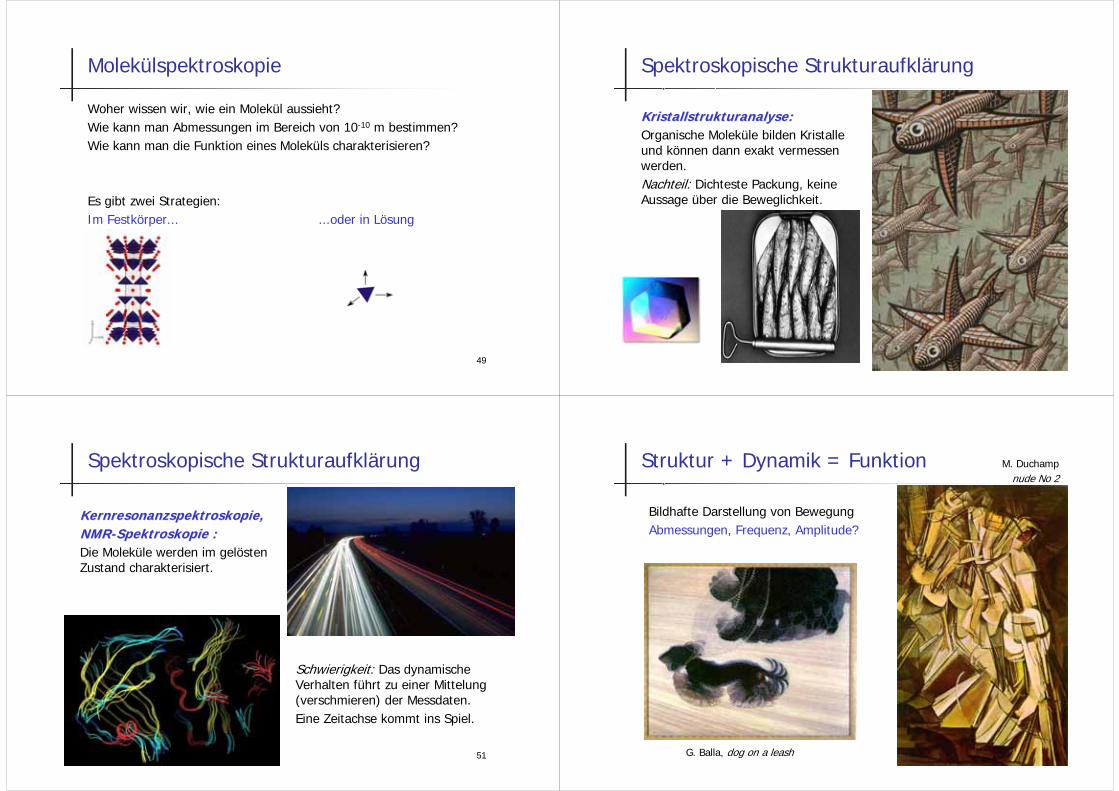
Molekülspektroskopie
Woher wissen wir, wie ein Molekül aussieht?Wie kann man Abmessungen im Bereich von 10-10 m bestimmen?Wie kann man die Funktion eines Moleküls charakterisieren?
Es gibt zwei Strategien:Im Festkörper... ...oder in Lösung
50
Spektroskopische Strukturaufklärung
Kristallstrukturanalyse:Kristallstrukturanalyse:Organische Moleküle bilden Kristalle und können dann exakt vermessen werden.Nachteil: Dichteste Packung, keine Aussage über die Beweglichkeit.
51
Spektroskopische Strukturaufklärung
Kernresonanzspektroskopie,Kernresonanzspektroskopie,NMRNMR--Spektroskopie :Spektroskopie :Die Moleküle werden im gelösten Zustand charakterisiert.
Schwierigkeit: Das dynamische Verhalten führt zu einer Mittelung (verschmieren) der Messdaten.Eine Zeitachse kommt ins Spiel.
52
Struktur + Dynamik = Funktion
Bildhafte Darstellung von BewegungAbmessungen, Frequenz, Amplitude?
M. Duchampnude No 2
G. Balla, dog on a leash
53
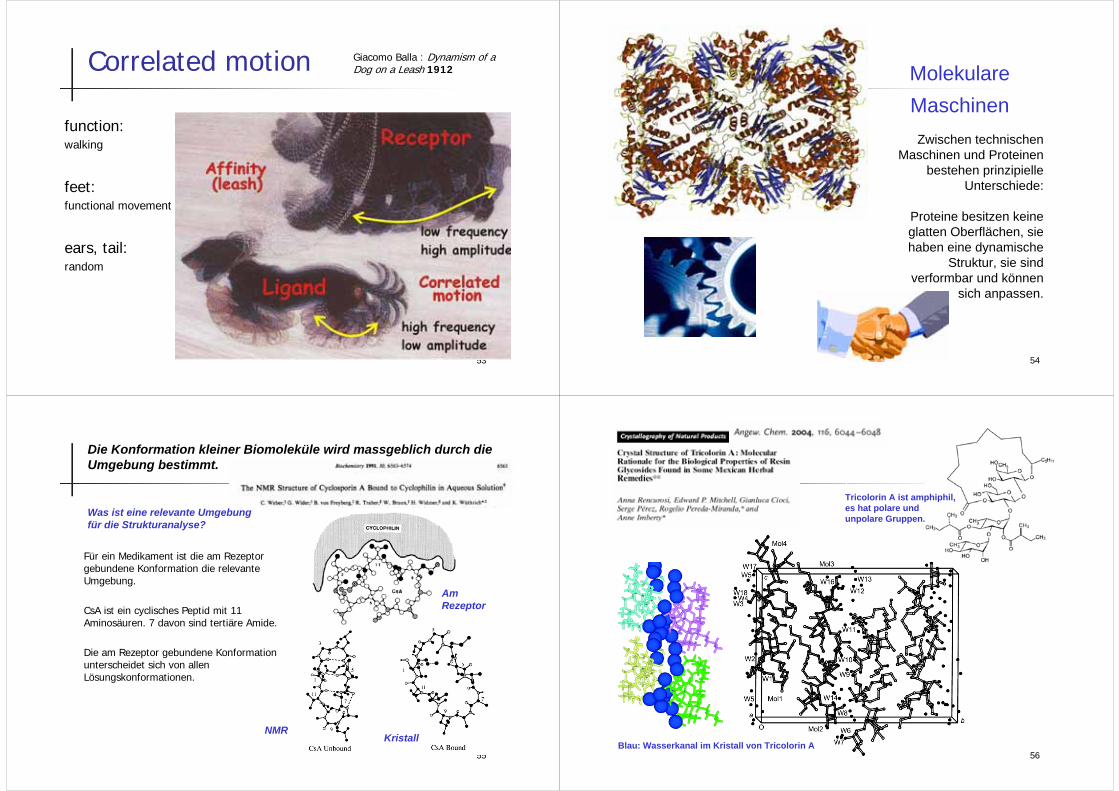
Correlated motion
function:walking
feet:functional movement
ears, tail:random
Giacomo Balla : Dynamism of a Dog on a Leash 1912
54
Molekulare Maschinen
Zwischen technischen Maschinen und Proteinen
bestehen prinzipielle Unterschiede:
Proteine besitzen keine glatten Oberflächen, sie haben eine dynamische
Struktur, sie sind verformbar und können
sich anpassen.
55
Die Konformation kleiner Biomoleküle wird massgeblich durch die Umgebung bestimmt.
Was ist eine relevante Umgebungfür die Strukturanalyse?
Für ein Medikament ist die am Rezeptor gebundene Konformation die relevante Umgebung.
CsA ist ein cyclisches Peptid mit 11 Aminosäuren. 7 davon sind tertiäre Amide.
Die am Rezeptor gebundene Konformationunterscheidet sich von allen Lösungskonformationen.
NMRKristall
Am Rezeptor
56Blau: Wasserkanal im Kristall von Tricolorin A
Tricolorin A ist amphiphil, es hat polare und unpolare Gruppen.
57
...The hydrophobic surface exposed externally and elongated along the axis of the water channel is ideally oriented for parallelinteraction with the lipids of a biological membrane upon insertion of tricolorin A into the membrane. This hypothesis differs from predictions made by molecular dynamics simulationsand NMR studies of micellar solutions of calonyctin A, anotherplant-growth-regulating resin glycoside,[18] which inserts perpendicularly into micelle lipid membranes. ...
[18] Z. H. Jiang, A. Geyer, R. R. Schmidt, Angew. Chem. 1995, 107, 2730
Die Kristallstrukturen von „großen“ Proteinen sind aussagekräftig, nicht jedoch die von „kleinen“ Biomolekülen: Die Oberfläche wächst quadratisch (m2), das Volumen kubisch (m3).Die Übertragung eines beliebigen Ausschnitts vom Kristall in die Lösung ist eine wissenschaftlich fragwürdige Vorgehensweise.
58
The plant hormone Calonyctin A
calonyction aculeatumcalonyction aculeatum(moonlight flower), China
Calonyctin A is insoluble in water.
Z. H. Jiang, A. Geyer, R. R. Schmidt, Angew. Chem. 1995, 107, 2730
Calonyctin A is a plant growth hormone
There are only very few cyclic glycolipids in nature.What is the relative orientation between the oligosaccharide moiety and the alkyl chain?
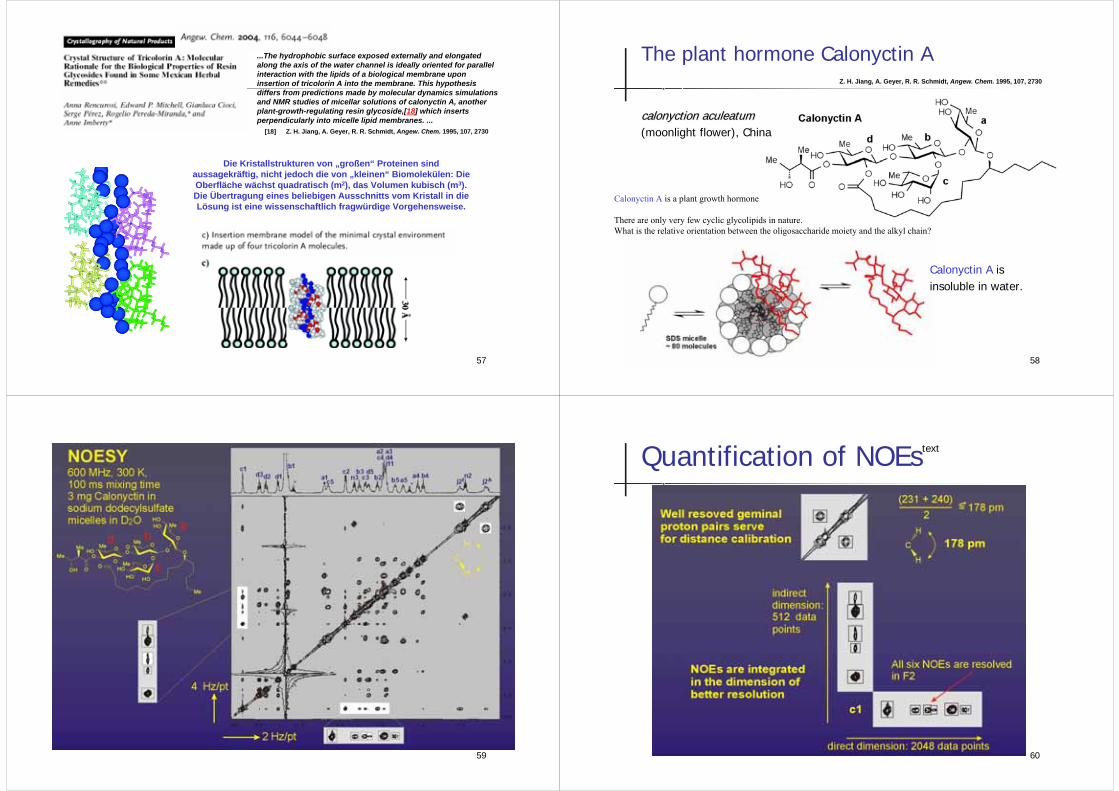
59
Calonyctin A text
60
Quantification of NOEstext
61
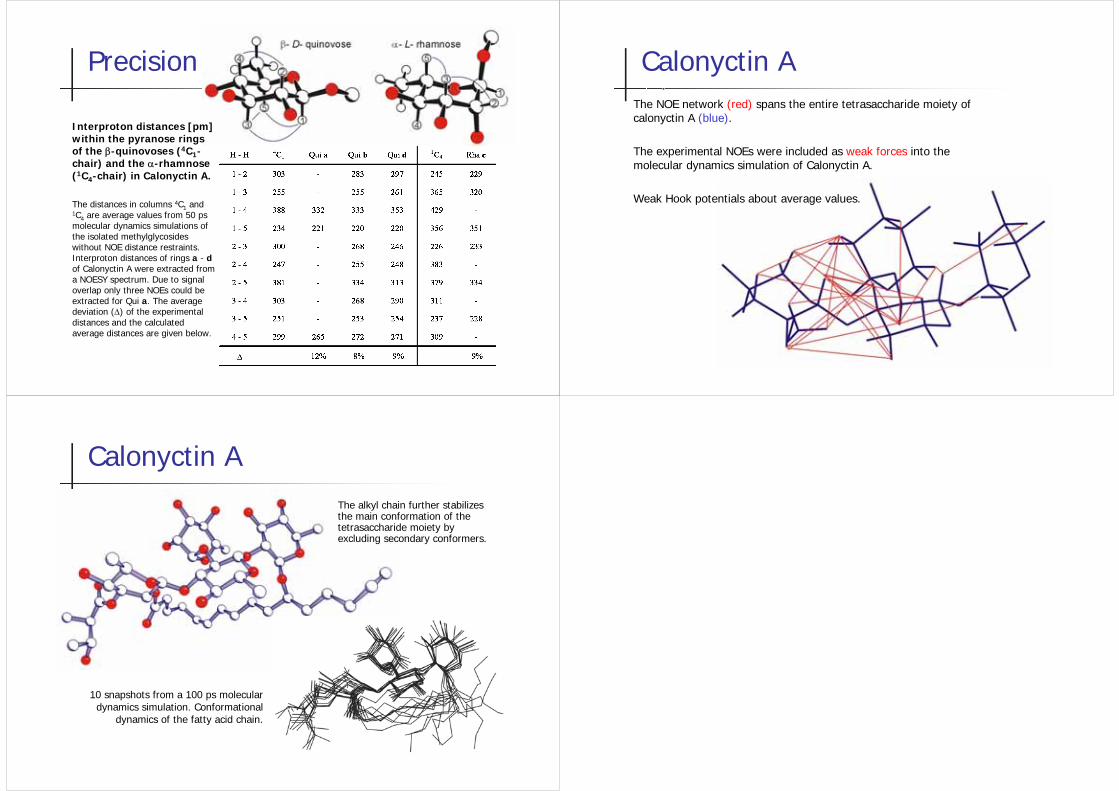
Precision
Interproton distances [pm]within the pyranose rings of the β-quinovoses (4C1-chair) and the α-rhamnose(1C4-chair) in Calonyctin A.
The distances in columns 4C1 and 1C4 are average values from 50 ps molecular dynamics simulations ofthe isolated methylglycosides without NOE distance restraints. Interproton distances of rings a - dof Calonyctin A were extracted froma NOESY spectrum. Due to signal overlap only three NOEs could be extracted for Qui a. The average deviation (∆) of the experimentaldistances and the calculated average distances are given below.
62
Calonyctin AThe NOE network (red) spans the entire tetrasaccharide moiety ofcalonyctin A (blue).
The experimental NOEs were included as weak forces into the molecular dynamics simulation of Calonyctin A.
Weak Hook potentials about average values.
63
Calonyctin AThe alkyl chain further stabilizes the main conformation of the tetrasaccharide moiety by excluding secondary conformers.
10 snapshots from a 100 ps molecular dynamics simulation. Conformational
dynamics of the fatty acid chain.


![fgNMR 2014.ppt [Kompatibilitätsmodus] · Festkörper NMR und Spektroskopie Weicher MaterieFestkörper NMR und Spektroskopie Weicher Materie Kay Saalwächter, Günter Hempel, (Detlef](https://img.pdfslide.tips/doc/110x75/605ed99edab9e611e31707bd/fgnmr-2014ppt-kompatibilittsmodus-festkrper-nmr-und-spektroskopie-weicher.jpg)