Embed Size (px)
Citation preview
Bisnode Southern Markets Bulletin April 2016
Main topic:Main topic:
LOW PRICES OF RAW MATERIALS REMAIN A THREATTO GLOBAL ECONOMYLOW PRICES OF RAW MATERIALS REMAIN A THREATTO GLOBAL ECONOMY
Bisnode Southern Markets Bulletin April 2016
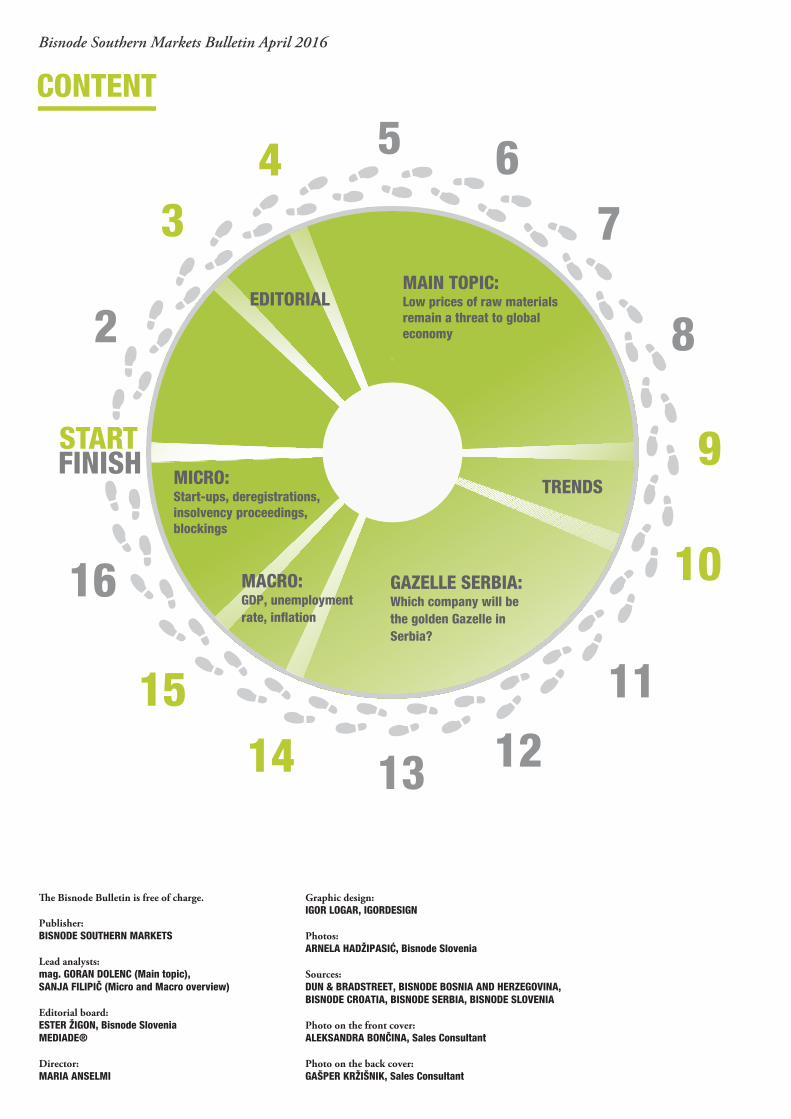
CONTENT
�e Bisnode Bulletin is free of charge.
Publisher:BISNODE SOUTHERN MARKETS
Lead analysts: mag. GORAN DOLENC (Main topic), SANJA FILIPIČ (Micro and Macro overview)
Editorial board:ESTER ŽIGON, Bisnode Slovenia MEDIADE®
Director: MARIA ANSELMI
Graphic design: IGOR LOGAR, IGORDESIGN
Photos:ARNELA HADŽIPASIĆ, Bisnode Slovenia
Sources: DUN & BRADSTREET, BISNODE BOSNIA AND HERZEGOVINA,BISNODE CROATIA, BISNODE SERBIA, BISNODE SLOVENIA
Photo on the front cover:ALEKSANDRA BONČINA, Sales Consultant
Photo on the back cover:GAŠPER KRŽIŠNIK, Sales Consultant
EDITORIAL
TRENDS
MAIN TOPIC:Low prices of raw materials remain a threat to global economy
GAZELLE SERBIA:Which company will be the golden Gazelle in Serbia?
MICRO:Start-ups, deregistrations, insolvency proceedings, blockings
MACRO:GDP, unemployment rate, inflation
Bisnode SM Bulletin April 2016 3EDITORIAL
Editorial
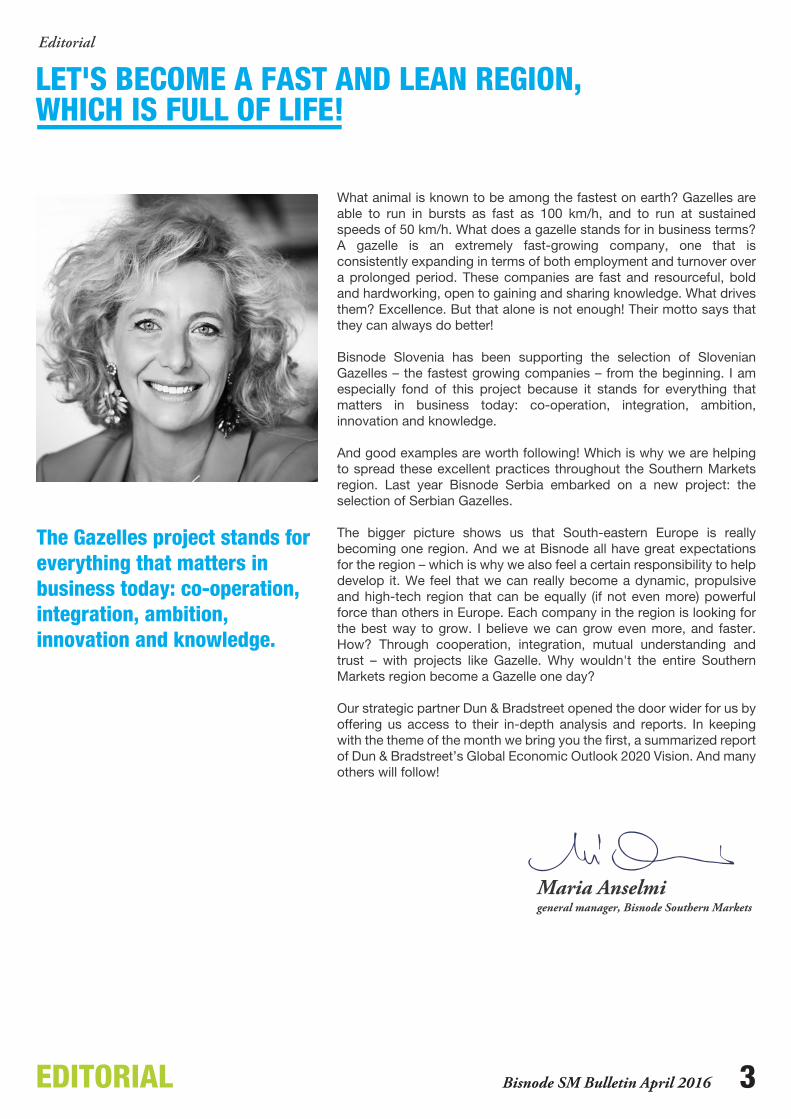
LET'S BECOME A FAST AND LEAN REGION, WHICH IS FULL OF LIFE!
general manager, Bisnode Southern Markets
What animal is known to be among the fastest on earth? Gazelles are able to run in bursts as fast as 100 km/h, and to run at sustained speeds of 50 km/h. What does a gazelle stands for in business terms? A gazelle is an extremely fast-growing company, one that is consistently expanding in terms of both employment and turnover over a prolonged period. These companies are fast and resourceful, bold and hardworking, open to gaining and sharing knowledge. What drives them? Excellence. But that alone is not enough! Their motto says that they can always do better!
Bisnode Slovenia has been supporting the selection of Slovenian Gazelles – the fastest growing companies – from the beginning. I am especially fond of this project because it stands for everything that matters in business today: co-operation, integration, ambition, innovation and knowledge.
And good examples are worth following! Which is why we are helping to spread these excellent practices throughout the Southern Markets region. Last year Bisnode Serbia embarked on a new project: the selection of Serbian Gazelles.
The bigger picture shows us that South-eastern Europe is really becoming one region. And we at Bisnode all have great expectations for the region – which is why we also feel a certain responsibility to help develop it. We feel that we can really become a dynamic, propulsive and high-tech region that can be equally (if not even more) powerful force than others in Europe. Each company in the region is looking for the best way to grow. I believe we can grow even more, and faster. How? Through cooperation, integration, mutual understanding and trust – with projects like Gazelle. Why wouldn't the entire Southern Markets region become a Gazelle one day?
Our strategic partner Dun & Bradstreet opened the door wider for us by offering us access to their in-depth analysis and reports. In keeping with the theme of the month we bring you the first, a summarized report of Dun & Bradstreet’s Global Economic Outlook 2020 Vision. And many others will follow!
The Gazelles project stands for everything that matters in business today: co-operation, integration, ambition, innovation and knowledge.
4 MAIN TOPICBisnode SM Bulletin April 2016 Bisnode SM Bulletin April 2016 5MAIN TOPIC
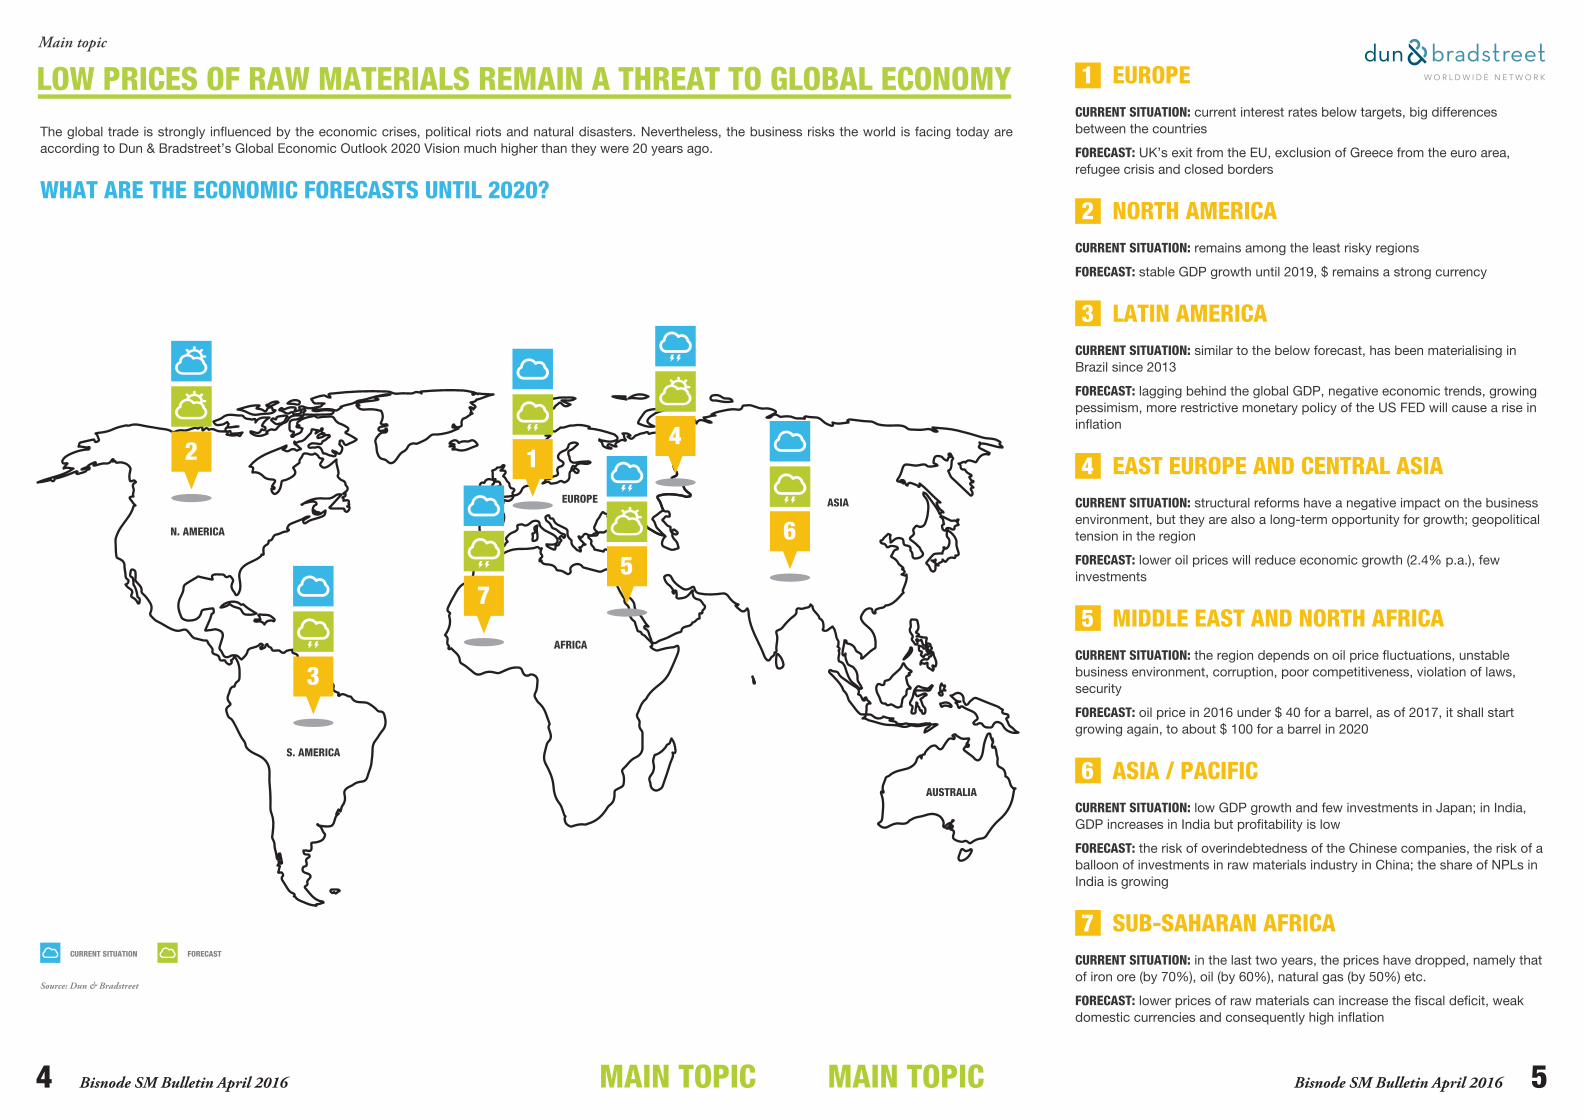
LOW PRICES OF RAW MATERIALS REMAIN A THREAT TO GLOBAL ECONOMYThe global trade is strongly influenced by the economic crises, political riots and natural disasters. Nevertheless, the business risks the world is facing today are according to Dun & Bradstreet’s Global Economic Outlook 2020 Vision much higher than they were 20 years ago.
WHAT ARE THE ECONOMIC FORECASTS UNTIL 2020?
N. AMERICA
S. AMERICA
AFRICA
EUROPE ASIA
AUSTRALIA
2 1
3
7
6
4
5
1 EUROPECURRENT SITUATION: current interest rates below targets, big differences between the countries
FORECAST: UK’s exit from the EU, exclusion of Greece from the euro area, refugee crisis and closed borders
2 NORTH AMERICACURRENT SITUATION: remains among the least risky regions
FORECAST: stable GDP growth until 2019, $ remains a strong currency
3 LATIN AMERICACURRENT SITUATION: similar to the below forecast, has been materialising in Brazil since 2013
FORECAST: lagging behind the global GDP, negative economic trends, growing pessimism, more restrictive monetary policy of the US FED will cause a rise in inflation
4 EAST EUROPE AND CENTRAL ASIACURRENT SITUATION: structural reforms have a negative impact on the business environment, but they are also a long-term opportunity for growth; geopolitical tension in the region
FORECAST: lower oil prices will reduce economic growth (2.4% p.a.), few investments
5 MIDDLE EAST AND NORTH AFRICA CURRENT SITUATION: the region depends on oil price fluctuations, unstable business environment, corruption, poor competitiveness, violation of laws, security
FORECAST: oil price in 2016 under $ 40 for a barrel, as of 2017, it shall start growing again, to about $ 100 for a barrel in 2020
6 ASIA / PACIFIC CURRENT SITUATION: low GDP growth and few investments in Japan; in India, GDP increases in India but profitability is low
FORECAST: the risk of overindebtedness of the Chinese companies, the risk of a balloon of investments in raw materials industry in China; the share of NPLs in India is growing
7 SUB-SAHARAN AFRICA CURRENT SITUATION: in the last two years, the prices have dropped, namely that of iron ore (by 70%), oil (by 60%), natural gas (by 50%) etc.
FORECAST: lower prices of raw materials can increase the fiscal deficit, weak domestic currencies and consequently high inflation
CURRENT SITUATION FORECAST
Main topic
Source: Dun & Bradstreet
6 MAIN TOPIC
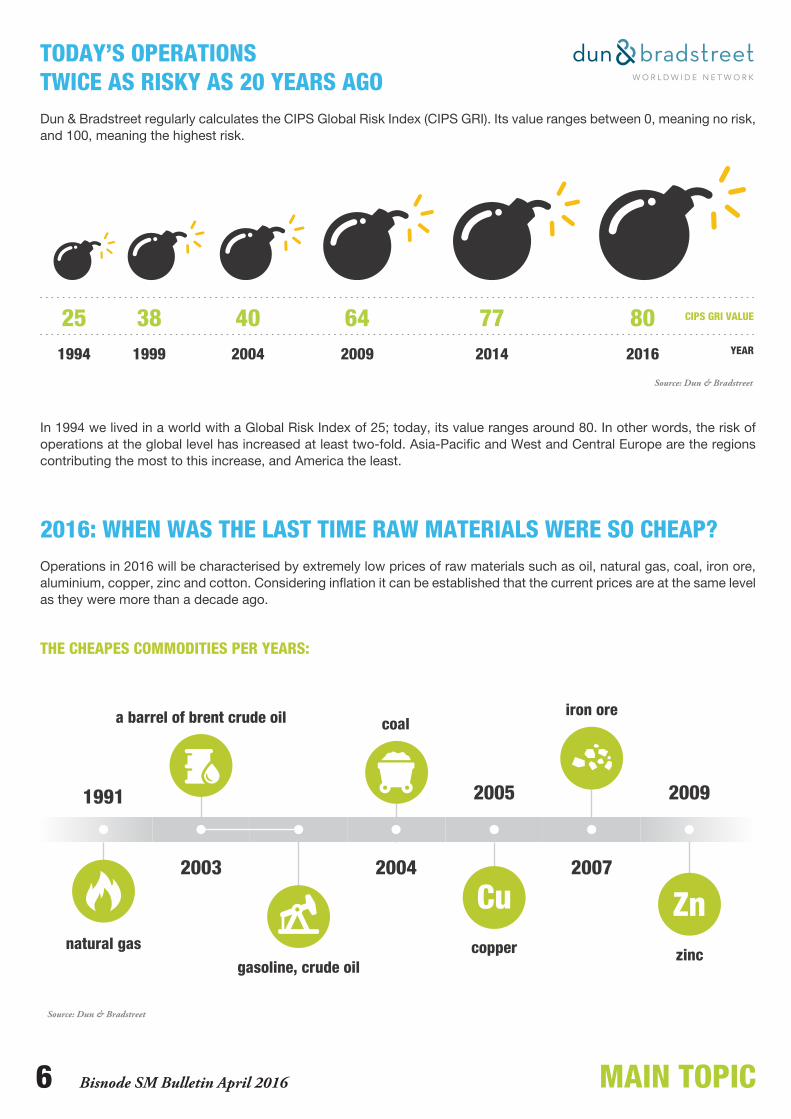
TODAY’S OPERATIONS TWICE AS RISKY AS 20 YEARS AGO Dun & Bradstreet regularly calculates the CIPS Global Risk Index (CIPS GRI). Its value ranges between 0, meaning no risk, and 100, meaning the highest risk.
2016: WHEN WAS THE LAST TIME RAW MATERIALS WERE SO CHEAP?Operations in 2016 will be characterised by extremely low prices of raw materials such as oil, natural gas, coal, iron ore, aluminium, copper, zinc and cotton. Considering inflation it can be established that the current prices are at the same level as they were more than a decade ago.
THE CHEAPES COMMODITIES PER YEARS:
In 1994 we lived in a world with a Global Risk Index of 25; today, its value ranges around 80. In other words, the risk of operations at the global level has increased at least two-fold. Asia-Pacific and West and Central Europe are the regions contributing the most to this increase, and America the least.
251994
381999
natural gasgasoline, crude oil
zinccopper
a barrel of brent crude oil iron orecoal
402004
772014
802016
642009
CIPS GRI VALUE
YEAR
1991
2003 2004
2005
2007
2009
Cu Zn
Bisnode SM Bulletin April 2016
Source: Dun & Bradstreet
Source: Dun & Bradstreet
7MAIN TOPIC
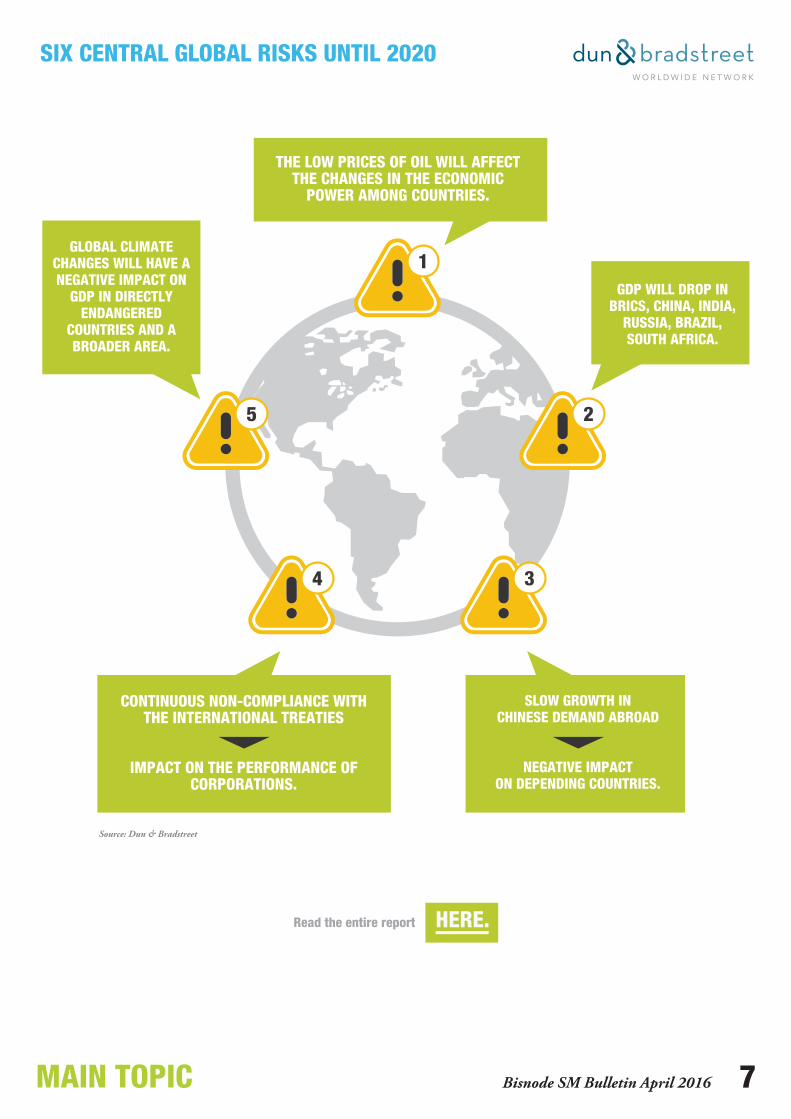
SIX CENTRAL GLOBAL RISKS UNTIL 2020
GDP WILL DROP IN BRICS, CHINA, INDIA,
RUSSIA, BRAZIL,SOUTH AFRICA.
1
2
3
5
4
THE LOW PRICES OF OIL WILL AFFECT THE CHANGES IN THE ECONOMIC
POWER AMONG COUNTRIES.
GLOBAL CLIMATE CHANGES WILL HAVE A NEGATIVE IMPACT ON
GDP IN DIRECTLY ENDANGERED
COUNTRIES AND A BROADER AREA.
CONTINUOUS NON-COMPLIANCE WITH THE INTERNATIONAL TREATIES
IMPACT ON THE PERFORMANCE OF CORPORATIONS.
SLOW GROWTH INCHINESE DEMAND ABROAD
NEGATIVE IMPACTON DEPENDING COUNTRIES.
Read the entire report HERE.
Bisnode SM Bulletin April 2016
Source: Dun & Bradstreet
R U S S I A N F E D E R A T I O N
FINLAND
AUSTRIA
ITALY
SPAIN
SWEDEN
NORWAY
GERMANY
FRANCE
PORTUGAL
HUNGARY
ROMANIA
BULGARIA
TURKEY
DENMARK
POLAND
BELARUS
UKRAINECZECH REP.SLOVAKIA
GREECE
CYPRUS
NETH.
BELGIUM
IRELAND
SERBIA
ALBANIA
MOLDOVA
LITHUANIA
LATVIA
ESTONIA
LUX.
MONTENEGRO
BOSNIA &HERZEGOVINA
CROATIASLOVENIA
SWITZ.
MACEDONIA (FYR)
GREENLAND
ICELAND
UNITED STATES OF AMERICA
HAWAII (US)
CANADA
MEXICO
THE BAHAMAS
CUBA
PANAMA
EL SALVADORGUATEMALA
BELIZEHONDURAS
NICARAGUA
COSTA RICA
JAMAICA
HAITI
DOMINICAN REPUBLIC
PUERTO RICO
ARGENTINA
BOLIVIA
COLOMBIA
VENEZUELA
PERUBRAZIL
FRENCH GUIANASURINAME
GUYANA
TRINIDAD & TOBAGO
CHILE
ECUADORGALÁPAGOS
PARAGUAY
URUGUAY
FALKLAND ISLANDS
KENYA
ETHIOPIA
ERITREA
SUDAN
EGYPT
NIGER
MAURITANIA
MALI
NIGERIA SOMALIA
NAMIBIA
LIBYA
CHAD
SOUTH AFRICA
TANZANIA
CONGODEM. REP. (ZAIRE)
ANGOLA
ALGERIA
MADAGASCAR
MAURITIUSMOZAMBIQUE
BOTSWANA
ZAMBIA
GABON
CENTRAL AFRICANREPUBLIC
TUNISIA
MALTA
MOROCCO
UGANDA
SWAZILAND
LESOTHO
MALAWI
BURUNDI
RWANDA
TOGO
BENIN
GHANAIVORYCOAST
LIBERIA
SIERRA LEONE
GUINEABURKINA
GAMBIA
CAMEROON
ZIMBABWE
CONGO
EQUATORIAL GUINEA
WESTERNSAHARA
DJIBOUTI
SENEGAL
GUINEA BISSAU
JORDAN
ISRAEL
LEBANON
ARMENIA AZERBAIJAN
GEORGIAKYRGYZ REPUBLIC
TAJIKISTAN
KUWAIT
QATARBAHRAIN
U. A. E.
YEMEN
SYRIA
IRAQ IRAN
OMAN
SAUDI ARABIA
AFGHANISTAN
PAKISTAN
INDIA
C H I N A
KAZAKHSTAN
TURKMENISTAN
UZBEKISTAN
MYANMAR
THAILAND
CAMBODIA
NEPAL
BHUTAN
VIETNAM
SRI LANKA
LAOSBANGLADESH
MALAYSIA
SINGAPORE
EAST TIMOR
PAPUANEW GUINEA
BRUNEI
PHILIPPINES
TAIWAN
HONG KONG (S.A.R.)
I N D O N E S I A
JAPAN
MONGOLIA
SOUTH KOREA
NORTH KOREA
AUSTRALIA
NEW ZEALAND
UNITEDKINGDOM
NEW CALEDONIA
FIJI
SOLOMONISLANDS
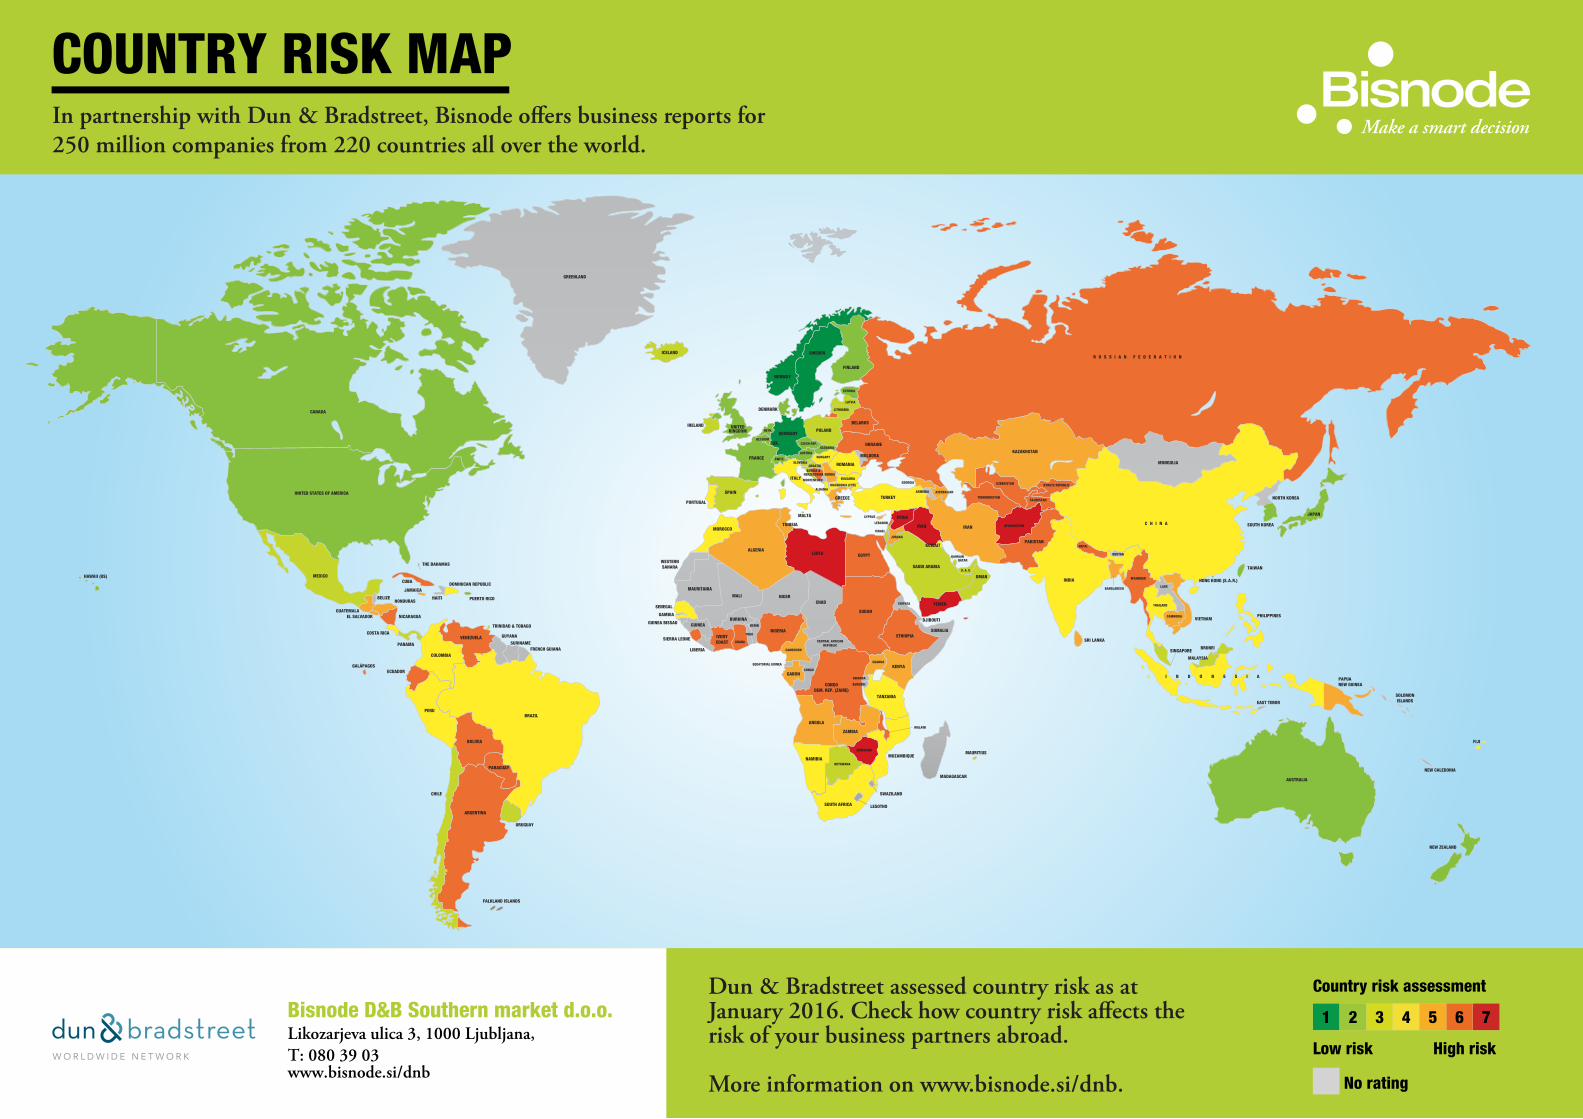
Dun & Bradstreet assessed country risk as at January 2016. Check how country risk affects the risk of your business partners abroad.
More information on www.bisnode.si/dnb.
Country risk assessment
1 2 3 4 5 6 7
Low risk High risk
No rating
COUNTRY RISK MAPIn partnership with Dun & Bradstreet, Bisnode offers business reports for250 million companies from 220 countries all over the world.
Bisnode D&B Southern market d.o.o.Likozarjeva ulica 3, 1000 Ljubljana,T: 080 39 03 www.bisnode.si/dnb
9TRENDS
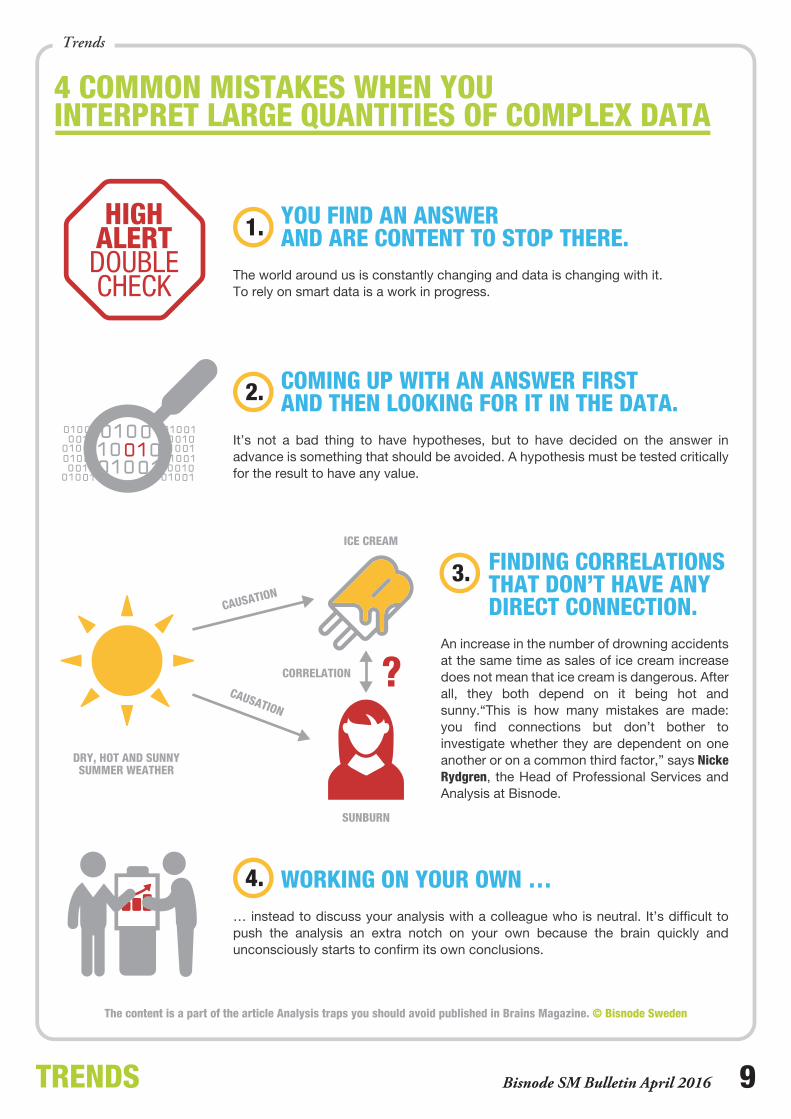
YOU FIND AN ANSWER AND ARE CONTENT TO STOP THERE. The world around us is constantly changing and data is changing with it.To rely on smart data is a work in progress.
The content is a part of the article Analysis traps you should avoid published in Brains Magazine. © Bisnode Sweden
1.
COMING UP WITH AN ANSWER FIRST AND THEN LOOKING FOR IT IN THE DATA. It’s not a bad thing to have hypotheses, but to have decided on the answer in advance is something that should be avoided. A hypothesis must be tested critically for the result to have any value.
FINDING CORRELATIONS THAT DON’T HAVE ANY DIRECT CONNECTION. An increase in the number of drowning accidents at the same time as sales of ice cream increase does not mean that ice cream is dangerous. After all, they both depend on it being hot and sunny.“This is how many mistakes are made: you find connections but don’t bother to investigate whether they are dependent on one another or on a common third factor,” says Nicke Rydgren, the Head of Professional Services and Analysis at Bisnode.
4 COMMON MISTAKES WHEN YOU INTERPRET LARGE QUANTITIES OF COMPLEX DATA
DRY, HOT AND SUNNYSUMMER WEATHER
CORRELATION ?
ICE CREAM
CAUSATION
SUNBURN
2.
3.
WORKING ON YOUR OWN … … instead to discuss your analysis with a colleague who is neutral. It’s difficult to push the analysis an extra notch on your own because the brain quickly and unconsciously starts to confirm its own conclusions.
4.
CAUSATION
Trends
Bisnode SM Bulletin April 2016
10 GAZELLE SERBIA Bisnode SM Bulletin April 2016
Gazelle Serbia
WHICH COMPANY WILL BE THE GOLDEN GAZELLE IN SERBIA?Among the many companies on the market the Gazelles have been recognized in the European environment as a very special ingredient of every national economy. They are not only fast growing and exert a positive influence on their partners and the community, but they also become examples and cornerstones of economic growth. In The Year of Entrepreneurship Bisnode Serbia will for the first time award the best among the fastest growing companies in Serbia.
Bisnode Serbia has established a robust methodology in bringing together experience with Gazelle projects abroad and their business intelligence expertise in Serbia. The first step was to choose the 500 fastest growing companies and to double-check their financial results and business intelligence indicators. Files for the top 20 companies to emerge out of the process were handed over to trained experts who made detailed interviews with the managers and/or owners who contributed to their success and are primarily responsible for their growth.
PROMOTING THE VALUES OF GROWTHThe interviews are designed to elicit an answer to the question: why are they so successful and how do they see their venture developing in the future. We look for sustainability and potential for growth, examine the risk profile, company culture and values, as well as communications within the company and the social responsibility it demonstrates.
Qualitative analysis supported by quantitative data narrows the field down to five candidate files that are forwarded to the Council of Gazelles. The council is established as a body of experts that have the final decision on who earns a place among the best three gazelles in Serbia, together with their ranking. The Council of Gazelles consists of individuals and representatives of institutions and companies that are both intelligent and experienced, drawn from a wide spectrum from the commercial sphere, where they have demonstrated a strong impact with their results and the resulting reputation they reflect back on the community.
Bisnode Serbia also takes care that the wider community gets information on the project and that it is promptly notified through media partnerships and collaboration with national business associations, government institutions and others that have established themselves as generous supporters of the values behind the Gazelle project. Supporters are offered the opportunity to bring attention to their partners by sponsoring candidates, and through nominees and winners of the Gazelle of Serbia project.
CONNECTING AND PROMOTING COMMON IDEAS
This year Serbia celebrates The Year of Entrepreneurship. So it’s no coincidence that Bisnode Serbia decided to establish the Gazelle of Serbia project now, in the Year of Entrepreneurship. The aim of promoting entrepreneurship and our own project goals are tightly connected in terms of values and address society as whole in order to rise awareness of the good examples we have all around us and that make our business environment more efficient and competitive. The main goal of Gazelles of Serbia is to connect these common values with common ideas and to bring related projects together.
Irina Zdravković, Bisnode SerbiaProject manager of the Gazelles of Serbia contest
MEMBERS OF THE COUNCIL OF GAZELLES ARE (in alphabetical order):
Maria Anselmi, general manager of Bisnode Southern Markets, Marko Čadež, president of the Chamber of Commerce and Industry of Serbia, Milan Petrović, president of the Serbian Association of Managers (SAM), dr. Miloš Petrović, director of the Serbian Development Agency (RAS), Dragica Pilipovic Chaffey, CEO of Serbia Broadband (SBB), Željko Sertić, Minister of Economy, dr. Dejan Šoškić, Faculty of Economics University of Belgrade, and Aleksandar Vlahović, president of the Serbian Association of Economists.
11GAZELLE SERBIA Bisnode SM Bulletin April 2016
THE LIST OF 500 FASTEST GROWING COMPANIES The list of the 500 fastest growing companies, the so-called Gazelles, serves as the starting point for the Gazelle contest. Based on official data, reported to APR, all companies are ranked according to their 5-year turnover performance. A 5-year period is taken into account in order to avoid the impact of sudden and short-term sales growth, and to provide a sound indicator of sustainable growth in the future.
After the first selection criterion is put in place a unique methodology is applied, whereby a company should prove compliant with the following standards. The company should have• a turnover of more than 30 million RSD in the last year,• generated a positive net profit in the last two years,• created new job positions during the last 5 years,• not been involved in insolvency or account blocking procedures in the last year,• not assumed excessively high credit risk to secure legal relief from its creditors,• managed and operated its assets in efficiently and effectively.
Robert Petrič, Bisnode Slovenia, Director of Production
´HAND-PICKED´ 50 CANDIDATES AND 20 NOMINEESThe 500 listed gazelles are scored according to the BSI Bisnode Success index. The index is based on the stakeholders concept: how a company is performing from the perspective of its owners, lenders, employees and the state. The index information is combined with desktop research on the companies: history, entrepreneurial story, business model, internationalisation, brand development, innovation. A total of 50 candidates are proposed by the Bisnode intelligence unit, from which 20 nominees are then selected by the methodology committee, represented by experts in the fields of entrepreneurship, management and business analytics. Experience shows that knowledge transfer and innovation generation is an intrinsic part of their co-operation. 20 nominees are then invited to take part in the contest, and personal interviews are conducted with all of them. The aim of the structured interview is to determine the growth orientation of the company, its business model, leadership potential and potential for innovation and sustainability. The company information file is complemented by a rating report on the participating company and systematically presented in the form of a detailed company file suitable for further methodology process phases.
Ljiljana Cupara, Bisnode Serbia, Rating, COO
CHOOSING THE BEST FROM THE FASTEST GROWING COMPANIESThe aim of the Gazelle Contest is to recognize the best company among the body of fastest growing companies. A complex yet transparent process integrates advanced business data analysis and desktop research with qualitative research. From the 20 nominated companies the methodology committee selects 5 finalists. The key and final decision on the selection of the Golden Gazelle of the year is entrusted to the highest level of the project – the Council of Gazelles. In addition to the business metrics components and entrepreneurial story of the candidates the Council’s decision also takes into account the values of the dynamic growth as well as the company’s potential for sustainable growth.
Mag. Edita Krajnović, Mediade,head of the Gazelle methodology process
METHODOLOGY: THE STORY BEHIND THE NUMBERS
12 GAZELLE SERBIABisnode SM Bulletin April 2016
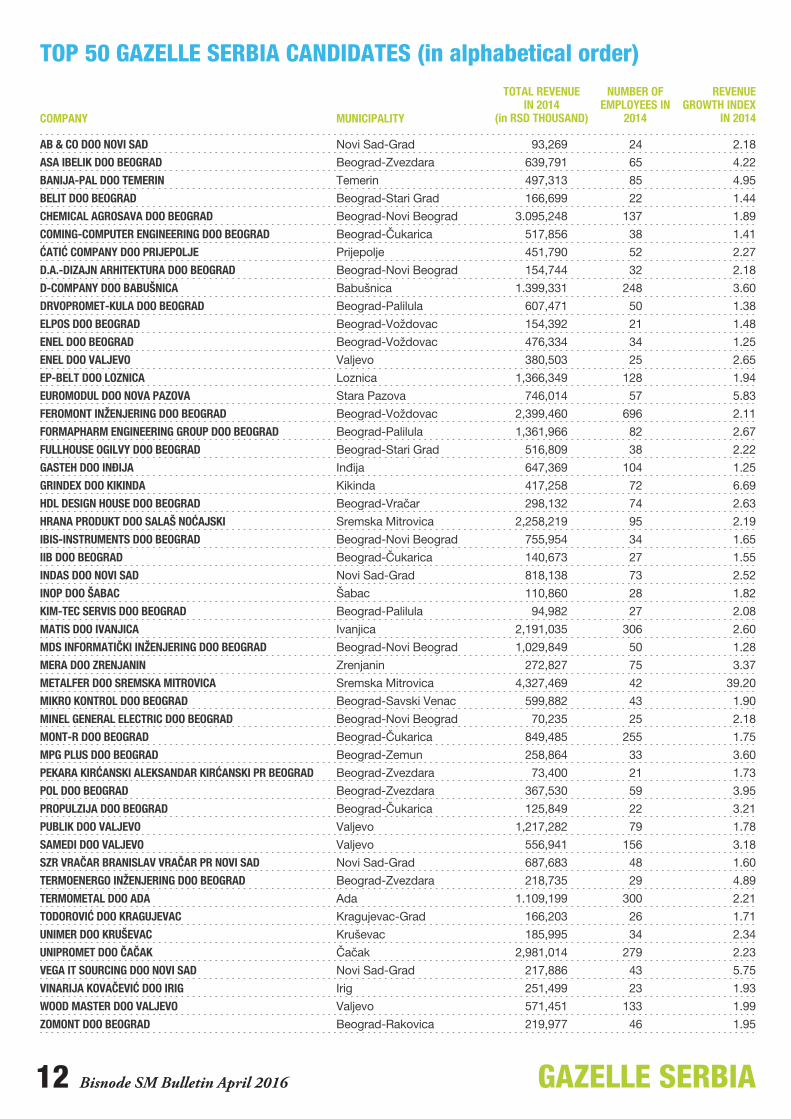
TOP 50 GAZELLE SERBIA CANDIDATES (in alphabetical order)
AB & CO DOO NOVI SAD
ASA IBELIK DOO BEOGRAD
BANIJA-PAL DOO TEMERIN
BELIT DOO BEOGRAD
CHEMICAL AGROSAVA DOO BEOGRAD
COMING-COMPUTER ENGINEERING DOO BEOGRAD
ĆATIĆ COMPANY DOO PRIJEPOLJE
D.A.-DIZAJN ARHITEKTURA DOO BEOGRAD
D-COMPANY DOO BABUŠNICA
DRVOPROMET-KULA DOO BEOGRAD
ELPOS DOO BEOGRAD
ENEL DOO BEOGRAD
ENEL DOO VALJEVO
EP-BELT DOO LOZNICA
EUROMODUL DOO NOVA PAZOVA
FEROMONT INŽENJERING DOO BEOGRAD
FORMAPHARM ENGINEERING GROUP DOO BEOGRAD
FULLHOUSE OGILVY DOO BEOGRAD
GASTEH DOO INĐIJA
GRINDEX DOO KIKINDA
HDL DESIGN HOUSE DOO BEOGRAD
HRANA PRODUKT DOO SALAŠ NOĆAJSKI
IBIS-INSTRUMENTS DOO BEOGRAD
IIB DOO BEOGRAD
INDAS DOO NOVI SAD
INOP DOO ŠABAC
KIM-TEC SERVIS DOO BEOGRAD
MATIS DOO IVANJICA
MDS INFORMATIČKI INŽENJERING DOO BEOGRAD
MERA DOO ZRENJANIN
METALFER DOO SREMSKA MITROVICA
MIKRO KONTROL DOO BEOGRAD
MINEL GENERAL ELECTRIC DOO BEOGRAD
MONT-R DOO BEOGRAD
MPG PLUS DOO BEOGRAD
PEKARA KIRĆANSKI ALEKSANDAR KIRĆANSKI PR BEOGRAD
POL DOO BEOGRAD
PROPULZIJA DOO BEOGRAD
PUBLIK DOO VALJEVO
SAMEDI DOO VALJEVO
SZR VRAČAR BRANISLAV VRAČAR PR NOVI SAD
TERMOENERGO INŽENJERING DOO BEOGRAD
TERMOMETAL DOO ADA
TODOROVIĆ DOO KRAGUJEVAC
UNIMER DOO KRUŠEVAC
UNIPROMET DOO ČAČAK
VEGA IT SOURCING DOO NOVI SAD
VINARIJA KOVAČEVIĆ DOO IRIG
WOOD MASTER DOO VALJEVO
ZOMONT DOO BEOGRAD
COMPANY MUNICIPALITY
TOTAL REVENUEIN 2014
(in RSD THOUSAND)
NUMBER OF EMPLOYEES IN
2014
REVENUE GROWTH INDEX
IN 2014
Novi Sad-Grad
Beograd-Zvezdara
Temerin
Beograd-Stari Grad
Beograd-Novi Beograd
Beograd-Čukarica
Prijepolje
Beograd-Novi Beograd
Babušnica
Beograd-Palilula
Beograd-Voždovac
Beograd-Voždovac
Valjevo
Loznica
Stara Pazova
Beograd-Voždovac
Beograd-Palilula
Beograd-Stari Grad
Inđija
Kikinda
Beograd-Vračar
Sremska Mitrovica
Beograd-Novi Beograd
Beograd-Čukarica
Novi Sad-Grad
Šabac
Beograd-Palilula
Ivanjica
Beograd-Novi Beograd
Zrenjanin
Sremska Mitrovica
Beograd-Savski Venac
Beograd-Novi Beograd
Beograd-Čukarica
Beograd-Zemun
Beograd-Zvezdara
Beograd-Zvezdara
Beograd-Čukarica
Valjevo
Valjevo
Novi Sad-Grad
Beograd-Zvezdara
Ada
Kragujevac-Grad
Kruševac
Čačak
Novi Sad-Grad
Irig
Valjevo
Beograd-Rakovica
93,269
639,791
497,313
166,699
3.095,248
517,856
451,790
154,744
1.399,331
607,471
154,392
476,334
380,503
1,366,349
746,014
2,399,460
1,361,966
516,809
647,369
417,258
298,132
2,258,219
755,954
140,673
818,138
110,860
94,982
2,191,035
1,029,849
272,827
4,327,469
599,882
70,235
849,485
258,864
73,400
367,530
125,849
1,217,282
556,941
687,683
218,735
1.109,199
166,203
185,995
2,981,014
217,886
251,499
571,451
219,977
24
65
85
22
137
38
52
32
248
50
21
34
25
128
57
696
82
38
104
72
74
95
34
27
73
28
27
306
50
75
42
43
25
255
33
21
59
22
79
156
48
29
300
26
34
279
43
23
133
46
2.18
4.22
4.95
1.44
1.89
1.41
2.27
2.18
3.60
1.38
1.48
1.25
2.65
1.94
5.83
2.11
2.67
2.22
1.25
6.69
2.63
2.19
1.65
1.55
2.52
1.82
2.08
2.60
1.28
3.37
39.20
1.90
2.18
1.75
3.60
1.73
3.95
3.21
1.78
3.18
1.60
4.89
2.21
1.71
2.34
2.23
5.75
1.93
1.99
1.95
14 MACROBisnode SM Bulletin April 2016
MACRO OVERVIEWOF THE ECONOMY – SOUTHERN MARKETS
GDP, UNEMPLOYMENT RATE, INFLATION
GROWTH
DECREASE
UNEMPLOYMENT RATE
INFLATIONBIH
0.2%
€€
SLO
-0.7%3.3%
€€€
12.9%
HR
RS
1.2% 17.9%* 1.5%
€€
1.9% -1.4%18.5%
€€€
€
GDP€€€€€€€€
ZERO GROWTH
Source: www.bisnode.si
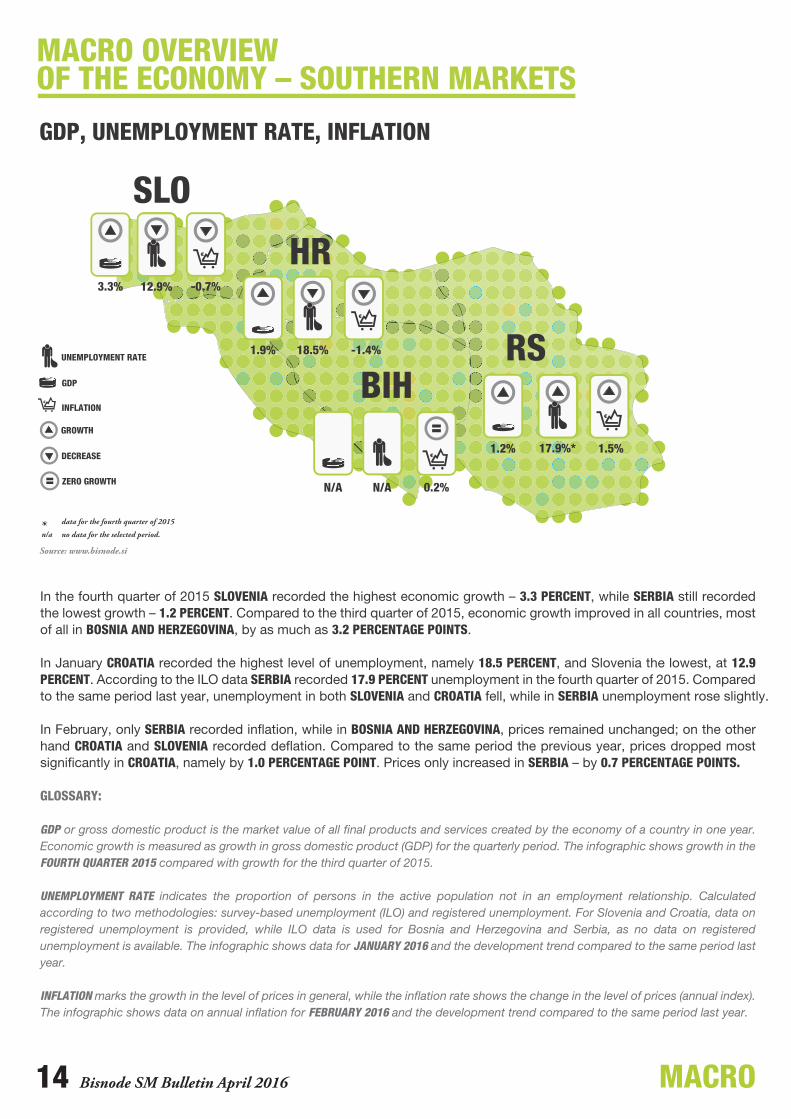
In the fourth quarter of 2015 SLOVENIA recorded the highest economic growth – 3.3 PERCENT, while SERBIA still recorded the lowest growth – 1.2 PERCENT. Compared to the third quarter of 2015, economic growth improved in all countries, most of all in BOSNIA AND HERZEGOVINA, by as much as 3.2 PERCENTAGE POINTS.
In January CROATIA recorded the highest level of unemployment, namely 18.5 PERCENT, and Slovenia the lowest, at 12.9 PERCENT. According to the ILO data SERBIA recorded 17.9 PERCENT unemployment in the fourth quarter of 2015. Compared to the same period last year, unemployment in both SLOVENIA and CROATIA fell, while in SERBIA unemployment rose slightly.
In February, only SERBIA recorded inflation, while in BOSNIA AND HERZEGOVINA, prices remained unchanged; on the other hand CROATIA and SLOVENIA recorded deflation. Compared to the same period the previous year, prices dropped most significantly in CROATIA, namely by 1.0 PERCENTAGE POINT. Prices only increased in SERBIA – by 0.7 PERCENTAGE POINTS.
GLOSSARY:
GDP or gross domestic product is the market value of all final products and services created by the economy of a country in one year. Economic growth is measured as growth in gross domestic product (GDP) for the quarterly period. The infographic shows growth in the FOURTH QUARTER 2015 compared with growth for the third quarter of 2015.
UNEMPLOYMENT RATE indicates the proportion of persons in the active population not in an employment relationship. Calculated according to two methodologies: survey-based unemployment (ILO) and registered unemployment. For Slovenia and Croatia, data on registered unemployment is provided, while ILO data is used for Bosnia and Herzegovina and Serbia, as no data on registered unemployment is available. The infographic shows data for JANUARY 2016 and the development trend compared to the same period last year.
INFLATION marks the growth in the level of prices in general, while the inflation rate shows the change in the level of prices (annual index). The infographic shows data on annual inflation for FEBRUARY 2016 and the development trend compared to the same period last year.
data for the fourth quarter of 2015
no data for the selected period.
15MICRO Bisnode SM Bulletin April 2016
MICRO OVERVIEWOF THE ECONOMY – SOUTHERN MARKETS
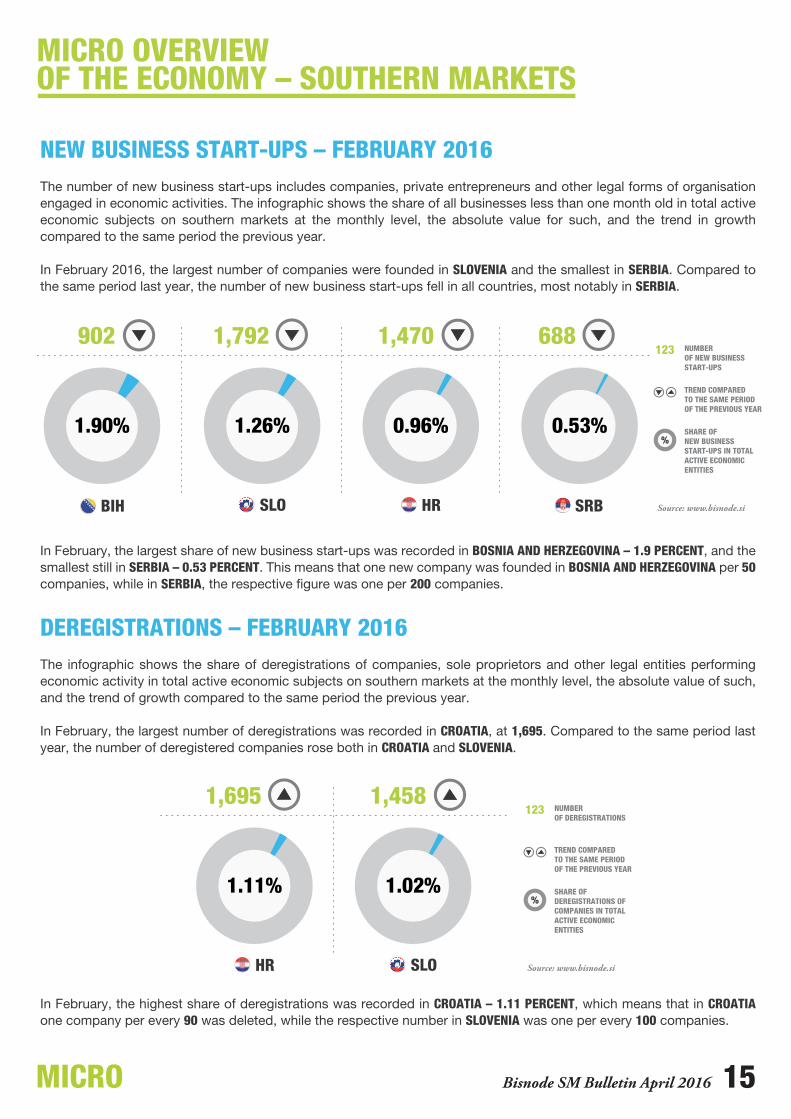
NEW BUSINESS START-UPS – FEBRUARY 2016The number of new business start-ups includes companies, private entrepreneurs and other legal forms of organisation engaged in economic activities. The infographic shows the share of all businesses less than one month old in total active economic subjects on southern markets at the monthly level, the absolute value for such, and the trend in growth compared to the same period the previous year.
In February 2016, the largest number of companies were founded in SLOVENIA and the smallest in SERBIA. Compared to the same period last year, the number of new business start-ups fell in all countries, most notably in SERBIA.
DEREGISTRATIONS – FEBRUARY 2016The infographic shows the share of deregistrations of companies, sole proprietors and other legal entities performing economic activity in total active economic subjects on southern markets at the monthly level, the absolute value of such, and the trend of growth compared to the same period the previous year.
In February, the largest number of deregistrations was recorded in CROATIA, at 1,695. Compared to the same period last year, the number of deregistered companies rose both in CROATIA and SLOVENIA.
In February, the largest share of new business start-ups was recorded in BOSNIA AND HERZEGOVINA – 1.9 PERCENT, and the smallest still in SERBIA – 0.53 PERCENT. This means that one new company was founded in BOSNIA AND HERZEGOVINA per 50 companies, while in SERBIA, the respective figure was one per 200 companies.
In February, the highest share of deregistrations was recorded in CROATIA – 1.11 PERCENT, which means that in CROATIA one company per every 90 was deleted, while the respective number in SLOVENIA was one per every 100 companies.
Source: www.bisnode.si
902 1,792 1,470 688
1.90% 1.26% 0.96% 0.53%
NUMBER OF NEW BUSINESS START-UPS
TREND COMPARED TO THE SAME PERIOD OF THE PREVIOUS YEAR
SHARE OF NEW BUSINESS START-UPS IN TOTAL ACTIVE ECONOMIC ENTITIES
Source: www.bisnode.si
1,695 1,458
1.11% 1.02%
NUMBER OF DEREGISTRATIONS
TREND COMPARED TO THE SAME PERIOD OF THE PREVIOUS YEAR
SHARE OF DEREGISTRATIONS OF COMPANIES IN TOTAL ACTIVE ECONOMIC ENTITIES
16 MICROBisnode SM Bulletin April 2016
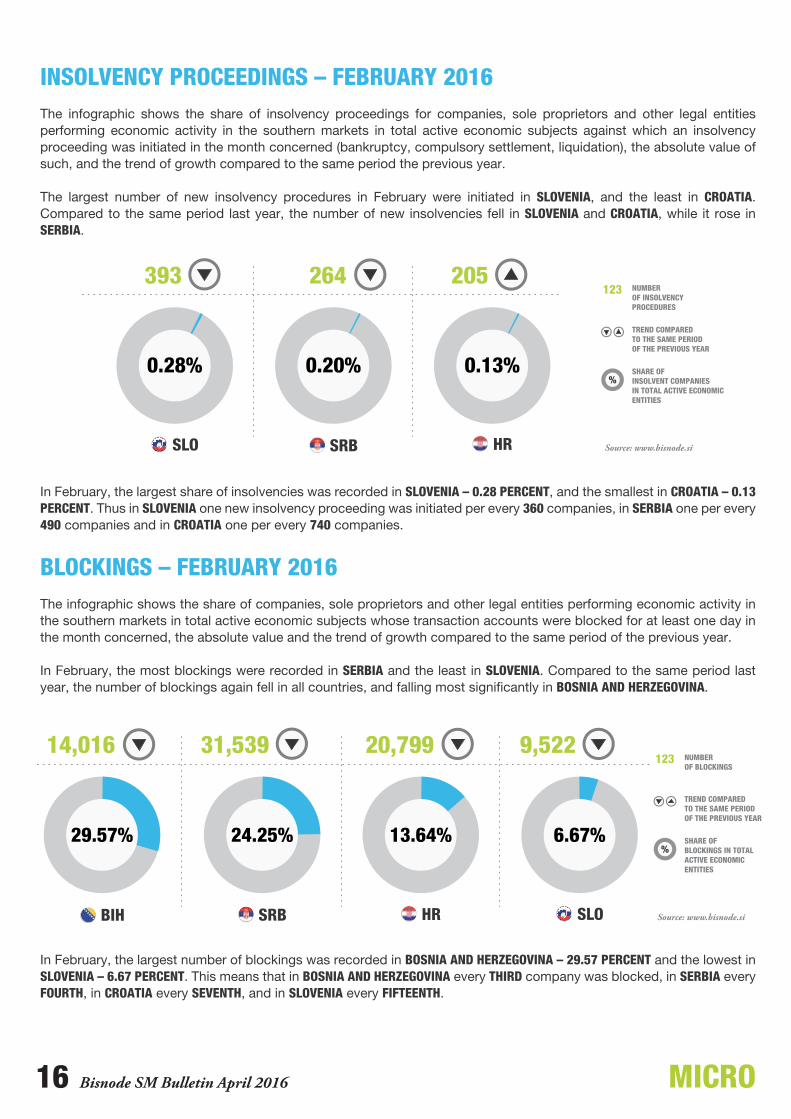
INSOLVENCY PROCEEDINGS – FEBRUARY 2016The infographic shows the share of insolvency proceedings for companies, sole proprietors and other legal entities performing economic activity in the southern markets in total active economic subjects against which an insolvency proceeding was initiated in the month concerned (bankruptcy, compulsory settlement, liquidation), the absolute value of such, and the trend of growth compared to the same period the previous year.
The largest number of new insolvency procedures in February were initiated in SLOVENIA, and the least in CROATIA. Compared to the same period last year, the number of new insolvencies fell in SLOVENIA and CROATIA, while it rose in SERBIA.
BLOCKINGS – FEBRUARY 2016The infographic shows the share of companies, sole proprietors and other legal entities performing economic activity in the southern markets in total active economic subjects whose transaction accounts were blocked for at least one day in the month concerned, the absolute value and the trend of growth compared to the same period of the previous year.
In February, the most blockings were recorded in SERBIA and the least in SLOVENIA. Compared to the same period last year, the number of blockings again fell in all countries, and falling most significantly in BOSNIA AND HERZEGOVINA.
Source: www.bisnode.si
393 264 205
0.28% 0.20% 0.13%
NUMBER OF INSOLVENCY PROCEDURES
TREND COMPARED TO THE SAME PERIOD OF THE PREVIOUS YEAR
SHARE OF INSOLVENT COMPANIES IN TOTAL ACTIVE ECONOMIC ENTITIES
In February, the largest share of insolvencies was recorded in SLOVENIA – 0.28 PERCENT, and the smallest in CROATIA – 0.13 PERCENT. Thus in SLOVENIA one new insolvency proceeding was initiated per every 360 companies, in SERBIA one per every 490 companies and in CROATIA one per every 740 companies.
Source: www.bisnode.si
14,016 31,539 20,799 9,522
29.57% 24.25% 13.64% 6.67%
NUMBER OF BLOCKINGS
TREND COMPARED TO THE SAME PERIOD OF THE PREVIOUS YEAR
SHARE OF BLOCKINGS IN TOTAL ACTIVE ECONOMIC ENTITIES
In February, the largest number of blockings was recorded in BOSNIA AND HERZEGOVINA – 29.57 PERCENT and the lowest in SLOVENIA – 6.67 PERCENT. This means that in BOSNIA AND HERZEGOVINA every THIRD company was blocked, in SERBIA every FOURTH, in CROATIA every SEVENTH, and in SLOVENIA every FIFTEENTH.