Embed Size (px)
Citation preview
Bitcoin or Ethereum? The Million Dollar Question
Rituparna Ghosh
Khondoker Haider
Pedro Kim
b
1
Table of Contents
Introduction…………………………………………………………… 2
Objective …………………………………………………………….. 2
Process…………………………………..……………………………. 3
Cryptic World of Cryptocurrency…………..………………………. 3
Two-Step Model…………………………………………………….… 4
Step One: Calculating Price Change in Bitcoin & Ether…………..…. 5
Step Two: Estimating Risks Associated with Bitcoin & Ethereum…... 8
Investment Decision…………………………………………………. 14
References
2
Introduction
They said, “Technology is the wave of the future” and in 2016, the future is here. The
financial crisis of 2008 created a lack of confidence in the financial services industry: nothing
was safe, not even traditional money, and especially not banks. Cryptocurrency, or digital
currency, was a solution, and Bitcoin was the forefather. This new instrument was designed to be
a hybrid of virtual money, digital asset, and technology; something the world had never
encountered before now. It is now 2016 and much has changed, Bitcoin’s value has skyrocketed
and its popularity and open-source format has led to many similar entrants into the market. It is
not only Bitcoin that has experienced significant success, the overall cryptocurrency market has
also had a similar experience, with the addition of new coins and creation of entire trading
platforms.
Objective
Over the past few years, many have tried to challenge Bitcoin’s leadership in the
cryptocurrency market, but none has come close, until Ethereum entered the scene. On one hand,
Bitcoin, as the first mover, got to set the path of rapid growth, and has been stabilizing its
volatility and price over time. Ether, the internal network currency of Ethereum, has experienced
a surge in popularity unlike any other coin in the cryptocurrency market; Ethereum is not just
another blockchain technology, it has found a whole new application for cryptocurrency. The
purpose of this report is to compare these two blockchain technologies, and create a portfolio,
consisting of Bitcoin and Ether, that will yield highest return with optimal risk on a million-
dollar investment over five years.
3
Process
The report introduces a Two-Step Model assessing risks and returns of Bitcoin and Ether
to propose three portfolio allocation mix. More specifically, Step One estimates price of Bitcoin
and Ether in five years using two approaches – Trend Analysis and Cryptocurrency Demand-
Supply Model. Step Two undertakes a qualitative assessment of their risks as a virtual currency,
digital asset, and a technology. Taking into consideration cryptocurrency environment and
potential of both cryptocurrencies, the model recommends a portfolio consisting of equal portion
of Ether and Bitcoin, resulting an expected return of 115.5 percent over the next 5 years.
Cryptic World of Cryptocurrency
Since its inception in 2009 with the creation of Bitcoin, the cryptocurrency market has
grown significantly with over 600 cryptocurrencies currently in the market. Over the years,
experts have boldly attempted to predict the price of cryptocurrencies, with limited success.
Some believe that the cryptocurrencies are undervalued, whereas others predict stagnation or
even a decline. Research on this industry is also scarce, the primary reason, of course, being its
age, in addition to the inherent randomness associated with such a nascent market. Moreover, it
becomes difficult to individually assess each coin because they all originally stem from the same
blockchain technology and they have little variation in terms of functionality. Given the weight
that Bitcoin carries in the market, most of the research available study this cryptocurrency
specifically.
An assessment of the literature that exists on cryptocurrency shows that there are three
primary factors that affect cryptocurrency prices. Although these factors are specific to Bitcoin,
4
they can be extrapolated to also influence the cryptocurrency market as a whole. The three key
factors that affect Bitcoin pricing are:
❏ Market forces of supply and demand (Buchholz et al. 2012; Bouoiyour and Selmi 2015)
❏ Attractiveness to investors (Kristoufek 2013; Bouoiyour and Selmi 2015); and
❏ Global macro-financial development (Van Wijk 2013; Ciaian et al. (2014)).
An important determinant of Bitcoin price, as well as price of any regular currency, is the
equilibrium between demand and supply. There are three types of uses for cryptocurrencies: as a
method of payment, as an asset or commodity, and as payment for miners – and it is extremely
difficult to model the estimated demand. Bucholz et al. (2012) show that supply-demand
interaction can be used to determine Bitcoin prices while Bouoiyour and Selmi (2015) argue that
Bitcoin is largely detached from macroeconomic fundamentals and behaves as if in a
‘speculative bubble.’ The key takeaway from previous studies is that it is difficult to study the
impact on cryptocurrency prices as there are many immeasurable factors that affect it, with the
key driving factors yet to be identified.
Two-Step Model
The proposed Two-Step model allows us to compare return and risk profile of Bitcoin
and Ether. More specifically, Step One estimates the price of Bitcoin and Ether over five years
using two different approaches – Trend Analysis and Cryptocurrency Demand/Supply Model,
whereas Step Two undertakes a qualitative assessment of their inherent risks in performing as a
virtual currency, digital asset, and a technology
5
Step One: Calculating the Price Change in Bitcoin and Ether
Trend Analysis
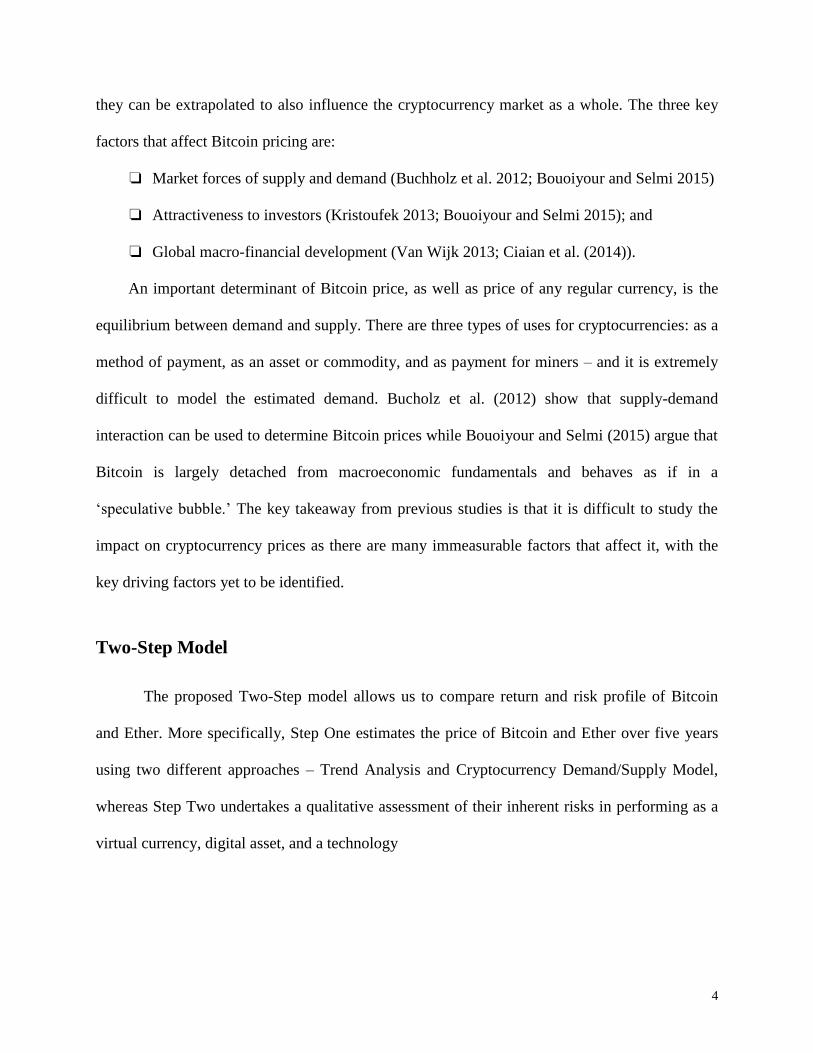
The first approach involves a time-series regression analysis using price data over the
period between 28th April 2013 until 2nd October 2016. To conduct this simple regression, the
Coinmarketcap.com database is used to obtain the Weekly Price in US Dollars (price) of all
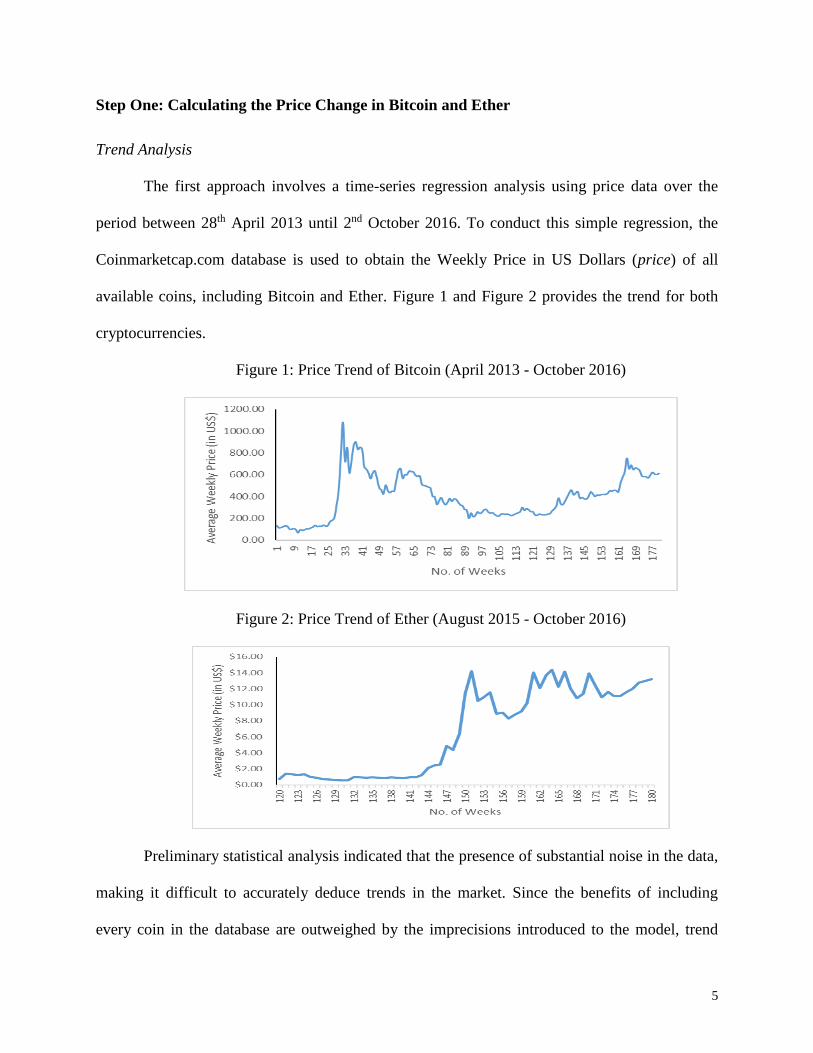
available coins, including Bitcoin and Ether. Figure 1 and Figure 2 provides the trend for both
cryptocurrencies.
Figure 1: Price Trend of Bitcoin (April 2013 - October 2016)
Figure 2: Price Trend of Ether (August 2015 - October 2016)
Preliminary statistical analysis indicated that the presence of substantial noise in the data,
making it difficult to accurately deduce trends in the market. Since the benefits of including
every coin in the database are outweighed by the imprecisions introduced to the model, trend
6
analysis was conducted on a subset of the database – this subset only comprised of coins that had
accumulated enough value and liquidity. More specifically, only coins worth over US$ 2, with a
market capitalization over US$ 1 million, were considered. The regression, following the
equation given below, measures average weekly change in cryptocurrency market price over a
period of 178 weeks to estimate the future weekly price changes.
Weekly Price𝑖 = 𝛽0 + 𝛽1 × Period𝑖 + 𝜀𝑖
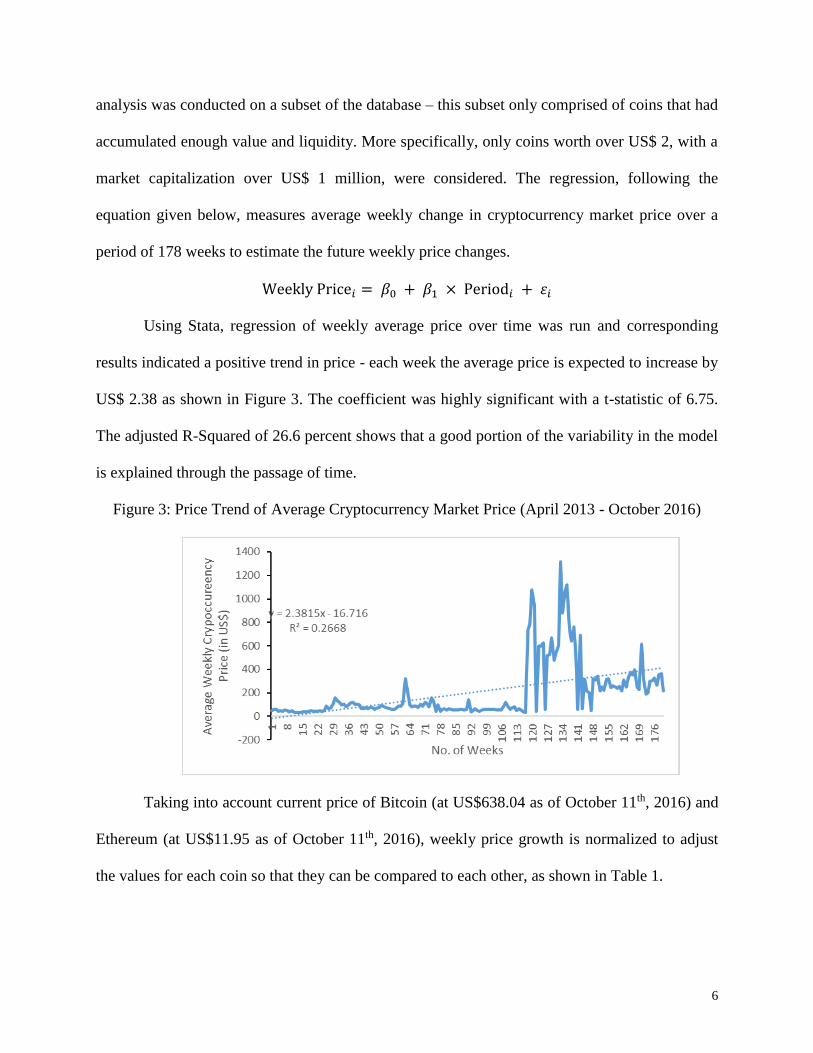
Using Stata, regression of weekly average price over time was run and corresponding
results indicated a positive trend in price - each week the average price is expected to increase by
US$ 2.38 as shown in Figure 3. The coefficient was highly significant with a t-statistic of 6.75.
The adjusted R-Squared of 26.6 percent shows that a good portion of the variability in the model
is explained through the passage of time.
Figure 3: Price Trend of Average Cryptocurrency Market Price (April 2013 - October 2016)
Taking into account current price of Bitcoin (at US$638.04 as of October 11th, 2016) and
Ethereum (at US$11.95 as of October 11th, 2016), weekly price growth is normalized to adjust
the values for each coin so that they can be compared to each other, as shown in Table 1.
7
Table 1: Normalizing the Price of Bitcoin and Ether based on Market Price Trend
It is expected that, on average, Bitcoin grows at US$ 2.33 per week whereas Ether at
$0.05 per week. Consequently, in 5 years, or 260 weeks, one would expect each coin to be traded
as shown below in Table 2.
Table 2: Estimating the Future Price of Bitcoin and Ether
This approach makes a few bold assumptions worthy of discussion. The most significant
assumption is that past growth in the trading value of these coins is indicative of their future
trajectory. There are more detailed models that contain other driving factors, such as market
change, risk appetite, investor sentiment, and supply and demand, which also introduce errors
and require a deeper analysis. To be specific, several factors that affect Bitcoin and the
cryptocurrency market cannot be quantified, such as investors’ sentiment, and the advancement
of technology, etc. Secondly, looking at the price trends for each coin below, one may very well
see their prices do not follow linear patterns. However, the choice to fit the data to a linear
regression was deliberate and predominantly due to conservatism. The relatively long period of
dataset, the accelerated growth of Bitcoin and Ether leading to a conservative measure of growth
for the cryptocurrency market.
8
Cryptocurrency Demand and Supply Model
The second approach is based on a model introduced by Needham and Company LLC for
the valuation of Bitcoin’s price. This approach was used to predict Bitcoin price using its future
demand and supply, but was expanded to also estimate the price of Ether.
Estimating Future Demand of Bitcoin & Ether
The primary demand for cryptocurrencies, such as Bitcoin and Ether, in the future will
stem from its utility as an alternative payment channel and as a digital asset.
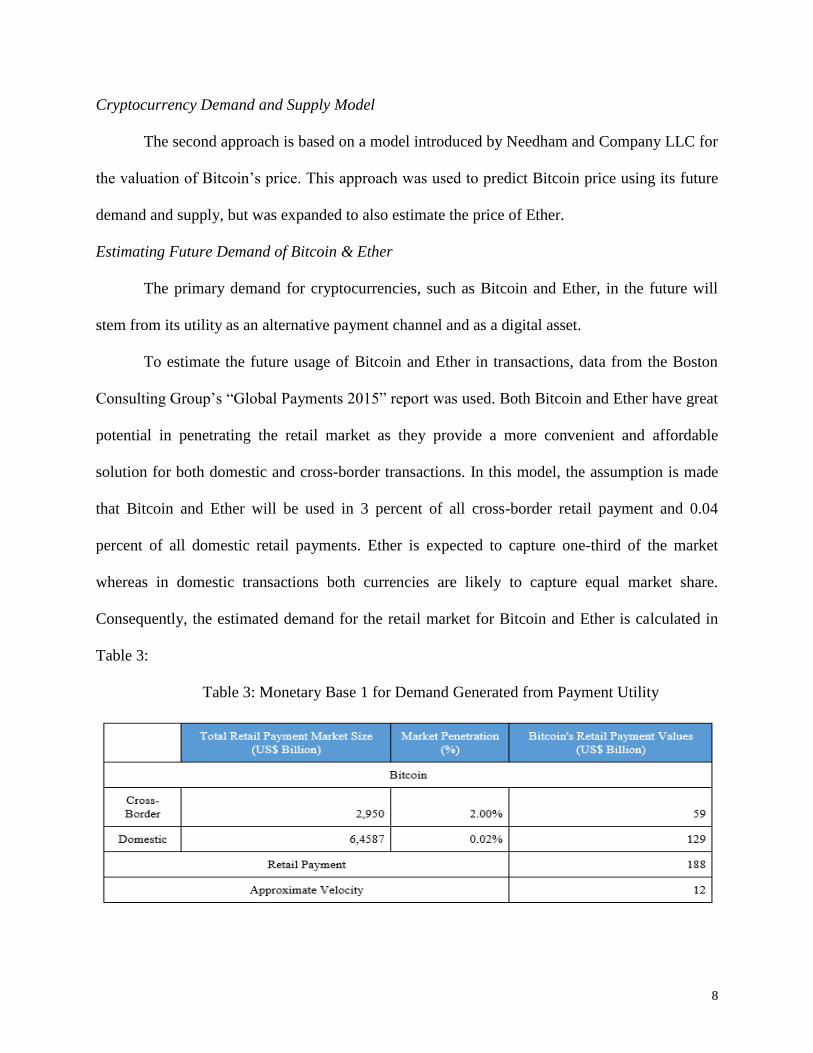
To estimate the future usage of Bitcoin and Ether in transactions, data from the Boston
Consulting Group’s “Global Payments 2015” report was used. Both Bitcoin and Ether have great
potential in penetrating the retail market as they provide a more convenient and affordable
solution for both domestic and cross-border transactions. In this model, the assumption is made
that Bitcoin and Ether will be used in 3 percent of all cross-border retail payment and 0.04
percent of all domestic retail payments. Ether is expected to capture one-third of the market
whereas in domestic transactions both currencies are likely to capture equal market share.
Consequently, the estimated demand for the retail market for Bitcoin and Ether is calculated in
Table 3:
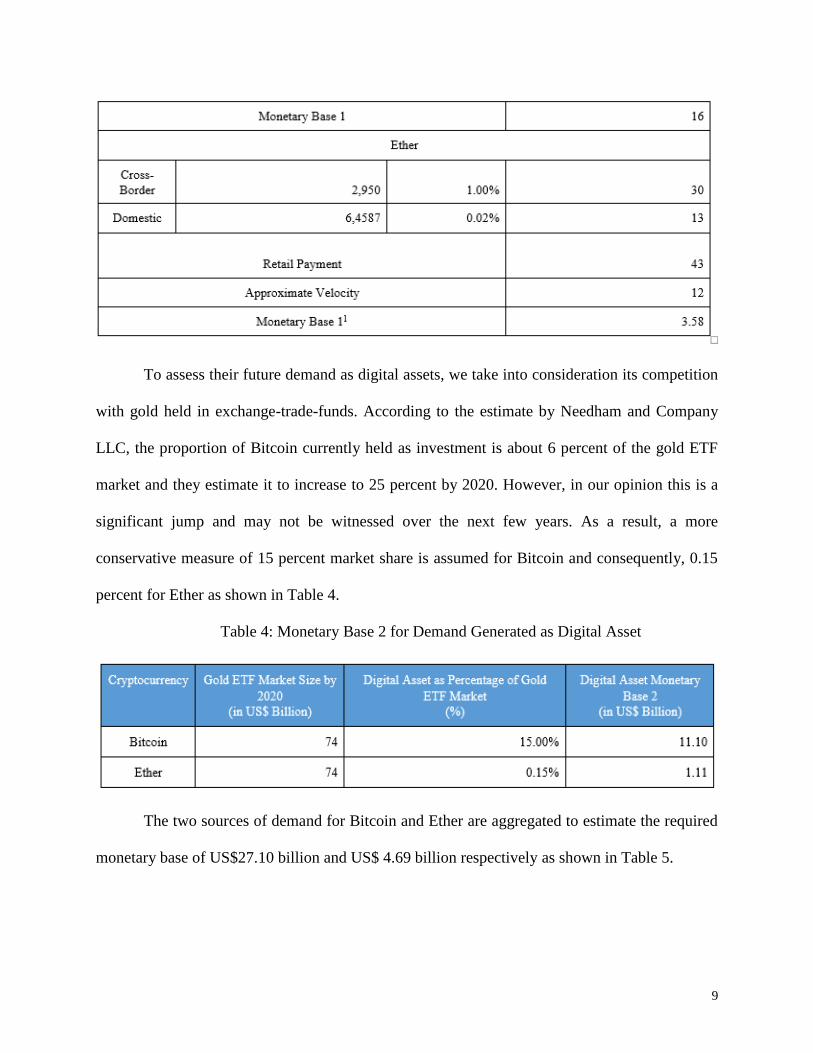
Table 3: Monetary Base 1 for Demand Generated from Payment Utility
9
To assess their future demand as digital assets, we take into consideration its competition
with gold held in exchange-trade-funds. According to the estimate by Needham and Company
LLC, the proportion of Bitcoin currently held as investment is about 6 percent of the gold ETF
market and they estimate it to increase to 25 percent by 2020. However, in our opinion this is a
significant jump and may not be witnessed over the next few years. As a result, a more
conservative measure of 15 percent market share is assumed for Bitcoin and consequently, 0.15
percent for Ether as shown in Table 4.
Table 4: Monetary Base 2 for Demand Generated as Digital Asset
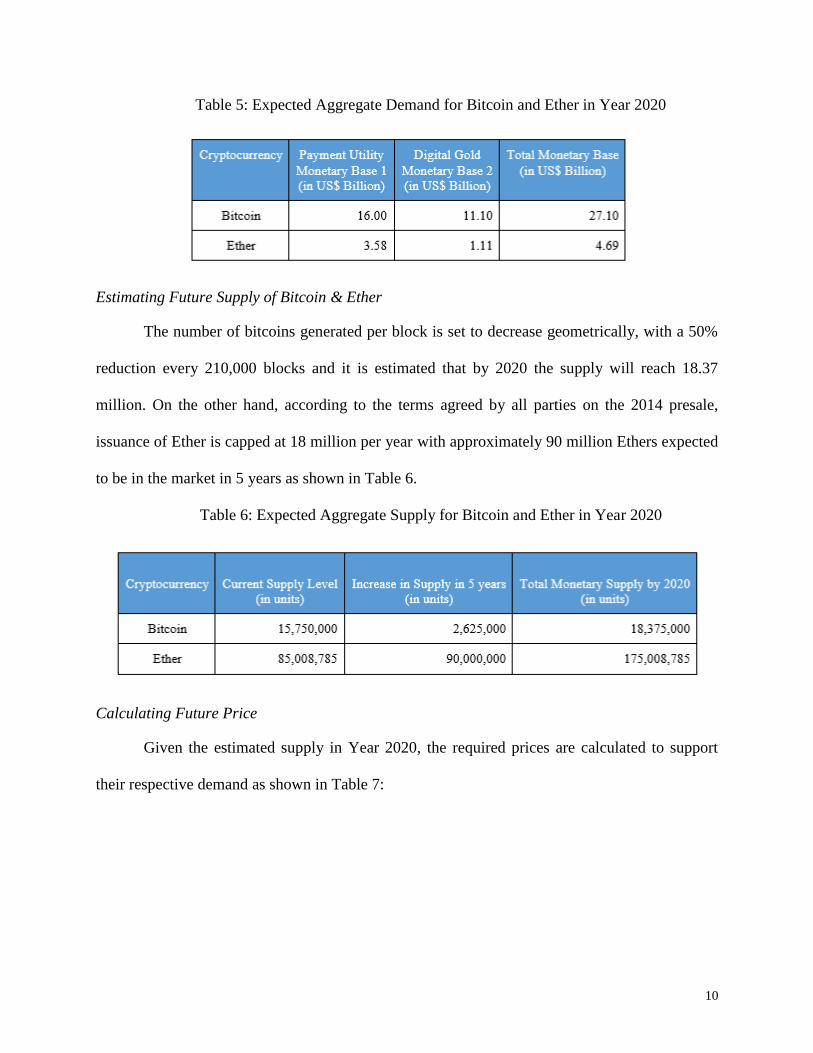
The two sources of demand for Bitcoin and Ether are aggregated to estimate the required
monetary base of US$27.10 billion and US$ 4.69 billion respectively as shown in Table 5.
10
Table 5: Expected Aggregate Demand for Bitcoin and Ether in Year 2020
Estimating Future Supply of Bitcoin & Ether
The number of bitcoins generated per block is set to decrease geometrically, with a 50%
reduction every 210,000 blocks and it is estimated that by 2020 the supply will reach 18.37
million. On the other hand, according to the terms agreed by all parties on the 2014 presale,
issuance of Ether is capped at 18 million per year with approximately 90 million Ethers expected
to be in the market in 5 years as shown in Table 6.
Table 6: Expected Aggregate Supply for Bitcoin and Ether in Year 2020
Calculating Future Price
Given the estimated supply in Year 2020, the required prices are calculated to support
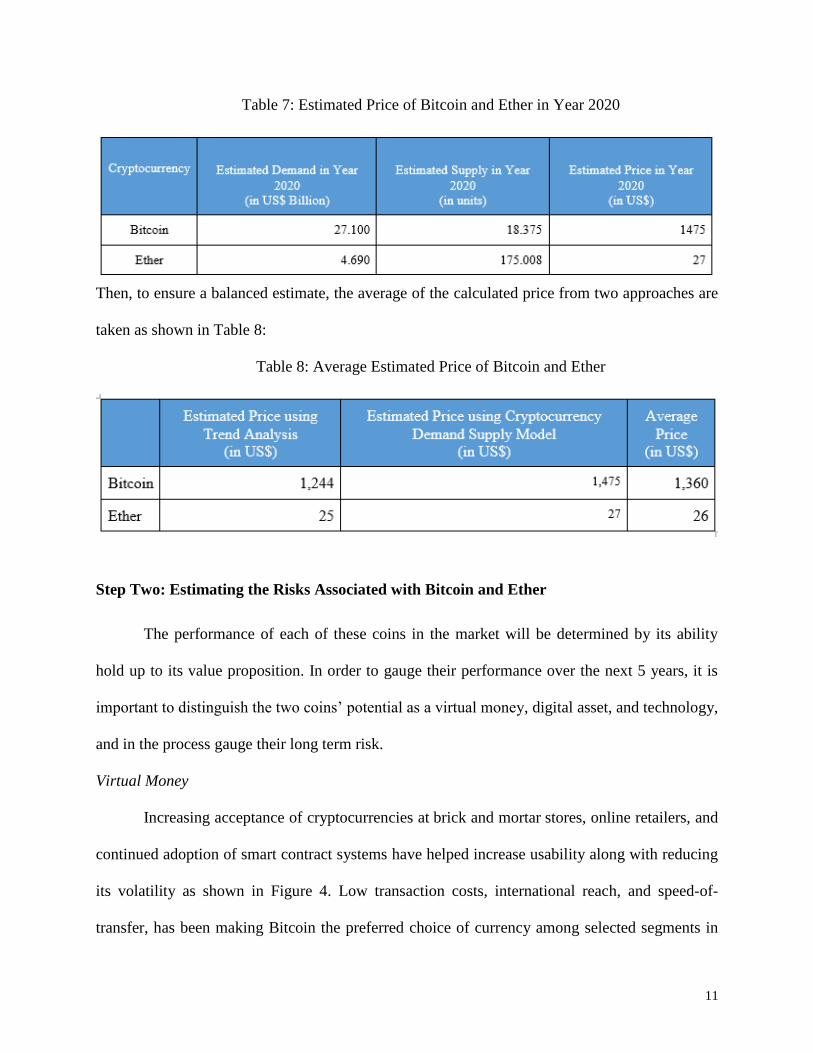
their respective demand as shown in Table 7:
11
Table 7: Estimated Price of Bitcoin and Ether in Year 2020
Then, to ensure a balanced estimate, the average of the calculated price from two approaches are
taken as shown in Table 8:
Table 8: Average Estimated Price of Bitcoin and Ether
Step Two: Estimating the Risks Associated with Bitcoin and Ether
The performance of each of these coins in the market will be determined by its ability
hold up to its value proposition. In order to gauge their performance over the next 5 years, it is
important to distinguish the two coins’ potential as a virtual money, digital asset, and technology,
and in the process gauge their long term risk.
Virtual Money
Increasing acceptance of cryptocurrencies at brick and mortar stores, online retailers, and
continued adoption of smart contract systems have helped increase usability along with reducing
its volatility as shown in Figure 4. Low transaction costs, international reach, and speed-of-
transfer, has been making Bitcoin the preferred choice of currency among selected segments in
12
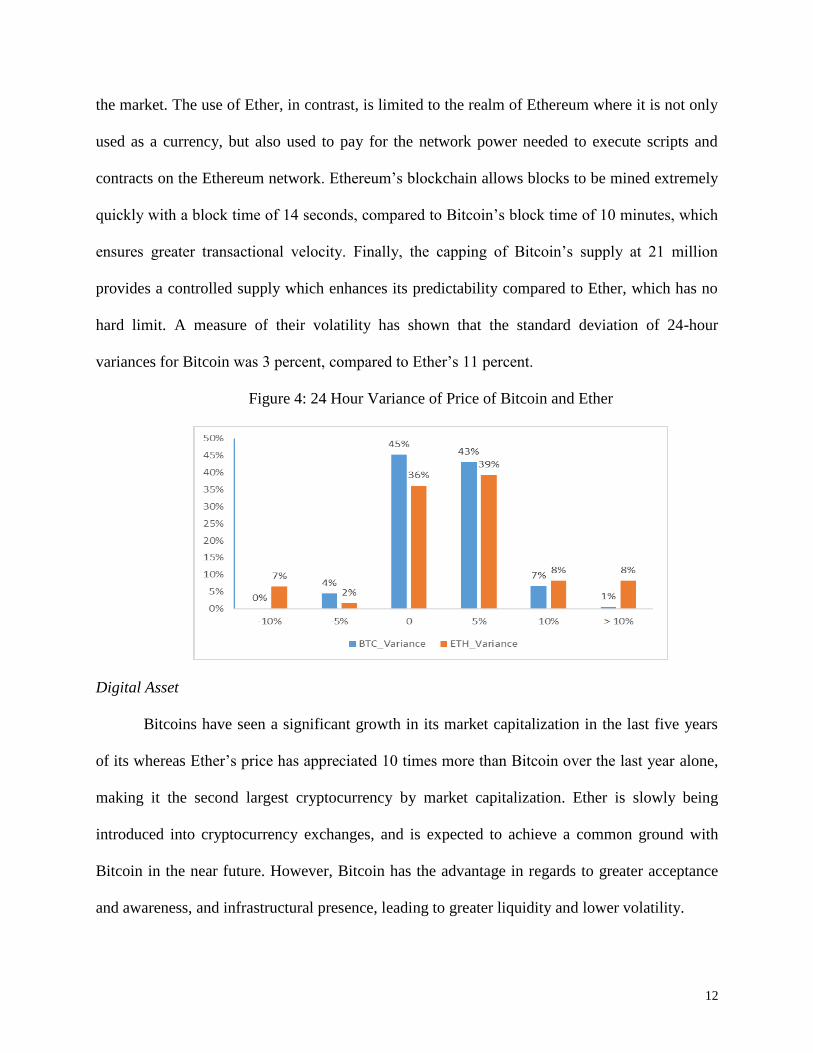
the market. The use of Ether, in contrast, is limited to the realm of Ethereum where it is not only
used as a currency, but also used to pay for the network power needed to execute scripts and
contracts on the Ethereum network. Ethereum’s blockchain allows blocks to be mined extremely
quickly with a block time of 14 seconds, compared to Bitcoin’s block time of 10 minutes, which
ensures greater transactional velocity. Finally, the capping of Bitcoin’s supply at 21 million
provides a controlled supply which enhances its predictability compared to Ether, which has no
hard limit. A measure of their volatility has shown that the standard deviation of 24-hour
variances for Bitcoin was 3 percent, compared to Ether’s 11 percent.
Figure 4: 24 Hour Variance of Price of Bitcoin and Ether
Digital Asset
Bitcoins have seen a significant growth in its market capitalization in the last five years
of its whereas Ether’s price has appreciated 10 times more than Bitcoin over the last year alone,
making it the second largest cryptocurrency by market capitalization. Ether is slowly being
introduced into cryptocurrency exchanges, and is expected to achieve a common ground with
Bitcoin in the near future. However, Bitcoin has the advantage in regards to greater acceptance
and awareness, and infrastructural presence, leading to greater liquidity and lower volatility.
13
Technology
Bitcoin is the original blockchain entity that primarily facilitates cash transactions,
whereas Ethereum exploits the full potential of the blockchain, and goes beyond the book-
keeping of financial transactions. In recent times, Ethereum has continued to attract the attention
from giants in the finance and technology industry alike, such as JPMorgan Chase, Microsoft,
and IBM, which have described it as Bitcoin 2.0: a superior technology, with many real world
applications.
One of the principal problems that Bitcoin has faced over the years revolves around
cybersecurity, with a few significant breaches and hacks which have resulted in the losses of
significant coins for the users. Nevertheless, these security breaches have very little to do with
the protocol itself, and more to do with the people and services handling and storing these coins.
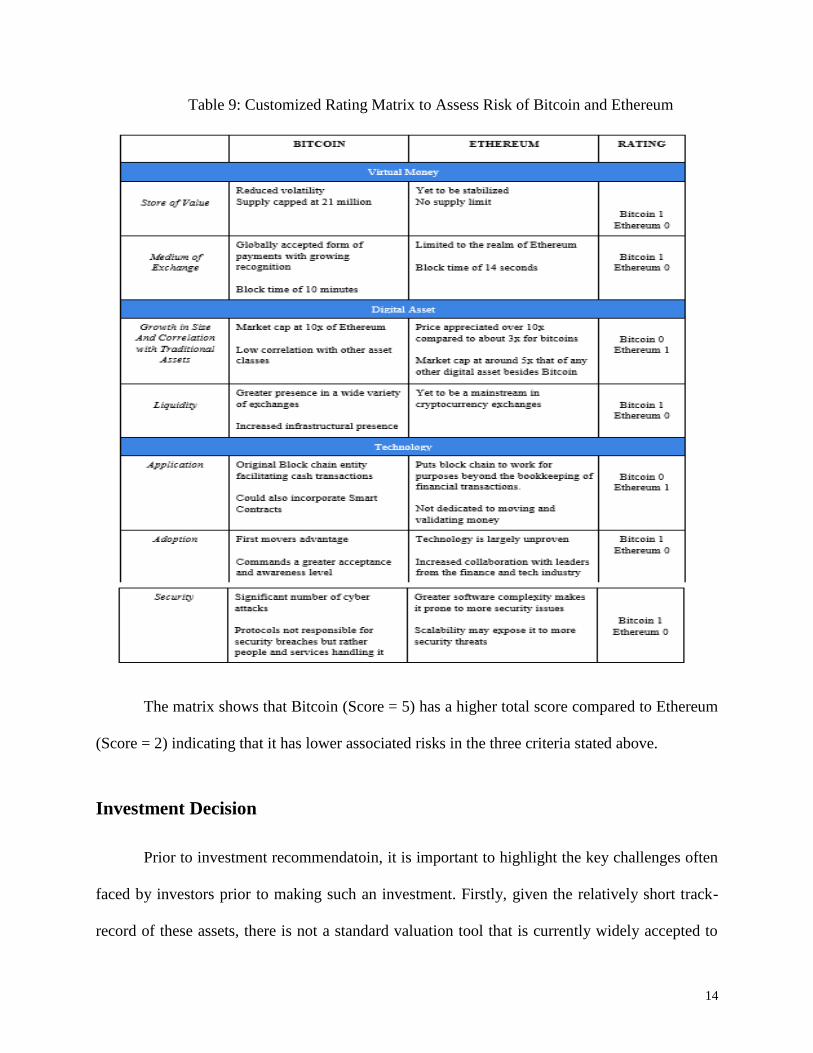
A customized risk rating matrix (See Table 9) is constructed to compare the risks
association with the two coins in regards to eight sub-categories - the superior coin is awarded a
point, which is then tallied. The currency with the highest score is expected to have lower risk.
14
Table 9: Customized Rating Matrix to Assess Risk of Bitcoin and Ethereum
The matrix shows that Bitcoin (Score = 5) has a higher total score compared to Ethereum
(Score = 2) indicating that it has lower associated risks in the three criteria stated above.
Investment Decision
Prior to investment recommendatoin, it is important to highlight the key challenges often
faced by investors prior to making such an investment. Firstly, given the relatively short track-
record of these assets, there is not a standard valuation tool that is currently widely accepted to
15
predict the trading prices of Bitcoin and Ether, and there has yet to be a consensus on the best
method to estimate the price trend. Secondly, although the world is shifting towards a more
digital ecosystem, there is no guarantee that technology is going to advance at the rate it has
been, and how the world economy is going to change, therefore making it difficult to quantify
their risk profiles. Finally, the cryptocurrency market is exposed to serious speculations, and new
players enter the market every day, making the application of any single valuation method
problematic.
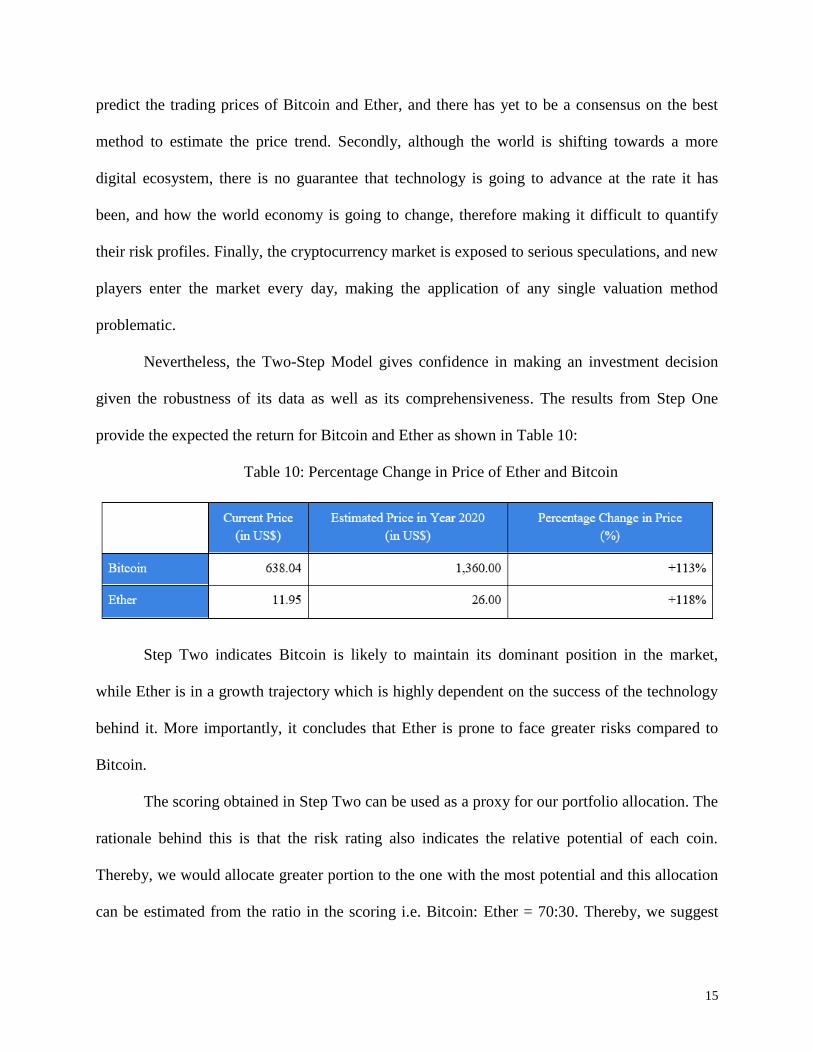
Nevertheless, the Two-Step Model gives confidence in making an investment decision
given the robustness of its data as well as its comprehensiveness. The results from Step One
provide the expected the return for Bitcoin and Ether as shown in Table 10:
Table 10: Percentage Change in Price of Ether and Bitcoin
Step Two indicates Bitcoin is likely to maintain its dominant position in the market,
while Ether is in a growth trajectory which is highly dependent on the success of the technology
behind it. More importantly, it concludes that Ether is prone to face greater risks compared to
Bitcoin.
The scoring obtained in Step Two can be used as a proxy for our portfolio allocation. The
rationale behind this is that the risk rating also indicates the relative potential of each coin.
Thereby, we would allocate greater portion to the one with the most potential and this allocation
can be estimated from the ratio in the scoring i.e. Bitcoin: Ether = 70:30. Thereby, we suggest
16
three portfolio combinations and these portfolios can be categorized into three distinct risk
levels:
❏ Low Risk - More investment in the less risky cryptocurrency i.e. Ether
❏ Moderate Risk - Contains a balanced share of both Bitcoin and Ether
❏ High Risk - More investment in the riskier cryptocurrency i.e. Bitcoin
Based on individual risk appetites, the investor may choose one of three combinations
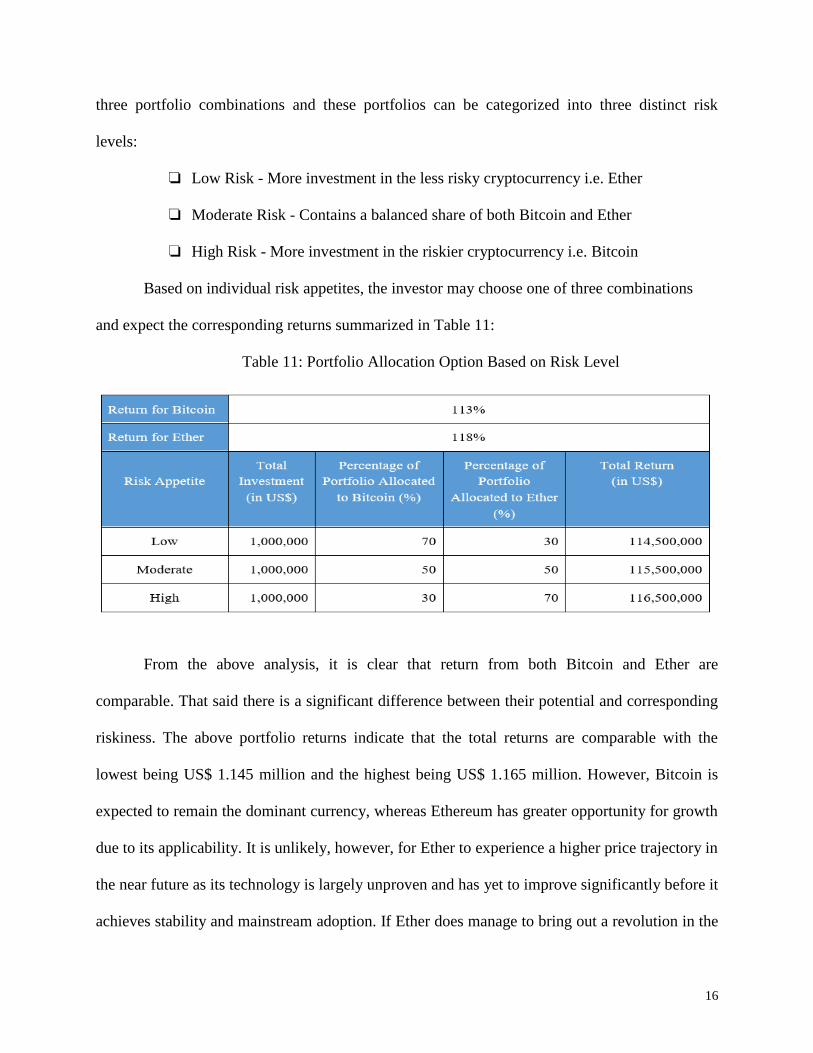
and expect the corresponding returns summarized in Table 11:
Table 11: Portfolio Allocation Option Based on Risk Level
From the above analysis, it is clear that return from both Bitcoin and Ether are
comparable. That said there is a significant difference between their potential and corresponding
riskiness. The above portfolio returns indicate that the total returns are comparable with the
lowest being US$ 1.145 million and the highest being US$ 1.165 million. However, Bitcoin is
expected to remain the dominant currency, whereas Ethereum has greater opportunity for growth
due to its applicability. It is unlikely, however, for Ether to experience a higher price trajectory in
the near future as its technology is largely unproven and has yet to improve significantly before it
achieves stability and mainstream adoption. If Ether does manage to bring out a revolution in the
17
adoption of smart contracts, then price trend is expected to increase significantly. Thereby, this
analysis recommends for a portfolio consisting of equal portion of Ether and Bitcoin, resulting in
an expected return of 115.5% over the next 5 years.
18
References Bouoiyour, J., R. Selmi, and A. Tiwari. 2014. Is BitCoin business income or speculative bubble? Unconditional vs.
conditional frequency domain analysis. MPRA Paper No. 59595. Germany: University Library of Munich.
Bouoiyour, J., and R. Selmi. 2015. What Does BitCoin Look Like? MPRA Paper No. 58091. Germany: University
Library of Munich.
Buchholz, M., J. Delaney, J. Warren, and J. Parker. 2012. “Bits and Bets, Information, Price Volatility, and Demand
for BitCoin, Economics 312. Retrieved from <www.bitcointrad ing.com/pdf/bitsandbets.pdf.> on 12th October
2016.
Buchholz, M., Delaney, J., Warren, J. and Parker, J. 2012. Bits and Bets, Information, Price Volatility, and Demand
for BitCoin. Economics 312. Retrieved from <http://www.bitcointrading.com/pdf/bitsandbets.pdf> on 12th October
2016.
Ciaian P., Rajcaniova, M. and Kancs, D. 2014. The Economics of BitCoin Price Formation. Economics and
Econometrics Research Institute.
Ciaian, P., Rajcaniova, M. & Kancs. 2016. The Digital Agenda of Virtual Currencies. Information Systems and e-
Business Management. Retrieved from
<http://publications.jrc.ec.europa.eu/repository/bitstream/JRC97043/the%20digital%20agenda%20of%20virtual%20
currencies_final.pdf> on 12th October 2016.
Coin Desk. Understanding Ethereum. 2016. Coin Desk. Retrieved from <
http://www.coindesk.com/research/understanding-ethereum-report> on 12th October 2016.
Coy, P. and Kharif, O. 2016. This Is Your Company On Blockchain. Bloomberg Businessweek. Retrieved from <
http://www.bloomberg.com/news/articles/2016-08-25/this-is-your-company-on-blockchain> on 12th October 2016.
Dab, Stefan et. Al. Global Payments 2015 – Listening to the Customer’s Voice. 2015. Boston Consulting Group.
Diversify Your Portfolio with an Allocation to Bitcoin. March 2016. Grayscale Investments. Retrieved from
<https://grayscale.co/wp-content/uploads/2016/03/Grayscale-Paper-1.pdf> on 12th October 2016.
He, Dong. 2016. Virtual Currencies and Beyond: Initial Considerations. IMF Discussion Notes. Retrieved from <
https://www.imf.org/external/pubs/ft/sdn/2016/sdn1603.pdf> on 12th October 2016.
Matta, M, Lunesu, I & Marchesi, M. 2015. The Predictor Impact of Web Search Media On Bitcoin Trading
Volumes. Conference: Information Filtering and Retrieval. Retrieved from
<https://www.researchgate.net/publication/282152077_The_Predictor_Impact_of_Web_Search_Media_On_Bitcoin
_Trading_Volumes> on 12th October 2016.
Needham & Company LLC. 2016. Bitcoin Price Model. Needham & Company LLC. Retrieved from <
https://needham.bluematrix.com/sellside/EmailDocViewer?encrypt=f33e2e42-a64c-49c4-ae1a-
bfc513744823&mime=pdf&co=needham&[email protected]&source=mail> on 12th October 2016
PwC. 2015. Money is no object: Understanding the evolving cryptocurrency market. PricewaterhouseCoopers.
Retrieved from < http://www.pwc.com/us/en/financial-services/publications/assets/pwc-cryptocurrency-
evolution.pdf> on 12th October 2016.
Kristoufek, L. 2013. BitCoin meets Google Trends and Wikipedia: Quantifying the relationship between phenomena
of the Internet era. Scientific Reports.
19
Kroll, J., I. Davey, and E. Felten. 2013.The Economics of BitCoin Mining, or BitCoin in the Presence of
Adversaries. WEIS 2013. Retrieved from
<http://weis2013.econinfosec.org/papers/KrollDaveyFeltenWEIS2013.pdf> on 12th October 2016.
Lee, T.B. 2014. These four charts suggest that BitCoin will stabilize in the future. Washington Post. Retrieved from
<http://www.washingtonpost.com/blogs/the-switch/wp/2014/02/03/these-four-charts-suggest-that-bitcoinwill-
stabilize-in-the-future> on 12th October 2016.
Shin, Laura. 2015. Should You Invest In Bitcoin? 10 Arguments In Favor. Retrieved from
<http://www.forbes.com/sites/laurashin/2015/12/11/should-you-invest-in-bitcoin-10-arguments-in-favor-as-of-
december-2015/#258f3fa3540e> on 12th October 2016.
Shin, Laura. 2015. 4 Reasons Why Bitcoin Represents A New Asset Class. Retrieved from
http://www.forbes.com/sites/laurashin/2016/06/02/4-reasons-why-bitcoin-represents-a-new-asset-
class/#4b4f324f5ce5 on 12th October 2016.
WEF. The future of financial infrastructure. 2016. World Economic Forum. Retrieved from <
http://www3.weforum.org/docs/WEF_The_future__of_financial_services.pdf> on 12th October 2016.
Weisnthal, J. 2013. Why Bitcoin has Value. Retrieved from <http://www.businessinsider.com/why-bitcoin-has-
value-2013-12> on 12th October 2016.
Zohar, A. 2015. Bitcoin Under the Hood. Communication of the ACM. Retrieved from <
http://cacm.acm.org/magazines/2015/9/191170-bitcoin/abstract> on 12th October 2016.

20


![猿でもわかる 入門 - OSPN · 入門 @syrohei. Ethereumはイーサリアム(英: Ethereum)は、イーサリアム・プロジェクト[1]により開 ... additional component](https://img.pdfslide.tips/doc/110x75/5fce048c0b8c9d11763a186b/coe-e-ospn-e-syrohei-ethereumfffie.jpg)