Embed Size (px)
Citation preview
Francisca Sofia Rodrigues de Freitas Pereira
Licenciada em Genética e Biotecnologia
Blocking tumor exosome release using nanovectorization systems
Dissertação para obtenção do Grau de Mestre em Genética Molecular e Biomedicina
Orientador: Maria Alexandra Núncio de Carvalho Ramos Fernandes, Professora Doutora, FCT/UNL
Co-orientador: Pedro Viana Baptista, Professor Doutor, FCT/UNL
Júri: Presidente: Professor Doutor José Paulo Nunes de Sousa Sampaio
Arguente: Professora Doutora Paula Alexandra Quintela Videira Vogal: Professora Doutora Alexandra Núncio de Carvalho Ramos Fernandes
Lisboa, 2015

ii
iii
UNIVERSIDADE NOVA DE LISBOA
FACULDADE DE CIÊNCIAS E TECNOLOGIA
DEPARTAMENTO DE CIÊNCIAS DA VIDA
Francisca Sofia Rodrigues de Freitas Pereira
Blocking tumor exosome release using
nanovectorization systems
Dissertação apresentada para obtenção do Grau de
Mestre em Genética Molecular e Biomedicina, pela
Universidade Nova de Lisboa, Faculdade de
Ciências e Tecnologia
Orientadora:
Professora Doutora Alexandra Fernandes (FCT/UNL)
Co-orientador:
Professor Doutor Pedro Viana Baptista (FCT/UNL)
Lisboa 2015

iv
v
Blocking tumor exosome release using nanovectorization systems
Copyright © Francisca Sofia Rodrigues de Freitas Pereira, Faculdade de Ciências e Tecnologia,
Universidade Nova de Lisboa.
A Faculdade de Ciências e Tecnologia e a Universidade Nova de Lisboa têm o direito, perpétuo e
sem limites geográficos, de arquivar e publicar esta dissertação através de exemplares impressos
reproduzidos em papel ou de forma digital, ou por qualquer outro meio conhecido ou que venha a ser
inventado, e de a divulgar através de repositórios científicos e de admitir a sua cópia e distribuição
com objectivos educacionais ou de investigação, não comerciais, desde que seja dado crédito ao
autor e editor.

vi

vii
ACKNOWLEDGMENTS
At first, I want to thank my supervisors Professor Alexandra Fernandes and Professor Pedro
Viana Baptista for the opportunity they gave me to work on these laboratories and for all the help
they provided me along the away. Thank you for being demanding with me, it made me realize that I
can do much more than I thought and made me learn a lot.
To Catarina Rodrigues, who guided me through my work since the beginning, thank you for
all the patience, all the advices and all the help when I needed.
Thanks to my colleagues here Carolina, João, Joana, Luís Raposo, Pedro, Sílvia, Sofia and
Soraia for all the help, all the laughs, all the jokes and for making easier to surpass those not so good
moments. Thanks to my colleagues of 315 for all the help and for being so fun. You are a very nice
group and I really enjoyed working with you.
To Marta Fernandes, thank you for the company ant the help in those moths you were at the
lab. I really liked to work with you and I hope you have learnt something with me.
For all the weakly dinners, for being my “big brothers” here, telling me all the funny stories
and for all the company, I want to thank to the boys and girls “from Vila Real”. We created a very
good group here and I am very happy for that!
To Lili, Mariana and David thank you a lot for all the dinners, all the talks, the laughs. It is a
great friendship we started and I know no matter the distance we will keep talking!
To my friends, for being always there, always making me laugh and feel better. Although we
just see each other twice a month or so, I know we will always be us! Special thanks to my best
friends Tomás, Jony, Lu and Gonçalo for all the fun and all the care!
To my oldest friend Mariana, thank you for all the help and despite we don’t talk too much I
know I can count on you. Those times when we lived together in Lisbon were good times! To Ângela,
for the company here in Lisbon!
I want to express my gratitude to my grandparents, who always believed in me, always
supported me and called me every Wednesday night and every weekend to sheer me up and feel a
little bit closer to home. Thanks to my grandmother and all my big family for being so united and so
fun!
At last, I want to thank to the most important persons in my life: my little sister for annoying
me in a way that only she knows!, for all the “bullying” she gives me and all the good times we have
together and I am sorry for not being always around; to my parents, my greatest supporters, thank
you for always believing in me and making me believe, for not letting me give up of anything and for
all the effort they made so I could get here. Thank you so much!

viii
ix
RESUMO
Os exossomas são pequenas vesículas membranares secretados por muitas células, normais ou
malignas, e são encontrados em vários fluídos como saliva, plasma e leite materno. Na última
década, o interesse nestas vesículas tem vindo a crescer uma vez que foi descoberto que, para além
de terem funções benéficas como a remoção de detritos e proteínas desnecessárias durante o
processo de maturação celular, os exossomas podem também interagir com outras células e
transferir informação entre elas, podendo promover o avanço de doenças como o cancro. A presente
tese teve como objetivo utilizar nanopartículas de ouro como veículos para o silenciamento génico,
numa tentativa de reduzir a secreção de exossomas por parte das células tumorais, regulada pela
proteína Rab27a, assim como comparar a quantidade de exossomas secretados entre duas linhas
tumorais mamárias, MCF7 e MDA. Variações na expressão do gene RAB27A foram avaliadas por
PCR quantitativa em tempo real e, como esperado, foi demonstrado haver uma diminuição nessa
expressão. Os exossomas foram isolados e purificados por dois métodos diferentes,
ultracentrifugação e o Kit comercial ExoQuick™ Solution, sendo depois caracterizados por Western
blot. Foi demonstrado que ExoQuick™ Solution é mais eficiente para o isolamento de exossomas e
também que as células MDA secretam uma maior quantidade dos mesmos. Um ensaio adicional foi
realizado em que os exossomas isolados a partir das células MCF7 foram incubados com uma linha
celular normal de brônquios e traqueia (BTEC), com o objetivo de observar a internalização dos
exossomas por outras células e a promoção da comunicação celular. A análise da expressão dos
genes c-Myc e miR-21 demonstrou haver uma maior expressão nas células incubadas com
exossomas derivados de células tumorais do que nas células controlo, sem exossomas, o que nos
permite concluir que o uptake de exossomas e a transferência de informação ocorreu.
Palavras-chave: Exossomas, Cancro, Nanopartículas de ouro, Silenciamento génico, Comunicação
celular

x
xi
ABSTRACT
Exosomes are small membrane vesicles secreted by most cell types, either normal or malignant
and are found in most body fluids such as saliva, plasma and breast milk. In the past decade, the
interest in these vesicles has been growing more and more since it was found that besides their
beneficial functions such as the removal of cellular debris and unnecessary proteins during cell
maturation process, they can also interact with other cells and transfer information between them, thus
helping diseases like cancer to progress. The present work intended to use gold nanoparticles as
vehicles for gene silencing in an attempt to reduce the tumor-derived exosome secretion, regulated by
Rab27a protein, and also aimed to compare the exosome secretion between two breast cell lines,
MCF7 and MDA. Changes in RAB27A gene expression were measured by Real-time Quantitative
PCR and it was revealed a decreased in RAB27A gene expression, as expected. Exosomes were
isolated and purified by two different methods, ultracentrifugation and the commercial kit ExoQuick™
Solution, and further characterized using Western Blot analysis. ExoQuick™ Solution was proven to
be the most efficient method for exosome isolation and it was revealed that MDA cells secrete more
exosomes. Furthermore, the isolated MCF7-derived exosomes were placed together with a normal
bronchial/tracheal epithelial cell line (BTEC) for an additional assay, which aimed to observe the
uptake of exosomes by other cells and the exosomes’ capability of promoting cell-cell communication.
This observation was made based on alterations in the expression levels of c-Myc and miR-21 genes
and the fact that they both have an increased expression in BTEC cells incubated with tumor-derived
exosomes when compared to control cells (without incubation with the exosomes) lead us to the
conclusion that the exosome uptake and exchange of information between the exosomes and the
normal cells did occurred.
Key words: Exosomes, Cancer, Gold Nanoparticles, Gene Silencing, Cell-cell Communication

xii
xiii
TABLE OF CONTENTS
1 INTRODUCTION ............................................................................................................................... 1
1.1 CANCER .................................................................................................................................... 1
1.1.1 TUMORIGENESIS .............................................................................................................. 1
1.1.1.1 MAIN CHARACTERISTICS OF CANCER .......................................................................... 3
1.1.2 CANCER INCIDENCE AND MORTALITY ............................................................................. 5
1.1.2.1 BREAST CANCER .......................................................................................................... 6
1.1.3 CANCER THERAPY ............................................................................................................ 7
1.1.3.1 NANOTECHNOLOGY FOR THERAPY ............................................................................. 8
1.1.3.1.1 GOLD NANOPARTICLES ....................................................................................... 10
1.2 EXOSOMES ............................................................................................................................. 12
1.2.1 EXOSOMES IN CANCER AND HEALTH - BIMODAL ROLE OF EXOSOMES ....................... 12
1.2.2 BIOGENESIS AND RELEASE OF EXOSOMES .................................................................... 14
1.2.2.1 RAB27A ...................................................................................................................... 16
1.2.3 EXOSOMES COMPOSITION ............................................................................................ 17
1.2.4 UPTAKE OF EXOSOMES BY CELLS .................................................................................. 19
1.2.5 EXOSOMES IN BREAST CANCER ..................................................................................... 21
1.3 SCOPE OF THE WORK ............................................................................................................ 22
2 MATERIAL AND METHODS ............................................................................................................ 23
2.1 CELL LINES.............................................................................................................................. 23
2.1.1 CELL LINE HANDLING AND MAINTENANCE ................................................................... 23
2.1.2 CELL VIABILITY MTS ASSAY ............................................................................................ 24
2.2 GOLD NANOPARTICLES.......................................................................................................... 25
2.2.1 GOLD NANOPARTICLES SYNTHESIS ............................................................................... 25
2.2.2 FUNCTIONALIZATION WITH POLYETHYLENE GLYCOL (PEG).......................................... 26
2.2.3 AuNP@PEG FUNCTIONALIZATION WITH THIOLATED OLIGONUCLEOTIDES ................. 26
2.2.4 QUANTIFICATION OF FUNCTIONALIZED OLIGONUCLEOTIDES ON AuNPs’ SURFACE ... 27
2.3 GENE EXPRESSION EVALUATION ASSAY ................................................................................ 27
2.3.1 RNA EXTRACTION .......................................................................................................... 27
2.3.2 cDNA SYNTHESIS ............................................................................................................ 28
2.3.3 cDNA AMPLIFICATION BY REAL QUANTITATIVE TIME PCR (qPCR)................................ 28
2.4 EXOSOME EXTRACTION AND PURIFICATION ........................................................................ 30
2.5 QUANTIFICATION AND CHARACTERIZATION OF EXOSOMES – WESTERN BLOT ................... 31
xiv
2.6 UPTAKE OF EXOSOMES BY NORMAL CELL LINES .................................................................. 32
2.6.1 EVALUATION OF C-MYC GENE EXPRESSION .................................................................. 32
2.6.1 MIR-21 QUANTIFICATION .............................................................................................. 33
3 RESULTS AND DISCUSSION ............................................................................................................ 35
3.1 SYNTHESIS AND CHARACTERIZATION OF GOLD NANOPARTICLES (AuNPs) .......................... 35
3.2 RAB27A GENE SILENCING (IN MCF7 AND MDA) ................................................................... 36
3.3 EXOSOME QUANTIFICATION ................................................................................................. 39
3.3.1 COMPARISON BETWEEN ISOLATION METHODS – ULTRACENTRIFUGATION AND
EXOQUICK™ SOLUTION ................................................................................................................. 39
3.3.2 EXOSOME QUANTIFICATION IN MCF7 AND MDA CELLS ............................................... 41
3.3.3 CHARACTERIZATION OF EXOSOMES - WESTERN BLOT ................................................. 43
3.4 UPTAKE OF EXOSOMES BY NORMAL CELLS ........................................................................... 45
3.4.1 C-MYC GENE EXPRESSION ............................................................................................. 45
3.4.2 MIR-21 QUANTIFICATION .............................................................................................. 47
4 CONCLUSIONS AND FUTURE PERSPECTIVES ................................................................................. 49
5 REFERENCES .................................................................................................................................. 51
6 APPENDICES ................................................................................................................................. xxiii
xv
FIGURE INDEX
Figure 1.1: Illustration of the main capabilities acquired by cancer cells during tumorigenesis (Adapted from Hanahan and Weinberg, 2011). ...................................................................................... 2
Figure 1.2: Incidence and mortality rates of the most common cancers worldwide (Adapted from “GLOBOCAN,” 2012). ..................................................................................................................... 5
Figure 1.3: Breast cancer incidence and mortality rates in the United States (“Cancer of the breast - SEER Stat Fact Sheets,” 2012). ................................................................................................ 6
Figure 1.4: Schematic representation of gold nanoparticles functionalized with several biomolecules (Adpated from Conde et al., 2012). ................................................................................... 9
Figure 1.5: Schematic representation of nanoparticles internalization and target mRNA with subsequent block of protein translation (Adapted from Zhang et al., 2014). ........................................ 11
Figure 1.6: Schematic illustration of the exosomes’ biogenesis (Adapted from Bellingham et al., 2012). ..................................................................................................................................................... 15
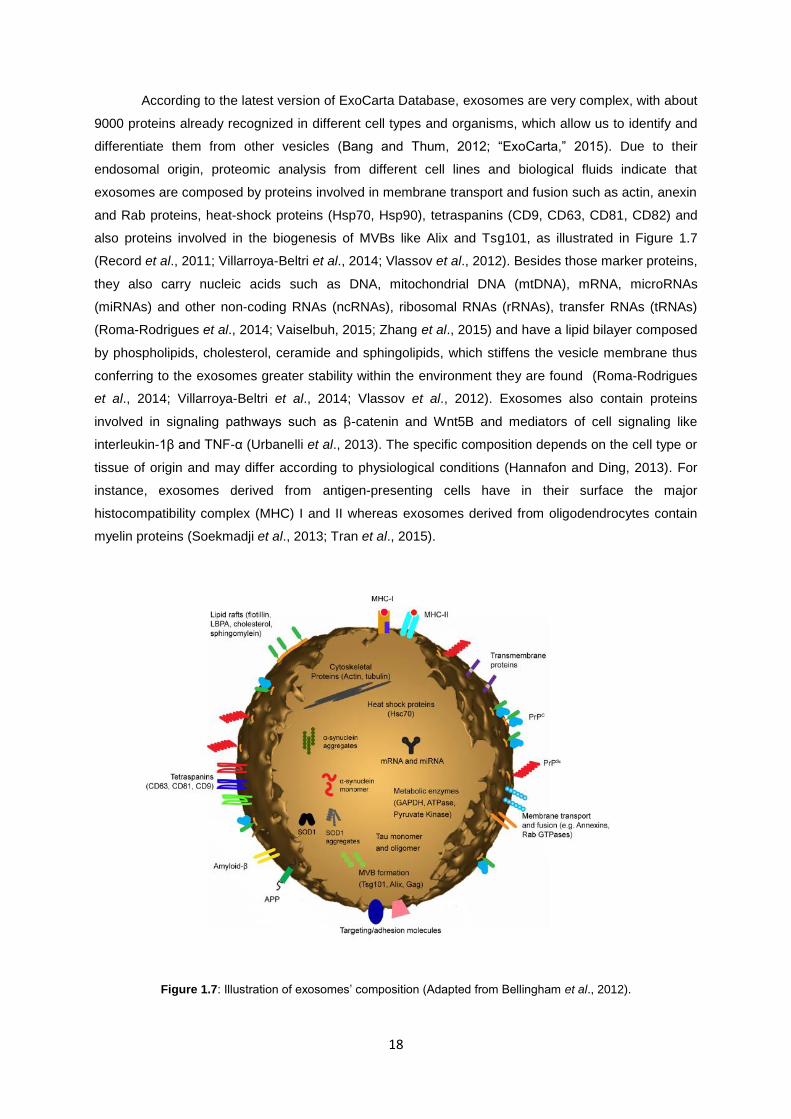
Figure 1.7: Illustration of exosomes’ composition (Adapted from Bellingham et al., 2012). ................ 18
Figure 1.8: Exosome uptake by recipient cells by a) receptors in the surface, b) fusion with the cell membrane or c) phagocytosis (Adapted from Kahlert and Kalluri, 2013). ...................................... 20
Figure 3.1: Characterization of naked gold nanoparticles and functionalized with PEG (AuNP@PEG) and with PEG and antisense-Rab27a (AuNP@PEG@antisense-Rab27a) by A) UV/vis spectroscopy in the wavelength range of 400-800 nm (pH 7.0) with the absorbance peak at 518 nm; and B) DLS measurements with diameter distribution of naked AuNPs (blue), AuNP@PEG (red) and AuNP@PEG@antisense-Rab27a (green). ...................................................... 36
Figure 3.2: RAB27A gene expression evaluation in MCF7 cells incubated with AuNP@PEG and AuNP@PEG@antisense-Rab27a with concentrations of 20 nM and 30 nM. Gene expression variation is calculated through 2
-ΔΔCt, after normalization with RNA18S gene and
control cells (exosome-depleted medium). The data are represented as means ± SEM of at least three independent experiments. ................................................................................................... 37
Figure 3.3: RAB27A gene expression evaluation in MCF7 cells (A) and MDA cells (B) incubated with AuNP@PEG and 20 nM of AuNP@PEG@antisese-Rab27a for 6 h and 12 h. Gene expression variation is calculated through 2
-ΔΔCt, after normalization with RNA18S gene
and control cells (exosome-depleted medium). The data are represented as means ± SEM of at least three independent experiments. ................................................................................................... 38
Figure 3.4: Cell viability in MCF7 and MDA cells after incubation with AuNP@PEG and AuNP@PEG@antisense-Rab27a with exposure times of 6 h (A) and 12 h (B). Cell viability values were normalized in relation to the control group without exosomes. The data are represented as means ± SEM of at least two independent experiments. ............................................. 39
Figure 3.5: Exosome quantification (µg/mL) of both supernatant 1 and 2 after isolation by ultracentrifugation method, with and without sucrose gradient. The data are represented as means ± SEM of at least two independent experiments; *p < 0.05 as compared with ultracentrifugation with sucrose values. ................................................................................................ 40
Figure 3.6: Exosome quantification (µg/mL) after isolation by ExoQuick™ Solution, with and without Amicon® Ultra-0.5 Filters. ......................................................................................................... 41
xvi
Figure 3.7: Quantification of exosomes in MCF7 and MDA cells after isolation with ExoQuick™ Solution. The data are represented as means ± SEM of at least two independent experiments. ........ 42
Figure 3.8: Quantification of exosomes in MCF7 and MDA cells when incubated with AuNP@PEG and AuNP@PEG@antisense-Rab27a. The data are represented as means ± SEM of at least two independent experiments; *p < 0.005, as compared with the control group. The values were normalized in relation to the MCF and MDA control group without AuNP (only exosome-depleted medium). ................................................................................................................. 43
Figure 3.9: SDS-PAGE gel stained with Coomasie blue. Samples loaded into wells 1 and 2 correspond to exosomes lysates extracted from supernatants 1 and 2 by ultracentrifugation. Samples from the 3
rd to the 6
th well correspond to exosome lysates extracted from supernatants
1 and 2 by Exoquick Solution. ............................................................................................................... 44
Figure 3.10: Western blot analysis of Alix protein in different amount of exosomes purified from supernatant 1 and 2 by ExoQuick Solution. Samples 1, 3 and 5 correspond to supernatant 1; samples 2, 4 and 6 correspond to supernatant 2. (M= molecular weight marker, NZYColour Protein Marker II). .................................................................................................................................. 45
Figure 3.11: c-Myc gene expression evaluation in BTEC cells after incubation with 50 µg of MCF7-derived exosomes. Data was normalized relatively to RNA18S gene expression and subsequent normalization with BTEC cells that were not exposed to MCF7-derived exosomes. The data are represented as means ± SEM of at least two independent experiments. ....................... 46
Figure 3.12: Intracellular c-Myc gene expression in BTEC cells (A) and MCF7 cells (B). Data analyzed relatively to RNA18S gene expression. The data are represented as means ± SEM of at least two independent experiments; *p < 0.005, as compared with c-Myc expression at 30 min. ........................................................................................................................................................ 47
Figure 3.13: miR-21 expression variations in BTEC cells after incubation for 30 min and 2 h with 50 µg of MCF7-derived exosomes, with normalization to miRNA U6. Only one experiment was performed. ...................................................................................................................................... 48
Figure 3.14: Cell viability in BTEC cell line incubated with 50 µg of tumor-derived exosomes. Cell viability values were normalized in relation to the control group without exosomes. The data are represented as means ± SEM of at least two independent experiments. ....................................... 48
Figure A.1: Coverage of AuNP surface with PEG. A) Absorbance spectra of DTNB after reaction with PEG. B) Calibration curve for PEG chains. Concentration can be calculated with the equation Abs412 nm= 921x + 9,0378, being x= [PEG, mg/mL]. C) Variation of PEG concentration incubated with AuNPs. It is shown that the 100% saturation point is obtained with 0.01mg/mL of PEG and above that no more PEG can bound to the AuNP’s surface……………... xxiii
Figure A.2: Oligonucleotide quantification. Calibration curve obtained from fluorescence spectra. The amount of fluorophore-labelled oligonucleotides present in the supernatant can be determined using the following equation: Y= 6124,9x + 74,97 (R
2= 0,9904)……………………….. xxiv
Figure A.3: Characterization of gold nanoparticles by TEM. A) TEM images of naked AuNPs; B) TEM images of AuNP@PEG; C) Histogram with size distribution of naked AuNPs D) Histogram with size distribution of AuNP@PEG……………………………………………………….. xxv
xvii
TABLE INDEX
Table 2.1: Concentrations used for cDNA template, primers forward and reverse and MgCl2 for amplification by qPCR. .......................................................................................................................... 28
Table 2.2: Sequences of the primers used and expected amplification product size. ......................... 29
Table 2.3: qPCR cycling conditions. ..................................................................................................... 29
Table 2.4: c-Myc primers' sequence and amplification product size. ................................................... 33

xviii
xix
ABBREVIATION LIST
A Adenin
Abs Absorbance
Abs260/230 Ratio between absorbance measured at 260nm and 230nm
Abs260/280 Ratio between absorbance measured at 260nm and 280nm
ACTB Gene that codes for β-actin
AuNP Gold nanoparticles
BSA Bovine Serum Albumin
BTEC Primary Bronchial/Tracheal Epithelial Normal Cells
C Cytosine
cDNA Complementar DNA
CO2 Carbon dioxide
Ct Cycle threshold
DLS Dynamic Light Scattering
DMEM Dulbecco’s Modified Eagle Medium
DNA Deoxyribonucleic Acid
DNTB 5,5’-dithio-bis(2-nitrobenzoic) acid
DTT DL – Dithiothreitol
ESCRT Endosomal Sorting Complexes Required for Transport
Exo-FBS Exosome depleted Fetal Bovine Serum
FBS Fetal Bovine Serum
G Guanidine
H2O Water
HAuCl4 Chloroauric Acid
HCl Chloridric Acid
HNO3 Nitric Acid
HRP Horseradish Peroxidase
SPR Localized Surface Plasmon Resonance
MCF7 Human Breast Cancer Cell Line
xx
MDA-MB-453 Human Breast Cancer Cell Line
MgCl2 Magnesium Chloride
mRNA Messenger RNA
miRNA Micro Ribonucleic Acid
MTS (3-(4,5-dimethylthiazol-2-yl)-5-(3-(carboxymethoxyphenyl)-2-(4-(sulfopheenyl)-
2H-tetrazolium
MVBs Multivesicular Bodies
PEG Poly(ethylene glycol)
PBS Phosphate Buffered Saline
PCR Polymerase Chain Reaction
PMSF Phenylmethylsulfonyl Fluride
qPCR Quantitative Polymerase Chain Reaction
RNA Ribonucleic Acid
SDS Sodium Dodecyl Sulfate
SDS-PAGE Sodium Dodecyl Sulfate-Polyacrylamide Gel Electrophoresis
siRNA Small interfering RNA
SPR Surface Plasmon Resonance
T Thymine
TAE Tris base, acetic acid and EDTA buffer
TBST Tris-buffered saline with Tween 20
TEM Transmission Electron Microscopy
TEMED Tetramethylethylenediamine
Tris-HCl Tris-Hidroclorite
UV Ultraviolet
LIST OF UNITS
% (w/v) Weight/volume percentage
% (v/v) Volume/volume percentage
bp Base Pair
°C Celsius degrees
xxi
H; min; sec Hours; minutes; seconds
Kg; g; mg; µg; ng Kilogram; Gram (10-3
kg); milligram (10-6
kg); microgram (10-9
kg); nanogram
(10-12
kg)
kDa Kilodalton
L; mL; µL Liter; milliliter (10-3L); microliter (10-6L)
M; cm; mm; nm Meter; centimeter (10-2
m); millimeter (10-3
m); nanometer (10-9
m)
M; mM; µM; nM Molar (mol/L); milimolar (10-3
M); micromolar (10-6
M); nanomolar (10-9
M)
mol; pmol Mole; picomol
Rpm Rotations Per Minute
V Volt
LIST OF SYMBOLS
Ɛ Molar Extinction Coefficient
𝓁 Optical Path % Percentage

xxii
1
1 INTRODUCTION
1.1 CANCER
Cancer consists in a highly complex disease that arises from the accumulation of several
genetic events throughout life, in which cells undergo metabolic and behavioral changes, leading to
uncontrolled proliferation which results in tumor production, invasion and metastasis (“World Cancer
Report,” 2008; Zhang et al., 2013). Under normal circumstances, growth is controlled by molecular
mechanisms so that the rates of new cell growth and old cell death are kept in balance. Sometimes,
this balance is no longer present because new cells grow too fast and old damaged cells do not die as
they should and continue to proliferate, as a result of the accumulation of the genetic events. Over
time, if not corrected, an organ can have the total number of cells altered and these aberrant cells can
form an agglomerate so called tumor (Hanahan and Weinberg, 2011).
A person’s age, genetic, and lifestyle behaviors affect collectively the risk of developing cancer
later in life. There are a number of phenomena, internal and external factors that can cause cancer,
being only 5-10% of all cases due to genetic causes. Among internal factors we can find abnormal
hormone levels, weakened immune system and hereditary factors that can predispose people to have
certain types of cancer. In a major way, lifestyle (alcohol abuse, diet, tobacco) as well as exposure to
environmental factors such as sunlight, exposure to chemicals, radiation and viruses can also
contribute to cancer (Anand et al., 2008; Nickels et al., 2013).
1.1.1 TUMORIGENESIS
Cancer development is a multi-step process as several things have to go wrong in order to a
subset of cells gradually progress into a neoplastic state, where both genetic susceptibility and
environmental changes together play important roles in the survival of abnormal cells (Herceg and
Hainaut, 2007; “World Cancer Report,” 2008). The formation of a malignant tumor begins with genetic
changes in somatic cells spontaneously or induced by exposure to an external factor, involving the
deregulation of several genes such as proto-oncogenes, tumor suppressor genes or genes involved in
cell cycle regulation and programed cell death. When critical functions are altered cells should
undergo a programmed form of cell death, as known as apoptosis. The critical point is when mutations
occur in genes which control proliferation or apoptosis leading to cell survival and proliferation instead,
causing an uncontrolled growth (Hanahan and Weinberg, 2011).
In our daily routine, DNA is continuously subjected to damage from exogenous agents that
can be chemical (tobacco, diet, and alcohol), physical (ultraviolet and ionizing radiation) or biological
(viruses) (Anand et al., 2008). Chemical agents and ionizing radiation can attack DNA bases and
2
induce modifications in the coding sequence, for instance, ultraviolet irradiation is capable of
disrupting the normal base pairing of DNA causing an obstacle for DNA polymerase (Ikehata and Ono,
2011). Likewise, lifestyle behaviors such as smoking, alcohol abuse as well as exposure to food
additives and lack of fruit and vegetable intake have been linked to chronic inflammation which is
believed to affect several stages in tumor development, immune surveillance and responses to
therapy (Anand et al., 2008; Grivennikov et al., 2011). Viruses can also play an important role in
human cancers, as for example the human papilloma virus (HPV) in cervix cancer (Schiller and Lowy,
2014). There are two types of viruses: DNA viruses which incorporate into the genome or RNA
viruses, as known as retroviruses, which can transform the cellular genome thus leading to malignant
changes (Devi, 2004; Schiller and Lowy, 2014). Spontaneous DNA mutations are frequent and there
are errors that may occur and stay unrepaired, however, if those occur in essential genes involved in
DNA repair and proliferation (BRAC1, BRAC2, MSH2, MYH), in regulatory genes (RB1), in genes
associated with the apoptotic pathway (BCL-2) and in cycle checkpoint related genes (TP53), it
becomes problematic (Bertram, 2001; Roma-Rodrigues et al., 2014).
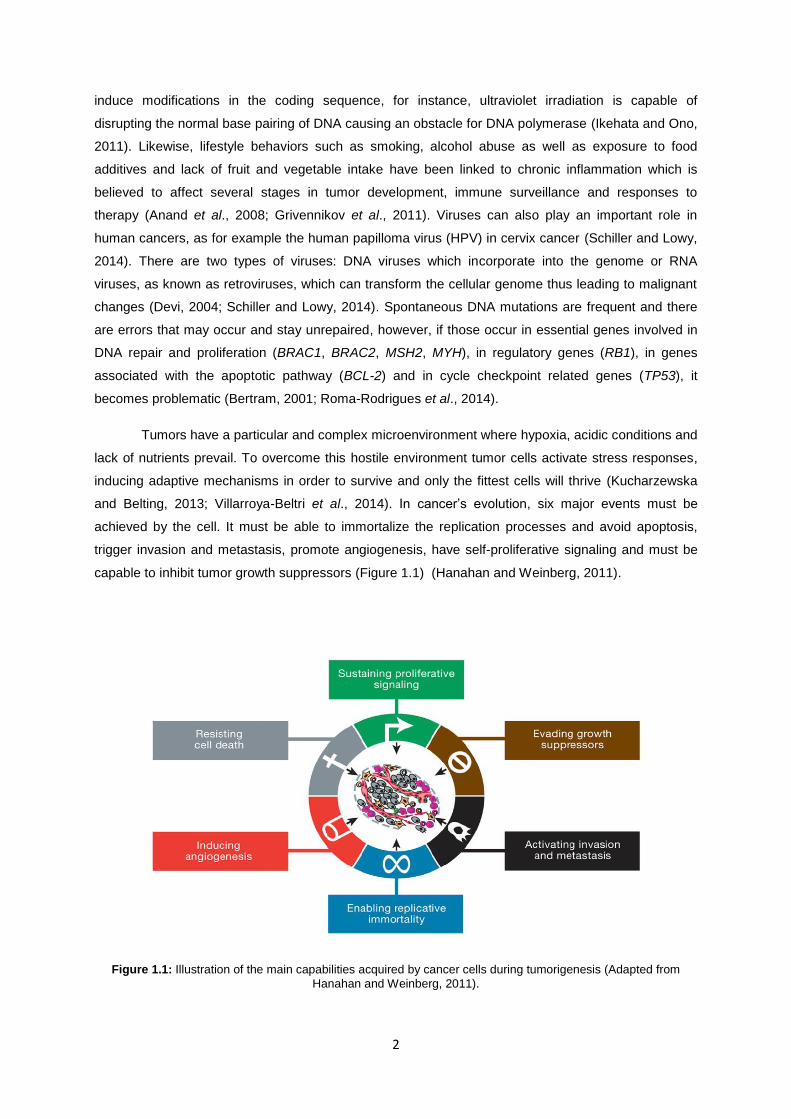
Tumors have a particular and complex microenvironment where hypoxia, acidic conditions and
lack of nutrients prevail. To overcome this hostile environment tumor cells activate stress responses,
inducing adaptive mechanisms in order to survive and only the fittest cells will thrive (Kucharzewska
and Belting, 2013; Villarroya-Beltri et al., 2014). In cancer’s evolution, six major events must be
achieved by the cell. It must be able to immortalize the replication processes and avoid apoptosis,
trigger invasion and metastasis, promote angiogenesis, have self-proliferative signaling and must be
capable to inhibit tumor growth suppressors (Figure 1.1) (Hanahan and Weinberg, 2011).
Figure 1.1: Illustration of the main capabilities acquired by cancer cells during tumorigenesis (Adapted from
Hanahan and Weinberg, 2011).
3
1.1.1.1 MAIN CHARACTERISTICS OF CANCER
Cell cycle is a tightly regulated process in which cells must follow a number of rules and go
through checkpoints that are mainly responsible for the evaluation of DNA integrity (Park and Lee,
2003). Cells only pass to a different cycle phase when they receive appropriate signals from a
regulatory enzyme family called cyclin-dependent kinases (CDK); when DNA replication is not correct
and cells are not able to repair it, a self-destruction processes (apoptosis) is activated to avoid errors’
perpetuation; there is a limited number of times that a cell can divide itself due to telomeres that have
a number of small repeats of DNA and when those end the cell cannot divide anymore. For a cell to
turn malignant genes involved in cell cycle checkpoints may be mutated and all these rules are then
broken. Cell division is permanently activated, defects in pathways involved in DNA damage response
and DNA repair allow cells to avoid programmed cell death and so they divide and accumulate
modifications over time (Hanahan and Weinberg, 2011; Park and Lee, 2003; “World Cancer Report,”
2008). Also an enzyme called telomerase can be activated, allowing the addition of new repeats of
DNA at the end of chromosomes which will compromise the genome integrity and give permission for
cells to divide more than it is supposed to (Hanahan and Weinberg, 2011; “World Cancer Report,”
2008).
Changes in genome can result from several events since genetic modifications, such as point
mutations, mutations to stop codons, gene function deregulation and loss of a certain gene, to
epigenetic modifications in DNA (Bertram, 2001; Hanahan and Weinberg, 2011; Herceg and Hainaut,
2007). Epigenetic is an expanding field defined as the study of “heritable changes in gene expression
that are not due to any alteration in DNA sequence” (Esteller, 2008). DNA methylation and post-
transcriptional modifications of histones (chromatin proteins) are two epigenetic mechanisms that may
contribute to carcinogenesis (Esteller, 2008; Waldmann and Schneider, 2013). Acetylation,
methylation, phosphorylation and ubiquitination of histones are modifications that have a profound
effect on nuclear processes such as DNA repair, DNA replication and organization of chromosomes
(Dawson and Kouzarides, 2012; Herceg and Hainaut, 2007). For instance, the addition of a methyl
group to the 5-carbon position of cytosine bases located 5’ to a guanosine base is a small modification
of the DNA molecule that has important regulatory consequences. Two anomalous methylations are
found in human cancer: hypomethylation, the loss of 5’-methyl-cytosine, associated with activation of
proto-oncogenes as well as chromosome instability, and hypermethylation of the CpG islands in the
promoter regions, linked to gene inactivation. There are a number of studies that point out
hypermethylation has the cause of the silencing of tumor suppressor and other cancer-related genes
(Dawson and Kouzarides, 2012; Waldmann and Schneider, 2013; “World Cancer Report,” 2008).
Oncogenes and suppressor genes are two classes of regulatory genes directly involved in tumor
progression. When proto-oncogenes suffer an alteration and become constitutively activated they
come to be called oncogenes and cells will grow with no control, since they are involved in stimulation
of proliferation. Classic examples include RAS and MYC genes (Hanahan and Weinberg, 2011;
Levine and Puzio-Kuter, 2010). c-Myc is the most investigated among MYC gene family because it is
involved in several cellular processes such as replication, differentiation and apoptosis and it was
4
shown to be overexpressed in most types of human cancer (Miller et al., 2013). In opposition to those,
TP53 and PTEN gene are examples of tumor suppressor genes which codes for proteins that usually
regulate cell cycle and cell death in order to inhibit the tumorigenesis progression. Under-expression
or loss of function will eventually lead to tumorigenesis (Hanahan and Weinberg, 2011; Levine and
Puzio-Kuter, 2010).
The ability of tumor cells to detach from their place of origin to other organs is known as
metastasis. This process involves several steps such as alterations in cell morphology, loss of cell
adhesion to other cells and to the extracellular matrix (ECM), invasion of neighborhood tissues and
blood circulation, migration, survival and colonization of other distant organs (Geiger and Peeper,
2009; Hanahan and Weinberg, 2011; Zhang et al., 2013). A mechanism similar to Epithelial-
Mesenchymal Transition (EMT) that happens during embryonic development and wound healing is
required for an in situ carcinoma to become invasive and consists in the transformation of a number of
epithelial cells into mesenchymal cells, thus being able to migrate (Hanahan and Weinberg, 2011;
Zhang et al., 2013). Epithelial cells are usually attached to each other and to ECM by adhesion and
signaling molecules such as cadherins and integrins. E-cadherin helps in the formation of adherens
junctions between adjacent epithelial cells and its downregulation is usually linked to the acquisition of
the invasion and metastatic capability of cancer cells (Hanahan and Weinberg, 2011; Zhang et al.,
2013). In order to conclude the metastatic process, cancer cells have not only to disseminate through
the body but also to be successful in the adaptation to other tissues’ microenvironment (Hanahan and
Weinberg, 2011). Given the difficulty to control the tumor spread, metastasis is believed to be the
cause of 90% of human cancer deaths (Zhang et al., 2013). Despite the poor prognostic, and because
the well-known strategies to fight cancer like surgery or chemotherapy are not so effective in this
cases, there are ongoing investigations to improve the treatment such as the use of growth factor
inhibitors or monoclonal antibodies that target cancer cells, described below in chapter 1.1.3 (Geiger
and Peeper, 2009; Hanahan and Weinberg, 2011; “World Cancer Report,” 2008).
The nutrient supply and transport of malignant cells through blood and lymph vessels is only
possible with the formation of tumor vascularization, being this process called angiogenesis (Katoh,
2013). Due to hypoxic conditions and lack of nutrients that tumors are exposed to, the creation of new
capillaries and blood vessels is crucial for tumor survival although tumor vasculature is not an
organized hierarchy, instead it is chaotic, leading to abnormal blood flow (Bergers and Benjamin,
2003; Geiger and Peeper, 2009). Generally, in processes such as wound healing and female
reproductive cycle, there is a balance between anti-angiogenic (thrombospondin-1, angiostatin) and
pro-angiogenic factors (Vascular endothelial growth factor A (VEGFA), epidermal growth factor (EGF))
but when there is an “angiogenic switch” this balance no longer exists falling to the pro-angiogenic
side thus having an enhanced expression that will favor the tumor growth (Bergers and Benjamin,
2003; Geiger and Peeper, 2009).
As we can understand, normally cells are equipped with defense mechanisms that work with
great efficacy at different levels until mutations occur and cells start to divide with no control, with the
tendency for cellular repair mechanisms to be less effective as a person grows older. Urgent
5
prevention measures and treatment ways for these malignant alterations are necessary to overcome
this disease that seems to be triggered by a multitude of factors over which people themselves can
have no control.
1.1.2 CANCER INCIDENCE AND MORTALITY
Being an increasingly important subject, cancer has affected about 14 million people in 2012,
worldwide and killed approximately 8.2 million, comparing to the 12.7 million cases and 7.1 million
deaths in 2008 (“Global Cancer Society,” 2008, “WHO,” 2015). It is estimated that in the next two
decades the number of cases will rise to about 70% (“WHO,” 2015).
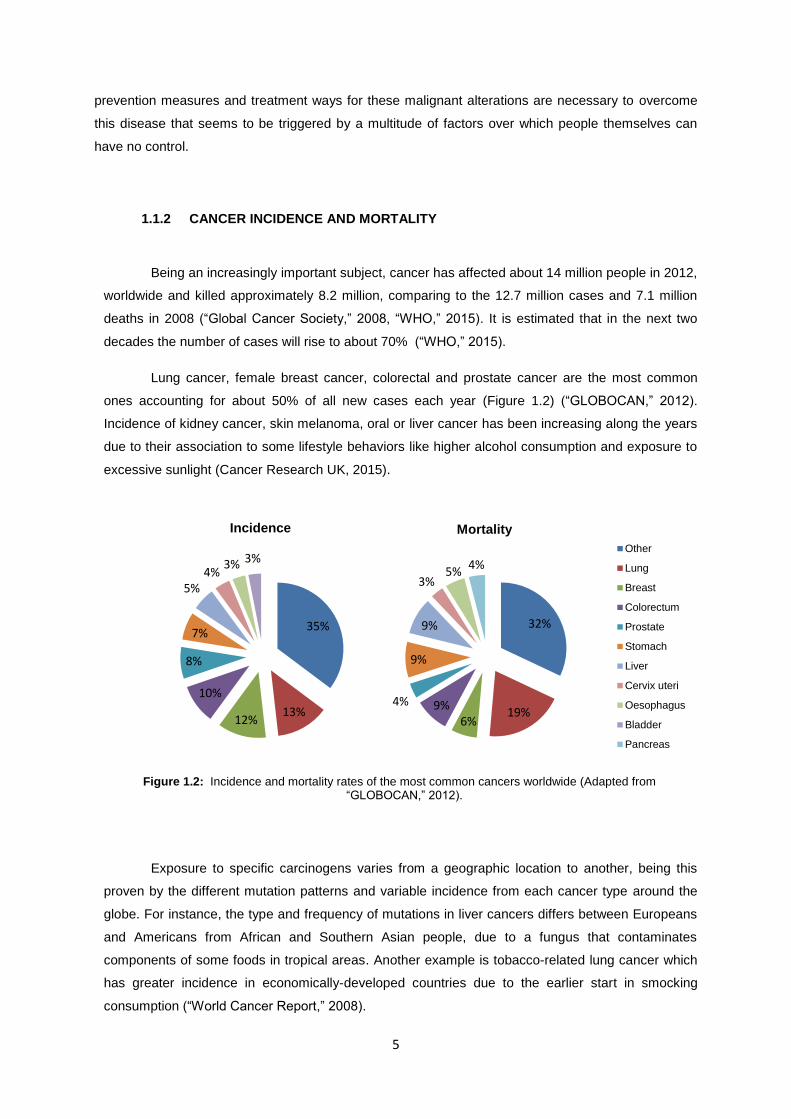
Lung cancer, female breast cancer, colorectal and prostate cancer are the most common
ones accounting for about 50% of all new cases each year (Figure 1.2) (“GLOBOCAN,” 2012).
Incidence of kidney cancer, skin melanoma, oral or liver cancer has been increasing along the years
due to their association to some lifestyle behaviors like higher alcohol consumption and exposure to
excessive sunlight (Cancer Research UK, 2015).
Exposure to specific carcinogens varies from a geographic location to another, being this
proven by the different mutation patterns and variable incidence from each cancer type around the
globe. For instance, the type and frequency of mutations in liver cancers differs between Europeans
and Americans from African and Southern Asian people, due to a fungus that contaminates
components of some foods in tropical areas. Another example is tobacco-related lung cancer which
has greater incidence in economically-developed countries due to the earlier start in smocking
consumption (“World Cancer Report,” 2008).
35%
13% 12%
10%
8%
7%
5% 4%
3% 3%
Incidence
32%
19% 6%
9% 4%
9%
9%
3% 5%
4%
Mortality
Other
Lung
Breast
Colorectum
Prostate
Stomach
Liver
Cervix uteri
Oesophagus
Bladder
Pancreas
Figure 1.2: Incidence and mortality rates of the most common cancers worldwide (Adapted from “GLOBOCAN,” 2012).
6
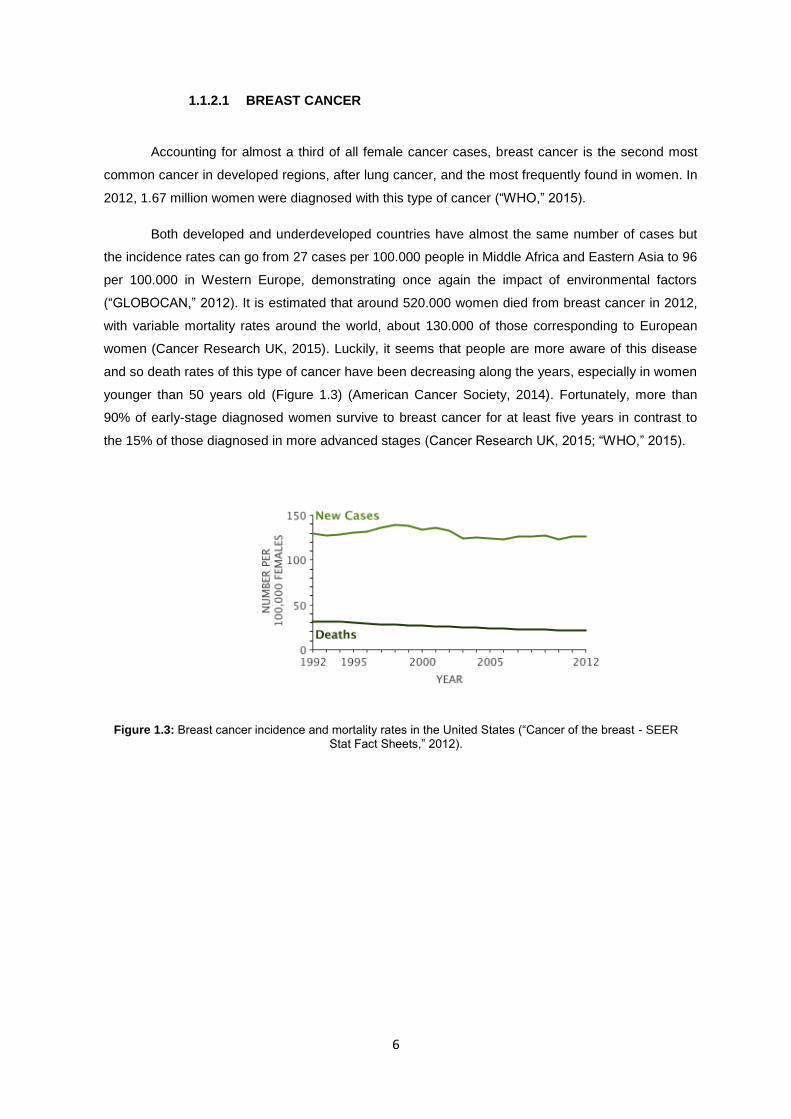
1.1.2.1 BREAST CANCER
Accounting for almost a third of all female cancer cases, breast cancer is the second most
common cancer in developed regions, after lung cancer, and the most frequently found in women. In
2012, 1.67 million women were diagnosed with this type of cancer (“WHO,” 2015).
Both developed and underdeveloped countries have almost the same number of cases but
the incidence rates can go from 27 cases per 100.000 people in Middle Africa and Eastern Asia to 96
per 100.000 in Western Europe, demonstrating once again the impact of environmental factors
(“GLOBOCAN,” 2012). It is estimated that around 520.000 women died from breast cancer in 2012,
with variable mortality rates around the world, about 130.000 of those corresponding to European
women (Cancer Research UK, 2015). Luckily, it seems that people are more aware of this disease
and so death rates of this type of cancer have been decreasing along the years, especially in women
younger than 50 years old (Figure 1.3) (American Cancer Society, 2014). Fortunately, more than
90% of early-stage diagnosed women survive to breast cancer for at least five years in contrast to
the 15% of those diagnosed in more advanced stages (Cancer Research UK, 2015; “WHO,” 2015).
Figure 1.3: Breast cancer incidence and mortality rates in the United States (“Cancer of the breast - SEER
Stat Fact Sheets,” 2012).
7
1.1.3 CANCER THERAPY
Classical approaches for cancer treatment are surgery, radiotherapy and chemotherapy (Silva
et al., 2014). Surgical intervention has been a potent tool in the fight against cancer as it can be used
for the removal of local tumor masses, treatment of pre-cancerous lesions and for removal of normal
organs that have risk to develop cancer, like for example the removal of breasts and ovaries when
mutations in BRCA genes are present, thus reducing the risk (“World Cancer Report,” 2008).
Radiotherapy is usually applied after surgery, depending on the tumor type, and it kills cancer cells
mainly through necrosis, a form of cell death caused by external factors (Grivennikov et al., 2011). In
the presence of metastasis, surgical removal or local ablation by radiotherapy is not enough and so
there is a need for systemic-based therapies. Cancer chemotherapy emerged around 1960 and is
based on the intravenous administration of cytotoxic drugs in order to cope the cancer cells in the
body (Crawford, 2013). Unfortunately cancer cells, contrary to normal cells, are exposed to an
extensive genomic instability, thus being able to adapt to drugs by the activation of alternative
pathways to overcome the inhibitory effect of the drug or enabling new genetic mutations, resulting in
drug-resistant phenotypes (Mendelsohn, 2013). Drug toxicity, pharmacodynamics and
pharmacokinetics have to be taken into account for an efficient treatment as well as drug
concentration, however with the traditional chemotherapeutic agents there is a risk of DNA damage,
superior to radiotherapy because they target cells that rapidly divide themselves and along with it
some normal tissues too, causing toxic side effects in some patients (Bertram, 2001; Gerber, 2008;
Mendelsohn, 2013). A better understanding of the mechanisms of cancer disease is leading to the
finding of new approaches which are based on blocking cell proliferation or tumor vascularization, both
processes presented in primary tumors and metastasis (Geiger and Peeper, 2009).
In the past decade, mechanism-based targeted therapies have become more important in the
medical field so that specific mechanisms can be possible to inhibit, thus enabling treatments to have
less nonspecific toxicity and fewer side effects (Gerber, 2008; Mendelsohn, 2013). The main goal is to
inhibit the acquired capabilities of tumor growth and progression using anti-angiogenic and pro-
apoptotic drugs, telomerase and cyclin-dependent kinase inhibitors, anti-inflammatory drugs, among
others (Hanahan and Weinberg, 2011). Monoclonal antibodies to target molecules on the cell’s
surface began to be developed in the early 1980s and nowadays immunotherapy is used to inhibit
growth factor receptors like, for example, EGFR (a tyrosine kinase also known as HER1) required for
tumor growth and also metastasis (Gerber, 2008; Mendelsohn, 2013). Clinical trials for personalized
cancer vaccines are progressing in a very promising way although problems like costs and effort in
their creation may be in the away and hamper the overall process (Cross and Burmester, 2006). Since
angiogenesis influences cell proliferation and survival too, one has to think that targeting of angiogenic
pathways is another anticancer approach, and being VEGF a pro-angiogenic factor, most research
has focused on inhibiting its action with tyrosine kinase inhibitors or antibodies against VEGF
receptors (Geiger and Peeper, 2009; Katoh, 2013). Although it is often used in association with
8
chemotherapy, targeted therapy has improved the life and prognostics of several cancer patients that
would not otherwise live long enough (Gerber, 2008).
Developing new targeted therapies is expensive and not everyone can afford the existing
treatments (Mendelsohn, 2013). However, global battle against cancer will not be won with only
treatment, it is imperative to have prevention measures against cancer – reduce or eliminate the
exposure to cancer-causing factors (tobacco, low physic activity, low nutrient intake…) and also to be
aware of the symptoms so that early-stage diagnosis can be possible. With these preventing actions,
along with the promising therapies, it is reasonable to think that it is possible for us to overcome
someday this powerful disease that still takes away so many lives.
1.1.3.1 NANOTECHNOLOGY FOR THERAPY
Most cancer therapies have too many side effects and are not efficient due to drug resistance
acquired by cancer cells and the inability to reach the target site in adequate concentrations
(Mendelsohn, 2013). In an attempt to overcome these problems, nanotechnology has been the center
of much attention in the past decade since it holds great promise in the improvement of targeted
therapies (Azmi et al., 2013; Sanvicens and Marco, 2008). The development of nanodevices for
cancer therapies aims to target the delivery of drugs to cancer cells and enhance the possibility of
early diagnostic or prevention with reduced toxicity and immune system responses avoidance (Heath
and Davis, 2008; Sanz et al., 2012) There exists a large variety of delivery systems including
polymeric nanoparticles, liposomes, dendrimers, micelles, carbon nanotubes, quantum dots and
inorganic nanoparticles (gold and silver nanoparticles for example), among others, which allow the use
of nanoparticles in several applications, depending on their shape, size and purpose (Martins et al.,
2014; Silva et al., 2014; Sperling and Parak, 2010).
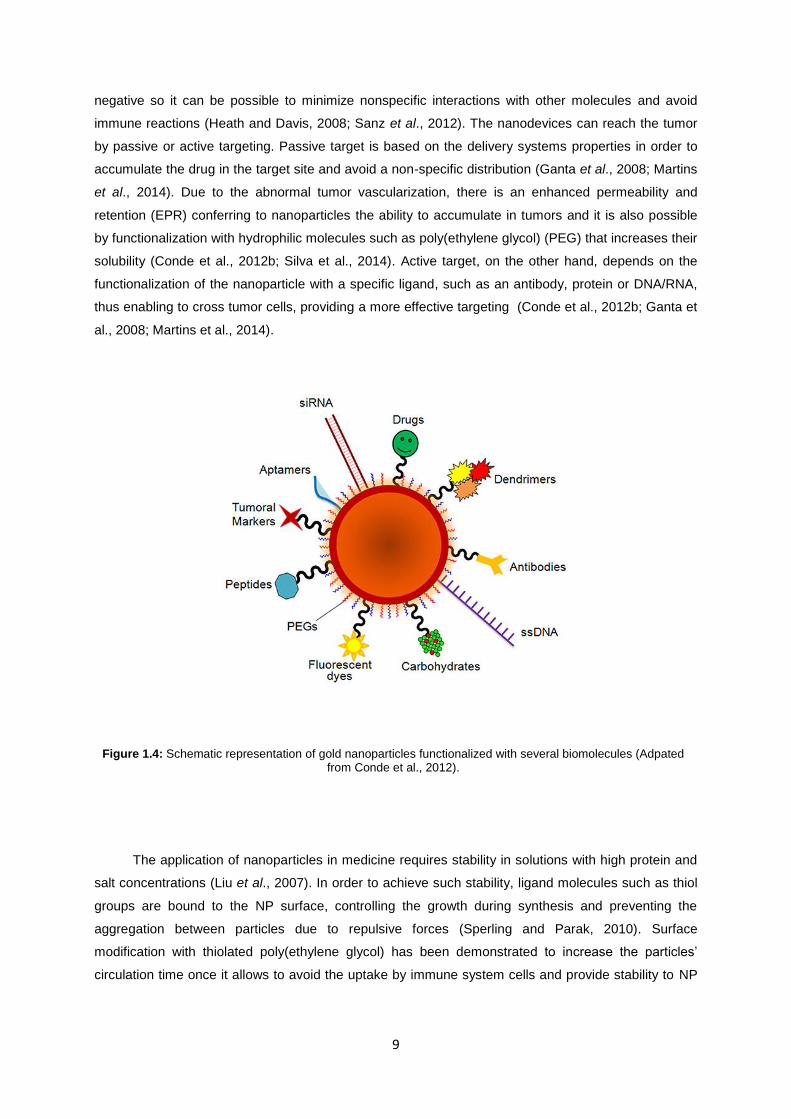
Metal nanoparticles (NPs), especially gold nanoparticles (AuNPs), possess unique properties,
both physical and chemical, that turns them into powerful tool for imaging, diagnosis and therapy, with
less side effects (Conde et al., 2010; Martins et al., 2014). The fact that they can be modulated in
shape, size, composition and other characteristics and have a size ranging 1-100 nm, similar to
several biomolecules such as nucleic acids and antibodies, together with their high surface:volume
ratio and the possibility of engineering their surface as desired, i.e., can be functionalized with
biomolecules (Figure 1.4), potentiate nanoparticles to be directed to specific cells and have different
circulation times in the organism (Conde et al., 2012b; Sanvicens and Marco, 2008; Silva et al., 2014).
Because nanometer-size particles are sufficiently large to contain multiple targeting ligands and a
variety of drug molecules as well as the fact that they can bypass multidrug resistance mechanisms, it
is possible to create new strategies for therapy (Heath and Davis, 2008; Martins et al., 2014).
Controlling the size of the nanoparticles is important because it will influence optical and electric
properties, the pharmacokinetics, biodistribution and accumulation in tumor site. Nanoparticles should
not be smaller than 10 nm in order to avoid renal clearance and the surface charge must be neutral or
9
negative so it can be possible to minimize nonspecific interactions with other molecules and avoid
immune reactions (Heath and Davis, 2008; Sanz et al., 2012). The nanodevices can reach the tumor
by passive or active targeting. Passive target is based on the delivery systems properties in order to
accumulate the drug in the target site and avoid a non-specific distribution (Ganta et al., 2008; Martins
et al., 2014). Due to the abnormal tumor vascularization, there is an enhanced permeability and
retention (EPR) conferring to nanoparticles the ability to accumulate in tumors and it is also possible
by functionalization with hydrophilic molecules such as poly(ethylene glycol) (PEG) that increases their
solubility (Conde et al., 2012b; Silva et al., 2014). Active target, on the other hand, depends on the
functionalization of the nanoparticle with a specific ligand, such as an antibody, protein or DNA/RNA,
thus enabling to cross tumor cells, providing a more effective targeting (Conde et al., 2012b; Ganta et
al., 2008; Martins et al., 2014).
The application of nanoparticles in medicine requires stability in solutions with high protein and
salt concentrations (Liu et al., 2007). In order to achieve such stability, ligand molecules such as thiol
groups are bound to the NP surface, controlling the growth during synthesis and preventing the
aggregation between particles due to repulsive forces (Sperling and Parak, 2010). Surface
modification with thiolated poly(ethylene glycol) has been demonstrated to increase the particles’
circulation time once it allows to avoid the uptake by immune system cells and provide stability to NP
Figure 1.4: Schematic representation of gold nanoparticles functionalized with several biomolecules (Adpated from Conde et al., 2012).
10
in biological environments because it prevents non-specific binding of proteins and cells due to steric
effects (Alexis et al., 2010; Sanz et al., 2012).
Despite the recognized advantages that nanoparticles bring to medicine, some challenges
remain to overcome (Martins et al., 2014; Sanvicens and Marco, 2008). There are toxicological and
ethical concerns that may postpone the regular clinical use of this emerging field, as well as the need
for further optimization and fully understand of their potential and mechanisms of action (Sanvicens
and Marco, 2008; Silva et al., 2014).
1.1.3.1.1 GOLD NANOPARTICLES
Easily synthetized, with a reduction method by citrate (Turkevich et al., 1951), gold
nanoparticles combined with biomolecules have been widely studied, with great potential for medical
therapies, and several methods have been developed to characterize them, centered on their physico-
chemical properties, such as the localized surface plasmon resonance (LSPR) (Baptista, 2012).
Uv/visible spectroscopy is the most used method for characterizing the nanoparticles based
on their optical properties and electronic structure since the absorption bands are related to their size
(Philip, 2008). LSPR is described as the oscillation of the free electrons across the nanoparticle,
induced by an electromagnetic field, resulting in an enhancement of absorption and scattering of the
electromagnetic radiation, thus giving an intense color and other optical properties to the nanoparticles
(Jain et al., 2007). The SPR is a consequence of their small size and is dependent on several
properties such as metal composition, shape and surface functionalization of the nanoparticles as well
as dielectric properties of the surrounding medium (Jain et al., 2007; Philip, 2008). A colloidal solution
of Au nanoshperes with a diameter around 20 nm has an intense ultraviolet-visible light extinction
band at 520 nm, which gives them their characteristic red color. Increasing the diameter will shift the
SPR band to higher wavelengths, changing their color, and the same happens when the refractive
index of the surrounding environment increases due to a change in shape or nanoparticles aggregate,
for instance (Alkilany and Murphy, 2010; Baptista, 2012). Supporting UV/visible spectroscopy, the
characterization of AuNPs can also be done by Dynamic Light Scattering (DLS) and Transmission
Electron Microscopy (TEM) (Liu et al., 2007; Sanz et al., 2012). While TEM analysis gives the real
radius of the nanoparticles and permits to see the structure and determine the average size, DLS
gives the hydrodynamic radius and allows us to confirm the functionalization efficacy with
biomolecules by the increased radius of the nanoparticle when functionalized, compared to a non-
functionalized nanoparticle (Liu et al., 2007). The hydrodynamic radius can be calculated by exposure
of a colloidal solution, with nanospheres in a Brownian motion, to a light beam, such as a laser. When
the light hits the moving particles, the direction and intensity of the light are altered with the size of the
particle, due to scattering, and it is dependent on features such as viscosity and temperature of the
surrounding medium (Lim et al., 2013).
11
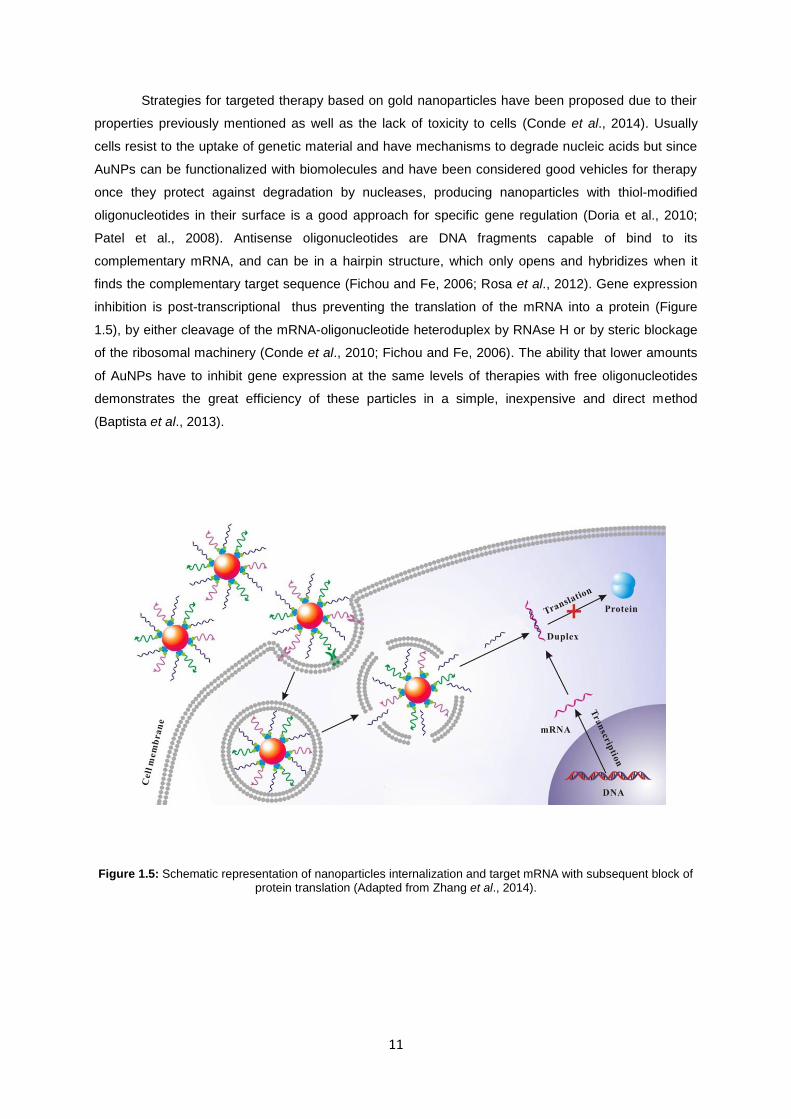
Strategies for targeted therapy based on gold nanoparticles have been proposed due to their
properties previously mentioned as well as the lack of toxicity to cells (Conde et al., 2014). Usually
cells resist to the uptake of genetic material and have mechanisms to degrade nucleic acids but since
AuNPs can be functionalized with biomolecules and have been considered good vehicles for therapy
once they protect against degradation by nucleases, producing nanoparticles with thiol-modified
oligonucleotides in their surface is a good approach for specific gene regulation (Doria et al., 2010;
Patel et al., 2008). Antisense oligonucleotides are DNA fragments capable of bind to its
complementary mRNA, and can be in a hairpin structure, which only opens and hybridizes when it
finds the complementary target sequence (Fichou and Fe, 2006; Rosa et al., 2012). Gene expression
inhibition is post-transcriptional thus preventing the translation of the mRNA into a protein (Figure
1.5), by either cleavage of the mRNA-oligonucleotide heteroduplex by RNAse H or by steric blockage
of the ribosomal machinery (Conde et al., 2010; Fichou and Fe, 2006). The ability that lower amounts
of AuNPs have to inhibit gene expression at the same levels of therapies with free oligonucleotides
demonstrates the great efficiency of these particles in a simple, inexpensive and direct method
(Baptista et al., 2013).
Figure 1.5: Schematic representation of nanoparticles internalization and target mRNA with subsequent block of protein translation (Adapted from Zhang et al., 2014).
12
1.2 EXOSOMES
Exosomes are small membrane vesicles (30-100 nm in diameter) of endocytic origin, first
described as membrane fragments isolated from biological fluids by Trams and collaborators in 1981
and with greater relevance achieved after Johnstone and colleagues studied them a few years later
(Johnstone et al., 1987; Trams et al., 1981; Zhang and Grizzle, 2014). Exosomes were initially thought
to be organelles involved in the removal of cellular debris but now it is known that they play an
important role in several processes like immunological processes, cell-cell communication and
diagnostics, becoming a subject of interest in various research fields over the past decade (Bang and
Thum, 2012; Zhang and Grizzle, 2014).
Cells are known to communicate and exchange information by direct contact, secretion of
soluble factors or by secreting a large variety of vesicles into the extracellular space (El Andaloussi et
al., 2013). One can distinguish exosomes from apoptotic bodies and regular microvesicles.
Microvesicles are released into the extracellular space by outward budding of plasma membrane in
response to calcium influx, are heterogeneous in shape and size (100-1000 nm) whereas exosomes
are formed by invagination of plasma membrane with endosomes followed by their release in the
extracellular space and its shape is more uniform. Also it was shown that microvesicles sediment at a
lower sucrose gradient than exosomes and their protein composition is different too. These two
classes are distinct from apoptotic bodies which are released from cells that are passing thru
apoptosis or mechanical stress, thus being larger (0.5 – 3 µm) and with different molecular
composition (Akers et al., 2013; Kharaziha et al., 2012; Muralidharan-Chari et al., 2010).
Exosomes are secreted by most cell types, both normal and malignant and are found in most
body fluids such as urine, saliva, plasma, amniotic liquid, breast milk, diseased fluids (i.e. pleural
effusions for example), among others, implying that they play a role in both normal and pathological
conditions (Braicu et al., 2015; Record et al., 2011; Zhang and Grizzle, 2014).
1.2.1 EXOSOMES IN CANCER AND HEALTH - BIMODAL ROLE OF EXOSOMES
Besides their function in the removal of unnecessary proteins during the cell maturation process
(Vlassov et al., 2012), once released into the extracellular space, exosomes are able to interact with
cells in the neighborhood or to course long distances enabling the transfer of biomolecules like
proteins, lipids and RNA between different cells by cell surface interactions, modulating their
phenotypes (Kahlert and Kalluri, 2013; Roma-Rodrigues et al., 2014). This modulation of the cells’
phenotype is dependent on the origin of the exosomes: positive effects are triggered by exosomes
released from normal cells whereas those from tumor or infected cells may cause non-positive health
effects by the transfer of oncogenic features (Record et al., 2011). It has been demonstrated that
cancer patients have an increased content of these vesicles in their biological fluids when compared to
healthy patients and as the tumor progresses its content increases even more (Bang and Thum, 2012;
13
Riches et al., 2014). Situations of stress like exposure to hypoxia, starvation or acidic conditions are
common in tumor microenvironment and, as previously explained in section 1.1.1.1 , cancer cells need
to overcome it so the tumor can progress (Villarroya-Beltri et al., 2014). For that to happen, these
stress conditions promote the release and trafficking of tumor-related exosomes that may contribute to
tumor growth and evasion since they can alter the surrounding microenvironment though secretion of
matrix metalloproteinases (MMPs) or its activators, such as heat shock proteins (HSPs), which
degrade proteins from the extracellular matrix such as collagen and fibronectin, thus enabling cells to
migrate (Hannafon and Ding, 2013; Muralidharan-Chari et al., 2010). Also, these little vesicles can
stimulate angiogenesis by inducing the expression of VEGF and cytokines and can also escape from
immune surveillance and trigger an immunosuppressive response, and thus propagate oncogenic
information through the organism, allowing tumor dissemination (Record et al., 2011; Villarroya-Beltri
et al., 2014; Zhang and Grizzle, 2014).
Multidrug resistance (MDR) is believed to be one of the major problems of cancer therapy
because drugs are expelled to the extracellular space by ABC transporters (ATP binding-cassette
transporters) thus losing its effect on cancer cells. Since exosomes carry ABC transporters, it was
thought that the mechanism of drug expulsion by cells can be mediated by these vesicles (Azmi et al.,
2013). There has also been several studies that indicate an association between exosomes and
infection, cardiovascular diseases and neurodegenerative diseases (Bellingham et al., 2012; Roma-
Rodrigues et al., 2014). Retroviruses and exosomes have been compared due to their resemblance in
composition and mechanism of action and it was demonstrated that exosomes have the capability of
spread pathogens such as prions and viruses, like HIV virus for example (Tan et al., 2013; Vlassov et
al., 2012). When infected, cells from the immune system, like dendritic cells and macrophages, can
produce and release exosomes as well as HIV virions since macrophages can fuse with late
endosomes and then release their infectious content in the extracellular space, similar to what
happens in exosomes’ biogenesis (Johnstone, 2006; Record et al., 2011). The fact that HIV and
exosomes share propagation mechanisms, similar size and 10% of protein content might be the basis
of the explanation of how this type of virus have the ability, like exosomes, of crossing the blood-brain
barrier (El Andaloussi et al., 2013; Record et al., 2011).
Easily obtained from biological fluids in a non-invasive manner, found in unexpected numbers
(≈1010
/mL) in the plasma of healthy individuals and with characteristics of the cell of origin, exosomes
can, on the other hand, be beneficial for us (Kahlert and Kalluri, 2013; Yellon and Davidson, 2014).
Mast cells, dendritic cells, macrophages and other types of cells involved in the immune system use
exosomes to communicate and perform their normal functions and because exosomes are secreted
by those and by stem cells too, they are capable of elicit an anti-tumor response by transporting tumor
antigens to dendritic cells inducing an immune response and they can also participate in tissue repair
(Bang and Thum, 2012; Zhang and Grizzle, 2014). Expressing in their surface Fas ligand, a
immunosuppressive and anti-inflammatory molecule, in order to reduce the immune capacity during
pregnancy is another example of exosome’s role in the immune system and there are also evidences
that they are involved in cell-cell communication during atherosclerosis protection, in the regulation of
14
neuronal cell function and that those secreted by mesenchymal stem cells possesses cytoprotective
properties (El Andaloussi et al., 2013; Roma-Rodrigues et al., 2014; Zhang and Grizzle, 2014).
Because of their role in immune responses, exosomes-based vaccines have been proposed for
clinical immunotherapy and other exosome-based therapies have been thought as strategies against
cancer and other diseases (Roma-Rodrigues et al., 2014; Théry et al., 2002). Engineering exosomes
to carry drugs or target proteins is one of the future strategies as well as nanobased formulations to
mimic exosomes (Azmi et al., 2013). Exosome research has been benefited by nanosystems, which
have already helped in detection and characterization as well as in loading exosomes for further use in
immunotherapy for instance (Azmi et al., 2013). Once natural transporters, they can be modified to
express certain proteins in their surface in order to be a potential novel targeted-therapy strategy with
less or none toxicity or immune responses associated (Bang and Thum, 2012), supporting the
possibility of using exosomes as therapeutic tool for drug delivery. There are some studies already
made on mice showing that dendritic-derived exosomes with interference RNA (RNAi) were able to be
delivered in the brain with no immune response associated and the inactivation of a neuron protein
responsible for the formation of beta-amyloid plaques in Alzheimer’s disease was possible with
exosomes transporting siRNA molecules (Azmi et al., 2013; Bang and Thum, 2012). Furthermore,
exosomes are able to provide paramount information about the tumor biology owing to their specific
protein content and because their concentration in a patient’s body has been demonstrated to be in
correlation with the state of the disease, they can be used in diagnostics as biomarkers to predict how
cancer will develop and how it should be treated in a personalized way (Kahlert and Kalluri, 2013;
Vaiselbuh, 2015).
Therefore, the question now is how important is their influence? The circulating exosomes have
been implicated in cancer and other diseases but is that their main biological role? Sure they can
promote harm but they are also implicated in the transfer of biomolecules between cells which might
represent a new paradigm of intracellular information transmission, as well as a new form of therapy
for several diseases. This being said, and despite the progresses that have already been made, there
is still a long road ahead and much more to explore about exosomes and their bimodal role in our
complex organism and the interest on them will grow more and more in the future.
1.2.2 BIOGENESIS AND RELEASE OF EXOSOMES
Exosomes biogenesis is a highly regulated and unidirectional process performed within the
endosomal system, which comprises early endosomes (EE), multivesicular bodies (MVBs), also
known as late endosomes, and lysosomes (Bellingham et al., 2012; Denzer et al., 2000). This
endocytic pathway is essential to homeostasis because it controls a variety of activities in every cell
such as internalization and degradation of macromolecules, plasma membrane composition, signal
transmission, nutrient uptake and defense against invading microorganisms (Fader and Colombo,
2009; Mellman, 1996). The membrane trafficking pathway is based on the internalization of
15
macromolecules, lipids or proteins by the plasma membrane which outgrows inside the cell and forms
a vesicle containing the material which then fuses with early endosome, with a slightly acidic lumen,
located at the periphery of the cell. Molecules inside early endosomes can then be recycled to the
plasma membrane or transported to lysosomes for degradation. If the latter, molecules are sent to late
endosomes in a transport mediated by carrier vesicles along microtubules. Late endosomes then
mature into lysosomes and their environment becomes more acidic, allowing the degradation of the
inner material by acidic hydrolases then staying as resting lysosomes until being activated again by
the fusion with another late endosome (Grant and Donaldson, 2011; Mellman, 1996). Classic
endocytic mechanisms include clathrin-dependent endocytosis, pinocytosis and phagocytosis
(Svensson et al., 2013). Families of small G proteins (Arf, Rab and Rho GTPases) have a very
important role in endocytosis, each one interacting with effector proteins of the endocytic pathway and
regulating different mechanisms in trafficking process such as vesicle movement and fusion with
target membranes (Doherty and McMahon, 2009; Grant and Donaldson, 2011).
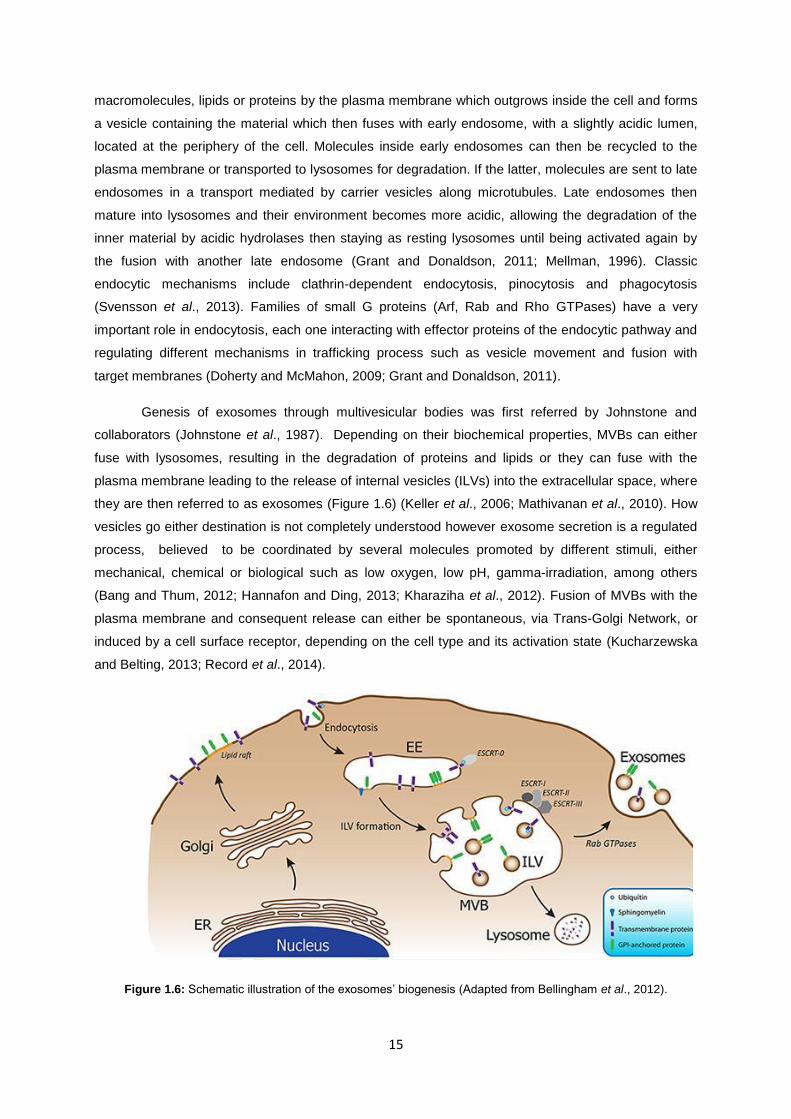
Genesis of exosomes through multivesicular bodies was first referred by Johnstone and
collaborators (Johnstone et al., 1987). Depending on their biochemical properties, MVBs can either
fuse with lysosomes, resulting in the degradation of proteins and lipids or they can fuse with the
plasma membrane leading to the release of internal vesicles (ILVs) into the extracellular space, where
they are then referred to as exosomes (Figure 1.6) (Keller et al., 2006; Mathivanan et al., 2010). How
vesicles go either destination is not completely understood however exosome secretion is a regulated
process, believed to be coordinated by several molecules promoted by different stimuli, either
mechanical, chemical or biological such as low oxygen, low pH, gamma-irradiation, among others
(Bang and Thum, 2012; Hannafon and Ding, 2013; Kharaziha et al., 2012). Fusion of MVBs with the
plasma membrane and consequent release can either be spontaneous, via Trans-Golgi Network, or
induced by a cell surface receptor, depending on the cell type and its activation state (Kucharzewska
and Belting, 2013; Record et al., 2014).
Figure 1.6: Schematic illustration of the exosomes’ biogenesis (Adapted from Bellingham et al., 2012).
16
Biogenesis of MVBs comprises the formation of membrane buds, sorting of ubiquitinated
cargo and cleavage of those buds, which will originate the ILVs (Hurley and Hanson, 2010). A
complex named ESCRT (Endosomal Sorting Complex Required for Transport), which recognizes
ubiquitinated proteins, is required for MVBs and ILVs’ formation and recruitment of proteins to
exosomes (Hurley and Hanson, 2010; Kahlert and Kalluri, 2013). ESCRT machinery is composed by
four complexes, ESCRT-0 ESCRT-I, ESCRT-II and ESCRT-III which are associated with Alix and
Tsg101 proteins, also presented in exosomes (Raposo and Stoorvogel, 2013; Record et al., 2011;
Villarroya-Beltri et al., 2014). The recognition of ubiquitinated proteins in the endosomal membrane is
made by ESCRT-0, -I and –II whereas ESCRT-III, recruited by the previous complexes, is responsible
for membrane budding and ILVs’ release (Hannafon and Ding, 2013; Hurley and Hanson, 2010).
However, there are other pathways for these processes of MVB formation and exosomes’ secretion
(Soekmadji et al., 2013; van der Pol et al., 2012). After being observed that cells with depletion of the
ESCRT subunits still secrete exosomes, it was demonstrated that an ESCRT-independent mechanism
can also be involved in exosome formation and release, dependent on sphingomyelinase, an enzyme
that produces ceramide from sphingomyelin, thus triggering the inward budding of exosomes in the
MVB’ membrane, allowing vesicle secretion (Kahlert and Kalluri, 2013; Raposo and Stoorvogel, 2013).
Increases in intracellular calcium and depolarization induced by potassium appears to lead to the
release of a superior amount of exosomes (Kahlert and Kalluri, 2013; Record et al., 2014) and also
other molecules of the endocytic pathway have been implicated in this process such as cytoskeleton
regulatory pathways, heparanase, Rab GTPases and SNARES (Soluble NSF Attachment Protein
Receptor), as well as proteins such as p53 and Alix (Bang and Thum, 2012; Kucharzewska and
Belting, 2013; Roma-Rodrigues et al., 2014). It was observed that, in cells undergoing stress
conditions, occurred an activation of the tumor suppressor activated pathway-6 (TSAP6) by the tumor
suppressor protein p53 and it was found that over-expression of the same pathway upregulates
exosome secretion, similar to what happens with constitutively active or over-expressed Rab
GTPases, common in cancer (Henderson and Azorsa, 2012; Record et al., 2011).
1.2.2.1 RAB27A
The Rab small GTP-binding protein family is believed to be responsible for the coordination of
several steps in vesicle trafficking, with over 60 Rab proteins identified in humans (Fukuda, 2013;
Grant and Donaldson, 2011). These proteins switch between a GDP-bound “off” state and a GTP-
bound “on” state, an inactive and active form respectively, controlled by two regulatory enzymes,
guanine nucleotide exchange factor (GEF, activator) and a GTPase-activating protein (GAP,
inactivator) and have different positions and functions in the process, including budding, mobility,
docking and fusion (Fukuda, 2013; Grant and Donaldson, 2011). Rab GTPases are ubiquitously
expressed in a considerable amount of secretory cells including exocrine, endocrine, ovarian and
hematopoietic cells and their roles could depend on the cell type, be complementary or indirect by
17
regulating pathways upstream of exosome secretion (Hannafon and Ding, 2013; Raposo and
Stoorvogel, 2013; Wang et al., 2008).
Rab27a has been associated with the regulation of exosomes’ secretion pathway by
promoting the displacement of MVBs to the cell periphery and subsequent docking at the plasma
membrane (Hannafon and Ding, 2013; Ostrowski et al., 2010; Raposo and Stoorvogel, 2013).
Ostrowski and colleagues demonstrated that the knockdown of Rab27a and its effector Slp4
(Synaptotagmin-like protein) inhibit the exosome secretion in HeLa cells, by either increasing the size
of MVBs, which impossibilities the docking of those to the plasma membrane or Rab27a is required for
docking and, when absent, vesicles will fuse with each other instead of fusion with the plasma
membrane (Kharaziha et al., 2012; Ostrowski et al., 2010). The secretion of exosomes can be
promoted by hypoxia and the inhibition of Rab27a has been associated with reduced mobilization of
neutrophils, which leads to decreased tumor growth and lung metastasis, demonstrating that Rab27a
is involved in cancer progression (Azmi et al., 2013; Kahlert and Kalluri, 2013). Overexpression of
Rab27a has been associated with the invasive and metastatic potential of human breast cancer cells
by promoting the secretion of insulin-like growth factor II (IGF-II), involved in several roles in normal
and breast cancer cells such as regulation of VEGF (Hendrix and de Wever, 2013; Wang et al., 2008).
1.2.3 EXOSOMES COMPOSITION
From exosome isolation by centrifugation or a protein-selective method, much can be discover
about exosomes’ composition (Johnstone, 2006). In order to study the exosomes, currently there are
many methods that enable us to isolate and characterize them based on their size, density (1.13-1.19
g/mL) or specific marker proteins, from a variety of pathological and healthy fluids (Kharaziha et al.,
2012; Théry et al., 2006). The isolation of exosomes from the supernatants of cultured cells is
commonly performed by serial centrifugations (to first remove cells and cellular debris) and a
ultracentrifugation (to pellet the exosomes) which can be combined with sucrose gradients for further
purification since exosomes have a distinct density floatation from other classes of vesicles and
because this method often brings impurities from other vesicles or cellular debris (Théry et al., 2006;
Vlassov et al., 2012). Other methods that allow us to obtain exosomes include immunoprecipitation
using magnetic beads with monoclonal antibodies specific for exosome antigens, even though it is
necessary a good knowledge of the vesicles in study, and size-exclusion chromatography, besides
other commercially available kits that already exists and provide a faster process for exosome
isolation (Bobrie et al., 2012; Soekmadji et al., 2013; Tran et al., 2015). Furthermore, exosomes can
be characterized by western blot analysis, flow cytometry, LC-MS/MS or image techniques such as
transmission electron microscopy and fluorescence microscopy, which allow a more accurate
identification of these vesicles based on morphological and biochemical characteristics (Koga et al.,
2005; Mathivanan et al., 2010; Muller et al., 2014; Valadi et al., 2007).
18
According to the latest version of ExoCarta Database, exosomes are very complex, with about
9000 proteins already recognized in different cell types and organisms, which allow us to identify and
differentiate them from other vesicles (Bang and Thum, 2012; “ExoCarta,” 2015). Due to their
endosomal origin, proteomic analysis from different cell lines and biological fluids indicate that
exosomes are composed by proteins involved in membrane transport and fusion such as actin, anexin
and Rab proteins, heat-shock proteins (Hsp70, Hsp90), tetraspanins (CD9, CD63, CD81, CD82) and
also proteins involved in the biogenesis of MVBs like Alix and Tsg101, as illustrated in Figure 1.7
(Record et al., 2011; Villarroya-Beltri et al., 2014; Vlassov et al., 2012). Besides those marker proteins,
they also carry nucleic acids such as DNA, mitochondrial DNA (mtDNA), mRNA, microRNAs
(miRNAs) and other non-coding RNAs (ncRNAs), ribosomal RNAs (rRNAs), transfer RNAs (tRNAs)
(Roma-Rodrigues et al., 2014; Vaiselbuh, 2015; Zhang et al., 2015) and have a lipid bilayer composed
by phospholipids, cholesterol, ceramide and sphingolipids, which stiffens the vesicle membrane thus
conferring to the exosomes greater stability within the environment they are found (Roma-Rodrigues
et al., 2014; Villarroya-Beltri et al., 2014; Vlassov et al., 2012). Exosomes also contain proteins
involved in signaling pathways such as β-catenin and Wnt5B and mediators of cell signaling like
interleukin-1β and TNF-α (Urbanelli et al., 2013). The specific composition depends on the cell type or
tissue of origin and may differ according to physiological conditions (Hannafon and Ding, 2013). For
instance, exosomes derived from antigen-presenting cells have in their surface the major
histocompatibility complex (MHC) I and II whereas exosomes derived from oligodendrocytes contain
myelin proteins (Soekmadji et al., 2013; Tran et al., 2015).
Figure 1.7: Illustration of exosomes’ composition (Adapted from Bellingham et al., 2012).
19
MicroRNAs are a class of small non-coding RNAS (17-24 nucleotides) implicated in post-
transcriptional modifications of gene expression observed within a cell or in adjacent cells, thus
showing that they circulate throughout the organism (Azmi et al., 2013; Zhang et al., 2015). Recent
studies have demonstrated that this circulation can be exosome-mediated and could be a mechanism
of genetic information exchange between cells (Valadi et al., 2007; Zhang et al., 2015). By being
transported inside exosomes, RNAs are protected from degradation by RNase enzymes and the
fusion of exosomes with a target cell membrane in the neighborhood or in a distant place allows the
transfer of microRNAS between cells, which can lead to mRNA degradation or de-stabilization in the
recipient cell, depending on the degree of complementary between them both, eventually resulting in
gene knockout (Gajos-Michniewicz et al., 2014; Henderson and Azorsa, 2012). miRNAs are presented
in body fluids and have been related to several processes including cell proliferation, cell
differentiation and migration as well as disease initiation and progression, being their expression
altered under pathological conditions (Zhang et al., 2015). For instance, mir-21and mir-141 had a
lower expression level in exosomes from healthy patients than those from patients with malignant
tumors (Zhang et al., 2015). Studies shown that these molecules can have tumor suppressor or
oncogenic activities such as miRNA let-7, which regulates cell proliferation and is found with low
expression levels in cancers, in opposition to miR-21, which acts as an oncogene, silencing an
antiapoptotic gene, thus contributing to cell survival (Gajos-Michniewicz et al., 2014; Henderson and
Azorsa, 2012). The transfer of exosome-secreted miRNAs can enhance the invasive potential of
cancer cell lines, as well as promote interactions between different cell types and also confer pro-
angiogenic properties (Azmi et al., 2013).
Although a lot of research is still necessary, it is believed that exosomal miRNAs are
characteristic of the cell from which exosomes were originated and therefore, miRNAs profiles in
exosomes released from pathological or cancer cell might serve as biomarkers for several diseases
(Gajos-Michniewicz et al., 2014). The intriguing fact that exosomes contain RNA that can be delivery
in recipient cells and have an active role on those, either by translation into proteins in the case of
mRNA or repression of gene expression in the case of miRNA might become an ideal pathway to
provide a new targeted-therapy strategy (Braicu et al., 2015).
1.2.4 UPTAKE OF EXOSOMES BY CELLS
When released, exosomes can stay in circulation and travel through body fluids or
alternatively they can be internalized by near or distant cells, transferring material between cells
(Record et al., 2014). Several mechanisms have been discussed to describe how exosomes are
internalized in other cells and exchange information and, even though it still is a poorly understood
subject, it is thought to be dependent on the type and the phagocytic capabilities of the target cell
(Record et al., 2011; Valadi et al., 2007).
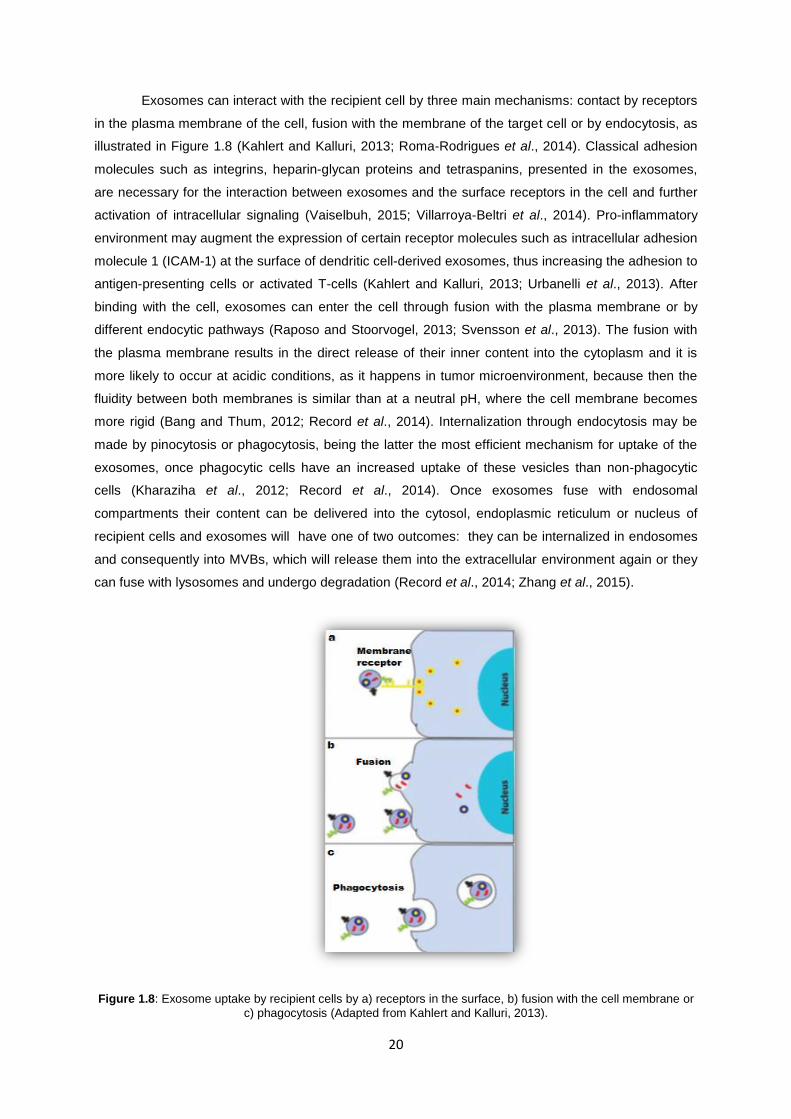
20
Exosomes can interact with the recipient cell by three main mechanisms: contact by receptors
in the plasma membrane of the cell, fusion with the membrane of the target cell or by endocytosis, as
illustrated in Figure 1.8 (Kahlert and Kalluri, 2013; Roma-Rodrigues et al., 2014). Classical adhesion
molecules such as integrins, heparin-glycan proteins and tetraspanins, presented in the exosomes,
are necessary for the interaction between exosomes and the surface receptors in the cell and further
activation of intracellular signaling (Vaiselbuh, 2015; Villarroya-Beltri et al., 2014). Pro-inflammatory
environment may augment the expression of certain receptor molecules such as intracellular adhesion
molecule 1 (ICAM-1) at the surface of dendritic cell-derived exosomes, thus increasing the adhesion to
antigen-presenting cells or activated T-cells (Kahlert and Kalluri, 2013; Urbanelli et al., 2013). After
binding with the cell, exosomes can enter the cell through fusion with the plasma membrane or by
different endocytic pathways (Raposo and Stoorvogel, 2013; Svensson et al., 2013). The fusion with
the plasma membrane results in the direct release of their inner content into the cytoplasm and it is
more likely to occur at acidic conditions, as it happens in tumor microenvironment, because then the
fluidity between both membranes is similar than at a neutral pH, where the cell membrane becomes
more rigid (Bang and Thum, 2012; Record et al., 2014). Internalization through endocytosis may be
made by pinocytosis or phagocytosis, being the latter the most efficient mechanism for uptake of the
exosomes, once phagocytic cells have an increased uptake of these vesicles than non-phagocytic
cells (Kharaziha et al., 2012; Record et al., 2014). Once exosomes fuse with endosomal
compartments their content can be delivered into the cytosol, endoplasmic reticulum or nucleus of
recipient cells and exosomes will have one of two outcomes: they can be internalized in endosomes
and consequently into MVBs, which will release them into the extracellular environment again or they
can fuse with lysosomes and undergo degradation (Record et al., 2014; Zhang et al., 2015).
Figure 1.8: Exosome uptake by recipient cells by a) receptors in the surface, b) fusion with the cell membrane or
c) phagocytosis (Adapted from Kahlert and Kalluri, 2013).
21
The internalization of exosomes has been showed by labeling exosomes with PKH26 dye or
using fluorescent proteins such as green fluorescent protein (GFP) or red fluorescent protein (RFP)
which fuse with marker proteins in the membrane, thus enabling to trace the exosomes. They were
visualized by fluorescent microscopy, demonstrating an increased fluorescence inside the cell, thus
proving the exosomes’ uptake (Suetsugu et al., 2013; Vaiselbuh, 2015). The unique composition of
exosomes is critical for their entry in target cells once vesicles composed exclusively by the lipids
found in exosomes do not have the capability to fuse with other cells, which indicates that the proteins
presented at the exosomes’ surface have a critical role in their communication with the surrounding
environment (El Andaloussi et al., 2013).
1.2.5 EXOSOMES IN BREAST CANCER
The human mammary gland suffers significant changes after birth, at puberty and pregnancy
such as growth and lactation. The mammary gland is composed by a supporting stroma and two
epithelial cell types, the luminal cells and the myoepithelial cells, which play different parts in the
organization of the mammary gland and milk secretion (Hannafon and Ding, 2013). Exosomes have
been identified in breast milk, both colostrum and mature breast milk, and it was demonstrated that
they have an important role in the influence of the infants’ immune responses (Hannafon and Ding,
2013; Vlassov et al., 2012). Once exomes can transport microRNAs and other biomolecules, it was
already suggested that mothers can transfer microRNAs to the newborns through the milk, thus
playing their role in the baby’s immune system (Hannafon and Ding, 2013).
Several studies have already stated the importance of exosomes in cell-cell communication
and consequent transfer of oncogenic information between cells, thus enabling metastatic events and
angiogenesis while suppressing the immune system responses (Vaiselbuh, 2015). MicroRNAs
secreted by tumor-derived exosomes have been related to the enhancement of the invasion potential
in breast malignant cells and because this type of cancer is very heterogeneous with several
phenotypic differences between tumors, the profile of exosomal miRNAs may be used as biomarkers
(Azmi et al., 2013; Hannafon and Ding, 2013). For instance, miR-21 has been studied has an
exosomal biomarker for breast cancer (Vaiselbuh, 2015). Exosomes from this type of cancer express
members of the human epidermal receptor (HER) family, constitutively active in many cancer cells,
such as HER2 that when over-expressed accounts for 25% of breast cancers (Kahlert and Kalluri,
2013; Marleau et al., 2012). Exosomes released from HER2-positive cancer cells may interfere with
anticancer therapies, by resisting to the activity of Trastuzumab, a previously described monoclonal
antibody therapy, increasing the tumor proliferation (Braicu et al., 2015; Hannafon and Ding, 2013)
In tumor breast cancer, genetic abnormalities occur mostly in the luminal epithelium, by
transition of the normal cells to pre-invasive lesions and also by the loss of myoepithelium cell layer
and it was recently demonstrated that the detachment of adherent breast cancer cell leads to the
secretion of exosomes (Hannafon and Ding, 2013; Marleau et al., 2012). Despite it is still not totally
clarified how exosomes contribute to the development of breast cancer and its progression, exosomes
22
from breast cancer cells have the ability to convert adipose tissue-derived mesenchymal stem cells
into myofibroblasts, which are involved in the remodeling of the tumor microenvironment as well as in
angiogenesis (Kahlert and Kalluri, 2013). Nonetheless, it is important to notice that, as previously
explained, exosomes also have advantages and the overall power of these nano-sized vesicles
remains to be fully understood.
1.3 SCOPE OF THE WORK
The main goal of this thesis is to prevent the release of exosomes by silencing RAB27A gene
using gold nanoparticles, functionalized with thiolated antisense oligonucleotides, as vectors. Another
goal is to isolate and purify exosomes from two different breast cancer cell lines, MCF7 and MDA –
MB – 453 using two different methods, characterize them and also to compare the amount of
exosomes that could be obtained from each cell line, which can be dependent on certain cell features
such as invasive and metastatic capabilities. Furthermore, the last goal is to observe the uptake of
tumor-derived exosomes by normal cells, thus allowing us to infer about exosomes’ capability of cell-
cell communication and biological material transfer by incubating exosomes from MCF7 breast cell
line with a normal bronchial/tracheal cell line.
23
2 MATERIAL AND METHODS
2.1 CELL LINES
The experimental work was performed with two human tumor cell lines, MCF7 (ATCC® HTB-
22™) and MDA – MB – 453 (ATCC® HTB-131™), which correspond to mammary adenocarcinoma,
purchased from the American Type Culture Collection (“ATCC Cell Lines,” 2014). The cell line MCF7
is from a 69 year old female with breast cancer and MDA cell line is from a 48 year old female with the
same disease, being both constituted by adherent epithelial cells.
In order to evaluate the interaction between exosomes and a non-cancerous cell line, Primary
Bronchial/Tracheal Epithelial Normal Cells (BTEC) (ATCC® PCS-300-010) derived from normal
human lung was used to observe the effect that exosomes from tumor cells had on them (“ATCC Cell
Lines,” 2014).
2.1.1 CELL LINE HANDLING AND MAINTENANCE
The human tumoral cell lines MCF7 and MDA were propagated in Dulbecco’s Modified Eagle
Medium (DMEM; Invitrogen, USA), supplemented with 10% (v/v) of exosome-depleted Fetal Bovine
Serum (exo-FBS; System Biosciences, USA) and 1% (v/v) of antibiotic/antimycotic Penicillin-
Streptomycin (Pen-Strep + Antimycotic; Invitrogen, USA). BTEC cell line was propagated in Airway
Epithelial Cell Basal Media (ATCC, USA) supplemented with Bronchial Epithelial Cell Growth Kit
(ATCC, USA). Cell cultures were maintained in 75 cm2
culture flasks (BD Biosciences, New Jersey,
USA) and were incubated in a CO2 Incubator (SANYO CO2 Incubator, Electric Biomedical Co., Osaka,
Japan), at 37 °C, 5% (v/v) of CO2 and an atmosphere of 99% (v/v) humidity.
In order for cells to have the nutrient supply and the space they need to grow, culture cells were
renewal when an 80% confluence was reached in the culture flask. After the medium was removed
and discarded, 2 mL of trypsin (TrypLE™, Invitrogen, New York, USA) were added to the flask and
incubated in the CO2 Incubator for 5 min so the adherent cells could detach. After that period of time,
the same quantity of medium was added to stop the trypsin activity. The cell suspension was
transferred to 15 mL Falcons (BD Biosciences, New Jersey, USA) and centrifuged at 1500 rpm for 5
min at approximately 15 °C (Sigma 3-16K 10280, Tuttlingen, Germany). Afterwards, the supernatant
was discarded and the remaining pellet was resuspended in 1 mL of fresh medium. To a 75 cm2
flask
it was added 10 mL of fresh medium with a 3x10⁵ cells/mL concentration from cell suspension, being
after incubated in the previously described conditions. For the exosome purification assays, MCF7 and
MDA cell lines were maintained with slightly differences, as described in section 2.4.
Cell density was verified using the trypan blue exclusion method, on a hemacytometer
(Hirschmann, Eberstadt, Germany). In a 2 mL eppendorf, 350 µL of medium were added together with
24
50 µL of the cell suspension and 100 µL of trypan blue solution 4% (v/v) (Sigma), a stain that
selectively colors dead cells since it only crosses corrupted membranes. This solution was placed in
the hemacytometer and examined at the microscope (Olympus CXX41 inverted microscope Tokyo,
Japan). Cell density was determined through the following equation (1):
(1)
𝑁𝑢𝑚𝑏𝑒𝑟 𝑜𝑓 𝑐𝑒𝑙𝑙𝑠
𝑚𝐿=
∑(𝑐𝑒𝑙𝑙𝑠 𝑝𝑒𝑟 𝑞𝑢𝑎𝑑𝑟𝑎𝑛𝑡)
4𝑥 104 (𝐶ℎ𝑎𝑚𝑏𝑒𝑟 𝑉𝑜𝑙𝑢𝑚𝑒 𝑥 𝐷𝑖𝑙𝑢𝑡𝑖𝑜𝑛 𝑓𝑎𝑐𝑡𝑜𝑟)
2.1.2 CELL VIABILITY MTS ASSAY
For each cell line, in vitro cytotoxicity assays were performed for each nanoformulation (section
2.2.2 and 2.2.3) and exosome solution (section 2.6) through the CellTiter 96® Aqueous Non-
Radioactive Cell Proliferation Assay (Promega, Madison, USA), a colorimetric method for determining
the number of viable cells.
After 80% confluence, cells were removed from the flask and centrifuged as previously
described in section 2.1.1. The supernatant was discarded and the pellet was resuspended in 1 mL of
medium. For cell viability assays, 100 µL of a cell suspension at a concentration of 0,75x10⁵ cells/mL
were plated into 96-well plates (Orange Scientific, Braine-l’Alleud, Bélgica) and incubated in the CO2
Incubator at 37 °C, 5% (v/v) of CO2 and an atmosphere of 99% (v/v) humidity for 24 hours.
The solutions with gold nanoparticles for MCF7 and MDA cells, as well as the exosomes
solutions for BTEC cells were prepared. The medium in the plate was removed and both
nanoformulations (section 2.2.2. and 2.2.3.) were added to MCF7 and MDA cells, with 6 and 12 hours
of incubation time. As for BTEC cells, these were incubated with exosomes at a concentration of 50 µg
for periods of time of 30 min, 2 h, 4 h and 12 h. Control samples were also prepared, incubated with
medium only.
After those periods of time, a solution with medium, MTS (3-(4,5-dimethylthiazol-2-yl)-5-(3-
(carboxymethoxyphenyl)-2-(4-(sulfopheenyl)-2H-tetrazolium, inner salt), and PMS (phenazine
methosulfate) in a 100:19:1 ratio was prepared and added to each well for further incubation of 45
min. During this period, a MTS is reduced into formazan by dehydrogenase present in metabolically
active cells. The quantity of formazan produced is directly proportional to the number of living cells,
measured at 490 nm absorbance by Tecan Infinite F200 Microplate Reader (Tecan, Männedorf,
Switzerland) and cell viability was calculated relatively to control samples with the following equation
(2):
25
(2)
𝐶𝑒𝑙𝑙 𝑉𝑖𝑎𝑏𝑖𝑙𝑖𝑡𝑦 (%) =𝐴𝑏𝑠 490𝑛𝑚 (𝑠𝑎𝑚𝑝𝑙𝑒)
𝐴𝑏𝑠 490𝑛𝑚 (𝑐𝑜𝑛𝑡𝑜𝑙) 𝑥 100
The assays were done in triplicate. It was expected to obtain 100% viability in all cases, with
the addition of nanoparticles and exosomes to cells since no toxicity is expected.
2.2 GOLD NANOPARTICLES
2.2.1 GOLD NANOPARTICLES SYNTHESIS
Gold nanoparticles were prepared by a citrate-reduction process first described by Turkevich
(Turkevich et al., 1951) and later adapted by Lee and Miesel (Lee and Meisel, 1982). First, all glass
material was incubated overnight with aqua regia (proportion 1:3 of HNO3:HCl) and then washed with
milli-Q water. After that, in a 500 mL round bottom flask, 250 mL of 1 mM HauCl4 (Sigma-Aldrich) were
dissolved in milli-Q water and brought to boil in the hot plate. While in reflux, 25 mL of 38.8 mM of
sodium citrate (Sigma) were quickly added and the colorless solution turned blue and then to red,
which indicates the nanoparticle formation. This solution was protected from light, kept in boil for 30
minutes and then allowed to cool down at room temperature.
AuNPs were later characterized by three methods: (1) UV/Vis Spectroscopy, using an UV/Vis
Spectrophotometer (UVmini-1240, Shimadzu, Germany), with the absorbance measurements made
using 100 μL of volume quartz absorption cells (105.202-QS, Hellma, Germany) and the concentration
determined using the Lambert-Beer law (according to the formula A = ε. ℓ.c, where A is the substance
absorbance, ε is the molar absorptivity for the wavelength of A, ℓ is the optical path length and C the
solution concentration) with theoretical extinction coefficient (2.33 x 10⁻⁸
M-1
cm-1
); (2) Dynamic Light
Scattering (DLS), using a Nanoparticle Analyzer SZ-100 (Horiba Scientific, Japan) at 25 °C and a
scattering angle of 90°, with samples of 2 nM of AuNP in milli-Q water previously prepared; (3)
Transmission Electron Microscopy (TEM), performed at Instituto de Ciência e Engenharia de Materiais
e Superfícies at Instituto Superior Técnico (ICEMS/IST), Portugal, with a HITACHI H-8100
microscope, being the samples prepared by depositing 10 μL of the colloidal solution of gold in carbon
copper grids, washing twice with milli-Q water, and air dried. The average particle size was
determined from TEM pictures using the imaging software Image J, analyzing at least 400 NPs.
26
2.2.2 FUNCTIONALIZATION WITH POLYETHYLENE GLYCOL (PEG)
In order to have stability in biological environment, the AuNP solution (10 nM) was mixed with
0.003 mg/mL of a commercial poly(ethylene glycol) (PEG) [O-(2-Mercaptoethyl)-O’-methyl-
hexa(ethylene glycol)] (Sigma-Aldrich, USA) in an aqueous solution of 0.028% of Sodium Dodecyl
Sulfate (SDS) (Sigma) and incubated for 16 hours at room temperature while stirring. After that, three
centrifugations (14.000 xg, 45 min) (Sigma 3-16K 10280, Tuttlingen, Germany) at 4 °C were
performed to remove the excess of PEG which has not been bound, remaining in the supernatant, and
it was quantified by the Ellman’s Assay. The pellet was re-suspended in Milli-Q water. The resulting
functionalized AuNPs were then characterized by UV/Vis Spectroscopy, Dynamic Light Scattering and
Transmission Electron Microscopy (Baptista et al., 2013).
The excess of PEG chains in the supernatants is quantified from a calibration curve prepared
by reacting 200 µL of a known concentration of O-(2-Mercaptoethyl)-O’-methyl-hexa(ethylene glycol)
in 100 µL of phosphate buffer 0.5 M (pH=7) with 7 µL of 5 mg/mL of 5,5’-diyhio-bis(2-nitrobenzoic)
acid (DTNB) in phosphate buffer 0.5 M (pH=7). Absorbance is measured at 412 nm after 10 min. The
amount of PEG chains bounded to the nanoparticles is calculated by the difference between the
amount calculated by this assay and the initial amount incubated. Through the Ellman’s assay, we
were able to determine the number of PEG chains that covers 100% of the gold nanoparticles surface
(Appendix A, Figure A.1) i.e. 0.01 mg/mL, being able to functionalize the nanoparticles with 30% of
PEG in their surface for further functionalization with thiolated oligonucleotides.
2.2.3 AuNP@PEG FUNCTIONALIZATION WITH THIOLATED OLIGONUCLEOTIDES
AuNP functionalized with PEG (AuNP@PEG) were therefore functionalized with an antisense
Rab27a oligonucleotide in hairpin conformation modified with 5’ –thiol- C6 (STABVIDA), previously re-
suspended in 1 mL of 0.1 M DL-dithiothreitol (DTT) (Sigma-Aldrich) for 2 hours at room temperature,
in order to avoid the dimerization of the oligonucleotides. After the oligonucleotide quantification using
the extinction coefficient at 260 nm obtained in Nanodrop, oligomers were added to the AuNP@PEG
solution in a 100:1 (AuNP:oligonucleotide) ratio. The solution was purified through a desalting NAP-5
column (Pharmacia Biotech, Sweden) using 10 nM (pH 8) of phosphate buffer as eluent.
To the previous solution it was added an AGE I solution (2% (w/v) SDS, 10 mM phosphate
buffer pH 8), sonicated 10 sec in an ultra-sound bath and incubated 20 min at room temperature.
Thereafter, it was added an AGE II solution (1,5 M NaCl, 0,01% (w/v) SDS, 10 mM phosphate buffer
pH 8) and It was sonicated 10 sec in an ultra-sound bath and incubated 20 min at room temperature
with this process being repeated two more times before an incubation for 16 hours at room
temperature. After that, the solution containing AuN@PEG@antisense-Rab27a was washed over
three centrifugations (14.000 xg, 45 min) to remove the excess of oligonucleotide that did not bound to
27
the AuNPs. The resulting AuNPs were characterized by Uv/Vis Spectroscopy and Dynamic Light
Scattering.
2.2.4 QUANTIFICATION OF FUNCTIONALIZED OLIGONUCLEOTIDES ON AuNPs’
SURFACE
After all washing steps the supernatants were stored so the amount of oligonucleotides per
AuNP could be determined. A standard linear calibration curve with known concentrations of
oligonucleotide (in the range of 0 – 0.3 µM) and Quant-iT OliGreen ssDNA Reagent (Thermo
Scientific, USA) in phosphate buffer 10 mM pH=8 was prepared (Appendix A, Figure A.2) and the
concentration of DNA was measured from fluorescence intensity in the PerkinElmer LS45
Fluorescence Spectrometer (USA) using an Ultra-Micro quartz cell (Hellma, Germany). Fluorescence
emission was converted to molar concentration of the oligonucleotide by interpolation from the
calibration curve. Once we know the initial amount of oligonucleotide added to the mixture, with the
standard curve we can determine what did not bound to the AuNP by subtracting the amount
quantified in the supernatants to the initially added.
2.3 GENE EXPRESSION EVALUATION ASSAY
The evaluation of nanoformulations silencing efficacy for RAB27A was evaluated by Real-time
Quantitative PCR (qPCR), in MCF7 and MDA cell lines. Cells were plated into 24-well plate and were
to adhere for 24 hours at 37 °C, 5% (v/v) of CO2 and an atmosphere of 99% (v/v) humidity. After that
period of time, cells were incubated with AuNP@PEG and AuNP@PEG@antisense-Rab27a at an
oligonucleotide concentration of 20 nM and 30 nM as well as exosome free medium (control),
harvesting the cells after 6 and 12 hours for subsequent RNA extraction (section 2.3.1), cDNA
synthesis (section 2.3.2) and gene expression measurement by qPCR (section 2.3.3).
2.3.1 RNA EXTRACTION
The RNA extraction was performed following the TRIsure Protocol (Bioline, UK). RNA
concentration was determined using NanoDrop2000 (Thermo Scientific, USA), by absorbance at 260
nm, knowing that 1 absorbance unit corresponds to 40 µg of single strand RNA in 1 mL. RNA purity
was also determined using NanoDrop by Abs260/Abs280 and Abs260/Abs230 ratios. The ratio
Abs260/Abs280 must be around 2 so RNA can be considered “pure”; if the ratio is lower than expected, it
may indicate the presence of proteins, phenol or other contaminants that absorb at 280 nm (Fleige
and Pfaffl, 2006; “SV Total RNA Isolation System,” 2009). The expected values for Abs260/Abs230 are
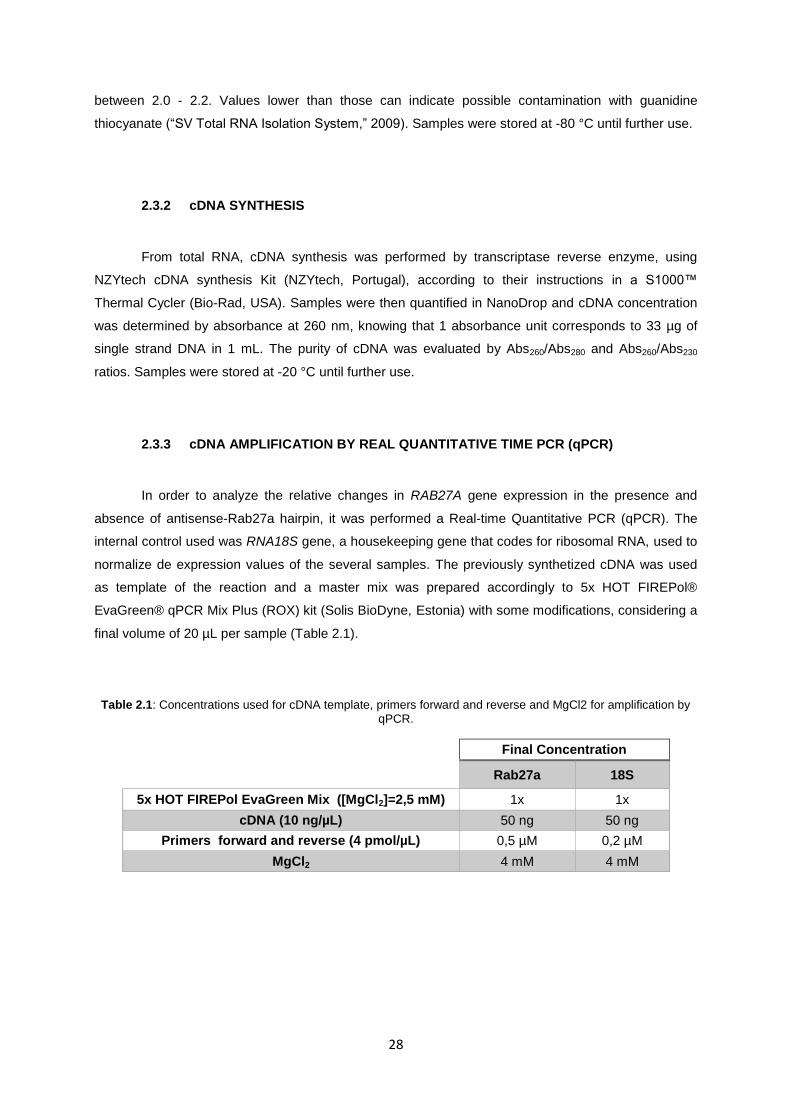
28
between 2.0 - 2.2. Values lower than those can indicate possible contamination with guanidine
thiocyanate (“SV Total RNA Isolation System,” 2009). Samples were stored at -80 °C until further use.
2.3.2 cDNA SYNTHESIS
From total RNA, cDNA synthesis was performed by transcriptase reverse enzyme, using
NZYtech cDNA synthesis Kit (NZYtech, Portugal), according to their instructions in a S1000™
Thermal Cycler (Bio-Rad, USA). Samples were then quantified in NanoDrop and cDNA concentration
was determined by absorbance at 260 nm, knowing that 1 absorbance unit corresponds to 33 µg of
single strand DNA in 1 mL. The purity of cDNA was evaluated by Abs260/Abs280 and Abs260/Abs230
ratios. Samples were stored at -20 °C until further use.
2.3.3 cDNA AMPLIFICATION BY REAL QUANTITATIVE TIME PCR (qPCR)
In order to analyze the relative changes in RAB27A gene expression in the presence and
absence of antisense-Rab27a hairpin, it was performed a Real-time Quantitative PCR (qPCR). The
internal control used was RNA18S gene, a housekeeping gene that codes for ribosomal RNA, used to
normalize de expression values of the several samples. The previously synthetized cDNA was used
as template of the reaction and a master mix was prepared accordingly to 5x HOT FIREPol®
EvaGreen® qPCR Mix Plus (ROX) kit (Solis BioDyne, Estonia) with some modifications, considering a
final volume of 20 µL per sample (Table 2.1).
Table 2.1: Concentrations used for cDNA template, primers forward and reverse and MgCl2 for amplification by
qPCR.
Final Concentration
Rab27a 18S
5x HOT FIREPol EvaGreen Mix ([MgCl2]=2,5 mM) 1x 1x
cDNA (10 ng/µL) 50 ng 50 ng
Primers forward and reverse (4 pmol/µL) 0,5 µM 0,2 µM
MgCl2 4 mM 4 mM
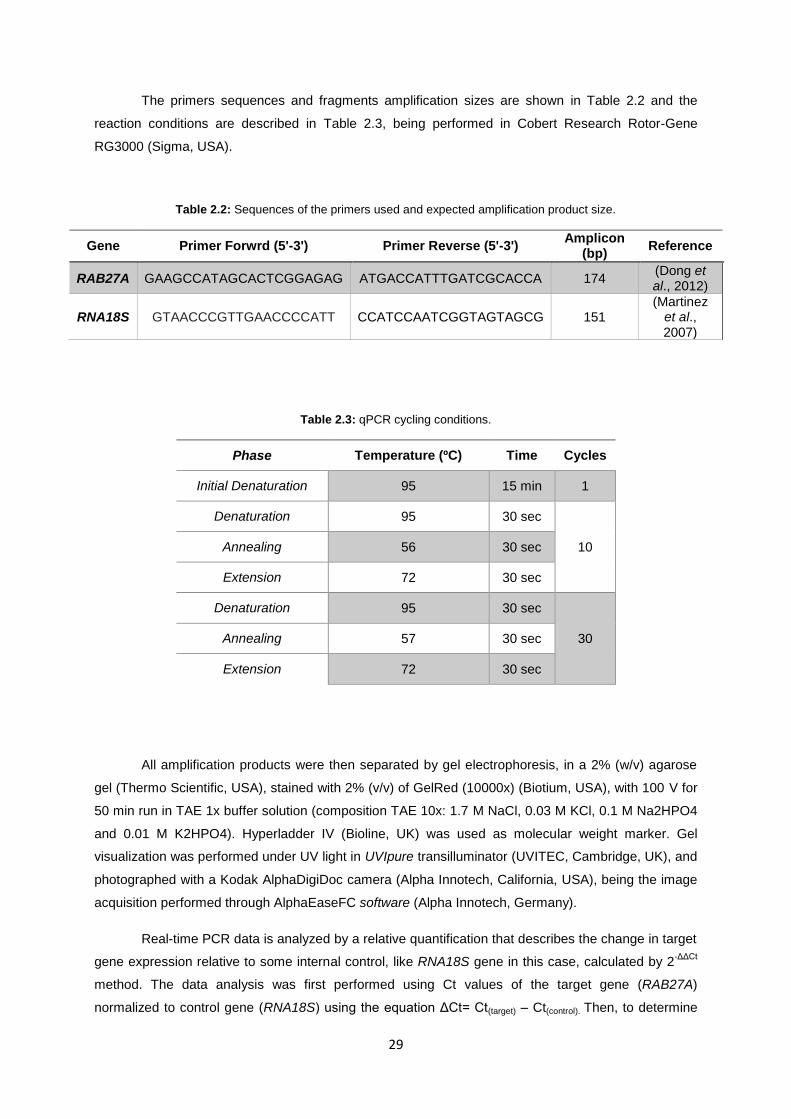
29
The primers sequences and fragments amplification sizes are shown in Table 2.2 and the
reaction conditions are described in Table 2.3, being performed in Cobert Research Rotor-Gene
RG3000 (Sigma, USA).
Table 2.2: Sequences of the primers used and expected amplification product size.
Gene Primer Forwrd (5'-3') Primer Reverse (5'-3') Amplicon
(bp) Reference
RAB27A GAAGCCATAGCACTCGGAGAG ATGACCATTTGATCGCACCA 174 (Dong et al., 2012)
RNA18S GTAACCCGTTGAACCCCATT CCATCCAATCGGTAGTAGCG 151 (Martinez
et al., 2007)
Table 2.3: qPCR cycling conditions.
Phase Temperature (ºC) Time Cycles
Initial Denaturation 95 15 min 1
Denaturation 95 30 sec
10 Annealing 56 30 sec
Extension 72 30 sec
Denaturation 95 30 sec
30 Annealing 57 30 sec
Extension 72 30 sec
All amplification products were then separated by gel electrophoresis, in a 2% (w/v) agarose
gel (Thermo Scientific, USA), stained with 2% (v/v) of GelRed (10000x) (Biotium, USA), with 100 V for
50 min run in TAE 1x buffer solution (composition TAE 10x: 1.7 M NaCl, 0.03 M KCl, 0.1 M Na2HPO4
and 0.01 M K2HPO4). Hyperladder IV (Bioline, UK) was used as molecular weight marker. Gel
visualization was performed under UV light in UVIpure transilluminator (UVITEC, Cambridge, UK), and
photographed with a Kodak AlphaDigiDoc camera (Alpha Innotech, California, USA), being the image
acquisition performed through AlphaEaseFC software (Alpha Innotech, Germany).
Real-time PCR data is analyzed by a relative quantification that describes the change in target
gene expression relative to some internal control, like RNA18S gene in this case, calculated by 2-ΔΔCt
method. The data analysis was first performed using Ct values of the target gene (RAB27A)
normalized to control gene (RNA18S) using the equation ΔCt= Ct(target) – Ct(control). Then, to determine
30
the relative expression levels, the following equation is used: ΔΔCt= ΔCt (target) – ΔCt(control) and after
that the expression of the target gene is known by calculation of 2-ΔΔCt
(Livak and Schmittgen, 2001).
2.4 EXOSOME EXTRACTION AND PURIFICATION
In order to understand the best method for isolation and purification, exosomes were isolated
from two procedures, one based on ultracentrifugations and other on precipitation by the ExoQuick-
TC™ Exosome Precipitation Solution (System Biosciences, USA). At a first step, two different
supernatants from both MCF7 and MDA cells were collected, in an attempt to observe which one had
a better yield of exosome quantity. The two cell lines were propagated in exosome-free medium, at 37
°C in 5% CO2, until they were 80% confluent. At that point, the medium in the flasks was collected
(“supernatant 1”) and cells were allowed to grow for another 48 hours in fresh exosome-free medium.
After that time “supernatant 2” was collected and culture cells were renewal following the procedure
described in section 2.1.1. Supernatants were stored at -80 °C until further use.
Isolation by ultracentrifugation method was performed using differential centrifugations
followed by ultracentrifugations, as previously described (Koga et al., 2005; Théry et al., 2006), with
some modifications. Supernatant 1 (20 mL) was centrifuged at 400 xg for 5 min and 2000 xg for 10
min to remove cells and cellular debris, followed by filtration through a 0.22 µm syringe filter (VWR,
USA) so larger vesicles could be retained. Besides the two centrifugations mentioned above,
supernatant 2 (20 mL) is submitted to another one at 10.000 xg for 20 min, with no filtration. After
samples were treated with centrifugations, ultracentrifugations were performed in a XL-A Analytical
Ultracentrifuge (Beckman Coulter USA) with a 30% (w/v) sucrose gradient (30 g sucrose, 2.4 g Tris
base, 100 mL D2O, pH 7.4) and without sucrose gradient, in order to compare which method gives us
the most amount of purified exosomes since exosomes float at densities ranging from 1.15 to 1.19
g/mL on continuous sucrose gradients, different than other vesicles (Théry et al., 2006). Samples were
carefully loaded into polycarbonate bottles (Beckman Coulter, USA). Supernatant 1 was submitted to
two ultracentrifugations at 100.000 xg for 1 hour, one with 4 mL of sucrose solution followed by
another with the sucrose fraction diluted in PBS 1x. If without sucrose gradient, the supernatant is
diluted in PBS 1x and only one ultracentrifugation is performed for 1 h and 30 min. Supernatant 2,
before being submitted to the same ultracentrifugations previously mentioned, was submitted to an
ultracentrifugation at 100.000 xg for 1 hour to remove the larger vesicles once no filtration was
performed in this sample. After all ultracentrifugations, the remaining pellets were resuspended in 100
µL of PBS 1x (137 mM NaCl, 2.7 mM KCl, 8 mM NaHPO4, 2 mM KH2PO4 pH 7.4). All centrifugations
were performed at 4 °C.
Another procedure used to isolate the exosomes was with ExoQuick™ Solution. Supernatants
1 and 2 were centrifuged at 3000 xg for 5 min, pellets were discarded and ExoQuick™ Solution was
added to the supernatants (for each final 500 µL it was added 120 µL of ExoQuick™ Solution).
Samples were stored overnight at 4 °C and then centrifuged at 1500 xg for 30 min. The supernatant
31
was removed and the pellet with exosomes was resuspended in PBS 1x. ExoQuick™ Solution was
also conjugated with Amicon® Ultra-0.5 Filters (Millipore, Germany), according to manufacturer’s
instructions, in an attempt to obtain more exosomes from each supernatant.
In order to observe if AuNP@PEG@anitisnse-Rab27a had the expected effect on exosome
secretion and also to compare it between the two cell lines used, cells from MCF7 and MDA were
plated each into fifteen 35 mm plates and were to adhere for 24 h. After that period of time, cells were
incubated for 6 and 12 h with the nanoformulations (sections 2.2.2 and 2.2.3) as well as exosome-free
medium as control. Then, medium was collected and it was added fresh exosome-free medium to
each plate and collected after one hour. Supernatants of each condition were collected together (total
volume of 5 mL each), centrifuged at 3000 xg for 15 min for the removal of cellular debris, filtrated with
a 0.22 µm syringe filter to retain larger vesicles and centrifuged in Amicon® Ultra-0.5 Filters according
to manufacturer’s instructions, so that exosomes were concentrated. Then, to the remaining 500 µL, it
was added 120 µL of the ExoQuick™ Solution and stored overnight at 4 °C. The mixture was then
centrifuged at 1500 xg for 30 min, the supernatant was removed and the remaining pellet with
exosomes was resuspended in PBS 1x.
The protein content was measured in a 96-well plate using PierceTM
BCA Protein Assay Kit
(Thermo Scientific, USA). A calibration curve was established using standard Bovine Serum Albumin
(BSA) solutions, with concentrations between 0 and 1000 µg/mL. To 10 µL of the exosome sample it
was added 150 µL of Pierce reagent and incubated at room temperature for 5 min before the
absorbance reading at 660 nm by Tecan Infinite F200 Microplate Reader (Tecan Männedorf,
Switzerland). The isolated exosomes were stored at -80 °C until further use.
2.5 QUANTIFICATION AND CHARACTERIZATION OF EXOSOMES – WESTERN BLOT
To verify the presence of exosomes, the pellet with exosomes obtained from the
ultracentrifugations and ExoQuick™ Solution was resuspended in a lysis buffer (150 Mm NaCl,
2%NP-40, 50 mM Tris pH8, 5 mM EDTA, 2% Protease inhibitor, 10% Phosphatase inhibitor, 1%
PMSF and 1% DTT) and incubated for 2 hours. After that, samples were treated SDS loading buffer
(1x) (SDS Loading buffer 5x: 0.25% (w/v) bromophenol blue, 500 mM DTT, 20% (v/v) glycerol, 10%
(w/v) SDS, 250 mM Tris-HCl pH 6.8) and incubated overnight for further analysis by Western blot. The
obtained protein lysates were quantified by Pierce™ BCA Protein Assay Kit, thus determining the
protein concentration obtained by ultracentrifugation and ExoQuick™ Solution from supernatants 1
and 2.
In order to understand which method has the better yield, total of protein obtained from
ultracentrifugation (15 µg) as well as 15 µg and 50 µg obtained with ExoQuick™ Solution method were
separated on 10% sodium dodecyl sulfate-polyacrylamide gel electrophoresis (SDS-PAGE), under
32
reduction conditions with a stacking gel of 5% (v/v) and a resolving gel of 10% (v/v). Gel was stained
with Coomassie blue and the density of the bands was analyzed with GelAnalyser software.
After the analysis of the previous gel a Western Blot analysis was performed with 15 µg, 30
µg and 50 µg of exosomes extracted by ExoQuick™ Solution method from both supernatant 1 and 2
samples. A SDS-PAGE was performed has previously described and proteins were transferred onto a
nitrocellulose membrane (Thermo Scientific, USA) at 20 V overnight at 4 °C, using transfer buffer (1x)
(Transfer buffer 10x: 25 mM Tris, 192 mM glycine, 0.01% (w/v) SDS, 20% (v/v) methanol, pH 8.3).
They were then blocked in TBST buffer (25 mM Tris-HCl, 150 mM NaCl, 0.1% (v/v) Tween-20, pH 7.5)
with 5% (w/v) of non-fat milk for 45 min at room temperature. After blocking, the membrane was
incubated with primary antibodies Anti-Alix and Anti-CD81 (Novus Biologicals, USA) at a dilution 1:500
and 1:1000, respectively, for 1 h at room temperature, washed three times for 5 min with TBST buffer
and incubated 1 h with anti-mouse horseradish peroxidadse (HRP)-antibody (Cell Signaling, USA) at a
dilution 1:2500. Membranes were then washed three times for 5 min with TBST buffer and the bound
antibodies were visualized using Western Bright ECL HRP Substrate (Advansta, USA).
2.6 UPTAKE OF EXOSOMES BY NORMAL CELL LINES
Once exosomes can transfer information from one cell to another, an assay was performed to
observe that possibility between tumor-derived exosomes and normal cells. BTEC cells were plated
into 35 mm plates with Airway Epithelial Cell Basal Media for 24 h to adhere. They were then
incubated in a medium solution with 50 µg of exosomes isolated from tumoral cells (MCF7) for 30 min,
2 h, 4 h and 12 h to be able to compare the expression of miR-21 and c-Myc over time by qPCR.
Controls with no exosomes at the same time points were also prepared. A cytotoxicity assay (section
2.1.2) was performed for all the mentioned periods of time to ensure that exosomes did not induce cell
death since that could influence the results.
2.6.1 EVALUATION OF C-MYC GENE EXPRESSION
Cells were collected and RNA extracted as explained in section 2.3.1. cDNA was synthetized
according to section 2.3.2 and qPCR for c-Myc gene expression evaluation was performed as
described in section 2.3.3, using the sequence of primers represented in Table 2.4, with RNA18S as
the internal control.
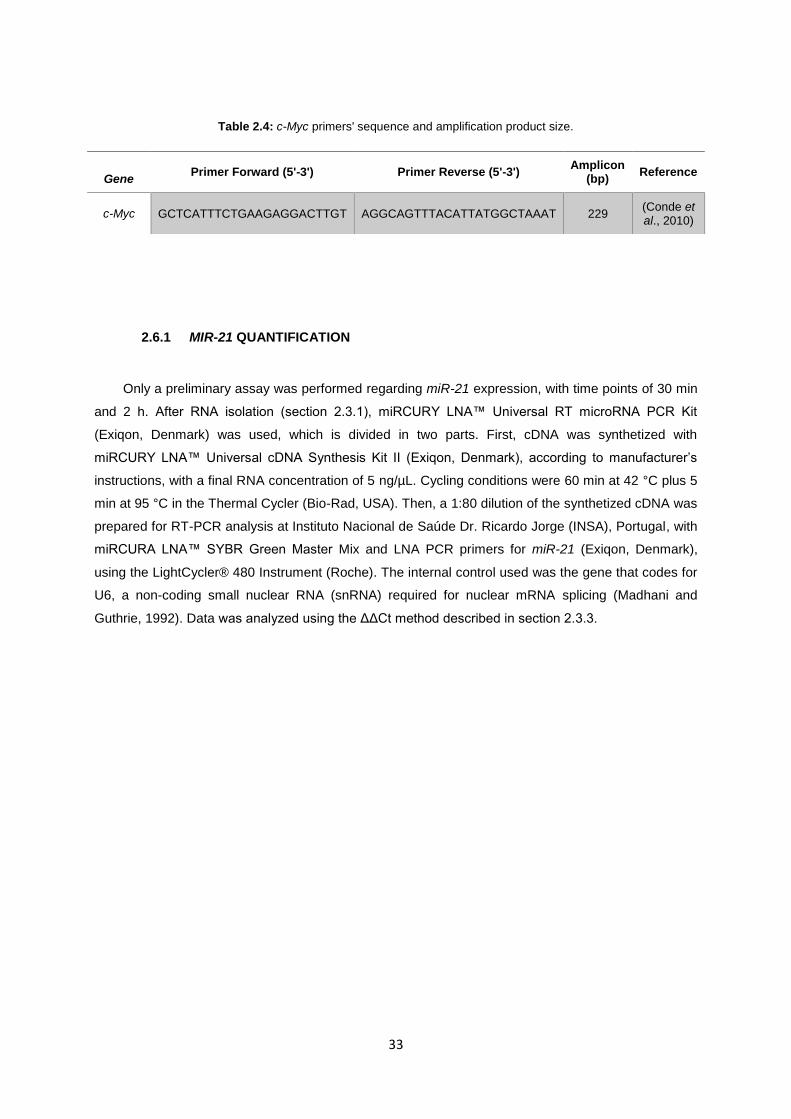
33
Table 2.4: c-Myc primers' sequence and amplification product size.
2.6.1 MIR-21 QUANTIFICATION
Only a preliminary assay was performed regarding miR-21 expression, with time points of 30 min
and 2 h. After RNA isolation (section 2.3.1), miRCURY LNA™ Universal RT microRNA PCR Kit
(Exiqon, Denmark) was used, which is divided in two parts. First, cDNA was synthetized with
miRCURY LNA™ Universal cDNA Synthesis Kit II (Exiqon, Denmark), according to manufacturer’s
instructions, with a final RNA concentration of 5 ng/µL. Cycling conditions were 60 min at 42 °C plus 5
min at 95 °C in the Thermal Cycler (Bio-Rad, USA). Then, a 1:80 dilution of the synthetized cDNA was
prepared for RT-PCR analysis at Instituto Nacional de Saúde Dr. Ricardo Jorge (INSA), Portugal, with
miRCURA LNA™ SYBR Green Master Mix and LNA PCR primers for miR-21 (Exiqon, Denmark),
using the LightCycler® 480 Instrument (Roche). The internal control used was the gene that codes for
U6, a non-coding small nuclear RNA (snRNA) required for nuclear mRNA splicing (Madhani and
Guthrie, 1992). Data was analyzed using the ΔΔCt method described in section 2.3.3.
Gene
Primer Forward (5'-3') Primer Reverse (5'-3') Amplicon
(bp) Reference
c-Myc GCTCATTTCTGAAGAGGACTTGT AGGCAGTTTACATTATGGCTAAAT 229 (Conde et al., 2010)

34
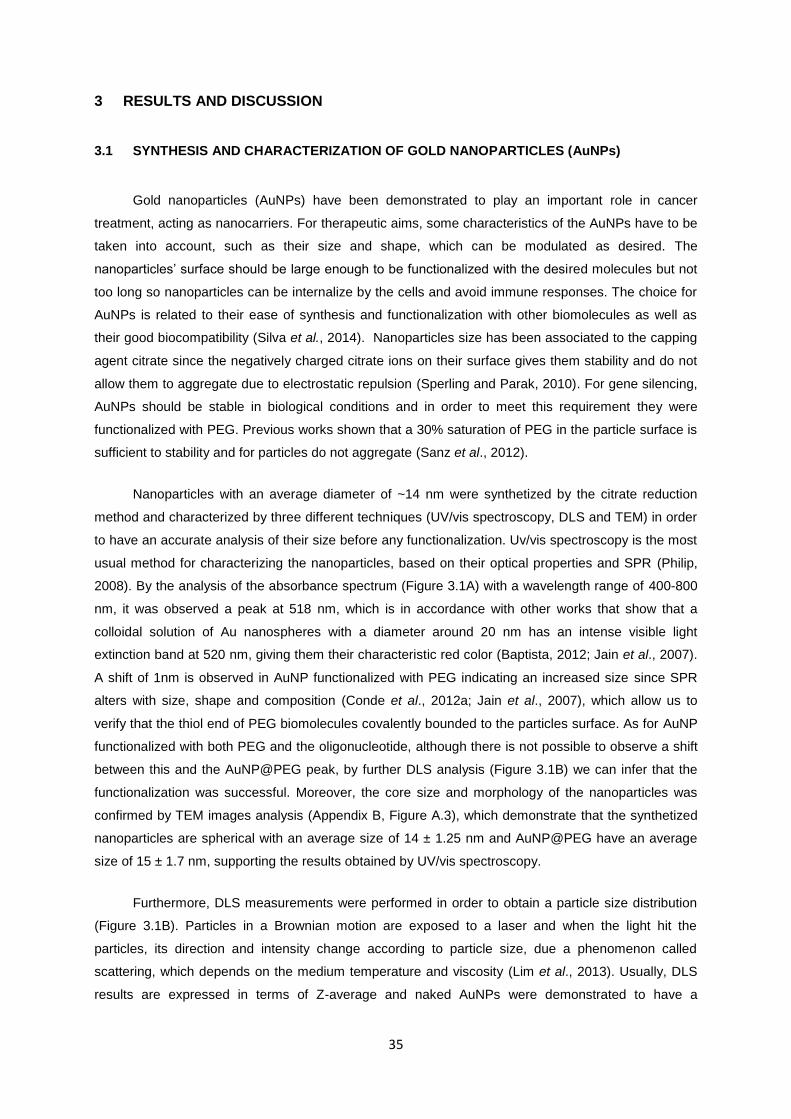
35
3 RESULTS AND DISCUSSION
3.1 SYNTHESIS AND CHARACTERIZATION OF GOLD NANOPARTICLES (AuNPs)
Gold nanoparticles (AuNPs) have been demonstrated to play an important role in cancer
treatment, acting as nanocarriers. For therapeutic aims, some characteristics of the AuNPs have to be
taken into account, such as their size and shape, which can be modulated as desired. The
nanoparticles’ surface should be large enough to be functionalized with the desired molecules but not
too long so nanoparticles can be internalize by the cells and avoid immune responses. The choice for
AuNPs is related to their ease of synthesis and functionalization with other biomolecules as well as
their good biocompatibility (Silva et al., 2014). Nanoparticles size has been associated to the capping
agent citrate since the negatively charged citrate ions on their surface gives them stability and do not
allow them to aggregate due to electrostatic repulsion (Sperling and Parak, 2010). For gene silencing,
AuNPs should be stable in biological conditions and in order to meet this requirement they were
functionalized with PEG. Previous works shown that a 30% saturation of PEG in the particle surface is
sufficient to stability and for particles do not aggregate (Sanz et al., 2012).
Nanoparticles with an average diameter of ~14 nm were synthetized by the citrate reduction
method and characterized by three different techniques (UV/vis spectroscopy, DLS and TEM) in order
to have an accurate analysis of their size before any functionalization. Uv/vis spectroscopy is the most
usual method for characterizing the nanoparticles, based on their optical properties and SPR (Philip,
2008). By the analysis of the absorbance spectrum (Figure 3.1A) with a wavelength range of 400-800
nm, it was observed a peak at 518 nm, which is in accordance with other works that show that a
colloidal solution of Au nanospheres with a diameter around 20 nm has an intense visible light
extinction band at 520 nm, giving them their characteristic red color (Baptista, 2012; Jain et al., 2007).
A shift of 1nm is observed in AuNP functionalized with PEG indicating an increased size since SPR
alters with size, shape and composition (Conde et al., 2012a; Jain et al., 2007), which allow us to
verify that the thiol end of PEG biomolecules covalently bounded to the particles surface. As for AuNP
functionalized with both PEG and the oligonucleotide, although there is not possible to observe a shift
between this and the AuNP@PEG peak, by further DLS analysis (Figure 3.1B) we can infer that the
functionalization was successful. Moreover, the core size and morphology of the nanoparticles was
confirmed by TEM images analysis (Appendix B, Figure A.3), which demonstrate that the synthetized
nanoparticles are spherical with an average size of 14 ± 1.25 nm and AuNP@PEG have an average
size of 15 ± 1.7 nm, supporting the results obtained by UV/vis spectroscopy.
Furthermore, DLS measurements were performed in order to obtain a particle size distribution
(Figure 3.1B). Particles in a Brownian motion are exposed to a laser and when the light hit the
particles, its direction and intensity change according to particle size, due a phenomenon called
scattering, which depends on the medium temperature and viscosity (Lim et al., 2013). Usually, DLS
results are expressed in terms of Z-average and naked AuNPs were demonstrated to have a
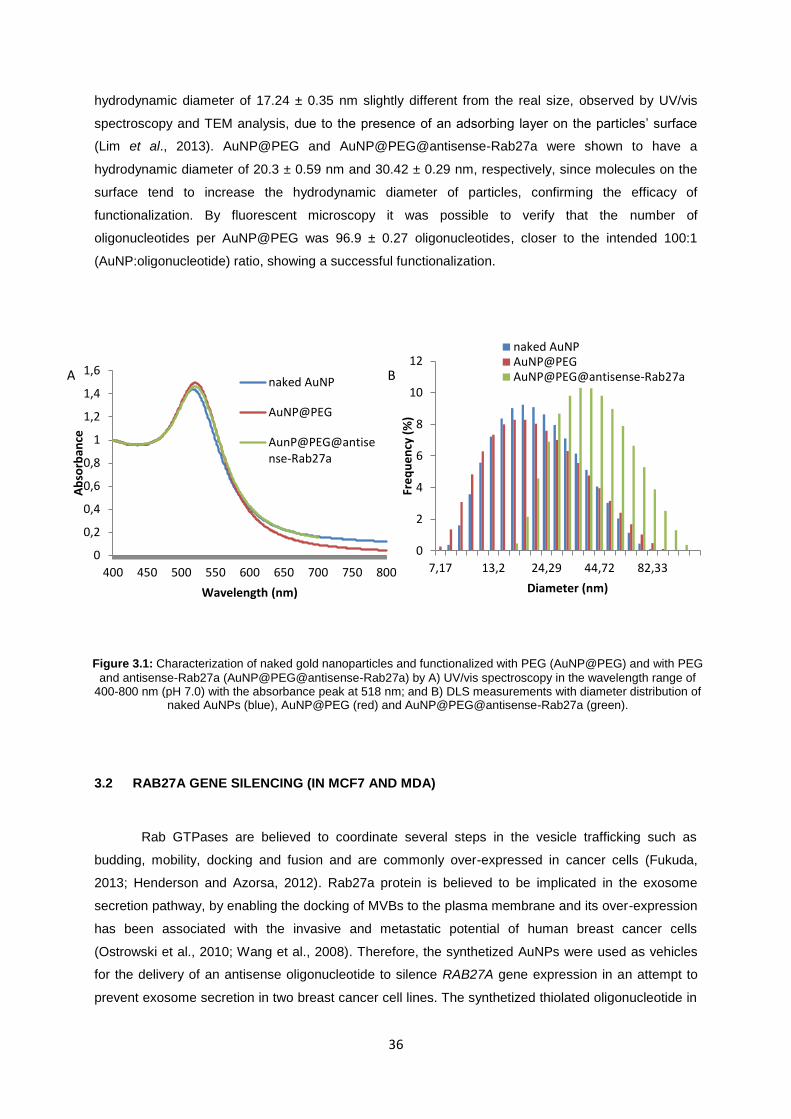
36
hydrodynamic diameter of 17.24 ± 0.35 nm slightly different from the real size, observed by UV/vis
spectroscopy and TEM analysis, due to the presence of an adsorbing layer on the particles’ surface
(Lim et al., 2013). AuNP@PEG and AuNP@PEG@antisense-Rab27a were shown to have a
hydrodynamic diameter of 20.3 ± 0.59 nm and 30.42 ± 0.29 nm, respectively, since molecules on the
surface tend to increase the hydrodynamic diameter of particles, confirming the efficacy of
functionalization. By fluorescent microscopy it was possible to verify that the number of
oligonucleotides per AuNP@PEG was 96.9 ± 0.27 oligonucleotides, closer to the intended 100:1
(AuNP:oligonucleotide) ratio, showing a successful functionalization.
3.2 RAB27A GENE SILENCING (IN MCF7 AND MDA)
Rab GTPases are believed to coordinate several steps in the vesicle trafficking such as
budding, mobility, docking and fusion and are commonly over-expressed in cancer cells (Fukuda,
2013; Henderson and Azorsa, 2012). Rab27a protein is believed to be implicated in the exosome
secretion pathway, by enabling the docking of MVBs to the plasma membrane and its over-expression
has been associated with the invasive and metastatic potential of human breast cancer cells
(Ostrowski et al., 2010; Wang et al., 2008). Therefore, the synthetized AuNPs were used as vehicles
for the delivery of an antisense oligonucleotide to silence RAB27A gene expression in an attempt to
prevent exosome secretion in two breast cancer cell lines. The synthetized thiolated oligonucleotide in
0
0,2
0,4
0,6
0,8
1
1,2
1,4
1,6
400 450 500 550 600 650 700 750 800
Ab
sorb
ance
Wavelength (nm)
naked AuNP
AuNP@PEG
AunP@PEG@antisense-Rab27a
0
2
4
6
8
10
12
7,17 13,2 24,29 44,72 82,33
Fre
qu
en
cy (
%)
Diameter (nm)
naked AuNPAuNP@PEGAuNP@PEG@antisense-Rab27a
Figure 3.1: Characterization of naked gold nanoparticles and functionalized with PEG (AuNP@PEG) and with PEG
and antisense-Rab27a (AuNP@PEG@antisense-Rab27a) by A) UV/vis spectroscopy in the wavelength range of 400-800 nm (pH 7.0) with the absorbance peak at 518 nm; and B) DLS measurements with diameter distribution of
naked AuNPs (blue), AuNP@PEG (red) and AuNP@PEG@antisense-Rab27a (green).
A B
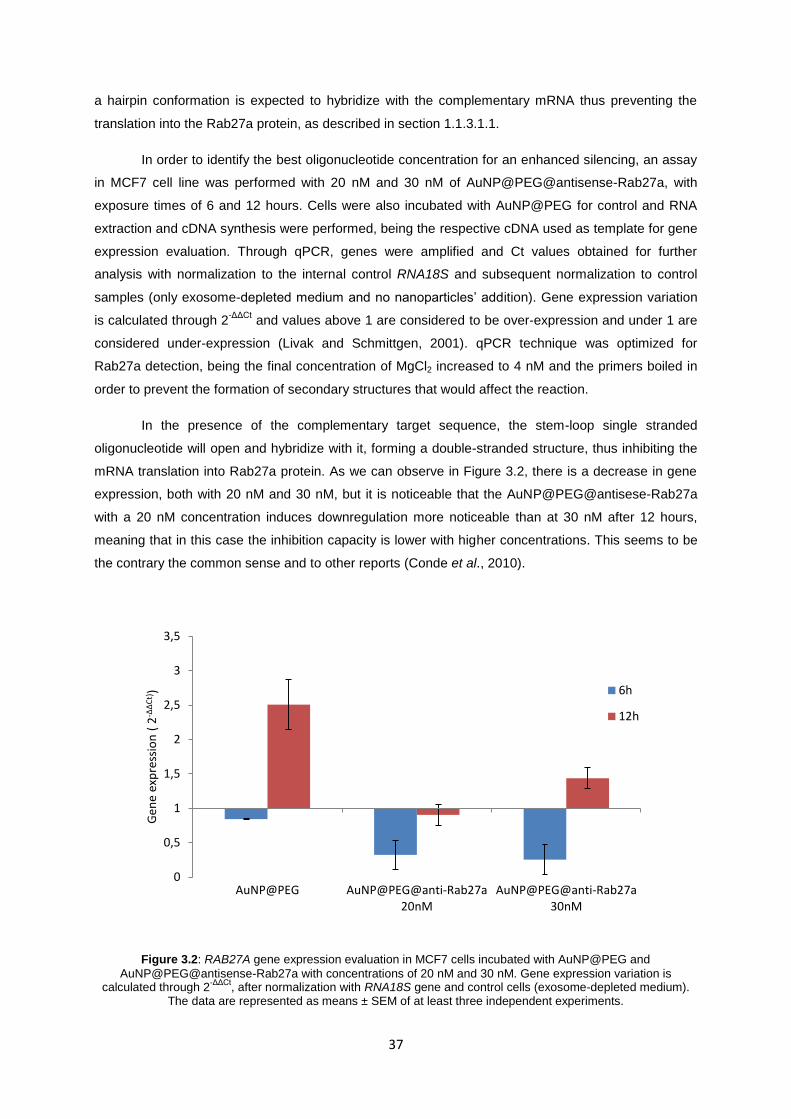
37
a hairpin conformation is expected to hybridize with the complementary mRNA thus preventing the
translation into the Rab27a protein, as described in section 1.1.3.1.1.
In order to identify the best oligonucleotide concentration for an enhanced silencing, an assay
in MCF7 cell line was performed with 20 nM and 30 nM of AuNP@PEG@antisense-Rab27a, with
exposure times of 6 and 12 hours. Cells were also incubated with AuNP@PEG for control and RNA
extraction and cDNA synthesis were performed, being the respective cDNA used as template for gene
expression evaluation. Through qPCR, genes were amplified and Ct values obtained for further
analysis with normalization to the internal control RNA18S and subsequent normalization to control
samples (only exosome-depleted medium and no nanoparticles’ addition). Gene expression variation
is calculated through 2-ΔΔCt
and values above 1 are considered to be over-expression and under 1 are
considered under-expression (Livak and Schmittgen, 2001). qPCR technique was optimized for
Rab27a detection, being the final concentration of MgCl2 increased to 4 nM and the primers boiled in
order to prevent the formation of secondary structures that would affect the reaction.
In the presence of the complementary target sequence, the stem-loop single stranded
oligonucleotide will open and hybridize with it, forming a double-stranded structure, thus inhibiting the
mRNA translation into Rab27a protein. As we can observe in Figure 3.2, there is a decrease in gene
expression, both with 20 nM and 30 nM, but it is noticeable that the AuNP@PEG@antisese-Rab27a
with a 20 nM concentration induces downregulation more noticeable than at 30 nM after 12 hours,
meaning that in this case the inhibition capacity is lower with higher concentrations. This seems to be
the contrary the common sense and to other reports (Conde et al., 2010).
Figure 3.2: RAB27A gene expression evaluation in MCF7 cells incubated with AuNP@PEG and
AuNP@PEG@antisense-Rab27a with concentrations of 20 nM and 30 nM. Gene expression variation is calculated through 2
-ΔΔCt, after normalization with RNA18S gene and control cells (exosome-depleted medium).
The data are represented as means ± SEM of at least three independent experiments.
0
0,5
1
1,5
2
2,5
3
3,5
AuNP@PEG AuNP@PEG@anti-Rab27a20nM
AuNP@PEG@anti-Rab27a30nM
Gen
e ex
pre
ssio
n (
2-Δ
ΔC
t)) 6h
12h
38
Based on the results above, the assays proceeded with AuNP@PEG@antisese-Rab27a at a
20 nM concentration. Both MCF7 and MDA cell lines were incubated with AuNP@PEG and
AuNP@PEG@antisense-Rab27a for 6 and 12 hours, to evaluate the effect of the antisense
oligonucleotide against RAB27A gene in different cell lines. Comparing MCF7 and MDA cells, it was
possible to verify that the metastatic MDA cells have an increased expression of RAB27A gene, as it
was expected, since it is involved in the modulation of invasive and metastatic phenotypes in breast
cancer cells (Hendrix and de Wever, 2013). An increase in gene expression, relatively to control cells,
is observed when cells are incubated with AuNP@PEG in MCF7 cells after 12 hours exposure and in
MDA after 6 and 12 hours exposure (Figure 3.3). Once Rab proteins are responsible for the
coordination of several steps in the intracellular trafficking (Fukuda, 2013), this over-expression might
be a consequent of the nanoparticles’ internalization that possibly cause some disturb in the endocytic
pathway. As for incubation with AuNP@PEG@antisense-Rab27a, in MCF7 cells (Figure 3.3A) there is
only possible to observe a decrease in RAB27A gene expression at 12 h, not being significantly
altered after 6 h exposure. However, in MDA cells (Figure 3.3B), it is possible to observe a more
significant decrease in RAB27A gene expression after exposure of 6 hours. If we were to compare
gene expression with cells exposed to AuNPs, utilizing cells incubated with AuNP@PEG as control, it
is possible to observe that RAB27A is under-expressed in every condition. These results allow us to
conclude that gold nanoparticles functionalized with antisense oligonucleotides were internalized by
cells and acted as inhibitors of gene expression, as it was expected.
In order to evaluate whether the nanoformulations had some toxic effect on cells, a cell
viability assay was performed. Cell survival rates upon nanoparticles exposure were determined via
the MTS assay (section 2.1.2) on MCF7 and MDA cells, with the same experimental conditions.
Observing Figure 3.4, no toxicity was detected after 6 and 12 h incubation, as expected, since gold
0
1
2
3
4
5
6
6h 12h
Gen
e ex
pre
ssio
n(2
-ΔΔ
Ct )
MCF7 + AuNP@PEG
MCF7+AuNP@PEG@anti-Rab27a
0
1
2
3
4
5
6
6h 12h
Gen
e ex
pre
ssio
n(2
-ΔΔ
Ct )
MDA+AuNP@PEG
MDA+AuNP@PEG@anti-Rab27a
B A
Figure 3.3: RAB27A gene expression evaluation in MCF7 cells (A) and MDA cells (B) incubated with AuNP@PEG
and 20 nM of AuNP@PEG@antisese-Rab27a for 6 h and 12 h. Gene expression variation is calculated through 2-ΔΔCt
, after normalization with RNA18S gene and control cells (exosome-depleted medium). The data are represented as
means ± SEM of at least three independent experiments.

39
nanoparticles have already been demonstrated to have reduced toxicity in biological environment
when functionalized with PEG molecules and antisense oligonucleotides (Conde et al., 2012b).
With the view to verify if the observed decrease in RAB27A gene expression when cells are
incubated with AuNP@PEG@antisense-Rab27a corresponds to a decreased amount of exosomes
released by MCF7 and MDA cells, this parameter was further evaluated.
3.3 EXOSOME QUANTIFICATION
3.3.1 COMPARISON BETWEEN ISOLATION METHODS – ULTRACENTRIFUGATION
AND EXOQUICK™ SOLUTION
Until now, few attempts have been performed on the exosome isolation optimization from
human plasma once it is a more challenging type of sample as it has high levels of clotting factors and
additional proteins that might difficult the exosome isolation (Muller et al., 2014). In the present work,
exosomes were isolated from MCF7 cells’ medium by two different methods, ultracentrifugation and
ExoQuick™ Solution, described in section 2.4. Traditional processes for exosome isolation from cell
culture medium are tedious and difficult, typically based on ultracentrifugation processes that are
usually combined with sucrose gradients since exosomes have floating densities different than other
vesicles (Théry et al., 2006). Within the last few years several reagents have been commercially
available for exosome isolation and purification (“Exosome Research,” 2015). ExoQuick™ Solution is
a polymer-based method that gently precipitates the exosomes by forming a network that captures
vesicles with sizes between 60 and 150 nm, providing a rapid and efficient method for exosome
isolation (“Exosome Research,” 2015).
0
20
40
60
80
100
120
AuNP@PEG AuNP@PEG@anti-Rab27a
Ce
ll vi
abili
ty (
% o
f co
ntr
ol)
MCF7
MDA
0
20
40
60
80
100
120
AuNP@PEG AuNP@PEG@anti-Rab27a
Ce
ll vi
abili
ty (
% o
f C
on
tro
l)
MCF7
MDA
Figure 3.4: Cell viability in MCF7 and MDA cells after incubation with AuNP@PEG and AuNP@PEG@antisense-
Rab27a with exposure times of 6 h (A) and 12 h (B). Cell viability values were normalized in relation to the control group without exosomes. The data are represented as means ± SEM of at least two independent experiments.
A B
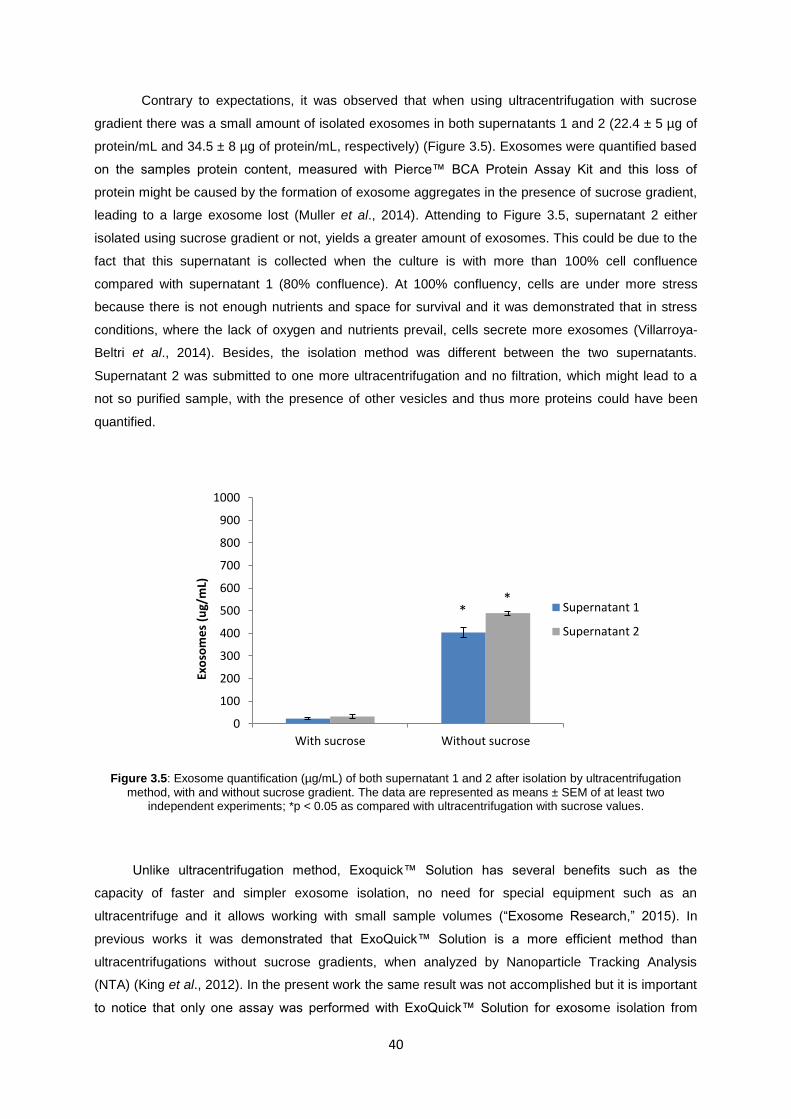
40
Contrary to expectations, it was observed that when using ultracentrifugation with sucrose
gradient there was a small amount of isolated exosomes in both supernatants 1 and 2 (22.4 ± 5 µg of
protein/mL and 34.5 ± 8 µg of protein/mL, respectively) (Figure 3.5). Exosomes were quantified based
on the samples protein content, measured with Pierce™ BCA Protein Assay Kit and this loss of
protein might be caused by the formation of exosome aggregates in the presence of sucrose gradient,
leading to a large exosome lost (Muller et al., 2014). Attending to Figure 3.5, supernatant 2 either
isolated using sucrose gradient or not, yields a greater amount of exosomes. This could be due to the
fact that this supernatant is collected when the culture is with more than 100% cell confluence
compared with supernatant 1 (80% confluence). At 100% confluency, cells are under more stress
because there is not enough nutrients and space for survival and it was demonstrated that in stress
conditions, where the lack of oxygen and nutrients prevail, cells secrete more exosomes (Villarroya-
Beltri et al., 2014). Besides, the isolation method was different between the two supernatants.
Supernatant 2 was submitted to one more ultracentrifugation and no filtration, which might lead to a
not so purified sample, with the presence of other vesicles and thus more proteins could have been
quantified.
Figure 3.5: Exosome quantification (µg/mL) of both supernatant 1 and 2 after isolation by ultracentrifugation
method, with and without sucrose gradient. The data are represented as means ± SEM of at least two independent experiments; *p < 0.05 as compared with ultracentrifugation with sucrose values.
Unlike ultracentrifugation method, Exoquick™ Solution has several benefits such as the
capacity of faster and simpler exosome isolation, no need for special equipment such as an
ultracentrifuge and it allows working with small sample volumes (“Exosome Research,” 2015). In
previous works it was demonstrated that ExoQuick™ Solution is a more efficient method than
ultracentrifugations without sucrose gradients, when analyzed by Nanoparticle Tracking Analysis
(NTA) (King et al., 2012). In the present work the same result was not accomplished but it is important
to notice that only one assay was performed with ExoQuick™ Solution for exosome isolation from
0
100
200
300
400
500
600
700
800
900
1000
With sucrose Without sucrose
Exo
som
es
(ug/
mL)
Supernatant 1
Supernatant 2
* *
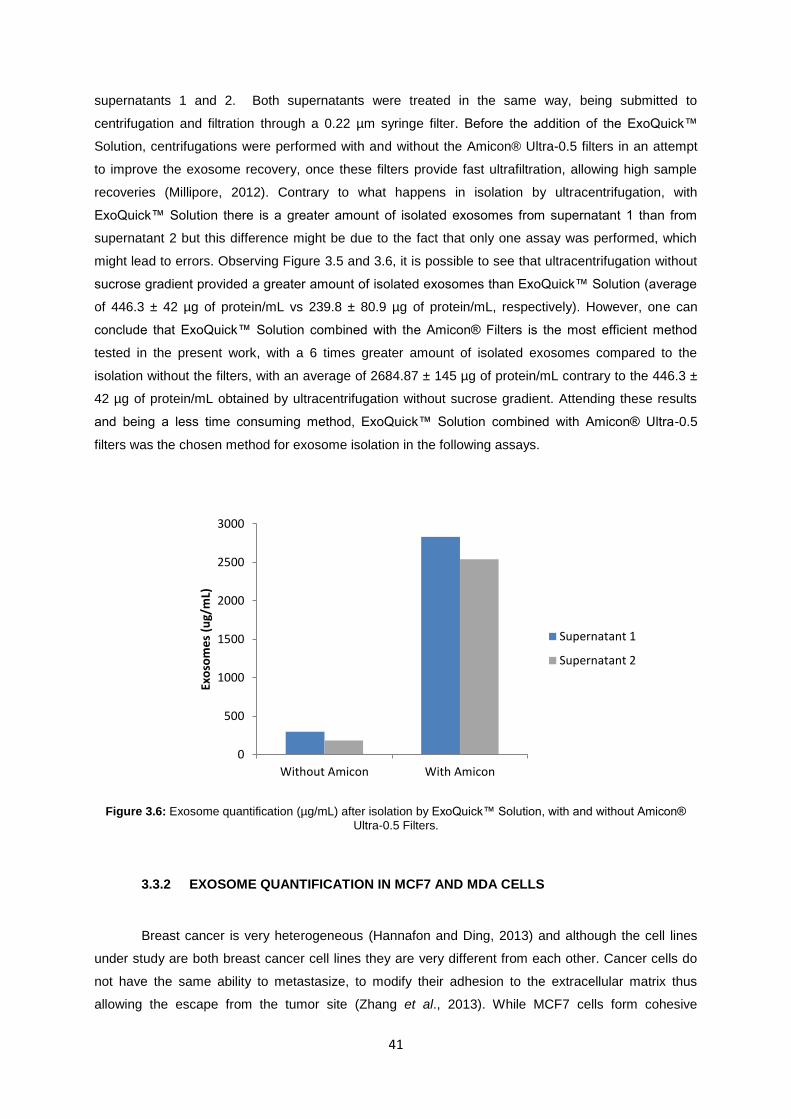
41
supernatants 1 and 2. Both supernatants were treated in the same way, being submitted to
centrifugation and filtration through a 0.22 µm syringe filter. Before the addition of the ExoQuick™
Solution, centrifugations were performed with and without the Amicon® Ultra-0.5 filters in an attempt
to improve the exosome recovery, once these filters provide fast ultrafiltration, allowing high sample
recoveries (Millipore, 2012). Contrary to what happens in isolation by ultracentrifugation, with
ExoQuick™ Solution there is a greater amount of isolated exosomes from supernatant 1 than from
supernatant 2 but this difference might be due to the fact that only one assay was performed, which
might lead to errors. Observing Figure 3.5 and 3.6, it is possible to see that ultracentrifugation without
sucrose gradient provided a greater amount of isolated exosomes than ExoQuick™ Solution (average
of 446.3 ± 42 µg of protein/mL vs 239.8 ± 80.9 µg of protein/mL, respectively). However, one can
conclude that ExoQuick™ Solution combined with the Amicon® Filters is the most efficient method
tested in the present work, with a 6 times greater amount of isolated exosomes compared to the
isolation without the filters, with an average of 2684.87 ± 145 µg of protein/mL contrary to the 446.3 ±
42 µg of protein/mL obtained by ultracentrifugation without sucrose gradient. Attending these results
and being a less time consuming method, ExoQuick™ Solution combined with Amicon® Ultra-0.5
filters was the chosen method for exosome isolation in the following assays.
Figure 3.6: Exosome quantification (µg/mL) after isolation by ExoQuick™ Solution, with and without Amicon®
Ultra-0.5 Filters.
3.3.2 EXOSOME QUANTIFICATION IN MCF7 AND MDA CELLS
Breast cancer is very heterogeneous (Hannafon and Ding, 2013) and although the cell lines
under study are both breast cancer cell lines they are very different from each other. Cancer cells do
not have the same ability to metastasize, to modify their adhesion to the extracellular matrix thus
allowing the escape from the tumor site (Zhang et al., 2013). While MCF7 cells form cohesive
0
500
1000
1500
2000
2500
3000
Without Amicon With Amicon
Exo
som
es
(ug/
mL)
Supernatant 1
Supernatant 2
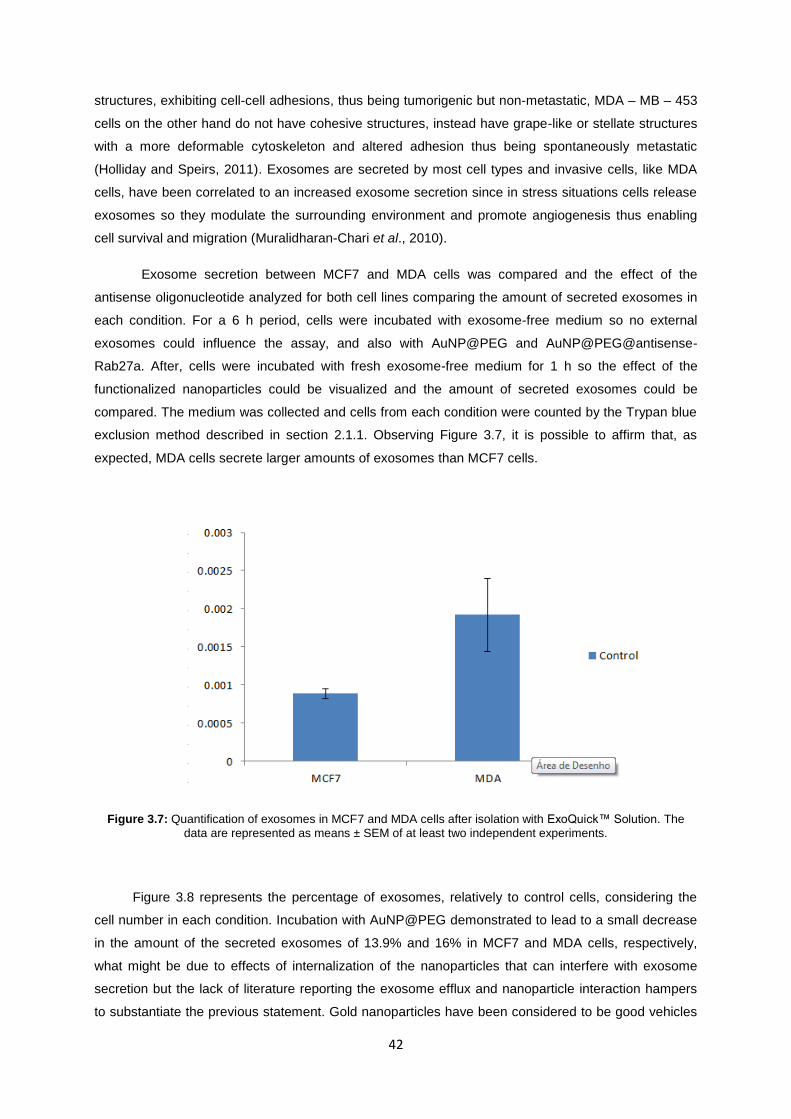
42
structures, exhibiting cell-cell adhesions, thus being tumorigenic but non-metastatic, MDA – MB – 453
cells on the other hand do not have cohesive structures, instead have grape-like or stellate structures
with a more deformable cytoskeleton and altered adhesion thus being spontaneously metastatic
(Holliday and Speirs, 2011). Exosomes are secreted by most cell types and invasive cells, like MDA
cells, have been correlated to an increased exosome secretion since in stress situations cells release
exosomes so they modulate the surrounding environment and promote angiogenesis thus enabling
cell survival and migration (Muralidharan-Chari et al., 2010).
Exosome secretion between MCF7 and MDA cells was compared and the effect of the
antisense oligonucleotide analyzed for both cell lines comparing the amount of secreted exosomes in
each condition. For a 6 h period, cells were incubated with exosome-free medium so no external
exosomes could influence the assay, and also with AuNP@PEG and AuNP@PEG@antisense-
Rab27a. After, cells were incubated with fresh exosome-free medium for 1 h so the effect of the
functionalized nanoparticles could be visualized and the amount of secreted exosomes could be
compared. The medium was collected and cells from each condition were counted by the Trypan blue
exclusion method described in section 2.1.1. Observing Figure 3.7, it is possible to affirm that, as
expected, MDA cells secrete larger amounts of exosomes than MCF7 cells.
Figure 3.7: Quantification of exosomes in MCF7 and MDA cells after isolation with ExoQuick™ Solution. The
data are represented as means ± SEM of at least two independent experiments.
Figure 3.8 represents the percentage of exosomes, relatively to control cells, considering the
cell number in each condition. Incubation with AuNP@PEG demonstrated to lead to a small decrease
in the amount of the secreted exosomes of 13.9% and 16% in MCF7 and MDA cells, respectively,
what might be due to effects of internalization of the nanoparticles that can interfere with exosome
secretion but the lack of literature reporting the exosome efflux and nanoparticle interaction hampers
to substantiate the previous statement. Gold nanoparticles have been considered to be good vehicles
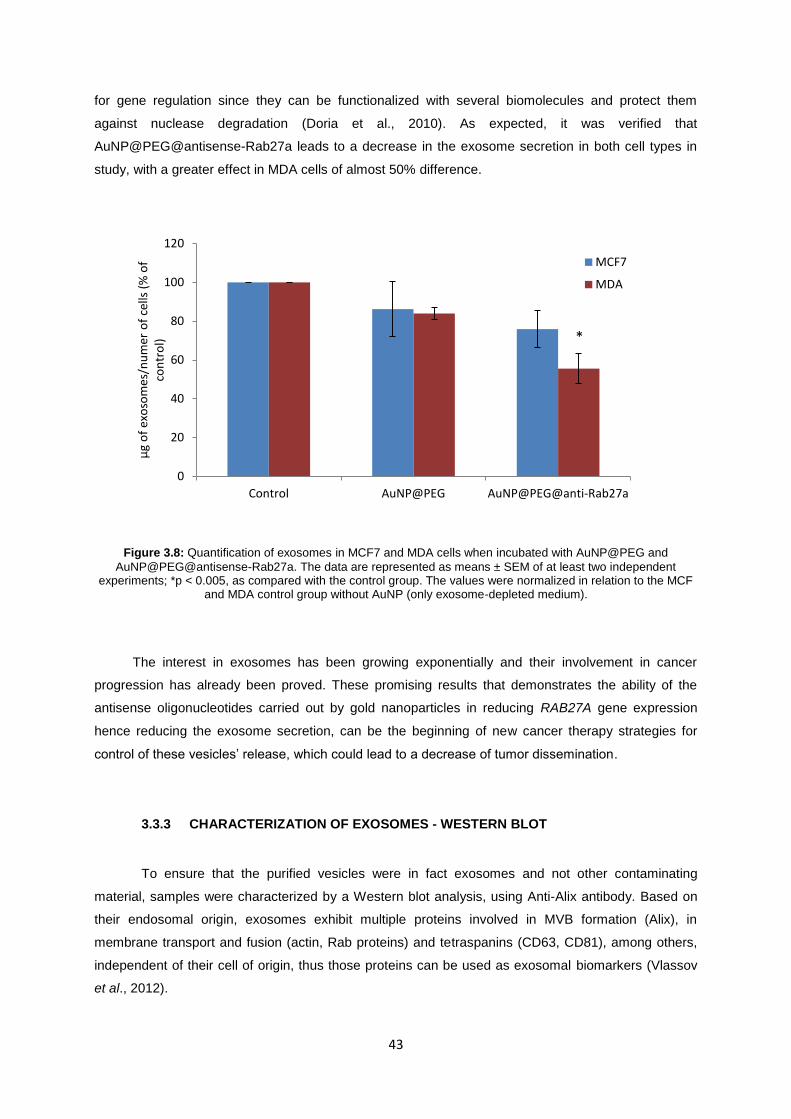
43
for gene regulation since they can be functionalized with several biomolecules and protect them
against nuclease degradation (Doria et al., 2010). As expected, it was verified that
AuNP@PEG@antisense-Rab27a leads to a decrease in the exosome secretion in both cell types in
study, with a greater effect in MDA cells of almost 50% difference.
Figure 3.8: Quantification of exosomes in MCF7 and MDA cells when incubated with AuNP@PEG and
AuNP@PEG@antisense-Rab27a. The data are represented as means ± SEM of at least two independent experiments; *p < 0.005, as compared with the control group. The values were normalized in relation to the MCF
and MDA control group without AuNP (only exosome-depleted medium).
The interest in exosomes has been growing exponentially and their involvement in cancer
progression has already been proved. These promising results that demonstrates the ability of the
antisense oligonucleotides carried out by gold nanoparticles in reducing RAB27A gene expression
hence reducing the exosome secretion, can be the beginning of new cancer therapy strategies for
control of these vesicles’ release, which could lead to a decrease of tumor dissemination.
3.3.3 CHARACTERIZATION OF EXOSOMES - WESTERN BLOT
To ensure that the purified vesicles were in fact exosomes and not other contaminating
material, samples were characterized by a Western blot analysis, using Anti-Alix antibody. Based on
their endosomal origin, exosomes exhibit multiple proteins involved in MVB formation (Alix), in
membrane transport and fusion (actin, Rab proteins) and tetraspanins (CD63, CD81), among others,
independent of their cell of origin, thus those proteins can be used as exosomal biomarkers (Vlassov
et al., 2012).
0
20
40
60
80
100
120
Control AuNP@PEG AuNP@PEG@anti-Rab27a
μg
of
exo
som
es/n
um
er o
f ce
lls (
% o
f co
ntr
ol)
MCF7
MDA
*
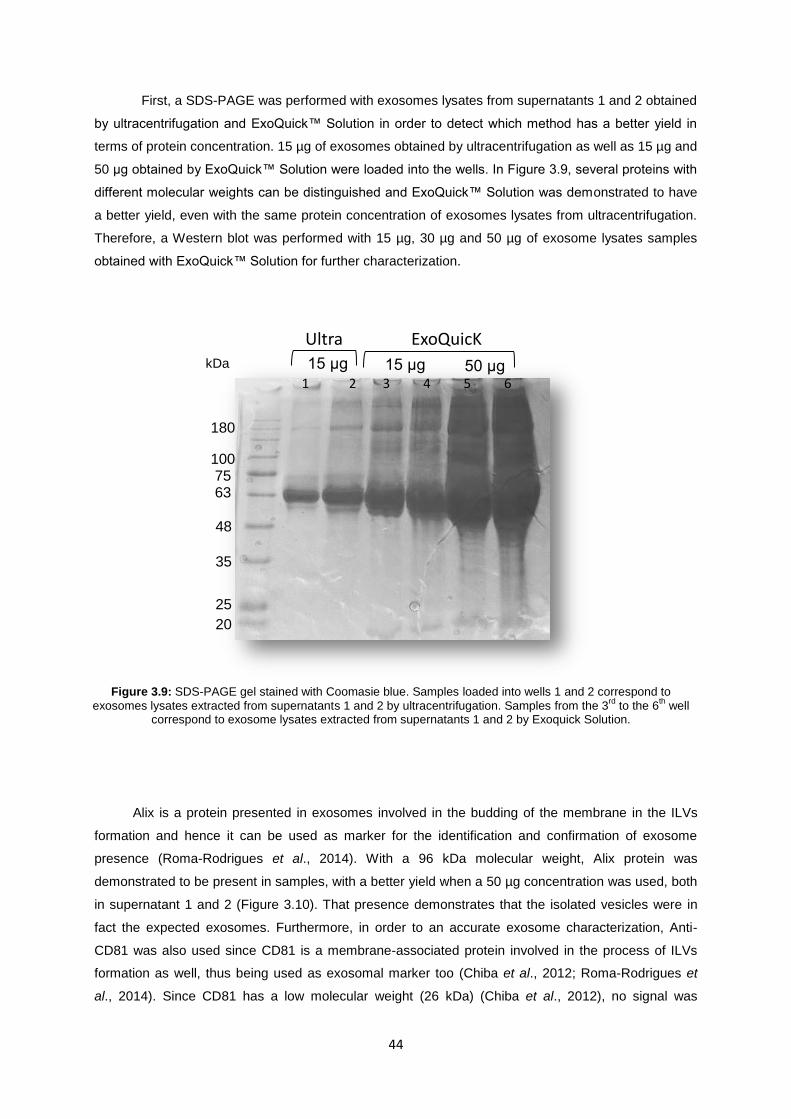
44
First, a SDS-PAGE was performed with exosomes lysates from supernatants 1 and 2 obtained
by ultracentrifugation and ExoQuick™ Solution in order to detect which method has a better yield in
terms of protein concentration. 15 µg of exosomes obtained by ultracentrifugation as well as 15 µg and
50 µg obtained by ExoQuick™ Solution were loaded into the wells. In Figure 3.9, several proteins with
different molecular weights can be distinguished and ExoQuick™ Solution was demonstrated to have
a better yield, even with the same protein concentration of exosomes lysates from ultracentrifugation.
Therefore, a Western blot was performed with 15 µg, 30 µg and 50 µg of exosome lysates samples
obtained with ExoQuick™ Solution for further characterization.
Alix is a protein presented in exosomes involved in the budding of the membrane in the ILVs
formation and hence it can be used as marker for the identification and confirmation of exosome
presence (Roma-Rodrigues et al., 2014). With a 96 kDa molecular weight, Alix protein was
demonstrated to be present in samples, with a better yield when a 50 µg concentration was used, both
in supernatant 1 and 2 (Figure 3.10). That presence demonstrates that the isolated vesicles were in
fact the expected exosomes. Furthermore, in order to an accurate exosome characterization, Anti-
CD81 was also used since CD81 is a membrane-associated protein involved in the process of ILVs
formation as well, thus being used as exosomal marker too (Chiba et al., 2012; Roma-Rodrigues et
al., 2014). Since CD81 has a low molecular weight (26 kDa) (Chiba et al., 2012), no signal was
kDa
180
100
75
63
48
35
25
20
15 µg 15 µg 50 µg
Ultra ExoQuicK
Figure 3.9: SDS-PAGE gel stained with Coomasie blue. Samples loaded into wells 1 and 2 correspond to
exosomes lysates extracted from supernatants 1 and 2 by ultracentrifugation. Samples from the 3rd
to the 6th well
correspond to exosome lysates extracted from supernatants 1 and 2 by Exoquick Solution.
1 2 3 4 5 6
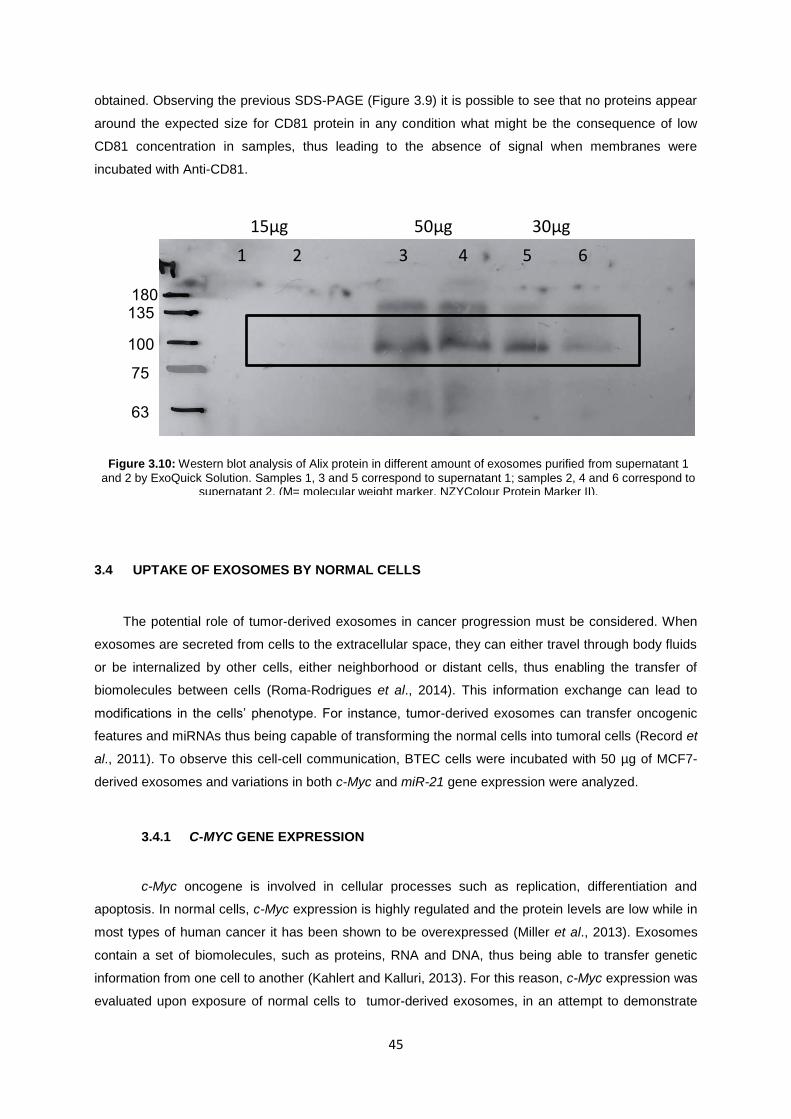
45
obtained. Observing the previous SDS-PAGE (Figure 3.9) it is possible to see that no proteins appear
around the expected size for CD81 protein in any condition what might be the consequence of low
CD81 concentration in samples, thus leading to the absence of signal when membranes were
incubated with Anti-CD81.
3.4 UPTAKE OF EXOSOMES BY NORMAL CELLS
The potential role of tumor-derived exosomes in cancer progression must be considered. When
exosomes are secreted from cells to the extracellular space, they can either travel through body fluids
or be internalized by other cells, either neighborhood or distant cells, thus enabling the transfer of
biomolecules between cells (Roma-Rodrigues et al., 2014). This information exchange can lead to
modifications in the cells’ phenotype. For instance, tumor-derived exosomes can transfer oncogenic
features and miRNAs thus being capable of transforming the normal cells into tumoral cells (Record et
al., 2011). To observe this cell-cell communication, BTEC cells were incubated with 50 µg of MCF7-
derived exosomes and variations in both c-Myc and miR-21 gene expression were analyzed.
3.4.1 C-MYC GENE EXPRESSION
c-Myc oncogene is involved in cellular processes such as replication, differentiation and
apoptosis. In normal cells, c-Myc expression is highly regulated and the protein levels are low while in
most types of human cancer it has been shown to be overexpressed (Miller et al., 2013). Exosomes
contain a set of biomolecules, such as proteins, RNA and DNA, thus being able to transfer genetic
information from one cell to another (Kahlert and Kalluri, 2013). For this reason, c-Myc expression was
evaluated upon exposure of normal cells to tumor-derived exosomes, in an attempt to demonstrate
Figure 3.10: Western blot analysis of Alix protein in different amount of exosomes purified from supernatant 1
and 2 by ExoQuick Solution. Samples 1, 3 and 5 correspond to supernatant 1; samples 2, 4 and 6 correspond to supernatant 2. (M= molecular weight marker, NZYColour Protein Marker II).
180 135
100
75
63
15µg 50µg 30µg
1 2 3 4 5 6
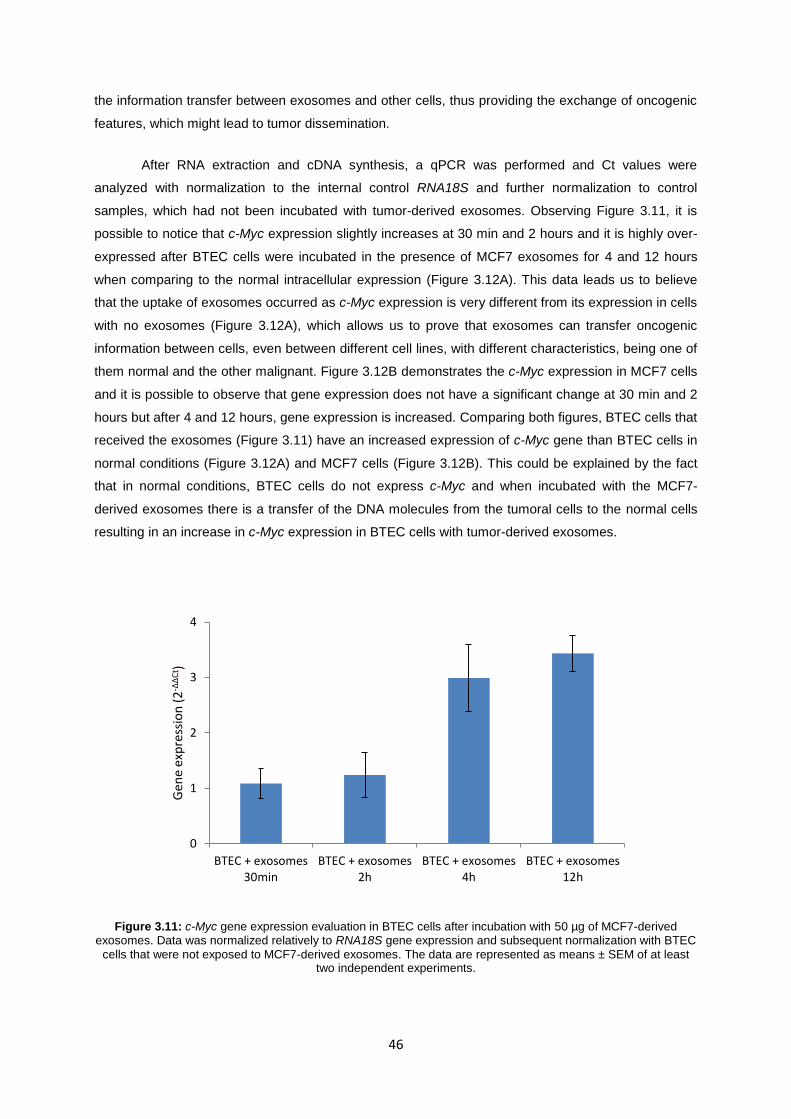
46
the information transfer between exosomes and other cells, thus providing the exchange of oncogenic
features, which might lead to tumor dissemination.
After RNA extraction and cDNA synthesis, a qPCR was performed and Ct values were
analyzed with normalization to the internal control RNA18S and further normalization to control
samples, which had not been incubated with tumor-derived exosomes. Observing Figure 3.11, it is
possible to notice that c-Myc expression slightly increases at 30 min and 2 hours and it is highly over-
expressed after BTEC cells were incubated in the presence of MCF7 exosomes for 4 and 12 hours
when comparing to the normal intracellular expression (Figure 3.12A). This data leads us to believe
that the uptake of exosomes occurred as c-Myc expression is very different from its expression in cells
with no exosomes (Figure 3.12A), which allows us to prove that exosomes can transfer oncogenic
information between cells, even between different cell lines, with different characteristics, being one of
them normal and the other malignant. Figure 3.12B demonstrates the c-Myc expression in MCF7 cells
and it is possible to observe that gene expression does not have a significant change at 30 min and 2
hours but after 4 and 12 hours, gene expression is increased. Comparing both figures, BTEC cells that
received the exosomes (Figure 3.11) have an increased expression of c-Myc gene than BTEC cells in
normal conditions (Figure 3.12A) and MCF7 cells (Figure 3.12B). This could be explained by the fact
that in normal conditions, BTEC cells do not express c-Myc and when incubated with the MCF7-
derived exosomes there is a transfer of the DNA molecules from the tumoral cells to the normal cells
resulting in an increase in c-Myc expression in BTEC cells with tumor-derived exosomes.
Figure 3.11: c-Myc gene expression evaluation in BTEC cells after incubation with 50 µg of MCF7-derived exosomes. Data was normalized relatively to RNA18S gene expression and subsequent normalization with BTEC
cells that were not exposed to MCF7-derived exosomes. The data are represented as means ± SEM of at least two independent experiments.
0
1
2
3
4
BTEC + exosomes30min
BTEC + exosomes2h
BTEC + exosomes4h
BTEC + exosomes12h
Gen
e ex
pre
ssio
n (
2-Δ
ΔC
t )
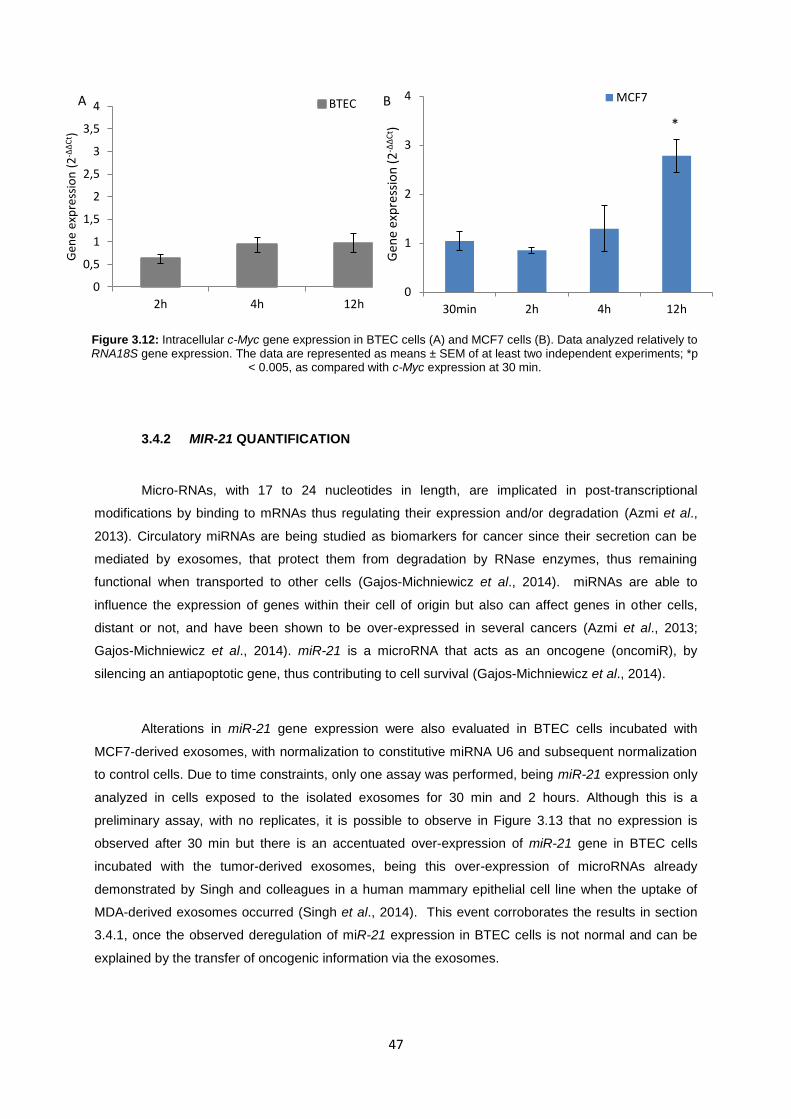
47
3.4.2 MIR-21 QUANTIFICATION
Micro-RNAs, with 17 to 24 nucleotides in length, are implicated in post-transcriptional
modifications by binding to mRNAs thus regulating their expression and/or degradation (Azmi et al.,
2013). Circulatory miRNAs are being studied as biomarkers for cancer since their secretion can be
mediated by exosomes, that protect them from degradation by RNase enzymes, thus remaining
functional when transported to other cells (Gajos-Michniewicz et al., 2014). miRNAs are able to
influence the expression of genes within their cell of origin but also can affect genes in other cells,
distant or not, and have been shown to be over-expressed in several cancers (Azmi et al., 2013;
Gajos-Michniewicz et al., 2014). miR-21 is a microRNA that acts as an oncogene (oncomiR), by
silencing an antiapoptotic gene, thus contributing to cell survival (Gajos-Michniewicz et al., 2014).
Alterations in miR-21 gene expression were also evaluated in BTEC cells incubated with
MCF7-derived exosomes, with normalization to constitutive miRNA U6 and subsequent normalization
to control cells. Due to time constraints, only one assay was performed, being miR-21 expression only
analyzed in cells exposed to the isolated exosomes for 30 min and 2 hours. Although this is a
preliminary assay, with no replicates, it is possible to observe in Figure 3.13 that no expression is
observed after 30 min but there is an accentuated over-expression of miR-21 gene in BTEC cells
incubated with the tumor-derived exosomes, being this over-expression of microRNAs already
demonstrated by Singh and colleagues in a human mammary epithelial cell line when the uptake of
MDA-derived exosomes occurred (Singh et al., 2014). This event corroborates the results in section
3.4.1, once the observed deregulation of miR-21 expression in BTEC cells is not normal and can be
explained by the transfer of oncogenic information via the exosomes.
0
0,5
1
1,5
2
2,5
3
3,5
4
2h 4h 12h
Gen
e ex
pre
ssio
n (
2-Δ
ΔC
t )
BTEC
0
1
2
3
4
30min 2h 4h 12h
Gen
e ex
pre
ssio
n (
2-Δ
ΔC
t )
MCF7
Figure 3.12: Intracellular c-Myc gene expression in BTEC cells (A) and MCF7 cells (B). Data analyzed relatively to RNA18S gene expression. The data are represented as means ± SEM of at least two independent experiments; *p
< 0.005, as compared with c-Myc expression at 30 min.
A B
*
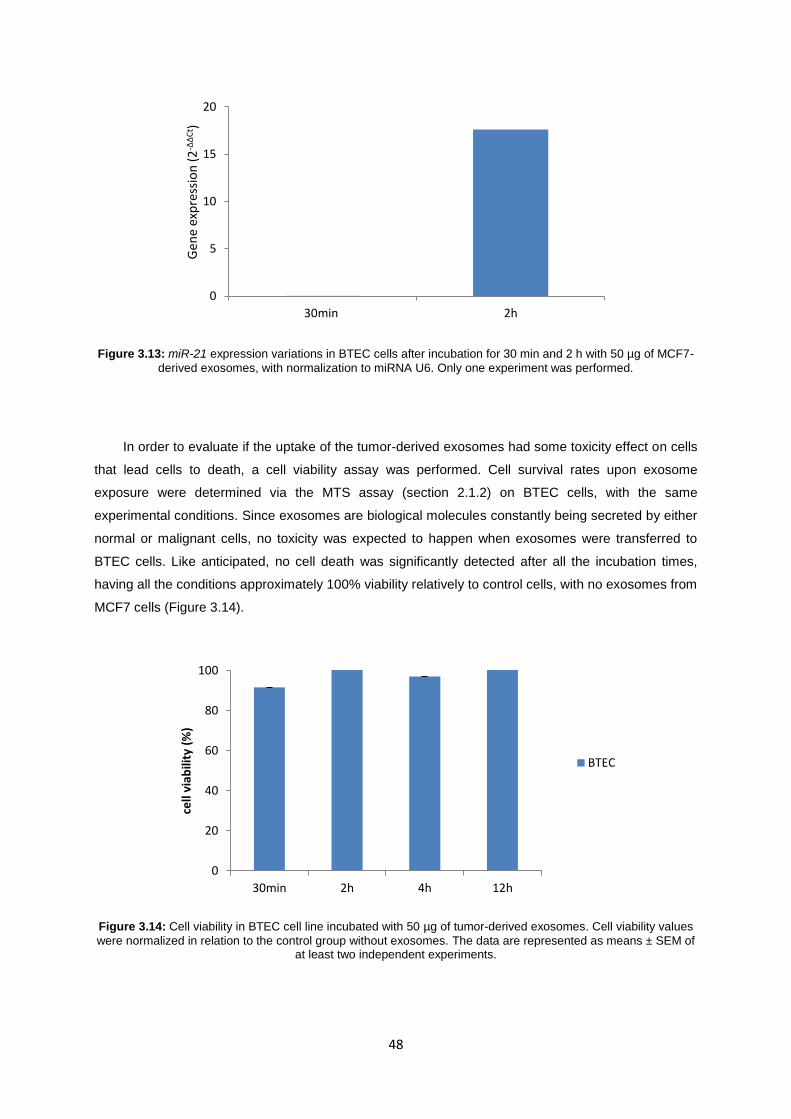
48
Figure 3.13: miR-21 expression variations in BTEC cells after incubation for 30 min and 2 h with 50 µg of MCF7-
derived exosomes, with normalization to miRNA U6. Only one experiment was performed.
In order to evaluate if the uptake of the tumor-derived exosomes had some toxicity effect on cells
that lead cells to death, a cell viability assay was performed. Cell survival rates upon exosome
exposure were determined via the MTS assay (section 2.1.2) on BTEC cells, with the same
experimental conditions. Since exosomes are biological molecules constantly being secreted by either
normal or malignant cells, no toxicity was expected to happen when exosomes were transferred to
BTEC cells. Like anticipated, no cell death was significantly detected after all the incubation times,
having all the conditions approximately 100% viability relatively to control cells, with no exosomes from
MCF7 cells (Figure 3.14).
Figure 3.14: Cell viability in BTEC cell line incubated with 50 µg of tumor-derived exosomes. Cell viability values
were normalized in relation to the control group without exosomes. The data are represented as means ± SEM of at least two independent experiments.
0
5
10
15
20
30min 2h
Gen
e ex
pre
ssio
n (
2-Δ
ΔC
t )
0
20
40
60
80
100
30min 2h 4h 12h
cell
viab
ility
(%
)
BTEC
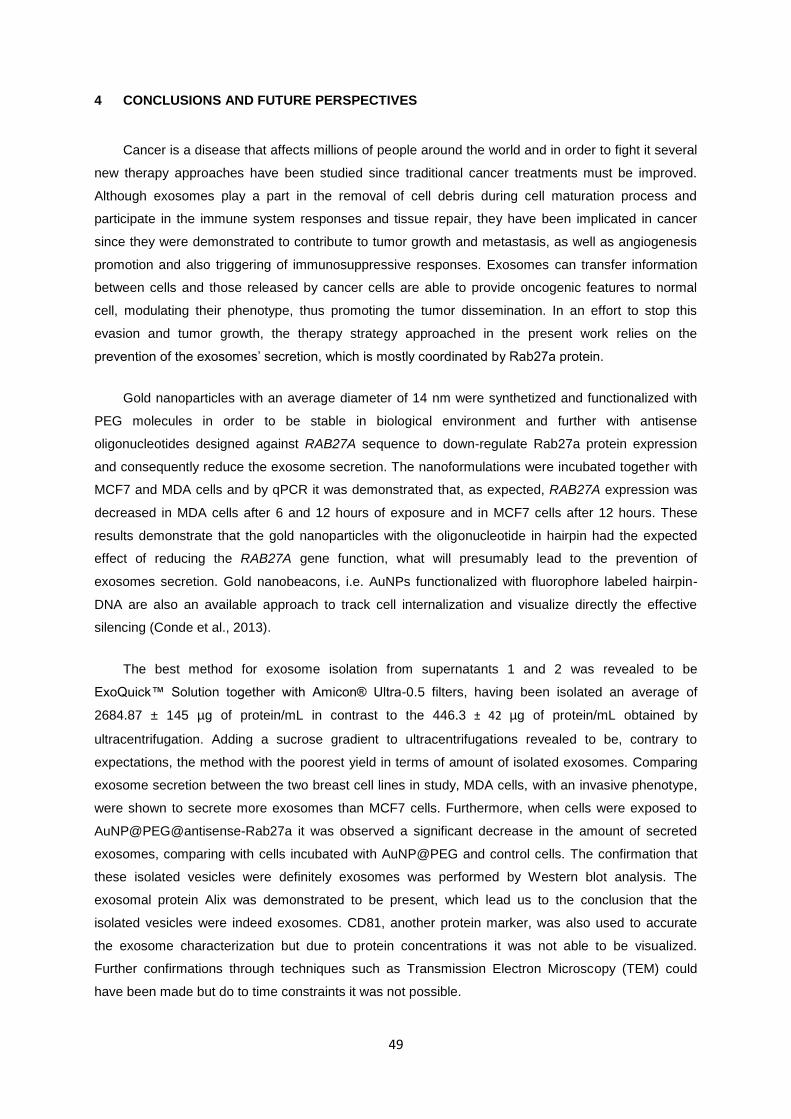
49
4 CONCLUSIONS AND FUTURE PERSPECTIVES
Cancer is a disease that affects millions of people around the world and in order to fight it several
new therapy approaches have been studied since traditional cancer treatments must be improved.
Although exosomes play a part in the removal of cell debris during cell maturation process and
participate in the immune system responses and tissue repair, they have been implicated in cancer
since they were demonstrated to contribute to tumor growth and metastasis, as well as angiogenesis
promotion and also triggering of immunosuppressive responses. Exosomes can transfer information
between cells and those released by cancer cells are able to provide oncogenic features to normal
cell, modulating their phenotype, thus promoting the tumor dissemination. In an effort to stop this
evasion and tumor growth, the therapy strategy approached in the present work relies on the
prevention of the exosomes’ secretion, which is mostly coordinated by Rab27a protein.
Gold nanoparticles with an average diameter of 14 nm were synthetized and functionalized with
PEG molecules in order to be stable in biological environment and further with antisense
oligonucleotides designed against RAB27A sequence to down-regulate Rab27a protein expression
and consequently reduce the exosome secretion. The nanoformulations were incubated together with
MCF7 and MDA cells and by qPCR it was demonstrated that, as expected, RAB27A expression was
decreased in MDA cells after 6 and 12 hours of exposure and in MCF7 cells after 12 hours. These
results demonstrate that the gold nanoparticles with the oligonucleotide in hairpin had the expected
effect of reducing the RAB27A gene function, what will presumably lead to the prevention of
exosomes secretion. Gold nanobeacons, i.e. AuNPs functionalized with fluorophore labeled hairpin-
DNA are also an available approach to track cell internalization and visualize directly the effective
silencing (Conde et al., 2013).
The best method for exosome isolation from supernatants 1 and 2 was revealed to be
ExoQuick™ Solution together with Amicon® Ultra-0.5 filters, having been isolated an average of
2684.87 ± 145 µg of protein/mL in contrast to the 446.3 ± 42 µg of protein/mL obtained by
ultracentrifugation. Adding a sucrose gradient to ultracentrifugations revealed to be, contrary to
expectations, the method with the poorest yield in terms of amount of isolated exosomes. Comparing
exosome secretion between the two breast cell lines in study, MDA cells, with an invasive phenotype,
were shown to secrete more exosomes than MCF7 cells. Furthermore, when cells were exposed to
AuNP@PEG@antisense-Rab27a it was observed a significant decrease in the amount of secreted
exosomes, comparing with cells incubated with AuNP@PEG and control cells. The confirmation that
these isolated vesicles were definitely exosomes was performed by Western blot analysis. The
exosomal protein Alix was demonstrated to be present, which lead us to the conclusion that the
isolated vesicles were indeed exosomes. CD81, another protein marker, was also used to accurate
the exosome characterization but due to protein concentrations it was not able to be visualized.
Further confirmations through techniques such as Transmission Electron Microscopy (TEM) could
have been made but do to time constraints it was not possible.
50
The uptake of MCF7-derived exosomes by BTEC cells was confirmed by the analysis of c-Myc
and miR-21 expression by qPCR. Once both genes were over-expressed in BTEC cells that received
the tumor-derived exosomes, one can conclude that exosomes are able to pass molecules from one
cell to another within 12 hours. To learn about the exosome uptake is also very usual to label
exosomes with small molecule fluorophores such as PKH67 and PKH26 allowing the monitorization of
the exosome uptake by recipient cells (Suetsugu et al., 2013).
In the present work no more studies were able to be finished due to time constraints once it was
necessary to optimize the exosome isolation for the following assays and also the analysis by qPCR
with Rab27a primers. Nanomedicine offers tools to diagnose and treat cancer, with nanoparticles
being used for gene silencing therapies and drug delivery, as it was demonstrated to have great
efficacy and (almost) no toxicity. The study of exosomes in cancer research is a relatively new area
and, despite the advances, much needs to be learnt about their involvement in both positive and
negative aspects of health. Being natural transporters, using exosomes for targeted delivery can be
beneficial in future works, as well as an accurate characterization of exosomes and a better
comprehension of exosome uptake and information exchange.
51
5 REFERENCES
Akers, J.C., Gonda, D., Kim, R., Carter, B.S., Chen, C.C. 2013. Biogenesis of extracellular vesicles
(EV): Exosomes, microvesicles, retrovirus-like vesicles, and apoptotic bodies. J. Neurooncol.
113: 1–11.
Alexis, F., Pridgen, E.M., Langer, R., Farokhzad, O.C. 2010. Nanoparticle Technologies for Cancer
Therapy, Drug Delivey.
Alkilany, A.M., Murphy, C.J. 2010. Toxicity and cellular uptake of gold nanoparticles: What we have
learned so far? J. Nanoparticle Res. 12: 2313–2333.
American Cancer Society 2014. What are the key statistics about breast cancer? Cancer.org. URL
http://www.cancer.org/cancer/breastcancer/detailedguide/breast-cancer-key-statistics (accessed
8.10.15).
Anand, P., Kunnumakara, A.B., Sundaram, C., Harikumar, K.B., Tharakan, S.T., Lai, O.S., Sung, B.,
Aggarwal, B.B. 2008. Cancer is a preventable disease that requires major lifestyle changes.
Pharm. Res. 25: 2097–2116.
ATCC Cell Lines 2014. URL www.lgcstandards-
atcc.org/Products/Cells_and_Microorganisms/Cell_Lines.aspx (accessed 1.8.15).
Azmi, A.S., Bao, B., Sarkar, F.H. 2013. Exosomes in cancer development, metastasis, and drug
resistance: A comprehensive review. Cancer Metastasis Rev. 32: 623–642.
Bang, C., Thum, T. 2012. Exosomes: New players in cell-cell communication. Int. J. Biochem. Cell
Biol. 44: 2060–2064.
Baptista, P., Conde, J., Rosa, J. 2013. Gold-Nanobeacons as a theranostic system for the detection
and inhibition of specific genes. Protoc. Exch. 1–35.
Baptista, P.V. 2012. Could gold nanoprobes be an important tool in cancer diagnostics? Expert Rev.
Mol. Diagn. 12: 541–3.
Bellingham, S.A., Guo, B.B., Coleman, B.M., Hill, A.F. 2012. Exosomes: Vehicles for the transfer of
toxic proteins associated with neurodegenerative diseases? Front. Physiol. 3:124.
Bergers, G., Benjamin, L.E. 2003. Tumorigenesis and the angiogenic switch. Nat. Rev. Cancer 3:
401–410.
Bertram, J.S. 2001. The molecular biology of cancer. Mol. Aspects Med. 21: 167–223.
Bobrie, A., Krumeich, S., Reyal, F., Recchi, C., Moita, L.F., Seabra, M.C., Ostrowski, M., Théry, C.
2012. Rab27a supports exosome-dependent and -independent mechanisms that modify the
tumor microenvironment and can promote tumor progression. Cancer Res. 72: 4920–4930.
Braicu, C., Tomuleasa, C., Monroig, P., Cucuianu, A., Berindan-Neagoe, I., Calin, G. a 2015.
Exosomes as divine messengers: are they the Hermes of modern molecular oncology? Cell
Death Differ. 22: 34–45.
Cancer Research UK 2015. Cancer Research UK URL http://www.cancerresearchuk.org (accessed
8.10.15).
Chiba, M., Kimura, M., Asari, S. 2012. Exosomes secreted from human colorectal cancer cell lines
contain mRNAs, microRNAs and natural antisense RNAs, that can transfer into the human
hepatoma HepG2 and lung cancer A549 cell lines. Oncol. Rep. 28: 1551–1558.
52
Conde, J., Ambrosone, A., Sanz, V., Hernandez, Y., Marchesano, V., Tian, F., Child, H., Berry, C.C.,
Ibarra, M.R., Baptista, P. V., Tortiglione, C., de la Fuente, J.M. 2012a. Design of multifunctional
gold nanoparticles for in vitro and in vivo gene silencing. ACS Nano 8316–8324.
Conde, J., de la Fuente, J.M., Baptista, P. V 2010. In vitro transcription and translation inhibition via
DNA functionalized gold nanoparticles. Nanotechnology 21: 505101.
Conde, J., Doria, G., Baptista, P. 2012b. Noble metal nanoparticles applications in cancer. J. Drug
Deliv. 2012: 751075.
Conde, J., Larguinho, M., Cordeiro, A., Raposo, L.R., Costa, P.M., Santos, S., Diniz, M.S., Fernandes,
A.R., Baptista, P. V 2014. Gold-nanobeacons for gene therapy: evaluation of genotoxicity, cell
toxicity and proteome profiling analysis. Nanotoxicology 8: 521–32.
Conde, J., Rosa, J., de la Fuente, J.M., Baptista, P. V 2013. Gold-nanobeacons for simultaneous gene
specific silencing and intracellular tracking of the silencing events. Biomaterials 34: 2516–23.
Crawford, S. 2013. Is it time for a new paradigm for systemic cancer treatment? Lessons from a
century of cancer chemotherapy. Front. Pharmacol. 4 1–18.
Cross, D., Burmester, J.K. 2006. Gene therapy for cancer treatment: past, present and future. Clin.
Med. Res. 4: 218–227.
Dawson, M. a., Kouzarides, T. 2012. Cancer epigenetics: From mechanism to therapy. Cell 150: 12–
27.
Denzer, K., Kleijmeer, M.J., Heijnen, H.F., Stoorvogel, W., Geuze, H.J. 2000. Exosome: from internal
vesicle of the multivesicular body to intercellular signaling device. J. Cell Sci. 113: 3365–3374.
Devi, P. 2004. Basics of carcinogenesis. Heal. Adm 16–24.
Doherty, G.J., McMahon, H.T. 2009. Mechanisms of endocytosis. Annu. Rev. Biochem. 78: 857–902.
Doria, G., Baumgartner, B.G., Franco, R., Baptista, P. V 2010. Optimizing Au-nanoprobes for specific
sequence discrimination. Colloids Surf. B. Biointerfaces 77: 122–4.
El Andaloussi, S., Lakhal, S., Mäger, I., Wood, M.J. a 2013. Exosomes for targeted siRNA delivery
across biological barriers. Adv. Drug Deliv. Rev. 65: 391–7.
Esteller, M. 2008. Molecular Origins of Cancer Epigenetics in Cancer. N Engl J Med 358: 1148–59.
ExoCarta 2015. URL http://exocarta.org (accessed 8.18.15).
Exosome Research 2015. . Syst. Biosci.
Fader, C.M., Colombo, M.I. 2009. Autophagy and multivesicular bodies: two closely related partners.
Cell Death Differ. 16: 70–78.
Fichou, Y., Fe, C. 2006. The potential of oligonucleotides for therapeutic applications 24.
Fleige, S., Pfaffl, M.W. 2006. RNA integrity and the effect on the real-time qRT-PCR performance.
Mol. Aspects Med. 27: 126–139.
Fukuda, M. 2013. Rab27 effectors, pleiotropic regulators in secretory pathways. Traffic 14: 949–63.
Gajos-Michniewicz, A., Duechler, M., Czyz, M. 2014. MiRNA in melanoma-derived exosomes. Cancer
Lett. 347: 29–37.
Ganta, S., Devalapally, H., Shahiwala, A., Amiji, M. 2008. A review of stimuli-responsive nanocarriers
for drug and gene delivery 126: 187–204.
53
Geiger, T.R., Peeper, D.S. 2009. Metastasis mechanisms. Biochim. Biophys. Acta - Rev. Cancer
1796: 293–308.
Gerber, D.E. 2008. Targeted therapies: A new generation of cancer treatments. Am. Fam. Physician
77: 311–319.
Global Cancer Society 2008. 1–57.
GLOBOCAN 2012. Int. Agency Researh Cancer, World Heal. Organ. URL
http://globocan.iarc.fr/Default.aspx (accessed 8.9.15).
Grant, B.D., Donaldson, J.G. 2011. Pathways and mechanisms of endocytic recycling. Nat Rev Mol
Cell Biol 10: 597–608.
Grivennikov, S.I., Greten, F.R., Karin, M. 2011. Immunity, Inflammation, and Cancer. Cell 140: 883–
899.
Hanahan, D., Weinberg, R. a. 2011. Hallmarks of cancer: The next generation. Cell 144: 646–674.
Hannafon, B.N., Ding, W.Q. 2013. Intercellular communication by exosome-derived microRNAs in
cancer. Int. J. Mol. Sci. 14: 14240–14269.
Heath, J.R., Davis, M.E. 2008. Nanotechnology and cancer. Annu. Rev. Med. 59: 251–65.
Henderson, M.C., Azorsa, D.O. 2012. The Genomic and Proteomic Content of Cancer Cell-Derived
Exosomes. Front. Oncol. 2: 1–9.
Hendrix, A., de Wever, O. 2013. Rab27 GTPases distribute extracellular nanomaps for invasive
growth and metastasis: Implications for prognosis and treatment. Int. J. Mol. Sci. 14: 9883–9892.
Herceg, Z., Hainaut, P. 2007. Genetic and epigenetic alterations as biomarkers for cancer detection,
diagnosis and prognosis. Mol. Oncol. 1: 26–41.
Holliday, D.L., Speirs, V. 2011. Choosing the right cell line for breast cancer research. Breast Cancer
Res. 13: 215.
Hurley, J.H., Hanson, P.I. 2010. Membrane budding and scission by the ESCRT machinery: it’s all in
the neck. Nat. Rev. Mol. Cell Biol. 11: 556–566.
Ikehata, H., Ono, T. 2011. The mechanisms of UV mutagenesis. J. Radiat. Res. 52: 115–125.
Jain, P.K., El-Sayed, I.H., El-Sayed, M.A. 2007. Au nanoparticles target cancer. Nanotoday.
Johnstone, R.M. 2006. Exosomes biological significance: A concise review. Blood Cells. Mol. Dis. 36:
315–21.
Johnstone, R.M., Adam, M., Hammond, J.R., Orr, L., Turbide, C. 1987. Vesicle formation during
reticulocyte maturation. Association of plasma membrane activities with released vesicles
(exosomes). J. Biol. Chem. 262: 9412–9420.
Kahlert, C., Kalluri, R. 2013. Exosomes in tumor microenvironment influence cancer progression and
metastasis. J. Mol. Med. 91: 431–437.
Katoh, M. 2013. Therapeutics targeting angiogenesis: Genetics and epigenetics, extracellular miRNAs
and signaling networks (Review). Int. J. Mol. Med. 32: 763–767.
Keller, S., Sanderson, M.P., Stoeck, A., Altevogt, P. 2006. Exosomes: From biogenesis and secretion
to biological function. Immunol. Lett. 107: 102–108.
Kharaziha, P., Ceder, S., Li, Q., Panaretakis, T. 2012. Tumor cell-derived exosomes: A message in a
bottle. Biochim. Biophys. Acta - Rev. Cancer 1826: 103–111.
54
King, H.W., Michael, M.Z., Gleadle, J.M. 2012. Hypoxic enhancement of exosome release by breast
cancer cells. BMC Cancer 12: 421.
Koga, K., Matsumoto, K., Akiyoshi, T., Kubo, M., Yamanaka, N., Tasaki, A., Nakashima, H.,
Nakamura, M., Kuroki, S., Tanaka, M., Katano, M. 2005. Purification , Characterization and
Biological Significance of Tumor-derived Exosomes 3708: 3703–3707.
Kucharzewska, P., Belting, M. 2013. Emerging roles of extracellular vesicles in the adaptive response
of tumour cells to microenvironmental stress. J. Extracell. vesicles 2: 1–10.
Lee, C., Meisel, D. 1982. Adsorption and Surface-Enhanced Raman of Dyes on Silver and Gold Sols’
60439: 3391–3395.
Levine, A.J., Puzio-Kuter, A.M. 2010. The control of the metabolic switch in cancers by oncogenes
and tumor suppressor genes. Science 330: 1340–1344.
Lim, J., Yeap, S.P., Che, H.X., Low, S.C. 2013. Characterization of magnetic nanoparticle by dynamic
light scattering. Nanoscale Res. Lett. 8: 1.
Liu, Y., Shipton, M.K., Ryan, J., Kaufman, E.D., Franzen, S., Feldheim, D.L. 2007. Synthesis , Stability
, and Cellular Internalization of Gold Nanoparticles Containing Mixed Peptide - Poly ( ethylene
glycol ) Monolayers 79: 2221–2229.
Livak, K.J., Schmittgen, T.D. 2001. Analysis of relative gene expression data using real-time
quantitative PCR and the 2(-Delta Delta C(T)) Method. Methods 25: 402–408.
Madhani, H.D., Guthrie, C. 1992. A novel base-pairing interaction between U2 and U6 snRNAs
suggests a mechanism for the catalytic activation of the spliceosome. Cell 71: 803–817.
Marleau, A.M., Chen, C.-S., Joyce, J. a, Tullis, R.H. 2012. Exosome removal as a therapeutic adjuvant
in cancer. J. Transl. Med. 10: 134.
Martins, P., Rosa, D., Fernandes, A.R., Baptista, P. V 2014. Nanoparticle Drug Delivery Systems :
Recent Patents and Applications in Nanomedicine. Recent Patents Nanomed. 3.
Mathivanan, S., Ji, H., Simpson, R.J. 2010. Exosomes: Extracellular organelles important in
intercellular communication. J. Proteomics 73: 1907–1920.
Mellman, I. 1996. Endocytosis and molecular sorting. Annu. Rev. Cell Dev. Biol. 12: 575–625.
Mendelsohn, J. 2013. Personalizing oncology: perspectives and prospects. J. Clin. Oncol. 31: 1904–
1911.
Miller, D.M., Thomas, S.D., Islam, A., Muench, D., Sedoris, K. 2013. c-Myc and Cancer Metabolism
18: 5546–5553.
Millipore 2012. Amicon ® Ultra-4 Centrifugal Filter Devices 1–12.
Muller, L., Hong, C.S., Stolz, D.B., Watkins, S.C., Whiteside, T.L. 2014. Isolation of biologically-active
exosomes from human plasma. J. Immunol. Methods.
Muralidharan-Chari, V., Clancy, J.W., Sedgwick, A., D’Souza-Schorey, C. 2010. Microvesicles:
mediators of extracellular communication during cancer progression. J. Cell Sci. 123: 1603–
1611.
Nickels, S., Truong, T., Hein, R., Stevens, K., Buck, K., Behrens, S., Eilber, U., Schmidt, M., 2013.
Evidence of Gene-Environment Interactions between Common Breast Cancer Susceptibility Loci
and Established Environmental Risk Factors. PLoS Genet. 9.
Ostrowski, M., Carmo, N.B., Krumeich, S., Fanget, I., Raposo, G., Savina, A., Moita, C.F., Schauer,
55
K., Hume, A.N., Freitas, R.P., Goud, B., Benaroch, P., Hacohen, N., Fukuda, M., Desnos, C.,
Seabra, M.C., Darchen, F., Amigorena, S., Moita, L.F., Thery, C. 2010. Rab27a and Rab27b
control different steps of the exosome secretion pathway. Nat. Cell Biol. 12: 19–30; sup pp 1–13.
Park, M.-T., Lee, S.-J. 2003. Cell cycle and cancer. J. Biochem. Mol. Biol. 36: 60–65.
Patel, P.C., Giljohann, D. a, Seferos, D.S., Mirkin, C. a 2008. Peptide antisense nanoparticles. Proc.
Natl. Acad. Sci. U. S. A. 105: 17222–17226.
Philip, D. 2008. Synthesis and spectroscopic characterization of gold nanoparticles. Spectrochim.
Acta. A. Mol. Biomol. Spectrosc. 71: 80–5.
Raposo, G., Stoorvogel, W. 2013. Extracellular vesicles: Exosomes, microvesicles, and friends. J. Cell
Biol. 200: 373–383.
Record, M., Carayon, K., Poirot, M., Silvente-Poirot, S. 2014. Exosomes as new vesicular lipid
transporters involved in cell-cell communication and various pathophysiologies. Biochim.
Biophys. Acta - Mol. Cell Biol. Lipids 1841: 108–120.
Record, M., Subra, C., Silvente-Poirot, S., Poirot, M. 2011. Exosomes as intercellular signalosomes
and pharmacological effectors. Biochem. Pharmacol. 81: 1171–1182.
Riches, A., Campbell, E., Borger, E., Powis, S. 2014. Regulation of exosome release from mammary
epithelial and breast cancer cells-A new regulatory pathway. Eur. J. Cancer 50: 1025–1034.
Roma-Rodrigues, C., Fernandes, A.R., Baptista, P.V. 2014. Exosome in tumour microenvironment:
Overview of the crosstalk between normal and cancer cells. Biomed Res. Int. 2014.
Rosa, J., Conde, J., de la Fuente, J.M., Lima, J.C., Baptista, P. V 2012. Gold-nanobeacons for real-
time monitoring of RNA synthesis. Biosens. Bioelectron. 36: 161–7.
Sanvicens, N., Marco, M.P. 2008. Multifunctional nanoparticles--properties and prospects for their use
in human medicine. Trends Biotechnol. 26: 425–33.
Sanz, V., Conde, J., Hernández, Y., Baptista, P. V., Ibarra, M.R., de la Fuente, J.M. 2012. Effect of
PEG biofunctional spacers and TAT peptide on dsRNA loading on gold nanoparticles. J.
Nanoparticle Res. 14: 917.
Schiller, J.T., Lowy, D.R. 2014. Viruses and Human Cancer 193: 1–10.
Silva, J., Fernandes, A.R., Baptista, P. V 2014. Application of Nanotechnology in Drug Delivery 14–17.
Singh, R., Pochampally, R., Watabe, K., Lu, Z., Mo, Y.-Y. 2014. Exosome-mediated transfer of miR-
10b promotes cell invasion in breast cancer. Mol. Cancer 13: 256.
Soekmadji, C., Russell, P.J., Nelson, C.C. 2013. Exosomes in prostate cancer: putting together the
pieces of a puzzle. Cancers (Basel). 5: 1522–44.
Sperling, R. a, Parak, W.J. 2010. Surface modification, functionalization and bioconjugation of colloidal
inorganic nanoparticles. Philos. Trans. A. Math. Phys. Eng. Sci. 368: 1333–83.
Suetsugu, A., Honma, K., Saji, S., Moriwaki, H., Ochiya, T., Hoffman, R.M. 2013. Imaging exosome
transfer from breast cancer cells to stroma at metastatic sites in orthotopic nude-mouse models.
Adv. Drug Deliv. Rev. 65: 383–90.
SV Total RNA Isolation System 2009 . Promega.
Svensson, K.J., Christianson, H.C., Wittrup, A., Bourseau-Guilmain, E., Lindqvist, E., Svensson, L.M.,
Mörgelin, M., Belting, M. 2013. Exosome uptake depends on ERK1/2-heat shock protein 27
signaling and lipid raft-mediated endocytosis negatively regulated by caveolin-1. J. Biol. Chem.
56
288: 17713–17724.
Tan, A., Rajadas, J., Seifalian, A.M. 2013. Exosomes as nano-theranostic delivery platforms for gene
therapy. Adv. Drug Deliv. Rev. 65: 357–367.
Théry, C., Clayton, A., Amigorena, S., Raposo, G. 2006. Isolation and characterization of exosomes
from cell culture supernatants, in: Current Protocols in Cell Biology. pp. 3.22.1–3.22.29.
Théry, C., Zitvogel, L., Amigorena, S. 2002. Exosomes: composition, biogenesis and function. Nat.
Rev. Immunol. 2: 569–79.
Trams, E.G., Lauter, C.J., Salem, N., Heine, U. 1981. Exfoliation of membrane ecto-enzymes in the
form of micro-vesicles. Biochim. Biophys. Acta 645: 63–70.
Tran, T.-H., Mattheolabakis, G., Aldawsari, H., Amiji, M. 2015. Exosomes as nanocarriers for
immunotherapy of cancer and inflammatory diseases, Clinical Immunology. Elsevier B.V.
Turkevich, J., Stevenson, P.C., Hillier, J. 1951. A study of the nucleation and growth processes in the
synthesis of Colloidal Gold. Discuss. Faraday Soc. 11: 55–75.
Urbanelli, L., Magini, A., Buratta, S., Brozzi, A., Sagini, K., Polchi, A., Tancini, B., Emiliani, C. 2013.
Signaling pathways in exosomes biogenesis, secretion and fate. Genes (Basel). 4: 152–170.
Vaiselbuh, S.R. 2015. Exosomes in Cancer Research 1: 11–24.
Valadi, H., Ekström, K., Bossios, A., Sjöstrand, M., Lee, J.J., Lötvall, J.O. 2007. Exosome-mediated
transfer of mRNAs and microRNAs is a novel mechanism of genetic exchange between cells.
Nat. Cell Biol. 9: 654–9.
van der Pol, E., Böing, A.N., Harrison, P., Sturk, A., Nieuwland, R. 2012. Classification, functions, and
clinical relevance of extracellular vesicles. Pharmacol. Rev. 64: 676–705.
Villarroya-Beltri, C., Baixauli, F., Gutiérrez-Vázquez, C., Sánchez-Madrid, F., Mittelbrunn, M. 2014.
Sorting it out: Regulation of exosome loading. Semin. Cancer Biol. 1–11.
Vlassov, A. V., Magdaleno, S., Setterquist, R., Conrad, R. 2012. Exosomes: Current knowledge of
their composition, biological functions, and diagnostic and therapeutic potentials. Biochim.
Biophys. Acta - Gen. Subj. 1820: 940–948.
Waldmann, T., Schneider, R. 2013. Targeting histone modifications - epigenetics in cancer. Curr.
Opin. Cell Biol. 25: 184–189.
Wang, J.-S., Wang, F.-B., Zhang, Q.-G., Shen, Z.-Z., Shao, Z.-M. 2008. Enhanced expression of
Rab27A gene by breast cancer cells promoting invasiveness and the metastasis potential by
secretion of insulin-like growth factor-II. Mol. Cancer Res. 6: 372–382.
WHO 2015. . World Heal. Organ. URL http://www.who.int/ (accessed 8.3.15).
World Cancer Report 2008. , in: World Cancer Report. pp. 97–133.
Yellon, D.M., Davidson, S.M. 2014. Exosomes: nanoparticles involved in cardioprotection? Circ. Res.
114: 325–332.
Zhang, H.G., Grizzle, W.E. 2014. Exosomes: A novel pathway of local and distant intercellular
communication that facilitates the growth and metastasis of neoplastic lesions. Am. J. Pathol.
184: 28–41.
Zhang, J., Li, S., Li, L., Li, M., Guo, C., Yao, J., Mi, S. 2015. Exosome and Exosomal MicroRNA:
Trafficking, Sorting, and Function. Genomics. Proteomics Bioinformatics 13: 17–24.
57
Zhang, M.-Z., Li, C., Fang, B.-Y., Yao, M.-H., Ren, Q.-Q., Zhang, L., Zhao, Y.-D. 2014. High
transfection efficiency of quantum dot-antisense oligonucleotide nanoparticles in cancer cells
through dual-receptor synergistic targeting. Nanotechnology 25: 255102.
Zhang, W., Kai, K., Ueno, N.T., Qin, L. 2013. A Brief Review of the Biophysical Hallmarks of
Metastatic Cancer Cells. Cancer Hallm. 1: 59–66.
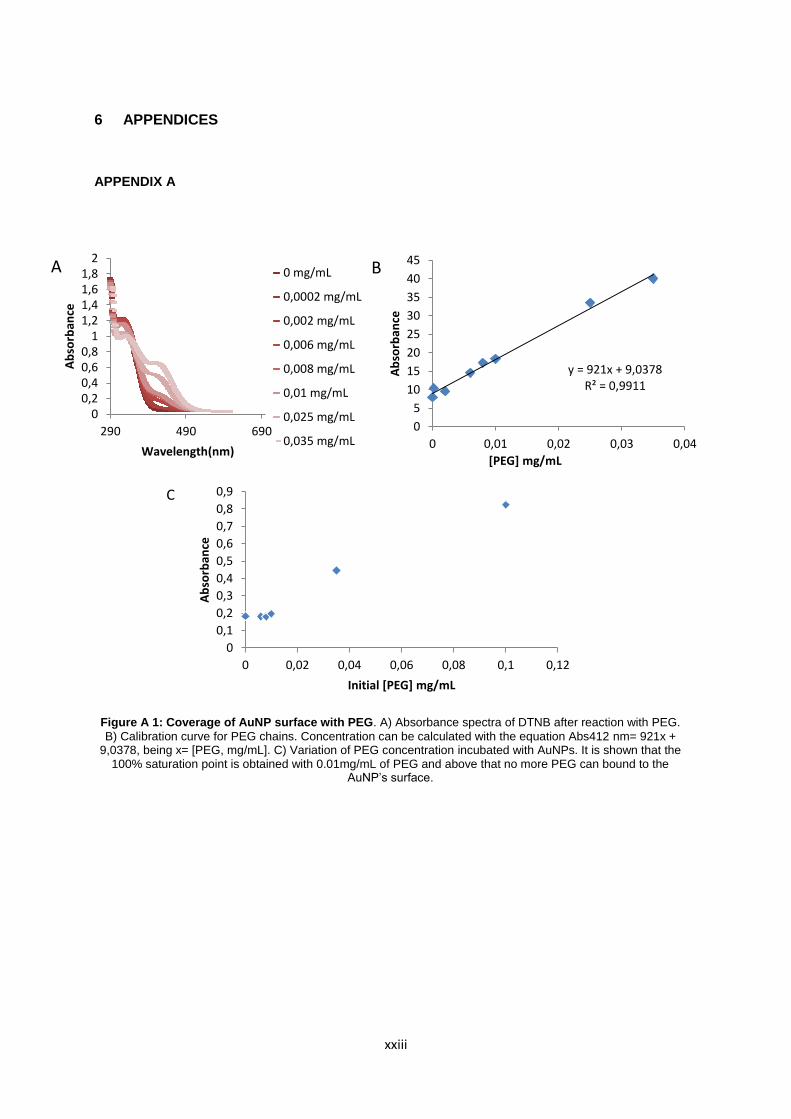
xxiii
6 APPENDICES
APPENDIX A
00,20,40,60,8
11,21,41,61,8
2
290 490 690
Ab
sorb
ance
Wavelength(nm)
0 mg/mL
0,0002 mg/mL
0,002 mg/mL
0,006 mg/mL
0,008 mg/mL
0,01 mg/mL
0,025 mg/mL
0,035 mg/mL
y = 921x + 9,0378 R² = 0,9911
0
5
10
15
20
25
30
35
40
45
0 0,01 0,02 0,03 0,04
Ab
sorb
ance
[PEG] mg/mL
A B
C
0
0,1
0,2
0,3
0,4
0,5
0,6
0,7
0,8
0,9
0 0,02 0,04 0,06 0,08 0,1 0,12
Ab
sorb
ance
Initial [PEG] mg/mL
Figure A 1: Coverage of AuNP surface with PEG. A) Absorbance spectra of DTNB after reaction with PEG.
B) Calibration curve for PEG chains. Concentration can be calculated with the equation Abs412 nm= 921x + 9,0378, being x= [PEG, mg/mL]. C) Variation of PEG concentration incubated with AuNPs. It is shown that the
100% saturation point is obtained with 0.01mg/mL of PEG and above that no more PEG can bound to the AuNP’s surface.
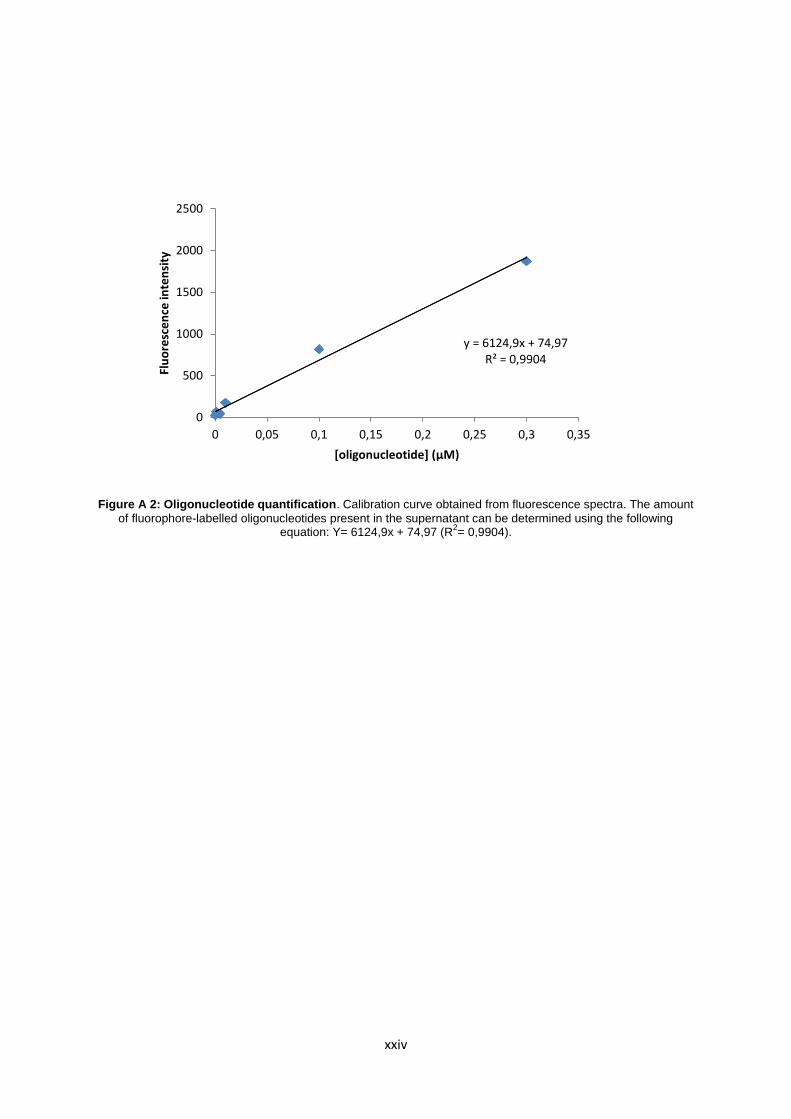
xxiv
Figure A 2: Oligonucleotide quantification. Calibration curve obtained from fluorescence spectra. The amount
of fluorophore-labelled oligonucleotides present in the supernatant can be determined using the following equation: Y= 6124,9x + 74,97 (R
2= 0,9904).
y = 6124,9x + 74,97 R² = 0,9904
0
500
1000
1500
2000
2500
0 0,05 0,1 0,15 0,2 0,25 0,3 0,35
Flu
ore
sce
nce
inte
nsi
ty
[oligonucleotide] (µM)
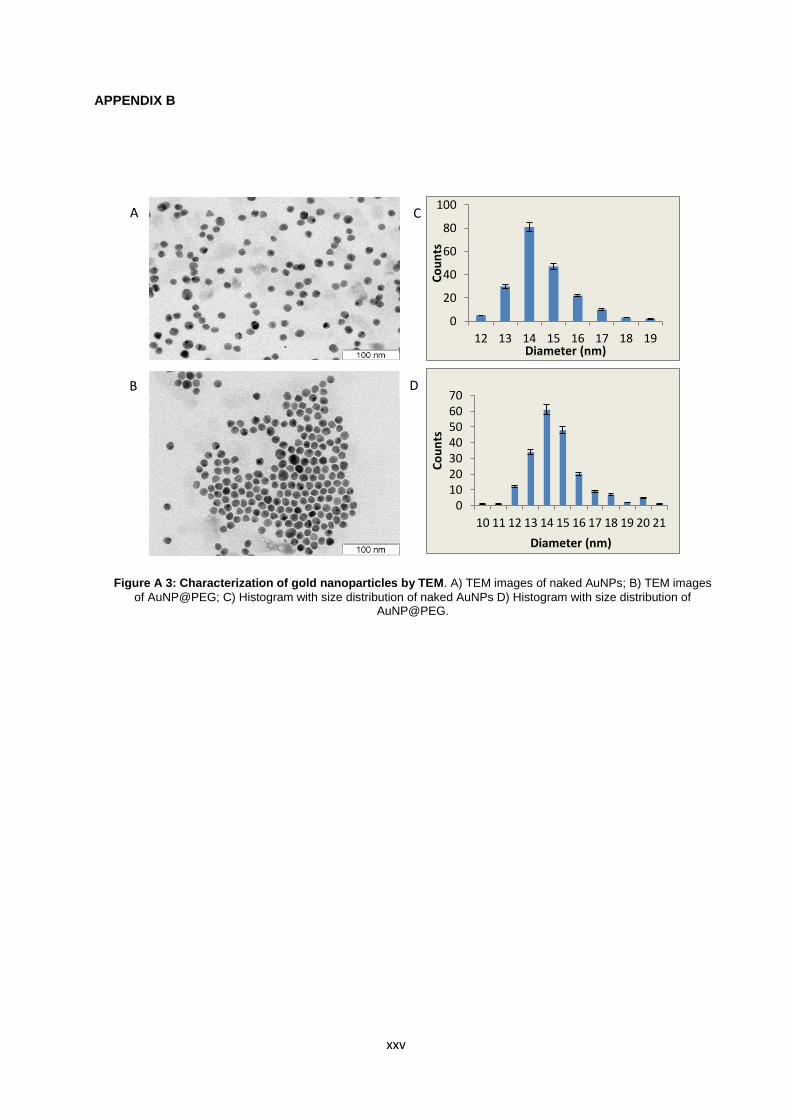
xxv
APPENDIX B
0
20
40
60
80
100
12 13 14 15 16 17 18 19
Co
un
ts
Diameter (nm)
010203040506070
10 11 12 13 14 15 16 17 18 19 20 21
Co
un
ts
Diameter (nm)
A
B
C
D
Figure A 3: Characterization of gold nanoparticles by TEM. A) TEM images of naked AuNPs; B) TEM images
of AuNP@PEG; C) Histogram with size distribution of naked AuNPs D) Histogram with size distribution of AuNP@PEG.