Embed Size (px)
Citation preview

Women in the Labor Force: A Databook
_____________________________________
U.S. Department of Labor U.S. Bureau of Labor Statistics December 2008 Report 1011

iii
Contents Page Women in the Labor Force: A Databook ..................................................................................................................... 1 Introduction ............................................................................................................................................................. 1 Highlights ............................................................................................................................................................... 1 Statistical Tables
1. Employment status of the civilian noninstitutional population by age and sex, 2007 annual averages .......... 4 2. Employment status of the civilian noninstitutional population 16 years and over by sex, 1970-2007 annual averages ............................................................................................................................ 7 3. Employment status by race, age, sex, and Hispanic or Latino ethnicity, 2007 annual averages ................... 10 4. Employment status by marital status and sex, 2007 annual averages ........................................................... 12 5. Employment status by sex, presence and age of children, race, and Hispanic or Latino ethnicity, March 2007 ................................................................................................................................................. 13 6. Employment status of women by presence and age of youngest child, marital status, race, and Hispanic or Latino ethnicity, March 2007 .................................................................................................................. 15 7. Employment status of women by presence and age of youngest child, March 1975-2007 ........................... 18 8. Employment status of the civilian noninstitutional population 25 to 64 years of age by educational attainment and sex, 2007 annual averages .................................................................................................... 21 9. Percent distribution of the civilian labor force 25 to 64 years of age by educational attainment and sex, 1970-2007 annual averages .......................................................................................................................... 22 10. Employed persons by major occupation and sex, 2006-07 annual averages ............................................... 26 11. Employed persons by detailed occupation and sex, 2007 annual averages.................................................. 28 12. Employed women by occupation, race, and Hispanic or Latino ethnicity, 2007 annual averages .............. 39 13. Employed persons by industry and sex, 2006-07 annual averages............................................................... 40 14. Employed persons by detailed industry and sex, 2007 annual averages ...................................................... 43 15. Employed women by industry, race, and Hispanic or Latino ethnicity, 2007 annual averages ................... 50 16. Median usual weekly earnings of full-time wage and salary workers in current dollars by race, Hispanic or Latino ethnicity, and sex, 1979-2007 annual averages .......................................................... 51 17. Median usual weekly earnings of employed full-time wage and salary workers 25 years and over by educational attainment and sex, 2007 annual averages ........................................................................ 53 18. Median usual weekly earnings of full-time wage and salary workers by detailed occupation and sex, 2007 annual averages ................................................................................................................................ 55 19. Median usual weekly earnings of full-time wage and salary workers by industry and sex, 2007 annual averages ................................................................................................................................ 68 20. Employed persons by full- and part-time status and sex, 1970-2007 annual averages ................................ 69 21. Average weekly hours at work in all industries and in nonagricultural industries by sex, 1976-2007 annual averages ....................................................................................................................... 73 22. Work experience of the population by sex and full- and part-time status, selected years, 1970-2006 ........ 74 23. Married-couple families by number and relationship of earners, 1967-2006 .............................................. 75 24. Contribution of wives’ earnings to family income, 1970-2006 ................................................................... 77 25. Wives who earn more than their husbands, 1987-2006 ............................................................................... 78 26. Wage and salary workers paid hourly rates with earnings at or below the prevailing Federal minimum wage by selected characteristics, 2007 annual averages ........................................................................... 79 27. Working poor: Poverty status of persons in the labor force 27 weeks or more by age, sex, race, and
Hispanic or Latino ethnicity, 2006 ............................................................................................................... 81 28. Percent distribution of employed persons by age, sex, and contingent and noncontingent status, February 2005 ............................................................................................................................................ 83 29. Percent distribution of employed persons by age, sex, and alternative work arrangements, February 2005 ........................................................................................................................................... 84
iv
Contents—Continued
Page Statistical Tables—Continued
30. Flexible schedules: Full-time wage and salary workers by selected characteristics, May 2004 ................. 85 31. Job-related work at home on primary job: All workers by marital status, presence and age of children, sex, and pay status, May 2004 ................................................................................................................... 86 32. Displaced workers by age, sex, race, Hispanic or Latino ethnicity, and employment status in January 2008 ............................................................................................................................................. 87 33. Labor force status of 2007 high school graduates and 2006-07 high school dropouts 16 to 24 years old by school enrollment and sex, October 2007 ............................................................................................ 88 34. Labor force status of persons 16 to 24 years old by school enrollment, sex, and educational attainment, October 2007 ............................................................................................................................................. 89 35. Multiple jobholders and multiple jobholding rates by sex and race, May of selected years, 1970-2007, not seasonally adjusted .............................................................................................................................. 90 36. Unincorporated self-employed persons in nonagricultural industries by sex, 1976-2007 annual averages . 91 37. Employment status of the native-born and foreign-born civilian noninstitutional population by age and sex, 2007 annual averages .................................................................................................................. 92 38. Union affiliation of employed wage and salary workers by sex, annual averages, 1983-2007 ................... 94
Technical Note ...................................................................................................................................................... 96

1
Women in the Labor Force: A Databook
Introduction
The past several decades have been marked by notable changes in women’s labor force activities. Since the 1970s, women’s labor force participation has risen substantially, particularly among women with children, and a larger share of women work full time and year round than ever before. In addition, women have increasingly attained higher levels of education: among women ages 25 to 64 who are in the labor force, the proportion with a college degree more than tripled from 1970 to 2007. Women’s earnings as a proportion of men’s also have grown over time. In 1979, women working full time earned 62 percent of what men did; in 2007, women’s earnings were 80 percent of men’s. This report presents historical and current labor force and earnings data for women and men from the Current Population Survey (CPS). The CPS is a national monthly survey of approximately 60,000 households conducted by the U.S. Census Bureau for the U.S. Bureau of Labor Statistics. Unless otherwise noted, data are annual averages from the CPS. Users should note that the comparisons of earnings in this report are on a broad level and do not control for many factors that can be significant in explaining earnings differences. For a detailed description of the source of the data and an explanation of concepts and definitions used, see the Technical Note at the end of this report.
Highlights
• In 2007, 59 percent of women were in the labor force, and this share has been quite stable over the past few years. Women’s labor force participation rate peaked at 60 percent in 1999, following several decades in which women increasingly entered the labor market. (See tables 1 and 2.)
• The unemployment rate for women was 4.5
percent in 2007. Although higher than its most recent low of 4.1 percent in 2000, the unemployment rate for women in 2007 was relatively low by historical standards. Unem-
ployment rates for women varied by race and Hispanic ethnicity in 2007. Asian women had the lowest rate (3.4 percent), followed by white (4.0 percent), Hispanic (6.1 percent), and black (7.5 percent) women. (See tables 1, 2, and 3.)
• From March 1975 to March 2000, the labor force
participation rate of mothers with children under age 18 rose from 47 percent to a peak of 73 percent. (These data were collected in the March CPS.) By 2004, the rate for these mothers had receded to 71 percent, where it remained through 2007. In general, mothers with older children (6 to 17 years of age, none younger) are more likely to participate in the labor force than mothers with younger children (under 6 years of age), and unmarried mothers have higher participation rates than married mothers. In 2007, 76 percent of unmarried mothers were in the labor force, compared with 69 percent of married mothers. (See tables 6 and 7.)
• The educational attainment of women in the labor
force aged 25 to 64 rose substantially from 1970 to 2007. Thirty-five percent of these women held college degrees in 2007, compared with 11 percent in 1970. Only 7 percent of women were high school dropouts in 2007, down from 34 percent in 1970. (See table 9.)
• In 2007, women accounted for about 51 percent of
all persons employed in management, professional, and related occupations, somewhat more than their share of all employed workers (46 percent). The share of women in specific occupations within this broad category varied in 2007. For example, 8 percent of engineering managers and 33 percent of lawyers were women. In contrast, 92 percent of registered nurses and 82 percent of social workers were women. (See table 11.)
• Employed Asian women were more likely (47
percent) to work in the higher paying management, professional, and related occupations in 2007 than

2
were employed white (40 percent), black (31 percent), or Hispanic (23 percent) women. Hispanic women (31 percent) and black women (27 percent) were more likely than white and Asian women (each 19 percent) to work in service occupations. (See table 12.)
• In 2007, women accounted for more than half of
all workers within several industry sectors: financial activities, education and health services, leisure and hospitality, and other services. However, women were substantially under-represented (relative to their share of total employment) in agriculture, mining, construction, manufacturing, and transportation and utilities. (See table 14.)
• Women who worked full time in wage and salary
jobs had median usual weekly earnings of $614 in 2007. This represented 80 percent of men’s median weekly earnings ($766). Earnings of Asian ($731) and white ($626) women were substantially higher than the earnings of their black ($533) and Hispanic ($473) counterparts. Women’s-to-men’s earnings ratios were higher among blacks (89 percent) and Hispanics (91 percent) than among whites (79 percent) and Asians (78 percent). (See table 16.)
• In 2007, female full-time wage and salary workers
with only a high school diploma had median usual weekly earnings of $512. This represented 80 percent of the earnings for women with an associate degree ($640), and 55 percent of those for women with a bachelor’s degree or higher ($932). (See table 17.)
• In 2007, 25 percent of employed women usually
worked part time—fewer than 35 hours per week. In comparison, about 11 percent of employed men usually worked part time. (See table 20.)
• Women in nonagricultural industries worked an
average of 36.1 hours per week in 2007. The average workweek for men in nonagricultural industries was 41.6 hours. (See table 21.)
• Of all women who worked at some point during
calendar year 2006, 61 percent worked full time and year round, compared with 41 percent in 1970. During the same period, the proportion of men who worked full time and year round grew from 66
to 75 percent. (See table 22.) (These data were collected in the 2007 Annual Social and Economic Supplement to the CPS and refer to work experience during the prior calendar year.)
• Both the wife and husband had earnings from work
in 57 percent of married-couple families in 2006, up from 44 percent in 1967. Couples in which only the husband worked represented 18 percent of married-couple families in 2006, compared with 36 percent in 1967. (See table 23.) (These data were collected in the 2007 Annual Social and Economic Supplement to the CPS and reflect earnings and work experience of the prior calendar year.)
• In 2006, working wives’ contributions accounted
for 36 percent of their families’ incomes, up by 9 percentage points from 1970, when wives’ earnings accounted for 27 percent of their families’ total incomes. The proportion of wives earning more than their husbands also has grown. In 1987, 18 percent of working wives whose husbands also worked earned more than their spouses; in 2006, the proportion was 26 percent. (See tables 24 and 25.) (These data were collected in the 2007 Annual Social and Economic Supplement to the CPS and reflect earnings and work experience of the prior calendar year.)
• In 2007, approximately 1.2 million women paid at
an hourly rate had earnings at or below the prevailing Federal minimum wage. This was 3 percent of all women paid at an hourly rate. Among women 25 years and older who were paid hourly rates, 2 percent had earnings at or below the minimum wage, compared with 7 percent of women aged 16 to 24. (On July 24, 2007, the Federal minimum wage level rose from $5.15 to $5.85 an hour. Data in this report reflect the average number of workers who earned $5.15 or less from January 2007 through July 2007 and those who earned $5.85 or less from August 2007 through the end of the year.) (See table 26.)
• Among workers who were in the labor force for at
least 27 weeks in 2006, women were slightly more likely than men to live in poverty—5.8 percent compared with 4.5 percent. Black and Hispanic women who were in the labor force for 27 weeks or more were significantly more likely than their white or Asian counterparts to be among the working poor. The poverty rates for black and
3
Hispanic women were 12.0 percent and 9.8 percent, respectively, compared with 4.8 percent and 3.4 percent, respectively, for white and Asian women. (See table 27.) (Data are from the 2007 Annual Social and Economic Supplement to the CPS and reflect earnings and work experience of the prior calendar year.)
• From January 2005 to December 2007, 1.6 million
women and 2.0 million men were displaced from jobs they had held for at least 3 years. The women were somewhat less likely than the men to have found a new job at the time of the survey in January 2008: the reemployment rate for women was 64 percent, compared with 70 percent for men. Women were almost twice as likely as men to have left the labor force, 20 and 11 percent, respec-tively. (See table 32.) (Data are from the January 2008 Displaced Worker supplement to the CPS.)
• Among 2007 high school graduates, young women
(68 percent) were slightly more likely than young men (66 percent) to be enrolled in college in October 2007. (See table 33.) (Data are from the October 2007 School Enrollment supplement to the CPS.)
• In October 2007, 45.6 percent of women aged 16
to 24 who were enrolled in either high school or college were in the labor force. Young men of the same age group who were enrolled in school had a lower labor force participation rate (39.6 percent). Among those not enrolled in school, women (73.0 percent) were less likely to be in the labor force than men (87.9 percent). (See table 34.) (Data are from the October 2007 School Enrollment supplement to the CPS.)
• Among 16- to 24-year-old women who were
not enrolled in school, those who did not have a high school diploma (48.6 percent) were signifi-cantly less likely to participate in the labor force than those who had a high school diploma but no additional education (71.0 percent). Of those in
the labor force, the high school dropouts were more likely to be unemployed than the high school graduates (19.0 percent, compared with 12.4 percent). (See table 34.) (Data are from the October 2007 School Enrollment supplement to the CPS.)
• In May 2007, the multiple jobholding rate for
women was 5.7 percent, the same as a year earlier. The May 2007 multiple jobholding rate for men was lower, at 4.9 percent. Multiple jobholding rates for both women and men have edged down since the mid-1990s, when they were at or near 6.5 percent. (See table 35.) (Data were collected in the May CPS.)
• Since 1976, the percentage of working women who
were self employed has trended up (from 4.4 percent to 5.4 percent in 2007), while the percentage of employed men who were self employed has edged down (from 8.4 percent to 7.7 percent). In 2007, 38 percent of all self-employed persons were women, compared with 27 percent in 1976. (See table 36.)
• In 2007, foreign-born women (54.9 percent) were
less likely than native-born women (60.1 percent) to be in the labor force. Of those in the labor force, foreign-born and native-born women were about equally likely to be unemployed (4.6 and 4.5 percent, respectively). Among men, the foreign born (81.9 percent) were more likely to be in the labor force than the native born (71.6 percent); the foreign born also were less likely to be unemployed (4.1 percent, compared with 4.9 percent). (See table 37.)
• About 12 percent of female wage and salary
workers were represented by unions in 2007, compared with 14 percent of men. Union attachment for both sexes has fallen since 1983, when unions represented 18 percent of women and 28 percent of men in wage and salary jobs. (See table 38.)

Table 1. Employment status of the civilian noninstitutional population by age and sex, 2007 annual averages (Numbers in thousands)
16 years and over ……... 231,867 153,124 66.0 146,047 63.0 7,078 4.6 78,74316 to 19 years …….…… 16,982 7,012 41.3 5,911 34.8 1,101 15.7 9,970
16 to 17 years……… 9,222 2,771 30.0 2,286 24.8 485 17.5 6,45118 to 19 years……… 7,760 4,242 54.7 3,625 46.7 616 14.5 3,519
20 to 24 years……….... 20,427 15,205 74.4 13,964 68.4 1,241 8.2 5,223
25 to 54 years……….… 125,696 104,353 83.0 100,450 79.9 3,904 3.7 21,34325 to 34 years……… 39,751 33,130 83.3 31,586 79.5 1,544 4.7 6,622
25 to 29 years……… 20,607 17,130 83.1 16,247 78.8 883 5.2 3,47730 to 34 years……… 19,144 16,000 83.6 15,339 80.1 661 4.1 3,145
35 to 44 years……… 42,401 35,527 83.8 34,302 80.9 1,225 3.4 6,87535 to 39 years……… 20,738 17,292 83.4 16,677 80.4 615 3.6 3,44640 to 44 years……… 21,664 18,235 84.2 17,625 81.4 610 3.3 3,429
45 to 54 years……… 43,544 35,697 82.0 34,563 79.4 1,135 3.2 7,84645 to 49 years……. 22,661 18,903 83.4 18,285 80.7 618 3.3 3,75850 to 54 years……… 20,882 16,795 80.4 16,278 77.9 517 3.1 4,088
55 to 64 years………… 32,533 20,750 63.8 20,108 61.8 642 3.1 11,78355 to 59 years……… 18,194 13,104 72.0 12,691 69.8 413 3.1 5,09060 to 64 years……… 14,339 7,646 53.3 7,417 51.7 229 3.0 6,693
65 years and over……. 36,228 5,804 16.0 5,614 15.5 190 3.3 30,42465 to 69 years……… 10,708 3,179 29.7 3,074 28.7 105 3.3 7,52970 to 74 years……… 8,461 1,457 17.2 1,408 16.6 50 3.4 7,00475 years and over…… 17,059 1,167 6.8 1,132 6.6 35 3.0 15,892
Age
Civilian noninsti-tutional
populationTotal Percent of
population
Civilian labor force
Total Percent of labor force
Not in labor force
Employed Unemployed
Total Percent of population
Total, both sexes
4
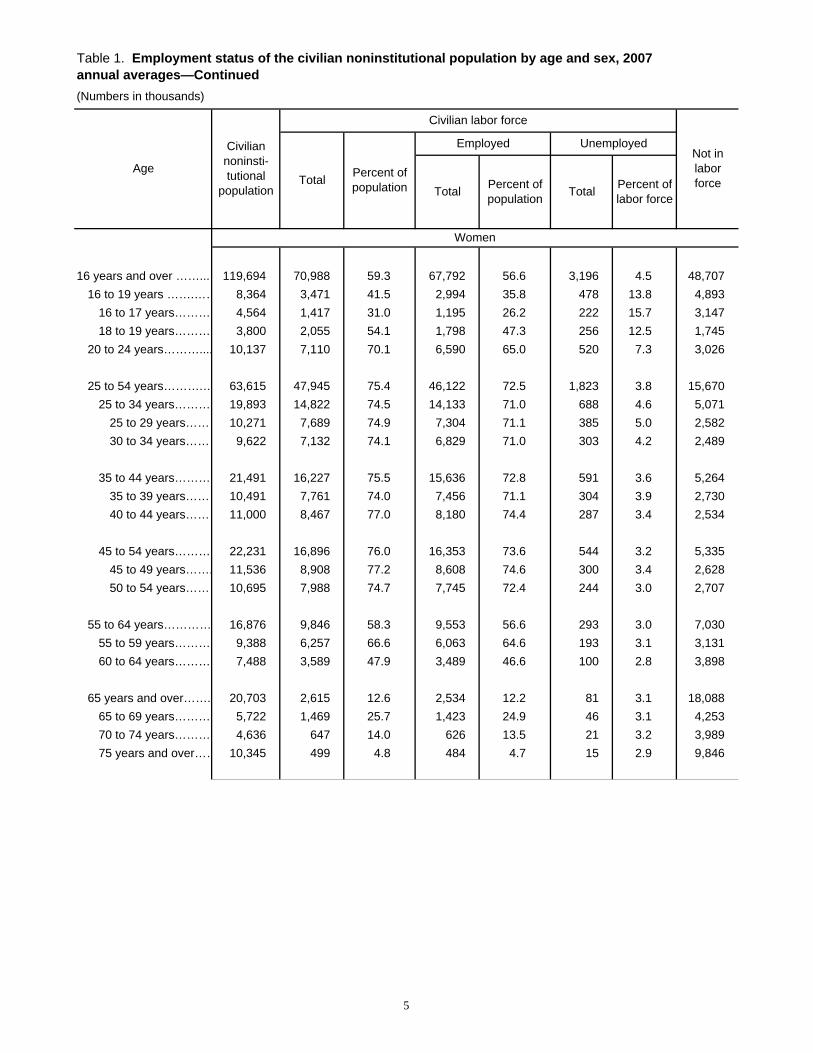
Table 1. Employment status of the civilian noninstitutional population by age and sex, 2007 annual averages—Continued(Numbers in thousands)
16 years and over ……... 119,694 70,988 59.3 67,792 56.6 3,196 4.5 48,70716 to 19 years …….…… 8,364 3,471 41.5 2,994 35.8 478 13.8 4,893
16 to 17 years……… 4,564 1,417 31.0 1,195 26.2 222 15.7 3,14718 to 19 years……… 3,800 2,055 54.1 1,798 47.3 256 12.5 1,745
20 to 24 years……….... 10,137 7,110 70.1 6,590 65.0 520 7.3 3,026
25 to 54 years……….… 63,615 47,945 75.4 46,122 72.5 1,823 3.8 15,67025 to 34 years……… 19,893 14,822 74.5 14,133 71.0 688 4.6 5,071
25 to 29 years……… 10,271 7,689 74.9 7,304 71.1 385 5.0 2,58230 to 34 years……… 9,622 7,132 74.1 6,829 71.0 303 4.2 2,489
35 to 44 years……… 21,491 16,227 75.5 15,636 72.8 591 3.6 5,26435 to 39 years……… 10,491 7,761 74.0 7,456 71.1 304 3.9 2,73040 to 44 years……… 11,000 8,467 77.0 8,180 74.4 287 3.4 2,534
45 to 54 years……… 22,231 16,896 76.0 16,353 73.6 544 3.2 5,33545 to 49 years……. 11,536 8,908 77.2 8,608 74.6 300 3.4 2,62850 to 54 years……… 10,695 7,988 74.7 7,745 72.4 244 3.0 2,707
55 to 64 years………… 16,876 9,846 58.3 9,553 56.6 293 3.0 7,03055 to 59 years……… 9,388 6,257 66.6 6,063 64.6 193 3.1 3,13160 to 64 years……… 7,488 3,589 47.9 3,489 46.6 100 2.8 3,898
65 years and over……. 20,703 2,615 12.6 2,534 12.2 81 3.1 18,08865 to 69 years……… 5,722 1,469 25.7 1,423 24.9 46 3.1 4,25370 to 74 years……… 4,636 647 14.0 626 13.5 21 3.2 3,98975 years and over…… 10,345 499 4.8 484 4.7 15 2.9 9,846
Women
Total Percent of population Total Percent of
labor force
Age
Civilian noninsti-tutional
populationTotal Percent of
population
Civilian labor force
Not in labor force
Employed Unemployed
5

Table 1. Employment status of the civilian noninstitutional population by age and sex, 2007 annual averages—Continued(Numbers in thousands)
16 years and over ……... 112,173 82,136 73.2 78,254 69.8 3,882 4.7 30,03616 to 19 years …….…… 8,618 3,541 41.1 2,917 33.9 623 17.6 5,077
16 to 17 years……… 4,658 1,354 29.1 1,091 23.4 263 19.4 3,30418 to 19 years……… 3,960 2,187 55.2 1,827 46.1 360 16.5 1,773
20 to 24 years……….... 10,291 8,095 78.7 7,374 71.7 721 8.9 2,196
25 to 54 years……….… 62,081 56,408 90.9 54,328 87.5 2,081 3.7 5,67325 to 34 years……… 19,858 18,308 92.2 17,452 87.9 856 4.7 1,550
25 to 29 years……… 10,336 9,441 91.3 8,943 86.5 498 5.3 89530 to 34 years……… 9,523 8,867 93.1 8,509 89.4 358 4.0 656
35 to 44 years……… 20,910 19,299 92.3 18,666 89.3 634 3.3 1,61135 to 39 years……… 10,247 9,531 93.0 9,221 90.0 311 3.3 71640 to 44 years……… 10,663 9,768 91.6 9,445 88.6 323 3.3 895
45 to 54 years……… 21,313 18,801 88.2 18,210 85.4 591 3.1 2,51245 to 49 years……. 11,125 9,995 89.8 9,677 87.0 318 3.2 1,13150 to 54 years……… 10,187 8,806 86.4 8,533 83.8 273 3.1 1,381
55 to 64 years………… 15,658 10,904 69.6 10,556 67.4 349 3.2 4,75355 to 59 years……… 8,807 6,848 77.8 6,628 75.3 219 3.2 1,95960 to 64 years……… 6,851 4,057 59.2 3,927 57.3 129 3.2 2,794
65 years and over……. 15,525 3,188 20.5 3,080 19.8 108 3.4 12,33765 to 69 years……… 4,986 1,710 34.3 1,651 33.1 59 3.5 3,27670 to 74 years……… 3,825 810 21.2 781 20.4 29 3.6 3,01475 years and over…… 6,714 668 10.0 648 9.6 20 3.1 6,046
SOURCE: Current Population Survey, U.S. Department of Labor, U.S. Bureau of Labor Statistics.
Men
Employed Unemployed
Total Percent of population Total Percent of
labor force
Not in labor force
Age
Civilian noninsti-tutional
populationTotal Percent of
population
Civilian labor force
6

Table 2. Employment status of the civilian noninstitutional population 16 years and over by sex,1970-2007 annual averages (Numbers in thousands)
1970…….…… 137,085 82,771 60.4 78,678 57.5 4,093 4.9 54,3151971…….…… 140,216 84,382 60.2 79,367 56.6 5,016 5.9 55,8341972 1……… 144,126 87,034 60.4 82,153 57.0 4,882 5.6 57,0911973 1……… 147,096 89,429 60.8 85,064 57.8 4,365 4.9 57,6671974…….…… 150,120 91,949 61.3 86,794 57.8 5,156 5.6 58,1711975…….…… 153,153 93,775 61.2 85,846 56.1 7,929 8.5 59,3771976…….…… 156,150 96,158 61.6 88,752 56.8 7,406 7.7 59,9911977…….…… 159,033 99,009 62.3 92,017 57.9 6,991 7.1 60,0251978 1…....... 161,910 102,251 63.2 96,048 59.3 6,202 6.1 59,6591979………… 164,863 104,962 63.7 98,824 59.9 6,137 5.8 59,900
1980………… 167,745 106,940 63.8 99,303 59.2 7,637 7.1 60,8061981…...…… 170,130 108,670 63.9 100,397 59.0 8,273 7.6 61,4601982…...…… 172,271 110,204 64.0 99,526 57.8 10,678 9.7 62,0671983…...…… 174,215 111,550 64.0 100,834 57.9 10,717 9.6 62,6651984…...…… 176,383 113,544 64.4 105,005 59.5 8,539 7.5 62,8391985…...…… 178,206 115,461 64.8 107,150 60.1 8,312 7.2 62,7441986 1…....... 180,587 117,834 65.3 109,597 60.7 8,237 7.0 62,7521987………… 182,753 119,865 65.6 112,440 61.5 7,425 6.2 62,8881988…...…… 184,613 121,669 65.9 114,968 62.3 6,701 5.5 62,9441989………… 186,393 123,869 66.5 117,342 63.0 6,528 5.3 62,523
1990 1…....... 189,164 125,840 66.5 118,793 62.8 7,047 5.6 63,3241991…...…… 190,925 126,346 66.2 117,718 61.7 8,628 6.8 64,5781992…...…… 192,805 128,105 66.4 118,492 61.5 9,613 7.5 64,7001993…...…… 194,838 129,200 66.3 120,259 61.7 8,940 6.9 65,6381994 1…....... 196,814 131,056 66.6 123,060 62.5 7,996 6.1 65,7581995…...…… 198,584 132,304 66.6 124,900 62.9 7,404 5.6 66,2801996…...…… 200,591 133,943 66.8 126,708 63.2 7,236 5.4 66,6471997 1…....... 203,133 136,297 67.1 129,558 63.8 6,739 4.9 66,8371998 1…....... 205,220 137,673 67.1 131,463 64.1 6,210 4.5 67,5471999 1…....... 207,753 139,368 67.1 133,488 64.3 5,880 4.2 68,385
2000 1…....... 212,577 142,583 67.1 136,891 64.4 5,692 4.0 69,9942001 ………… 215,092 143,734 66.8 136,933 63.7 6,801 4.7 71,3592002 ………… 217,570 144,863 66.6 136,485 62.7 8,378 5.8 72,7072003 1…....... 221,168 146,510 66.2 137,736 62.3 8,774 6.0 74,6582004 1…....... 223,357 147,401 66.0 139,252 62.3 8,149 5.5 75,9562005………… 226,082 149,320 66.0 141,730 62.7 7,591 5.1 76,7622006………… 228,815 151,428 66.2 144,427 63.1 7,001 4.6 77,3872007………… 231,867 153,124 66.0 146,047 63.0 7,078 4.6 78,743
See footnote at end of table.
Year
Civilian noninsti-tutional
population
Civilian labor force
Not in labor forceTotal Percent of
population
Employed Unemployed
Total Percent of population Total Percent of
labor force
Total, both sexes
7

Table 2. Employment status of the civilian noninstitutional population 16 years and over by sex,1970-2007 annual averages—Continued(Numbers in thousands)
1970…….…… 72,782 31,543 43.3 29,688 40.8 1,855 5.9 41,2391971…….…… 74,274 32,202 43.4 29,976 40.4 2,227 6.9 42,0721972 1……… 76,290 33,479 43.9 31,257 41.0 2,222 6.6 42,8111973 1……… 77,804 34,804 44.7 32,715 42.0 2,089 6.0 43,0001974…….…… 79,312 36,211 45.7 33,769 42.6 2,441 6.7 43,1011975…….…… 80,860 37,475 46.3 33,989 42.0 3,486 9.3 43,3861976…….…… 82,390 38,983 47.3 35,615 43.2 3,369 8.6 43,4061977…….…… 83,840 40,613 48.4 37,289 44.5 3,324 8.2 43,2271978 1…....... 85,334 42,631 50.0 39,569 46.4 3,061 7.2 42,7031979………… 86,843 44,235 50.9 41,217 47.5 3,018 6.8 42,608
1980………… 88,348 45,487 51.5 42,117 47.7 3,370 7.4 42,8611981…...…… 89,618 46,696 52.1 43,000 48.0 3,696 7.9 42,9221982…...…… 90,748 47,755 52.6 43,256 47.7 4,499 9.4 42,9931983…...…… 91,684 48,503 52.9 44,047 48.0 4,457 9.2 43,1811984…...…… 92,778 49,709 53.6 45,915 49.5 3,794 7.6 43,0681985…...…… 93,736 51,050 54.5 47,259 50.4 3,791 7.4 42,6861986 1…....... 94,789 52,413 55.3 48,706 51.4 3,707 7.1 42,3761987………… 95,853 53,658 56.0 50,334 52.5 3,324 6.2 42,1951988…...…… 96,756 54,742 56.6 51,696 53.4 3,046 5.6 42,0141989………… 97,630 56,030 57.4 53,027 54.3 3,003 5.4 41,601
1990 1…....... 98,787 56,829 57.5 53,689 54.3 3,140 5.5 41,9571991…...…… 99,646 57,178 57.4 53,496 53.7 3,683 6.4 42,4681992…...…… 100,535 58,141 57.8 54,052 53.8 4,090 7.0 42,3941993…...…… 101,506 58,795 57.9 54,910 54.1 3,885 6.6 42,7111994 1…....... 102,460 60,239 58.8 56,610 55.3 3,629 6.0 42,2211995…...…… 103,406 60,944 58.9 57,523 55.6 3,421 5.6 42,4621996…...…… 104,385 61,857 59.3 58,501 56.0 3,356 5.4 42,5281997 1…....... 105,418 63,036 59.8 59,873 56.8 3,162 5.0 42,3821998 1…....... 106,462 63,714 59.8 60,771 57.1 2,944 4.6 42,7481999 1…....... 108,031 64,855 60.0 62,042 57.4 2,814 4.3 43,175
2000 1…....... 110,613 66,303 59.9 63,586 57.5 2,717 4.1 44,3102001 ………… 111,811 66,848 59.8 63,737 57.0 3,111 4.7 44,9622002 ………… 112,985 67,363 59.6 63,582 56.3 3,781 5.6 45,6212003 1…....... 114,733 68,272 59.5 64,404 56.1 3,868 5.7 46,4612004 1…....... 115,647 68,421 59.2 64,728 56.0 3,694 5.4 47,2252005………… 116,931 69,288 59.3 65,757 56.2 3,531 5.1 47,6432006………… 118,210 70,173 59.4 66,925 56.6 3,247 4.6 48,0372007………… 119,694 70,988 59.3 67,792 56.6 3,196 4.5 48,707
See footnote at end of table.
Year
Civilian noninsti-tutional
population
Civilian labor force
Not in labor forceTotal Percent of
population
Employed Unemployed
Total Percent of population Total Percent of
labor force
Women
8

Table 2. Employment status of the civilian noninstitutional population 16 years and over by sex, 1970-2007 annual averages—Continued(Numbers in thousands)
1970…….…… 64,304 51,228 79.7 48,990 76.2 2,238 4.4 13,0761971…….…… 65,942 52,180 79.1 49,390 74.9 2,789 5.3 13,7621972 1……… 67,835 53,555 78.9 50,896 75.0 2,659 5.0 14,2801973 1……… 69,292 54,624 78.8 52,349 75.5 2,275 4.2 14,6671974…….…… 70,808 55,739 78.7 53,024 74.9 2,714 4.9 15,0691975…….…… 72,291 56,299 77.9 51,857 71.7 4,442 7.9 15,9931976…….…… 73,759 57,174 77.5 53,138 72.0 4,036 7.1 16,5851977…….…… 75,193 58,396 77.7 54,728 72.8 3,667 6.3 16,7971978 1…....... 76,576 59,620 77.9 56,479 73.8 3,142 5.3 16,9561979………… 78,020 60,726 77.8 57,607 73.8 3,120 5.1 17,293
1980………… 79,398 61,453 77.4 57,186 72.0 4,267 6.9 17,9451981…...…… 80,511 61,974 77.0 57,397 71.3 4,577 7.4 18,5371982…...…… 81,523 62,450 76.6 56,271 69.0 6,179 9.9 19,0731983…...…… 82,531 63,047 76.4 56,787 68.8 6,260 9.9 19,4841984…...…… 83,605 63,835 76.4 59,091 70.7 4,744 7.4 19,7711985…...…… 84,469 64,411 76.3 59,891 70.9 4,521 7.0 20,0581986 1…....... 85,798 65,422 76.3 60,892 71.0 4,530 6.9 20,3761987………… 86,899 66,207 76.2 62,107 71.5 4,101 6.2 20,6921988…...…… 87,857 66,927 76.2 63,273 72.0 3,655 5.5 20,9301989………… 88,762 67,840 76.4 64,315 72.5 3,525 5.2 20,923
1990 1…....... 90,377 69,011 76.4 65,104 72.0 3,906 5.7 21,3671991…...…… 91,278 69,168 75.8 64,223 70.4 4,946 7.2 22,1101992…...…… 92,270 69,964 75.8 64,440 69.8 5,523 7.9 22,3061993…...…… 93,332 70,404 75.4 65,349 70.0 5,055 7.2 22,9271994 1…....... 94,355 70,817 75.1 66,450 70.4 4,367 6.2 23,5381995…...…… 95,178 71,360 75.0 67,377 70.8 3,983 5.6 23,8181996…...…… 96,206 72,087 74.9 68,207 70.9 3,880 5.4 24,1191997 1…....... 97,715 73,261 75.0 69,685 71.3 3,577 4.9 24,4541998 1…....... 98,758 73,959 74.9 70,693 71.6 3,266 4.4 24,7991999 1…....... 99,722 74,512 74.7 71,446 71.6 3,066 4.1 25,210
2000 1…....... 101,964 76,280 74.8 73,305 71.9 2,975 3.9 25,6842001 ………… 103,282 76,886 74.4 73,196 70.9 3,690 4.8 26,3962002 ………… 104,585 77,500 74.1 72,903 69.7 4,597 5.9 27,0852003 1…....... 106,435 78,238 73.5 73,332 68.9 4,906 6.3 28,1972004 1…....... 107,710 78,980 73.3 74,524 69.2 4,456 5.6 28,7302005………… 109,151 80,033 73.3 75,973 69.6 4,059 5.1 29,1192006………… 110,605 81,255 73.5 77,502 70.1 3,753 4.6 29,3502007………… 112,173 82,136 73.2 78,254 69.8 3,882 4.7 30,036
Year
Civilian noninsti-tutional
population
Civilian labor force
Not in labor forceTotal Percent of
population
Employed Unemployed
Total Percent of population Total Percent of
labor force
Men
1 The comparability of historical labor force data hasbeen affected at various times by methodological andconceptual changes in the Current Population Survey(CPS). For an explanation, see the HistoricalComparability section of the Household Data technical
documentation provided athttp://www.bls.gov/cps/eetech_methods.pdf .
SOURCE: Current Population Survey, U.S.Department of Labor, U.S. Bureau of Labor Statistics.
9

Table 3. Employment status by race, age, sex, and Hispanic or Latino ethnicity, 2007 annual averages(Numbers in thousands)
Civilian labor force
Employed Unemployed
Total Percent
of population
Total Percent of labor force
WhiteTotal, 16 years and over……… 188,253 124,935 66.4 119,792 63.6 5,143 4.1 63,319 16 to 19 years……………… 13,043 5,795 44.4 4,990 38.3 805 13.9 7,248 20 to 24 years……………..… 15,945 12,176 76.4 11,325 71.0 851 7.0 3,769 25 to 54 years……………… 100,446 84,096 83.7 81,294 80.9 2,802 3.3 16,350 55 to 64 years……………… 27,392 17,782 64.9 17,262 63.0 520 2.9 9,611 65 years and over………….. 31,426 5,085 16.2 4,921 15.7 164 3.2 26,341
Women, 16 years and over…… 96,180 56,777 59.0 54,503 56.7 2,274 4.0 39,403 16 to 19 years………….....… 6,390 2,851 44.6 2,507 39.2 344 12.1 3,539 20 to 24 years…………….… 7,832 5,609 71.6 5,259 67.1 350 6.2 2,223 25 to 54 years……………..… 50,071 37,770 75.4 36,496 72.9 1,274 3.4 12,301 55 to 64 years…………….... 14,051 8,282 58.9 8,047 57.3 235 2.8 5,770 65 years and over………….. 17,835 2,264 12.7 2,193 12.3 71 3.1 15,571
Men, 16 years and over……… 92,073 68,158 74.0 65,289 70.9 2,869 4.2 23,915 16 to 19 years…………….… 6,653 2,944 44.3 2,483 37.3 461 15.7 3,709 20 to 24 years……………… 8,113 6,567 80.9 6,066 74.8 501 7.6 1,546 25 to 54 years……………..… 50,375 46,326 92.0 44,798 88.9 1,529 3.3 4,049 55 to 64 years……………… 13,341 9,500 71.2 9,215 69.1 285 3.0 3,841 65 years and over…………… 13,591 2,821 20.8 2,727 20.1 93 3.3 10,771
Black or African American
Total, 16 years and over……… 27,485 17,496 63.7 16,051 58.4 1,445 8.3 9,989 16 to 19 years……………… 2,640 801 30.3 566 21.4 235 29.4 1,839 20 to 24 years……………… 2,891 1,974 68.3 1,674 57.9 300 15.2 917 25 to 54 years……………… 15,590 12,478 80.0 11,666 74.8 812 6.5 3,113 55 to 64 years……………… 3,284 1,811 55.1 1,732 52.7 79 4.3 1,473 65 years and over…………… 3,080 432 14.0 413 13.4 19 4.5 2,647
Women, 16 years and over…… 15,124 9,244 61.1 8,551 56.5 693 7.5 5,879 16 to 19 years……………… 1,336 417 31.2 311 23.3 106 25.3 919 20 to 24 years……………… 1,511 993 65.7 858 56.8 135 13.6 519 25 to 54 years……………… 8,554 6,589 77.0 6,182 72.3 406 6.2 1,965 55 to 64 years……………… 1,830 1,019 55.7 982 53.7 38 3.7 810 65 years and over…………… 1,893 227 12.0 218 11.5 9 4.0 1,666
Men, 16 years and over……… 12,361 8,252 66.8 7,500 60.7 752 9.1 4,110 16 to 19 years……………… 1,305 384 29.4 254 19.5 130 33.8 920 20 to 24 years……………… 1,380 981 71.1 816 59.1 166 16.9 398 25 to 54 years……………… 7,036 5,889 83.7 5,483 77.9 406 6.9 1,147 55 to 64 years……………… 1,454 791 54.4 750 51.6 41 5.2 663 65 years and over…………… 1,186 206 17.3 195 16.5 10 5.0 981
Race, age, sex, and Hispanic or Latino ethnicity
Civilian noninsti-tutional
population
Not in labor force Total
Percent of
population
10
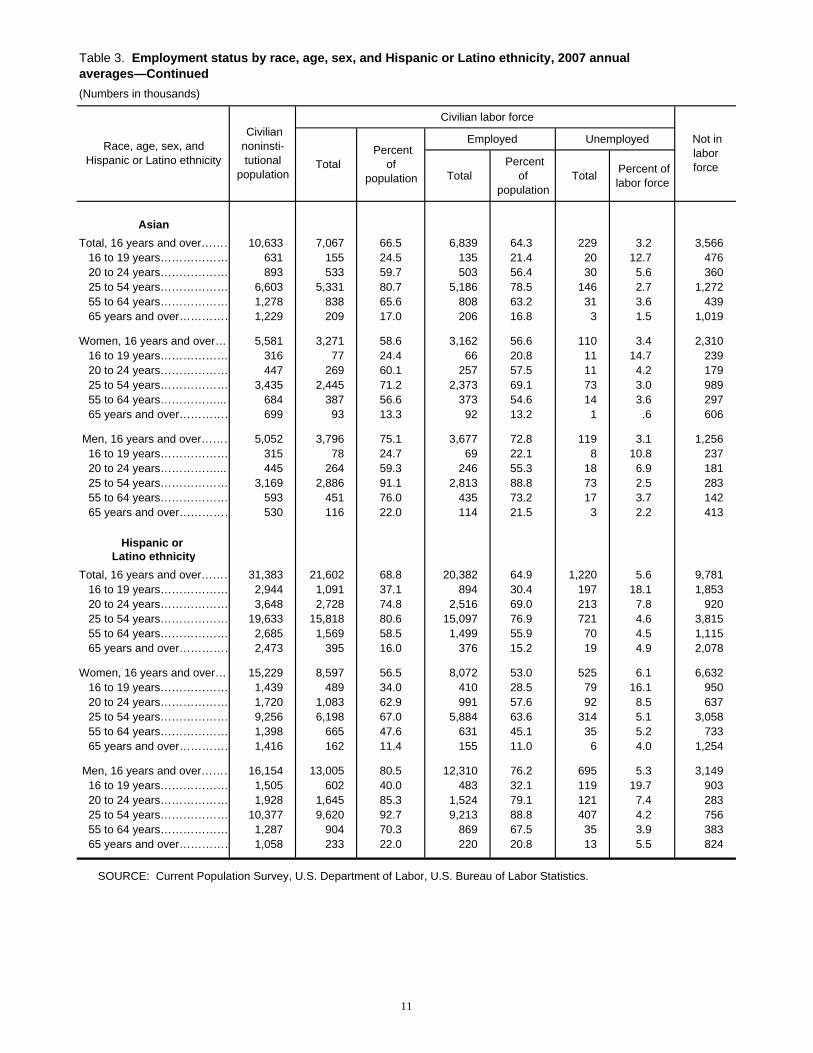
Table 3. Employment status by race, age, sex, and Hispanic or Latino ethnicity, 2007 annual averages—Continued(Numbers in thousands)
Civilian labor force
Employed Unemployed
Total Percent
of population
Total Percent of labor force
AsianTotal, 16 years and over……… 10,633 7,067 66.5 6,839 64.3 229 3.2 3,566 16 to 19 years……………… 631 155 24.5 135 21.4 20 12.7 476 20 to 24 years……………… 893 533 59.7 503 56.4 30 5.6 360 25 to 54 years……………… 6,603 5,331 80.7 5,186 78.5 146 2.7 1,272 55 to 64 years……………… 1,278 838 65.6 808 63.2 31 3.6 439 65 years and over…………… 1,229 209 17.0 206 16.8 3 1.5 1,019
Women, 16 years and over…… 5,581 3,271 58.6 3,162 56.6 110 3.4 2,310 16 to 19 years……………… 316 77 24.4 66 20.8 11 14.7 239 20 to 24 years……………… 447 269 60.1 257 57.5 11 4.2 179 25 to 54 years……………… 3,435 2,445 71.2 2,373 69.1 73 3.0 989 55 to 64 years……………...… 684 387 56.6 373 54.6 14 3.6 297 65 years and over…………… 699 93 13.3 92 13.2 1 .6 606
Men, 16 years and over……… 5,052 3,796 75.1 3,677 72.8 119 3.1 1,256 16 to 19 years……………… 315 78 24.7 69 22.1 8 10.8 237 20 to 24 years……………...… 445 264 59.3 246 55.3 18 6.9 181 25 to 54 years……………… 3,169 2,886 91.1 2,813 88.8 73 2.5 283 55 to 64 years……………… 593 451 76.0 435 73.2 17 3.7 142 65 years and over…………… 530 116 22.0 114 21.5 3 2.2 413
Hispanic or Latino ethnicity
Total, 16 years and over……… 31,383 21,602 68.8 20,382 64.9 1,220 5.6 9,781 16 to 19 years……………… 2,944 1,091 37.1 894 30.4 197 18.1 1,853 20 to 24 years……………… 3,648 2,728 74.8 2,516 69.0 213 7.8 920 25 to 54 years……………… 19,633 15,818 80.6 15,097 76.9 721 4.6 3,815 55 to 64 years……………… 2,685 1,569 58.5 1,499 55.9 70 4.5 1,115 65 years and over…………… 2,473 395 16.0 376 15.2 19 4.9 2,078
Women, 16 years and over…… 15,229 8,597 56.5 8,072 53.0 525 6.1 6,632 16 to 19 years……………… 1,439 489 34.0 410 28.5 79 16.1 950 20 to 24 years……………… 1,720 1,083 62.9 991 57.6 92 8.5 637 25 to 54 years……………… 9,256 6,198 67.0 5,884 63.6 314 5.1 3,058 55 to 64 years……………… 1,398 665 47.6 631 45.1 35 5.2 733 65 years and over…………… 1,416 162 11.4 155 11.0 6 4.0 1,254
Men, 16 years and over……… 16,154 13,005 80.5 12,310 76.2 695 5.3 3,149 16 to 19 years……………… 1,505 602 40.0 483 32.1 119 19.7 903 20 to 24 years……………… 1,928 1,645 85.3 1,524 79.1 121 7.4 283 25 to 54 years……………… 10,377 9,620 92.7 9,213 88.8 407 4.2 756 55 to 64 years……………… 1,287 904 70.3 869 67.5 35 3.9 383 65 years and over…………… 1,058 233 22.0 220 20.8 13 5.5 824
SOURCE: Current Population Survey, U.S. Department of Labor, U.S. Bureau of Labor Statistics.
Race, age, sex, and Hispanic or Latino ethnicity
Civilian noninsti-tutional
population
Not in labor force Total
Percent of
population
11

Table 4. Employment status by marital status and sex, 2007 annual averages(Numbers in thousands)
Civilian labor force
Employed Unemployed
Total Percent
of population
Total Percent of labor
force
Total
Total, 16 years and over…… 231,867 153,124 66.0 146,047 63.0 7,078 4.6 78,743 Married, spouse present…… 122,234 84,401 69.0 82,146 67.2 2,255 2.7 37,833 Unmarried, total…………… 109,633 68,723 62.7 63,901 58.3 4,822 7.0 40,910 Never married…………… 64,869 44,020 67.9 40,466 62.4 3,555 8.1 20,848 Other marital status……… 44,764 24,703 55.2 23,435 52.4 1,268 5.1 20,061 Divorced………………… 22,653 16,241 71.7 15,441 68.2 800 4.9 6,412 Separated………………… 8,107 5,677 70.0 5,325 65.7 352 6.2 2,430 Widowed……………….… 14,004 2,784 19.9 2,669 19.1 115 4.1 11,219
Women
Total, 16 years and over…… 119,694 70,988 59.3 67,792 56.6 3,196 4.5 48,707 Married, spouse present…… 60,474 36,881 61.0 35,832 59.3 1,049 2.8 23,593 Unmarried, total……….…… 59,220 34,107 57.6 31,960 54.0 2,146 6.3 25,113 Never married…………...… 30,219 19,745 65.3 18,322 60.6 1,422 7.2 10,475 Other marital status……… 29,001 14,362 49.5 13,638 47.0 724 5.0 14,639 Divorced………………… 13,292 9,346 70.3 8,904 67.0 441 4.7 3,946 Separated………………… 4,497 2,907 64.6 2,710 60.3 197 6.8 1,590 Widowed………………… 11,212 2,109 18.8 2,024 18.0 86 4.1 9,103
Men
Total, 16 years and over…… 112,173 82,136 73.2 78,254 69.8 3,882 4.7 30,036 Married, spouse present…… 61,760 47,520 76.9 46,314 75.0 1,206 2.5 14,240 Unmarried, total…………… 50,413 34,616 68.7 31,941 63.4 2,676 7.7 15,796 Never married…………… 34,650 24,276 70.1 22,143 63.9 2,132 8.8 10,374 Other marital status……… 15,763 10,341 65.6 9,797 62.2 544 5.3 5,423 Divorced………………… 9,362 6,895 73.7 6,537 69.8 358 5.2 2,466 Separated………………. 3,610 2,770 76.7 2,615 72.4 155 5.6 840 Widowed………………… 2,792 675 24.2 645 23.1 30 4.4 2,117
SOURCE: Current Population Survey, U.S. Department of Labor, U.S. Bureau of Labor Statistics.
Marital status and sex
Civilian noninsti-tutional
population
Not in labor force Total
Percent of
population
12

Table 5. Employment status by sex, presence and age of children, race, and Hispanic or Latino ethnicity, March 2007 (Numbers in thousands)
Civilian labor force
Employed Unemployed
Total Percent
of population
Total Percent of labor force
TotalWomen, 16 years and over…………….. 119,300 70,873 59.4 67,925 56.9 2,948 4.2 48,427 With children under 18 years old……… 37,647 26,834 71.3 25,646 68.1 1,188 4.4 10,813 With children 6 to 17, none younger… 20,502 15,940 77.7 15,341 74.8 599 3.8 4,562 With children under 6 years old……… 17,146 10,894 63.5 10,305 60.1 589 5.4 6,251 With children under 3 years old…… 10,000 6,006 60.1 5,679 56.8 327 5.5 3,994 With no children under 18 years old…… 81,653 44,039 53.9 42,279 51.8 1,760 4.0 37,614
Men, 16 years and over………………… 111,733 81,434 72.9 77,187 69.1 4,247 5.2 30,299 With children under 18 years old……… 28,771 27,092 94.2 26,236 91.2 856 3.2 1,679 With children 6 to 17, none younger… 15,667 14,572 93.0 14,119 90.1 453 3.1 1,095 With children under 6 years old……… 13,104 12,520 95.5 12,117 92.5 403 3.2 584 With children under 3 years old…… 7,790 7,461 95.8 7,209 92.5 252 3.4 329 With no children under 18 years old…… 82,961 54,342 65.5 50,950 61.4 3,392 6.2 28,619
WhiteWomen, 16 years and over……………… 95,929 56,674 59.1 54,594 56.9 2,081 3.7 39,255 With children under 18 years old……… 29,566 20,917 70.7 20,114 68.0 803 3.8 8,650 With children 6 to 17, none younger… 16,131 12,477 77.3 12,084 74.9 392 3.1 3,655 With children under 6 years old…….… 13,435 8,440 62.8 8,029 59.8 410 4.9 4,995 With children under 3 years old…… 7,923 4,716 59.5 4,477 56.5 239 5.1 3,207 With no children under 18 years old…… 66,363 35,758 53.9 34,480 52.0 1,278 3.6 30,605
Men, 16 years and over………………… 91,792 67,732 73.8 64,592 70.4 3,140 4.6 24,060 With children under 18 years old……… 23,996 22,758 94.8 22,101 92.1 657 2.9 1,237 With children 6 to 17, none younger… 13,057 12,266 93.9 11,917 91.3 349 2.8 791 With children under 6 years old……… 10,938 10,492 95.9 10,183 93.1 309 2.9 446 With children under 3 years old…… 6,586 6,322 96.0 6,127 93.0 196 3.1 264 With no children under 18 years old…… 67,797 44,974 66.3 42,492 62.7 2,482 5.5 22,823
Black or African American
Women, 16 years and over…………….. 15,055 9,259 61.5 8,629 57.3 630 6.8 5,796 With children under 18 years old……… 5,232 3,962 75.7 3,664 70.0 298 7.5 1,270 With children 6 to 17, none younger… 2,901 2,356 81.2 2,197 75.7 159 6.7 545 With children under 6 years old……… 2,331 1,606 68.9 1,467 62.9 140 8.7 724 With children under 3 years old…… 1,300 839 64.5 765 58.8 74 8.8 461 With no children under 18 years old…… 9,823 5,296 53.9 4,965 50.5 331 6.3 4,526
Men, 16 years and over………………… 12,291 8,070 65.7 7,266 59.1 804 10.0 4,221 With children under 18 years old……… 2,584 2,317 89.7 2,175 84.2 142 6.1 267 With children 6 to 17, none younger… 1,489 1,300 87.3 1,217 81.7 83 6.4 189 With children under 6 years old……… 1,095 1,017 92.8 958 87.5 59 5.8 78 With children under 3 years old…… 611 581 95.2 541 88.5 41 7.0 30 With no children under 18 years old…… 9,706 5,753 59.3 5,091 52.4 662 11.5 3,954
See note at end of table.
Characteristic
Civilian noninsti-tutional
population
Not in
labor force
Total Percent
of population
13
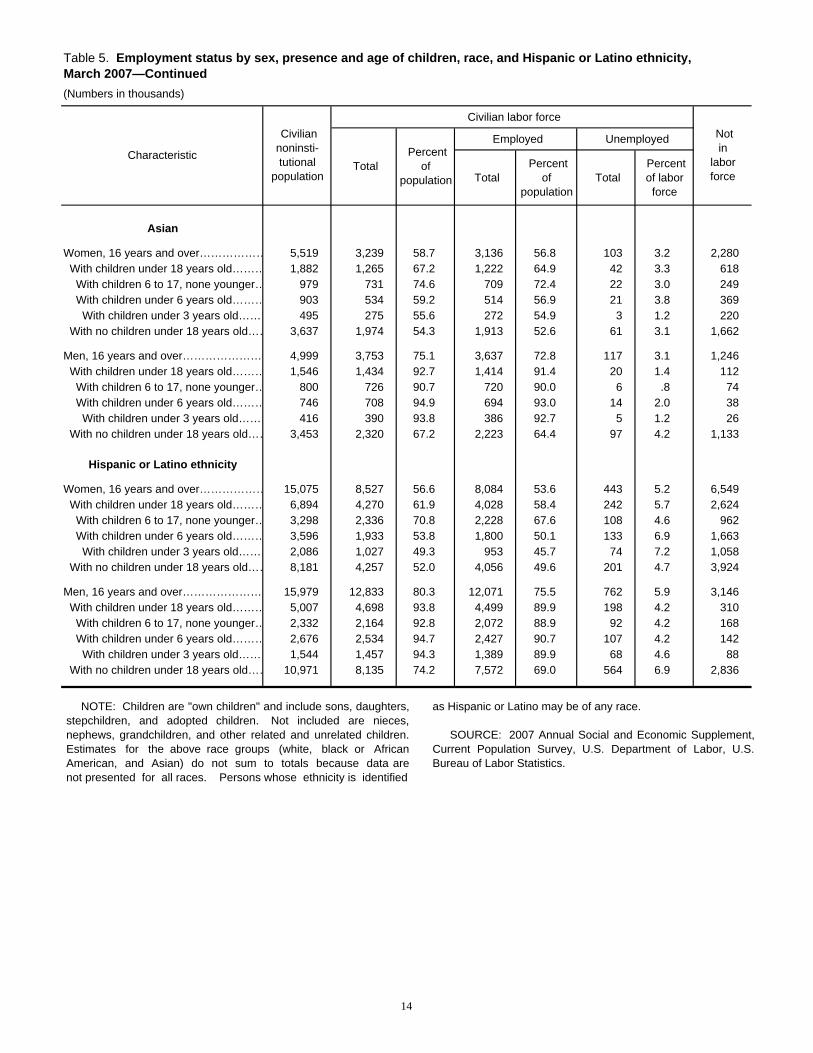
Table 5. Employment status by sex, presence and age of children, race, and Hispanic or Latino ethnicity, March 2007—Continued(Numbers in thousands)
Civilian labor force
Employed Unemployed
Total Percent
of population
Total Percent of labor force
Asian
Women, 16 years and over……………… 5,519 3,239 58.7 3,136 56.8 103 3.2 2,280 With children under 18 years old……… 1,882 1,265 67.2 1,222 64.9 42 3.3 618 With children 6 to 17, none younger… 979 731 74.6 709 72.4 22 3.0 249 With children under 6 years old……… 903 534 59.2 514 56.9 21 3.8 369 With children under 3 years old…… 495 275 55.6 272 54.9 3 1.2 220 With no children under 18 years old…… 3,637 1,974 54.3 1,913 52.6 61 3.1 1,662
Men, 16 years and over………………… 4,999 3,753 75.1 3,637 72.8 117 3.1 1,246 With children under 18 years old……… 1,546 1,434 92.7 1,414 91.4 20 1.4 112 With children 6 to 17, none younger… 800 726 90.7 720 90.0 6 .8 74 With children under 6 years old……… 746 708 94.9 694 93.0 14 2.0 38 With children under 3 years old…… 416 390 93.8 386 92.7 5 1.2 26 With no children under 18 years old…… 3,453 2,320 67.2 2,223 64.4 97 4.2 1,133
Hispanic or Latino ethnicity
Women, 16 years and over……………… 15,075 8,527 56.6 8,084 53.6 443 5.2 6,549 With children under 18 years old……… 6,894 4,270 61.9 4,028 58.4 242 5.7 2,624 With children 6 to 17, none younger… 3,298 2,336 70.8 2,228 67.6 108 4.6 962 With children under 6 years old……… 3,596 1,933 53.8 1,800 50.1 133 6.9 1,663 With children under 3 years old…… 2,086 1,027 49.3 953 45.7 74 7.2 1,058 With no children under 18 years old…… 8,181 4,257 52.0 4,056 49.6 201 4.7 3,924
Men, 16 years and over………………… 15,979 12,833 80.3 12,071 75.5 762 5.9 3,146 With children under 18 years old……… 5,007 4,698 93.8 4,499 89.9 198 4.2 310 With children 6 to 17, none younger… 2,332 2,164 92.8 2,072 88.9 92 4.2 168 With children under 6 years old……… 2,676 2,534 94.7 2,427 90.7 107 4.2 142 With children under 3 years old…… 1,544 1,457 94.3 1,389 89.9 68 4.6 88 With no children under 18 years old…… 10,971 8,135 74.2 7,572 69.0 564 6.9 2,836
Characteristic
Civilian noninsti-tutional
population
Not in
labor force
Total Percent
of population
NOTE: Children are "own children" and include sons, daughters,stepchildren, and adopted children. Not included are nieces,nephews, grandchildren, and other related and unrelated children.Estimates for the above race groups (white, black or AfricanAmerican, and Asian) do not sum to totals because data arenot presented for all races. Persons whose ethnicity is identified
as Hispanic or Latino may be of any race.
SOURCE: 2007 Annual Social and Economic Supplement,Current Population Survey, U.S. Department of Labor, U.S.Bureau of Labor Statistics.
14

Table 6. Employment status of women by presence and age of youngest child, marital status, race, and Hispanic or Latino ethnicity, March 2007(Numbers in thousands)
Civilian labor force
Employed Unemployed
Total, 16 years and over…………………… 119,300 70,873 59.4 67,925 56.9 2,948 4.2 48,427 With children under 18 years old………… 37,647 26,834 71.3 25,646 68.1 1,188 4.4 10,813 With children 6 to 17 years old, none younger………….………………… 20,502 15,940 77.7 15,341 74.8 599 3.8 4,562 With children under 6 years old………… 17,146 10,894 63.5 10,305 60.1 589 5.4 6,251 With children under 3 years old………… 10,000 6,006 60.1 5,679 56.8 327 5.5 3,994 With no children under 18 years old……… 81,653 44,039 53.9 42,279 51.8 1,760 4.0 37,614
Total, 16 years and over…………………… 60,656 37,335 61.6 36,370 60.0 965 2.6 23,320 With children under 18 years old………… 26,788 18,569 69.3 18,045 67.4 524 2.8 8,219 With children 6 to 17 years old, none younger………….………………… 14,319 10,905 76.2 10,638 74.3 267 2.5 3,414 With children under 6 years old………… 12,468 7,664 61.5 7,407 59.4 257 3.4 4,805 With children under 3 years old………… 7,408 4,353 58.8 4,215 56.9 138 3.2 3,055 With no children under 18 years old……… 33,868 18,766 55.4 18,326 54.1 441 2.3 15,102
Total, 16 years and over…………………… 58,645 33,538 57.2 31,555 53.8 1,983 5.9 25,107 With children under 18 years old………… 10,860 8,265 76.1 7,602 70.0 664 8.0 2,594 With children 6 to 17 years old, none younger………….………………… 6,182 5,035 81.4 4,703 76.1 331 6.6 1,148 With children under 6 years old………… 4,677 3,231 69.1 2,898 62.0 333 10.3 1,446 With children under 3 years old………… 2,592 1,653 63.8 1,464 56.5 189 11.4 939 With no children under 18 years old……… 47,785 25,273 52.9 23,953 50.1 1,319 5.2 22,512
Total, 16 years and over…………………… 95,929 56,674 59.1 54,594 56.9 2,081 3.7 39,255 With children under 18 years old………… 29,566 20,917 70.7 20,114 68.0 803 3.8 8,650 With children 6 to 17 years old, none younger………….………………… 16,131 12,477 77.3 12,084 74.9 392 3.1 3,655 With children under 6 years old………… 13,435 8,440 62.8 8,029 59.8 410 4.9 4,995 With children under 3 years old………… 7,923 4,716 59.5 4,477 56.5 239 5.1 3,207 With no children under 18 years old……… 66,363 35,758 53.9 34,480 52.0 1,278 3.6 30,605
Total, 16 years and over…………………… 51,921 31,687 61.0 30,937 59.6 750 2.4 20,234 With children under 18 years old………… 22,507 15,480 68.8 15,067 66.9 412 2.7 7,027 With children 6 to 17 years old, none younger………….………………… 12,013 9,093 75.7 8,887 74.0 206 2.3 2,919 With children under 6 years old………… 10,494 6,386 60.9 6,180 58.9 206 3.2 4,108 With children under 3 years old………… 6,304 3,666 58.1 3,551 56.3 115 3.1 2,639 With no children under 18 years old……… 29,414 16,207 55.1 15,870 54.0 337 2.1 13,207
Total, 16 years and over…………………… 44,008 24,987 56.8 23,656 53.8 1,331 5.3 19,021 With children under 18 years old………… 7,059 5,437 77.0 5,047 71.5 390 7.2 1,623 With children 6 to 17 years old, none younger………….………………… 4,119 3,383 82.1 3,198 77.6 186 5.5 735 With children under 6 years old………… 2,941 2,053 69.8 1,849 62.9 204 10.0 887 With children under 3 years old………… 1,619 1,050 64.9 926 57.2 124 11.8 569 With no children under 18 years old……… 36,949 19,551 52.9 18,610 50.4 941 4.8 17,398
See footnote at end of table.
White, married, spouse present
White, other marital statuses1
Total, all marital statuses
Total, married, spouse present
Total, other marital statuses1
White, all marital statuses
Presence and age of children
Civilian noninsti-tutional
population
Not in
labor force
Total Percent
of population Total
Percent of
population Total
Percent of labor force
15

Table 6. Employment status of women by presence and age of youngest child, marital status, race, and Hispanicor Latino ethnicity, March 2007—Continued(Numbers in thousands)
Civilian labor force
Employed Unemployed
Total, 16 years and over…………………… 15,055 9,259 61.5 8,629 57.3 630 6.8 5,796 With children under 18 years old………… 5,232 3,962 75.7 3,664 70.0 298 7.5 1,270 With children 6 to 17 years old, none younger………….………………… 2,901 2,356 81.2 2,197 75.7 159 6.7 545 With children under 6 years old………… 2,331 1,606 68.9 1,467 62.9 140 8.7 724 With children under 3 years old………… 1,300 839 64.5 765 58.8 74 8.8 461 With no children under 18 years old……… 9,823 5,296 53.9 4,965 50.5 331 6.3 4,526
Total, 16 years and over…………………… 4,323 2,941 68.0 2,826 65.4 115 3.9 1,382 With children under 18 years old………… 2,052 1,613 78.6 1,555 75.8 58 3.6 439 With children 6 to 17 years old, none younger………….………………… 1,192 996 83.6 966 81.1 30 3.0 195 With children under 6 years old………… 860 617 71.7 589 68.5 28 4.5 243 With children under 3 years old………… 474 326 68.9 312 66.0 14 4.3 147 With no children under 18 years old……… 2,271 1,327 58.5 1,271 56.0 57 4.3 943
Total, 16 years and over…………………… 10,732 6,318 58.9 5,803 54.1 515 8.2 4,414 With children under 18 years old………… 3,180 2,349 73.9 2,109 66.3 241 10.2 831 With children 6 to 17 years old, none younger………….………………… 1,710 1,360 79.5 1,231 72.0 129 9.5 350 With children under 6 years old………… 1,470 989 67.3 877 59.7 112 11.3 481 With children under 3 years old………… 826 512 62.0 452 54.8 60 11.7 314 With no children under 18 years old……… 7,552 3,969 52.6 3,694 48.9 274 6.9 3,583
Total, 16 years and over…………………… 5,519 3,239 58.7 3,136 56.8 103 3.2 2,280 With children under 18 years old………… 1,882 1,265 67.2 1,222 64.9 42 3.3 618 With children 6 to 17 years old, none younger………….………………… 979 731 74.6 709 72.4 22 3.0 249 With children under 6 years old………… 903 534 59.2 514 56.9 21 3.8 369 With children under 3 years old………… 495 275 55.6 272 54.9 3 1.2 220 With no children under 18 years old……… 3,637 1,974 54.3 1,913 52.6 61 3.1 1,662
Total, 16 years and over…………………… 3,301 2,006 60.8 1,945 58.9 60 3.0 1,295 With children under 18 years old………… 1,668 1,085 65.1 1,053 63.1 32 3.0 583 With children 6 to 17 years old, none younger………….………………… 846 615 72.7 597 70.5 18 3.0 231 With children under 6 years old………… 822 470 57.2 456 55.5 14 2.9 352 With children under 3 years old………… 456 250 54.7 246 54.0 3 1.4 207 With no children under 18 years old……… 1,633 920 56.4 892 54.7 28 3.0 712
Total, 16 years and over…………………… 2,218 1,233 55.6 1,190 53.7 43 3.5 985 With children under 18 years old………… 214 180 83.8 169 79.1 10 5.6 35 With children 6 to 17 years old, none younger………….………………… 133 115 86.6 112 84.1 3 2.9 18 With children under 6 years old………… 81 64 79.1 57 70.8 7 10.5 17 With children under 3 years old………… 39 25 65.3 25 65.3 - - 14 With no children under 18 years old……… 2,004 1,054 52.6 1,021 50.9 33 3.1 950
See footnote at end of table.
Asian, all marital statuses
Asian, married, spouse present
Asian, other marital statuses1
Percent of labor force
Black or African American, all marital statuses
Black or African American, married, spouse present
Black or African American, other marital statuses1
Presence and age of children
Civilian noninsti-tutional
population
Not in
labor force
Total Percent
of population Total
Percent of
population Total
16

Table 6. Employment status of women by presence and age of youngest child, marital status, race, and Hispanicor Latino ethnicity, March 2007—Continued(Numbers in thousands)
Civilian labor force
Employed Unemployed
Total, 16 years and over…………………… 15,075 8,527 56.6 8,084 53.6 443 5.2 6,549 With children under 18 years old………… 6,894 4,270 61.9 4,028 58.4 242 5.7 2,624 With children 6 to 17 years old, none younger………….………………… 3,298 2,336 70.8 2,228 67.6 108 4.6 962 With children under 6 years old………… 3,596 1,933 53.8 1,800 50.1 133 6.9 1,663 With children under 3 years old………… 2,086 1,027 49.3 953 45.7 74 7.2 1,058 With no children under 18 years old……… 8,181 4,257 52.0 4,056 49.6 201 4.7 3,924
Total, 16 years and over…………………… 7,455 4,084 54.8 3,930 52.7 155 3.8 3,371 With children under 18 years old………… 4,702 2,676 56.9 2,568 54.6 108 4.0 2,026 With children 6 to 17 years old, none younger………….………………… 2,178 1,445 66.3 1,388 63.8 56 3.9 733 With children under 6 years old………… 2,524 1,231 48.8 1,180 46.7 52 4.2 1,292 With children under 3 years old………… 1,496 677 45.3 651 43.5 26 3.9 819 With no children under 18 years old……… 2,753 1,409 51.2 1,361 49.4 47 3.3 1,345
Total, 16 years and over…………………… 7,620 4,442 58.3 4,154 54.5 288 6.5 3,178 With children under 18 years old………… 2,193 1,594 72.7 1,460 66.6 134 8.4 599 With children 6 to 17 years old, none younger………….………………… 1,120 892 79.6 839 74.9 52 5.9 228 With children under 6 years old………… 1,072 702 65.5 620 57.8 82 11.6 370 With children under 3 years old………… 590 351 59.4 303 51.3 48 13.7 239 With no children under 18 years old……… 5,428 2,848 52.5 2,694 49.6 154 5.4 2,579
Hispanic or Latino, other marital statuses1
Total Percent of labor force
Hispanic or Latino, all marital statuses
Hispanic or Latino, married, spouse present
Presence and age of children
Civilian noninsti-tutional
population
Not in
labor force
Total Percent
of population Total
Percent of
population
1 Includes never-married, divorced, separated, and widowedpersons.
NOTE: Children are "own children" and include sons,daughters, stepchildren, and adopted children. Not includedare nieces, nephews, grandchildren, and other related andunrelated children. Detail for the above race groups (white,
black or African American, and Asian) do not sum to totals becausedata are not presented for all races. Persons whose ethnicity isidentified as Hispanic or Latino may be of any race.
SOURCE: Current Population Survey, U.S. Department ofLabor, U.S. Bureau of Labor Statistics.
17

Table 7. Employment status of women by presence and age of youngest child, March 1975-2007(Numbers in thousands)
1975...…… 14,616 47.4 13,069 1,548 11.0 8,917 54.9 8,218 700 7.9 1976...…… 15,073 48.8 13,725 1,346 8.9 9,388 56.2 8,769 621 6.6 1977……… 15,669 50.8 14,276 1,393 8.9 10,040 58.3 9,389 650 6.5 1978……… 16,385 53.0 15,142 1,242 7.6 10,401 60.0 9,845 556 5.3 1979...…… 16,883 54.5 15,624 1,259 7.7 10,646 61.6 10,030 615 5.8
1980……… 17,790 56.6 16,526 1,264 7.1 11,252 64.3 10,640 612 5.4 1981...…… 18,422 58.1 16,952 1,471 8.0 11,490 65.5 10,725 765 6.7 1982...…… 18,744 58.5 16,854 1,890 10.1 11,377 65.8 10,440 936 8.2 1983...…… 18,924 58.9 16,792 2,131 11.3 11,340 66.3 10,303 1,037 9.1 1984……… 19,555 60.5 17,782 1,773 9.1 11,538 68.1 10,739 799 6.9 1985……… 20,041 62.1 18,306 1,735 8.7 11,826 69.9 10,984 842 7.1 1986……… 20,620 62.8 18,922 1,698 8.2 12,075 70.4 11,320 756 6.3 1987……… 21,422 64.7 19,798 1,624 7.6 12,438 72.0 11,661 778 6.3 1988……… 21,545 65.1 20,141 1,404 6.5 12,683 73.3 12,042 641 5.1 1989……… 21,936 65.7 20,647 1,289 5.9 12,800 74.2 12,168 632 4.9
1990...…… 22,196 66.7 20,865 1,331 6.0 12,799 74.7 12,133 666 5.2 1991...…… 22,327 66.6 20,774 1,552 7.0 12,691 74.4 12,017 674 5.3 1992...…… 22,756 67.2 21,052 1,704 7.5 13,183 75.9 12,391 793 6.0 1993……… 23,063 66.9 21,521 1,541 6.7 13,441 75.4 12,757 684 5.1 1994……… 24,191 68.4 22,467 1,724 7.1 13,863 76.0 13,074 789 5.7 1995……… 24,695 69.7 23,195 1,500 6.1 14,300 76.4 13,608 691 4.8 1996……… 24,720 70.2 23,386 1,334 5.4 14,427 77.2 13,794 633 4.4 1997……… 25,604 72.1 24,082 1,522 5.9 14,993 78.1 14,282 711 4.7 1998...…… 25,647 72.3 24,209 1,438 5.6 15,028 78.4 14,370 658 4.4 1999……… 25,472 72.1 24,307 1,165 4.6 15,150 78.5 14,633 516 3.4
2000...…… 25,795 72.9 24,693 1,102 4.3 15,479 79.0 14,931 549 3.5 2001...…… 26,269 72.7 25,030 1,239 4.7 15,839 79.4 15,220 619 3.9 2002……… 26,140 72.2 24,612 1,529 5.8 15,948 78.6 15,171 777 4.9 2003...…… 26,202 71.7 24,598 1,603 6.1 15,993 78.7 15,166 828 5.2 2004……… 25,913 70.7 24,413 1,501 5.8 15,782 77.5 15,006 776 4.9 2005……… 25,941 70.5 24,564 1,377 5.3 15,594 76.9 14,930 663 4.3 2006...…… 26,009 70.6 24,728 1,281 4.9 15,579 76.9 14,949 630 4.0 2007...…… 26,834 71.3 25,646 1,188 4.4 15,940 77.7 15,341 599 3.8
See note at end of table.
Percent of
populationTotal
Percent of labor
force
Percent of
populationTotal
Percent of labor
forceTotal
Year
With own children under age 18 With own children ages 6 to 17, none younger
Civilian labor force
Employed
Unemployed Civilian labor force
Employed
Unemployed
Total
18

Table 7. Employment status of women by presence and age of youngest child, March 1975-2007—Continued(Numbers in thousands)
1975...…… 5,699 39.0 4,851 848 14.9 2,824 34.3 2,326 500 17.7 1976...…… 5,684 40.1 4,957 727 12.8 2,702 34.1 2,285 418 15.5 1977……… 5,629 41.2 4,887 742 13.2 2,795 35.4 2,371 424 15.2 1978……… 5,983 44.0 5,297 687 11.5 3,179 39.4 2,768 411 12.9 1979...…… 6,238 45.7 5,594 644 10.3 3,380 41.1 2,979 401 11.9
1980……… 6,538 46.8 5,886 652 10.0 3,565 41.9 3,167 398 11.2 1981...…… 6,933 48.9 6,227 706 10.2 3,826 44.3 3,380 446 11.7 1982...…… 7,367 49.9 6,414 953 12.9 4,133 45.6 3,542 591 14.3 1983...…… 7,583 50.5 6,489 1,094 14.4 4,233 46.0 3,551 682 16.1 1984……… 8,017 52.1 7,043 974 12.1 4,401 47.6 3,839 562 12.8 1985……… 8,215 53.5 7,322 893 10.9 4,601 49.5 4,089 513 11.1 1986……… 8,545 54.4 7,602 943 11.0 4,786 50.8 4,227 559 11.7 1987……… 8,983 56.7 8,137 846 9.4 5,064 52.9 4,570 494 9.8 1988……… 8,862 56.1 8,099 763 8.6 4,947 52.4 4,477 470 9.5 1989……… 9,136 56.7 8,478 657 7.2 5,053 52.4 4,671 381 7.5
1990...…… 9,397 58.2 8,732 664 7.1 5,216 53.6 4,823 393 7.5 1991...…… 9,636 58.4 8,758 878 9.1 5,417 54.5 4,868 550 10.1 1992...…… 9,573 58.0 8,662 911 9.5 5,329 54.5 4,776 553 10.4 1993……… 9,621 57.9 8,764 857 8.9 5,349 53.9 4,857 492 9.2 1994……… 10,328 60.3 9,394 935 9.0 5,724 57.1 5,165 559 9.8 1995……… 10,395 62.3 9,587 809 7.8 5,650 58.7 5,172 478 8.5 1996……… 10,293 62.3 9,592 701 6.8 5,619 59.0 5,222 397 7.1 1997……… 10,610 65.0 9,800 810 7.6 5,839 61.8 5,366 473 8.1 1998...…… 10,619 65.2 9,839 780 7.3 5,882 62.2 5,454 428 7.3 1999……… 10,322 64.4 9,674 648 6.3 5,645 60.7 5,285 359 6.4
2000...…… 10,316 65.3 9,763 553 5.4 5,670 61.0 5,350 320 5.6 2001...…… 10,430 64.4 9,810 620 5.9 5,743 60.7 5,350 393 6.8 2002……… 10,193 64.1 9,441 752 7.4 5,600 60.5 5,160 440 7.9 2003...…… 10,209 62.9 9,433 776 7.6 5,568 58.7 5,112 456 8.2 2004……… 10,131 62.2 9,407 724 7.1 5,401 57.3 4,983 417 7.7 2005……… 10,347 62.6 9,634 714 6.9 5,704 58.9 5,299 405 7.1 2006...…… 10,430 63.0 9,779 651 6.2 5,842 59.9 5,458 384 6.6 2007...…… 10,894 63.5 10,305 589 5.4 6,006 60.1 5,679 327 5.5
See note at end of table.
Employed
Unemployed
TotalPercent
of population
TotalPercent of labor
forceTotal
Percent of
populationTotal
Percent of labor
force
Year
With own children under age 6 With own children under age 3
Civilian labor force
Employed
Unemployed Civilian labor force
19

Table 7. Employment status of women by presence andage of youngest child, March 1975-2007—Continued(Numbers in thousands)
1975...…… 22,365 45.1 20,381 1,984 8.9 1976...…… 23,327 45.7 21,389 1,938 8.3 1977……… 24,385 46.4 22,348 2,037 8.4 1978……… 25,362 47.0 23,631 1,731 6.8 1979...…… 26,962 48.6 25,285 1,677 6.2
1980……… 27,144 48.1 25,375 1,769 6.5 1981...…… 27,992 48.7 25,934 2,059 7.4 1982...…… 28,351 48.6 26,041 2,311 8.2 1983...…… 28,856 48.7 26,373 2,483 8.6 1984……… 29,684 49.3 27,652 2,032 6.8 1985……… 30,850 50.4 28,814 2,036 6.6 1986……… 31,112 50.5 29,107 2,005 6.4 1987……… 31,538 50.5 29,688 1,850 5.9 1988……… 32,490 51.2 30,911 1,580 4.9 1989……… 33,255 51.9 31,761 1,495 4.5
1990...…… 33,942 52.3 32,391 1,551 4.6 1991...…… 34,047 52.0 32,167 1,880 5.5 1992...…… 34,487 52.3 32,481 2,006 5.8 1993……… 34,495 52.1 32,476 2,020 5.9 1994……… 35,455 53.1 33,345 2,110 6.0 1995……… 35,843 52.9 34,054 1,789 5.0 1996……… 36,509 53.0 34,698 1,811 5.0 1997……… 37,295 53.6 35,572 1,723 4.6 1998...…… 38,253 54.1 36,680 1,573 4.1 1999……… 39,314 54.3 37,587 1,727 4.4
2000...…… 40,142 54.8 38,408 1,733 4.3 2001...…… 40,996 54.4 39,363 1,633 4.0 2002……… 41,278 54.0 39,038 2,241 5.4 2003...…… 42,039 54.1 39,667 2,372 5.6 2004……… 42,289 53.8 40,000 2,289 5.4 2005……… 42,677 53.5 40,570 2,107 4.9 2006...…… 43,392 53.6 41,440 1,952 4.5 2007...…… 44,039 53.9 42,279 1,760 4.0
Year
With no own children under age 18
Civilian labor force
Employed
Unemployed
TotalPercent
of population
TotalPercent of labor
force
NOTE: "Own children" include sons, daughters, stepchildren,and adopted children. Not included are nieces, nephews,grandchildren, and other related and unrelated children. Datafor 1994 and subsequent years are not directly comparable withdata for 1993 and earlier years because of the introduction of amajor redesign of the Current Population Survey.
SOURCE: Current Population Survey, U.S. Department ofLabor, U.S. Bureau of Labor Statistics.
20

Table 8. Employment status of the civilian noninstitutional population 25 to 64 years of age by educational attainment and sex, 2007 annual averages (Numbers in thousands)
Civilian labor force
Employed Unemployed
Total Percent
of population
Total Percent of labor
force
Total
Total, 25 to 64 years………………...…… 158,230 125,104 79.1 120,558 76.2 4,545 3.6 33,126 Less than a high school diploma……… 18,309 11,651 63.6 10,801 59.0 850 7.3 6,658 High school graduates, no college1…… 47,949 36,569 76.3 34,947 72.9 1,622 4.4 11,380 Some college or associate degree…… 42,625 34,599 81.2 33,371 78.3 1,227 3.5 8,026 College graduates, total………………. 49,347 42,285 85.7 41,439 84.0 846 2.0 7,062 Bachelor's degree……………………… 32,755 27,783 84.8 27,174 83.0 609 2.2 4,972 Master's degree………………………. 12,014 10,348 86.1 10,166 84.6 182 1.8 1,666 Professional degree…………………… 2,618 2,371 90.6 2,340 89.4 31 1.3 247 Doctoral degree………………………… 1,960 1,784 91.0 1,759 89.7 25 1.4 177
Women
Total, 25 to 64 years……………………. 80,491 57,791 71.8 55,675 69.2 2,116 3.7 22,700 Less than a high school diploma……… 8,538 4,124 48.3 3,770 44.2 354 8.6 4,414 High school graduates, no college1…… 23,771 16,139 67.9 15,440 65.0 699 4.3 7,633 Some college or associate degree…… 22,905 17,382 75.9 16,740 73.1 642 3.7 5,523 College graduates, total………………… 25,277 20,146 79.7 19,726 78.0 421 2.1 5,131 Bachelor's degree……………………. 17,013 13,320 78.3 13,022 76.5 298 2.2 3,694 Master's degree………………………. 6,539 5,338 81.6 5,238 80.1 100 1.9 1,201 Professional degree…………………… 1,017 868 85.3 855 84.1 13 1.5 149 Doctoral degree………………………… 708 621 87.7 611 86.3 10 1.6 87
Men
Total, 25 to 64 years……………………… 77,739 67,313 86.6 64,883 83.5 2,429 3.6 10,426 Less than a high school diploma……… 9,772 7,527 77.0 7,031 72.0 496 6.6 2,244 High school graduates, no college1…… 24,178 20,431 84.5 19,507 80.7 924 4.5 3,747 Some college or associate degree…… 19,720 17,216 87.3 16,631 84.3 585 3.4 2,504 College graduates, total………………… 24,070 22,138 92.0 21,714 90.2 425 1.9 1,931 Bachelor's degree……………………. 15,741 14,463 91.9 14,152 89.9 311 2.2 1,278 Master's degree…………………...…… 5,475 5,010 91.5 4,929 90.0 81 1.6 465 Professional degree………………….. 1,601 1,503 93.9 1,485 92.8 18 1.2 98 Doctoral degree………………………… 1,252 1,162 92.8 1,148 91.7 15 1.3 90
1 Includes persons with a high school diploma or equivalent.
SOURCE: Current Population Survey, U.S. Department of Labor, U.S. Bureau of Labor Statistics.
Educational attainment and sex
Civilian noninsti-tutional
population
Not in
labor force
Total Percent
of population
21

Table 9. Percent distribution of the civilian labor force 25 to 64 years of age by educational attainment and sex, 1970-2007 annual averages
High school College
Less than 4 years
4 years, no college 1 to 3 years 4 years or
more
1970 …...……… 61,765 100.0 36.1 38.1 11.8 14.11971…...……… 62,344 100.0 34.5 38.4 12.3 14.81972…...……… 63,704 100.0 33.3 38.8 12.4 15.51973…...……… 64,775 100.0 30.9 39.7 13.0 16.41974…...……… 66,527 100.0 29.3 39.5 13.7 17.51975…...……… 67,774 100.0 27.5 39.7 14.4 18.31976…...……… 69,243 100.0 25.8 39.6 15.2 19.41977…...……… 71,324 100.0 24.9 39.2 15.7 20.21978…...……… 73,504 100.0 23.7 39.2 16.5 20.61979…...……… 75,781 100.0 21.8 39.5 17.3 21.31980…...……… 78,010 100.0 20.6 39.8 17.6 22.01981…...……… 80,273 100.0 19.7 40.6 17.7 22.01982…...……… 81,516 100.0 18.8 40.8 17.3 23.11983…….......... 83,615 100.0 17.8 39.9 18.1 24.21984…….......... 86,001 100.0 16.7 40.2 18.4 24.71985…...……… 88,424 100.0 15.9 40.2 19.0 24.91986…...……… 90,500 100.0 15.5 40.2 19.5 24.81987…...……… 92,966 100.0 14.9 40.2 19.7 25.31988…….......... 94,870 100.0 14.7 39.9 19.7 25.71989…...……… 97,318 100.0 14.0 39.6 20.0 26.41990…….......... 99,175 100.0 13.4 39.5 20.7 26.41991…...……… 100,480 100.0 13.0 39.4 21.1 26.5
TotalLess than a high school
diploma
High school graduates, no college 2
Some college, no degree, or associate
degree
College graduates 3
1992…………… 103,018 100.0 12.1 35.7 25.6 26.61993…...……… 104,237 100.0 11.3 35.1 26.6 27.01994…...……… 105,610 100.0 10.8 33.9 27.7 27.61995…….......... 107,032 100.0 10.4 33.2 28.1 28.31996…...……… 108,932 100.0 10.6 32.9 27.8 28.71997…….......... 110,945 100.0 10.6 32.9 27.5 29.01998…….......... 111,932 100.0 10.5 32.4 27.4 29.81999…...……… 113,095 100.0 10.0 31.8 27.6 30.52000…...……… 115,750 100.0 10.1 31.4 27.8 30.72001…...……… 116,893 100.0 10.1 30.9 28.0 31.02002…...……… 118,028 100.0 10.0 30.7 27.7 31.62003…….......... 119,621 100.0 9.9 30.3 27.6 32.12004…...……… 120,135 100.0 9.7 30.1 27.7 32.42005…………… 121,752 100.0 9.8 29.9 27.8 32.52006…………… 123,550 100.0 9.7 29.6 27.7 33.02007…………… 125,104 100.0 9.3 29.2 27.7 33.8
See footnotes at end of table.
YearCivilian labor
force (thousands)
Percent distribution
Total
Total, both sexes
YearCivilian labor
force (thousands)
Percent distribution
Total, both sexes
1
4
22
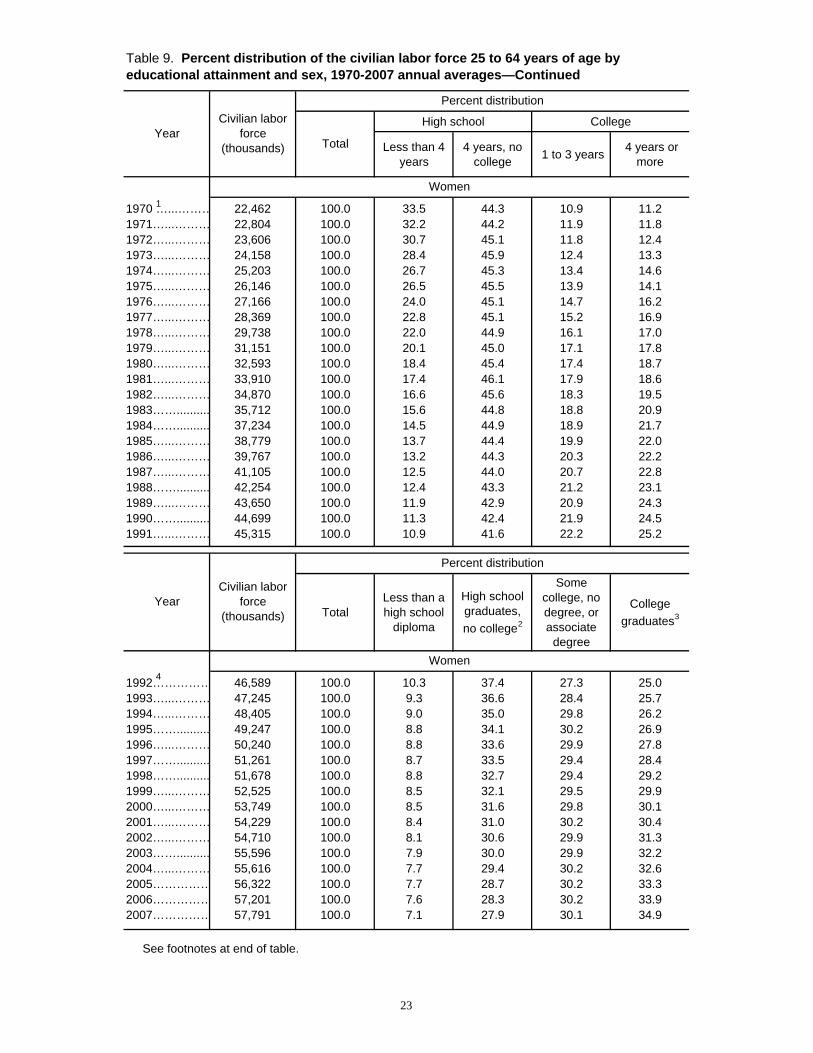
Table 9. Percent distribution of the civilian labor force 25 to 64 years of age by educational attainment and sex, 1970-2007 annual averages—Continued
High school College
Less than 4 years
4 years, no college 1 to 3 years 4 years or
more
1970 …...……… 22,462 100.0 33.5 44.3 10.9 11.21971…...……… 22,804 100.0 32.2 44.2 11.9 11.81972…...……… 23,606 100.0 30.7 45.1 11.8 12.41973…...……… 24,158 100.0 28.4 45.9 12.4 13.31974…...……… 25,203 100.0 26.7 45.3 13.4 14.61975…...……… 26,146 100.0 26.5 45.5 13.9 14.11976…...……… 27,166 100.0 24.0 45.1 14.7 16.21977…...……… 28,369 100.0 22.8 45.1 15.2 16.91978…...……… 29,738 100.0 22.0 44.9 16.1 17.01979…...……… 31,151 100.0 20.1 45.0 17.1 17.81980…...……… 32,593 100.0 18.4 45.4 17.4 18.71981…...……… 33,910 100.0 17.4 46.1 17.9 18.61982…...……… 34,870 100.0 16.6 45.6 18.3 19.51983…….......... 35,712 100.0 15.6 44.8 18.8 20.91984…….......... 37,234 100.0 14.5 44.9 18.9 21.71985…...……… 38,779 100.0 13.7 44.4 19.9 22.01986…...……… 39,767 100.0 13.2 44.3 20.3 22.21987…...……… 41,105 100.0 12.5 44.0 20.7 22.81988…….......... 42,254 100.0 12.4 43.3 21.2 23.11989…...……… 43,650 100.0 11.9 42.9 20.9 24.31990…….......... 44,699 100.0 11.3 42.4 21.9 24.51991…...……… 45,315 100.0 10.9 41.6 22.2 25.2
TotalLess than a high school
diploma
High school graduates, no college2
Some college, no degree, or associate
degree
College graduates3
1992…………… 46,589 100.0 10.3 37.4 27.3 25.01993…...……… 47,245 100.0 9.3 36.6 28.4 25.71994…...……… 48,405 100.0 9.0 35.0 29.8 26.21995…….......... 49,247 100.0 8.8 34.1 30.2 26.91996…...……… 50,240 100.0 8.8 33.6 29.9 27.81997…….......... 51,261 100.0 8.7 33.5 29.4 28.41998…….......... 51,678 100.0 8.8 32.7 29.4 29.21999…...……… 52,525 100.0 8.5 32.1 29.5 29.92000…...……… 53,749 100.0 8.5 31.6 29.8 30.12001…...……… 54,229 100.0 8.4 31.0 30.2 30.42002…...……… 54,710 100.0 8.1 30.6 29.9 31.32003…….......... 55,596 100.0 7.9 30.0 29.9 32.22004…...……… 55,616 100.0 7.7 29.4 30.2 32.62005…………… 56,322 100.0 7.7 28.7 30.2 33.32006…………… 57,201 100.0 7.6 28.3 30.2 33.92007…………… 57,791 100.0 7.1 27.9 30.1 34.9
See footnotes at end of table.
YearCivilian labor
force (thousands)
Percent distribution
Total
Women
YearCivilian labor
force (thousands)
Percent distribution
Women
1
4
23

Table 9. Percent distribution of the civilian labor force 25 to 64 years of age by educational attainment and sex, 1970-2007 annual averages—Continued
High school College
Less than 4 years
4 years, no college 1 to 3 years 4 years or
more
1970 …...……… 39,303 100.0 37.5 34.5 12.2 15.71971…...……… 39,539 100.0 35.9 35.1 12.5 16.51972…...……… 40,098 100.0 34.8 35.1 12.8 17.31973…...……… 40,617 100.0 32.4 36.0 13.4 18.21974…...……… 41,344 100.0 30.8 36.0 13.9 19.31975…...……… 41,628 100.0 28.9 36.1 14.8 20.21976…...……… 42,077 100.0 27.0 36.0 15.5 21.51977…...……… 42,954 100.0 26.3 35.3 16.1 22.31978…...……… 43,766 100.0 24.8 35.3 16.9 23.01979…...……… 44,630 100.0 23.0 35.7 17.5 23.81980…...……… 45,417 100.0 22.2 35.7 17.7 24.31981…...……… 46,363 100.0 21.5 36.5 17.4 24.61982…...……… 47,144 100.0 20.3 36.8 17.5 25.51983…….......... 47,903 100.0 19.4 36.3 17.7 26.61984…….......... 48,767 100.0 18.4 36.7 18.0 26.91985…...……… 49,647 100.0 17.7 36.9 18.3 27.11986…...……… 50,733 100.0 17.2 37.0 18.9 26.91987…...……… 51,860 100.0 16.8 37.1 18.9 27.21988…….......... 52,616 100.0 16.5 37.3 18.5 27.81989…...……… 53,668 100.0 15.7 36.9 19.2 28.21990…….......... 54,476 100.0 15.1 37.2 19.7 28.01991…...……… 55,165 100.0 14.7 37.5 20.2 27.6
See footnotes at end of table.
YearCivilian labor
force (thousands)
Percent distribution
Total
Men1
24
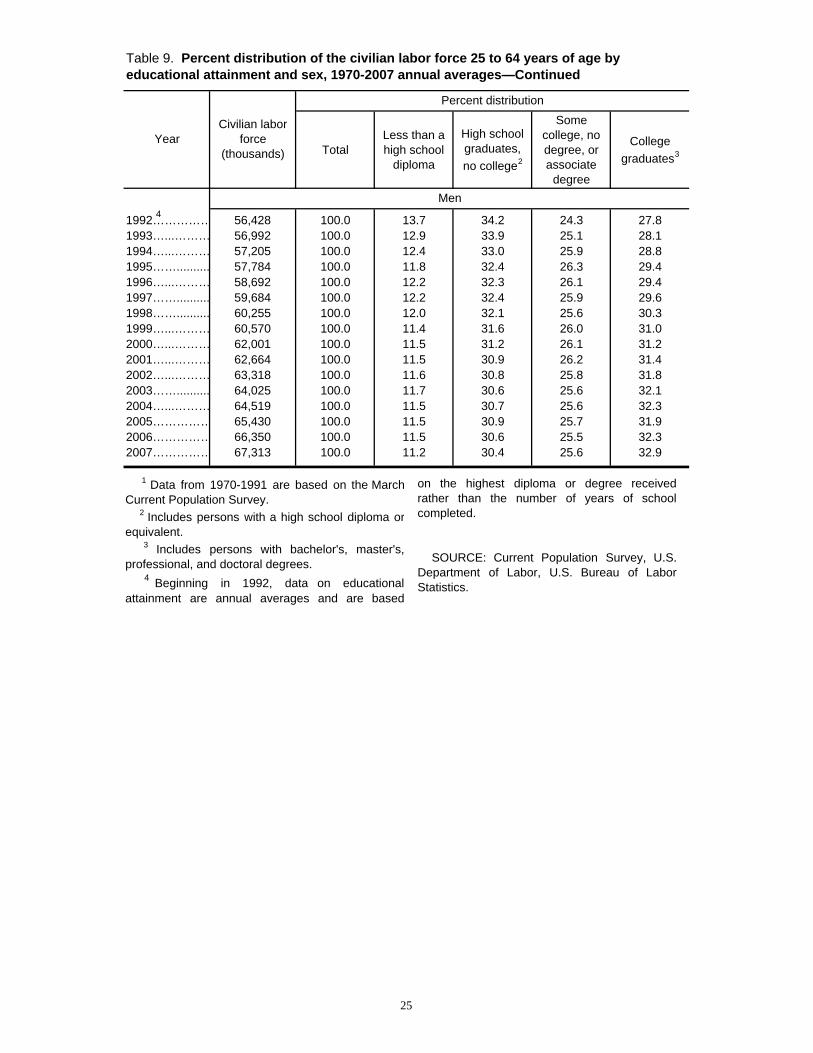
Table 9. Percent distribution of the civilian labor force 25 to 64 years of age by educational attainment and sex, 1970-2007 annual averages—Continued
TotalLess than a high school
diploma
High school graduates, no college2
Some college, no degree, or associate
degree
College graduates3
1992…………… 56,428 100.0 13.7 34.2 24.3 27.81993…...……… 56,992 100.0 12.9 33.9 25.1 28.11994…...……… 57,205 100.0 12.4 33.0 25.9 28.81995…….......... 57,784 100.0 11.8 32.4 26.3 29.41996…...……… 58,692 100.0 12.2 32.3 26.1 29.41997…….......... 59,684 100.0 12.2 32.4 25.9 29.61998…….......... 60,255 100.0 12.0 32.1 25.6 30.31999…...……… 60,570 100.0 11.4 31.6 26.0 31.02000…...……… 62,001 100.0 11.5 31.2 26.1 31.22001…...……… 62,664 100.0 11.5 30.9 26.2 31.42002…...……… 63,318 100.0 11.6 30.8 25.8 31.82003…….......... 64,025 100.0 11.7 30.6 25.6 32.12004…...……… 64,519 100.0 11.5 30.7 25.6 32.32005…………… 65,430 100.0 11.5 30.9 25.7 31.92006…………… 66,350 100.0 11.5 30.6 25.5 32.32007…………… 67,313 100.0 11.2 30.4 25.6 32.9
Men
YearCivilian labor
force (thousands)
Percent distribution
1 Data from 1970-1991 are based on the MarchCurrent Population Survey.
2 Includes persons with a high school diploma orequivalent.
3 Includes persons with bachelor's, master's,professional, and doctoral degrees.
4 Beginning in 1992, data on educationalattainment are annual averages and are based
4
on the highest diploma or degree receivedrather than the number of years of schoolcompleted.
SOURCE: Current Population Survey, U.S.Department of Labor, U.S. Bureau of LaborStatistics.
25

Table 10. Employed persons by major occupation and sex, 2006-07 annual averages(Numbers in thousands)
Number Percent Number Percent
Total
Total, 16 years and over…………….……………………………… 144,427 100.0 146,047 100.0Management, professional, and related occupations ............................ 50,420 34.9 51,788 35.5 Management, business, and financial operations occupations .......... 21,233 14.7 21,577 14.8 Professional and related occupations ................................................ 29,187 20.2 30,210 20.7Service occupations .............................................................................. 23,811 16.5 24,137 16.5Sales and office occupations ................................................................ 36,141 25.0 36,212 24.8 Sales and related occupations ........................................................... 16,641 11.5 16,698 11.4 Office and administrative support occupations .................................. 19,500 13.5 19,513 13.4Natural resources, construction, and maintenance occupations ........... 15,830 11.0 15,740 10.8 Farming, fishing, and forestry occupations ........................................ 961 .7 960 .7 Construction and extraction occupations ........................................... 9,507 6.6 9,535 6.5 Installation, maintenance, and repair occupations ............................. 5,362 3.7 5,245 3.6Production, transportation, and material moving occupations .............. 18,224 12.6 18,171 12.4 Production occupations ...................................................................... 9,378 6.5 9,395 6.4 Transportation and material moving occupations .............................. 8,846 6.1 8,776 6.0
Women
Total, 16 years and over.……………………………………………… 66,925 100.0 67,792 100.0Management, professional, and related occupations ............................ 25,492 38.1 26,195 38.6 Management, business, and financial operations occupations .......... 8,886 13.3 9,203 13.6 Professional and related occupations ................................................ 16,606 24.8 16,992 25.1Service occupations .............................................................................. 13,653 20.4 13,800 20.4Sales and office occupations ................................................................ 22,866 34.2 22,948 33.8 Sales and related occupations ........................................................... 8,163 12.2 8,275 12.2 Office and administrative support occupations .................................. 14,703 22.0 14,673 21.6Natural resources, construction, and maintenance occupations ........... 752 1.1 662 1.0 Farming, fishing, and forestry occupations ........................................ 212 .3 201 .3 Construction and extraction occupations ........................................... 292 .4 258 .4 Installation, maintenance, and repair occupations ............................. 248 .4 202 .3Production, transportation, and material moving occupations .............. 4,163 6.2 4,188 6.2 Production occupations ...................................................................... 2,850 4.3 2,832 4.2 Transportation and material moving occupations .............................. 1,313 2.0 1,355 2.0
Occupation and sex
Year
2006 2007
26

Table 10. Employed persons by major occupation and sex, 2006-07 annual averages—Continued(Numbers in thousands)
Number Percent Number Percent
Men
Total, 16 years and over.…………………………………………… 77,502 100.0 78,254 100.0Management, professional, and related occupations ............................ 24,928 32.2 25,593 32.7 Management, business, and financial operations occupations .......... 12,347 15.9 12,375 15.8 Professional and related occupations ................................................ 12,581 16.2 13,218 16.9Service occupations .............................................................................. 10,159 13.1 10,337 13.2Sales and office occupations ................................................................ 13,275 17.1 13,264 16.9 Sales and related occupations ........................................................... 8,478 10.9 8,424 10.8 Office and administrative support occupations .................................. 4,797 6.2 4,840 6.2Natural resources, construction, and maintenance occupations ........... 15,079 19.5 15,078 19.3 Farming, fishing, and forestry occupations ........................................ 750 1.0 759 1.0 Construction and extraction occupations ........................................... 9,216 11.9 9,276 11.9 Installation, maintenance, and repair occupations ............................. 5,114 6.6 5,043 6.4Production, transportation, and material moving occupations .............. 14,061 18.1 13,983 17.9 Production occupations ...................................................................... 6,529 8.4 6,563 8.4 Transportation and material moving occupations .............................. 7,533 9.7 7,420 9.5
SOURCE: Current Population Survey, U.S. Department of Labor, U.S. Bureau of Labor Statistics.
Occupation
Year
2006 2007
27

Table 11. Employed persons by detailed occupation and sex, 2007 annual averages(Numbers in thousands)
Total, 16 years and over……………………...…………………………………………………………… 146,047 46.4
Management, professional, and related occupations.......................................................................... 51,788 50.6Management, business, and financial operations occupations........................................................ 21,577 42.7
Management occupations............................................................................................................. 15,486 37.5Chief executives......................................................................................................................... 1,649 25.6General and operations managers............................................................................................ 971 27.5Legislators………………………………………………….…………………………………………… 19 -Advertising and promotions managers...................................................................................... 77 56.2Marketing and sales managers.................................................................................................. 848 38.8Public relations managers.......................................................................................................... 63 53.8Administrative services managers............................................................................................. 98 32.7Computer and information systems managers.......................................................................... 467 27.8Financial managers.................................................................................................................... 1,181 54.6Human resources managers...................................................................................................... 253 70.3Industrial production managers.................................................................................................. 264 16.7Purchasing managers................................................................................................................ 168 40.3Transportation, storage, and distribution managers.................................................................. 260 17.2Farm, ranch, and other agricultural managers........................................................................... 204 22.5Farmers and ranchers................................................................................................................ 742 25.5Construction managers.............................................................................................................. 1,176 8.1Education administrators........................................................................................................... 810 64.1Engineering managers............................................................................................................... 114 8.0Food service managers............................................................................................................. 1,002 44.3Funeral directors……….……………………………………………………………………………… 43 -Gaming managers……………..……………………………………………………………………… 7 -Lodging managers..................................................................................................................... 151 50.6Medical and health services managers...................................................................................... 536 69.9Natural sciences managers…………………………………………..……………………………… 12 -Postmasters and mail superintendents...................................................................................... 50 54.1Property, real estate, and community association managers.................................................... 594 50.5Social and community service managers.................................................................................. 331 65.8Managers, all other……………………………………………………………………………………… 3,398 36.5
Business and financial operations occupations............................................................................ 6,091 55.9Agents and business managers of artists, performers, and athletes……………………………… 41 -Purchasing agents and buyers, farm products……………………………………………………… 7 -Wholesale and retail buyers, except farm products................................................................... 200 51.5Purchasing agents, except wholesale, retail, and farm products............................................... 280 55.5Claims adjusters, appraisers, examiners, and investigators...................................................... 289 61.8Compliance officers, except agriculture, construction, health and safety, and transportation... 139 50.6Cost estimators.......................................................................................................................... 115 15.4Human resources, training, and labor relations specialists........................................................ 793 71.1Logisticians................................................................................................................................ 55 40.8Management analysts................................................................................................................ 627 44.3Meeting and convention planners…………………………………………………………………… 44 -Other business operations specialists………………………………………………………………… 218 71.4Accountants and auditors.......................................................................................................... 1,806 61.9Appraisers and assessors of real estate.................................................................................... 118 25.8Budget analysts......................................................................................................................... 62 66.1Credit analysts…………………………………………………………………………………………… 30 -Financial analysts...................................................................................................................... 109 34.3
See note at end of table.
Occupation Total employed
Percent women
28
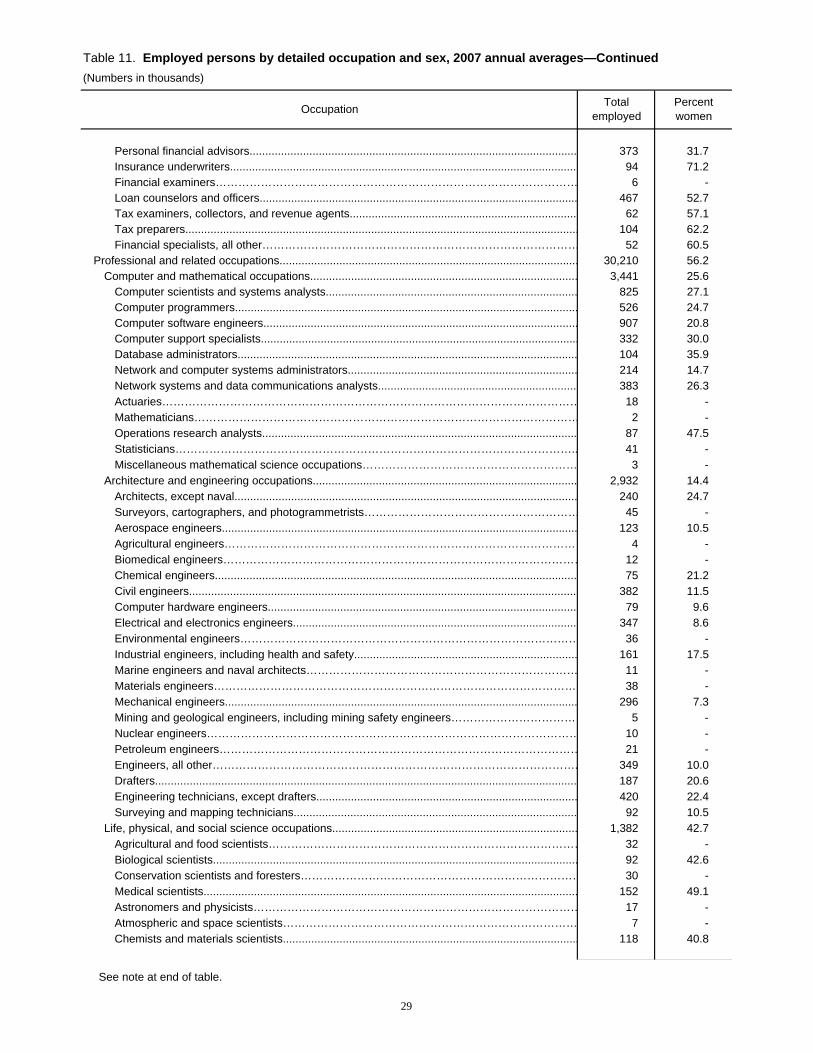
Table 11. Employed persons by detailed occupation and sex, 2007 annual averages—Continued (Numbers in thousands)
Personal financial advisors........................................................................................................ 373 31.7Insurance underwriters.............................................................................................................. 94 71.2Financial examiners…………………………………………………………………………………… 6 -Loan counselors and officers..................................................................................................... 467 52.7Tax examiners, collectors, and revenue agents........................................................................ 62 57.1Tax preparers............................................................................................................................. 104 62.2Financial specialists, all other………………………………………………………………………… 52 60.5
Professional and related occupations............................................................................................... 30,210 56.2Computer and mathematical occupations..................................................................................... 3,441 25.6
Computer scientists and systems analysts................................................................................ 825 27.1Computer programmers............................................................................................................. 526 24.7Computer software engineers.................................................................................................... 907 20.8Computer support specialists..................................................................................................... 332 30.0Database administrators............................................................................................................ 104 35.9Network and computer systems administrators......................................................................... 214 14.7Network systems and data communications analysts............................................................... 383 26.3Actuaries………………………………………………………………………………………………… 18 -Mathematicians………………………………………………………………………………………… 2 -Operations research analysts.................................................................................................... 87 47.5Statisticians…………………………………………………………………………………………….. 41 -Miscellaneous mathematical science occupations………………………………………………… 3 -
Architecture and engineering occupations.................................................................................... 2,932 14.4Architects, except naval............................................................................................................. 240 24.7Surveyors, cartographers, and photogrammetrists………………………………………………… 45 -Aerospace engineers................................................................................................................. 123 10.5Agricultural engineers…………………………………………………………………………………… 4 -Biomedical engineers…………………………………………………………………………………… 12 -Chemical engineers................................................................................................................... 75 21.2Civil engineers........................................................................................................................... 382 11.5Computer hardware engineers.................................................................................................. 79 9.6Electrical and electronics engineers.......................................................................................... 347 8.6Environmental engineers……………………………………………………………………………… 36 -Industrial engineers, including health and safety....................................................................... 161 17.5Marine engineers and naval architects……………………………………………………………… 11 -Materials engineers…………………………………………………………………………………… 38 -Mechanical engineers................................................................................................................ 296 7.3Mining and geological engineers, including mining safety engineers…………………………… 5 -Nuclear engineers……………………………………………………………………………………… 10 -Petroleum engineers…………………………………………………………………………………… 21 -Engineers, all other……………………………………………………………………………………. 349 10.0Drafters...................................................................................................................................... 187 20.6Engineering technicians, except drafters................................................................................... 420 22.4Surveying and mapping technicians.......................................................................................... 92 10.5
Life, physical, and social science occupations.............................................................................. 1,382 42.7Agricultural and food scientists………………………………………………………………………… 32 -Biological scientists.................................................................................................................... 92 42.6Conservation scientists and foresters………………………………………………………………… 30 -Medical scientists....................................................................................................................... 152 49.1Astronomers and physicists…………………………………………………………………………… 17 -Atmospheric and space scientists…………………………………………………………………… 7 -Chemists and materials scientists.............................................................................................. 118 40.8
See note at end of table.
Occupation Total employed
Percent women
29

Table 11. Employed persons by detailed occupation and sex, 2007 annual averages—Continued(Numbers in thousands)
Environmental scientists and geoscientists............................................................................... 98 29.9Physical scientists, all other………………………………………………………………………….. 119 33.5Economists…………………………………………………………………………………………….. 23 -Market and survey researchers................................................................................................. 159 56.8Psychologists............................................................................................................................. 185 64.4Sociologists……………………………………………………………………………………………… 7 -Urban and regional planners……………………………………………………………………….. 30 -Miscellaneous social scientists and related workers………………………………………………… 36 -Agricultural and food science technicians………………………………………………………….. 23 -Biological technicians…………………………………………………………………………………… 23 -Chemical technicians................................................................................................................. 62 32.4Geological and petroleum technicians……………………………………………………………… 15 -Nuclear technicians…………………………………………………………………………………… 2 -Other life, physical, and social science technicians………………………………………………… 151 39.3
Community and social services occupations................................................................................. 2,265 60.7Counselors................................................................................................................................. 686 65.9Social workers............................................................................................................................ 673 82.0Miscellaneous community and social service specialists........................................................... 317 63.2Clergy......................................................................................................................................... 422 15.1Directors, religious activities and education............................................................................... 57 69.7Religious workers, all other…………………………………………………………………………… 110 61.2
Legal occupations......................................................................................................................... 1,668 51.5Lawyers...................................................................................................................................... 1,001 32.6Judges, magistrates, and other judicial workers........................................................................ 68 43.3Paralegals and legal assistants................................................................................................. 347 88.4Miscellaneous legal support workers......................................................................................... 253 77.5
Education, training, and library occupations.................................................................................. 8,485 73.3Postsecondary teachers............................................................................................................ 1,261 46.2Preschool and kindergarten teachers........................................................................................ 667 97.3Elementary and middle school teachers.................................................................................... 2,943 80.9Secondary school teachers........................................................................................................ 1,158 56.9Special education teachers........................................................................................................ 363 81.5Other teachers and instructors................................................................................................... 732 63.8Archivists, curators, and museum technicians……………………………………………………… 42 -Librarians................................................................................................................................... 215 83.2Library technicians..................................................................................................................... 52 62.3Teacher assistants..................................................................................................................... 974 91.5Other education, training, and library workers........................................................................... 78 69.7
Arts, design, entertainment, sports, and media occupations........................................................ 2,789 47.1Artists and related workers........................................................................................................ 227 52.9Designers................................................................................................................................... 852 54.7Actors…………………………………………………………………………………………………… 28 -Producers and directors............................................................................................................. 149 30.5Athletes, coaches, umpires, and related workers...................................................................... 253 36.3Dancers and choreographers………………………………………………………………………. 25 -Musicians, singers, and related workers.................................................................................... 170 31.5Entertainers and performers, sports and related workers, all other…………………………….. 42 -Announcers................................................................................................................................ 51 24.4News analysts, reporters and correspondents........................................................................... 84 42.1Public relations specialists......................................................................................................... 132 63.3Editors........................................................................................................................................ 163 49.5
See note at end of table.
Occupation Total employed
Percent women
30
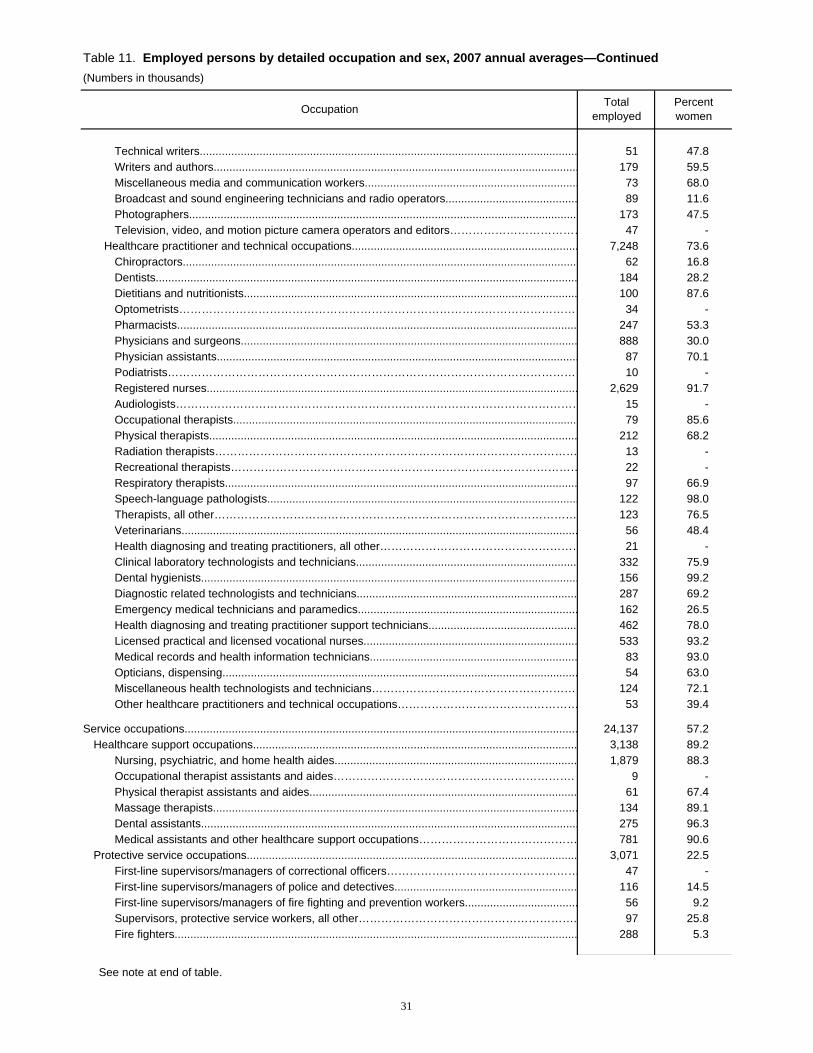
Table 11. Employed persons by detailed occupation and sex, 2007 annual averages—Continued(Numbers in thousands)
Technical writers........................................................................................................................ 51 47.8Writers and authors.................................................................................................................... 179 59.5Miscellaneous media and communication workers.................................................................... 73 68.0Broadcast and sound engineering technicians and radio operators.......................................... 89 11.6Photographers........................................................................................................................... 173 47.5Television, video, and motion picture camera operators and editors……………………………… 47 -
Healthcare practitioner and technical occupations........................................................................ 7,248 73.6Chiropractors............................................................................................................................. 62 16.8Dentists...................................................................................................................................... 184 28.2Dietitians and nutritionists.......................................................................................................... 100 87.6Optometrists…………………………………………………………………………………………… 34 -Pharmacists............................................................................................................................... 247 53.3Physicians and surgeons........................................................................................................... 888 30.0Physician assistants................................................................................................................... 87 70.1Podiatrists………………………………………………………………………………………………… 10 -Registered nurses...................................................................................................................... 2,629 91.7Audiologists……………………………………………………………………………………………… 15 -Occupational therapists............................................................................................................. 79 85.6Physical therapists..................................................................................................................... 212 68.2Radiation therapists…………………………………………………………………………………… 13 -Recreational therapists………………………………………………………………………………… 22 -Respiratory therapists................................................................................................................ 97 66.9Speech-language pathologists................................................................................................... 122 98.0Therapists, all other…………………………………………………………………………………… 123 76.5Veterinarians.............................................................................................................................. 56 48.4Health diagnosing and treating practitioners, all other……………………………………………… 21 -Clinical laboratory technologists and technicians...................................................................... 332 75.9Dental hygienists........................................................................................................................ 156 99.2Diagnostic related technologists and technicians...................................................................... 287 69.2Emergency medical technicians and paramedics...................................................................... 162 26.5Health diagnosing and treating practitioner support technicians............................................... 462 78.0Licensed practical and licensed vocational nurses.................................................................... 533 93.2Medical records and health information technicians.................................................................. 83 93.0Opticians, dispensing................................................................................................................. 54 63.0Miscellaneous health technologists and technicians……………………………………………… 124 72.1Other healthcare practitioners and technical occupations………………………………………… 53 39.4
Service occupations............................................................................................................................. 24,137 57.2Healthcare support occupations....................................................................................................... 3,138 89.2
Nursing, psychiatric, and home health aides............................................................................. 1,879 88.3Occupational therapist assistants and aides………………………………………………………. 9 -Physical therapist assistants and aides..................................................................................... 61 67.4Massage therapists.................................................................................................................... 134 89.1Dental assistants........................................................................................................................ 275 96.3Medical assistants and other healthcare support occupations…………………………………… 781 90.6
Protective service occupations......................................................................................................... 3,071 22.5First-line supervisors/managers of correctional officers…………………………………………… 47 -First-line supervisors/managers of police and detectives.......................................................... 116 14.5First-line supervisors/managers of fire fighting and prevention workers.................................... 56 9.2Supervisors, protective service workers, all other…………………………………………………. 97 25.8Fire fighters................................................................................................................................ 288 5.3
See note at end of table.
Occupation Total employed
Percent women
31

Table 11. Employed persons by detailed occupation and sex, 2007 annual averages—Continued(Numbers in thousands)
Fire inspectors…………………………………………………………………………………………… 16 -Bailiffs, correctional officers, and jailers..................................................................................... 444 29.5Detectives and criminal investigators......................................................................................... 135 23.2Fish and game wardens……………………………………………………………………………… 8 -Parking enforcement workers………………………………………………………………………… 11 -Police and sheriff's patrol officers.............................................................................................. 669 13.7Transit and railroad police……………………………………………………………………………. 5 -Animal control workers………………………………………………………………………………… 10 -Private detectives and investigators.......................................................................................... 86 31.1Security guards and gaming surveillance officers...................................................................... 891 23.2Crossing guards………………………………………………………………………………………… 48 -Lifeguards and other protective service workers…………………………………………………… 144 57.2
Food preparation and serving related occupations.......................................................................... 7,699 56.4Chefs and head cooks............................................................................................................... 345 20.6First-line supervisors/managers of food preparation and serving workers................................ 610 57.3Cooks......................................................................................................................................... 1,939 40.1Food preparation workers.......................................................................................................... 681 61.2Bartenders................................................................................................................................. 375 54.0Combined food preparation and serving workers, including fast food....................................... 302 70.1Counter attendants, cafeteria, food concession, and coffee shop............................................. 323 64.5Waiters and waitresses.............................................................................................................. 1,978 74.0Food servers, nonrestaurant...................................................................................................... 182 73.4Dining room and cafeteria attendants and bartender helpers.................................................... 392 48.9Dishwashers.............................................................................................................................. 281 24.8Hosts and hostesses, restaurant, lounge, and coffee shop....................................................... 284 85.8Food preparation and serving related workers, all other…………………………………………… 7 -
Building and grounds cleaning and maintenance occupations......................................................... 5,469 40.0First-line supervisors/managers of housekeeping and janitorial workers………………………… 319 34.1First-line supervisors/managers of landscaping, lawn service, and groundskeeping workers... 234 5.9Janitors and building cleaners................................................................................................... 2,080 34.2Maids and housekeeping cleaners............................................................................................ 1,427 89.2Pest control workers.................................................................................................................. 77 4.0Grounds maintenance workers.................................................................................................. 1,332 5.9
Personal care and service occupations............................................................................................ 4,760 79.3First-line supervisors/managers of gaming workers.................................................................. 139 43.2First-line supervisors/managers of personal service workers.................................................... 157 71.3Animal trainers…………………………………………………………………………………………. 31 -Nonfarm animal caretakers........................................................................................................ 140 78.0Gaming services workers........................................................................................................... 111 50.3Motion picture projectionists…………………………………………………………………………… 6 -Ushers, lobby attendants, and ticket takers............................................................................... 51 37.1Miscellaneous entertainment attendants and related workers…………………………………… 160 45.2Funeral service workers………………………………………………………………………………. 12 -Barbers...................................................................................................................................... 102 26.1Hairdressers, hairstylists, and cosmetologists........................................................................... 778 92.9Miscellaneous personal appearance workers............................................................................ 223 84.9Baggage porters, bellhops, and concierges............................................................................... 60 16.7Tour and travel guides……………………………………………………………………………….. 47 -Transportation attendants.......................................................................................................... 148 75.9Child care workers..................................................................................................................... 1,341 94.6Personal and home care aides.................................................................................................. 766 88.2
See note at end of table.
Occupation Total employed
Percent women
32

Table 11. Employed persons by detailed occupation and sex, 2007 annual averages—Continued (Numbers in thousands)
Recreation and fitness workers.................................................................................................. 331 61.7Residential advisors................................................................................................................... 64 67.4Personal care and service workers, all other………………………………………………………… 90 51.4
Sales and office occupations............................................................................................................... 36,212 63.4Sales and related occupations......................................................................................................... 16,698 49.6
First-line supervisors/managers of retail sales workers............................................................. 3,445 42.6First-line supervisors/managers of non-retail sales workers...................................................... 1,333 28.2Cashiers..................................................................................................................................... 3,022 75.6Counter and rental clerks........................................................................................................... 158 53.4Parts salespersons.................................................................................................................... 132 17.4Retail salespersons.................................................................................................................... 3,492 51.5Advertising sales agents............................................................................................................ 219 57.5Insurance sales agents.............................................................................................................. 538 45.4Securities, commodities, and financial services sales agents................................................... 398 31.2Travel agents............................................................................................................................. 111 75.3Sales representatives, services, all other.................................................................................. 590 36.2Sales representatives, wholesale and manufacturing................................................................ 1,442 27.1Models, demonstrators, and product promoters........................................................................ 75 83.4Real estate brokers and sales agents........................................................................................ 1,050 55.4Sales engineers………………………………………………………………………………………… 40 -Telemarketers............................................................................................................................ 160 60.2Door-to-door sales workers, news and street vendors, and related workers............................. 265 66.7Sales and related workers, all other………………………………………………………………… 227 60.9
Office and administrative support occupations................................................................................. 19,513 75.2First-line supervisors/managers of office and administrative support workers.......................... 1,629 73.4Switchboard operators, including answering service……………………………………………… 50 89.4Telephone operators………………………………………………………………………………….. 40 -Communications equipment operators, all other…………………………………………………… 8 -Bill and account collectors......................................................................................................... 216 63.2Billing and posting clerks and machine operators...................................................................... 442 89.5Bookkeeping, accounting, and auditing clerks........................................................................... 1,490 90.3Gaming cage workers………………………………………………………………………………… 13 -Payroll and timekeeping clerks.................................................................................................. 181 89.1Procurement clerks……………………………………………………………………………………. 28 -Tellers........................................................................................................................................ 472 87.5Brokerage clerks………………………………………………………………………………………… 6 -Correspondence clerks………………………………………………………………………………. 7 -Court, municipal, and license clerks.......................................................................................... 99 80.7Credit authorizers, checkers, and clerks……………………………………………………………… 48 -Customer service representatives............................................................................................. 1,917 68.5Eligibility interviewers, government programs............................................................................ 68 79.6File clerks................................................................................................................................... 403 82.0Hotel, motel, and resort desk clerks........................................................................................... 118 68.1Interviewers, except eligibility and loan...................................................................................... 141 81.5Library assistants, clerical.......................................................................................................... 113 84.2Loan interviewers and clerks..................................................................................................... 155 80.4New accounts clerks…………………………………………………………………………………… 17 -Order clerks............................................................................................................................... 102 70.1Human resources assistants, except payroll and timekeeping…………………………………… 49 -Receptionists and information clerks......................................................................................... 1,441 93.0Reservation and transportation ticket agents and travel clerks................................................. 144 59.1
See note at end of table.
Occupation Total employed
Percent women
33
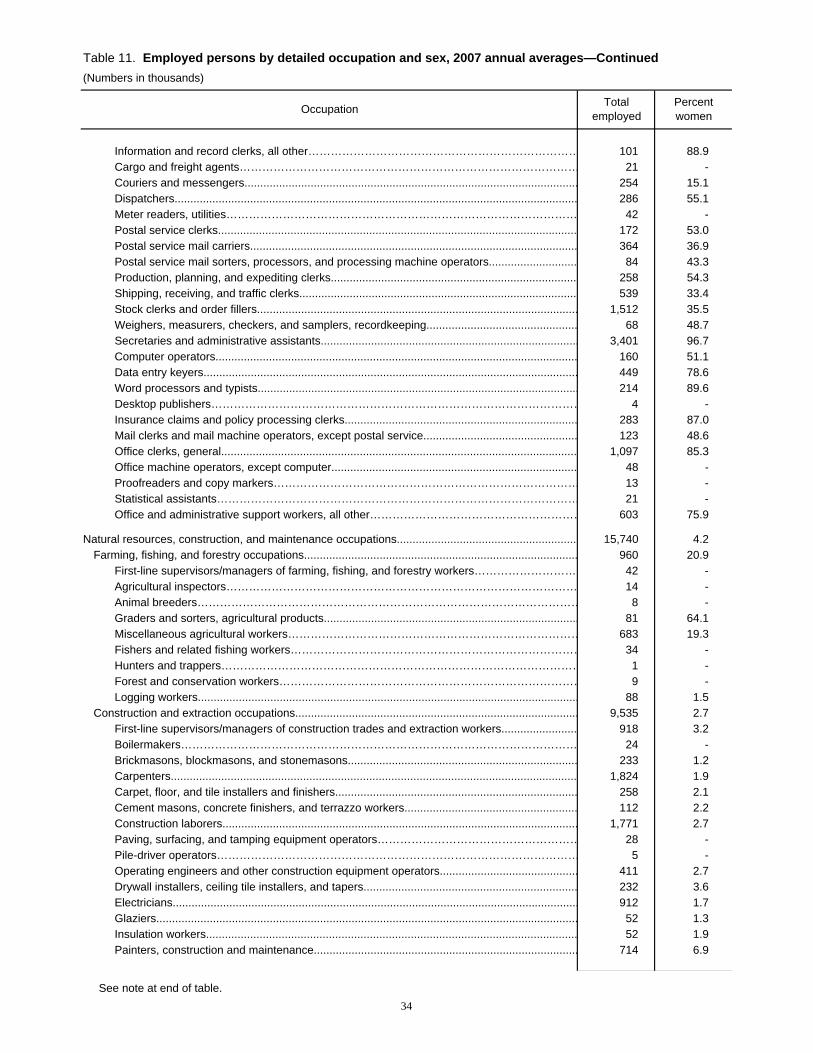
Table 11. Employed persons by detailed occupation and sex, 2007 annual averages—Continued (Numbers in thousands)
Information and record clerks, all other……………………………………………………………… 101 88.9Cargo and freight agents……………………………………………………………………………… 21 -Couriers and messengers.......................................................................................................... 254 15.1Dispatchers................................................................................................................................ 286 55.1Meter readers, utilities………………………………………………………………………………… 42 -Postal service clerks.................................................................................................................. 172 53.0Postal service mail carriers........................................................................................................ 364 36.9Postal service mail sorters, processors, and processing machine operators............................ 84 43.3Production, planning, and expediting clerks.............................................................................. 258 54.3Shipping, receiving, and traffic clerks........................................................................................ 539 33.4Stock clerks and order fillers...................................................................................................... 1,512 35.5Weighers, measurers, checkers, and samplers, recordkeeping................................................ 68 48.7Secretaries and administrative assistants.................................................................................. 3,401 96.7Computer operators................................................................................................................... 160 51.1Data entry keyers....................................................................................................................... 449 78.6Word processors and typists...................................................................................................... 214 89.6Desktop publishers……………………………………………………………………………………… 4 -Insurance claims and policy processing clerks.......................................................................... 283 87.0Mail clerks and mail machine operators, except postal service................................................. 123 48.6Office clerks, general................................................................................................................. 1,097 85.3Office machine operators, except computer.............................................................................. 48 -Proofreaders and copy markers……………………………………………………………………… 13 -Statistical assistants…………………………………………………………………………………… 21 -Office and administrative support workers, all other………………………………………………… 603 75.9
Natural resources, construction, and maintenance occupations......................................................... 15,740 4.2Farming, fishing, and forestry occupations....................................................................................... 960 20.9
First-line supervisors/managers of farming, fishing, and forestry workers……………………… 42 -Agricultural inspectors………………………………………………………………………………… 14 -Animal breeders………………………………………………………………………………………… 8 -Graders and sorters, agricultural products................................................................................. 81 64.1Miscellaneous agricultural workers…………………………………………………………………… 683 19.3Fishers and related fishing workers…………………………………………………………………… 34 -Hunters and trappers…………………………………………………………………………………… 1 -Forest and conservation workers……………………………………………………………………… 9 -Logging workers......................................................................................................................... 88 1.5
Construction and extraction occupations.......................................................................................... 9,535 2.7First-line supervisors/managers of construction trades and extraction workers........................ 918 3.2Boilermakers…………………………………………………………………………………………… 24 -Brickmasons, blockmasons, and stonemasons......................................................................... 233 1.2Carpenters................................................................................................................................. 1,824 1.9Carpet, floor, and tile installers and finishers............................................................................. 258 2.1Cement masons, concrete finishers, and terrazzo workers....................................................... 112 2.2Construction laborers................................................................................................................. 1,771 2.7Paving, surfacing, and tamping equipment operators……………………………………………… 28 -Pile-driver operators…………………………………………………………………………………… 5 -Operating engineers and other construction equipment operators............................................ 411 2.7Drywall installers, ceiling tile installers, and tapers.................................................................... 232 3.6Electricians................................................................................................................................. 912 1.7Glaziers...................................................................................................................................... 52 1.3Insulation workers...................................................................................................................... 52 1.9Painters, construction and maintenance.................................................................................... 714 6.9
See note at end of table.
Occupation Total employed
Percent women
34

Table 11. Employed persons by detailed occupation and sex, 2007 annual averages—Continued (Numbers in thousands)
Paperhangers…………………………………………………………………………………………… 6 -Pipelayers, plumbers, pipefitters, and steamfitters.................................................................... 697 1.5Plasterers and stucco masons................................................................................................... 82 .6Reinforcing iron and rebar workers…………………………………………………………………. 12 -Roofers...................................................................................................................................... 269 .9Sheet metal workers.................................................................................................................. 143 3.7Structural iron and steel workers............................................................................................... 88 .4Helpers, construction trades...................................................................................................... 117 4.2Construction and building inspectors......................................................................................... 107 10.0Elevator installers and repairers……………………………………………………………………… 31 -Fence erectors…………………………………………………………………………………………… 35 -Hazardous materials removal workers……………………………………………………………… 17 -Highway maintenance workers.................................................................................................. 109 .5Rail-track laying and maintenance equipment operators…………………………………………… 12 -Septic tank servicers and sewer pipe cleaners……………………………………………………… 5 -Miscellaneous construction and related workers…………………………………………………… 48 -Derrick, rotary drill, and service unit operators, oil, gas, and mining……………………………… 43 -Earth drillers, except oil and gas……………………………………………………………………… 40 -Explosives workers, ordnance handling experts, and blasters…………………………………… 4 -Mining machine operators……………………………………………………………………………… 58 1.0Roof bolters, mining…………………………………………………………………………………… 4 -Roustabouts, oil and gas……………………………………………………………………………… 5 -Helpers--extraction workers…………………………………………………………………………… 5 -Other extraction workers……………………………………………………………………………… 50 4.0
Installation, maintenance, and repair occupations........................................................................... 5,245 3.9First-line supervisors/managers of mechanics, installers, and repairers................................... 330 5.4Computer, automated teller, and office machine repairers........................................................ 318 10.6Radio and telecommunications equipment installers and repairers........................................... 203 14.8Avionics technicians…………………………………………………………………………………… 14 -Electric motor, power tool, and related repairers…………………………………………………… 27 -Electrical and electronics installers and repairers, transportation equipment…………………… 5 -Electrical and electronics repairers, industrial and utility…………………………………………… 14 -Electronic equipment installers and repairers, motor vehicles…………………………………… 28 -Electronic home entertainment equipment installers and repairers........................................... 62 .3Security and fire alarm systems installers.................................................................................. 64 .4Aircraft mechanics and service technicians............................................................................... 126 2.1Automotive body and related repairers...................................................................................... 155 1.6Automotive glass installers and repairers…………………………………………………………… 16 -Automotive service technicians and mechanics........................................................................ 879 .7Bus and truck mechanics and diesel engine specialists............................................................ 365 1.1Heavy vehicle and mobile equipment service technicians and mechanics................................ 226 1.3Small engine mechanics............................................................................................................ 68 2.5Miscellaneous vehicle and mobile equipment mechanics, installers, and repairers…………… 88 2.2Control and valve installers and repairers…………………………………………………………… 20 -Heating, air conditioning, and refrigeration mechanics and installers........................................ 403 .9Home appliance repairers.......................................................................................................... 51 4.4Industrial and refractory machinery mechanics......................................................................... 426 3.2Maintenance and repair workers, general.................................................................................. 488 3.1Maintenance workers, machinery.............................................................................................. 55 .7Millwrights.................................................................................................................................. 75 .9Electrical power-line installers and repairers............................................................................. 103 1.4
See note at end of table.
Occupation Total employed
Percent women
35

Table 11. Employed persons by detailed occupation and sex, 2007 annual averages—Continued (Numbers in thousands)
Telecommunications line installers and repairers...................................................................... 227 7.5Precision instrument and equipment repairers.......................................................................... 58 12.6Coin, vending, and amusement machine servicers and repairers............................................. 61 17.6Commercial divers……………………………………………………………………………………… 7 -Locksmiths and safe repairers………………………………………………………………………… 24 -Manufactured building and mobile home installers………………………………………………… 18 -Riggers…………………………………………………………………………………………………… 8 -Signal and track switch repairers……………………………………………………………………… 10 -Helpers--installation, maintenance, and repair workers…………………………………………… 22 -Other installation, maintenance, and repair workers………………………………………………… 198 8.5
Production, transportation, and material moving occupations............................................................. 18,171 23.0Production occupations.................................................................................................................... 9,395 30.1
First-line supervisors/managers of production and operating workers...................................... 941 19.4Aircraft structure, surfaces, rigging, and systems assemblers…………………………………… 10 -Electrical, electronics, and electromechanical assemblers........................................................ 205 57.9Engine and other machine assemblers……………………………………………………………… 14 -Structural metal fabricators and fitters………………………………………………………………… 33 -Miscellaneous assemblers and fabricators…………………………………………………………… 1,071 38.3Bakers........................................................................................................................................ 192 54.1Butchers and other meat, poultry, and fish processing workers................................................ 281 26.8Food and tobacco roasting, baking, and drying machine operators and tenders……………… 16 -Food batchmakers..................................................................................................................... 92 58.0Food cooking machine operators and tenders……………………………………………………… 7 -Computer control programmers and operators.......................................................................... 55 8.7Extruding and drawing machine setters, operators, and tenders, metal and plastic…………… 18 -Forging machine setters, operators, and tenders, metal and plastic……………………………… 9 -Rolling machine setters, operators, and tenders, metal and plastic……………………………… 12 -Cutting, punching, and press machine setters, operators, and tenders, metal and plastic........ 118 21.6Drilling and boring machine tool setters, operators, and tenders, metal and plastic…………… 2 -Grinding, lapping, polishing, and buffing machine tool setters, operators, and tenders, metal and plastic................................................................................................................................ 55 13.2Lathe and turning machine tool setters, operators, and tenders, metal and plastic…………… 15 -Milling and planing machine setters, operators, and tenders, metal and plastic………………… 4 -Machinists.................................................................................................................................. 422 5.2Metal furnace and kiln operators and tenders……………………………………………………… 24 -Model makers and patternmakers, metal and plastic……………………………………………… 15 -Molders and molding machine setters, operators, and tenders, metal and plastic.................... 75 18.1Multiple machine tool setters, operators, and tenders, metal and plastic………………………… 5 -Tool and die makers.................................................................................................................. 80 2.0Welding, soldering, and brazing workers................................................................................... 577 5.6Heat treating equipment setters, operators, and tenders, metal and plastic……………………… 13 -Lay-out workers, metal and plastic…………………………………………………………………… 8 -Plating and coating machine setters, operators, and tenders, metal and plastic………………… 18 -Tool grinders, filers, and sharpeners………………………………………………………………… 7 -Metalworkers and plastic workers, all other………………………………………………………… 435 28.9Bookbinders and bindery workers…………………………………………………………………… 47 -Job printers……………………………………………………………………………………………… 42 -Prepress technicians and workers............................................................................................. 52 46.8Printing machine operators........................................................................................................ 222 17.2Laundry and dry-cleaning workers............................................................................................. 229 56.4Pressers, textile, garment, and related materials....................................................................... 59 72.2
See note at end of table.
Total employed
Percent womenOccupation
36

Table 11. Employed persons by detailed occupation and sex, 2007 annual averages—Continued (Numbers in thousands)
Sewing machine operators........................................................................................................ 265 81.6Shoe and leather workers and repairers……………………………………………………………… 12 -Shoe machine operators and tenders………………………………………………………………. 9 -Tailors, dressmakers, and sewers............................................................................................. 90 75.3Textile bleaching and dyeing machine operators and tenders…………………………………… 5 -Textile cutting machine setters, operators, and tenders…………………………………………… 6 -Textile knitting and weaving machine setters, operators, and tenders…………………………… 13 -Textile winding, twisting, and drawing out machine setters, operators, and tenders…………… 25 -Fabric and apparel patternmakers…………………………………………………………………… 5 -Upholsterers............................................................................................................................... 53 14.9Textile, apparel, and furnishings workers, all other………………………………………………… 16 -Cabinetmakers and bench carpenters....................................................................................... 91 6.5Furniture finishers……………………………………………………………………………………… 20 -Model makers and patternmakers, wood…………………………………………………………… 1 -Sawing machine setters, operators, and tenders, wood............................................................ 52 9.1Woodworking machine setters, operators, and tenders, except sawing………………………… 30 -Woodworkers, all other………………………………………………………………………………… 35 -Power plant operators, distributors, and dispatchers……………………………………………… 48 -Stationary engineers and boiler operators................................................................................. 95 1.3Water and liquid waste treatment plant and system operators.................................................. 72 6.2Miscellaneous plant and system operators………………………………………………………… 44 -Chemical processing machine setters, operators, and tenders…………………………………… 47 -Crushing, grinding, polishing, mixing, and blending workers..................................................... 118 12.5Cutting workers.......................................................................................................................... 94 24.4Extruding, forming, pressing, and compacting machine setters, operators, and tenders……… 32 -Furnace, kiln, oven, drier, and kettle operators and tenders……………………………………… 14 -Inspectors, testers, sorters, samplers, and weighers................................................................. 737 39.5Jewelers and precious stone and metal workers…………………………………………………… 47 -Medical, dental, and ophthalmic laboratory technicians............................................................ 107 44.0Packaging and filling machine operators and tenders............................................................... 279 57.1Painting workers........................................................................................................................ 193 11.0Photographic process workers and processing machine operators.......................................... 64 56.4Semiconductor processors…………………………………………………………………………… 3 -Cementing and gluing machine operators and tenders…………………………………………… 16 -Cleaning, washing, and metal pickling equipment operators and tenders……………………… 12 -Cooling and freezing equipment operators and tenders…………………………………………… 5 -Etchers and engravers………………………………………………………………………………… 8 -Molders, shapers, and casters, except metal and plastic………………………………………… 39 -Paper goods machine setters, operators, and tenders……………………………………………… 49 -Tire builders……………………………………………………………………………………………… 15 -Helpers--production workers…………………………………………………………………………… 44 -Production workers, all other………………………………………………………………………… 1,006 30.5
Transportation and material moving occupations............................................................................. 8,776 15.4Supervisors, transportation and material moving workers......................................................... 225 20.3Aircraft pilots and flight engineers.............................................................................................. 123 4.2Air traffic controllers and airfield operations specialists…………………………………………… 33 -Ambulance drivers and attendants, except emergency medical technicians…………………… 17 -Bus drivers................................................................................................................................. 578 51.6Driver/sales workers and truck drivers....................................................................................... 3,460 5.3Taxi drivers and chauffeurs........................................................................................................ 333 15.4Motor vehicle operators, all other……………………………………………………………………… 74 10.4
See note at end of table.
Occupation Total employed
Percent women
37

Table 11. Employed persons by detailed occupation and sex, 2007 annual averages—Continued (Numbers in thousands)
Locomotive engineers and operators......................................................................................... 52 5.5Railroad brake, signal, and switch operators………………………………………………………… 6 -Railroad conductors and yardmasters....................................................................................... 53 5.9Subway, streetcar, and other rail transportation workers…………………………………………… 18 -Sailors and marine oilers……………………………………………………………………………… 15 -Ship and boat captains and operators………………………………………………………………… 41 -Ship engineers…………………………………………………………………………………………… 2 -Bridge and lock tenders………………………………………………………………………………… 3 -Parking lot attendants................................................................................................................ 90 15.4Service station attendants.......................................................................................................... 90 7.0Transportation inspectors……………………………………………………………………………… 43 -Other transportation workers…………………………………………………………………………… 19 -Conveyor operators and tenders............................................................................................... 6 -Crane and tower operators........................................................................................................ 61 .6Dredge, excavating, and loading machine operators................................................................. 61 2.2Hoist and winch operators……………………………………………………………………………… 9 -Industrial truck and tractor operators......................................................................................... 571 5.9Cleaners of vehicles and equipment.......................................................................................... 326 13.0Laborers and freight, stock, and material movers, hand............................................................ 1,877 18.6Machine feeders and offbearers……………………………………………………………………… 29 -Packers and packagers, hand................................................................................................... 406 64.4Pumping station operators…………………………………………………………………………… 23 -Refuse and recyclable material collectors................................................................................. 79 6.4Shuttle car operators…………………………………………………………………………………… 4 -Tank car, truck, and ship loaders……………………………………………………………………… 7 -Material moving workers, all other…………………………………………………………………… 39 -
Occupation Total employed
Percent women
NOTE: Dash indicates data not shown for occupations where employment base is less than 50,000.
SOURCE: Current Population Survey, U.S. Department of Labor, U.S. Bureau of Labor Statistics.
38
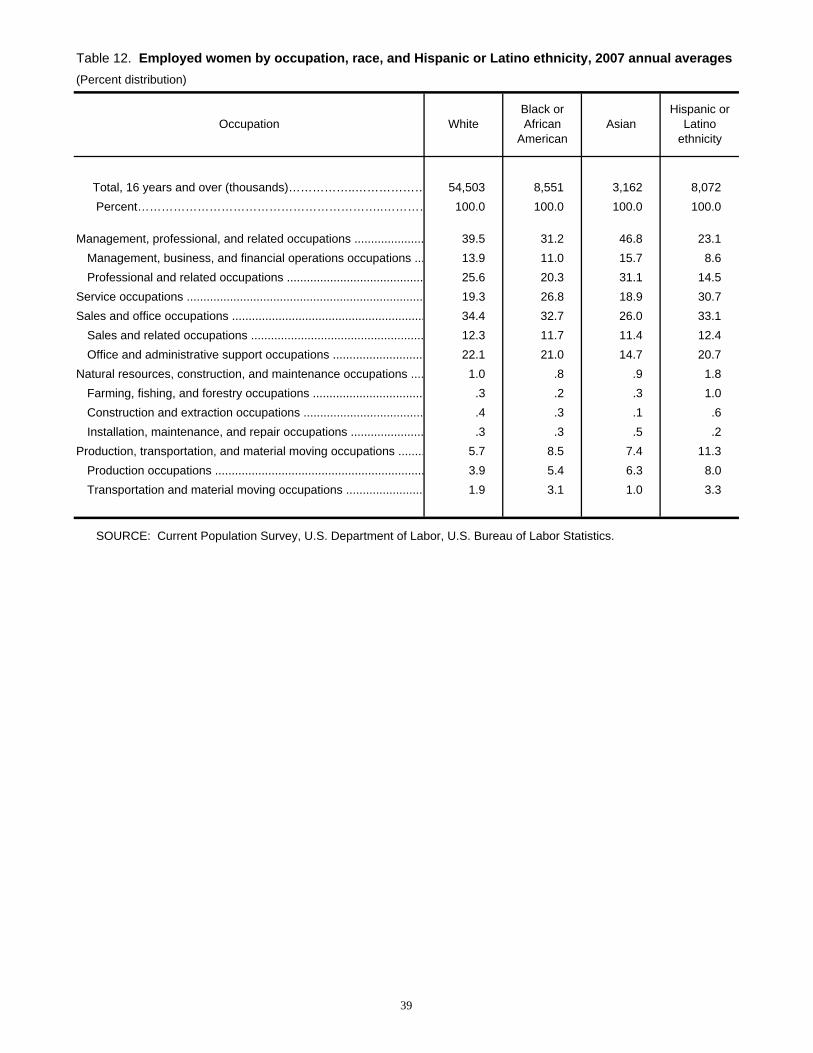
Table 12. Employed women by occupation, race, and Hispanic or Latino ethnicity, 2007 annual averages(Percent distribution)
Total, 16 years and over (thousands)……………..……………… 54,503 8,551 3,162 8,072 Percent……………………………………………………..………… 100.0 100.0 100.0 100.0
Management, professional, and related occupations ..................... 39.5 31.2 46.8 23.1Management, business, and financial operations occupations ... 13.9 11.0 15.7 8.6Professional and related occupations ......................................... 25.6 20.3 31.1 14.5
Service occupations ....................................................................... 19.3 26.8 18.9 30.7Sales and office occupations .......................................................... 34.4 32.7 26.0 33.1
Sales and related occupations .................................................... 12.3 11.7 11.4 12.4Office and administrative support occupations ........................... 22.1 21.0 14.7 20.7
Natural resources, construction, and maintenance occupations .... 1.0 .8 .9 1.8Farming, fishing, and forestry occupations ................................. .3 .2 .3 1.0Construction and extraction occupations .................................... .4 .3 .1 .6Installation, maintenance, and repair occupations ...................... .3 .3 .5 .2
Production, transportation, and material moving occupations ........ 5.7 8.5 7.4 11.3Production occupations ............................................................... 3.9 5.4 6.3 8.0Transportation and material moving occupations ....................... 1.9 3.1 1.0 3.3
SOURCE: Current Population Survey, U.S. Department of Labor, U.S. Bureau of Labor Statistics.
Occupation WhiteBlack or African
AmericanAsian
Hispanic or Latino
ethnicity
39

Table 13. Employed persons by industry and sex, 2006-07 annual averages
(Numbers in thousands)
Number Percent Number Percent
Total, both sexes
Total, 16 years and over…………….……………………… 144,427 100.0 146,047 100.0Agriculture, forestry, fishing, and hunting .................................. 2,206 1.5 2,095 1.4Mining ........................................................................................ 687 .5 736 .5Construction ............................................................................... 11,749 8.1 11,856 8.1Manufacturing ............................................................................ 16,377 11.3 16,302 11.2 Durable goods ......................................................................... 10,499 7.3 10,363 7.1 Nondurable goods ................................................................... 5,877 4.1 5,938 4.1Wholesale and retail trade ......................................................... 21,328 14.8 20,937 14.3 Wholesale trade ....................................................................... 4,561 3.2 4,367 3.0 Retail trade .............................................................................. 16,767 11.6 16,570 11.3Transportation and utilities ......................................................... 7,455 5.2 7,650 5.2 Transportation and warehousing ............................................. 6,269 4.3 6,457 4.4 Utilities ..................................................................................... 1,186 .8 1,193 .8Information ................................................................................. 3,573 2.5 3,566 2.4Financial activities ...................................................................... 10,490 7.3 10,488 7.2 Finance and insurance ............................................................ 7,254 5.0 7,306 5.0 Real estate and rental and leasing .......................................... 3,237 2.2 3,182 2.2Professional and business services ........................................... 14,868 10.3 15,621 10.7 Professional and technical services ......................................... 8,776 6.1 9,208 6.3 Management, administrative, and waste services.................... 6,092 4.2 6,412 4.4Education and health services ................................................... 29,938 20.7 30,662 21.0 Educational services ................................................................ 12,522 8.7 12,828 8.8 Health care and social assistance ........................................... 17,416 12.1 17,834 12.2 Hospitals ................................................................................ 5,712 4.0 5,955 4.1 Health services, except hospitals .......................................... 8,639 6.0 8,733 6.0 Social assistance ................................................................... 3,065 2.1 3,147 2.2Leisure and hospitality ............................................................... 12,145 8.4 12,415 8.5 Arts, entertainment, and recreation ......................................... 2,671 1.8 2,833 1.9 Accommodation and food services .......................................... 9,474 6.6 9,582 6.6Other services ............................................................................ 7,088 4.9 6,972 4.8 Other services, except private households .............................. 6,285 4.4 6,159 4.2 Private households .................................................................. 803 .6 813 .6Public administration .................................................................. 6,524 4.5 6,746 4.6
Industry and sex
Year
2006 2007
40
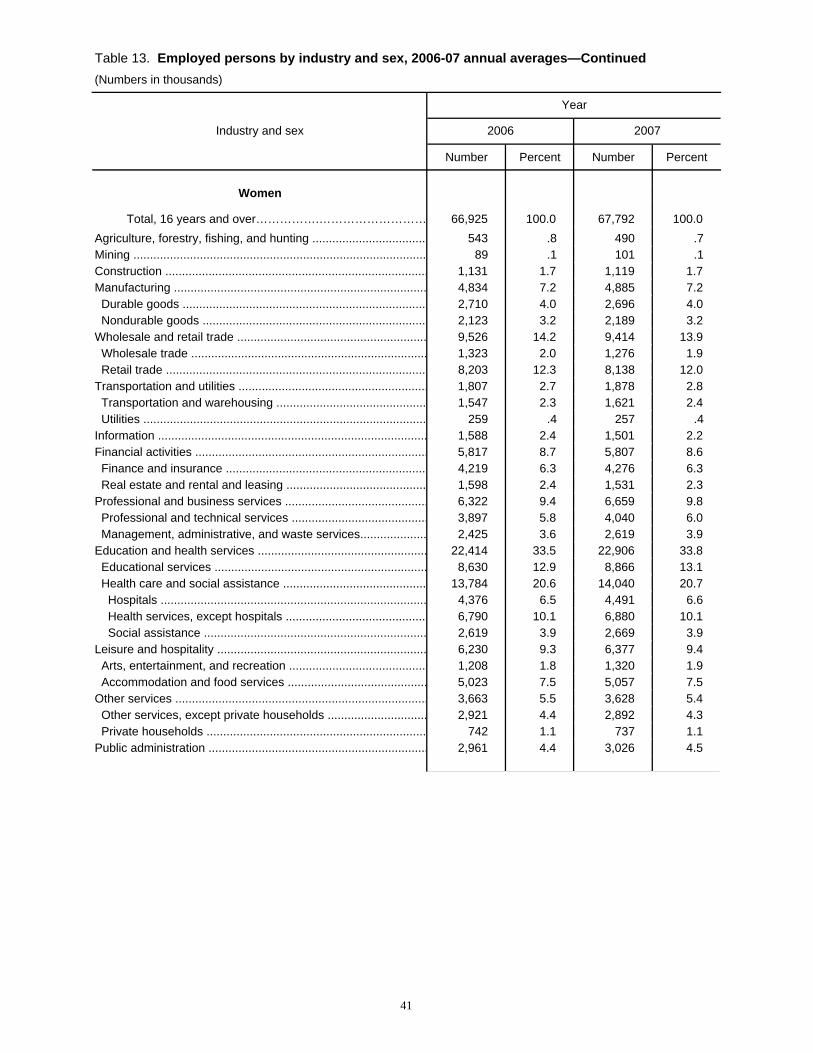
Table 13. Employed persons by industry and sex, 2006-07 annual averages—Continued(Numbers in thousands)
Number Percent Number Percent
Women
Total, 16 years and over…………….……………………… 66,925 100.0 67,792 100.0Agriculture, forestry, fishing, and hunting .................................. 543 .8 490 .7 Mining ........................................................................................ 89 .1 101 .1 Construction ............................................................................... 1,131 1.7 1,119 1.7Manufacturing ............................................................................ 4,834 7.2 4,885 7.2 Durable goods ......................................................................... 2,710 4.0 2,696 4.0 Nondurable goods ................................................................... 2,123 3.2 2,189 3.2Wholesale and retail trade ......................................................... 9,526 14.2 9,414 13.9 Wholesale trade ....................................................................... 1,323 2.0 1,276 1.9 Retail trade .............................................................................. 8,203 12.3 8,138 12.0Transportation and utilities ......................................................... 1,807 2.7 1,878 2.8 Transportation and warehousing ............................................. 1,547 2.3 1,621 2.4 Utilities ..................................................................................... 259 .4 257 .4 Information ................................................................................. 1,588 2.4 1,501 2.2Financial activities ...................................................................... 5,817 8.7 5,807 8.6 Finance and insurance ............................................................ 4,219 6.3 4,276 6.3 Real estate and rental and leasing .......................................... 1,598 2.4 1,531 2.3Professional and business services ........................................... 6,322 9.4 6,659 9.8 Professional and technical services ......................................... 3,897 5.8 4,040 6.0 Management, administrative, and waste services.................... 2,425 3.6 2,619 3.9Education and health services ................................................... 22,414 33.5 22,906 33.8 Educational services ................................................................ 8,630 12.9 8,866 13.1 Health care and social assistance ........................................... 13,784 20.6 14,040 20.7 Hospitals ................................................................................ 4,376 6.5 4,491 6.6 Health services, except hospitals .......................................... 6,790 10.1 6,880 10.1 Social assistance ................................................................... 2,619 3.9 2,669 3.9Leisure and hospitality ............................................................... 6,230 9.3 6,377 9.4 Arts, entertainment, and recreation ......................................... 1,208 1.8 1,320 1.9 Accommodation and food services .......................................... 5,023 7.5 5,057 7.5Other services ............................................................................ 3,663 5.5 3,628 5.4 Other services, except private households .............................. 2,921 4.4 2,892 4.3 Private households .................................................................. 742 1.1 737 1.1Public administration .................................................................. 2,961 4.4 3,026 4.5
Industry and sex
Year
2006 2007
41

Table 13. Employed persons by industry and sex, 2006-07 annual averages—Continued(Numbers in thousands)
Number Percent Number Percent
Men
Total, 16 years and over…………….……………………… 77,502 100.0 78,254 100.0Agriculture, forestry, fishing, and hunting .................................. 1,663 2.1 1,604 2.0Mining ........................................................................................ 598 .8 635 .8 Construction ............................................................................... 10,618 13.7 10,738 13.7Manufacturing ............................................................................ 11,543 14.9 11,416 14.6 Durable goods ......................................................................... 7,789 10.1 7,667 9.8 Nondurable goods ................................................................... 3,754 4.8 3,749 4.8Wholesale and retail trade ......................................................... 11,802 15.2 11,523 14.7 Wholesale trade ....................................................................... 3,238 4.2 3,091 3.9 Retail trade .............................................................................. 8,564 11.1 8,433 10.8Transportation and utilities ......................................................... 5,648 7.3 5,772 7.4 Transportation and warehousing ............................................. 4,722 6.1 4,836 6.2 Utilities ..................................................................................... 926 1.2 936 1.2Information ................................................................................. 1,985 2.6 2,065 2.6Financial activities ...................................................................... 4,673 6.0 4,681 6.0 Finance and insurance ............................................................ 3,035 3.9 3,030 3.9 Real estate and rental and leasing .......................................... 1,638 2.1 1,651 2.1Professional and business services ........................................... 8,546 11.0 8,962 11.5 Professional and technical services ......................................... 4,878 6.3 5,168 6.6 Management, administrative, and waste services.................... 3,668 4.7 3,794 4.8Education and health services ................................................... 7,524 9.7 7,756 9.9 Educational services ................................................................ 3,892 5.0 3,962 5.1 Health care and social assistance ........................................... 3,632 4.7 3,794 4.8 Hospitals ................................................................................ 1,337 1.7 1,464 1.9 Health services, except hospitals .......................................... 1,850 2.4 1,852 2.4 Social assistance ................................................................... 446 .6 478 .6 Leisure and hospitality ............................................................... 5,914 7.6 6,038 7.7 Arts, entertainment, and recreation ......................................... 1,463 1.9 1,514 1.9 Accommodation and food services .......................................... 4,452 5.7 4,525 5.8Other services ............................................................................ 3,425 4.4 3,343 4.3 Other services, except private households .............................. 3,364 4.3 3,267 4.2 Private households .................................................................. 60 .1 76 .1 Public administration .................................................................. 3,563 4.6 3,720 4.8
SOURCE: Current Population Survey, U.S. Department of Labor, U.S. Bureau of Labor Statistics.
Industry and sex
Year
2006 2007
42

Table 14. Employed persons by detailed industry and sex, 2007 annual averages(Numbers in thousands)
Total, 16 years and over……………………...…………………………………………… 146,047 46.4
Agriculture, forestry, fishing, and hunting...................................................................... 2,095 23.4Crop production...................................................................................................... 896 22.0Animal production................................................................................................... 854 25.4Forestry, except logging.......................................................................................... 55 24.3Logging................................................................................................................... 101 3.7Fishing, hunting, and trapping................................................................................. 47 - Support activities for agriculture and forestry.......................................................... 141 36.5
Mining............................................................................................................................ 736 13.8Oil and gas extraction............................................................................................. 96 16.8Coal mining............................................................................................................. 95 5.2Metal ore mining..................................................................................................... 36 - Nonmetallic mineral mining and quarrying.............................................................. 107 14.1Not specified type of mining.................................................................................... 9 - Support activities for mining.................................................................................... 393 15.0
Construction................................................................................................................... 11,856 9.4
Manufacturing................................................................................................................ 16,302 30.0Durable goods............................................................................................................ 10,363 26.0
Nonmetallic mineral products.................................................................................. 544 19.1Pottery, ceramics, and related product manufacturing........................................ 28 - Structural clay product manufacturing................................................................. 39 - Glass and glass products.................................................................................... 141 26.8Cement, concrete, lime, and gypsum products................................................... 233 11.7Miscellaneous nonmetallic mineral product manufacturing................................. 102 19.8
Primary metals and fabricated metal products........................................................ 1,899 18.6Iron and steel mills and steel products................................................................ 273 13.2Aluminum production and processing................................................................. 89 15.7Nonferrous metal, except aluminum, production and processing........................ 65 23.8Foundries............................................................................................................. 99 17.2Metal forgings and stampings.............................................................................. 89 18.1Cutlery and hand tools......................................................................................... 54 31.4Structural metals and tanks and shipping containers.......................................... 393 16.9Machine shops; turned products; screws, nuts, and bolts................................... 342 14.2Coating, engraving, heat treating and allied activities......................................... 108 19.0Ordnance............................................................................................................. 36 - Miscellaneous fabricated metal product manufacturing...................................... 330 26.2Not specified metal industries.............................................................................. 21 -
Machinery manufacturing........................................................................................ 1,309 21.1Agricultural implements....................................................................................... 94 20.9Construction, mining, and oil field machinery...................................................... 145 15.1Commercial and service industry machinery....................................................... 105 28.9Metalworking machinery...................................................................................... 158 17.3Engines, turbines, and power transmission equipment....................................... 71 22.3Machinery manufacturing, n.e.c.......................................................................... 724 22.1Not specified machinery manufacturing.............................................................. 11 -
Computers and electronic products........................................................................ 1,487 33.7Computer and peripheral equipment................................................................... 334 28.9Communications, audio, and video equipment.................................................... 166 36.4Navigational, measuring, electromedical, and control instruments..................... 232 32.5Electronic component and product manufacturing, n.e.c.................................... 755 35.5
See note at end of table.
Industry Total employed Percent women
43

Table 14. Employed persons by detailed industry and sex, 2007 annual averages—Continued(Numbers in thousands)
Electrical equipment and appliances...................................................................... 484 32.1Household appliances......................................................................................... 84 36.0Electrical lighting, equipment, and supplies manufacturing, n.e.c....................... 400 31.3
Transportation equipment....................................................................................... 2,215 24.1Motor vehicles and motor vehicle equipment...................................................... 1,282 26.3Aircraft and parts................................................................................................. 375 23.2Aerospace products and parts............................................................................. 318 21.9Railroad rolling stock manufacturing................................................................... 30 - Ship and boat building......................................................................................... 171 16.4Other transportation equipment manufacturing................................................... 38 -
Wood products........................................................................................................ 511 18.7Sawmills and wood preservation......................................................................... 136 12.6Veneer, plywood, and engineered wood products.............................................. 59 22.5Prefabricated wood buildings and mobile homes................................................ 61 14.4Miscellaneous wood products............................................................................. 255 22.1Furniture and related products manufacturing..................................................... 641 24.8
Miscellaneous manufacturing................................................................................. 1,273 40.7Medical equipment and supplies manufacturing................................................. 506 43.4Toys, amusement, and sporting goods manufacturing........................................ 118 40.1Miscellaneous manufacturing, n.e.c.................................................................... 455 40.0Not specified manufacturing industries................................................................ 194 36.0
Nondurable goods...................................................................................................... 5,938 36.9Food manufacturing................................................................................................ 1,600 39.6
Animal food, grain, and oilseed milling................................................................ 141 23.7Sugar and confectionery products....................................................................... 80 53.2Fruit and vegetable preserving and specialty foods............................................ 166 44.3Dairy products..................................................................................................... 161 30.7Animal slaughtering and processing.................................................................... 477 38.5Retail bakeries..................................................................................................... 137 58.7Bakeries, except retail......................................................................................... 219 38.3Seafood and other miscellaneous foods, n.e.c.................................................... 194 40.5Not specified food industries............................................................................... 25 -
Beverages and tobacco products........................................................................... 243 25.1Beverages manufacturing.................................................................................... 208 22.5Tobacco manufacturing....................................................................................... 35 -
Textiles, apparel, and leather.................................................................................. 805 57.7Fiber, yarn, and thread mills................................................................................ 18 - Fabric mills, except knitting................................................................................. 131 44.4Textile and fabric finishing and coating mills....................................................... 28 - Carpet and rug mills............................................................................................ 63 40.4Textile product mills, except carpets and rugs.................................................... 109 56.4Knitting mills........................................................................................................ 34 - Cut and sew apparel............................................................................................ 339 68.7Apparel accessories and other apparel manufacturing....................................... 14 - Footwear manufacturing...................................................................................... 37 - Leather tanning and products, except footwear manufacturing........................... 33 -
Paper and printing................................................................................................... 1,156 29.6Pulp, paper, and paperboard mills....................................................................... 185 22.6Paperboard containers and boxes....................................................................... 150 25.0Miscellaneous paper and pulp products.............................................................. 85 25.8Printing and related support activities.................................................................. 736 32.8
Petroleum and coal products.................................................................................. 181 21.0Petroleum refining............................................................................................... 159 20.8
See note at end of table.
Industry Total employed Percent women
44

Table 14. Employed persons by detailed industry and sex, 2007 annual averages—Continued(Numbers in thousands)
Miscellaneous petroleum and coal products....................................................... 22 - Chemicals............................................................................................................... 1,229 34.7
Resins, synthetic rubber and fibers, and filaments.............................................. 101 30.6Agricultural chemical manufacturing.................................................................... 35 - Pharmaceuticals and medicines.......................................................................... 468 43.3Paints, coatings, and adhesives.......................................................................... 80 21.3Soaps, cleaning compounds, and cosmetics...................................................... 161 50.2Industrial and miscellaneous chemicals.............................................................. 383 22.6
Plastics and rubber products.................................................................................. 725 30.6Plastics product manufacturing........................................................................... 564 31.8Tire manufacturing............................................................................................... 84 17.3Rubber product, except tire, manufacturing........................................................ 77 36.1
Wholesale and retail trade............................................................................................. 20,937 45.0Wholesale trade......................................................................................................... 4,367 29.2
Motor vehicles, parts and supplies.......................................................................... 255 21.1Furniture and home furnishings.............................................................................. 92 42.0Lumber and other construction materials................................................................ 230 22.7Professional and commercial equipment and supplies........................................... 417 32.6Metals and minerals, except petroleum.................................................................. 81 26.5Electrical goods....................................................................................................... 259 27.2Hardware, plumbing and heating equipment, and supplies.................................... 186 25.2Machinery, equipment, and supplies...................................................................... 486 24.8Recyclable materials............................................................................................... 119 14.1Miscellaneous durable goods................................................................................. 124 37.6Paper and paper products...................................................................................... 82 37.7Drugs, sundries, and chemical and allied products................................................ 289 42.5Apparel, fabrics, and notions.................................................................................. 132 53.2Groceries and related products............................................................................... 833 26.0Farm product raw materials.................................................................................... 60 15.3Petroleum and petroleum products......................................................................... 115 26.5Alcoholic beverages................................................................................................ 173 19.8Farm supplies......................................................................................................... 51 30.7Miscellaneous nondurable goods........................................................................... 115 39.6Wholesale electronic markets, agents and brokers................................................ 106 37.7Not specified wholesale trade................................................................................. 61 28.6
Retail trade................................................................................................................. 16,570 49.1Automobile dealers................................................................................................. 1,371 20.0Other motor vehicle dealers.................................................................................... 174 23.1Auto parts, accessories, and tire stores.................................................................. 462 16.5Furniture and home furnishings stores................................................................... 660 43.2Household appliance stores.................................................................................... 91 27.5Radio, TV, and computer stores............................................................................. 594 32.1Building material and supplies dealers................................................................... 1,063 28.2Hardware stores...................................................................................................... 186 36.8Lawn and garden equipment and supplies stores.................................................. 275 34.2Grocery stores........................................................................................................ 2,622 51.3Specialty food stores............................................................................................... 192 49.0Beer, wine, and liquor stores.................................................................................. 155 38.7Pharmacies and drug stores................................................................................... 859 63.0Health and personal care, except drug, stores....................................................... 332 66.9Gasoline stations.................................................................................................... 508 51.5Clothing and accessories, except shoe, stores....................................................... 1,010 73.9
See note at end of table.
Industry Total employed Percent women
45
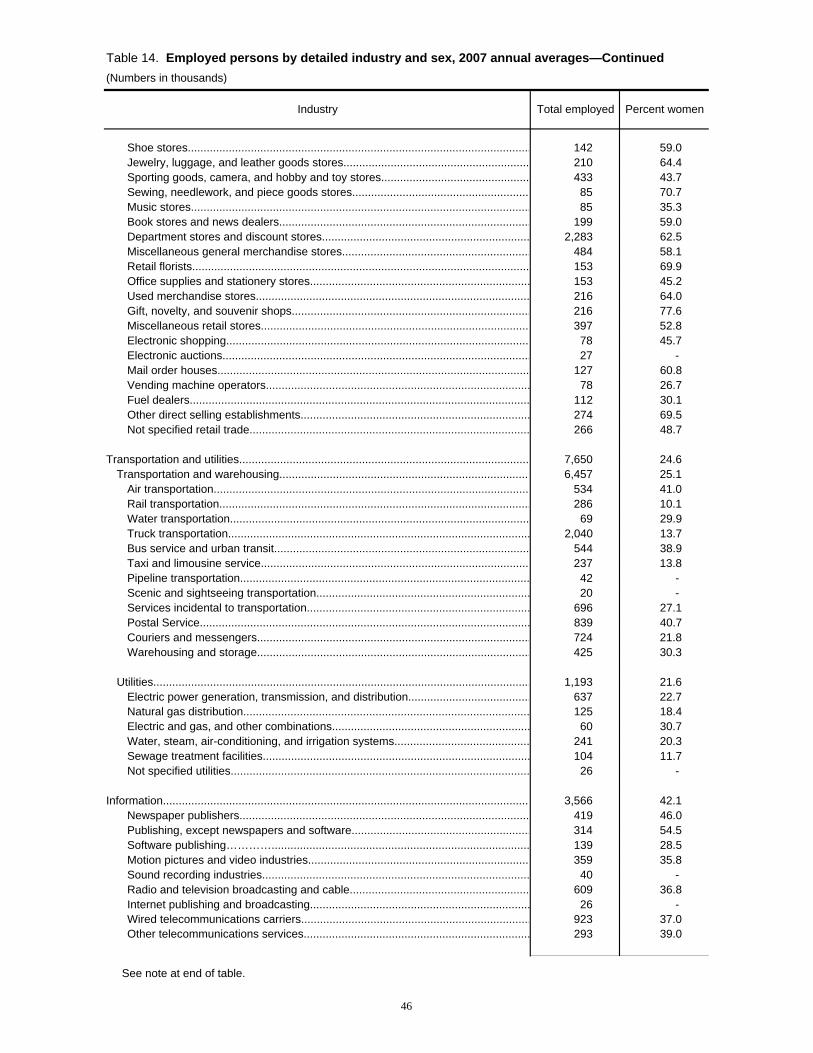
Table 14. Employed persons by detailed industry and sex, 2007 annual averages—Continued(Numbers in thousands)
Shoe stores............................................................................................................. 142 59.0Jewelry, luggage, and leather goods stores........................................................... 210 64.4Sporting goods, camera, and hobby and toy stores............................................... 433 43.7Sewing, needlework, and piece goods stores......................................................... 85 70.7Music stores............................................................................................................ 85 35.3Book stores and news dealers................................................................................ 199 59.0Department stores and discount stores.................................................................. 2,283 62.5Miscellaneous general merchandise stores............................................................ 484 58.1Retail florists........................................................................................................... 153 69.9Office supplies and stationery stores...................................................................... 153 45.2Used merchandise stores....................................................................................... 216 64.0Gift, novelty, and souvenir shops............................................................................ 216 77.6Miscellaneous retail stores...................................................................................... 397 52.8Electronic shopping................................................................................................. 78 45.7Electronic auctions.................................................................................................. 27 - Mail order houses................................................................................................... 127 60.8Vending machine operators.................................................................................... 78 26.7Fuel dealers............................................................................................................ 112 30.1Other direct selling establishments......................................................................... 274 69.5Not specified retail trade......................................................................................... 266 48.7
Transportation and utilities............................................................................................. 7,650 24.6Transportation and warehousing................................................................................ 6,457 25.1
Air transportation..................................................................................................... 534 41.0Rail transportation................................................................................................... 286 10.1Water transportation............................................................................................... 69 29.9Truck transportation................................................................................................ 2,040 13.7Bus service and urban transit................................................................................. 544 38.9Taxi and limousine service...................................................................................... 237 13.8Pipeline transportation............................................................................................ 42 - Scenic and sightseeing transportation.................................................................... 20 - Services incidental to transportation....................................................................... 696 27.1Postal Service......................................................................................................... 839 40.7Couriers and messengers....................................................................................... 724 21.8Warehousing and storage....................................................................................... 425 30.3
Utilities........................................................................................................................ 1,193 21.6Electric power generation, transmission, and distribution....................................... 637 22.7Natural gas distribution........................................................................................... 125 18.4Electric and gas, and other combinations............................................................... 60 30.7Water, steam, air-conditioning, and irrigation systems........................................... 241 20.3Sewage treatment facilities..................................................................................... 104 11.7Not specified utilities............................................................................................... 26 -
Information..................................................................................................................... 3,566 42.1Newspaper publishers............................................................................................ 419 46.0Publishing, except newspapers and software......................................................... 314 54.5Software publishing………….................................................................................. 139 28.5Motion pictures and video industries....................................................................... 359 35.8Sound recording industries..................................................................................... 40 - Radio and television broadcasting and cable......................................................... 609 36.8Internet publishing and broadcasting...................................................................... 26 - Wired telecommunications carriers......................................................................... 923 37.0Other telecommunications services........................................................................ 293 39.0
See note at end of table.
Industry Total employed Percent women
46
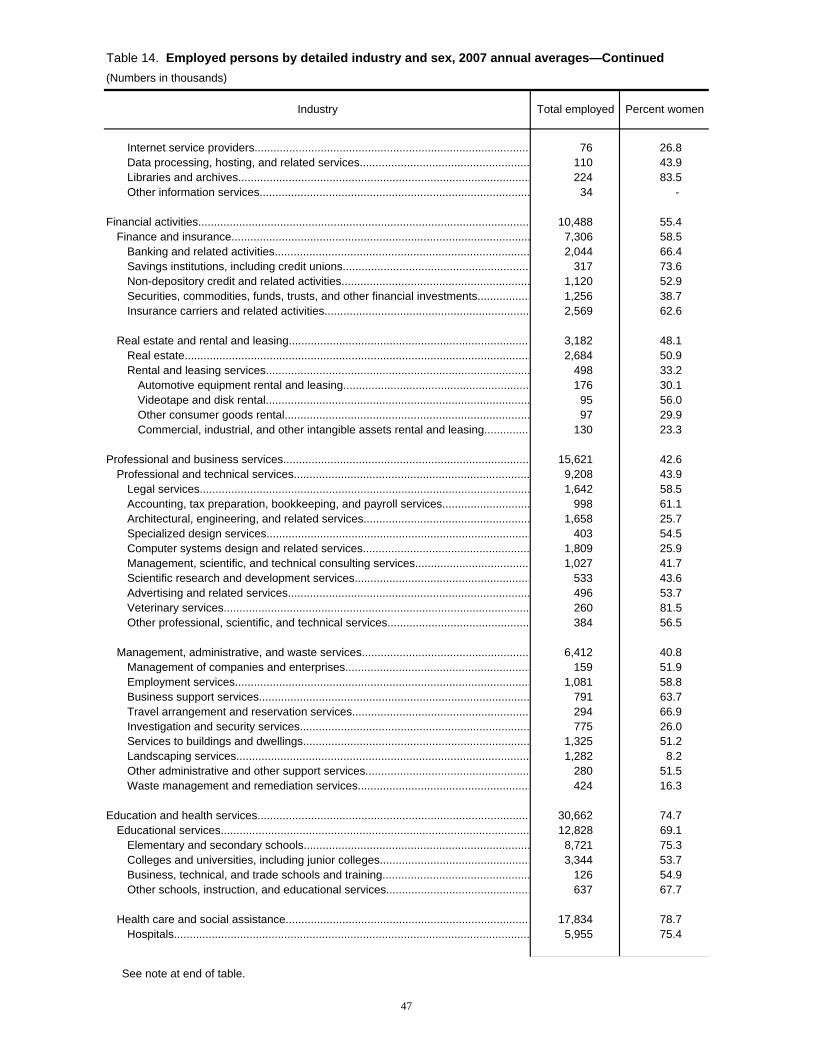
Table 14. Employed persons by detailed industry and sex, 2007 annual averages—Continued(Numbers in thousands)
Internet service providers........................................................................................ 76 26.8Data processing, hosting, and related services...................................................... 110 43.9Libraries and archives............................................................................................. 224 83.5Other information services...................................................................................... 34 -
Financial activities.......................................................................................................... 10,488 55.4Finance and insurance............................................................................................... 7,306 58.5
Banking and related activities................................................................................. 2,044 66.4Savings institutions, including credit unions............................................................ 317 73.6Non-depository credit and related activities............................................................ 1,120 52.9Securities, commodities, funds, trusts, and other financial investments................. 1,256 38.7Insurance carriers and related activities................................................................. 2,569 62.6
Real estate and rental and leasing............................................................................. 3,182 48.1Real estate.............................................................................................................. 2,684 50.9Rental and leasing services.................................................................................... 498 33.2
Automotive equipment rental and leasing........................................................... 176 30.1Videotape and disk rental.................................................................................... 95 56.0Other consumer goods rental.............................................................................. 97 29.9Commercial, industrial, and other intangible assets rental and leasing............... 130 23.3
Professional and business services.............................................................................. 15,621 42.6Professional and technical services........................................................................... 9,208 43.9
Legal services......................................................................................................... 1,642 58.5Accounting, tax preparation, bookkeeping, and payroll services............................ 998 61.1Architectural, engineering, and related services..................................................... 1,658 25.7Specialized design services.................................................................................... 403 54.5Computer systems design and related services..................................................... 1,809 25.9Management, scientific, and technical consulting services..................................... 1,027 41.7Scientific research and development services........................................................ 533 43.6Advertising and related services............................................................................. 496 53.7Veterinary services................................................................................................. 260 81.5Other professional, scientific, and technical services............................................. 384 56.5
Management, administrative, and waste services...................................................... 6,412 40.8Management of companies and enterprises........................................................... 159 51.9Employment services.............................................................................................. 1,081 58.8Business support services...................................................................................... 791 63.7Travel arrangement and reservation services......................................................... 294 66.9Investigation and security services......................................................................... 775 26.0Services to buildings and dwellings........................................................................ 1,325 51.2Landscaping services............................................................................................. 1,282 8.2Other administrative and other support services.................................................... 280 51.5Waste management and remediation services....................................................... 424 16.3
Education and health services....................................................................................... 30,662 74.7Educational services.................................................................................................. 12,828 69.1
Elementary and secondary schools........................................................................ 8,721 75.3Colleges and universities, including junior colleges................................................ 3,344 53.7Business, technical, and trade schools and training............................................... 126 54.9Other schools, instruction, and educational services.............................................. 637 67.7
Health care and social assistance.............................................................................. 17,834 78.7Hospitals................................................................................................................. 5,955 75.4
See note at end of table.
Industry Total employed Percent women
47

Table 14. Employed persons by detailed industry and sex, 2007 annual averages—Continued(Numbers in thousands)
Health services, except hospitals............................................................................ 8,733 78.8Offices of physicians............................................................................................ 1,720 75.8Offices of dentists................................................................................................ 843 80.9Offices of chiropractors........................................................................................ 144 62.4Offices of optometrists......................................................................................... 114 76.9Offices of other health practitioners..................................................................... 299 76.2Outpatient care centers....................................................................................... 881 75.5Home health care services.................................................................................. 959 90.0Other health care services................................................................................... 1,334 70.1Nursing care facilities.......................................................................................... 1,689 87.1Residential care facilities, without nursing........................................................... 749 74.0
Social assistance.................................................................................................... 3,147 84.8Individual and family services.............................................................................. 1,282 77.2Community food and housing, and emergency services..................................... 123 68.9Vocational rehabilitation services........................................................................ 181 63.0Child day care services....................................................................................... 1,560 94.9
Leisure and hospitality................................................................................................... 12,415 51.4Arts, entertainment, and recreation............................................................................ 2,833 46.6
Independent artists, performing arts, spectator sports, and related industries....... 773 42.5Museums, art galleries, historical sites, and similar institutions.............................. 399 45.4Bowling centers....................................................................................................... 47 - Other amusement, gambling, and recreation industries......................................... 1,614 49.0
Accommodation and food services............................................................................ 9,582 52.8Accommodation...................................................................................................... 1,463 55.9
Traveler accommodation..................................................................................... 1,374 56.7Recreational vehicle parks and camps, and rooming and boarding houses....... 89 43.9
Food services and drinking places.......................................................................... 8,119 52.2Restaurants and other food services................................................................... 7,857 52.2Drinking places, alcoholic beverages.................................................................. 261 52.1
Other services................................................................................................................ 6,972 52.0Other services, except private households................................................................ 6,159 47.0
Repair and maintenance......................................................................................... 2,105 12.9Automotive repair and maintenance.................................................................... 1,261 10.3Car washes.......................................................................................................... 154 17.6Electronic and precision equipment repair and maintenance.............................. 174 16.7Commercial and industrial machinery and equipment repair and maintenance.. 323 7.9Personal and household goods repair and maintenance.................................... 188 31.0Footwear and leather goods repair...................................................................... 5 -
Personal and laundry services................................................................................ 2,218 72.6Barber shops....................................................................................................... 103 26.7Beauty salons...................................................................................................... 942 91.4Nail salons and other personal care services...................................................... 358 80.6Drycleaning and laundry services........................................................................ 369 57.5Funeral homes, cemeteries, and crematories..................................................... 117 32.1Other personal services....................................................................................... 330 55.7
Membership associations and organizations.......................................................... 1,836 55.0Religious organizations....................................................................................... 1,066 48.6Civic, social, advocacy organizations, and grantmaking and giving services...... 519 67.5Labor unions........................................................................................................ 63 42.1Business, professional, political, and similar organizations................................. 188 61.4
Private households..................................................................................................... 813 90.7
See note at end of table.
Industry Total employed Percent women
48

Table 14. Employed persons by detailed industry and sex, 2007 annual averages—Continued(Numbers in thousands)
Public administration...................................................................................................... 6,746 44.9Executive offices and legislative bodies.................................................................. 883 54.0Public finance activities........................................................................................... 358 62.7Other general government and support.................................................................. 130 32.6Justice, public order, and safety activities............................................................... 2,864 35.3Administration of human resource programs.......................................................... 907 71.1Administration of environmental quality and housing programs............................. 323 37.7Administration of economic programs and space research.................................... 581 45.8National security and international affairs............................................................... 699 34.0
Industry Total employed Percent women
n.e.c. = not elsewhere classified. NOTE: Dash indicates data not shown for industries where employment base is less than 50,000.
SOURCE: Current Population Survey, U.S. Department of Labor, U.S. Bureau of Labor Statistics.
49

Table 15. Employed women by industry, race, and Hispanic or Latino ethnicity, 2007 annual averages(Percent distribution)
Total, 16 years and over (thousands)……………..…… 54,503 8,551 3,162 8,072 Percent…………………………………………………… 100.0 100.0 100.0 100.0
Agriculture and related industries ....................................... 0.8 0.1 0.4 0.9Mining ................................................................................. .2 - - .1Construction ....................................................................... 1.8 .7 .9 1.5Manufacturing ..................................................................... 7.1 6.7 10.4 9.7 Durable goods .................................................................. 4.0 3.2 6.2 4.4 Nondurable goods ............................................................ 3.1 3.5 4.2 5.3Wholesale and retail trade ................................................. 14.2 11.7 12.9 14.9 Wholesale trade ............................................................... 2.0 1.1 2.4 2.2 Retail trade ....................................................................... 12.3 10.6 10.5 12.7Transportation and utilities ................................................. 2.5 4.4 2.8 2.8 Transportation and warehousing ...................................... 2.1 4.0 2.3 2.5 Utilities .............................................................................. .4 .4 .5 .3Information ......................................................................... 2.2 2.5 1.9 1.6Financial activities .............................................................. 8.7 7.8 8.7 7.5 Finance and insurance ..................................................... 6.3 6.2 6.7 5.3 Real estate and rental and leasing ................................... 2.4 1.6 1.9 2.3Professional and business services ................................... 10.0 8.4 10.9 9.8 Professional and technical services ................................. 6.3 3.2 8.4 3.7 Management, administrative, and waste services............ 3.7 5.2 2.5 6.1Education and health services ........................................... 33.5 37.9 29.9 27.6 Educational services ........................................................ 13.7 11.0 8.6 9.5 Health care and social assistance .................................... 19.7 26.9 21.3 18.1 Hospitals ......................................................................... 6.3 8.0 9.3 4.0 Health services, except hospitals ................................... 9.7 13.2 9.3 9.3 Social assistance ............................................................ 3.7 5.7 2.7 4.9Leisure and hospitality ....................................................... 9.4 8.5 10.5 13.0 Arts, entertainment, and recreation .................................. 2.0 1.3 1.9 1.5 Accommodation and food services .................................. 7.4 7.1 8.6 11.4Other services .................................................................... 5.4 4.2 7.1 7.0 Other services, except private households ...................... 4.3 3.1 6.3 3.8 Private households ........................................................... 1.1 1.0 .8 3.2Public administration .......................................................... 4.1 7.0 3.7 3.5
Hispanic or Latino
ethnicityIndustry White
Black or African
AmericanAsian
NOTE: Dash indicates no data or data that do not meet publication criteria.
SOURCE: Current Population Survey, U.S. Department of Labor, U.S. Bureau of Labor Statistics.
50

Table 16. Median usual weekly earnings of full-time wage and salary workers in current dollars by race, Hispanic or Latino ethnicity, and sex, 1979-2007 annual averages
1979……. $241 $248 $199 - $194 $182 $184 $169 - $157
1980……. 262 269 212 - 209 201 203 185 - 1721981……. 284 291 235 - 223 219 221 206 - 1901982……. 302 310 245 - 240 239 242 217 - 2031983……. 313 320 261 - 250 252 254 232 - 2151984……. 326 336 269 - 259 265 268 241 - 2231985……… 344 356 277 - 270 277 281 252 - 2301986 1…… 359 371 291 - 277 291 294 264 - 2411987……. 374 384 301 - 285 303 307 276 - 2511988……… 385 395 314 - 290 315 318 288 - 2601989……. 399 409 319 - 298 328 334 301 - 269
1990 1…… 412 424 329 - 304 346 353 308 - 2781991……. 426 442 348 - 312 366 373 323 - 2921992……. 440 458 357 - 321 380 387 335 - 3021993……. 459 475 369 - 331 393 401 348 - 3131994 1…… 467 484 371 - 324 399 408 346 - 3051995……. 479 494 383 - 329 406 415 355 - 3051996……. 490 506 387 - 339 418 428 362 - 3161997 1…… 503 519 400 - 351 431 444 375 - 3181998 1…… 523 545 426 - 370 456 468 400 - 3371999 1…… 549 573 445 - 385 473 483 409 - 348
2000 1…… 576 590 474 $615 399 493 502 429 $547 3662001……. 596 610 491 639 417 512 522 454 563 3882002……. 608 623 498 658 424 529 547 473 566 3972003 1…… 620 636 514 693 440 552 567 491 598 4102004……. 638 657 525 708 456 573 584 505 613 4192005…… 651 672 520 753 471 585 596 499 665 4292006……. 671 690 554 784 486 600 609 519 699 4402007……. 695 716 569 830 503 614 626 533 731 473
See footnote at end of table.
Year
Total, both sexes Women
Hispanic or Latino
ethnicityTotal White
Black or African
AmericanAsian
Hispanic or Latino
ethnicityTotal White
Black or African
AmericanAsian
51
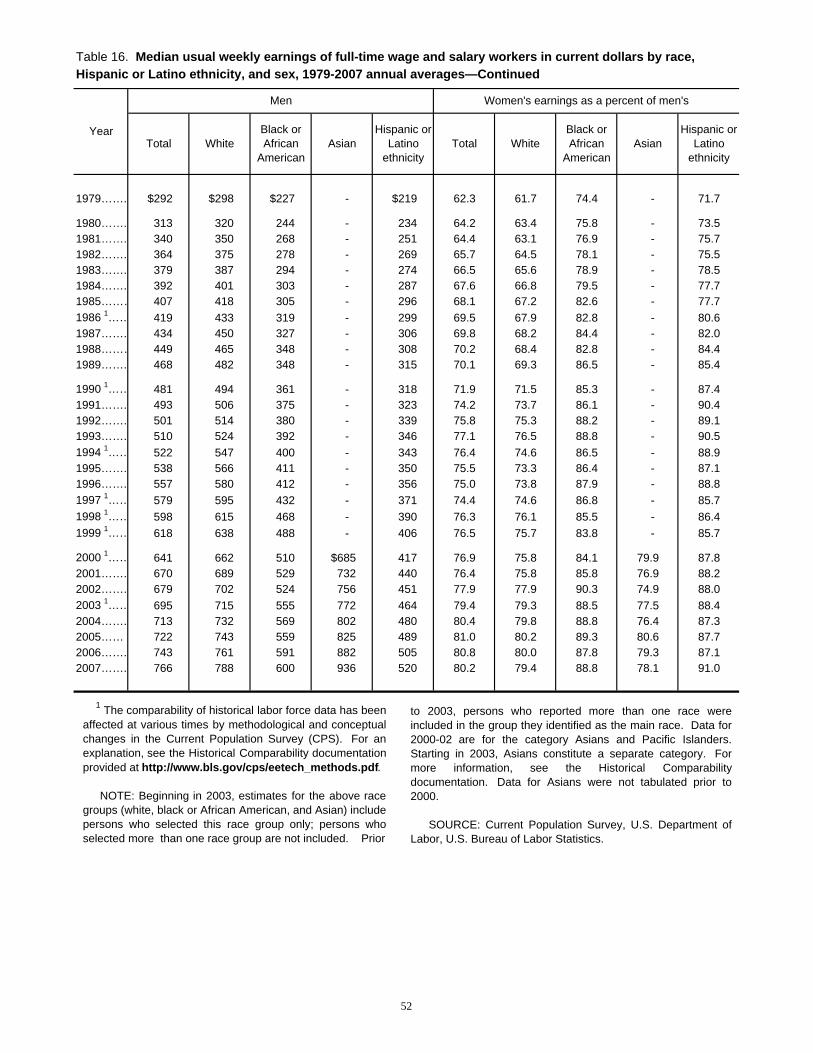
Table 16. Median usual weekly earnings of full-time wage and salary workers in current dollars by race, Hispanic or Latino ethnicity, and sex, 1979-2007 annual averages—Continued
1979……. $292 $298 $227 - $219 62.3 61.7 74.4 - 71.7
1980……. 313 320 244 - 234 64.2 63.4 75.8 - 73.5 1981……. 340 350 268 - 251 64.4 63.1 76.9 - 75.7 1982……. 364 375 278 - 269 65.7 64.5 78.1 - 75.5 1983……. 379 387 294 - 274 66.5 65.6 78.9 - 78.5 1984……. 392 401 303 - 287 67.6 66.8 79.5 - 77.7 1985……… 407 418 305 - 296 68.1 67.2 82.6 - 77.7 1986 1…… 419 433 319 - 299 69.5 67.9 82.8 - 80.6 1987……. 434 450 327 - 306 69.8 68.2 84.4 - 82.0 1988……… 449 465 348 - 308 70.2 68.4 82.8 - 84.4 1989……. 468 482 348 - 315 70.1 69.3 86.5 - 85.4
1990 1…… 481 494 361 - 318 71.9 71.5 85.3 - 87.4 1991……. 493 506 375 - 323 74.2 73.7 86.1 - 90.4 1992……. 501 514 380 - 339 75.8 75.3 88.2 - 89.1 1993……. 510 524 392 - 346 77.1 76.5 88.8 - 90.5 1994 1…… 522 547 400 - 343 76.4 74.6 86.5 - 88.9 1995……. 538 566 411 - 350 75.5 73.3 86.4 - 87.1 1996……. 557 580 412 - 356 75.0 73.8 87.9 - 88.8 1997 1…… 579 595 432 - 371 74.4 74.6 86.8 - 85.7 1998 1…… 598 615 468 - 390 76.3 76.1 85.5 - 86.4 1999 1…… 618 638 488 - 406 76.5 75.7 83.8 - 85.7
2000 1…… 641 662 510 $685 417 76.9 75.8 84.1 79.9 87.8 2001……. 670 689 529 732 440 76.4 75.8 85.8 76.9 88.2 2002……. 679 702 524 756 451 77.9 77.9 90.3 74.9 88.0 2003 1…… 695 715 555 772 464 79.4 79.3 88.5 77.5 88.4 2004……. 713 732 569 802 480 80.4 79.8 88.8 76.4 87.3 2005…… 722 743 559 825 489 81.0 80.2 89.3 80.6 87.7 2006……. 743 761 591 882 505 80.8 80.0 87.8 79.3 87.1 2007……. 766 788 600 936 520 80.2 79.4 88.8 78.1 91.0
Year
Men Women's earnings as a percent of men's
Total WhiteBlack or African
AmericanAsian
Hispanic or Latino
ethnicity
Hispanic or Latino
ethnicityTotal White
Black or African
AmericanAsian
1 The comparability of historical labor force data has beenaffected at various times by methodological and conceptualchanges in the Current Population Survey (CPS). For anexplanation, see the Historical Comparability documentationprovided at http://www.bls.gov/cps/eetech_methods.pdf.
NOTE: Beginning in 2003, estimates for the above racegroups (white, black or African American, and Asian) includepersons who selected this race group only; persons whoselected more than one race group are not included. Prior
to 2003, persons who reported more than one race wereincluded in the group they identified as the main race. Data for2000-02 are for the category Asians and Pacific Islanders.Starting in 2003, Asians constitute a separate category. Formore information, see the Historical Comparabilitydocumentation. Data for Asians were not tabulated prior to2000.
SOURCE: Current Population Survey, U.S. Department ofLabor, U.S. Bureau of Labor Statistics.
52

Table 17. Median usual weekly earnings of employed full-time wage and salary workers 25 years and over by educational attainment and sex, 2007 annual averages
Total, both sexes
Total……………….………………………… 96,089 $738 Less than a high school diploma ………… 8,746 428 High school graduate or more1…………. 87,344 773 High school graduates, no college 1…… 27,997 604 Some college or associate degree……… 26,190 704 Some college, no degree…………….… 16,486 683 Associate degree………………….…… 9,704 740 Occupational program…………...…… 4,812 732 Academic program…………….……… 4,891 749 College graduates, total………………… 33,157 1,072 Bachelor's degree……………….……… 21,673 987 Master's degree…………………...…… 8,367 1,165 Professional degree…..……………..… 1,646 1,427 Doctoral degree…………...…………… 1,471 1,497
Women
Total……………………………..…………… 42,249 646 Less than a high school diploma………… 2,756 369 High school graduate or more1…………. 39,493 673 High school graduates, no college 1…… 11,744 512 Some college or associate degree……… 12,475 609 Some college, no degree…………….… 7,625 592 Associate degree………………….…… 4,850 640 Occupational program…………...…… 2,296 620 Academic program…………….……… 2,554 661 College graduates, total………………… 15,274 932 Bachelor's degree……………...……… 9,974 860 Master's degree………………...……… 4,193 1,034 Professional degree……………….…… 621 1,177 Doctoral degree……………………..…… 487 1,279
Educational attainment and sex Total employed (in thousands)
Median weekly earnings
53

Table 17. Median usual weekly earnings of employed full-time wage and salary workers 25 years and over by educational attainment and sex, 2007 annual averages—Continued
Men
Total……………………….………………… 53,840 $823 Less than a high school diploma………… 5,990 481 High school graduate or more1…………. 47,851 883 High school graduates, no college 1…… 16,253 689 Some college or associate degree……… 13,715 810 Some college, no degree…………….… 8,861 784 Associate degree………………….…… 4,854 857 Occupational program…………...…… 2,516 852 Academic program…………….……… 2,338 862 College graduates, total………………… 17,883 1,243 Bachelor's degree………………….…… 11,699 1,147 Master's degree……………...………… 4,174 1,375 Professional degree…………...………… 1,025 1,612 Doctoral degree………………….……… 984 1,606
Educational attainment and sex Total employed (in thousands)
Median weekly earnings
1 Includes persons with a high school diploma or equivalent.
SOURCE: Current Population Survey, U.S. Department of Labor, U.S. Bureau of Labor Statistics.
54

Table 18. Median usual weekly earnings of full-time wage and salary workers by detailed occupation and sex,2007 annual averages(Numbers in thousands)
Total, 16 years and older…………………………………… 107,339 $695 47,041 $614 60,298 $766 80.2Management, professional, and related occupations…… 39,147 996 19,924 858 19,222 1,187 72.3
Management, business, and financial operations occupations…………………………………… 15,977 1,080 7,293 908 8,684 1,261 72.0
Management occupations……………………………… 11,009 1,161 4,438 963 6,570 1,337 72.0Chief executives……………………………………… 1,043 1,882 267 1,536 776 1,918 80.1General and operations managers………………… 893 1,221 249 987 644 1,332 74.1Legislators……………………………………………… 10 ( 1 ) 5 ( 1 ) 5 ( 1 ) ( ² )Advertising and promotions managers……………… 69 965 41 ( 1 ) 29 ( 1 ) ( ² )Marketing and sales managers……………………… 784 1,319 296 1,028 488 1,511 68.0Public relations managers…………………………… 60 1,145 30 ( 1 ) 29 ( 1 ) ( ² )Administrative services managers…………………… 97 1,057 28 ( 1 ) 69 1,068 ( ² )Computer and information systems managers…… 444 1,553 123 1,363 321 1,596 85.4Financial managers…………………………………… 1,070 1,078 575 909 495 1,452 62.6Human resources managers………………………… 238 1,208 166 1,073 72 1,581 67.9Industrial production managers……………………… 253 1,216 41 ( 1 ) 211 1,244 ( ² )Purchasing managers………………………………… 154 1,240 64 1,054 90 1,374 76.7Transportation, storage, and distribution managers……………………………… 252 845 43 ( 1 ) 208 836 ( ² )Farm, ranch, and other agricultural managers……… 86 713 19 ( 1 ) 67 693 ( ² )Construction managers……………………………… 546 1,143 48 ( 1 ) 497 1,155 ( ² )Education administrators……………………………. 713 1,131 454 960 259 1,371 70.0Engineering managers………………………………… 116 1,713 9 ( 1 ) 107 1,748 ( ² )Food service managers……………………………… 646 645 308 584 338 731 79.9Funeral directors……….……………………………… 31 ( 1 ) 9 ( 1 ) 22 ( 1 ) ( ² )Gaming managers……………..……………………… 6 ( 1 ) 1 ( 1 ) 5 ( 1 ) ( ² )Lodging managers…………………………………… 104 696 56 618 48 ( 1 ) ( ² )Medical and health services managers……………… 448 1,136 326 1,063 122 1,414 75.2Natural sciences managers………………………… 10 ( 1 ) 5 ( 1 ) 6 ( 1 ) ( ² )Postmasters and mail superintendents……………… 35 ( 1 ) 16 ( 1 ) 19 ( 1 ) ( ² )Property, real estate, and community association managers……….. ……… 338 787 197 732 140 970 75.5Social and community service managers…………… 269 962 164 913 105 1,063 85.9Managers, all other…………………………………… 2,296 1,180 897 1,006 1,399 1,307 77.0
Business and financial operations occupations……… 4,968 941 2,854 832 2,114 1,131 73.6Agents and business managers of artists, performers, and athletes…………………… 23 ( 1 ) 8 ( 1 ) 14 ( 1 ) ( ² )Purchasing agents and buyers, farm products…… 7 ( 1 ) 1 ( 1 ) 6 ( 1 ) ( ² )Wholesale and retail buyers, except farm products………………………………… 157 750 81 737 77 794 92.8Purchasing agents, except wholesale, retail, and farm products………………………………………… 260 854 148 753 112 992 75.9Claims adjusters, appraisers, examiners, and investigators…………………………………… 270 809 164 743 106 898 82.7Compliance officers, except agriculture, construction, health and safety, and transportation………………………………………… 125 936 63 747 62 1,124 66.5Cost estimators………………………………………… 104 1,034 16 ( 1 ) 89 1,063 ( ² )Human resources, training, and labor relations specialists…………………………………………… 731 875 517 811 215 1,037 78.2Logisticians…………………………………………… 53 990 22 ( 1 ) 30 ( 1 ) ( ² )Management analysts………………………………… 352 1,200 166 1,083 186 1,388 78.0Meeting and convention planners…………………… 31 ( 1 ) 26 ( 1 ) 5 ( 1 ) ( ² )
See footnotes at end of table.
Occupation
Both sexes Women MenWomen's earnings
as percent of men's
Total employed
Median weekly
earnings
Total employed
Median weekly
earnings
Total employed
Median weekly
earnings
55
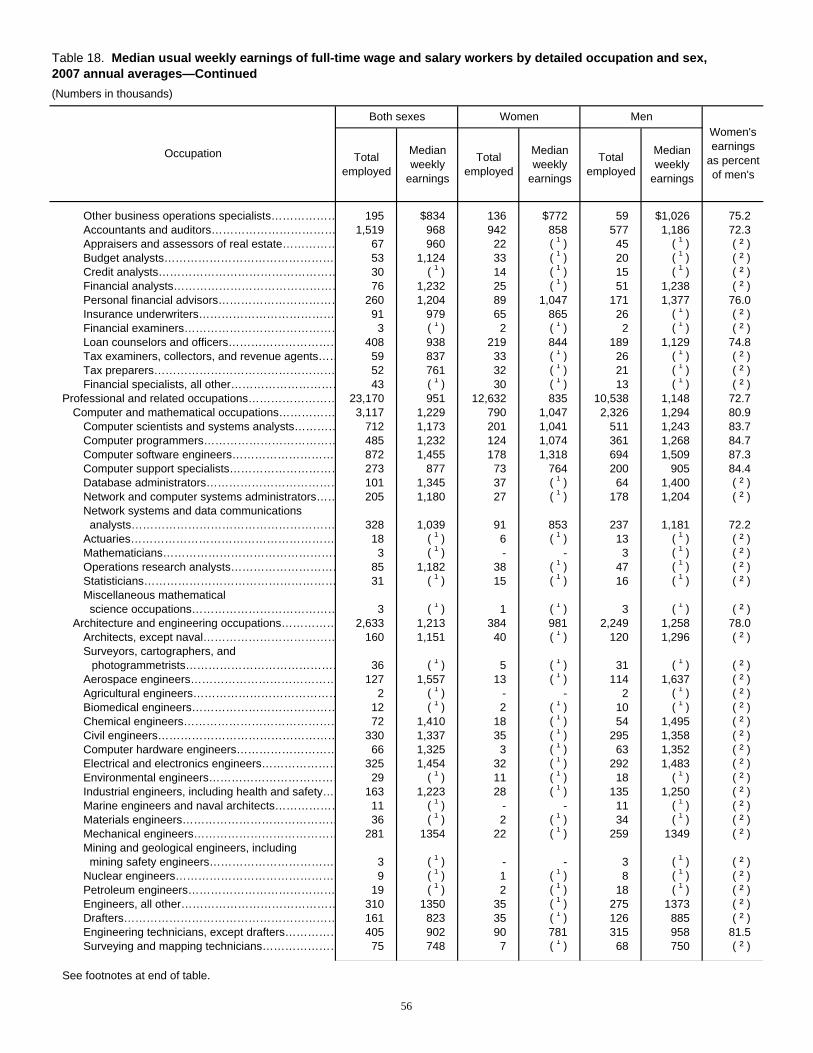
Table 18. Median usual weekly earnings of full-time wage and salary workers by detailed occupation and sex,2007 annual averages—Continued(Numbers in thousands)
Other business operations specialists……………… 195 $834 136 $772 59 $1,026 75.2Accountants and auditors…………………………… 1,519 968 942 858 577 1,186 72.3Appraisers and assessors of real estate…………… 67 960 22 ( 1 ) 45 ( 1 ) ( ² )Budget analysts……………………………………… 53 1,124 33 ( 1 ) 20 ( 1 ) ( ² )Credit analysts………………………………………… 30 ( 1 ) 14 ( 1 ) 15 ( 1 ) ( ² )Financial analysts……………………………………… 76 1,232 25 ( 1 ) 51 1,238 ( ² )Personal financial advisors…………………………… 260 1,204 89 1,047 171 1,377 76.0Insurance underwriters……………………………… 91 979 65 865 26 ( 1 ) ( ² )Financial examiners…………………………………… 3 ( 1 ) 2 ( 1 ) 2 ( 1 ) ( ² )Loan counselors and officers………………………… 408 938 219 844 189 1,129 74.8Tax examiners, collectors, and revenue agents…… 59 837 33 ( 1 ) 26 ( 1 ) ( ² )Tax preparers………………………………………… 52 761 32 ( 1 ) 21 ( 1 ) ( ² )Financial specialists, all other………………………… 43 ( 1 ) 30 ( 1 ) 13 ( 1 ) ( ² )
Professional and related occupations…………………… 23,170 951 12,632 835 10,538 1,148 72.7Computer and mathematical occupations…………… 3,117 1,229 790 1,047 2,326 1,294 80.9
Computer scientists and systems analysts………… 712 1,173 201 1,041 511 1,243 83.7Computer programmers……………………………… 485 1,232 124 1,074 361 1,268 84.7Computer software engineers……………………… 872 1,455 178 1,318 694 1,509 87.3Computer support specialists………………………… 273 877 73 764 200 905 84.4Database administrators……………………………… 101 1,345 37 ( 1 ) 64 1,400 ( ² )Network and computer systems administrators…… 205 1,180 27 ( 1 ) 178 1,204 ( ² )Network systems and data communications analysts……………………………………………… 328 1,039 91 853 237 1,181 72.2Actuaries……………………………………………… 18 ( 1 ) 6 ( 1 ) 13 ( 1 ) ( ² )Mathematicians………………………………………… 3 ( 1 ) - - 3 ( 1 ) ( ² )Operations research analysts………………………… 85 1,182 38 ( 1 ) 47 ( 1 ) ( ² )Statisticians…………………………………………… 31 ( 1 ) 15 ( 1 ) 16 ( 1 ) ( ² )Miscellaneous mathematical science occupations………………………………… 3 ( 1 ) 1 ( 1 ) 3 ( 1 ) ( ² )
Architecture and engineering occupations…………… 2,633 1,213 384 981 2,249 1,258 78.0Architects, except naval……………………………… 160 1,151 40 ( 1 ) 120 1,296 ( ² )Surveyors, cartographers, and
photogrammetrists…………………………………… 36 ( 1 ) 5 ( 1 ) 31 ( 1 ) ( ² )Aerospace engineers………………………………… 127 1,557 13 ( 1 ) 114 1,637 ( ² )Agricultural engineers………………………………… 2 ( 1 ) - - 2 ( 1 ) ( ² )Biomedical engineers………………………………… 12 ( 1 ) 2 ( 1 ) 10 ( 1 ) ( ² )Chemical engineers…………………………………… 72 1,410 18 ( 1 ) 54 1,495 ( ² )Civil engineers………………………………………… 330 1,337 35 ( 1 ) 295 1,358 ( ² )Computer hardware engineers……………………… 66 1,325 3 ( 1 ) 63 1,352 ( ² )Electrical and electronics engineers………………… 325 1,454 32 ( 1 ) 292 1,483 ( ² )Environmental engineers……………………………… 29 ( 1 ) 11 ( 1 ) 18 ( 1 ) ( ² )Industrial engineers, including health and safety… 163 1,223 28 ( 1 ) 135 1,250 ( ² )Marine engineers and naval architects……………… 11 ( 1 ) - - 11 ( 1 ) ( ² )Materials engineers…………………………………… 36 ( 1 ) 2 ( 1 ) 34 ( 1 ) ( ² )Mechanical engineers………………………………… 281 1354 22 ( 1 ) 259 1349 ( ² )Mining and geological engineers, including mining safety engineers…………………………… 3 ( 1 ) - - 3 ( 1 ) ( ² )Nuclear engineers…………………………………… 9 ( 1 ) 1 ( 1 ) 8 ( 1 ) ( ² )Petroleum engineers………………………………… 19 ( 1 ) 2 ( 1 ) 18 ( 1 ) ( ² )Engineers, all other…………………………………… 310 1350 35 ( 1 ) 275 1373 ( ² )Drafters………………………………………………… 161 823 35 ( 1 ) 126 885 ( ² )Engineering technicians, except drafters…………… 405 902 90 781 315 958 81.5Surveying and mapping technicians………………… 75 748 7 ( 1 ) 68 750 ( ² )
See footnotes at end of table.
Occupation
Both sexes Women MenWomen's earnings
as percent of men's
Total employed
Median weekly
earnings
Total employed
Median weekly
earnings
Total employed
Median weekly
earnings
56

Table 18. Median usual weekly earnings of full-time wage and salary workers by detailed occupation and sex,2007 annual averages—Continued(Numbers in thousands)
Life, physical, and social science occupations……… 1,152 $1,053 469 $939 683 $1,151 81.6Agricultural and food scientists……………………… 17 ( 1 ) 4 ( 1 ) 13 ( 1 ) ( ² )Biological scientists…………………………………… 81 1,004 34 ( 1 ) 46 ( 1 ) ( ² )Conservation scientists and foresters……………… 29 ( 1 ) 4 ( 1 ) 25 ( 1 ) ( ² )Medical scientists……………………………………… 145 1,098 66 856 78 1,374 62.3Astronomers and physicists………………………… 16 ( 1 ) 4 ( 1 ) 12 ( 1 ) ( ² )Atmospheric and space scientists…………………… 7 ( 1 ) - - 7 ( 1 ) ( ² )Chemists and materials scientists…………………… 120 1,149 53 980 67 1,354 72.4Environmental scientists and geoscientists………… 78 1,080 20 ( 1 ) 58 1,159 ( ² )Physical scientists, all other………………………… 120 1,371 41 ( 1 ) 78 1,531 ( ² )Economists…………………………………………… 20 ( 1 ) 4 ( 1 ) 15 ( 1 ) ( ² )Market and survey researchers……………………… 122 1,062 68 1,035 54 1,160 89.2Psychologists………………………………………… 100 1,170 63 1,152 38 ( 1 ) ( ² )Sociologists…………………………………………… 8 ( 1 ) 7 ( 1 ) 1 ( 1 ) ( ² )Urban and regional planners………………………… 29 ( 1 ) 5 ( 1 ) 24 ( 1 ) ( ² )Miscellaneous social scientists and related workers………………………………………………… 30 ( 1 ) 15 ( 1 ) 14 ( 1 ) ( ² )Agricultural and food science technicians………… 19 ( 1 ) 7 ( 1 ) 12 ( 1 ) ( ² )Biological technicians………………………………… 19 ( 1 ) 5 ( 1 ) 13 ( 1 ) ( ² )Chemical technicians………………………………… 57 785 21 ( 1 ) 37 ( 1 ) ( ² )Geological and petroleum technicians……………… 16 ( 1 ) 4 ( 1 ) 12 ( 1 ) ( ² )Nuclear technicians…………………………………… 2 ( 1 ) - - 2 ( 1 ) ( ² )Other life, physical, and social science technicians…………………………………………… 117 749 41 ( 1 ) 76 833 ( ² )
Community and social services occupations………… 1,893 755 1,117 720 776 807 89.2Counselors……………………………………………… 577 760 375 724 202 833 86.9Social workers………………………………………… 587 757 475 754 112 764 98.7Miscellaneous community and social service specialists…………………………………………… 272 680 169 636 103 788 80.7Clergy…………………………………………………… 359 797 46 ( 1 ) 313 832 ( ² )Directors, religious activities and education………… 35 ( 1 ) 20 ( 1 ) 16 ( 1 ) ( ² )Religious workers, all other…………………………… 62 668 32 ( 1 ) 30 ( 1 ) ( ² )
Legal occupations……………………………………… 1,167 1,148 663 930 505 1,579 58.9Lawyers………………………………………………… 624 1,591 231 1,381 393 1,783 77.5Judges, magistrates, and other judicial workers…… 67 1,728 26 ( 1 ) 41 ( 1 ) ( ² )Paralegals and legal assistants……………………… 285 797 251 789 34 ( 1 ) ( ² )Miscellaneous legal support workers……………… 192 722 155 662 37 ( 1 ) ( ² )
Education, training, and library occupations………… 6,500 841 4,690 784 1,810 1,007 77.9Postsecondary teachers……………………………… 860 1,131 370 962 491 1,239 77.6Preschool and kindergarten teachers……………… 488 567 473 561 15 ( 1 ) ( ² )Elementary and middle school teachers…………… 2,595 863 2,081 847 514 938 90.3Secondary school teachers…………………………… 1,028 944 558 900 471 1,001 89.9Special education teachers…………………………… 323 881 265 886 58 860 103.0Other teachers and instructors……………………… 335 766 188 685 147 987 69.4Archivists, curators, and museum technicians……… 31 ( 1 ) 23 ( 1 ) 8 ( 1 ) ( ² )Librarians……………………………………………… 169 861 134 846 35 ( 1 ) ( ² )Library technicians…………………………………… 22 ( 1 ) 12 ( 1 ) 11 ( 1 ) ( ² )Teacher assistants…………………………………… 600 410 553 406 47 ( 1 ) ( ² )Other education, training, and library workers……… 49 ( 1 ) 34 ( 1 ) 14 ( 1 ) ( ² )
Arts, design, entertainment, sports, and media occupations…………………………………………… 1,568 829 689 732 879 920 79.6Artists and related workers…………………………… 78 953 31 ( 1 ) 47 ( 1 ) ( ² )Designers……………………………………………… 553 776 275 697 278 894 78.0
See footnotes at end of table.
Occupation
Both sexes Women MenWomen's earnings
as percent of men's
Total employed
Median weekly
earnings
Total employed
Median weekly
earnings
Total employed
Median weekly
earnings
57

Table 18. Median usual weekly earnings of full-time wage and salary workers by detailed occupation and sex,2007 annual averages—Continued(Numbers in thousands)
Actors…………………………………………………… 10 ( 1 ) 6 ( 1 ) 3 ( 1 ) ( ² )Producers and directors……………………………… 93 $1,008 29 ( 1 ) 64 $988 ( ² )Athletes, coaches, umpires, and related workers… 119 773 25 ( 1 ) 94 798 ( ² )Dancers and choreographers………………………… 12 ( 1 ) 8 ( 1 ) 5 ( 1 ) ( ² )Musicians, singers, and related workers…………… 32 ( 1 ) 10 ( 1 ) 22 ( 1 ) ( ² )Entertainers and performers, sports and related workers, all other…………………………………… 14 ( 1 ) 7 ( 1 ) 7 ( 1 ) ( ² )Announcers…………………………………………… 31 ( 1 ) 10 ( 1 ) 21 ( 1 ) ( ² )News analysts, reporters and correspondents…… 63 943 27 ( 1 ) 36 ( 1 ) ( ² )Public relations specialists…………………………… 110 851 70 $804 39 ( 1 ) ( ² )Editors………………………………………………… 134 931 59 804 75 979 82.1Technical writers……………………………………… 47 ( 1 ) 25 ( 1 ) 22 ( 1 ) ( ² )Writers and authors…………………………………… 80 999 46 ( 1 ) 34 ( 1 ) ( ² )Miscellaneous media and communication workers… 37 ( 1 ) 25 ( 1 ) 12 ( 1 ) ( ² )Broadcast and sound engineering technicians and radio operators……………………... ………… 70 864 10 ( 1 ) 60 893 ( ² )Photographers………………………………………… 61 660 26 ( 1 ) 35 ( 1 ) ( ² )Television, video, and motion picture camera operators and editors………………………………… 25 ( 1 ) 1 ( 1 ) 24 ( 1 ) ( ² )
Healthcare practitioner and technical occupations…… 5,140 920 3,830 875 1,310 1,156 75.7Chiropractors…………………………………………… 6 ( 1 ) 2 ( 1 ) 4 ( 1 ) ( ² )Dentists………………………………………………… 36 ( 1 ) 17 ( 1 ) 19 ( 1 ) ( ² )Dietitians and nutritionists…………………………… 76 734 70 720 6 ( 1 ) ( ² )Optometrists…………………………………………… 11 ( 1 ) 4 ( 1 ) 7 ( 1 ) ( ² )Pharmacists…………………………………………… 172 1,838 87 1,603 84 1,887 84.9Physicians and surgeons…………………………… 611 1,475 197 1,062 413 1,796 59.1Physician assistants…………………………………… 71 1,211 48 ( 1 ) 22 ( 1 ) ( ² )Podiatrists……………………………………………… 4 ( 1 ) 1 ( 1 ) 3 ( 1 ) ( ² )Registered nurses…………………………………… 1,965 984 1,773 976 192 1,098 88.9Audiologists…………………………………………… 10 ( 1 ) 9 ( 1 ) 1 ( 1 ) ( ² )Occupational therapists……………………………… 51 1,099 40 ( 1 ) 11 ( 1 ) ( ² )Physical therapists…………………………………… 139 1,143 79 1,096 60 1,247 87.9Radiation therapists…………………………………… 9 ( 1 ) 9 ( 1 ) - - ( ² )Recreational therapists……………………………… 17 ( 1 ) 14 ( 1 ) 2 ( 1 ) ( ² )Respiratory therapists………………………………… 77 896 50 881 27 ( 1 ) ( ² )Speech-language pathologists……………………… 84 1,037 82 1,039 2 ( 1 ) ( ² )Therapists, all other…………………………………… 73 730 53 729 21 ( 1 ) ( ² )Veterinarians…………………………………………… 27 ( 1 ) 13 ( 1 ) 14 ( 1 ) ( ² )Health diagnosing and treating practitioners, all other……………………………………………… 5 ( 1 ) 4 ( 1 ) 1 ( 1 ) ( ² )Clinical laboratory technologists and technicians… 270 844 201 803 68 1,049 76.5Dental hygienists……………………………………… 61 946 60 949 1 ( 1 ) ( ² )Diagnostic related technologists and technicians… 226 916 144 845 83 1,050 80.5Emergency medical technicians and paramedics… 129 704 34 ( 1 ) 95 751 ( ² )Health diagnosing and treating practitioner support technicians………………….. ……………… 341 579 273 538 68 687 78.3Licensed practical and licensed vocational nurses… 422 668 392 664 30 ( 1 ) ( ² )Medical records and health information technicians…………………………………………… 72 507 68 509 4 ( 1 ) ( ² )Opticians, dispensing………………………………… 36 ( 1 ) 21 ( 1 ) 15 ( 1 ) ( ² )Miscellaneous health technologists and technicians…………………………………………… 99 688 66 681 33 ( 1 ) ( ² )
See footnotes at end of table.
Occupation
Both sexes Women MenWomen's earnings
as percent of men's
Total employed
Median weekly
earnings
Total employed
Median weekly
earnings
Total employed
Median weekly
earnings
58

Table 18. Median usual weekly earnings of full-time wage and salary workers by detailed occupation and sex,2007 annual averages—Continued(Numbers in thousands)
Other healthcare practitioners and technical occupations…………………………………………… 42 ( 1 ) 20 ( 1 ) 22 ( 1 ) ( ² )
Service occupations……………………………………… 14,716 $454 7,345 $406 7,371 $515 78.8Healthcare support occupations……………………… 2,187 454 1,926 447 261 522 85.6
Nursing, psychiatric, and home health aides……… 1,344 423 1,174 416 170 500 83.2Occupational therapist assistants and aides……… 7 ( 1 ) 6 ( 1 ) - - ( ² )Physical therapist assistants and aides…………… 42 ( 1 ) 26 ( 1 ) 16 ( 1 ) ( ² )Massage therapists…………………………………… 36 ( 1 ) 33 ( 1 ) 4 ( 1 ) ( ² )Dental assistants……………………………………… 169 508 155 508 14 ( 1 ) ( ² )Medical assistants and other healthcare support occupations…………………………………………… 589 490 531 487 58 575 84.7
Protective service occupations………………………… 2,736 719 560 588 2,175 754 78.0First-line supervisors/managers of correctional officers………………………………………………… 41 ( 1 ) 10 ( 1 ) 31 ( 1 ) ( ² )First-line supervisors/managers of police and detectives……………………………………………… 124 1,067 20 ( 1 ) 105 1,084 ( ² )First-line supervisors/managers of fire fighting and prevention workers…………………………………… 59 1,197 6 ( 1 ) 53 1,119 ( ² )Supervisors, protective service workers, all other… 91 758 23 ( 1 ) 68 876 ( ² )Fire fighters…………………………………………… 266 901 14 ( 1 ) 252 919 ( ² )Fire inspectors………………………………………… 14 ( 1 ) 1 ( 1 ) 14 ( 1 ) ( ² )Bailiffs, correctional officers, and jailers…………… 437 648 132 578 304 686 84.3Detectives and criminal investigators……………… 134 1,066 30 ( 1 ) 104 1,121 ( ² )Fish and game wardens……………………………… 6 ( 1 ) 1 ( 1 ) 4 ( 1 ) ( ² )Parking enforcement workers………………………… 10 ( 1 ) 7 ( 1 ) 4 ( 1 ) ( ² )Police and sheriff's patrol officers…………………… 655 891 86 791 568 907 87.2Transit and railroad police…………………………… 6 ( 1 ) 2 ( 1 ) 4 ( 1 ) ( ² )Animal control workers……………………………… 8 ( 1 ) 3 ( 1 ) 5 ( 1 ) ( ² )Private detectives and investigators………………… 64 696 17 ( 1 ) 46 ( 1 ) ( ² )Security guards and gaming surveillance officers… 750 510 172 465 579 524 88.7Crossing guards……………………………………… 13 ( 1 ) 7 ( 1 ) 6 ( 1 ) ( ² )Lifeguards and other protective service workers…… 58 410 29 ( 1 ) 29 ( 1 ) ( ² )
Food preparation and serving related occupations… 4,107 385 2,037 363 2,070 403 90.1Chefs and head cooks………………………………… 290 518 53 482 236 535 90.1First-line supervisors/managers of food preparation and serving workers…………………… 449 491 258 423 191 586 72.2Cooks…………………………………………………… 1,263 365 448 341 815 377 90.5Food preparation workers…………………………… 322 349 198 335 124 367 91.3Bartenders……………………………………………… 212 479 104 404 108 551 73.3Combined food preparation and serving workers, including fast food………………………………… 145 340 99 358 46 ( 1 ) ( ² )Counter attendants, cafeteria, food concession, and coffee shop……………………………………… 91 305 55 299 36 ( 1 ) ( ² )Waiters and waitresses……………………………… 865 380 592 360 274 415 86.7Food servers, nonrestaurant………………………… 95 415 67 401 29 ( 1 ) ( ² )Dining room and cafeteria attendants and bartender helpers…………………... ……………… 156 356 67 345 89 370 93.2Dishwashers…………………………………………… 150 316 38 ( 1 ) 111 314 ( ² )Hosts and hostesses, restaurant, lounge, and coffee shop…………………………………………… 63 366 56 363 7 ( 1 ) ( ² )Food preparation and serving related workers, all other……………………………………………… 6 ( 1 ) 2 ( 1 ) 4 ( 1 ) ( ² )
See footnotes at end of table.
Occupation
Both sexes Women MenWomen's earnings
as percent of men's
Total employed
Median weekly
earnings
Total employed
Median weekly
earnings
Total employed
Median weekly
earnings
59

Table 18. Median usual weekly earnings of full-time wage and salary workers by detailed occupation and sex,2007 annual averages—Continued(Numbers in thousands)
Building and grounds cleaning and maintenance occupations…………………………………………… 3,520 $422 1,230 $376 2,290 $472 79.7First-line supervisors/managers of housekeeping and janitorial workers……………… 180 586 54 481 126 646 74.5First-line supervisors/managers of landscaping, lawn service, and groundskeeping workers……… 105 718 6 ( 1 ) 99 732 ( ² )Janitors and building cleaners……………………… 1,444 434 416 388 1,028 475 81.7Maids and housekeeping cleaners………………… 849 366 717 357 132 439 81.3Pest control workers…………………………………… 68 516 3 ( 1 ) 65 518 ( ² )Grounds maintenance workers……………………… 874 420 34 ( 1 ) 840 421 ( ² )
Personal care and service occupations……………… 2,166 434 1,593 402 574 578 69.6First-line supervisors/managers of gaming workers………………………………………………… 97 728 32 ( 1 ) 65 805 ( ² )First-line supervisors/managers of personal service workers…………….. ……………………… 50 605 30 ( 1 ) 20 ( 1 ) ( ² )Animal trainers………………………………………… 8 ( 1 ) 3 ( 1 ) 5 ( 1 ) ( ² )Nonfarm animal caretakers…………………………… 48 ( 1 ) 39 ( 1 ) 9 ( 1 ) ( ² )Gaming services workers…………………………… 88 627 36 ( 1 ) 51 655 ( ² )Motion picture projectionists………………………… 3 ( 1 ) - - 3 ( 1 ) ( ² )Ushers, lobby attendants, and ticket takers………… 11 ( 1 ) 3 ( 1 ) 8 ( 1 ) ( ² )Miscellaneous entertainment attendants and related workers……………………………………… 62 416 26 ( 1 ) 37 ( 1 ) ( ² )Funeral service workers……………………………… 3 ( 1 ) 1 ( 1 ) 2 ( 1 ) ( ² )Barbers………………………………………………… 48 ( 1 ) 15 ( 1 ) 33 ( 1 ) ( ² )Hairdressers, hairstylists, and cosmetologists……… 309 425 278 409 31 ( 1 ) ( ² )Miscellaneous personal appearance workers……… 129 429 98 402 31 ( 1 ) ( ² )Baggage porters, bellhops, and concierges………… 53 522 9 ( 1 ) 44 ( 1 ) ( ² )Tour and travel guides………………………………… 20 ( 1 ) 9 ( 1 ) 11 ( 1 ) ( ² )Transportation attendants…………………………… 96 595 71 557 25 ( 1 ) ( ² )Child care workers…………………………………… 445 368 408 360 38 ( 1 ) ( ² )Personal and home care aides……………………… 433 380 379 373 55 434 85.9Recreation and fitness workers……………………… 164 523 96 513 68 626 81.9Residential advisors…………………………………… 48 ( 1 ) 32 ( 1 ) 16 ( 1 ) ( ² )Personal care and service workers, all other……… 51 489 28 ( 1 ) 24 ( 1 ) ( ² )
Sales and office occupations……………………………… 25,702 598 15,976 550 9,725 714 77.0Sales and related occupations………………………… 10,448 643 4,675 493 5,773 791 62.3
First-line supervisors/managers of retail sales workers………………………………………… 2,352 647 1,004 538 1,349 746 72.1First-line supervisors/managers of non-retail sales workers………………. ……………………… 865 928 278 768 587 990 77.6Cashiers………………………………………………… 1,459 356 1,074 344 385 409 84.1Counter and rental clerks…………………………… 95 504 45 ( 1 ) 50 567 ( ² )Parts salespersons…………………………………… 122 598 21 ( 1 ) 101 638 ( ² )Retail salespersons…………………………………… 2,034 513 841 409 1,193 638 64.1Advertising sales agents……………………………… 185 741 110 683 74 900 75.9Insurance sales agents……………………………… 357 747 189 644 168 959 67.2Securities, commodities, and financial services sales agents………………………………………… 307 1,128 100 1,031 208 1,243 82.9Travel agents…………………………………………… 79 649 60 670 18 ( 1 ) ( ² )Sales representatives, services, all other…………… 485 854 164 713 321 939 75.9Sales representatives, wholesale and manufacturing………………………………………… 1,228 933 327 784 900 976 80.3
See footnotes at end of table.
Occupation
Both sexes Women MenWomen's earnings
as percent of men's
Total employed
Median weekly
earnings
Total employed
Median weekly
earnings
Total employed
Median weekly
earnings
60

Table 18. Median usual weekly earnings of full-time wage and salary workers by detailed occupation and sex,2007 annual averages—Continued(Numbers in thousands)
Models, demonstrators, and product promoters…… 21 ( 1 ) 14 ( 1 ) 7 ( 1 ) ( ² )Real estate brokers and sales agents……………… 504 $851 263 $701 241 $1,027 68.3Sales engineers……………………………………… 38 ( 1 ) 4 ( 1 ) 34 ( 1 ) ( ² )Telemarketers………………………………………… 110 407 60 391 50 422 92.7Door-to-door salesworkers, news and street vendors, and related workers……………………… 55 464 29 ( 1 ) 26 ( 1 ) ( ² )Sales and related workers, all other………………… 152 736 91 682 62 851 80.1
Office and administrative support occupations……… 15,253 581 11,301 570 3,952 619 92.1First-line supervisors/managers of office and administrative support workers…………………… 1,396 711 990 675 406 803 84.1Switchboard operators, including answering service………………………………………………… 32 ( 1 ) 28 ( 1 ) 3 ( 1 ) ( ² )Telephone operators………………………………… 35 ( 1 ) 23 ( 1 ) 12 ( 1 ) ( ² )Communications equipment operators, all other…… 4 ( 1 ) 1 ( 1 ) 4 ( 1 ) ( ² )Bill and account collectors…………………………… 190 537 118 521 72 586 88.9Billing and posting clerks and machine operators… 365 560 327 560 39 ( 1 ) ( ² )Bookkeeping, accounting, and auditing clerks……… 964 606 859 601 105 666 90.2Gaming cage workers………………………………… 11 ( 1 ) 9 ( 1 ) 2 ( 1 ) ( ² )Payroll and timekeeping clerks……………………… 156 652 142 636 14 ( 1 ) ( ² )Procurement clerks…………………………………… 23 ( 1 ) 14 ( 1 ) 9 ( 1 ) ( ² )Tellers…………………………………………………… 342 455 304 457 37 ( 1 ) ( ² )Brokerage clerks……………………………………… 6 ( 1 ) 3 ( 1 ) 2 ( 1 ) ( ² )Correspondence clerks……………………………… 7 ( 1 ) 6 ( 1 ) 1 ( 1 ) ( ² )Court, municipal, and license clerks………………… 92 623 74 626 17 ( 1 ) ( ² )Credit authorizers, checkers, and clerks…………… 44 ( 1 ) 39 ( 1 ) 5 ( 1 ) ( ² )Customer service representatives…………………… 1,570 541 1,085 521 485 608 85.7Eligibility interviewers, government programs……… 68 661 54 619 14 ( 1 ) ( ² )File clerks……………………………………………… 279 525 222 519 57 574 90.4Hotel, motel, and resort desk clerks………………… 97 406 64 396 33 ( 1 ) ( ² )Interviewers, except eligibility and loan……………… 107 560 90 550 17 ( 1 ) ( ² )Library assistants, clerical…………………………… 44 ( 1 ) 38 ( 1 ) 6 ( 1 ) ( ² )Loan interviewers and clerks………………………… 122 639 103 633 19 ( 1 ) ( ² )New accounts clerks………………………………… 15 ( 1 ) 13 ( 1 ) 2 ( 1 ) ( ² )Order clerks…………………………………………… 95 542 68 529 27 ( 1 ) ( ² )Human resources assistants, except payroll and timekeeping…………………………………………… 43 ( 1 ) 35 ( 1 ) 8 ( 1 ) ( ² )Receptionists and information clerks………………… 1,019 482 940 480 79 503 95.4Reservation and transportation ticket agents and travel clerks…………... ……………………………… 130 564 71 565 59 562 100.5Information and record clerks, all other……………… 87 597 80 586 7 ( 1 ) ( ² )Cargo and freight agents……………………………… 18 ( 1 ) 5 ( 1 ) 13 ( 1 ) ( ² )Couriers and messengers…………………………… 191 707 24 ( 1 ) 167 720 ( ² )Dispatchers…………………………………………… 265 602 143 551 122 649 84.9Meter readers, utilities………………………………… 36 ( 1 ) 4 ( 1 ) 32 ( 1 ) ( ² )Postal service clerks………………………………… 151 831 76 850 75 812 104.7Postal service mail carriers…………………………… 315 896 105 799 209 929 86.0Postal service mail sorters, processors, and processing machine operators……………………… 81 832 36 ( 1 ) 45 ( 1 ) ( ² )Production, planning, and expediting clerks………… 240 746 128 658 112 885 74.4Shipping, receiving, and traffic clerks……………… 468 508 150 500 318 514 97.3Stock clerks and order fillers………………………… 1,067 445 383 441 684 448 98.4Weighers, measurers, checkers, and samplers, recordkeeping………………………………………… 53 513 30 ( 1 ) 24 ( 1 ) ( ² )Secretaries and administrative assistants………… 2,668 599 2,578 597 90 694 86.0
See footnotes at end of table.
Occupation
Both sexes Women MenWomen's earnings
as percent of men's
Total employed
Median weekly
earnings
Total employed
Median weekly
earnings
Total employed
Median weekly
earnings
61
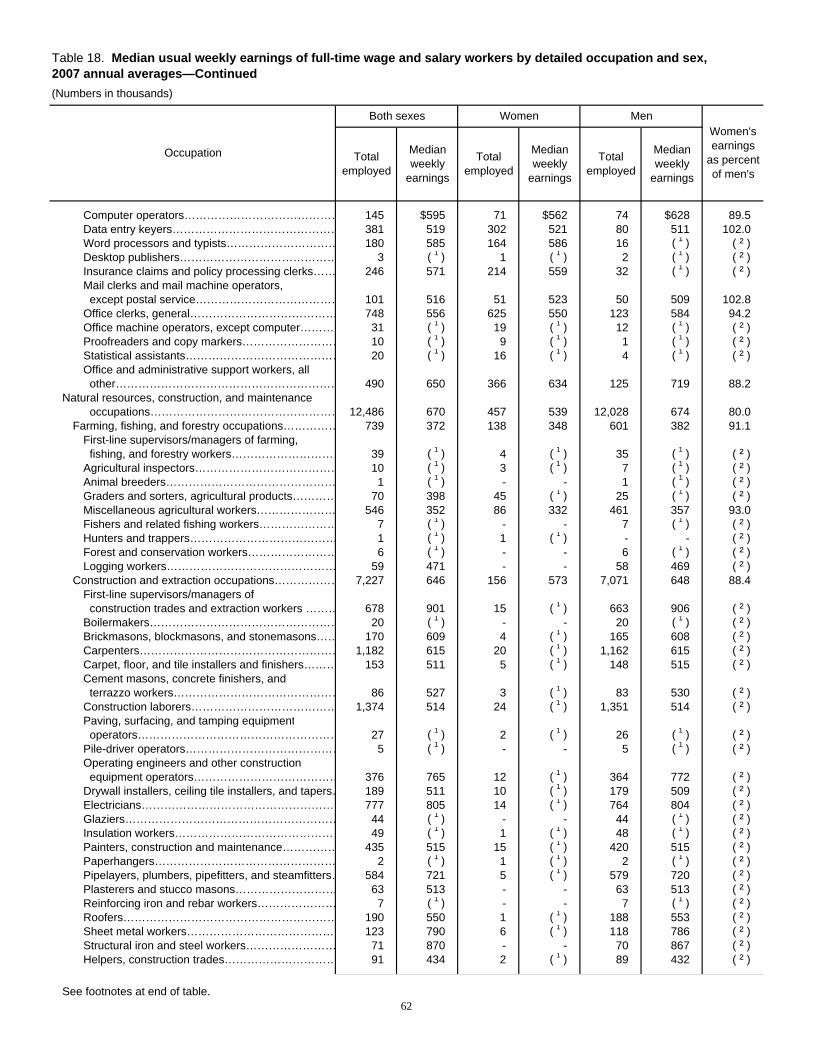
Table 18. Median usual weekly earnings of full-time wage and salary workers by detailed occupation and sex,2007 annual averages—Continued(Numbers in thousands)
Computer operators…………………………………… 145 $595 71 $562 74 $628 89.5Data entry keyers……………………………………… 381 519 302 521 80 511 102.0Word processors and typists………………………… 180 585 164 586 16 ( 1 ) ( ² )Desktop publishers…………………………………… 3 ( 1 ) 1 ( 1 ) 2 ( 1 ) ( ² )Insurance claims and policy processing clerks…… 246 571 214 559 32 ( 1 ) ( ² )Mail clerks and mail machine operators, except postal service………………………………… 101 516 51 523 50 509 102.8Office clerks, general………………………………… 748 556 625 550 123 584 94.2Office machine operators, except computer……… 31 ( 1 ) 19 ( 1 ) 12 ( 1 ) ( ² )Proofreaders and copy markers……………………… 10 ( 1 ) 9 ( 1 ) 1 ( 1 ) ( ² )Statistical assistants…………………………………… 20 ( 1 ) 16 ( 1 ) 4 ( 1 ) ( ² )Office and administrative support workers, all other…………………………………………………… 490 650 366 634 125 719 88.2
Natural resources, construction, and maintenance occupations…………………………………………… 12,486 670 457 539 12,028 674 80.0
Farming, fishing, and forestry occupations…………… 739 372 138 348 601 382 91.1First-line supervisors/managers of farming, fishing, and forestry workers………………………… 39 ( 1 ) 4 ( 1 ) 35 ( 1 ) ( ² )Agricultural inspectors………………………………… 10 ( 1 ) 3 ( 1 ) 7 ( 1 ) ( ² )Animal breeders……………………………………… 1 ( 1 ) - - 1 ( 1 ) ( ² )Graders and sorters, agricultural products………… 70 398 45 ( 1 ) 25 ( 1 ) ( ² )Miscellaneous agricultural workers………………… 546 352 86 332 461 357 93.0Fishers and related fishing workers………………… 7 ( 1 ) - - 7 ( 1 ) ( ² )Hunters and trappers………………………………… 1 ( 1 ) 1 ( 1 ) - - ( ² )Forest and conservation workers…………………… 6 ( 1 ) - - 6 ( 1 ) ( ² )Logging workers……………………………………… 59 471 - - 58 469 ( ² )
Construction and extraction occupations……………… 7,227 646 156 573 7,071 648 88.4First-line supervisors/managers of construction trades and extraction workers ……… 678 901 15 ( 1 ) 663 906 ( ² )Boilermakers…………………………………………… 20 ( 1 ) - - 20 ( 1 ) ( ² )Brickmasons, blockmasons, and stonemasons…… 170 609 4 ( 1 ) 165 608 ( ² )Carpenters……………………………………………… 1,182 615 20 ( 1 ) 1,162 615 ( ² )Carpet, floor, and tile installers and finishers……… 153 511 5 ( 1 ) 148 515 ( ² )Cement masons, concrete finishers, and terrazzo workers……………………………………… 86 527 3 ( 1 ) 83 530 ( ² )Construction laborers………………………………… 1,374 514 24 ( 1 ) 1,351 514 ( ² )Paving, surfacing, and tamping equipment operators……………………………………………… 27 ( 1 ) 2 ( 1 ) 26 ( 1 ) ( ² )Pile-driver operators…………………………………… 5 ( 1 ) - - 5 ( 1 ) ( ² )Operating engineers and other construction equipment operators………………………………… 376 765 12 ( 1 ) 364 772 ( ² )Drywall installers, ceiling tile installers, and tapers… 189 511 10 ( 1 ) 179 509 ( ² )Electricians…………………………………………… 777 805 14 ( 1 ) 764 804 ( ² )Glaziers………………………………………………… 44 ( 1 ) - - 44 ( 1 ) ( ² )Insulation workers……………………………………… 49 ( 1 ) 1 ( 1 ) 48 ( 1 ) ( ² )Painters, construction and maintenance…………… 435 515 15 ( 1 ) 420 515 ( ² )Paperhangers………………………………………… 2 ( 1 ) 1 ( 1 ) 2 ( 1 ) ( ² )Pipelayers, plumbers, pipefitters, and steamfitters… 584 721 5 ( 1 ) 579 720 ( ² )Plasterers and stucco masons……………………… 63 513 - - 63 513 ( ² )Reinforcing iron and rebar workers………………… 7 ( 1 ) - - 7 ( 1 ) ( ² )Roofers………………………………………………… 190 550 1 ( 1 ) 188 553 ( ² )Sheet metal workers………………………………… 123 790 6 ( 1 ) 118 786 ( ² )Structural iron and steel workers…………………… 71 870 - - 70 867 ( ² )Helpers, construction trades………………………… 91 434 2 ( 1 ) 89 432 ( ² )
See footnotes at end of table.
Occupation
Both sexes Women MenWomen's earnings
as percent of men's
Total employed
Median weekly
earnings
Total employed
Median weekly
earnings
Total employed
Median weekly
earnings
62

Table 18. Median usual weekly earnings of full-time wage and salary workers by detailed occupation and sex,2007 annual averages—Continued(Numbers in thousands)
Construction and building inspectors……………… 92 $906 9 ( 1 ) 83 $906 ( ² )Elevator installers and repairers……………………… 31 ( 1 ) - - 31 ( 1 ) ( ² )Fence erectors………………………………………… 28 ( 1 ) - - 28 ( 1 ) ( ² )Hazardous materials removal workers……………… 21 ( 1 ) 1 ( 1 ) 19 ( 1 ) ( ² )Highway maintenance workers……………………… 102 621 1 ( 1 ) 102 623 ( ² )Rail-track laying and maintenance equipment operators……………………………………………… 11 ( 1 ) - - 11 ( 1 ) ( ² )Septic tank servicers and sewer pipe cleaners…… 4 ( 1 ) - - 4 ( 1 ) ( ² )Miscellaneous construction and related workers…… 34 ( 1 ) 1 ( 1 ) 33 ( 1 ) ( ² )Derrick, rotary drill, and service unit operators, oil, gas, and mining………………………………… 42 ( 1 ) - - 42 ( 1 ) ( ² )Earth drillers, except oil and gas…………………… 30 ( 1 ) 1 ( 1 ) 29 ( 1 ) ( ² )Explosives workers, ordnance handling experts, and blasters…………………………………………… 4 ( 1 ) - - 3 ( 1 ) ( ² )Mining machine operators…………………………… 59 954 1 ( 1 ) 57 961 ( ² )Roof bolters, mining…………………………………… 3 ( 1 ) - - 3 ( 1 ) ( ² )Roustabouts, oil and gas……………………………… 5 ( 1 ) - - 5 ( 1 ) ( ² )Helpers--extraction workers………………………… 7 ( 1 ) - - 7 ( 1 ) ( ² )Other extraction workers……………………………… 57 777 1 ( 1 ) 56 769 ( ² )
Installation, maintenance, and repair occupations…… 4,520 749 163 $726 4,357 750 96.8First-line supervisors/managers of mechanics, installers, and repairers……………………………… 324 960 18 ( 1 ) 306 961 ( ² )Computer, automated teller, and office machine repairers……………………………………………… 251 751 34 ( 1 ) 217 777 ( ² )Radio and telecommunications equipment installers and repairers……………………………… 182 927 25 ( 1 ) 157 923 ( ² )Avionics technicians…………………………………… 13 ( 1 ) 3 ( 1 ) 10 ( 1 ) ( ² )Electric motor, power tool, and related repairers…… 24 ( 1 ) - - 24 ( 1 ) ( ² )Electrical and electronics installers and repairers, transportation equipment……………… 4 ( 1 ) - - 4 ( 1 ) ( ² )Electrical and electronics repairers, industrial and utility……………………………………………… 14 ( 1 ) - - 14 ( 1 ) ( ² )Electronic equipment installers and repairers, motor vehicles………………………………………… 26 ( 1 ) 1 ( 1 ) 25 ( 1 ) ( ² )Electronic home entertainment equipment installers and repairers……………………………… 48 ( 1 ) - - 48 ( 1 ) ( ² )Security and fire alarm systems installers………… 59 739 - - 59 739 ( ² )Aircraft mechanics and service technicians………… 128 889 2 ( 1 ) 126 895 ( ² )Automotive body and related repairers……………… 119 620 2 ( 1 ) 117 623 ( ² )Automotive glass installers and repairers…………… 11 ( 1 ) - - 11 ( 1 ) ( ² )Automotive service technicians and mechanics…… 670 655 3 ( 1 ) 667 656 ( ² )Bus and truck mechanics and diesel engine specialists…………………………………………… 332 698 4 ( 1 ) 328 697 ( ² )Heavy vehicle and mobile equipment service technicians and mechanics………………………… 226 803 2 ( 1 ) 224 802 ( ² )Small engine mechanics……………………………… 45 ( 1 ) 1 ( 1 ) 44 ( 1 ) ( ² )Miscellaneous vehicle and mobile equipment mechanics, installers, and repairers……………… 70 508 - - 70 506 ( ² )Control and valve installers and repairers………… 20 ( 1 ) 1 ( 1 ) 19 ( 1 ) ( ² )Heating, air conditioning, and refrigeration mechanics and installers…………………………… 345 728 3 ( 1 ) 342 729 ( ² )Home appliance repairers…………………………… 34 ( 1 ) 1 ( 1 ) 33 ( 1 ) ( ² )Industrial and refractory machinery mechanics…… 393 798 12 ( 1 ) 381 798 ( ² )Maintenance and repair workers, general………… 444 694 12 ( 1 ) 432 694 ( ² )
See footnotes at end of table.
Occupation
Both sexes Women MenWomen's earnings
as percent of men's
Total employed
Median weekly
earnings
Total employed
Median weekly
earnings
Total employed
Median weekly
earnings
63
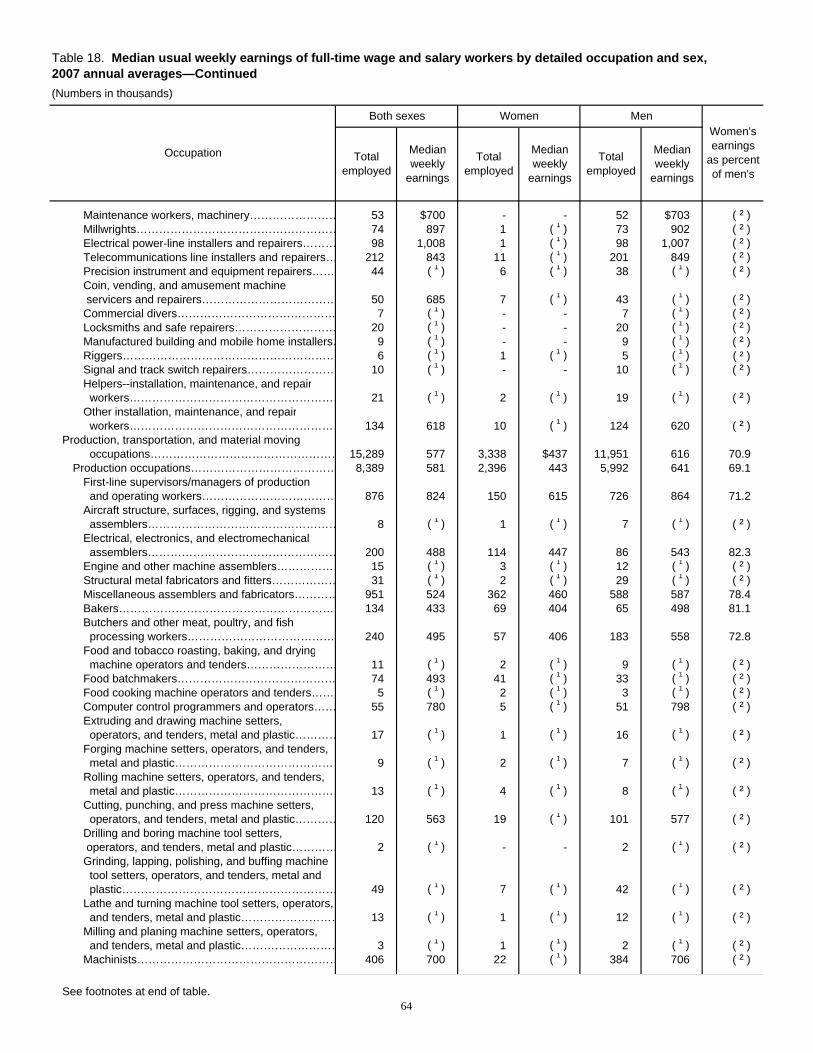
Table 18. Median usual weekly earnings of full-time wage and salary workers by detailed occupation and sex,2007 annual averages—Continued(Numbers in thousands)
Maintenance workers, machinery…………………… 53 $700 - - 52 $703 ( ² )Millwrights……………………………………………… 74 897 1 ( 1 ) 73 902 ( ² )Electrical power-line installers and repairers……… 98 1,008 1 ( 1 ) 98 1,007 ( ² )Telecommunications line installers and repairers… 212 843 11 ( 1 ) 201 849 ( ² )Precision instrument and equipment repairers…… 44 ( 1 ) 6 ( 1 ) 38 ( 1 ) ( ² )Coin, vending, and amusement machine servicers and repairers……………………………… 50 685 7 ( 1 ) 43 ( 1 ) ( ² )Commercial divers…………………………………… 7 ( 1 ) - - 7 ( 1 ) ( ² )Locksmiths and safe repairers……………………… 20 ( 1 ) - - 20 ( 1 ) ( ² )Manufactured building and mobile home installers… 9 ( 1 ) - - 9 ( 1 ) ( ² )Riggers………………………………………………… 6 ( 1 ) 1 ( 1 ) 5 ( 1 ) ( ² )Signal and track switch repairers…………………… 10 ( 1 ) - - 10 ( 1 ) ( ² )Helpers--installation, maintenance, and repair workers………………………………………………… 21 ( 1 ) 2 ( 1 ) 19 ( 1 ) ( ² )Other installation, maintenance, and repair workers………………………………………………… 134 618 10 ( 1 ) 124 620 ( ² )
Production, transportation, and material moving occupations…………………………………………… 15,289 577 3,338 $437 11,951 616 70.9
Production occupations………………………………… 8,389 581 2,396 443 5,992 641 69.1First-line supervisors/managers of production and operating workers……………………………… 876 824 150 615 726 864 71.2Aircraft structure, surfaces, rigging, and systems assemblers…………………………………………… 8 ( 1 ) 1 ( 1 ) 7 ( 1 ) ( ² )Electrical, electronics, and electromechanical assemblers…………………………………………… 200 488 114 447 86 543 82.3Engine and other machine assemblers……………… 15 ( 1 ) 3 ( 1 ) 12 ( 1 ) ( ² )Structural metal fabricators and fitters……………… 31 ( 1 ) 2 ( 1 ) 29 ( 1 ) ( ² )Miscellaneous assemblers and fabricators………… 951 524 362 460 588 587 78.4Bakers………………………………………………… 134 433 69 404 65 498 81.1Butchers and other meat, poultry, and fish processing workers………………………………… 240 495 57 406 183 558 72.8Food and tobacco roasting, baking, and drying machine operators and tenders…………………… 11 ( 1 ) 2 ( 1 ) 9 ( 1 ) ( ² )Food batchmakers…………………………………… 74 493 41 ( 1 ) 33 ( 1 ) ( ² )Food cooking machine operators and tenders…… 5 ( 1 ) 2 ( 1 ) 3 ( 1 ) ( ² )Computer control programmers and operators…… 55 780 5 ( 1 ) 51 798 ( ² )Extruding and drawing machine setters, operators, and tenders, metal and plastic………… 17 ( 1 ) 1 ( 1 ) 16 ( 1 ) ( ² )Forging machine setters, operators, and tenders, metal and plastic……………………………………… 9 ( 1 ) 2 ( 1 ) 7 ( 1 ) ( ² )Rolling machine setters, operators, and tenders, metal and plastic……………………………………… 13 ( 1 ) 4 ( 1 ) 8 ( 1 ) ( ² )Cutting, punching, and press machine setters, operators, and tenders, metal and plastic………… 120 563 19 ( 1 ) 101 577 ( ² )Drilling and boring machine tool setters, operators, and tenders, metal and plastic………… 2 ( 1 ) - - 2 ( 1 ) ( ² )Grinding, lapping, polishing, and buffing machine tool setters, operators, and tenders, metal and plastic………………………………………………… 49 ( 1 ) 7 ( 1 ) 42 ( 1 ) ( ² )Lathe and turning machine tool setters, operators, and tenders, metal and plastic……………………… 13 ( 1 ) 1 ( 1 ) 12 ( 1 ) ( ² )Milling and planing machine setters, operators, and tenders, metal and plastic……………………… 3 ( 1 ) 1 ( 1 ) 2 ( 1 ) ( ² )Machinists……………………………………………… 406 700 22 ( 1 ) 384 706 ( ² )
See footnotes at end of table.
Occupation
Both sexes Women MenWomen's earnings
as percent of men's
Total employed
Median weekly
earnings
Total employed
Median weekly
earnings
Total employed
Median weekly
earnings
64

Table 18. Median usual weekly earnings of full-time wage and salary workers by detailed occupation and sex,2007 annual averages—Continued(Numbers in thousands)
Metal furnace and kiln operators and tenders……… 23 ( 1 ) 2 ( 1 ) 21 ( 1 ) ( ² )Model makers and patternmakers, metal and plastic………………………………………………… 12 ( 1 ) - - 11 ( 1 ) ( ² )Molders and molding machine setters, operators, and tenders, metal and plastic………… 73 $580 12 ( 1 ) 61 $618 ( ² )Multiple machine tool setters, operators, and tenders, metal and plastic…………………………… 5 ( 1 ) 1 ( 1 ) 4 ( 1 ) ( ² )Tool and die makers…………………………………… 75 918 3 ( 1 ) 72 923 ( ² )Welding, soldering, and brazing workers…………… 536 607 37 ( 1 ) 499 618 ( ² )Heat treating equipment setters, operators, and tenders, metal and plastic…………………………… 12 ( 1 ) 2 ( 1 ) 9 ( 1 ) ( ² )Lay-out workers, metal and plastic………………… 7 ( 1 ) - - 7 ( 1 ) ( ² )Plating and coating machine setters, operators, and tenders, metal and plastic……………………… 15 ( 1 ) 2 ( 1 ) 14 ( 1 ) ( ² )Tool grinders, filers, and sharpeners………………… 5 ( 1 ) 1 ( 1 ) 4 ( 1 ) ( ² )Metalworkers and plastic workers, all other………… 422 551 123 $482 299 588 82.0Bookbinders and bindery workers…………………… 43 ( 1 ) 15 ( 1 ) 28 ( 1 ) ( ² )Job printers…………………………………………… 34 ( 1 ) 4 ( 1 ) 30 ( 1 ) ( ² )Prepress technicians and workers…………………… 51 538 26 ( 1 ) 25 ( 1 ) ( ² )Printing machine operators…………………………… 180 613 26 ( 1 ) 153 657 ( ² )Laundry and dry-cleaning workers…………………… 176 380 98 340 78 496 68.5Pressers, textile, garment, and related materials… 50 344 33 ( 1 ) 17 ( 1 ) ( ² )Sewing machine operators…………………………… 226 361 179 359 47 ( 1 ) ( ² )Shoe and leather workers and repairers…………… 6 ( 1 ) 1 ( 1 ) 5 ( 1 ) ( ² )Shoe machine operators and tenders……………… 10 ( 1 ) 5 ( 1 ) 5 ( 1 ) ( ² )Tailors, dressmakers, and sewers…………………… 54 453 34 ( 1 ) 20 ( 1 ) ( ² )Textile bleaching and dyeing machine operators and tenders………………………………………… 4 ( 1 ) 1 ( 1 ) 4 ( 1 ) ( ² )Textile cutting machine setters, operators, and tenders………………………………………………… 6 ( 1 ) 1 ( 1 ) 5 ( 1 ) ( ² )Textile knitting and weaving machine setters, operators, and tenders……………………………… 11 ( 1 ) 9 ( 1 ) 2 ( 1 ) ( ² )Textile winding, twisting, and drawing out machine setters, operators, and tenders………… 23 ( 1 ) 14 ( 1 ) 8 ( 1 ) ( ² )Fabric and apparel patternmakers…………………… 6 ( 1 ) 6 ( 1 ) - - ( ² )Upholsterers…………………………………………… 34 ( 1 ) 2 ( 1 ) 32 ( 1 ) ( ² )Textile, apparel, and furnishings workers, all other… 11 ( 1 ) 2 ( 1 ) 9 ( 1 ) ( ² )Cabinetmakers and bench carpenters……………… 67 598 6 ( 1 ) 61 607 ( ² )Furniture finishers……………………………………… 11 ( 1 ) 3 ( 1 ) 7 ( 1 ) ( ² )Model makers and patternmakers, wood…………… 1 ( 1 ) - - 1 ( 1 ) ( ² )Sawing machine setters, operators, and tenders, wood………………………………………… 54 483 5 ( 1 ) 49 ( 1 ) ( ² )Woodworking machine setters, operators, and tenders, except sawing…………………………….. 25 ( 1 ) 6 ( 1 ) 19 ( 1 ) ( ² )Woodworkers, all other……………………………… 19 ( 1 ) 2 ( 1 ) 18 ( 1 ) ( ² )Power plant operators, distributors, and dispatchers…………………………………………… 47 ( 1 ) 4 ( 1 ) 43 ( 1 ) ( ² )Stationary engineers and boiler operators………… 88 752 1 ( 1 ) 86 757 ( ² )Water and liquid waste treatment plant and system operators…………………………………… 74 722 5 ( 1 ) 69 731 ( ² )Miscellaneous plant and system operators………… 40 ( 1 ) 5 ( 1 ) 35 ( 1 ) ( ² )Chemical processing machine setters, operators, and tenders……………………………… 44 ( 1 ) 7 ( 1 ) 37 ( 1 ) ( ² )
See footnotes at end of table.
Occupation
Both sexes Women MenWomen's earnings
as percent of men's
Total employed
Median weekly
earnings
Total employed
Median weekly
earnings
Total employed
Median weekly
earnings
65
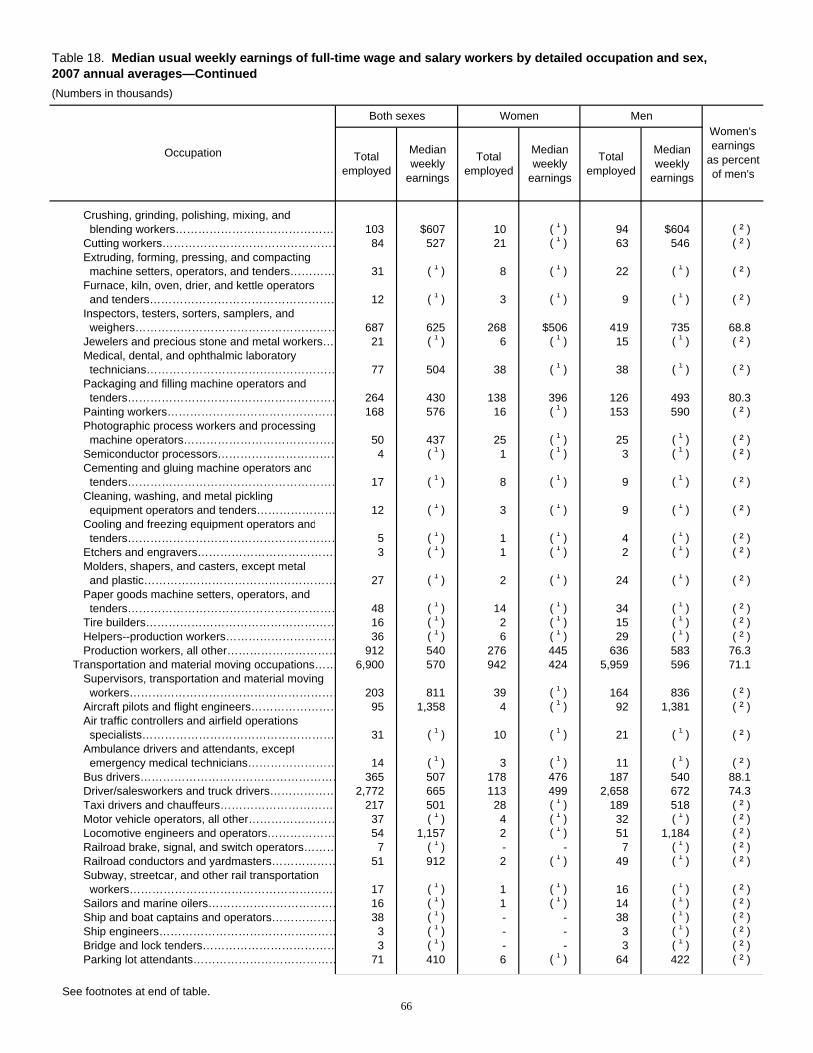
Table 18. Median usual weekly earnings of full-time wage and salary workers by detailed occupation and sex,2007 annual averages—Continued(Numbers in thousands)
Crushing, grinding, polishing, mixing, and blending workers…………………………………… 103 $607 10 ( 1 ) 94 $604 ( ² )Cutting workers………………………………………… 84 527 21 ( 1 ) 63 546 ( ² )Extruding, forming, pressing, and compacting machine setters, operators, and tenders………… 31 ( 1 ) 8 ( 1 ) 22 ( 1 ) ( ² )Furnace, kiln, oven, drier, and kettle operators and tenders…………………………………………… 12 ( 1 ) 3 ( 1 ) 9 ( 1 ) ( ² )Inspectors, testers, sorters, samplers, and weighers……………………………………………… 687 625 268 $506 419 735 68.8Jewelers and precious stone and metal workers… 21 ( 1 ) 6 ( 1 ) 15 ( 1 ) ( ² )Medical, dental, and ophthalmic laboratory technicians…………………………………………… 77 504 38 ( 1 ) 38 ( 1 ) ( ² )Packaging and filling machine operators and tenders………………………………………………… 264 430 138 396 126 493 80.3Painting workers……………………………………… 168 576 16 ( 1 ) 153 590 ( ² )Photographic process workers and processing machine operators…………………………………… 50 437 25 ( 1 ) 25 ( 1 ) ( ² )Semiconductor processors…………………………… 4 ( 1 ) 1 ( 1 ) 3 ( 1 ) ( ² )Cementing and gluing machine operators and tenders………………………………………………… 17 ( 1 ) 8 ( 1 ) 9 ( 1 ) ( ² )Cleaning, washing, and metal pickling equipment operators and tenders………………… 12 ( 1 ) 3 ( 1 ) 9 ( 1 ) ( ² )Cooling and freezing equipment operators and tenders………………………………………………… 5 ( 1 ) 1 ( 1 ) 4 ( 1 ) ( ² )Etchers and engravers………………………………… 3 ( 1 ) 1 ( 1 ) 2 ( 1 ) ( ² )Molders, shapers, and casters, except metal and plastic…………………………………………… 27 ( 1 ) 2 ( 1 ) 24 ( 1 ) ( ² )Paper goods machine setters, operators, and tenders………………………………………………… 48 ( 1 ) 14 ( 1 ) 34 ( 1 ) ( ² )Tire builders…………………………………………… 16 ( 1 ) 2 ( 1 ) 15 ( 1 ) ( ² )Helpers--production workers………………………… 36 ( 1 ) 6 ( 1 ) 29 ( 1 ) ( ² )Production workers, all other………………………… 912 540 276 445 636 583 76.3
Transportation and material moving occupations…… 6,900 570 942 424 5,959 596 71.1Supervisors, transportation and material moving workers………………………………………………… 203 811 39 ( 1 ) 164 836 ( ² )Aircraft pilots and flight engineers…………………… 95 1,358 4 ( 1 ) 92 1,381 ( ² )Air traffic controllers and airfield operations specialists…………………………………………… 31 ( 1 ) 10 ( 1 ) 21 ( 1 ) ( ² )Ambulance drivers and attendants, except emergency medical technicians…………………… 14 ( 1 ) 3 ( 1 ) 11 ( 1 ) ( ² )Bus drivers……………………………………………… 365 507 178 476 187 540 88.1Driver/salesworkers and truck drivers……………… 2,772 665 113 499 2,658 672 74.3Taxi drivers and chauffeurs…………………………… 217 501 28 ( 1 ) 189 518 ( ² )Motor vehicle operators, all other…………………… 37 ( 1 ) 4 ( 1 ) 32 ( 1 ) ( ² )Locomotive engineers and operators……………… 54 1,157 2 ( 1 ) 51 1,184 ( ² )Railroad brake, signal, and switch operators……… 7 ( 1 ) - - 7 ( 1 ) ( ² )Railroad conductors and yardmasters……………… 51 912 2 ( 1 ) 49 ( 1 ) ( ² )Subway, streetcar, and other rail transportation workers………………………………………………… 17 ( 1 ) 1 ( 1 ) 16 ( 1 ) ( ² )Sailors and marine oilers……………………………… 16 ( 1 ) 1 ( 1 ) 14 ( 1 ) ( ² )Ship and boat captains and operators……………… 38 ( 1 ) - - 38 ( 1 ) ( ² )Ship engineers………………………………………… 3 ( 1 ) - - 3 ( 1 ) ( ² )Bridge and lock tenders……………………………… 3 ( 1 ) - - 3 ( 1 ) ( ² )Parking lot attendants………………………………… 71 410 6 ( 1 ) 64 422 ( ² )
See footnotes at end of table.
Occupation
Both sexes Women MenWomen's earnings
as percent of men's
Total employed
Median weekly
earnings
Total employed
Median weekly
earnings
Total employed
Median weekly
earnings
66

Table 18. Median usual weekly earnings of full-time wage and salary workers by detailed occupation and sex,2007 annual averages—Continued(Numbers in thousands)
Service station attendants…………………………… 63 $404 6 ( 1 ) 57 $411 ( ² )Transportation inspectors…………………………… 41 ( 1 ) 5 ( 1 ) 36 ( 1 ) ( ² )Other transportation workers………………………… 18 ( 1 ) 2 ( 1 ) 17 ( 1 ) ( ² )Conveyor operators and tenders…………………… 7 ( 1 ) - - 7 ( 1 ) ( ² )Crane and tower operators…………………………… 55 715 - - 55 716 ( ² )Dredge, excavating, and loading machine operators……………………………………………… 44 ( 1 ) - - 44 ( 1 ) ( ² )Hoist and winch operators…………………………… 6 ( 1 ) 2 ( 1 ) 4 ( 1 ) ( ² )Industrial truck and tractor operators………………… 532 519 29 ( 1 ) 503 522 ( ² )Cleaners of vehicles and equipment………………… 233 405 33 ( 1 ) 200 413 ( ² )Laborers and freight, stock, and material movers, hand…………………………………………………… 1,428 474 233 $418 1,195 486 86.0Machine feeders and offbearers…………………… 23 ( 1 ) 10 ( 1 ) 13 ( 1 ) ( ² )Packers and packagers, hand……………………… 335 374 221 362 114 414 87.4Pumping station operators…………………………… 17 ( 1 ) - - 17 ( 1 ) ( ² )Refuse and recyclable material collectors………… 60 517 3 ( 1 ) 58 525 ( ² )Shuttle car operators………………………………… 2 ( 1 ) 1 ( 1 ) 1 ( 1 ) ( ² )Tank car, truck, and ship loaders…………………… 4 ( 1 ) - - 4 ( 1 ) ( ² )Material moving workers, all other…………………… 36 ( 1 ) 4 ( 1 ) 32 ( 1 ) ( ² )
Occupation
Both sexes Women MenWomen's earnings
as percent of men's
Total employed
Median weekly
earnings
Total employed
Median weekly
earnings
Total employed
Median weekly
earnings
1 Data not shown where base is less than 50,000.
² Data not shown where base for either the numerator or denominator is less than 50,000.
NOTE: Dash indicates no data or data that do not meet publication criteria.
SOURCE: Current Population Survey, U.S. Department of Labor, U.S. Bureau of Labor Statistics.
67

Table 19. Median usual weekly earnings of full-time wage and salary workers by industry and sex, 2007 annual averages
Total, 16 years and over…………….……… 107,339 $695 47,041 $614 60,298 $766 80.2
Agriculture and related industries .................... 920 421 157 399 763 426 93.7Mining .............................................................. 685 969 85 776 601 1,007 77.1Construction .................................................... 8,354 675 692 672 7,662 676 99.4Manufacturing .................................................. 14,755 719 4,283 582 10,473 783 74.3
Durable goods .............................................. 9,462 745 2,407 612 7,055 797 76.8Nondurable goods ........................................ 5,293 669 1,876 531 3,417 755 70.3
Wholesale and retail trade ............................... 14,517 587 5,830 487 8,688 664 73.3Wholesale trade ........................................... 3,695 720 1,052 612 2,643 764 80.1Retail trade ................................................... 10,822 539 4,778 464 6,044 622 74.6
Transportation and utilities .............................. 6,293 765 1,464 645 4,829 808 79.8Transportation and warehousing .................. 5,152 729 1,221 622 3,931 767 81.1Utilities .......................................................... 1,141 944 243 763 898 995 76.7
Information ....................................................... 2,960 885 1,198 739 1,762 998 74.0Financial activities ........................................... 8,127 782 4,571 680 3,556 984 69.1
Finance and insurance ................................. 6,130 821 3,681 690 2,449 1,152 59.9Real estate and rental and leasing ............... 1,997 692 890 637 1,107 745 85.5
Professional and business services ................ 10,787 787 4,511 675 6,275 918 73.5Professional and technical services ............. 6,371 1,032 2,782 794 3,590 1,250 63.5Management, administrative, and waste services...................................................... 4,415 529 1,730 513 2,686 546 94.0
Education and health services ......................... 22,580 727 16,549 674 6,031 886 76.1Educational services .................................... 9,830 808 6,659 763 3,170 920 82.9Health care and social assistance ................ 12,750 649 9,890 609 2,860 842 72.3
Leisure and hospitality ..................................... 7,019 447 3,231 407 3,789 489 83.2Arts, entertainment, and recreation .............. 1,602 588 660 513 942 624 82.2Accomodation and food services ................. 5,418 414 2,571 386 2,847 448 86.2
Other services ................................................. 4,031 581 1,743 482 2,288 659 73.1Other services, except private households .. 3,646 599 1,404 505 2,242 665 75.9Private households ....................................... 385 394 339 390 47 ( 1 ) ( 1 )
Public administration........................................ 6,310 859 2,728 736 3,582 961 76.6
Industry
Both Sexes Women MenWomen's
earnings as percent of
men'sTotal
Employed
Median Weekly
Earnings
Total Employed
Median Weekly
Earnings
Total Employed
Median Weekly
Earnings
1 Data not shown where base is less than 50,000.
SOURCE: Current Population Survey, U.S. Department of Labor, U.S. Bureau of Labor Statistics.
68

Table 20. Employed persons by full- and part-time status and sex, 1970-2007 annual averages (Numbers in thousands)
Total employed Usually full time 1 Usually part time 2 Percent usuallyfull time
Percent usuallypart time
1970…………...… 78,678 66,753 11,925 84.8 15.21971………...…… 79,367 66,973 12,393 84.4 15.61972 3………...… 82,153 69,214 12,939 84.3 15.71973 3………...… 85,064 71,803 13,262 84.4 15.61974……...……… 86,794 73,093 13,701 84.2 15.81975…………...… 85,846 71,586 14,260 83.4 16.61976………...…… 88,752 73,964 14,788 83.3 16.71977………...…… 92,017 76,625 15,391 83.3 16.71978 3…………... 96,048 80,193 15,855 83.5 16.51979………..…… 98,824 82,654 16,171 83.6 16.4
1980……..……… 99,303 82,562 16,740 83.1 16.91981……..……… 100,397 83,243 17,154 82.9 17.11982………..…… 99,526 81,421 18,106 81.8 18.21983…..………… 100,834 82,322 18,511 81.6 18.41984…..………… 105,005 86,544 18,462 82.4 17.61985……...……… 107,150 88,534 18,615 82.6 17.41986 3….…..…… 109,597 90,529 19,069 82.6 17.41987……...….…… 112,440 92,957 19,483 82.7 17.31988……...……… 114,968 95,214 19,754 82.8 17.21989……...……… 117,342 97,369 19,973 83.0 17.0
1990 3……...…… 118,793 98,666 20,128 83.1 16.91991……...……… 117,718 97,190 20,528 82.6 17.41992………...…… 118,492 97,664 20,828 82.4 17.61993……….…… 120,259 99,114 21,145 82.4 17.61994 3………...… 123,060 99,772 23,288 81.1 18.91995………...…… 124,900 101,679 23,220 81.4 18.61996….………… 126,708 103,537 23,170 81.7 18.31997 3………..… 129,558 106,334 23,224 82.1 17.91998 3……...…… 131,463 108,202 23,261 82.3 17.71999 3…………… 133,488 110,302 23,186 82.6 17.4
2000 3………...… 136,891 113,846 23,044 83.2 16.82001…………..… 136,933 113,573 23,361 82.9 17.12002……………… 136,485 112,700 23,785 82.6 17.42003 3………….. 137,736 113,324 24,412 82.3 17.72004 …………… 139,252 114,518 24,734 82.2 17.82005 …………… 141,730 117,016 24,714 82.6 17.42006 …………… 144,427 119,688 24,739 82.9 17.12007 …………… 146,047 121,091 24,956 82.9 17.1
See footnotes at end of table.
Year
Total, both sexes
69

Table 20. Employed persons by full- and part-time status and sex, 1970-2007 annual averages―Continued (Numbers in thousands)
Total employed Usually full time 1 Usually part time 2 Percent usuallyfull time
Percent usuallypart time
1970…………...… 29,688 21,929 7,758 73.9 26.1 1971………...…… 29,976 21,950 8,026 73.2 26.8 1972 3………...… 31,257 22,842 8,416 73.1 26.9 1973 3………...… 32,715 23,960 8,756 73.2 26.8 1974……...……… 33,769 24,714 9,055 73.2 26.8 1975…………...… 33,989 24,598 9,391 72.4 27.6 1976………...…… 35,615 25,814 9,799 72.5 27.5 1977………...…… 37,289 27,076 10,213 72.6 27.4 1978 3…………... 39,569 28,912 10,658 73.1 26.9 1979………..…… 41,217 30,227 10,990 73.3 26.7
1980……..……… 42,117 30,845 11,270 73.2 26.8 1981……..……… 43,000 31,337 11,664 72.9 27.1 1982………..…… 43,256 31,086 12,170 71.9 28.1 1983…..………… 44,047 31,679 12,367 71.9 28.1 1984…..………… 45,915 33,473 12,441 72.9 27.1 1985……...……… 47,259 34,672 12,587 73.4 26.6 1986 3….…..…… 48,706 35,845 12,862 73.6 26.4 1987……...….…… 50,334 37,210 13,124 73.9 26.1 1988……...……… 51,696 38,398 13,298 74.3 25.7 1989……...……… 53,027 39,484 13,544 74.5 25.5
1990 3……...…… 53,689 40,165 13,524 74.8 25.2 1991……...……… 53,496 39,783 13,713 74.4 25.6 1992………...…… 54,052 40,301 13,751 74.6 25.4 1993……….…… 54,910 40,991 13,919 74.7 25.3 1994 3………...… 56,610 40,940 15,670 72.3 27.7 1995………...…… 57,523 41,743 15,779 72.6 27.4 1996….………… 58,501 42,776 15,725 73.1 26.9 1997 3………..… 59,873 44,076 15,797 73.6 26.4 1998 3……...…… 60,771 45,014 15,757 74.1 25.9 1999 3…………… 62,042 46,372 15,670 74.7 25.3
2000 3………...… 63,586 47,916 15,670 75.4 24.6 2001…………..… 63,737 47,950 15,788 75.2 24.8 2002……………… 63,582 47,494 16,088 74.7 25.3 2003 3………….. 64,404 47,946 16,459 74.4 25.6 2004 …………… 64,728 48,073 16,654 74.3 25.7 2005 …………… 65,757 49,158 16,598 74.8 25.2 2006 …………… 66,925 50,380 16,545 75.3 24.7 2007 …………… 67,792 51,056 16,736 75.3 24.7
See footnotes at end of table.
Year
Women
70

Table 20. Employed persons by full- and part-time status and sex, 1970-2007 annual averages―Continued (Numbers in thousands)
Total employed Usually full time 1 Usually part time 2 Percent usuallyfull time
Percent usuallypart time
1970…………...… 48,990 44,825 4,166 91.5 8.51971………...…… 49,390 45,023 4,367 91.2 8.81972 3………...… 50,896 46,373 4,523 91.1 8.91973 3………...… 52,349 47,843 4,507 91.4 8.61974……...……… 53,024 48,378 4,646 91.2 8.81975…………...… 51,857 46,988 4,870 90.6 9.41976………...…… 53,138 48,150 4,988 90.6 9.41977………...…… 54,728 49,551 5,178 90.5 9.51978 3…………... 56,479 51,281 5,198 90.8 9.21979………..…… 57,607 52,427 5,180 91.0 9.0
1980……..……… 57,186 51,717 5,471 90.4 9.61981……..……… 57,397 51,906 5,492 90.4 9.61982………..…… 56,271 50,334 5,937 89.4 10.61983…..………… 56,787 50,643 6,145 89.2 10.81984…..………… 59,091 53,070 6,020 89.8 10.21985……...……… 59,891 53,862 6,028 89.9 10.11986 3….…..…… 60,892 54,685 6,207 89.8 10.21987……...….…… 62,107 55,746 6,360 89.8 10.21988……...……… 63,273 56,816 6,457 89.8 10.21989……...……… 64,315 57,885 6,430 90.0 10.0
1990 3……...…… 65,104 58,501 6,604 89.9 10.11991……...……… 64,223 57,407 6,815 89.4 10.61992………...…… 64,440 57,363 7,077 89.0 11.01993……….…… 65,349 58,123 7,226 88.9 11.11994 3………...… 66,450 58,832 7,617 88.5 11.51995………...…… 67,377 59,936 7,441 89.0 11.01996….………… 68,207 60,762 7,445 89.1 10.91997 3………..… 69,685 62,258 7,427 89.3 10.71998 3……...…… 70,693 63,189 7,504 89.4 10.61999 3…………… 71,446 63,930 7,516 89.5 10.5
See footnotes at end of table.
Year
Men
71

Table 20. Employed persons by full- and part-time status and sex, 1970-2007 annual averages―Continued (Numbers in thousands)
Total employed Usually full time 1 Usually part time 2 Percent usuallyfull time
Percent usuallypart time
2000 3………...… 73,305 65,930 7,375 89.9 10.12001…………..… 73,196 65,623 7,573 89.7 10.32002……………… 72,903 65,205 7,697 89.4 10.62003 3………….. 73,332 65,379 7,953 89.2 10.82004 …………… 74,524 66,444 8,080 89.2 10.82005 …………… 75,973 67,858 8,115 89.3 10.72006 …………… 77,502 69,307 8,194 89.4 10.62007 …………… 78,254 70,035 8,220 89.5 10.5
Year
Men
1 Prior to 1994, total includes persons who usuallywork part-time but who worked 35 or more hoursduring the reference week; for 1994 and later years,such persons were included in the part-time total. Inall years, the total includes those who usually work fulltime but who worked less than 35 hours during thereference week for noneconomic reasons, such asillness or holiday, and those absent from work for theentire reference week who usually work full time.These groups are not shown separately.
2 For all years, total includes those who usuallywork less than 35 hours a week but who wereabsent from work for the entire reference week and
for 1994 and later years, those who worked 35 or morehours during the reference week. These groups arenot shown separately.
3 The comparability of historical labor force data hasbeen affected at various times by methodological andconceptual changes in the Current Population Survey(CPS). For an explanation, see the HistoricalComparability documentation provided at http://www.bls.gov/cps/eetech_methods.pdf .
SOURCE: Current Population Survey, U.S.Department of Labor, U.S. Bureau of Labor Statistics.
72

Table 21. Average weekly hours at work in all industries and in nonagricultural industries by sex, 1976-2007 annual averages
All industries Nonagricultural industries
Total Women Men Total Women Men
1976……. 38.7 34.1 41.7 38.4 34.1 41.41977……. 38.8 34.2 41.9 38.5 34.2 41.61978 1…… 39.0 34.5 42.1 38.7 34.4 41.81979…...… 38.9 34.5 42.0 38.6 34.4 41.7
1980……. 38.5 34.5 41.5 38.3 34.4 41.21981……. 38.1 34.1 41.1 37.9 34.1 40.71982…...… 38.0 34.1 40.9 37.7 34.0 40.61983……. 38.3 34.5 41.2 38.1 34.4 41.01984……… 38.8 34.9 41.8 38.6 34.9 41.51985…...… 39.0 35.2 42.0 38.9 35.2 41.81986 1…… 39.1 35.4 42.1 38.9 35.3 41.91987……. 39.0 35.3 42.0 38.8 35.3 41.81988……. 39.4 35.7 42.4 39.3 35.7 42.21989…...… 39.6 35.8 42.6 39.4 35.8 42.4
1990 1…… 39.4 35.8 42.3 39.3 35.8 42.11991…...… 39.2 35.8 42.0 39.1 35.8 41.91992……. 38.9 35.6 41.7 38.8 35.6 41.61993……… 39.4 36.0 42.2 39.3 36.0 42.11994 1…… 39.2 35.5 42.2 39.1 35.6 42.11995……. 39.3 35.6 42.3 39.2 35.7 42.21996……… 39.3 35.7 42.3 39.2 35.7 42.21997 1…… 39.5 36.0 42.4 39.4 36.0 42.31998 1…… 39.3 35.8 42.2 39.2 35.9 42.21999 1…… 39.6 36.2 42.4 39.5 36.2 42.4
2000 1…… 39.7 36.4 42.5 39.6 36.4 42.42001…...… 39.2 36.1 41.9 39.2 36.1 41.82002……. 39.2 36.0 41.8 39.1 36.1 41.72003 1…… 39.0 35.9 41.7 39.0 35.9 41.62004……. 39.0 35.9 41.7 39.0 35.9 41.62005……. 39.2 36.1 41.8 39.1 36.1 41.72006……… 39.2 36.2 41.8 39.2 36.2 41.72007……… 39.2 36.1 41.7 39.1 36.1 41.6
Year
1 The comparability of historical data has been affected at various times bymethodological and conceptual changes in the Current Population Survey(CPS). For an explanation, see the Historical Comparability documentationprovided at http://www.bls.gov/cps/eetech_methods.pdf .
SOURCE: Current Population Survey, U.S. Department of Labor, U.S. Bureauof Labor Statistics.
73

Table 22. Work experience of the population by sex and full- and part-time status, selected years, 1970-2006(Percent distribution)
Year
Total
Total, both sexes
1970………….……… 138,953 93,850 67.5 100.0 79.4 55.6 23.8 20.6 6.7 13.9 1975………….……… 153,180 102,603 67.0 100.0 78.9 54.3 24.6 21.2 7.5 13.7 1980…….…………… 169,452 115,752 68.3 100.0 78.5 56.1 22.4 21.4 7.7 13.7 1985………….……… 179,944 123,466 68.6 100.0 78.2 58.7 19.5 21.9 8.3 13.6 1990 1………...……… 189,238 132,562 70.1 100.0 78.8 60.4 18.4 21.3 8.7 12.6 1995………….……… 199,925 138,971 69.5 100.0 78.6 62.9 15.7 21.3 9.1 12.2 2000 1………...……… 214,292 150,787 70.4 100.0 80.4 66.7 13.7 19.5 9.3 10.2 2005…………………… 227,975 154,322 67.7 100.0 80.3 67.5 12.8 19.7 10.0 9.7 2006…………………… 231,033 156,658 67.8 100.0 80.9 68.4 12.5 19.1 9.7 9.4
Women
1970………….……… 73,657 38,809 52.7 100.0 67.9 40.7 27.2 32.2 10.1 22.1 1975…….…………… 80,834 43,511 53.8 100.0 67.1 41.4 25.7 32.8 11.7 21.1 1980……….………… 89,259 51,492 57.7 100.0 67.7 44.7 23.0 32.3 11.9 20.4 1985…….…………… 94,490 56,165 59.4 100.0 68.1 48.9 19.2 31.8 12.3 19.5 1990 1………...……… 98,970 61,494 62.1 100.0 69.8 51.5 18.3 30.2 12.8 17.4 1995……….………… 104,058 65,304 62.8 100.0 70.2 54.3 15.9 29.7 13.3 16.4 2000 1………...……… 111,440 71,341 64.0 100.0 72.9 58.4 14.5 27.1 13.4 13.7 2005…………………… 117,814 72,309 61.4 100.0 72.7 59.9 12.8 27.3 14.1 13.2 2006…………………… 119,300 73,527 61.6 100.0 73.0 60.7 12.3 27.0 14.1 12.9
Men
1970………….……… 65,296 55,041 84.3 100.0 87.6 66.1 21.5 12.4 4.4 8.0 1975………….……… 72,346 59,091 81.7 100.0 87.5 63.8 23.7 12.5 4.4 8.1 1980……….………… 80,193 64,260 80.1 100.0 87.2 65.2 22.0 12.8 4.4 8.4 1985……….………… 85,454 67,301 78.8 100.0 86.5 66.8 19.7 13.5 4.8 8.7 1990 1………...……… 90,269 71,068 78.7 100.0 86.4 68.0 18.4 13.5 5.1 8.4 1995……….………… 95,867 73,667 76.8 100.0 86.2 70.6 15.6 13.9 5.5 8.4 2000 1………...……… 102,853 79,446 77.2 100.0 87.5 74.2 13.3 12.6 5.5 7.1 2005…………………… 110,161 82,013 74.4 100.0 87.0 74.2 12.8 13.0 6.3 6.7 2006…………………… 111,733 83,131 74.4 100.0 87.8 75.2 12.6 12.2 5.7 6.5
50 to 52weeks
1 to 49weeks Total 50 to 52
weeks1 to 49weeks
Population (in
thousands)
With work experience Percent distribution by work experience
Total (in
thousands)
Percent of population
Usually work full time Usually work part time
Total
1 The comparability of historical labor force data has beenaffected at various times by methodological and conceptualchanges in the Current Population Survey (CPS). For anexplanation, see the Historical Comparability documentationprovided at http://www.bls.gov/cps/eetech_methods.pdf .
NOTE: These data, collected in the Annual Social and
Economic Supplement, reflect the work experience of theentire year.
SOURCE: Annual Social and Economic Supplements, 1971-2007, Current Population Survey, U.S. Departmentof Labor, U.S. Bureau of Labor Statistics.
74

Table 23. Married-couple families by number and relationship of earners, 1967-2006(Numbers in thousands)
Married-couple families
Total Husband only
Wife only
Other family
memberTotal
Husband and wife
Husband and other
family member
Wife and other family
member
Husband and wife are not earners
1967……. 43,292 2,943 16,490 15,429 716 345 23,859 18,888 4,639 - -1968……. 43,842 2,888 16,375 15,310 730 335 24,579 19,743 4,522 - -1969……. 44,436 3,022 16,268 15,133 797 339 25,145 20,327 4,517 - -1970…...… 44,832 3,252 16,117 14,931 867 320 25,464 20,510 4,622 - -1971…...… 45,939 3,471 16,847 15,502 1,004 340 25,621 20,641 4,651 - -1972……. 46,594 3,632 16,787 15,387 1,003 398 26,175 21,279 4,553 - -1973…...… 47,185 4,027 16,080 14,547 1,110 423 27,078 22,152 4,535 - -1974…...… 47,438 4,325 15,795 14,122 1,216 457 27,319 22,451 4,442 - -1975…...… 47,878 4,943 16,217 14,343 1,394 481 26,717 22,338 3,861 - -1976……. 48,150 4,962 15,630 13,690 1,424 516 27,559 23,104 3,829 - -1977…...… 48,131 5,177 15,119 13,153 1,456 512 27,835 23,474 3,812 - -1978…...… 48,532 5,226 14,456 12,434 1,509 513 28,850 24,655 3,609 - -1979…...… 49,132 5,559 13,912 11,934 1,499 480 29,660 25,595 3,476 - -1980……. 49,316 5,903 13,900 11,621 1,707 573 29,513 25,557 3,380 - -1981……. 49,669 6,213 13,832 11,524 1,680 628 29,624 25,729 3,212 - -1982……. 49,947 6,427 14,235 11,575 2,048 613 29,285 25,387 3,149 - -1983…...… 50,134 6,549 13,692 11,100 1,944 647 29,893 26,119 2,996 - -1984……. 50,395 6,630 12,952 10,472 1,852 628 30,814 27,035 2,891 - -1985…...… 50,978 6,693 12,961 10,406 1,897 658 31,324 27,787 2,764 - -1986……. 51,574 6,731 12,565 9,984 1,917 664 32,278 28,811 2,730 - -1987……. 51,847 6,741 12,435 9,787 1,946 702 32,671 29,369 2,576 - -1988……. 52,149 6,754 11,876 9,463 1,777 636 33,519 30,536 2,303 532 148 1989…...… 52,385 6,812 11,748 9,212 1,840 695 33,825 30,879 2,373 435 138
1990……. 52,241 6,770 11,630 9,107 1,826 698 33,841 30,829 2,369 479 164 1991……. 52,549 7,091 11,523 8,873 1,993 657 33,935 31,049 2,161 527 197 1992……. 53,254 7,256 11,977 9,114 2,145 718 34,021 31,268 1,940 624 199 1993…...… 53,248 7,282 11,842 8,745 2,411 687 34,123 31,302 2,051 614 156 1994…...… 53,929 7,227 11,774 8,719 2,374 681 34,928 32,125 2,048 603 151 1995……. 53,621 7,278 11,739 8,821 2,253 664 34,604 32,061 1,878 539 127 1996……. 53,654 7,148 11,556 8,671 2,214 671 34,950 32,406 1,899 522 123 1997……. 54,362 7,289 11,728 8,792 2,302 634 35,345 32,764 1,853 569 158 1998…...… 54,829 7,257 12,279 9,198 2,419 662 35,293 32,810 1,726 616 141 1999……. 55,352 7,163 12,328 9,093 2,595 640 35,861 33,360 1,815 519 167
2000…...… 56,643 7,463 12,717 9,515 2,601 600 36,463 33,892 1,865 566 139 2001……. 56,798 7,666 12,907 9,621 2,698 588 36,224 33,696 1,898 501 129 2002……. 57,362 7,803 13,487 10,109 2,818 560 36,071 33,547 1,845 558 121 2003……. 57,767 8,043 14,051 10,469 3,026 557 35,673 33,220 1,789 548 117 2004……… 58,045 7,996 14,352 10,821 2,991 540 35,696 33,131 1,832 610 123 2005……… 58,225 8,017 14,292 10,603 3,096 593 35,915 33,380 1,818 597 121 2006……… 59,050 8,091 14,545 10,693 3,261 591 36,414 33,880 1,752 639 142
See note at end of table.
Two earners or more
YearTotal No
earners
One earner
75

Table 23. Married-couple families by number and relationship of earners, 1967-2006—Continued(Percent distribution)
Married-couple families
Total Husband only
Wife only
Other family
memberTotal Husband
and wife
Husband and other
family member
Wife and other family
member
Husband and wife are not earners
1967…..… 100.0 6.8 38.1 35.6 1.7 0.8 55.1 43.6 10.7 - -1968…...… 100.0 6.6 37.4 34.9 1.7 .8 56.1 45.0 10.3 - -1969…...… 100.0 6.8 36.6 34.1 1.8 .8 56.6 45.7 10.2 - -1970…...… 100.0 7.3 35.9 33.3 1.9 .7 56.8 45.7 10.3 - -1971…...… 100.0 7.6 36.7 33.7 2.2 .7 55.8 44.9 10.1 - -1972…...… 100.0 7.8 36.0 33.0 2.2 .9 56.2 45.7 9.8 - -1973……… 100.0 8.5 34.1 30.8 2.4 .9 57.4 46.9 9.6 - -1974…...… 100.0 9.1 33.3 29.8 2.6 1.0 57.6 47.3 9.4 - -1975…...… 100.0 10.3 33.9 30.0 2.9 1.0 55.8 46.7 8.1 - -1976…...… 100.0 10.3 32.5 28.4 3.0 1.1 57.2 48.0 8.0 - -1977……. 100.0 10.8 31.4 27.3 3.0 1.1 57.8 48.8 7.9 - -1978……. 100.0 10.8 29.8 25.6 3.1 1.1 59.4 50.8 7.4 - -1979……. 100.0 11.3 28.3 24.3 3.1 1.0 60.4 52.1 7.1 - -1980……. 100.0 12.0 28.2 23.6 3.5 1.2 59.8 51.8 6.9 - -1981……. 100.0 12.5 27.8 23.2 3.4 1.3 59.6 51.8 6.5 - -1982……. 100.0 12.9 28.5 23.2 4.1 1.2 58.6 50.8 6.3 - -1983……. 100.0 13.1 27.3 22.1 3.9 1.3 59.6 52.1 6.0 - -1984……. 100.0 13.2 25.7 20.8 3.7 1.2 61.1 53.6 5.7 - -1985……. 100.0 13.1 25.4 20.4 3.7 1.3 61.4 54.5 5.4 - -1986……. 100.0 13.1 24.4 19.4 3.7 1.3 62.6 55.9 5.3 - -1987……. 100.0 13.0 24.0 18.9 3.8 1.4 63.0 56.6 5.0 - -1988……. 100.0 13.0 22.8 18.1 3.4 1.2 64.3 58.6 4.4 1.0 0.3 1989……. 100.0 13.0 22.4 17.6 3.5 1.3 64.6 58.9 4.5 .8 .3
1990…...… 100.0 13.0 22.3 17.4 3.5 1.3 64.8 59.0 4.5 .9 .3 1991…...… 100.0 13.5 21.9 16.9 3.8 1.3 64.6 59.1 4.1 1.0 .4 1992…...… 100.0 13.6 22.5 17.1 4.0 1.3 63.9 58.7 3.6 1.2 .4 1993…...… 100.0 13.7 22.2 16.4 4.5 1.3 64.1 58.8 3.9 1.2 .3 1994……. 100.0 13.4 21.8 16.2 4.4 1.3 64.8 59.6 3.8 1.1 .3 1995……. 100.0 13.6 21.9 16.5 4.2 1.2 64.5 59.8 3.5 1.0 .2 1996……. 100.0 13.3 21.5 16.2 4.1 1.3 65.1 60.4 3.5 1.0 .2 1997……. 100.0 13.4 21.6 16.2 4.2 1.2 65.0 60.3 3.4 1.0 .3 1998……. 100.0 13.2 22.4 16.8 4.4 1.2 64.4 59.8 3.1 1.1 .3 1999……. 100.0 12.9 22.3 16.4 4.7 1.2 64.8 60.3 3.3 .9 .3
2000…...… 100.0 13.2 22.5 16.8 4.6 1.1 64.4 59.8 3.3 1.0 .2 2001……. 100.0 13.5 22.7 16.9 4.8 1.0 63.8 59.3 3.3 .9 .2 2002…...… 100.0 13.6 23.5 17.6 4.9 1.0 62.9 58.5 3.2 1.0 .2 2003……. 100.0 13.9 24.3 18.1 5.2 1.0 61.8 57.5 3.1 .9 .2 2004……… 100.0 13.8 24.7 18.6 5.2 .9 61.5 57.1 3.2 1.0 .2 2005……… 100.0 13.8 24.5 18.2 5.3 1.0 61.7 57.3 3.1 1.0 .2 2006……… 100.0 13.7 24.6 18.1 5.5 1.0 61.7 57.4 3.0 1.1 .2
YearTotal No
earners
One earner Two earners or more
NOTE: These data, collected in the Annual Socialand Economic Supplement, reflect the earnings andwork experience of the entire year. Dash indicates datanot available.
SOURCE: Annual Social and Economic Supplements,1968-2007, Current Population Survey, U.S. Departmentof Labor, U.S. Bureau of Labor Statistics.
76

Table 24. Contribution of wives' earnings to family income, 1970-2006
1970………………….……… 26.61971…………………….…… 27.51972…………...……………… 26.71973……………….………… 26.01974……………….………… 25.41975…………….…………… 26.31976………………….……… 26.41977………………….……… 26.11978……...…………………… 26.11979……………...…………… 26.0
1980………….……………… 26.71981……...…………………… 27.31982……………...…………… 28.41983……………….………… 28.81984………………….……… 28.41985……………….………… 28.31986………………...………… 29.01987……………………...…… 29.51988……………………...…… 29.61989……………………….… 29.9
1990………………….……… 30.71991………………….……… 31.31992…………………….…… 32.41993………….……………… 32.21994…………….…………… 31.91995……………….………… 31.91996……………………….… 32.61997…………………….…… 32.71998……………….………… 32.81999……………………….… 32.8
2000……………………….… 33.52001……………………….… 34.42002……………………….… 34.82003……………………….… 35.22004…………………………… 34.92005…………………………… 35.12006…………………………… 35.6
YearContribution to family income
(median percent)
NOTE: These data, collected in the Annual Socialand Economic Supplement, reflect the earnings andwork experience of the entire year.
SOURCE: Annual Social and EconomicSupplements, 1971-2007, Current Population Survey,U.S. Department of Labor, U.S. Bureau of LaborStatistics.
77

Table 25. Wives who earn more than their husbands, 1987-2006(Numbers in thousands)
Married-couple families in which
wife (but not necessarily
husband) had earnings from
work
Wives who earnmore than
their husbands 1
Percent of wiveswho earn more
than their husbands 1
Married-couple families in which
both wife and husband had earnings from
work
Wives who earnmore than
theirhusbands 2
Percent of wiveswho earn more
than their husbands 2
1987…...………… 32,025 7,581 23.7 29,755 5,311 17.81988…...………… 32,810 7,827 23.9 30,503 5,520 18.11989…...………… 33,119 8,068 24.4 30,848 5,796 18.8
1990…...………… 33,093 8,221 24.8 30,794 5,923 19.21991…...………… 33,516 8,983 26.8 30,998 6,465 20.91992…...………… 33,987 9,715 28.6 31,221 6,948 22.31993…...………… 34,286 10,000 29.2 31,264 6,978 22.31994…...………… 35,066 10,184 29.0 32,091 7,209 22.51995…...………… 34,819 9,822 28.2 32,030 7,033 22.01996…...………… 35,120 10,070 28.7 32,389 7,340 22.71997……............ 35,613 10,309 28.9 32,745 7,441 22.71998……............ 35,806 10,467 29.2 32,782 7,443 22.71999……............ 36,454 10,548 28.9 33,340 7,434 22.3
2000……............ 37,037 11,070 29.9 33,873 7,906 23.32001……............ 36,864 11,329 30.7 33,665 8,130 24.12002……............ 36,905 11,765 31.9 33,531 8,391 25.02003……............ 36,761 11,923 32.4 33,189 8,351 25.22004……………… 36,710 11,985 32.6 33,110 8,386 25.32005……………… 37,055 12,215 33.0 33,364 8,524 25.52006……………… 37,733 12,601 33.4 33,838 8,707 25.7
Year
Families in which wives have earnings but husbands may not
Families in which both wives and husbands have earnings
1 Includes families in which husband had no earningsfrom work.
2 Excludes families in which husband had no earningsfrom work.
NOTE: These data, collected in the Annual Socialand Economic Supplement, reflect the earnings and work
experience of the entire year.
SOURCE: Annual Social and EconomicSupplements, 1988-2007, Current Population Survey,U.S. Department of Labor, U.S. Bureau of LaborStatistics.
78

Table 26. Wage and salary workers paid hourly rates with earnings at or below the prevailing Federal minimum wage by selected characteristics, 2007 annual averages (Numbers in thousands)
Age and sex
Total, 16 years and over………………..………… 75,873 1,729 2.3 267 1,462 16 to 24 years………………………..…………… 16,275 814 5.0 145 669 25 years and over……………………..………… 59,597 915 1.5 122 793
Women, 16 years and over……………..………… 38,082 1,183 3.1 181 1,002 16 to 24 years………………………..…………… 7,961 572 7.2 93 479 25 years and over……………………..………… 30,121 611 2.0 88 523
Men, 16 years and over………………………..… 37,790 546 1.4 86 460 16 to 24 years…………………………………..… 8,314 242 2.9 52 190 25 years and over…………………………..…… 29,476 304 1.0 34 270
Race and Hispanic or Latino ethnicity
White……………………………..………………… 61,061 1,420 2.3 204 1,216 Women………………………..………………….… 30,117 949 3.2 131 818 Men………………………..………………….…… 30,944 471 1.5 73 398
Black or African American………………………… 9,965 205 2.1 55 150 Women………………………..………………….… 5,483 156 2.8 45 111 Men………………………..………………….…… 4,482 49 1.1 10 39
Asian……………….………………………………. 2,730 51 1.9 1 50 Women………………………..………………….… 1,469 37 2.5 1 36 Men………………………..………………….…… 1,260 14 1.1 - 14
Hispanic or Latino ………………………………… 13,168 246 1.9 41 205 Women………………………..………………….… 5,372 132 2.5 22 110 Men………………………..………………….…… 7,796 114 1.5 19 95
Characteristic
Workers paid hourly rates
Total
Total at or below prevailing minimum wage
TotalPercent of hourly paid
workers
At prevailing Federal
minimum wage
Below prevailing Federal
minimum wage
79
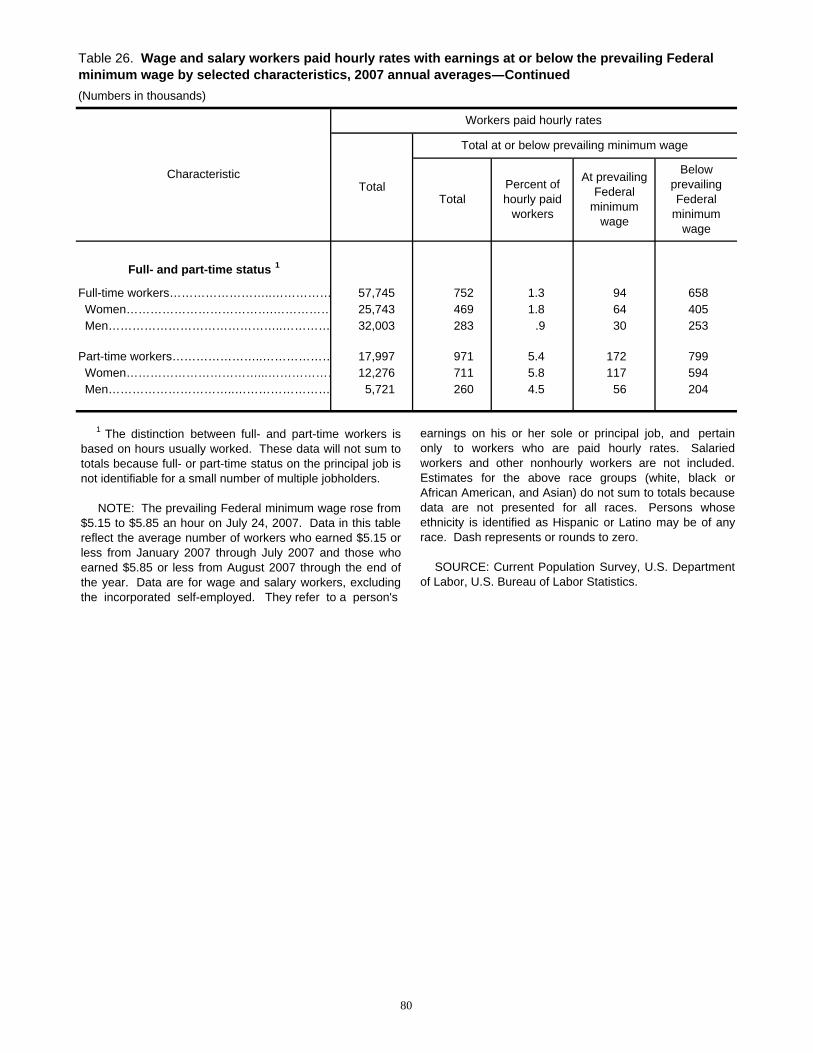
Table 26. Wage and salary workers paid hourly rates with earnings at or below the prevailing Federal minimum wage by selected characteristics, 2007 annual averages―Continued (Numbers in thousands)
Full- and part-time status 1
Full-time workers……………………..…………… 57,745 752 1.3 94 658 Women……………………………….…………… 25,743 469 1.8 64 405 Men……………………………………..………… 32,003 283 .9 30 253
Part-time workers…………………..……………… 17,997 971 5.4 172 799 Women……………………………...……………… 12,276 711 5.8 117 594 Men…………………………..…………………… 5,721 260 4.5 56 204
Characteristic
Workers paid hourly rates
Total
Total at or below prevailing minimum wage
TotalPercent of hourly paid
workers
At prevailing Federal
minimum wage
Below prevailing Federal
minimum wage
1 The distinction between full- and part-time workers isbased on hours usually worked. These data will not sum tototals because full- or part-time status on the principal job isnot identifiable for a small number of multiple jobholders.
NOTE: The prevailing Federal minimum wage rose from$5.15 to $5.85 an hour on July 24, 2007. Data in this tablereflect the average number of workers who earned $5.15 orless from January 2007 through July 2007 and those whoearned $5.85 or less from August 2007 through the end ofthe year. Data are for wage and salary workers, excludingthe incorporated self-employed. They refer to a person's
earnings on his or her sole or principal job, and pertainonly to workers who are paid hourly rates. Salariedworkers and other nonhourly workers are not included.Estimates for the above race groups (white, black orAfrican American, and Asian) do not sum to totals becausedata are not presented for all races. Persons whoseethnicity is identified as Hispanic or Latino may be of anyrace. Dash represents or rounds to zero.
SOURCE: Current Population Survey, U.S. Departmentof Labor, U.S. Bureau of Labor Statistics.
80

Table 27. Working poor: Poverty status of persons in the labor force for 27 weeks or more by age, sex, race, and Hispanic or Latino ethnicity, 2006(Numbers in thousands)
Total, 16 years and older…… 145,229 118,915 16,437 6,624 19,985 7,427 5,295 1,601 251 1,95616 to 19 years…………… 4,128 3,461 440 65 620 432 320 91 4 9120 to 24 years…………... 13,299 10,743 1,706 436 2,420 1,480 1,079 306 39 26625 to 34 years…………... 31,831 25,212 4,012 1,704 6,259 2,196 1,515 527 72 68935 to 44 years…………… 34,617 27,815 4,184 1,859 5,267 1,674 1,212 333 59 54645 to 54 years…………… 34,977 28,926 3,866 1,536 3,528 1,050 710 243 59 24155 to 64 years…………… 20,618 17,658 1,812 843 1,496 498 388 81 14 10265 years and older……… 5,759 5,100 417 182 396 96 71 22 3 21
Women, 16 years and older… 66,772 53,382 8,790 3,072 7,808 3,863 2,569 1,054 104 76916 to 19 years…………… 2,074 1,760 211 27 261 232 190 36 – 4020 to 24 years…………... 6,114 4,816 884 222 922 812 559 208 22 9925 to 34 years………...… 14,090 10,816 2,090 774 2,238 1,132 687 379 23 24735 to 44 years…………… 15,666 12,197 2,273 840 2,075 854 555 233 29 22145 to 54 years…………… 16,544 13,413 2,088 725 1,529 522 352 132 21 11155 to 64 years…………… 9,724 8,151 1,023 403 623 268 191 57 9 4465 years and older……… 2,558 2,230 220 82 161 44 35 8 – 6
Men, 16 years and older……… 78,457 65,533 7,648 3,552 12,177 3,564 2,726 547 147 1,18716 to 19 years…………… 2,054 1,701 229 38 360 201 129 55 4 5120 to 24 years…………… 7,185 5,926 822 214 1,498 668 520 98 17 16725 to 34 years…………… 17,740 14,397 1,921 930 4,021 1,064 829 147 49 44135 to 44 years…………... 18,951 15,618 1,911 1,019 3,191 821 657 99 30 32545 to 54 years…………… 18,433 15,513 1,778 811 1,999 528 358 111 37 13055 to 64 years…………… 10,894 9,507 789 441 873 231 197 23 5 5765 years and older……… 3,200 2,870 197 100 235 52 36 13 3 15
Age and sex
Total Below poverty level
Total WhiteBlack or African
AmericanAsian
Hispanic or Latino ethnicity
Total WhiteBlack or African
AmericanAsian
Hispanic or Latino ethnicity
81

Table 27. Working poor: Poverty status of persons in the labor force for 27 weeks or more by age, sex, race, and Hispanic or Latino ethnicity, 2006—Continued
Total, 16 years and older…… 5.1 4.5 9.7 3.8 9.816 to 19 years…………… 10.5 9.2 20.7 ( 2 ) 14.720 to 24 years…………... 11.1 10.0 17.9 8.9 11.025 to 34 years…………... 6.9 6.0 13.1 4.2 11.035 to 44 years…………… 4.8 4.4 8.0 3.2 10.445 to 54 years…………… 3.0 2.5 6.3 3.8 6.855 to 64 years…………… 2.4 2.2 4.4 1.7 6.865 years and older……… 1.7 1.4 5.2 1.9 5.3
Women, 16 years and older… 5.8 4.8 12.0 3.4 9.816 to 19 years…………… 11.2 10.8 17.0 ( 2 ) 15.520 to 24 years…………... 13.3 11.6 23.5 9.7 10.725 to 34 years………...… 8.0 6.3 18.1 2.9 11.035 to 44 years…………… 5.4 4.6 10.3 3.5 10.645 to 54 years…………… 3.2 2.6 6.3 2.9 7.355 to 64 years…………… 2.8 2.3 5.6 2.3 7.165 years and older……… 1.7 1.6 3.8 – 3.8
Men, 16 years and older……… 4.5 4.2 7.2 4.1 9.716 to 19 years…………… 9.8 7.6 24.0 ( 2 ) 14.120 to 24 years…………… 9.3 8.8 11.9 8.0 11.225 to 34 years…………… 6.0 5.8 7.7 5.3 11.035 to 44 years…………... 4.3 4.2 5.2 3.0 10.245 to 54 years…………… 2.9 2.3 6.3 4.6 6.555 to 64 years…………… 2.1 2.1 3.0 1.2 6.665 years and older……… 1.6 1.3 6.7 3.0 6.3
Age and sex
Rate 1
Total WhiteBlack or African
AmericanAsian
Hispanic or Latino ethnicity
1 Number below the poverty level as a percent of the total in the labor force for27 weeks or more. 2 Data not shown where base is less than 80,000.
NOTE: These data, collected in the Annual Social and Economic Supplement,reflect the earnings and work experience of the entire year. Estimates for theabove race groups (white, black or African American, and Asian) do not sum tototals because data are not presented for all races. Persons whose ethnicity isidentified as Hispanic or Latino may be of any race. Dash represents or rounds tozero.
SOURCE: Annual Social and Economic Supplement, Current PopulationSurvey, U.S. Department of Labor, U.S. Bureau of Labor Statistics.
82
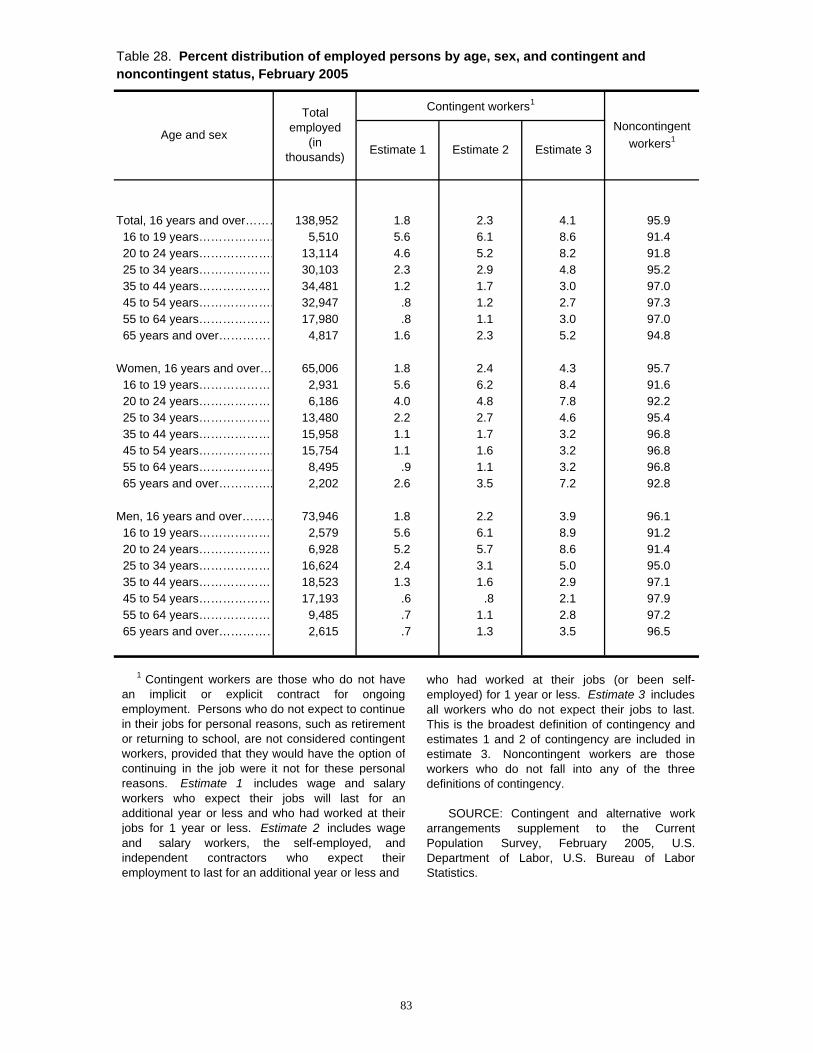
Table 28. Percent distribution of employed persons by age, sex, and contingent and noncontingent status, February 2005
Total, 16 years and over……… 138,952 1.8 2.3 4.1 95.9 16 to 19 years………………. 5,510 5.6 6.1 8.6 91.4 20 to 24 years………………. 13,114 4.6 5.2 8.2 91.8 25 to 34 years………………… 30,103 2.3 2.9 4.8 95.2 35 to 44 years………………… 34,481 1.2 1.7 3.0 97.0 45 to 54 years………………. 32,947 .8 1.2 2.7 97.3 55 to 64 years………………… 17,980 .8 1.1 3.0 97.0 65 years and over…………… 4,817 1.6 2.3 5.2 94.8
Women, 16 years and over… 65,006 1.8 2.4 4.3 95.7 16 to 19 years………………… 2,931 5.6 6.2 8.4 91.6 20 to 24 years………………… 6,186 4.0 4.8 7.8 92.2 25 to 34 years………………… 13,480 2.2 2.7 4.6 95.4 35 to 44 years………………… 15,958 1.1 1.7 3.2 96.8 45 to 54 years………………. 15,754 1.1 1.6 3.2 96.8 55 to 64 years………………. 8,495 .9 1.1 3.2 96.8 65 years and over………….. 2,202 2.6 3.5 7.2 92.8
Men, 16 years and over……… 73,946 1.8 2.2 3.9 96.1 16 to 19 years………………… 2,579 5.6 6.1 8.9 91.2 20 to 24 years………………… 6,928 5.2 5.7 8.6 91.4 25 to 34 years………………… 16,624 2.4 3.1 5.0 95.0 35 to 44 years………………… 18,523 1.3 1.6 2.9 97.1 45 to 54 years………………… 17,193 .6 .8 2.1 97.9 55 to 64 years………………… 9,485 .7 1.1 2.8 97.2 65 years and over…………… 2,615 .7 1.3 3.5 96.5
Estimate 1 Estimate 2 Estimate 3Age and sex
Total employed
(in thousands)
Contingent workers1
Noncontingent workers1
1 Contingent workers are those who do not havean implicit or explicit contract for ongoingemployment. Persons who do not expect to continuein their jobs for personal reasons, such as retirementor returning to school, are not considered contingentworkers, provided that they would have the option ofcontinuing in the job were it not for these personalreasons. Estimate 1 includes wage and salaryworkers who expect their jobs will last for anadditional year or less and who had worked at theirjobs for 1 year or less. Estimate 2 includes wageand salary workers, the self-employed, andindependent contractors who expect theiremployment to last for an additional year or less and
who had worked at their jobs (or been self-employed) for 1 year or less. Estimate 3 includesall workers who do not expect their jobs to last.This is the broadest definition of contingency andestimates 1 and 2 of contingency are included inestimate 3. Noncontingent workers are thoseworkers who do not fall into any of the threedefinitions of contingency.
SOURCE: Contingent and alternative workarrangements supplement to the CurrentPopulation Survey, February 2005, U.S.Department of Labor, U.S. Bureau of LaborStatistics.
83

Table 29. Percent distribution of employed persons by age, sex, and alternative work arrangements, February 2005
Total, 16 years and over……… 138,952 100.0 7.4 1.8 0.9 0.6 89.1 16 to 19 years……………..… 5,510 100.0 1.6 2.4 .6 .1 94.3 20 to 24 years…………...…… 13,114 100.0 2.7 2.7 1.5 .7 91.9 25 to 34 years…………….… 30,103 100.0 5.0 1.8 1.2 .7 91.1 35 to 44 years……………..… 34,481 100.0 8.0 1.7 .7 .6 88.9 45 to 54 years………..……… 32,947 100.0 8.5 1.3 .6 .6 89.0 55 to 64 years………………. 17,980 100.0 10.8 1.5 .8 .6 86.2 65 years and over………….… 4,817 100.0 18.3 3.6 .7 .4 76.8
Women, 16 years and over… 65,006 100.0 5.6 1.9 1.0 .4 91.0 16 to 19 years………………… 2,931 100.0 1.9 1.8 .3 - 95.7 20 to 24 years……………..… 6,186 100.0 2.6 2.5 1.5 .4 92.5 25 to 34 years……………..… 13,480 100.0 3.8 1.8 1.3 .5 92.6 35 to 44 years………………… 15,958 100.0 5.8 2.0 .8 .4 91.0 45 to 54 years………………. 15,754 100.0 6.6 1.3 .8 .3 90.9 55 to 64 years…………..…… 8,495 100.0 7.7 1.9 1.0 .5 88.8 65 years and over…………… 2,202 100.0 13.3 3.8 .8 .7 81.1
Men, 16 years and over……… 73,946 100.0 9.1 1.7 .8 .8 87.5 16 to 19 years……………..… 2,579 100.0 1.2 3.2 .9 .3 92.6 20 to 24 years…………..…… 6,928 100.0 2.8 2.9 1.5 .9 91.4 25 to 34 years……………..… 16,624 100.0 6.1 1.8 1.1 .8 89.9 35 to 44 years……….……… 18,523 100.0 9.8 1.4 .6 .8 87.1 45 to 54 years………….…… 17,193 100.0 10.3 1.2 .4 .8 87.3 55 to 64 years………………… 9,485 100.0 13.6 1.1 .5 .7 83.9 65 years and over…………… 2,615 100.0 22.5 3.5 .6 .1 73.3
Workers with traditional
arrangementsIndependent contractors
On-call workers
Temporary help agency
workers
Workers provided by
contract firms
Age and sex
Total employed
(in thousands)
Total
Percent of workers with alternative arrangements1
1 Independent contractors are workers who wereidentified as independent contractors, independentconsultants, or freelance workers, whether they were self-employed or wage and salary workers. On-call workers are workers who are called to work only as needed, althoughthey can be scheduled to work for several days or weeks ina row. Temporary help agency workers are workers whowere paid by a temporary help agency, whether or not theirjob was temporary. Workers provided by contract firms are workers who are employed by a company that providesthem or their services to others under contract and who areusually assigned to only one customer and usually work atthe customer's worksite.
NOTE: Workers with traditional arrangements arethose who do not fall into any of the "alternativearrangements" categories. Detail may not sum to totalsbecause the total employed includes day laborers (analternative arrangement, not shown separately) and asmall number of workers who were both "on-call" and"provided by contract firms." Dash represents zero.
SOURCE: Contingent and alternative workarrangements supplement to the Current PopulationSurvey, February 2005, U.S. Department of Labor, U.S.Bureau of Labor Statistics.
84
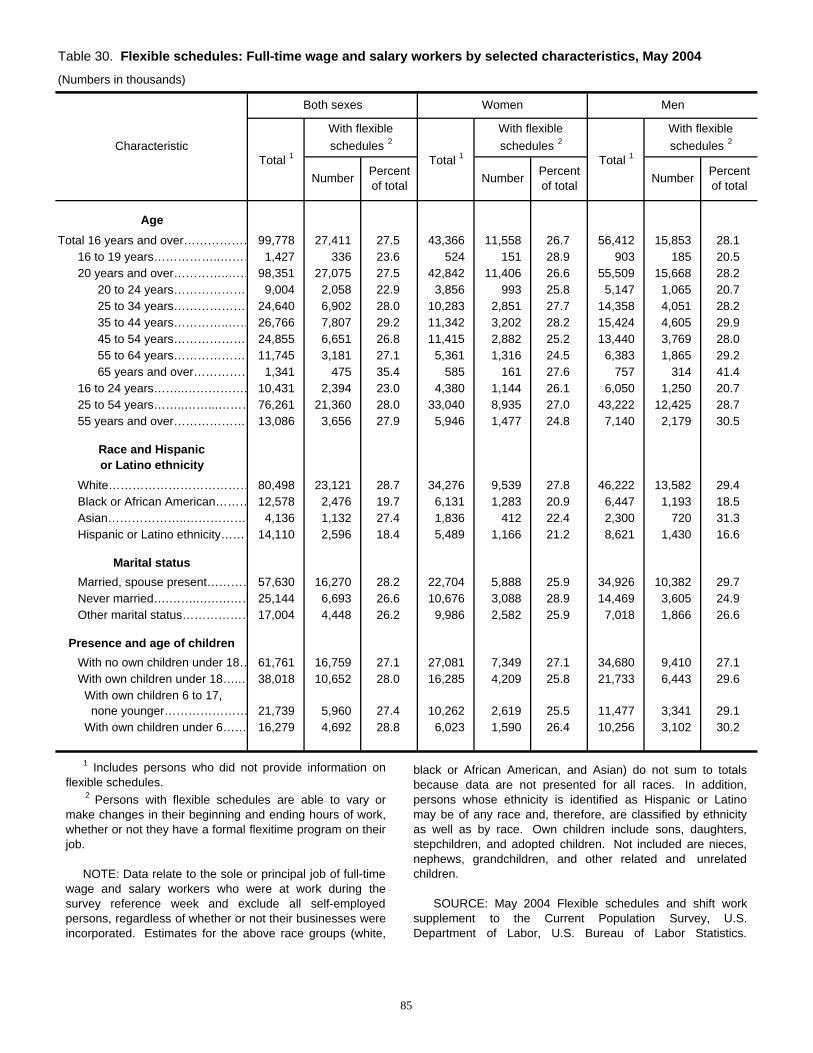
Table 30. Flexible schedules: Full-time wage and salary workers by selected characteristics, May 2004
(Numbers in thousands)
Total 16 years and over……………… 99,778 27,411 27.5 43,366 11,558 26.7 56,412 15,853 28.116 to 19 years……………..……… 1,427 336 23.6 524 151 28.9 903 185 20.520 years and over…………..…… 98,351 27,075 27.5 42,842 11,406 26.6 55,509 15,668 28.2
20 to 24 years……………… 9,004 2,058 22.9 3,856 993 25.8 5,147 1,065 20.725 to 34 years……………… 24,640 6,902 28.0 10,283 2,851 27.7 14,358 4,051 28.235 to 44 years…………..…… 26,766 7,807 29.2 11,342 3,202 28.2 15,424 4,605 29.945 to 54 years……………… 24,855 6,651 26.8 11,415 2,882 25.2 13,440 3,769 28.055 to 64 years……………… 11,745 3,181 27.1 5,361 1,316 24.5 6,383 1,865 29.265 years and over…………… 1,341 475 35.4 585 161 27.6 757 314 41.4
16 to 24 years……..……………. 10,431 2,394 23.0 4,380 1,144 26.1 6,050 1,250 20.725 to 54 years……..……...……… 76,261 21,360 28.0 33,040 8,935 27.0 43,222 12,425 28.755 years and over……………… 13,086 3,656 27.9 5,946 1,477 24.8 7,140 2,179 30.5
White……………………………… 80,498 23,121 28.7 34,276 9,539 27.8 46,222 13,582 29.4Black or African American……… 12,578 2,476 19.7 6,131 1,283 20.9 6,447 1,193 18.5Asian………………..…………… 4,136 1,132 27.4 1,836 412 22.4 2,300 720 31.3Hispanic or Latino ethnicity………14,110 2,596 18.4 5,489 1,166 21.2 8,621 1,430 16.6
Married, spouse present………… 57,630 16,270 28.2 22,704 5,888 25.9 34,926 10,382 29.7Never married….……..….….…… 25,144 6,693 26.6 10,676 3,088 28.9 14,469 3,605 24.9Other marital status……………… 17,004 4,448 26.2 9,986 2,582 25.9 7,018 1,866 26.6
With no own children under 18… 61,761 16,759 27.1 27,081 7,349 27.1 34,680 9,410 27.1With own children under 18…..… 38,018 10,652 28.0 16,285 4,209 25.8 21,733 6,443 29.6 With own children 6 to 17, none younger………………… 21,739 5,960 27.4 10,262 2,619 25.5 11,477 3,341 29.1 With own children under 6…… 16,279 4,692 28.8 6,023 1,590 26.4 10,256 3,102 30.2
or Latino ethnicity
Characteristic
Both sexes Women Men
Total 1
With flexible schedules 2
Total 1
With flexible schedules 2
Total 1
With flexible schedules 2
Marital status
Presence and age of children
Number Percent of total
Age
Race and Hispanic
Number Percent of total Number Percent
of total
1 Includes persons who did not provide information onflexible schedules.
2 Persons with flexible schedules are able to vary ormake changes in their beginning and ending hours of work,whether or not they have a formal flexitime program on theirjob.
NOTE: Data relate to the sole or principal job of full-timewage and salary workers who were at work during thesurvey reference week and exclude all self-employedpersons, regardless of whether or not their businesses wereincorporated. Estimates for the above race groups (white,
black or African American, and Asian) do not sum to totalsbecause data are not presented for all races. In addition,persons whose ethnicity is identified as Hispanic or Latinomay be of any race and, therefore, are classified by ethnicityas well as by race. Own children include sons, daughters,stepchildren, and adopted children. Not included are nieces,nephews, grandchildren, and other related and unrelatedchildren.
SOURCE: May 2004 Flexible schedules and shift worksupplement to the Current Population Survey, U.S.Department of Labor, U.S. Bureau of Labor Statistics.
85

Table 31. Job-related work at home on primary job: All workers by marital status, presence and age
(Numbers in thousands)
Total, 16 years and over……………… 136,602 20,673 15.1 16.2 49.3 33.7Married, spouse present………... 77,243 14,623 18.9 16.4 48.1 34.6Not married……………...………… 59,359 6,050 10.2 15.7 52.2 31.5
Never married………………… 36,857 3,087 8.4 17.7 58.1 23.2Other marital status…………… 22,502 2,963 13.2 13.6 46.1 40.2
With own children under 18……… 50,011 8,584 17.2 17.4 47.5 34.0 With own children under 6… 21,373 3,599 16.8 19.2 47.3 32.8
With no own children under 18…… 86,591 12,090 14.0 15.4 50.5 33.4
Total, 16 years and over……………… 64,185 9,893 15.4 17.8 51.4 29.4Married, spouse present………... 33,750 6,509 19.3 18.2 48.8 31.4Not married……….....……………… 30,435 3,384 11.1 17.1 56.5 25.5
Never married………………… 16,754 1,522 9.1 19.2 66.2 12.7Other marital status…………… 13,681 1,862 13.6 15.3 48.6 35.9
With own children under 18……… 24,108 4,051 16.8 19.9 46.6 31.5 With own children under 6… 9,331 1,614 17.3 23.4 42.6 32.6
With no own children under 18…… 40,077 5,842 14.6 16.3 54.8 27.9
Total, 16 years and over……………… 72,417 10,780 14.9 14.7 47.3 37.6Married, spouse present………… 43,493 8,114 18.7 15.0 47.5 37.1Not married…………..……...……… 28,924 2,666 9.2 13.9 46.8 39.1
Never married………………… 20,104 1,565 7.8 16.2 50.3 33.3Other marital status…………… 8,820 1,101 12.5 10.5 41.8 47.4
With own children under 18…….… 25,903 4,533 17.5 15.1 48.4 36.3 With own children under 6… 12,042 1,986 16.5 15.8 51.0 33.0
With no own children under 18…… 46,514 6,247 13.4 14.5 46.5 38.6
of children, sex, and pay status, May 2004
CharacteristicTotal
employed 3
Persons who usually worked at home 1
Total Rate
Percent distribution by class of worker 2
Wage and salary Self- employed 4
Paid Unpaid
Total
Women
Men
1 Persons who usually work at home are defined asthose who work at home at least once per week as partof their primary job.
2 Unpaid family workers and wage and salary workerswho did not report pay status are included in total but notshown separately.
3 Includes persons who did not provide information onwork at home.
4 Includes both the incorporated and unincorporatedself-employed.
NOTE: Data refer to employed persons innonagricultural industries. Own children include sons,daughters, stepchildren, and adopted children. Notincluded are nieces, nephews, grandchildren, and otherrelated and unrelated children.
SOURCE: May 2004 Work at home supplement tothe Current Population Survey, U.S. Department ofLabor, U.S. Bureau of Labor Statistics.
86

Table 32. Displaced workers1 by age, sex, race, Hispanic or Latino ethnicity, and employment status in January 2008
Total
Total, 20 years and over…………...… 3,641 100.0 67.1 18.0 15.0 20 to 24 years…………………...…… 127 100.0 67.5 22.8 9.7 25 to 54 years……………...………… 2,602 100.0 72.6 17.4 10.0 55 to 64 years…………...…………… 708 100.0 60.8 20.7 18.5 65 years and over…………...……… 204 100.0 18.4 12.6 69.0
Women, 20 years and over………… 1,617 100.0 63.5 16.9 19.6 20 to 24 years……………………...… 53 100.0 ( 2 ) ( 2 ) ( 2 ) 25 to 54 years………………..……… 1,112 100.0 70.1 15.1 14.8 55 to 64 years…………………..…… 352 100.0 53.4 23.6 23.0 65 years and over………………..… 101 100.0 22.4 9.8 67.8
Men, 20 years and over…………….. 2,024 100.0 69.9 18.8 11.2 20 to 24 years……………………..… 75 100.0 66.4 22.5 11.1 25 to 54 years……………..………… 1,490 100.0 74.4 19.1 6.5 55 to 64 years…………..…………… 356 100.0 68.0 17.9 14.0 65 years and over…………..……… 103 100.0 14.4 15.4 70.2
White
Total, 20 years and over…………..… 3,032 100.0 67.9 16.8 15.3 Women……………………………… 1,348 100.0 64.4 14.9 20.7
Men 1 684 100 0 70 8 18 2 11 0
Age, sex, race, and Hispanic or Latino ethnicity
Total (in
thousands)
Percent distribution by employment status
Total Employed Unemployed Not in labor force
Men……………………………….…… 1,684 100.0 70.8 18.2 11.0
Black or African American
Total, 20 years and over……………… 408 100.0 58.6 28.2 13.3 Women…………………………….… 187 100.0 56.3 31.1 12.6 Men…………………………….……… 221 100.0 60.5 25.7 13.8
Asian
Total, 20 years and over……………… 122 100.0 67.3 11.7 21.0 Women…………………………….… 57 100.0 ( 2 ) ( 2 ) ( 2 ) Men………………………………..… 65 100.0 ( 2 ) ( 2 ) ( 2 )
Hispanic or Latino ethnicity
Total, 20 years and over………….… 423 100.0 68.4 17.4 14.1 Women……………………………… 153 100.0 65.5 6.9 27.6 Men…………………………..……… 270 100.0 70.1 23.4 6.6
1 Data refer to persons who had 3 or more yearsof tenure on a job they had lost or left betweenJanuary 2005 and December 2007 because of plantor company closings or moves, insufficient work, orthe abolishment of their positions or shifts.
2 Data not shown where base is less than 75,000.
NOTE: Estimates for the above race groups(white, black or African American, and Asian) do not
sum to totals because data are not presented for allraces. Persons whose ethnicity is identified asHispanic or Latino may be of any race.
SOURCE: January 2008 Displaced Workersupplement to the Current Population Survey, U.S.Department of Labor, U.S. Bureau of Labor Statistics.
87

Table 33. Labor force status of 2007 high school graduates and 2006-07 high school dropouts 16 to 24 years old by school enrollment and sex, October 2007(Numbers in thousands)
Total, 2007 high school graduates…… 2,955 1,531 51.8 1,307 44.2 224 14.7 1,424
Women…………………….……………… 1,444 731 50.6 635 44.0 96 13.2 713 Men……………………….………………… 1,511 800 52.9 672 44.5 128 16.0 711
Enrolled in college………...……………… 1,986 789 39.7 712 35.9 77 9.8 1,197Percent of total 2007 graduates……… 67.2 51.5 - 54.5 - 34.4 - 84.1
Women…………………………..……… 986 402 40.7 353 35.8 49 12.1 585Percent of female 2007 graduates… 68.3 55.0 - 55.6 - 51.0 - 82.0
Men………………………….…………… 999 387 38.8 359 35.9 28 7.3 612Percent of male 2007 graduates…… 66.1 48.4 - 53.4 - 21.9 - 86.1
Not enrolled in college……………..…… 970 742 76.6 595 61.3 147 19.9 227Percent of total 2007 graduates……… 32.8 48.5 - 45.5 - 65.6 - 15.9
Women………………………………….. 458 330 72.0 282 61.6 48 14.5 128Percent of female 2007 graduates… 31.7 45.1 - 44.4 - 50.0 - 18.0
Men……………………………………… 512 413 80.6 313 61.1 100 24.1 99Percent of male 2007 graduates…… 33.9 51.6 - 46.6 - 78.1 - 13.9
Total, 2006-07 high school dropouts1… 426 239 56.2 175 41.1 64 26.9 187
Women…………………………..……… 193 99 51.1 79 40.6 20 20.4 95 Men………………………………….…… 233 141 60.4 96 41.4 44 31.5 92
TotalPercent of labor
force
Characteristic
Civilian noninsti-tutional
population
Civilian labor force
Not in labor force Total
Percent of
population
Employed Unemployed
Total Percent
of population
1 Data refer to persons who dropped out of school between October 2006 and October 2007.
NOTE: Because of rounding, sums of individual items may not equal totals. The weights used in estimation were revisedwith the release of October 2007 data. As a result, the 2007 October data are not strictly comparable with publishedestimates from earlier years.
SOURCE: October 2007 Current Population Survey, U.S. Department of Labor, U.S. Bureau of Labor Statistics.
88

Table 34. Labor force status of persons 16 to 24 years old by school enrollment, sex, and educational attainment, October 2007
(Numbers in thousands)
Enrolled in school…………………...… 21,061 8,979 42.6 8,181 38.8 798 8.9 12,083
Women……………………………….… 10,717 4,884 45.6 4,470 41.7 414 8.5 5,833 Men……………………………….……… 10,344 4,095 39.6 3,711 35.9 383 9.4 6,250
Enrolled in high school 1…………...…… 9,724 2,855 29.4 2,421 24.9 434 15.2 6,869
Women……………………………….… 4,607 1,425 30.9 1,218 26.4 206 14.5 3,182 Men……………………………….…… 5,118 1,431 28.0 1,203 23.5 227 15.9 3,687
Enrolled in college……………..……… 11,337 6,124 54.0 5,760 50.8 364 5.9 5,213
Women…………………….…………… 6,110 3,460 56.6 3,252 53.2 208 6.0 2,651 Men…………………….……………… 5,226 2,664 51.0 2,508 48.0 156 5.9 2,563
Not enrolled in school……………..…… 16,419 13,264 80.8 11,740 71.5 1,524 11.5 3,155
Women…………………………….…… 7,823 5,710 73.0 5,112 65.3 598 10.5 2,113 Less than a high school diploma ...... 1,419 689 48.6 558 39.3 131 19.0 730 High school graduates, no college 2 . 3,340 2,371 71.0 2,077 62.2 294 12.4 969 Some college or associate degree ... 1,884 1,527 81.1 1,416 75.1 112 7.3 357 Bachelor’s degree and higher ........... 1,180 1,122 95.1 1,061 90.0 61 5.4 58
Men……………………………………... 8,595 7,554 87.9 6,628 77.1 926 12.3 1,042 Less than a high school diploma ...... 1,859 1,496 80.5 1,261 67.8 236 15.7 362 High school graduates, no college 2 . 4,073 3,544 87.0 3,069 75.3 475 13.4 529 Some college or associate degree ... 1,768 1,662 94.0 1,509 85.4 152 9.2 106 Bachelor’s degree and higher ........... 895 852 95.1 789 88.1 63 7.4 44
TotalPercent of labor
force
Characteristic
Civilian noninsti-tutional
population
Civilian labor force
Not in labor force Total
Percent of
population
Employed Unemployed
TotalPercent
of population
1 Includes a small number of persons enrolled in grades below high school. 2 Includes high school diploma or equivalent.
NOTE: Because of rounding, sums of individual items may not equal totals. The weights used in estimation were revisedwith the release of October 2007 data. As a result, the 2007 October data are not strictly comparable with published estimatesfrom earlier years.
SOURCE: October 2007 Current Population Survey, U.S. Department of Labor, U.S. Bureau of Labor Statistics.
89
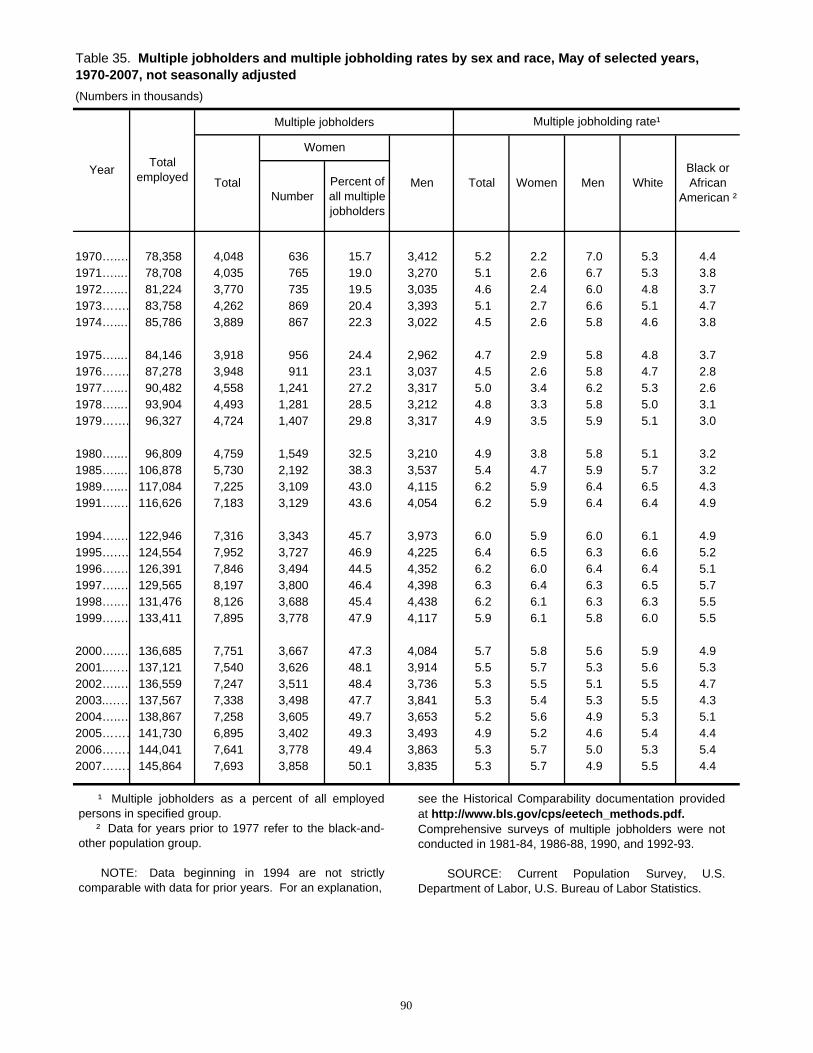
Table 35. Multiple jobholders and multiple jobholding rates by sex and race, May of selected years, 1970-2007, not seasonally adjusted(Numbers in thousands)
Multiple jobholders
NumberPercent of all multiple jobholders
1970…..… 78,358 4,048 636 15.7 3,412 5.2 2.2 7.0 5.3 4.4 1971…...… 78,708 4,035 765 19.0 3,270 5.1 2.6 6.7 5.3 3.8 1972…...… 81,224 3,770 735 19.5 3,035 4.6 2.4 6.0 4.8 3.7 1973……. 83,758 4,262 869 20.4 3,393 5.1 2.7 6.6 5.1 4.7 1974…...… 85,786 3,889 867 22.3 3,022 4.5 2.6 5.8 4.6 3.8
1975…...… 84,146 3,918 956 24.4 2,962 4.7 2.9 5.8 4.8 3.7 1976……. 87,278 3,948 911 23.1 3,037 4.5 2.6 5.8 4.7 2.8 1977…...… 90,482 4,558 1,241 27.2 3,317 5.0 3.4 6.2 5.3 2.6 1978…...… 93,904 4,493 1,281 28.5 3,212 4.8 3.3 5.8 5.0 3.1 1979……. 96,327 4,724 1,407 29.8 3,317 4.9 3.5 5.9 5.1 3.0
1980…...… 96,809 4,759 1,549 32.5 3,210 4.9 3.8 5.8 5.1 3.2 1985…...… 106,878 5,730 2,192 38.3 3,537 5.4 4.7 5.9 5.7 3.2 1989…...… 117,084 7,225 3,109 43.0 4,115 6.2 5.9 6.4 6.5 4.3 1991…..… 116,626 7,183 3,129 43.6 4,054 6.2 5.9 6.4 6.4 4.9
1994…..… 122,946 7,316 3,343 45.7 3,973 6.0 5.9 6.0 6.1 4.9 1995….… 124,554 7,952 3,727 46.9 4,225 6.4 6.5 6.3 6.6 5.2 1996…..… 126,391 7,846 3,494 44.5 4,352 6.2 6.0 6.4 6.4 5.1 1997…..… 129,565 8,197 3,800 46.4 4,398 6.3 6.4 6.3 6.5 5.7 1998…..… 131,476 8,126 3,688 45.4 4,438 6.2 6.1 6.3 6.3 5.5 1999…..… 133,411 7,895 3,778 47.9 4,117 5.9 6.1 5.8 6.0 5.5
2000…..… 136,685 7,751 3,667 47.3 4,084 5.7 5.8 5.6 5.9 4.9 2001..…… 137,121 7,540 3,626 48.1 3,914 5.5 5.7 5.3 5.6 5.3 2002…..… 136,559 7,247 3,511 48.4 3,736 5.3 5.5 5.1 5.5 4.7 2003..…… 137,567 7,338 3,498 47.7 3,841 5.3 5.4 5.3 5.5 4.3 2004…..… 138,867 7,258 3,605 49.7 3,653 5.2 5.6 4.9 5.3 5.1 2005………141,730 6,895 3,402 49.3 3,493 4.9 5.2 4.6 5.4 4.4 2006………144,041 7,641 3,778 49.4 3,863 5.3 5.7 5.0 5.3 5.4 2007………145,864 7,693 3,858 50.1 3,835 5.3 5.7 4.9 5.5 4.4
Men WhiteBlack or African
American ²
Year Total employed
Multiple jobholding rate¹
Total
Women
Men Total Women
¹ Multiple jobholders as a percent of all employedpersons in specified group.
² Data for years prior to 1977 refer to the black-and-other population group.
NOTE: Data beginning in 1994 are not strictlycomparable with data for prior years. For an explanation,
see the Historical Comparability documentation providedat http://www.bls.gov/cps/eetech_methods.pdf.Comprehensive surveys of multiple jobholders were notconducted in 1981-84, 1986-88, 1990, and 1992-93.
SOURCE: Current Population Survey, U.S.Department of Labor, U.S. Bureau of Labor Statistics.
90

Table 36. Unincorporated self-employed persons in nonagricultural industries by sex, 1976-2007 annual averages (Numbers in thousands)
Total employed
Self-employed
Self-employed
as a percent of
total
Total employed
Self-employed
Self-employed
as a percent of
total
Total employed
Self-employed
Self-employed
as a percent of
total
1976…… 85,421 5,782 6.8 35,027 1,549 4.4 50,394 4,233 8.4 26.8 1977….. 88,734 6,115 6.9 36,677 1,692 4.6 52,057 4,423 8.5 27.7 1978….. 92,661 6,428 6.9 38,900 1,814 4.7 53,761 4,614 8.6 28.2 1979….. 95,477 6,792 7.1 40,556 1,982 4.9 54,921 4,810 8.8 29.2 1980….. 95,938 7,001 7.3 41,461 2,097 5.1 54,477 4,904 9.0 30.0 1981….. 97,030 7,097 7.3 42,333 2,192 5.2 54,697 4,905 9.0 30.9 1982….. 96,125 7,263 7.6 42,591 2,309 5.4 53,534 4,954 9.3 31.8 1983….. 97,450 7,575 7.8 43,367 2,439 5.6 54,083 5,136 9.5 32.2 1984…… 101,685 7,785 7.7 45,262 2,566 5.7 56,423 5,219 9.2 33.0 1985….. 103,971 7,810 7.5 46,615 2,603 5.6 57,356 5,207 9.1 33.3 1986….. 106,435 7,881 7.4 48,054 2,610 5.4 58,381 5,271 9.0 33.1 1987….. 109,232 8,201 7.5 49,668 2,778 5.6 59,564 5,423 9.1 33.9 1988…… 111,800 8,519 7.6 51,020 2,955 5.8 60,780 5,564 9.2 34.7 1989….. 114,143 8,605 7.5 52,341 3,043 5.8 61,802 5,562 9.0 35.4 1990…… 115,570 8,719 7.5 53,011 3,122 5.9 62,559 5,597 8.9 35.8 1991….. 114,449 8,850 7.7 52,815 3,150 6.0 61,634 5,700 9.2 35.6 1992….. 115,246 8,576 7.4 53,380 2,963 5.6 61,866 5,613 9.1 34.5 1993….. 117,144 8,959 7.6 54,273 3,065 5.6 62,871 5,894 9.4 34.2 1994….. 119,651 9,003 7.5 55,755 3,443 6.2 63,896 5,560 8.7 38.2 1995….. 121,460 8,901 7.3 56,642 3,440 6.1 64,818 5,461 8.4 38.6 1996….. 123,264 8,971 7.3 57,630 3,506 6.1 65,634 5,465 8.3 39.1 1997….. 126,159 9,056 7.2 59,026 3,550 6.0 67,133 5,506 8.2 39.2 1998….. 128,085 8,962 7.0 59,945 3,482 5.8 68,140 5,480 8.0 38.9 1999….. 130,207 8,790 6.8 61,193 3,424 5.6 69,014 5,366 7.8 39.0 2000….. 134,427 9,205 6.8 62,983 3,631 5.8 71,444 5,573 7.8 39.4 2001….. 134,635 9,121 6.8 63,147 3,594 5.7 71,488 5,527 7.7 39.4 2002…… 134,174 8,923 6.7 62,995 3,499 5.6 71,179 5,425 7.6 39.2 2003….. 135,461 9,344 6.9 63,824 3,609 5.7 71,636 5,736 8.0 38.6 2004…… 137,020 9,467 6.9 64,182 3,607 5.6 72,838 5,860 8.0 38.1 2005….. 139,532 9,509 6.8 65,213 3,565 5.5 74,319 5,944 8.0 37.5 2006…… 142,221 9,685 6.8 66,382 3,681 5.5 75,838 6,004 7.9 38.0 2007…… 143,952 9,557 6.6 67,302 3,637 5.4 76,650 5,920 7.7 38.1
Self-employed women as percent of total self-employed
Year
Total Women Men
NOTE: Beginning in 2000, data reflect the introduction of the 2002 Census industry classification system derived from the2002 North American Industry Classification System into the Current Population Survey (CPS).
SOURCE: Current Population Survey, U.S. Department of Labor, U.S. Bureau of Labor Statistics.
91
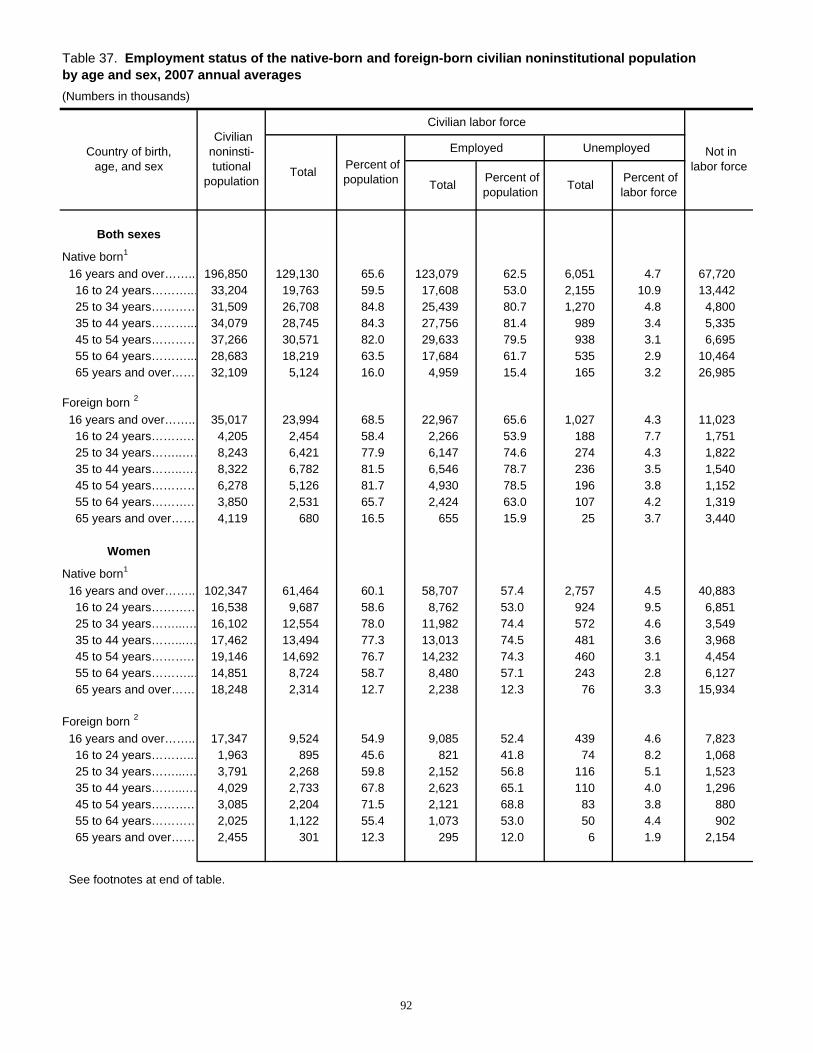
Table 37. Employment status of the native-born and foreign-born civilian noninstitutional population by age and sex, 2007 annual averages(Numbers in thousands)
Civilian labor force
Employed Unemployed
Both sexes
Native born1
16 years and over…….. 196,850 129,130 65.6 123,079 62.5 6,051 4.7 67,720 16 to 24 years………..… 33,204 19,763 59.5 17,608 53.0 2,155 10.9 13,442 25 to 34 years………… 31,509 26,708 84.8 25,439 80.7 1,270 4.8 4,800 35 to 44 years………... 34,079 28,745 84.3 27,756 81.4 989 3.4 5,335 45 to 54 years………… 37,266 30,571 82.0 29,633 79.5 938 3.1 6,695 55 to 64 years………... 28,683 18,219 63.5 17,684 61.7 535 2.9 10,464 65 years and over……. 32,109 5,124 16.0 4,959 15.4 165 3.2 26,985
Foreign born 2
16 years and over…….. 35,017 23,994 68.5 22,967 65.6 1,027 4.3 11,023 16 to 24 years……….… 4,205 2,454 58.4 2,266 53.9 188 7.7 1,751 25 to 34 years……..…… 8,243 6,421 77.9 6,147 74.6 274 4.3 1,822 35 to 44 years……..…… 8,322 6,782 81.5 6,546 78.7 236 3.5 1,540 45 to 54 years………… 6,278 5,126 81.7 4,930 78.5 196 3.8 1,152 55 to 64 years……….… 3,850 2,531 65.7 2,424 63.0 107 4.2 1,319 65 years and over…… 4,119 680 16.5 655 15.9 25 3.7 3,440
Women
Native born1
16 years and over…….. 102,347 61,464 60.1 58,707 57.4 2,757 4.5 40,883 16 to 24 years………… 16,538 9,687 58.6 8,762 53.0 924 9.5 6,851 25 to 34 years……...… 16,102 12,554 78.0 11,982 74.4 572 4.6 3,549 35 to 44 years……...… 17,462 13,494 77.3 13,013 74.5 481 3.6 3,968 45 to 54 years……….… 19,146 14,692 76.7 14,232 74.3 460 3.1 4,454 55 to 64 years………..… 14,851 8,724 58.7 8,480 57.1 243 2.8 6,127 65 years and over……. 18,248 2,314 12.7 2,238 12.3 76 3.3 15,934
Foreign born 2
16 years and over…….. 17,347 9,524 54.9 9,085 52.4 439 4.6 7,823 16 to 24 years………..… 1,963 895 45.6 821 41.8 74 8.2 1,068 25 to 34 years……...… 3,791 2,268 59.8 2,152 56.8 116 5.1 1,523 35 to 44 years……...… 4,029 2,733 67.8 2,623 65.1 110 4.0 1,296 45 to 54 years……….… 3,085 2,204 71.5 2,121 68.8 83 3.8 880 55 to 64 years………… 2,025 1,122 55.4 1,073 53.0 50 4.4 902 65 years and over…… 2,455 301 12.3 295 12.0 6 1.9 2,154
See footnotes at end of table.
Country of birth, age, and sex
Civilian noninsti-tutional
population
Not in labor force Total Percent of
population Total Percent of population Total Percent of
labor force
92

Table 37. Employment status of the native-born and foreign-born civilian noninstitutional population by age and sex, 2007 annual averages—Continued(Numbers in thousands)
Civilian labor force
Employed Unemployed
Men
Native born1
16 years and over……… 94,503 67,666 71.6 64,372 68.1 3,294 4.9 26,837 16 to 24 years………… 16,667 10,076 60.5 8,846 53.1 1,230 12.2 6,591 25 to 34 years………... 15,406 14,155 91.9 13,457 87.3 698 4.9 1,251 35 to 44 years………... 16,617 15,251 91.8 14,743 88.7 508 3.3 1,366 45 to 54 years……….… 18,120 15,879 87.6 15,401 85.0 478 3.0 2,241 55 to 64 years……….… 13,832 9,495 68.6 9,204 66.5 291 3.1 4,337 65 years and over……. 13,861 2,810 20.3 2,721 19.6 89 3.2 11,051
Foreign born 2
16 years and over……… 17,670 14,470 81.9 13,883 78.6 588 4.1 3,200 16 to 24 years……….… 2,242 1,559 69.6 1,445 64.5 114 7.3 683 25 to 34 years……...… 4,452 4,153 93.3 3,995 89.7 158 3.8 299 35 to 44 years………... 4,293 4,049 94.3 3,923 91.4 126 3.1 244 45 to 54 years………… 3,193 2,922 91.5 2,809 88.0 113 3.9 271 55 to 64 years……….… 1,825 1,409 77.2 1,352 74.0 57 4.1 417 65 years and over……. 1,664 378 22.7 359 21.6 19 5.1 1,286
Country of birth, age, and sex
Civilian noninsti-tutional
population
Not in labor force Total Percent of
population Total Percent of population Total Percent of
labor force
1 Native-born persons are those who were born in the UnitedStates or a U.S. Island Area such as Puerto Rico, or bornabroad of a U.S.-citizen parent.
2 Foreign born refers to people residing in the United Stateswho were born outside the United States or one of its outlyingareas, such as Puerto Rico or Guam, to parents neither of
whom was a U.S. citizen. This group primarily includeslegally admitted immigrants, but also includes refugees,students, temporary workers, and undocumented aliens.
SOURCE: Current Population Survey, U.S. Departmentof Labor, U.S. Bureau of Labor Statistics.
93
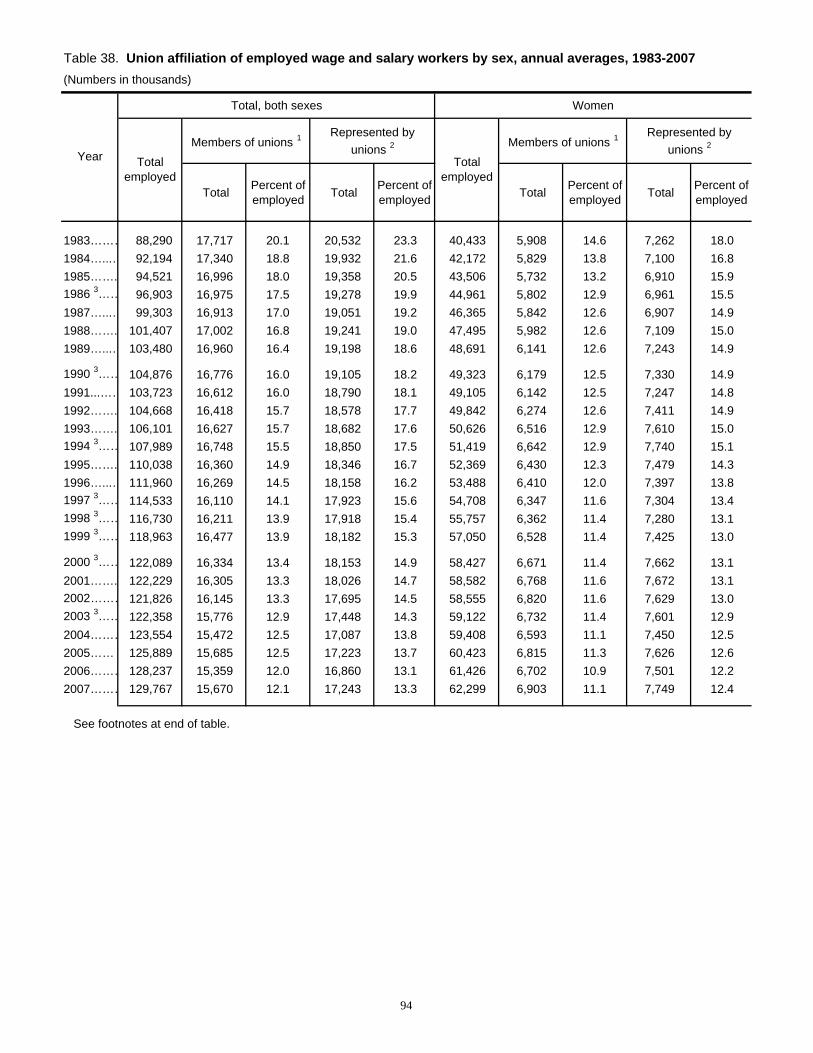
Table 38. Union affiliation of employed wage and salary workers by sex, annual averages, 1983-2007(Numbers in thousands)
Total, both sexes Women
Members of unions 1 Represented by unions 2 Members of unions 1 Represented by
unions 2
Total Percent of employed Total Percent of
employed Total Percent of employed Total Percent of
employed
1983……… 88,290 17,717 20.1 20,532 23.3 40,433 5,908 14.6 7,262 18.01984…...… 92,194 17,340 18.8 19,932 21.6 42,172 5,829 13.8 7,100 16.81985……. 94,521 16,996 18.0 19,358 20.5 43,506 5,732 13.2 6,910 15.91986 3…… 96,903 16,975 17.5 19,278 19.9 44,961 5,802 12.9 6,961 15.51987…...… 99,303 16,913 17.0 19,051 19.2 46,365 5,842 12.6 6,907 14.91988……. 101,407 17,002 16.8 19,241 19.0 47,495 5,982 12.6 7,109 15.01989…...… 103,480 16,960 16.4 19,198 18.6 48,691 6,141 12.6 7,243 14.9
1990 3…… 104,876 16,776 16.0 19,105 18.2 49,323 6,179 12.5 7,330 14.91991...…… 103,723 16,612 16.0 18,790 18.1 49,105 6,142 12.5 7,247 14.81992……. 104,668 16,418 15.7 18,578 17.7 49,842 6,274 12.6 7,411 14.91993……. 106,101 16,627 15.7 18,682 17.6 50,626 6,516 12.9 7,610 15.01994 3…… 107,989 16,748 15.5 18,850 17.5 51,419 6,642 12.9 7,740 15.11995……. 110,038 16,360 14.9 18,346 16.7 52,369 6,430 12.3 7,479 14.31996…...… 111,960 16,269 14.5 18,158 16.2 53,488 6,410 12.0 7,397 13.81997 3…… 114,533 16,110 14.1 17,923 15.6 54,708 6,347 11.6 7,304 13.41998 3…… 116,730 16,211 13.9 17,918 15.4 55,757 6,362 11.4 7,280 13.11999 3…… 118,963 16,477 13.9 18,182 15.3 57,050 6,528 11.4 7,425 13.0
2000 3…… 122,089 16,334 13.4 18,153 14.9 58,427 6,671 11.4 7,662 13.12001……. 122,229 16,305 13.3 18,026 14.7 58,582 6,768 11.6 7,672 13.12002……… 121,826 16,145 13.3 17,695 14.5 58,555 6,820 11.6 7,629 13.02003 3…… 122,358 15,776 12.9 17,448 14.3 59,122 6,732 11.4 7,601 12.92004……… 123,554 15,472 12.5 17,087 13.8 59,408 6,593 11.1 7,450 12.52005…… 125,889 15,685 12.5 17,223 13.7 60,423 6,815 11.3 7,626 12.62006……… 128,237 15,359 12.0 16,860 13.1 61,426 6,702 10.9 7,501 12.22007……… 129,767 15,670 12.1 17,243 13.3 62,299 6,903 11.1 7,749 12.4
See footnotes at end of table.
Year Total employed
Total employed
94

Table 38. Union affiliation of employed wage and salary workers by sex, annual averages, 1983-2007—Continued(Numbers in thousands)
Men
Members of unions 1 Represented by unions 2
Total Percent of employed Total Percent of
employed
1983……… 47,856 11,809 24.7 13,270 27.71984…...… 50,022 11,511 23.0 12,832 25.71985……. 51,015 11,264 22.1 12,448 24.41986 3…… 51,942 11,173 21.5 12,317 23.71987…...… 52,938 11,071 20.9 12,144 22.91988……. 53,912 11,019 20.4 12,132 22.51989…...… 54,789 10,820 19.7 11,955 21.8
1990 3…… 55,553 10,597 19.1 11,775 21.21991...…… 54,618 10,470 19.2 11,542 21.11992……. 54,826 10,144 18.5 11,167 20.41993……. 55,475 10,112 18.2 11,072 20.01994 3…… 56,570 10,106 17.9 11,110 19.61995……. 57,669 9,929 17.2 10,868 18.81996…...… 58,473 9,859 16.9 10,761 18.41997 3…… 59,825 9,763 16.3 10,619 17.71998 3…… 60,973 9,850 16.2 10,638 17.41999 3…… 61,914 9,949 16.1 10,758 17.4
2000 3…… 63,662 9,664 15.2 10,491 16.52001……. 63,647 9,538 15.0 10,354 16.32002……… 63,272 9,325 14.7 10,066 15.92003 3…… 63,236 9,044 14.3 9,848 15.62004……… 64,145 8,878 13.8 9,638 15.02005…… 65,466 8,870 13.5 9,597 14.72006……… 66,811 8,657 13.0 9,360 14.02007……… 67,468 8,767 13.0 9,494 14.1
Year Total employed
1 Data refer to members of a labor union or an employeeassociation similar to a union.
2 Data refer to members of a labor union or an employeeassociation similar to a union, as well as workers who are notmembers but whose jobs are covered by a union or employeeassociation contract.
3 Not strictly comparable with data for prior years. For anexplanation, see the Historical Comparability documentationprovided at http://www.bls.gov/cps/eetech_methods.pdf .
NOTE: Data refer to the sole or principal job of full- and part-time workers. All self-employed workers are excluded, regardlessof whether or not their businesses are incorporated.
SOURCE: Current Population Survey, U.S. Department of Labor,U.S. Bureau of Labor Statistics.
95

96
Technical Note
The estimates in this report were obtained from the Current Population Survey (CPS), a national monthly sample survey of approximately 60,000 households, which provides a wide range of information on the labor force, employment, and unemployment. Earnings and union affiliation data are collected from one-fourth of the CPS monthly sample. The survey is conducted for the Bureau of Labor Statistics by the U.S. Census Bureau, using a scientifically-selected national sample with cov-erage in all 50 States and the District of Columbia. Material in this report is in the public domain and, with appropriate credit, may be reproduced without permission. This information is available to sensory-impaired individuals on request. Voice phone: (202) 691-5200; TDD message referral phone number: 1-800-877-8339. Reliability of the Estimates Statistics based on the CPS are subject to both sampling and nonsampling error. When a sample, rather than an entire population, is surveyed, there is a chance that the sample estimates may differ from the “true” population values they represent. The exact difference, or sampling error, varies depending on the particular sample selected, and this variability is measured by the standard error of the estimate. There is about a 90-percent chance, or level of confidence, that an estimate based on a sample will differ by no more than 1.6 standard errors from the “true” population value because of sampling error. BLS analyses are generally conducted at the 90-percent level of confidence. All other types of error are referred to as nonsampling error. Nonsampling error can occur for many reasons, including the failure to sample a segment of the population, inability to obtain information for all respondents in the sample, inability or unwillingness of respondents to provide correct information, and errors made in the collection or processing of data. CPS data also are affected by nonsampling error. The full extent of nonsampling error is unknown, but special studies
have been conducted to quantify some sources of such error in the CPS. For further discussion of the reliability of data from the CPS and information on estimating standard errors, see the Household Data technical documentation provided at http://www. bls.gov/cps/eetech_methods.pdf. Concepts and Definitions Concepts used in this report are defined below. Civilian noninstitutional population. Included are persons 16 years of age and older residing in the 50 States and the District of Columbia who are not confined to institutions (for example, correctional facilities and residential nursing and mental health care facilities), and who are not on active duty in the Armed Forces. Civilian labor force. This group comprises all persons classified as employed or unemployed. Employed persons. Employed persons are those who, during the survey week, (a) did any work at all as paid civilians; (b) worked in their own business or profession or on their own farm; (c) worked 15 hours or more as unpaid workers in a family business; or (d) were temporarily absent from their jobs because of illness, vacation, bad weather, or another reason. Unemployed persons. Unemployed persons are those who had no employment during the survey week, were available for work at that time, and made specific efforts to find employment sometime in the prior 4 weeks. Persons laid off from their former jobs and awaiting recall did not need to be looking for work to be classified as unemployed. Civilian labor force participation rate. This rate is the civilian labor force as a percent of the civilian noninstitutional population. Employment-population ratio. This ratio rep-resents the proportion of the population that is employed.

97
Unemployment rate. This rate represents the number of unemployed persons as a percent of the civilian labor force. Race. White, black or African American, and Asian are terms used to describe the race of persons. Persons in these categories are those who selected that race group only. Data for the remaining race categories—American Indian or Alaska Native, Native Hawaiian or Other Pacific Islanders, and persons who selected more than one race category—are included in totals but are not shown separately because the number of survey respondents was too small to develop estimates of sufficient quality for publication. In the survey process, race is determined by the household respondent. Hispanic or Latino ethnicity. This term refers to persons who identified themselves in the survey as being Spanish, Hispanic, or Latino. Persons whose ethnicity is identified as Hispanic or Latino may be of any race. Family. A family is a group of two or more persons residing together who are related by birth, marriage, or adoption. Families are classified either as married-couple families or as families maintained by women or men without spouses. Self-employed workers. Self-employed workers are those who work for profit or fees in their own business, profession, trade, or farm. Unincor-porated self employed are included in the self-employed category. Self-employed persons whose businesses are incorporated are included in wage and salary employment. Wage and salary workers. These are workers who receive wages, salaries, commissions, tips, payment in kind, or piece rates. The group includes employees in both the private and public sectors but, for purposes of the earnings series, excludes all self-employed persons, regardless of whether their businesses are incorporated. Hourly paid workers. Workers who are paid an hourly wage are a subset of wage and salary workers, representing approximately three-fifths of all wage and salary workers. Workers paid by the hour are, therefore, included in the estimates of median usual weekly earnings in this report, along with salaried workers and other workers not paid by
the hour. Data for workers paid at hourly rates are presented separately in Table 26. Usual weekly earnings. Data are collected on wages and salaries before taxes and other deductions and include any overtime pay, commissions, or tips usually received (at the principal job in the case of multiple jobholders). Earnings of self-employed workers are excluded, regardless of whether their businesses are incorporated. Prior to 1994, respondents were asked to report earnings per week. Since January 1994, respondents have been asked to identify the easiest way for them to report earnings (hourly, weekly, biweekly, twice monthly, monthly, annually, other) and how much they usually earn in the reported period. Earnings reported on a basis other than weekly are converted to a weekly equivalent. The term “usual” is as perceived by the respondent. If the respondent asks for a definition of usual, interviewers are instructed to define the term as “more than half the weeks worked during the past 4 or 5 months.” Medians of usual weekly earnings. The median is the amount that divides a given earnings distribution into two equal groups, one having earnings above the median, and the other having earnings below the median. The BLS estimating procedure for determining the median of an earnings distribution places each reported or calculated weekly earnings value into a $50-wide interval that is centered on a multiple of $50. The value of the median is estimated through a linear interpolation of the interval in which the median lies. Over-the-year changes in the medians for specific groups may not necessarily be consistent with the movements estimated for the overall group boundary. The most common reasons for this possible anomaly follow: (1) There could be a change in the relative weights of the subgroups. For example, the medians of both 16- to 24-year- olds and those 25 years and over may rise, but if the lower earning 16-to-24 age group accounts for a greatly increased share of the total, the overall median could actually fall. (2) There could be a large change in the shape of the distribution of reported earnings. This could be caused by survey observations that are clustered at rounded values, for example, $250, $300, or $400. An estimate lying in a $50-wide centered interval containing such a cluster, or “spike,” tends to change more slowly than one in other intervals. Medians, for

98
example, measure the central tendency of a multipeaked distribution that shifts over time. As the distribution shifts, the median does not necessarily move at the same rate. Specifically, the median takes relatively more time to move through a frequently reported interval but, once above the upper limit of such an interval, it can move relatively quickly to the next frequently reported earnings interval. BLS procedures for estimating medians mitigate such irregular movements of the measures; however, users should be cautious of these effects when evaluating short-term changes in the medians, as well as in ratios of the medians. Hours at work. These are the actual hours worked (at all jobs) during the reference week. For example, persons who normally work 40 hours a week but were off during the Columbus Day holiday would be reported as working 32 hours, even though they were paid for the holiday. Usual hours, or usual full- or part-time status. Data on persons “at work” exclude persons who were temporarily absent from a job and therefore classified in the zero-hours worked category, “with a job but not at work.” These are persons who were absent from their jobs for the entire week for reasons such as bad weather, vacation, illness, or involvement in a labor dispute. To differentiate a person’s normal schedule from his or her activity during the reference week, persons also are classified according to their usual full- or part-time status. In this context, full-time workers are those who usually worked 35 hours or more (at all jobs combined). This group includes some individuals who worked less than 35 hours in the reference week for either economic or noneconomic reasons and those who were temporarily absent from work. Similarly, part-time workers are those who usually work less than 35 hours per week (at all jobs), regardless of the number of hours worked in the reference week. This may include some individuals who actually worked more than 34 hours in the reference week, as well as those who were temporarily absent from work. Occupation and industry. This information applies
to the job held during the reference week. Persons with two or more jobs are classified in the occupation and industry at which they worked the greatest number of hours. The occupational and industry classification of CPS data is based on the 2002 Census Bureau occupational and industrial classification systems, which are derived from the 2000 Standard Occupation Classification (SOC) and the 2002 North American Industry Classification (NAICS). Additional information about these classifications is available online at http://www.bls.gov/cps/cpsoccind.htm. Work experience. These data reflect work activity during the calendar year and are obtained from the Annual Social and Economic Supplement (ASEC) to the Current Population Survey. Estimates of persons who worked were based on “yes” responses to the following questions in the ASEC: “Did you work at a job or business at any time during [the survey reference year]?” or “Did you do any temporary, part-time, or seasonal work even for a few days during [the survey reference year]?” Since the reference period is a full year, the number of persons with some employment or unemployment greatly exceeds the average levels for any given month, which are based on a 1-week reference period, and the corresponding annual averages of monthly estimates. Poverty classification. Poverty statistics presented in this report are based on definitions developed by the Social Security Administration in 1964 and revised by the Federal interagency committees in 1969 and 1981. These definitions originally were based on the Department of Agriculture’s Economy Food Plan and reflected the different consumption requirements of families, based on factors such as family size and the number of children under 18 years of age. The actual poverty thresholds vary in accordance with the makeup of the family. Poverty thresholds are updated each year to reflect changes in the Consumer Price Index for All Urban Consumers (CPI-U). The thresholds do not vary geographically. For more information on poverty data and thresholds, see http://www.census.gov /hhes/www/poverty/poverty.html.