Embed Size (px)
Citation preview
Boom, Bust, and Frac: Coping With the Downturn
aka “Fracking to Survive in 2016”
C. Mark PearsonLiberty Resources LLC
“Hydraulic Fracturing to Survive in 2016”
Fracking to Survive in 2016 • C. Mark Pearson
One-Column Format
Slide 2
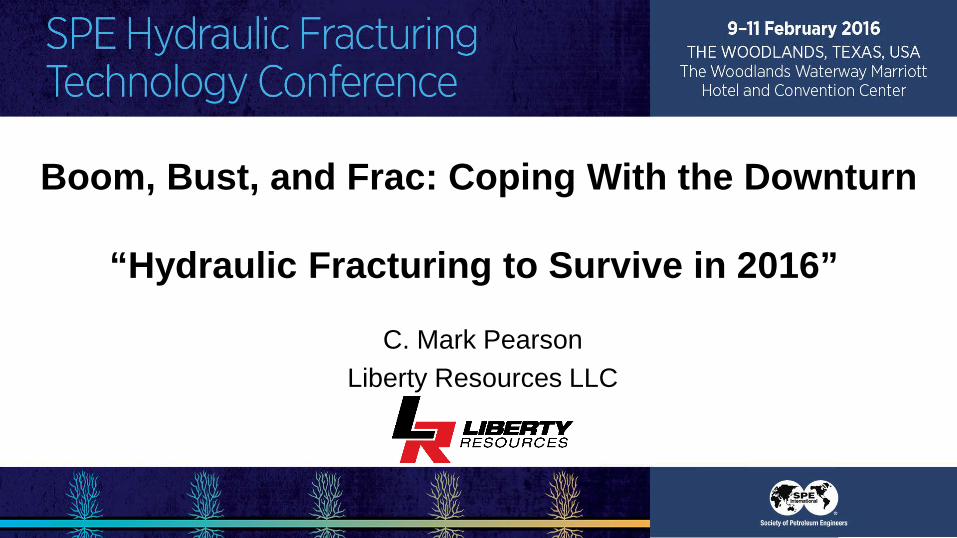
Breakeven Prices for Domestic E&P Companies
Wells Fargo Securities; 2016 E&P Breakevens; January 7, 2016
Fracking to Survive in 2016 • C. Mark Pearson
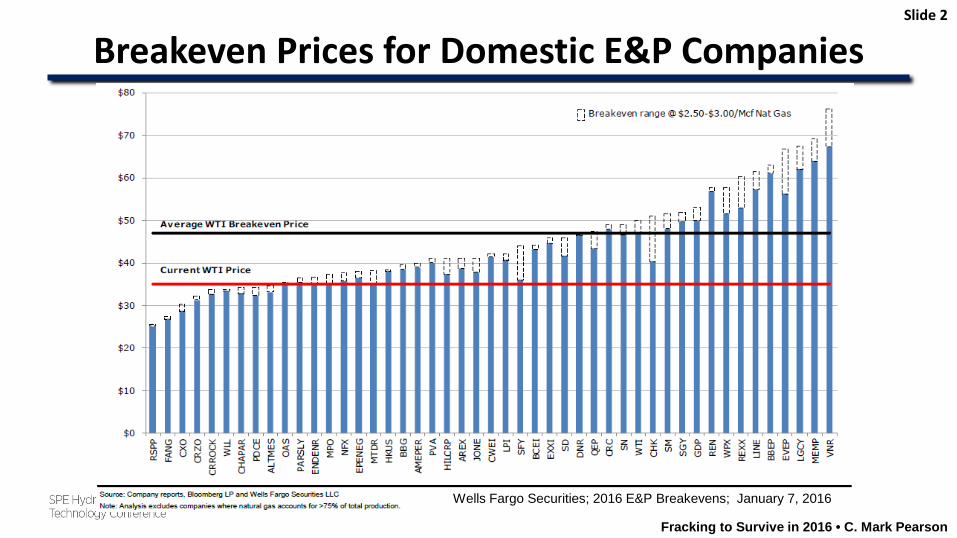
- To HBP acreage- Support Cash Flow - Maintain Borrowing Base
- “The Boss Told Me To”
Slide 3
Why are we still Fracking?
Should we be designing the Horizontal Well Completion to maximize initial rates/cash flow, maximizing reserve
recovery, or minimizing completion spend?
Fracking to Survive in 2016 • C. Mark Pearson
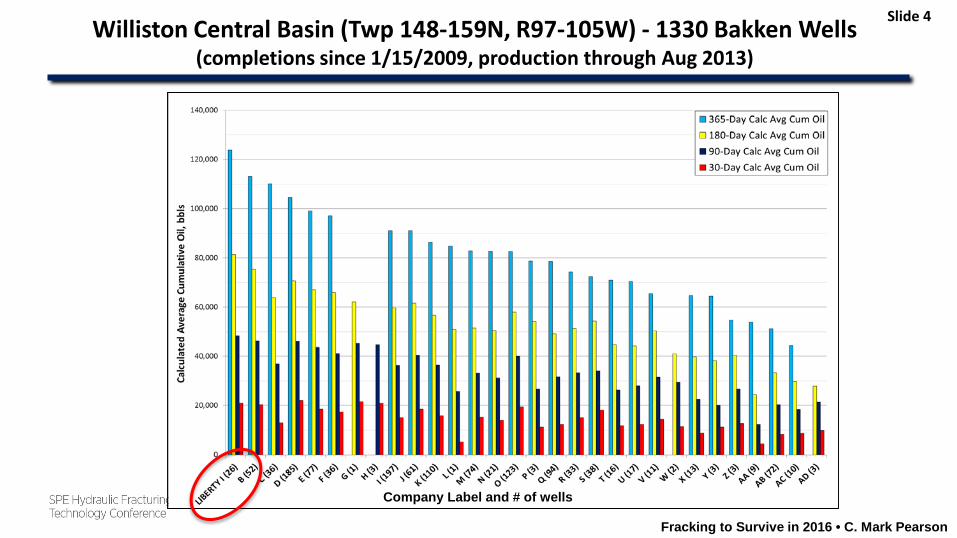
Slide 4Williston Central Basin (Twp 148-159N, R97-105W) - 1330 Bakken Wells(completions since 1/15/2009, production through Aug 2013)
Company Label and # of wells
Fracking to Survive in 2016 • C. Mark Pearson
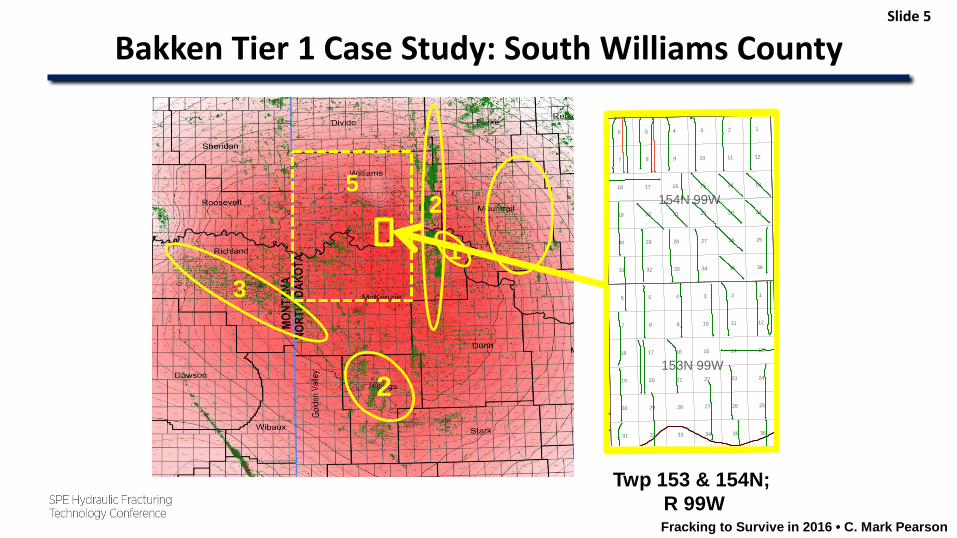
Bakken Tier 1 Case Study: South Williams CountySlide 5
4
5Twp 153 & 154N;
R 99W
13
25
2
154N 99W
153N 99W
2 16 5 4 3
8 9 11 12107
18 17 16 15 1314
22 23 2419 20 21
30 27 2629 28 25
35 363431 32 33
3 2 15 46
11 12108 97
14 1316 1518 17
2419 20 21 22 23
2530 28 27 2629
32 3331 34 35 36
Fracking to Survive in 2016 • C. Mark Pearson
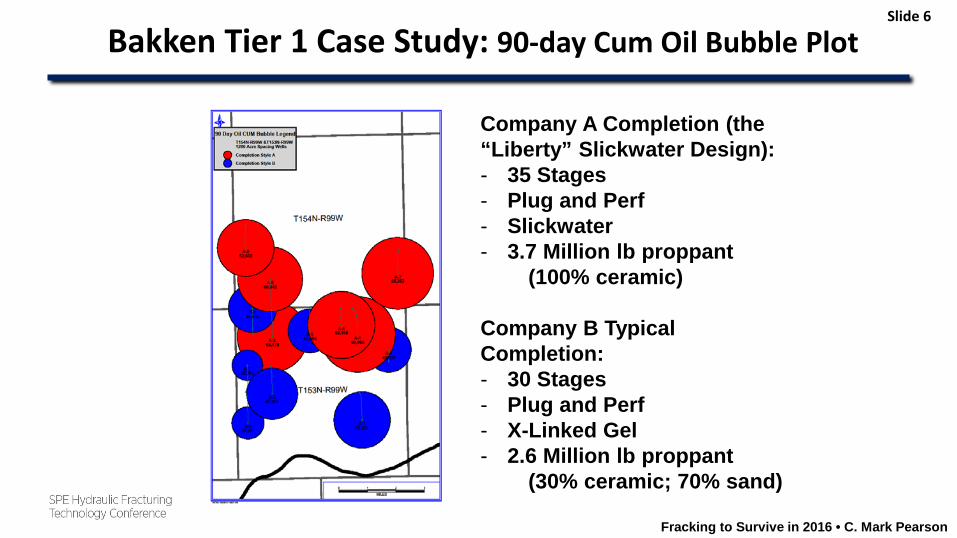
Bakken Tier 1 Case Study: 90-day Cum Oil Bubble PlotSlide 6
Company A Completion (the “Liberty” Slickwater Design):- 35 Stages- Plug and Perf- Slickwater- 3.7 Million lb proppant
(100% ceramic)
Company B Typical Completion:- 30 Stages- Plug and Perf- X-Linked Gel- 2.6 Million lb proppant
(30% ceramic; 70% sand)
Fracking to Survive in 2016 • C. Mark Pearson
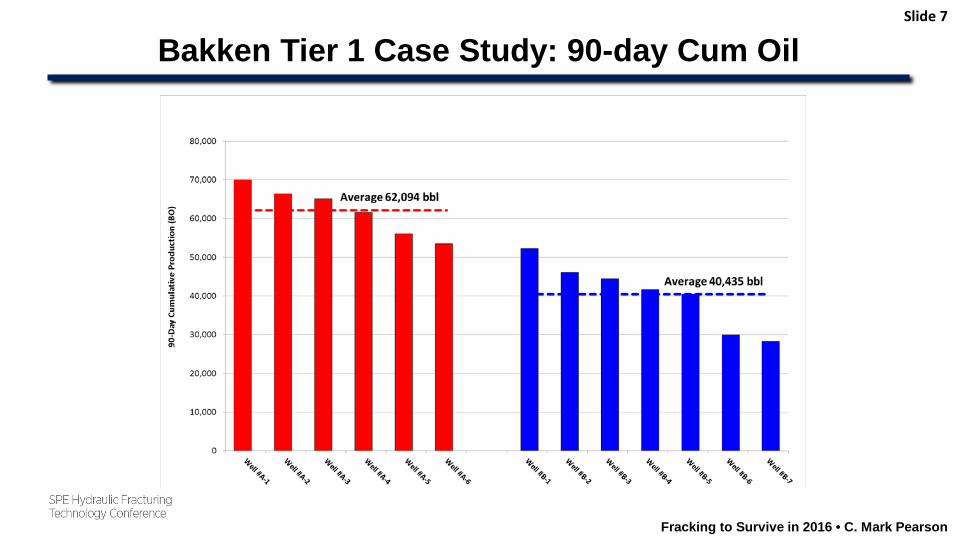
Bakken Tier 1 Case Study: 90-day Cum OilSlide 7
Fracking to Survive in 2016 • C. Mark Pearson
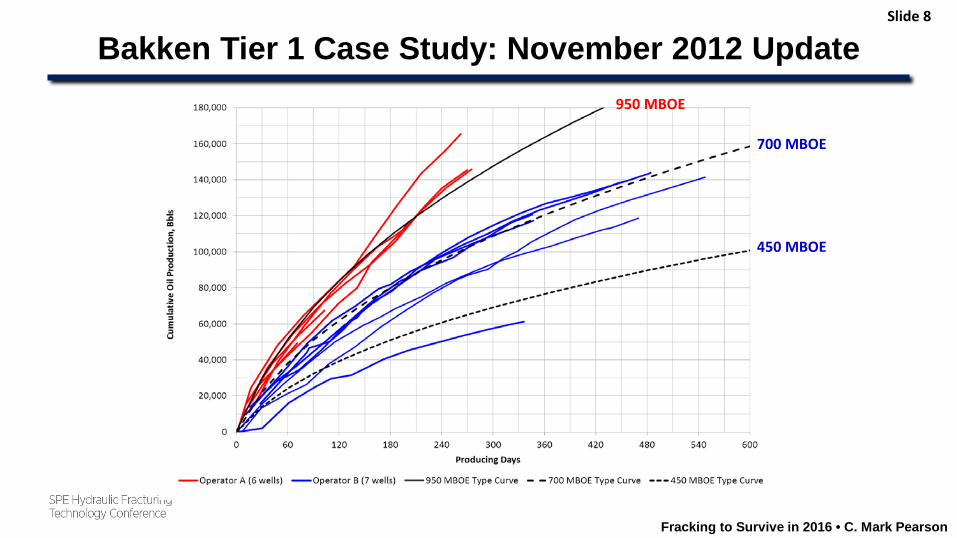
Bakken Tier 1 Case Study: November 2012 UpdateSlide 8
450 MBOE
700 MBOE
950 MBOE
Fracking to Survive in 2016 • C. Mark Pearson
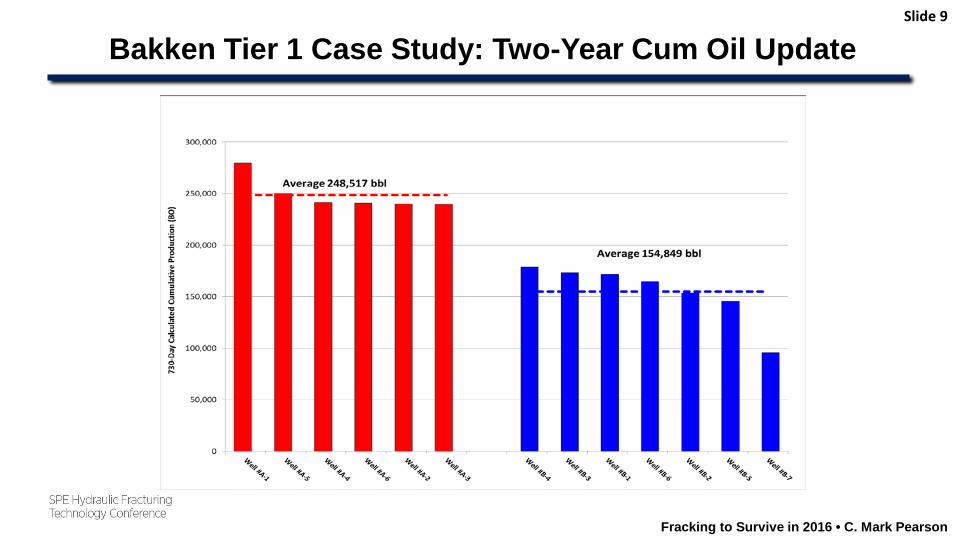
Bakken Tier 1 Case Study: Two-Year Cum Oil UpdateSlide 9
Fracking to Survive in 2016 • C. Mark Pearson
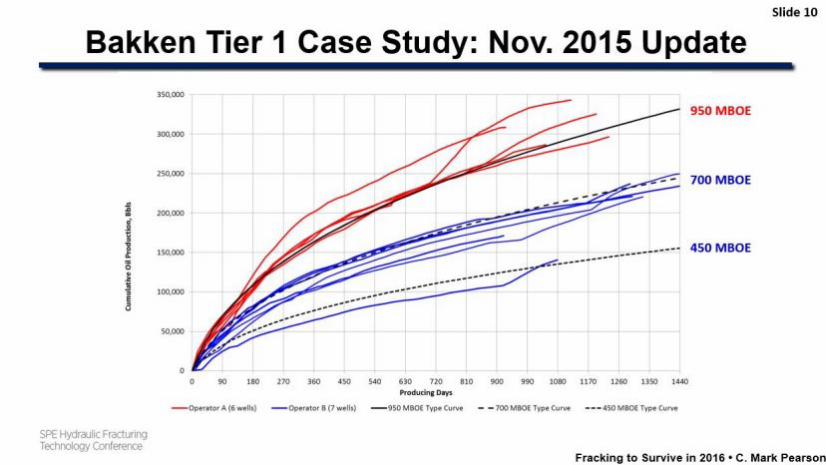
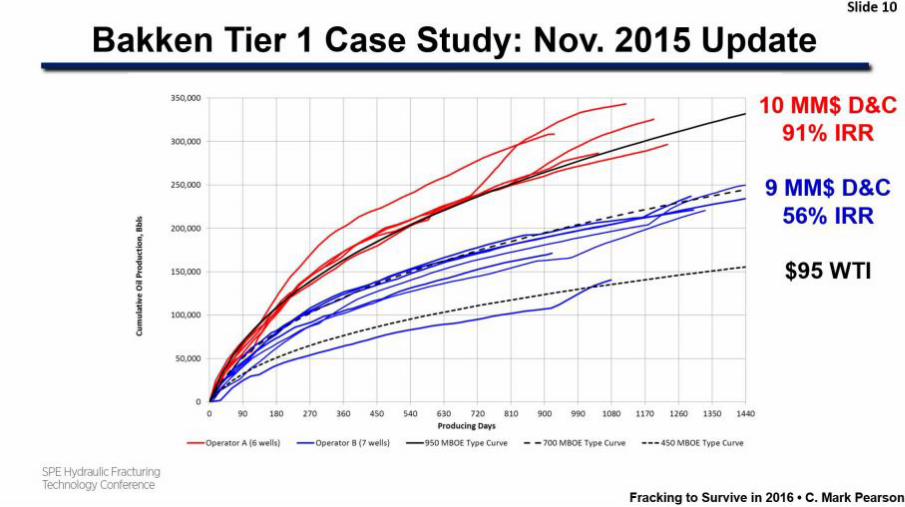
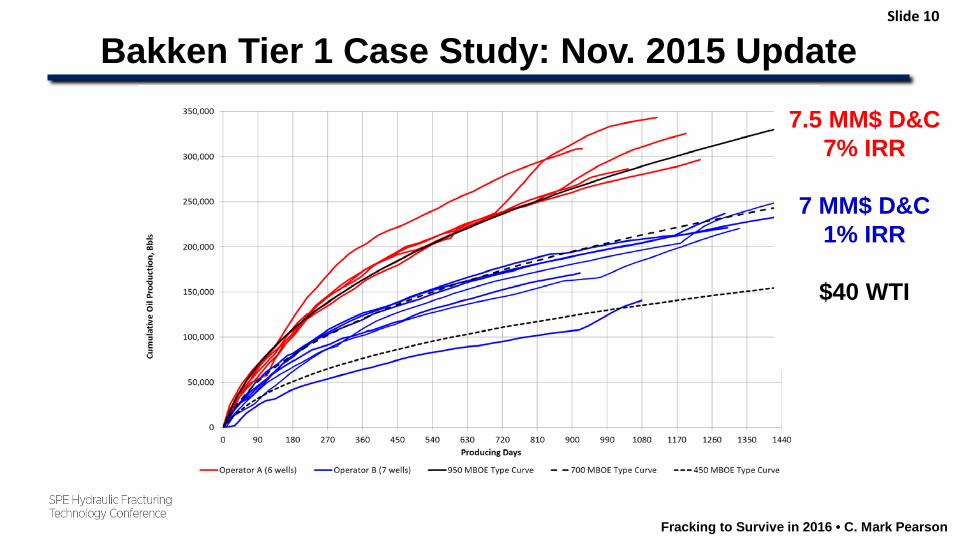
Bakken Tier 1 Case Study: Nov. 2015 UpdateSlide 10
450 MBOE
700 MBOE
950 MBOE10 MM$ D&C91% IRR
9 MM$ D&C56% IRR
$95 WTI
7.5 MM$ D&C7% IRR
7 MM$ D&C1% IRR
$40 WTI
Fracking to Survive in 2016 • C. Mark Pearson
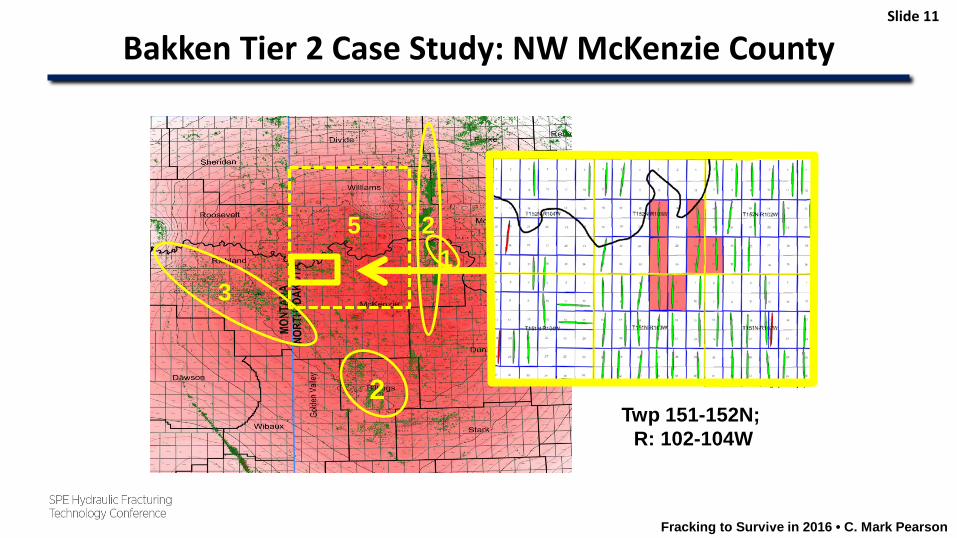
Bakken Tier 2 Case Study: NW McKenzie CountySlide 11
4
11
Twp 151-152N; R: 102-104W
13
25
2
Fracking to Survive in 2016 • C. Mark Pearson
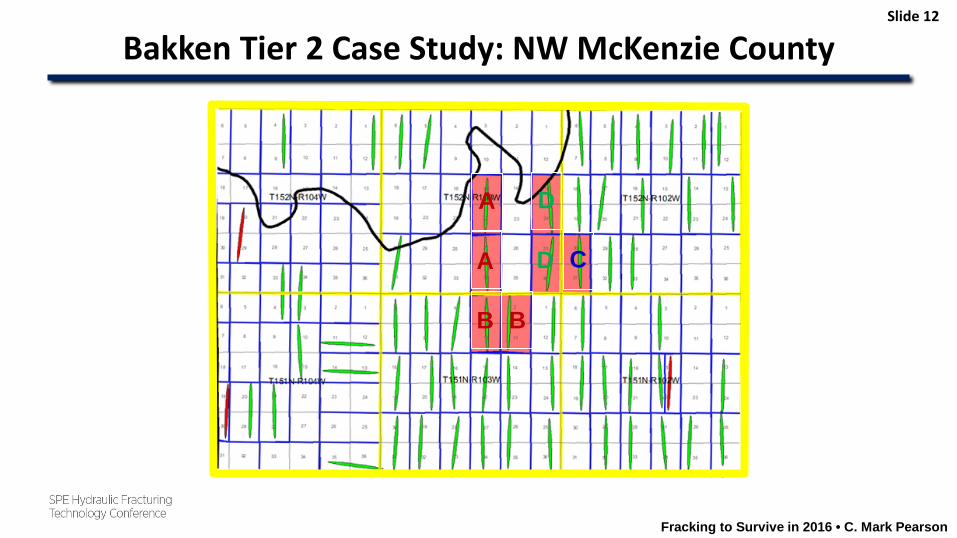
Bakken Tier 2 Case Study: NW McKenzie CountySlide 12
A
A
B B
CD
D
Fracking to Survive in 2016 • C. Mark Pearson
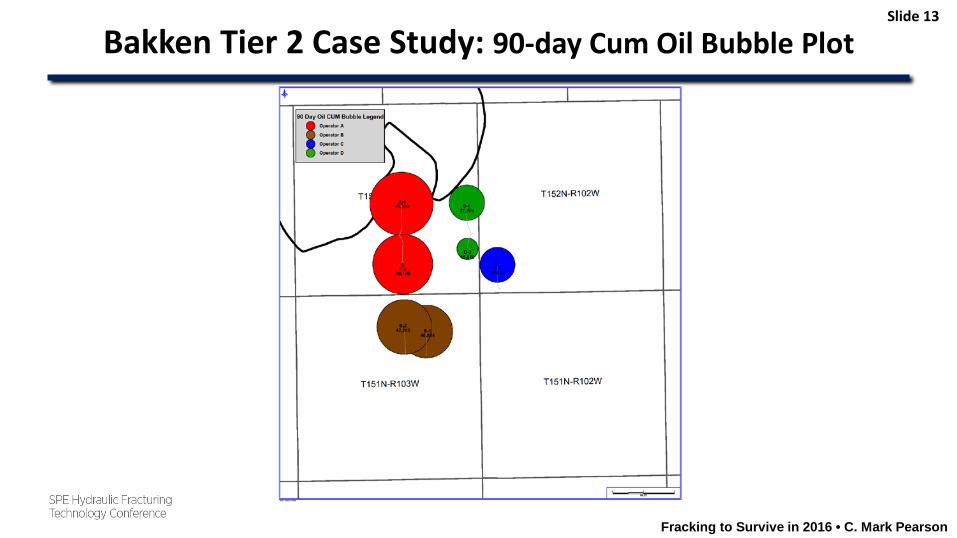
Bakken Tier 2 Case Study: 90-day Cum Oil Bubble PlotSlide 13
Fracking to Survive in 2016 • C. Mark Pearson
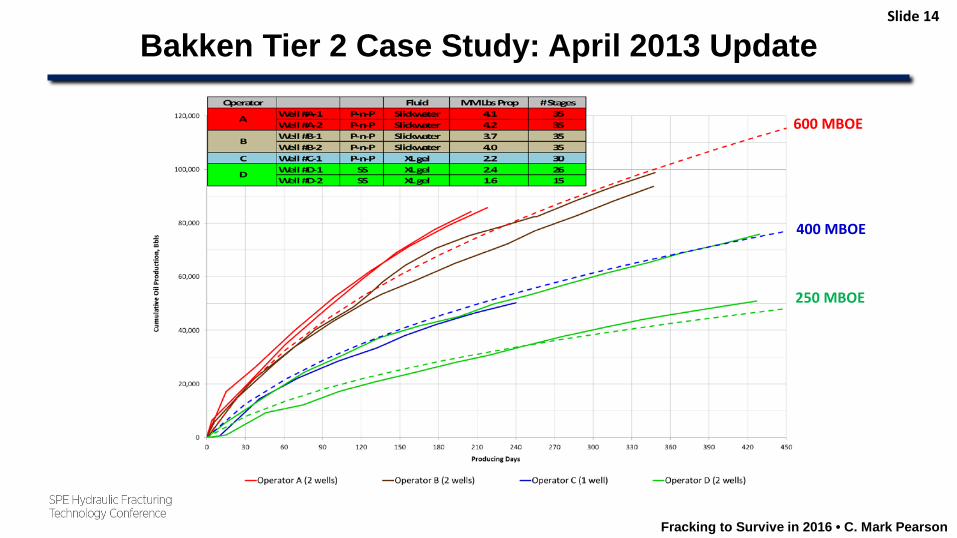
Slide 14
Bakken Tier 2 Case Study: April 2013 Update
600 MBOE
400 MBOE
250 MBOE
Fracking to Survive in 2016 • C. Mark Pearson
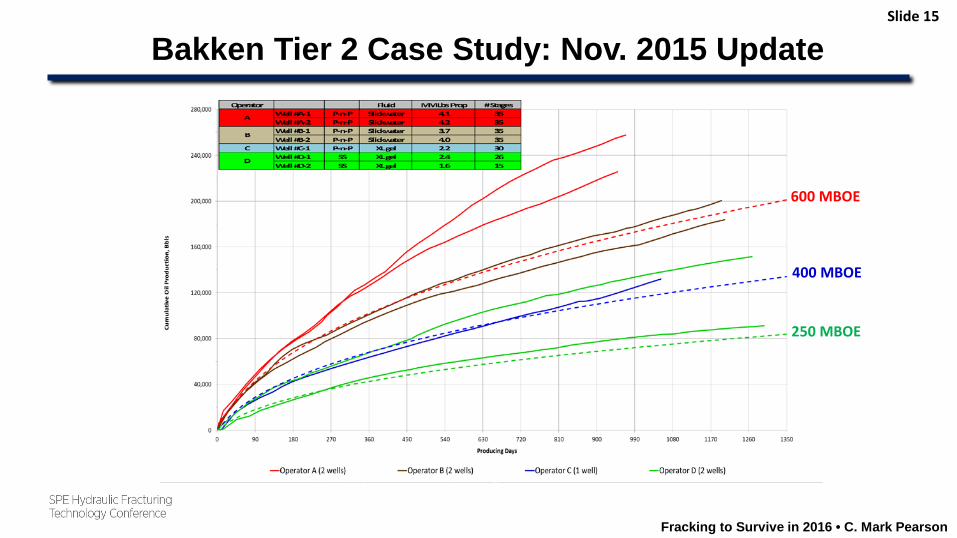
Slide 15
Bakken Tier 2 Case Study: Nov. 2015 Update
600 MBOE
400 MBOE
250 MBOE
Fracking to Survive in 2016 • C. Mark Pearson
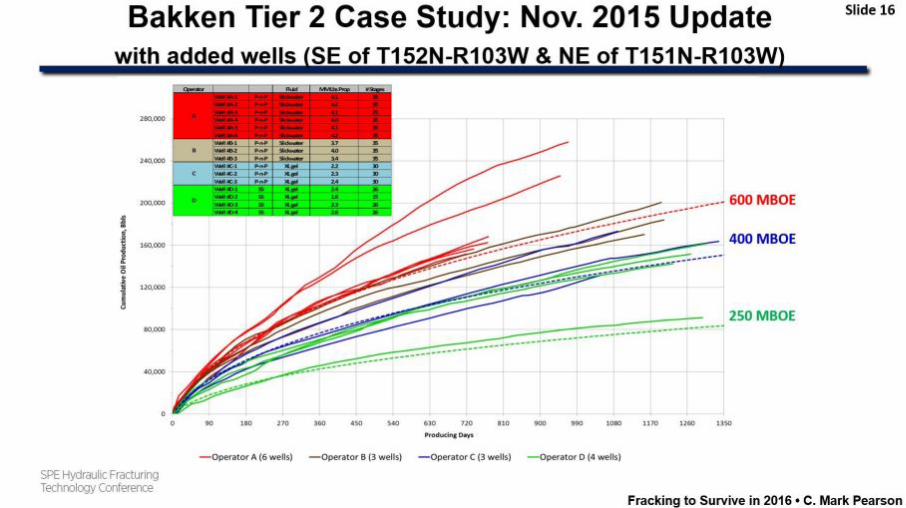
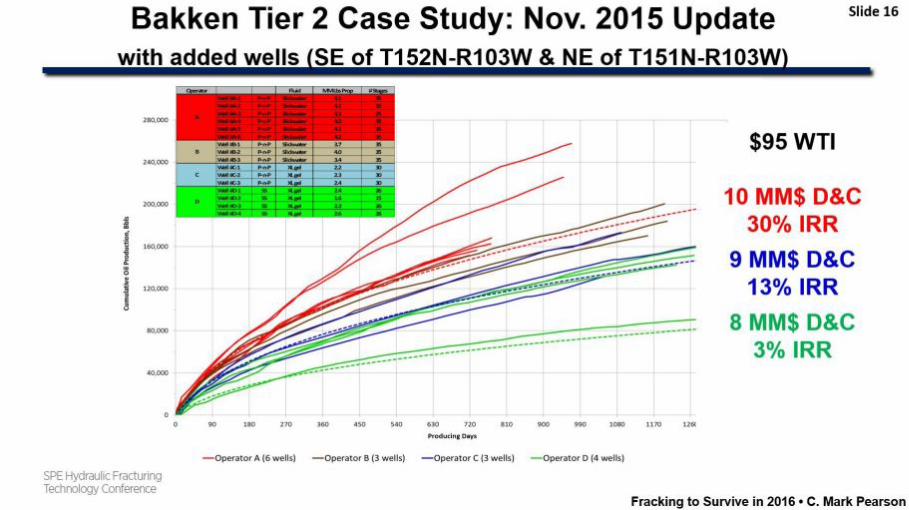
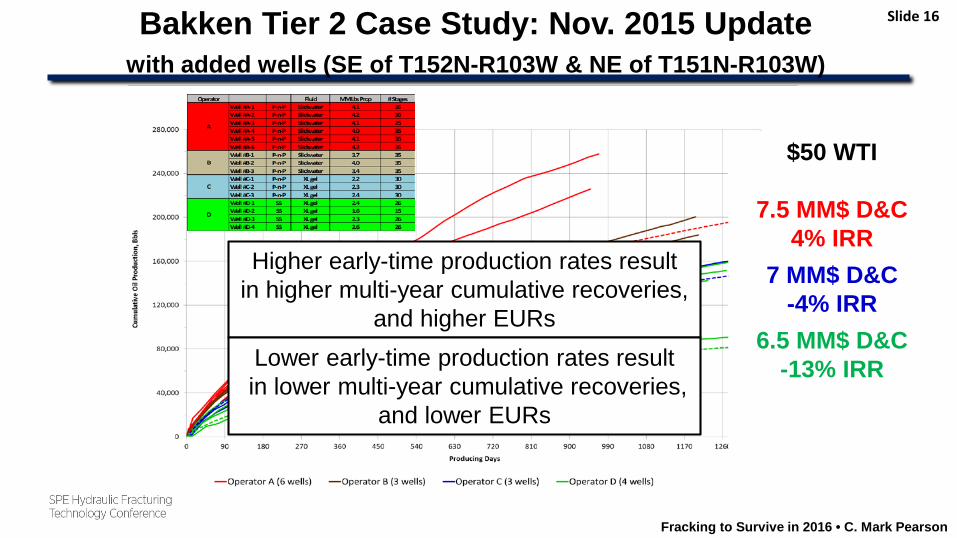
Slide 16Bakken Tier 2 Case Study: Nov. 2015 Updatewith added wells (SE of T152N-R103W & NE of T151N-R103W)
600 MBOE
400 MBOE
250 MBOE
$95 WTI
10 MM$ D&C30% IRR
9 MM$ D&C13% IRR
8 MM$ D&C3% IRR
$50 WTI
7.5 MM$ D&C4% IRR
7 MM$ D&C-4% IRR
6.5 MM$ D&C-13% IRR
Higher early-time production rates resultin higher multi-year cumulative recoveries,
and higher EURsLower early-time production rates resultin lower multi-year cumulative recoveries,
and lower EURs
Fracking to Survive in 2016 • C. Mark Pearson
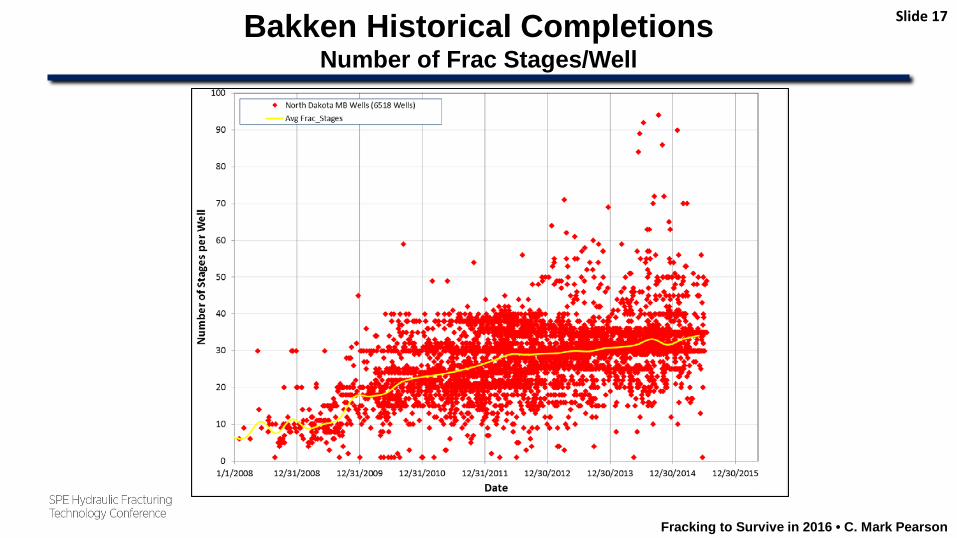
Bakken Historical CompletionsNumber of Frac Stages/Well
Slide 17
Fracking to Survive in 2016 • C. Mark Pearson
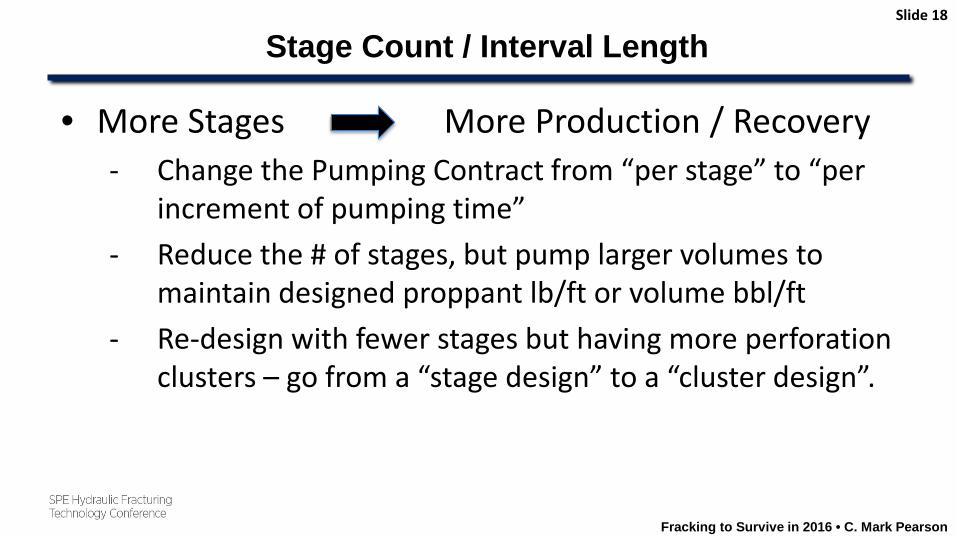
Stage Count / Interval Length Slide 18
• More Stages More Production / Recovery- Change the Pumping Contract from “per stage” to “per
increment of pumping time”- Reduce the # of stages, but pump larger volumes to
maintain designed proppant lb/ft or volume bbl/ft- Re-design with fewer stages but having more perforation
clusters – go from a “stage design” to a “cluster design”.
Fracking to Survive in 2016 • C. Mark Pearson
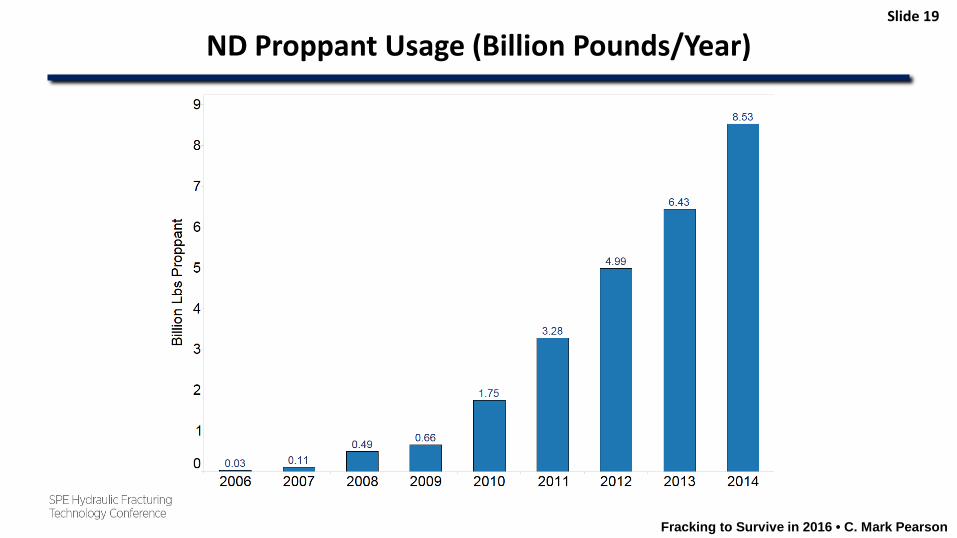
ND Proppant Usage (Billion Pounds/Year)Slide 19
Fracking to Survive in 2016 • C. Mark Pearson
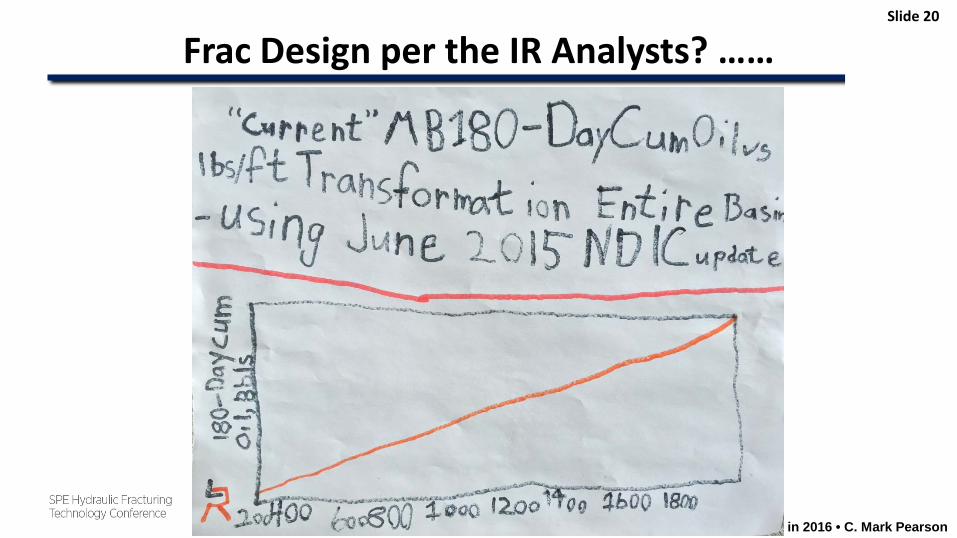
Frac Design per the IR Analysts? ……Slide 20
Fracking to Survive in 2016 • C. Mark Pearson
William “FracPup” PearsonSlide 21
Fracking to Survive in 2016 • C. Mark Pearson
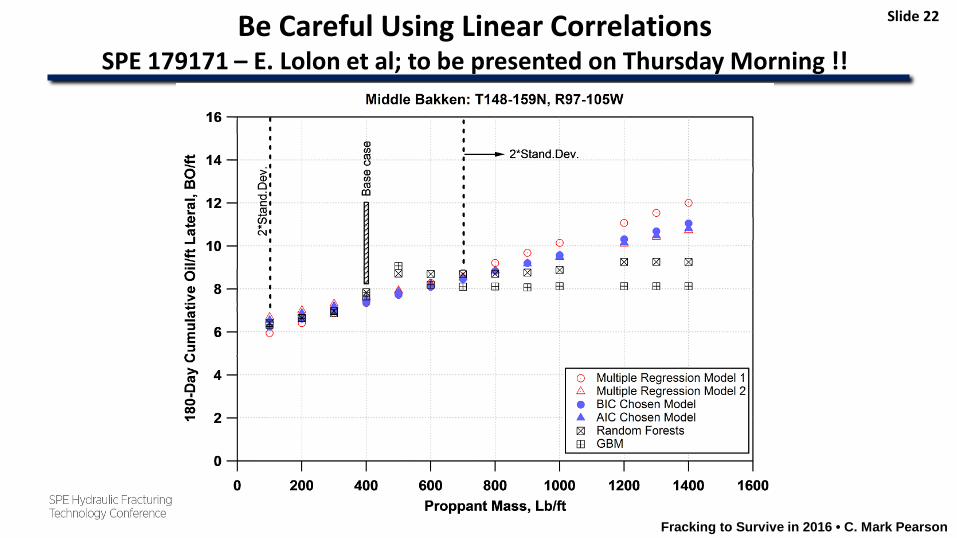
Be Careful Using Linear CorrelationsSPE 179171 – E. Lolon et al; to be presented on Thursday Morning !!
Slide 22
Fracking to Survive in 2016 • C. Mark Pearson
Summary
• The Horizontal Well Completion is Critical to Long-Term Recovery• The fracs you design today will define the well’s recovery over the next
30 – 40 years • Beware of making cuts in the completion spend thinking it is just
affecting initial production rates and early-time cumulative production• Use the slowdown in industry activity to do a better job engineering
the completion and not just using a geometric design.• Work on “GeoEngineering” your completion
Slide 23
Fracking to Survive in 2016 • C. Mark Pearson
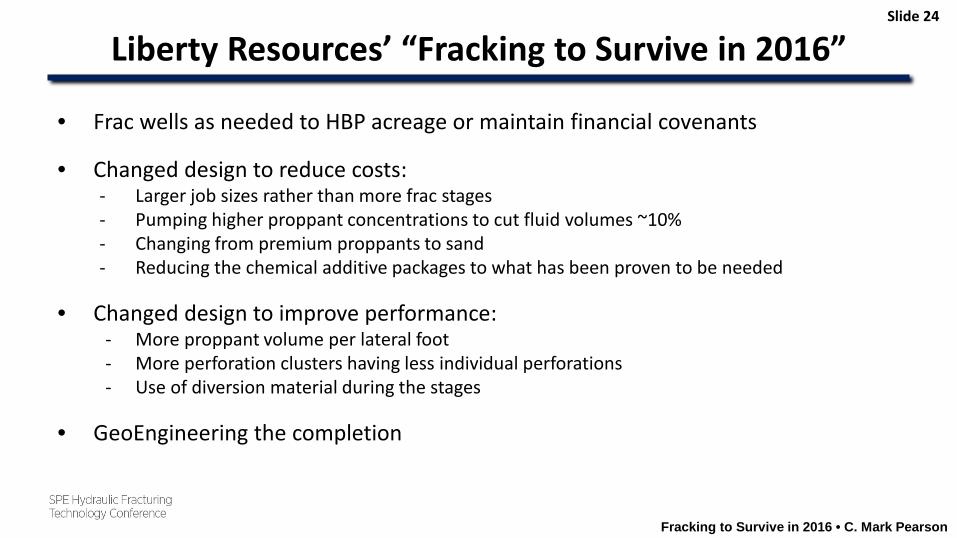
Liberty Resources’ “Fracking to Survive in 2016”
• Frac wells as needed to HBP acreage or maintain financial covenants
• Changed design to reduce costs:- Larger job sizes rather than more frac stages- Pumping higher proppant concentrations to cut fluid volumes ~10%- Changing from premium proppants to sand- Reducing the chemical additive packages to what has been proven to be needed
• Changed design to improve performance:- More proppant volume per lateral foot- More perforation clusters having less individual perforations- Use of diversion material during the stages
• GeoEngineering the completion
Slide 24
Acknowledgements
Co-workers at Liberty Resources and Liberty Oilfield Services
Slide 25
THANK YOU