Embed Size (px)
Citation preview
F I S C A L Y E A R 2 0 0 5
O F T H E U . S .B U D G E T G O V E R N M E N T
MIDSESSION REVIEW
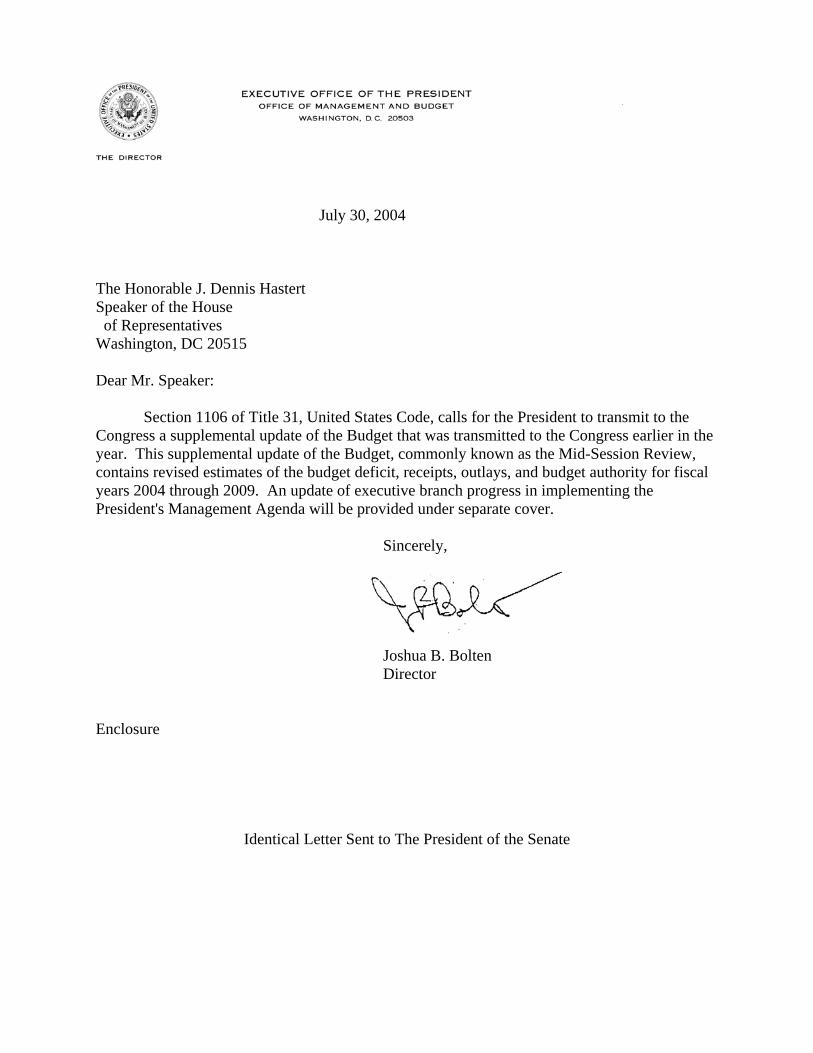
July 30, 2004
The Honorable J. Dennis Hastert Speaker of the House of Representatives
Washington, DC 20515
Dear Mr. Speaker:
Section 1106 of Title 31, United States Code, calls for the President to transmit to the Congress a supplemental update of the Budget that was transmitted to the Congress earlier in the year. This supplemental update of the Budget, commonly known as the Mid-Session Review, contains revised estimates of the budget deficit, receipts, outlays, and budget authority for fiscal years 2004 through 2009. An update of executive branch progress in implementing the President's Management Agenda will be provided under separate cover.
Sincerely,
Joshua B. Bolten Director
Enclosure
Identical Letter Sent to The President of the Senate
TABLE OF CONTENTS Page
Transmittal Letter
List of Tables ...................................................................................................................... iii
Summary ............................................................................................................................ 1
Economic Assumptions ...................................................................................................... 11
Receipts ............................................................................................................................... 19
Spending ............................................................................................................................. 21
Summary Tables ................................................................................................................ 27
GENERAL NOTES
1. All years referred to are fiscal years unless otherwise noted.
2. All totals in the text and tables display both on-budget and off-budget spending and receipts unless otherwise noted.
3. Details in the tables and text may not add to totals due to rounding.
4. Web address: http://www.whitehouse.gov/omb/budget
i
LIST OF TABLES Page
Table 1. Changes from the February Budget ............................................................. 3
Table 2. Economic Assumptions .................................................................................. 12
Table 3. Comparison of Economic Assumptions ......................................................... 13
Table 4. Change in Receipts ........................................................................................ 20
Table 5. Change in Outlays ......................................................................................... 23
Table 6. Budget Totals ................................................................................................. 27
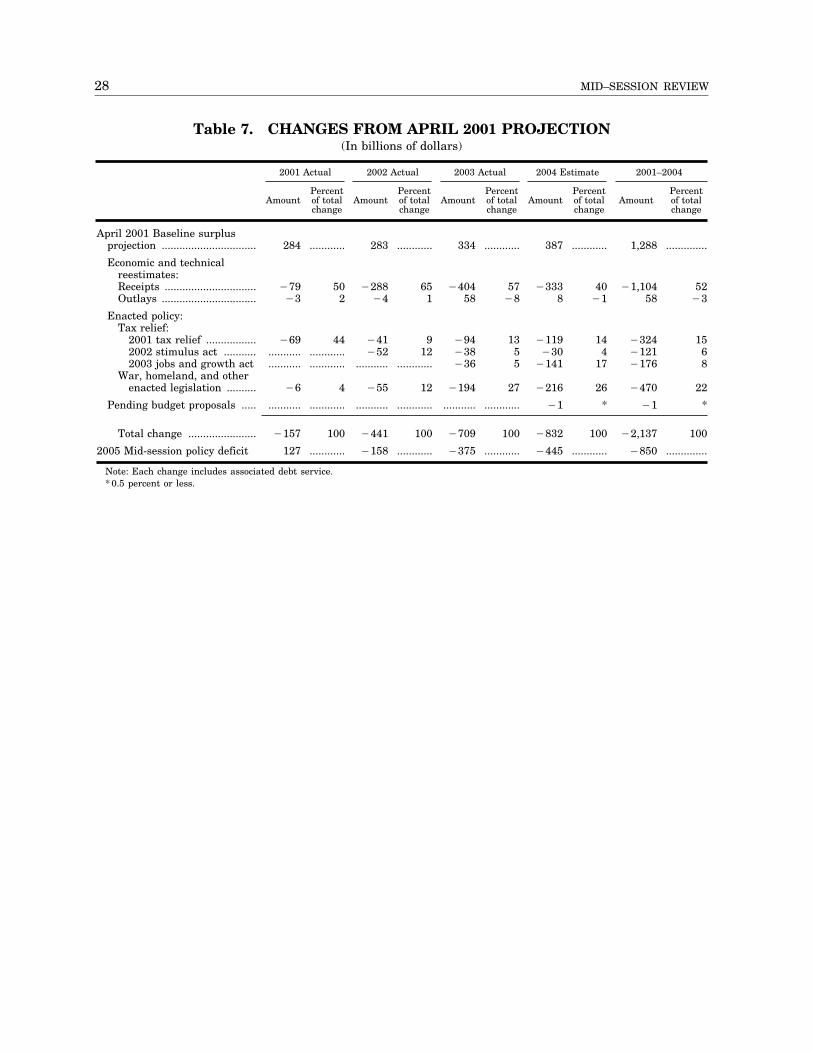
Table 7. Changes from April 2001 Projection ............................................................. 28
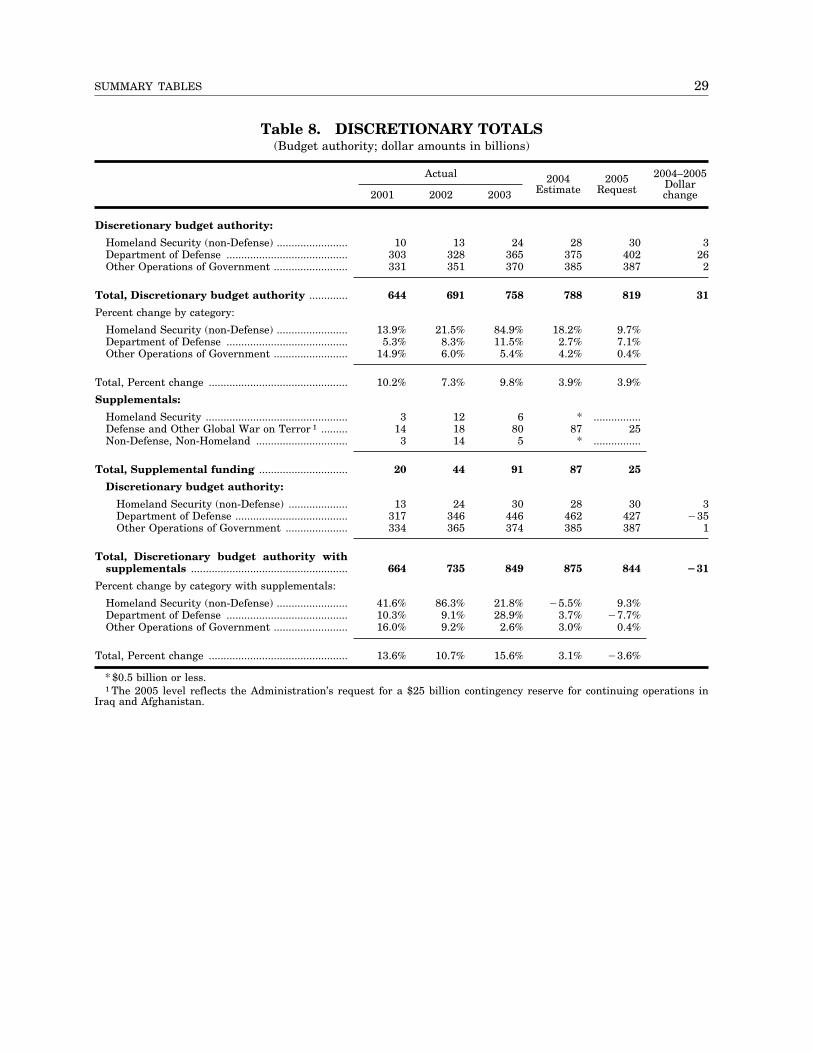
Table 8. Discretionary Totals ....................................................................................... 29
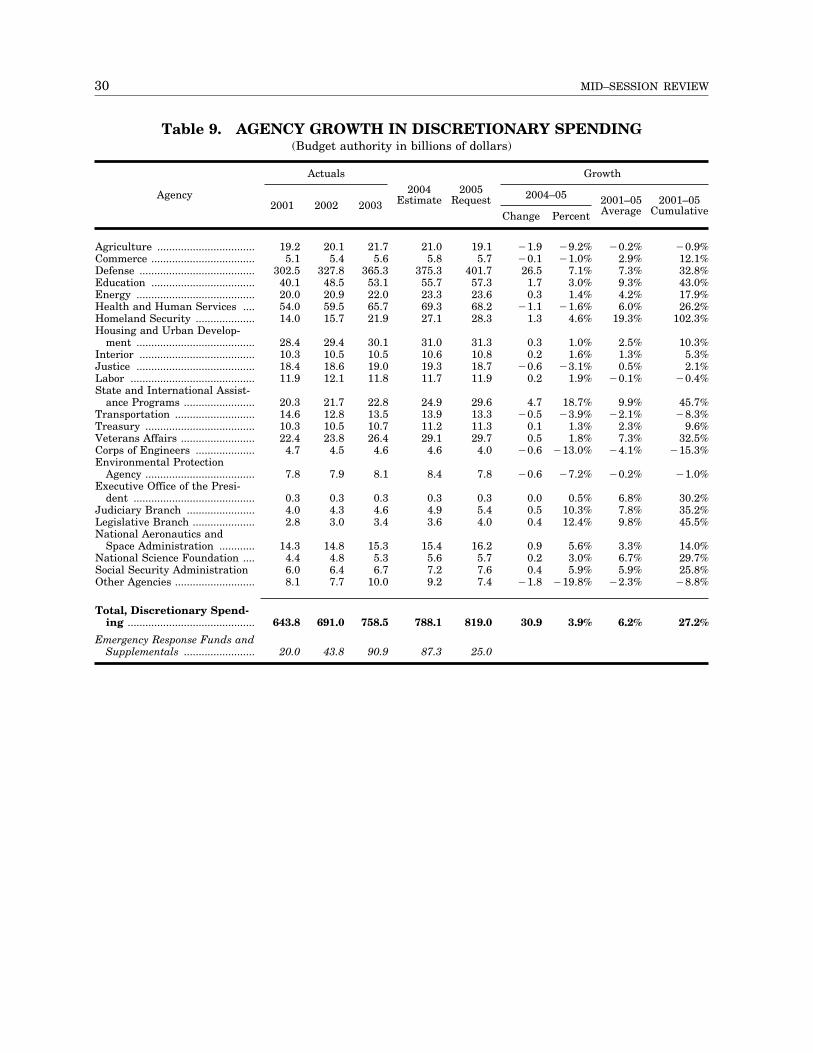
Table 9. Agency Growth in Discretionary Spending .................................................. 30
Table 10. Discretionary Proposals by Appropriations Subcommittee ........................ 31
Table 11. Homeland Security Funding by Agency ....................................................... 32
Table 12. Mandatory Proposals ..................................................................................... 33
Table 13. Receipts Proposals ......................................................................................... 36
Table 14. Budget Summary by Category ...................................................................... 42
Table 15. Impact of Budget Policy ................................................................................. 43
Table 16. Receipts by Source ......................................................................................... 44
Table 17. Outlays by Agency ......................................................................................... 45
Table 18. Outlays by Function ...................................................................................... 46
Table 19. Discretionary Budget Authority by Agency ................................................. 47
Table 20. Discretionary Budget Authority by Function .............................................. 48
Table 21. Current Services Baseline by Category ........................................................ 49
Table 22. Baseline Adjustments .................................................................................... 50
Table 23. Outlays for Mandatory Programs Under Current Law .............................. 51
Table 24. Federal Government Financing and Debt .................................................... 52
iii
SUMMARY The 2005 Budget, released in February,
set forth the President’s plan to cut the deficit in half while advancing his priorities of winning the War on Terror, protecting the homeland, strengthening the economy, and creating jobs. This Mid-Session Review reports solid progress toward cutting the deficit in half, based, in part, on the success of the President’s economic policies:
• Economic growth and job creation. Economic growth over the past year has been strong. During the second half of last year, the economy expanded at one of the fastest rates in two decades. In the first quarter of this year, real gross domestic product (GDP) grew 3.9 percent, and all indications point to further solid growth in the remainder of the year, although the growth rate will, as always, vary from quarter to quarter. Job creation has accelerated, with 1.5 million jobs created in the last 10 months, including nearly 1.3 million jobs since the start of this year.
• Declining deficits. Largely because of this improved economic performance, revenues have increased dramatically from the February projections for 2004 and 2005. As a result, projected deficits are down a total of more than $100 billion from the February estimates for these two fiscal years. The projections for each subsequent year are improved as well.
By following the President’s Six-Point Plan for Economic Growth, we can sustain the economic recovery and continue to create jobs for American workers. A strong economy, coupled with spending restraint, will allow us to cut the deficit by more than half within five years.
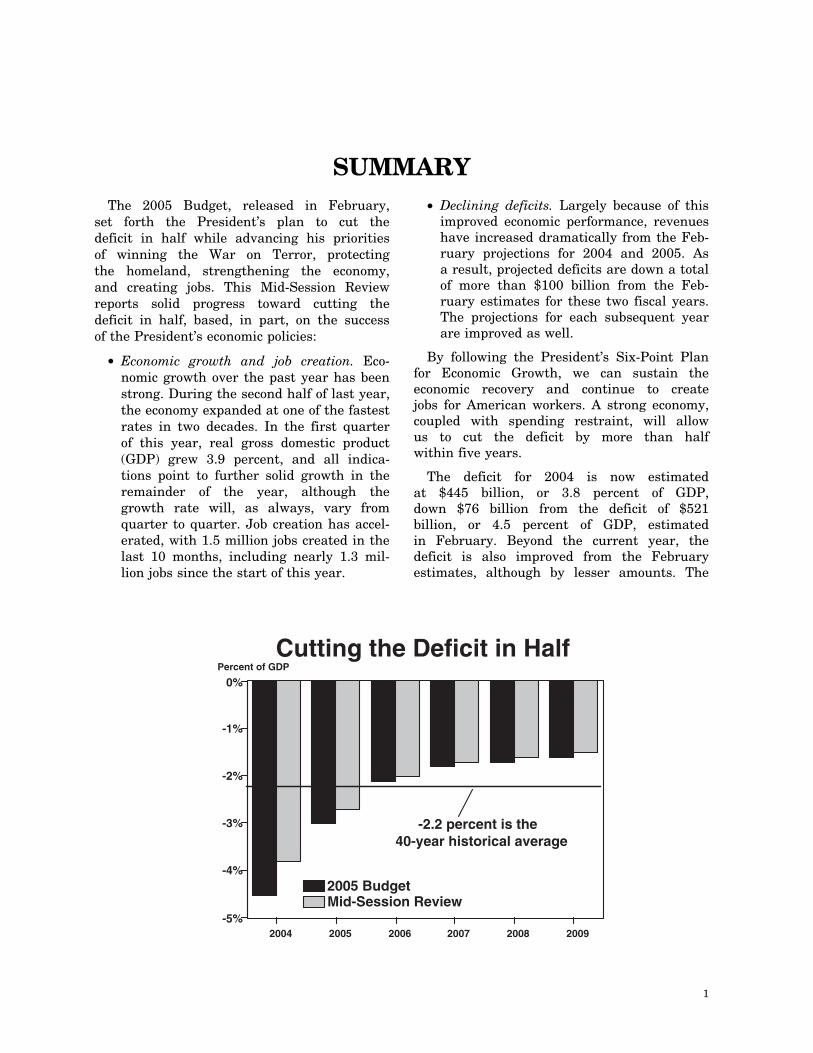
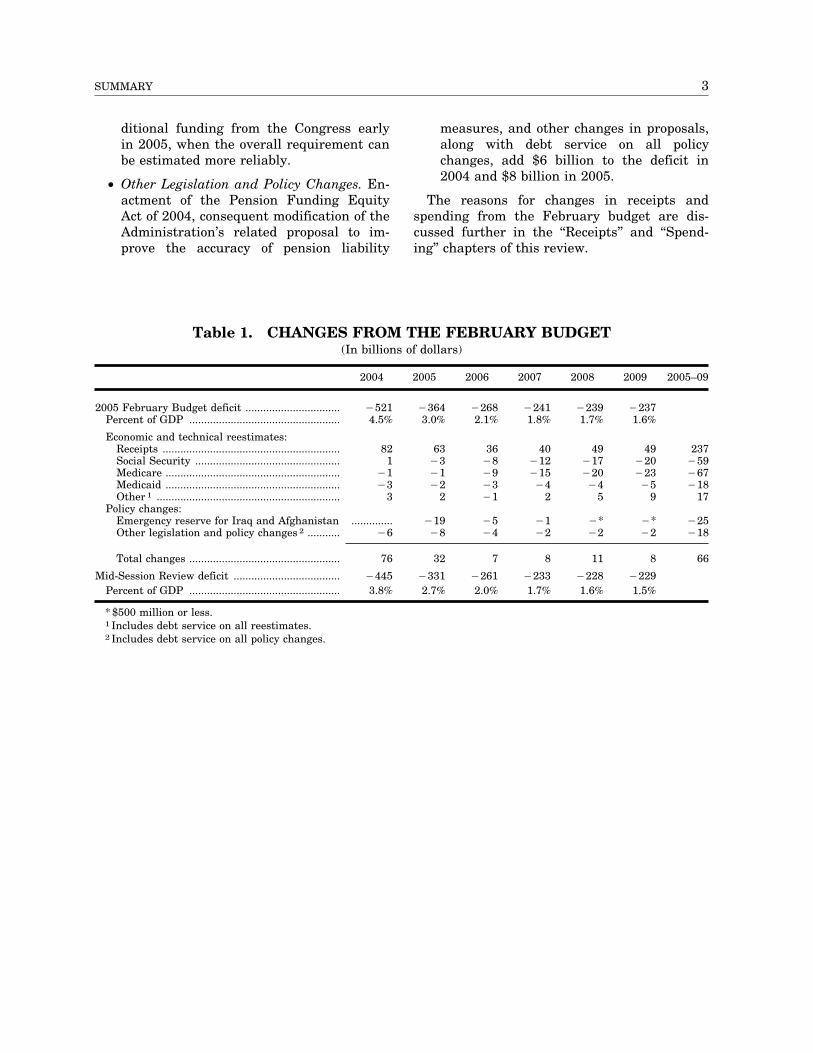
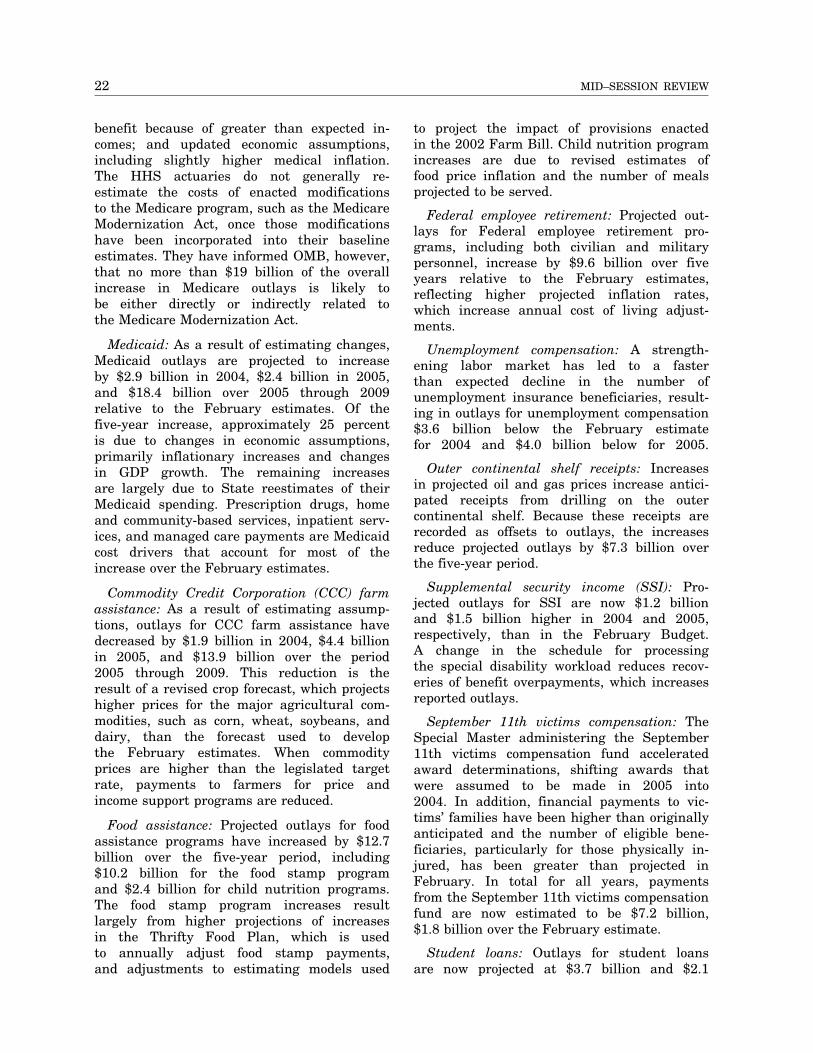
The deficit for 2004 is now estimated at $445 billion, or 3.8 percent of GDP, down $76 billion from the deficit of $521 billion, or 4.5 percent of GDP, estimated in February. Beyond the current year, the deficit is also improved from the February estimates, although by lesser amounts. The
Cutting the Deficit in Half Percent of GDP
-5%
-4%
-3%
-2%
-1%
0%
-2.2 percent is the 40-year historical average
2005 Budget Mid-Session Review
2004 2005 2006 2007 2008 2009
1
2 MID–SESSION REVIEW
2005 deficit is reduced from February by $32 billion, even after including spending from the President’s request in May for a $25 billion contingent emergency reserve for operations in Iraq and Afghanistan. The reductions in the deficits as estimated in February for 2006 through 2009 range from $7 billion to $11 billion.
The improvement in the deficit in 2004 is due to significantly higher receipts. Projected collections also exceed the February estimates for 2005 and subsequent years, although by smaller amounts than in the current fiscal year due to the Administration’s conservative economic forecast and its cautious estimating assumptions. Of course, if the economy performs better than the Administration assumes—and spending restraint con-tinues—then the deficits would be below the estimates shown here.
The most economically relevant measure of the budget deficit is its size in relation to the Nation’s economy, as measured by GDP. While the projected deficit for 2004 of 3.8 percent of GDP is unwelcome, it would be smaller than deficits in nine of the last 25 years, and far below the peak deficit in that period of 6.0 percent of GDP in 1983. The projected 2005 deficit, at 2.7 percent of GDP, would be smaller than those in 14 of the last 25 years.
With steady growth in receipts and restraint in spending, the deficit is projected to fall to 1.5 percent of GDP in 2009, 0.1 percentage point lower than estimated in February, and well less than half of the 2004 deficit. This 2009 deficit would also be well below the average deficit of 2.2 percent of GDP over the last four decades.
Changes in Budget Estimates since February
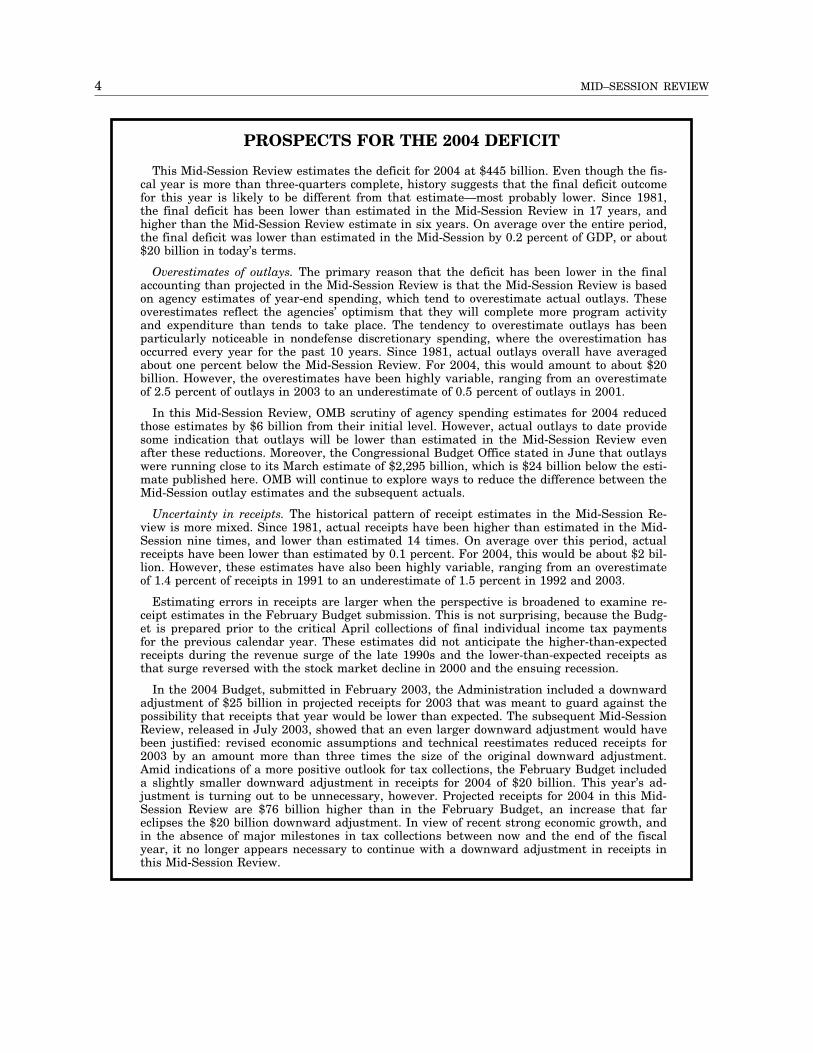
The Mid-Session Review estimates of receipts, outlays, and the deficit have been updated to reflect legislation enacted since February, changes in the economic outlook, and other developments (Table 1). The major reasons for the change in the deficit forecasts from February are the following:
• Reestimates in Receipts. Changes in the economic outlook, actual collections experi
ence, and other revisions in estimating assumptions raise receipts from February by $82 billion in 2004, $63 billion in 2005, and by smaller amounts in later years. These changes include the effects of removing the downward adjustment for uncertainty in receipts that was included in the Budget, amounting to $20 billion in 2004 and $15 billion in 2005. Improved economic conditions, higher collections from withheld personal income taxes, and solid collections in the month of April indicate that these downward adjustments are no longer required.
• Reestimates in Spending. Revised estimates of spending, primarily for Social Security, Medicare, and Medicaid, raise outlays from the February estimates. Social Security spending is down from February estimates by $1 billion in 2004, up by $3 billion in 2005, and up by growing amounts in later years, largely due to increased cost of living adjustments because of the higher assumed level of the consumer price index. Revisions in Medicare increase outlays by $1 billion in each of 2004 and 2005, and by substantially larger amounts thereafter. These revisions result largely from technical changes, including updated data on health status, refinements in estimating models, and a technical correction to the Budget estimates. Spending for the Medicaid program is higher than in February estimates by $3 billion in 2004, $2 billion in 2005, and slightly larger amounts in subsequent years. These estimates reflect new State projections of Medicaid spending.
• Request for 2005 Funding for Operations in Iraq and Afghanistan. On May 12, the Administration requested a $25 billion contingent emergency reserve fund for the continuing costs of operations in Iraq and Afghanistan. The availability of this reserve fund will ensure that there is no disruption in funding and resources for our Armed Forces overseas. This request is projected to increase outlays by $19 billion in 2005 and $5 billion in 2006. The full cost of these operations in 2005 is uncertain, but they are expected to require additional funding beyond this request. The Administration expects to request ad
3 SUMMARY
ditional funding from the Congress early measures, and other changes in proposals, in 2005, when the overall requirement can along with debt service on all policy be estimated more reliably. changes, add $6 billion to the deficit in
2004 and $8 billion in 2005. • Other Legislation and Policy Changes. Enactment of the Pension Funding Equity The reasons for changes in receipts and Act of 2004, consequent modification of the spending from the February budget are dis-Administration’s related proposal to im cussed further in the ‘‘Receipts’’ and ‘‘Spendprove the accuracy of pension liability ing’’ chapters of this review.
Table 1. CHANGES FROM THE FEBRUARY BUDGET (In billions of dollars)
2005 February Budget deficit ................................ Percent of GDP ...................................................
Economic and technical reestimates: Receipts ............................................................ Social Security ................................................. Medicare ........................................................... Medicaid ........................................................... Other 1 ..............................................................
Policy changes: Emergency reserve for Iraq and Afghanistan Other legislation and policy changes 2 ...........
Total changes ...................................................
Mid-Session Review deficit .................................... Percent of GDP ...................................................
* $500 million or less. 1 Includes debt service on all reestimates. 2 Includes debt service on all policy changes.
2004
¥521 4.5%
82 1
¥1 ¥3
3
.............. ¥6
2005
¥364 3.0%
63 ¥3 ¥1 ¥2
2
¥19 ¥8
2006
¥268 2.1%
36 ¥8 ¥9 ¥3 ¥1
¥5 ¥4
2007
¥241 1.8%
40 ¥12 ¥15
¥4 2
¥1 ¥2
2008
¥239 1.7%
49 ¥17 ¥20
¥4 5
¥* ¥2
2009 2
¥237 1.6%
49 ¥20 ¥23
¥5 9
¥* ¥2
005–09
237 ¥59 ¥67 ¥18
17
¥25 ¥18
76
¥445 3.8%
32
¥331 2.7%
7
¥261 2.0%
8
¥233 1.7%
11
¥228 1.6%
8
¥229 1.5%
66
4 MID–SESSION REVIEW
PROSPECTS FOR THE 2004 DEFICIT
This Mid-Session Review estimates the deficit for 2004 at $445 billion. Even though the fiscal year is more than three-quarters complete, history suggests that the final deficit outcome for this year is likely to be different from that estimate—most probably lower. Since 1981, the final deficit has been lower than estimated in the Mid-Session Review in 17 years, and higher than the Mid-Session Review estimate in six years. On average over the entire period, the final deficit was lower than estimated in the Mid-Session by 0.2 percent of GDP, or about $20 billion in today’s terms.
Overestimates of outlays. The primary reason that the deficit has been lower in the final accounting than projected in the Mid-Session Review is that the Mid-Session Review is based on agency estimates of year-end spending, which tend to overestimate actual outlays. These overestimates reflect the agencies’ optimism that they will complete more program activity and expenditure than tends to take place. The tendency to overestimate outlays has been particularly noticeable in nondefense discretionary spending, where the overestimation has occurred every year for the past 10 years. Since 1981, actual outlays overall have averaged about one percent below the Mid-Session Review. For 2004, this would amount to about $20 billion. However, the overestimates have been highly variable, ranging from an overestimate of 2.5 percent of outlays in 2003 to an underestimate of 0.5 percent of outlays in 2001.
In this Mid-Session Review, OMB scrutiny of agency spending estimates for 2004 reduced those estimates by $6 billion from their initial level. However, actual outlays to date provide some indication that outlays will be lower than estimated in the Mid-Session Review even after these reductions. Moreover, the Congressional Budget Office stated in June that outlays were running close to its March estimate of $2,295 billion, which is $24 billion below the estimate published here. OMB will continue to explore ways to reduce the difference between the Mid-Session outlay estimates and the subsequent actuals.
Uncertainty in receipts. The historical pattern of receipt estimates in the Mid-Session Review is more mixed. Since 1981, actual receipts have been higher than estimated in the Mid-Session nine times, and lower than estimated 14 times. On average over this period, actual receipts have been lower than estimated by 0.1 percent. For 2004, this would be about $2 billion. However, these estimates have also been highly variable, ranging from an overestimate of 1.4 percent of receipts in 1991 to an underestimate of 1.5 percent in 1992 and 2003.
Estimating errors in receipts are larger when the perspective is broadened to examine receipt estimates in the February Budget submission. This is not surprising, because the Budget is prepared prior to the critical April collections of final individual income tax payments for the previous calendar year. These estimates did not anticipate the higher-than-expected receipts during the revenue surge of the late 1990s and the lower-than-expected receipts as that surge reversed with the stock market decline in 2000 and the ensuing recession.
In the 2004 Budget, submitted in February 2003, the Administration included a downward adjustment of $25 billion in projected receipts for 2003 that was meant to guard against the possibility that receipts that year would be lower than expected. The subsequent Mid-Session Review, released in July 2003, showed that an even larger downward adjustment would have been justified: revised economic assumptions and technical reestimates reduced receipts for 2003 by an amount more than three times the size of the original downward adjustment. Amid indications of a more positive outlook for tax collections, the February Budget included a slightly smaller downward adjustment in receipts for 2004 of $20 billion. This year’s adjustment is turning out to be unnecessary, however. Projected receipts for 2004 in this Mid-Session Review are $76 billion higher than in the February Budget, an increase that far eclipses the $20 billion downward adjustment. In view of recent strong economic growth, and in the absence of major milestones in tax collections between now and the end of the fiscal year, it no longer appears necessary to continue with a downward adjustment in receipts in this Mid-Session Review.
5 SUMMARY
The Sources of Recent Deficits
Today’s deficits are due to an extraordinary confluence of adversity: the stock market downturn that began in 2000, the subsequent recession, the terrorist attacks of September 11, 2001, subsequent spending for homeland security and the War on Terror, and the crisis in investor confidence from revelations of corporate scandals years in the making. The current deficit estimate of $445 billion for 2004 is a change of $832 billion from the $387 billion baseline surplus projected by the Administration when it took office in 2001. That initial surplus projection envisioned no recession, no continued collapse in the stock market, no September 11th terrorist attacks, no revelation of long-standing corporate accounting scandals, no additional homeland security spending, and no War on Terror. These subsequent events have had a dramatic effect on the budget outlook.
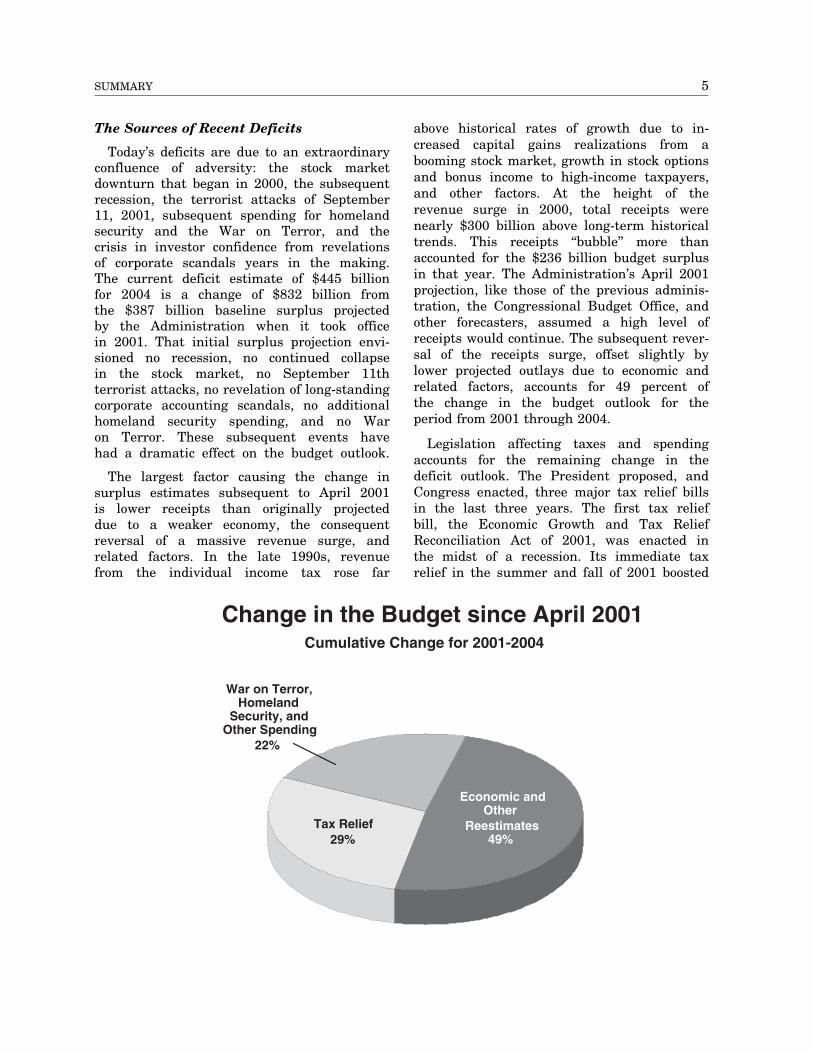
The largest factor causing the change in surplus estimates subsequent to April 2001 is lower receipts than originally projected due to a weaker economy, the consequent reversal of a massive revenue surge, and related factors. In the late 1990s, revenue from the individual income tax rose far
above historical rates of growth due to increased capital gains realizations from a booming stock market, growth in stock options and bonus income to high-income taxpayers, and other factors. At the height of the revenue surge in 2000, total receipts were nearly $300 billion above long-term historical trends. This receipts ‘‘bubble’’ more than accounted for the $236 billion budget surplus in that year. The Administration’s April 2001 projection, like those of the previous administration, the Congressional Budget Office, and other forecasters, assumed a high level of receipts would continue. The subsequent reversal of the receipts surge, offset slightly by lower projected outlays due to economic and related factors, accounts for 49 percent of the change in the budget outlook for the period from 2001 through 2004.
Legislation affecting taxes and spending accounts for the remaining change in the deficit outlook. The President proposed, and Congress enacted, three major tax relief bills in the last three years. The first tax relief bill, the Economic Growth and Tax Relief Reconciliation Act of 2001, was enacted in the midst of a recession. Its immediate tax relief in the summer and fall of 2001 boosted
Change in the Budget since April 2001 Cumulative Change for 2001-2004
War on Terror, Homeland
Security, and Other Spending
22%
Tax Relief 29%
Economic and Other
Reestimates 49%
6 MID–SESSION REVIEW
consumer demand and helped to ensure the recession was one of the shortest and shallowest on record. The second tax relief bill, the Job Creation and Worker Assistance Act of 2002, provided incentives for business investment to jump-start the recovery. Finally, last year the Jobs and Growth Tax Relief Reconciliation Act of 2003 lent further support to business investment and helped to accelerate job creation to its current healthy pace. Over 2001 through 2004, the cumulative effects of this tax relief account for 29 percent of the change in the budget balance from the original April 2001 projection. Even if the direct effects of that tax relief were removed from the accounting, the deficit this year would still be in triple digits. Furthermore, without the dynamic impact of the tax measures in boosting the economy out of recession, economic growth would have been slower, with as many as 3 million fewer jobs by the end of this year, leading to a significantly higher deficit than this static estimate.
Policy action on the spending side of the budget has also contributed to the shift in the budget outlook, accounting for 22 percent of the change from the April 2001 projection. A little more than half of this new spending is in the areas of defense and homeland security. Limiting the focus to discretionary spending, which the President and Congress control through annual appropriations, more than three-quarters of the increase above the 2001 level has been directly related to the response to September 11th, enhanced homeland security, and the War on Terror.
Achieving an Improved Budget Outlook
The February Budget set out a goal of cutting the deficit in half within five years. With improvements in the budget outlook since February, this Mid-Session Review continues to project that this goal will be met. The estimated deficit for 2004 is now 3.8 percent of GDP, down from 4.5 percent of GDP projected in February. By 2009, the deficit is reduced to 1.5 percent of GDP, less than half of the current estimate for 2004 and a reduction of two-thirds from the estimate in the February Budget. In nominal terms, the current deficit is also reduced by more than half, from the $521 billion deficit for 2004 estimated in February to the current estimate of $229 billion for 2009.
Future reductions in the deficit will not be automatic. The key to a reduced deficit is twofold: continuation of the President’s pro-growth economic policies and restraint in spending.
The outlook for the economy is brightening. Job creation has accelerated, industrial production is increasing rapidly, and after-tax incomes are rising. Productivity gains have continued even as hours worked have begun to increase, with the average growth in productivity in the current expansion well above any previous postwar recovery. Consumer spending is rising briskly, consumer and business confidence is increasing, and, more fundamental to sustained growth, business investment is growing at a healthy pace. There is more to be done, but these developments suggest a future of sustained economic growth and rising wages, in which every American who wants a job can find one.
7 SUMMARY
TAX RELIEF AND THE ECONOMY
The tax relief enacted by Congress and signed into law by President Bush over the last three years shortened the duration of the recession and helped the economy overcome a series of additional shocks so that GDP over the four quarters ending with the first quarter of 2004 has grown at the fastest rate in almost 20 years and 1.3 million jobs have been created since the start of the year. This stronger growth is no accident, and can be traced to specific consequences of the tax policies that have been put in place.
For example, much of the enacted tax relief went to families to help them through the financial strains of a soft economy. By raising after-tax family incomes, the tax relief also strengthened the economy by sustaining personal consumption. For example, the combination of the increase in child tax credit from $500 to $1,000, the creation of the new 10 percent tax bracket, and the marriage penalty provisions have meant that individuals and families could better maintain their levels of purchases. Partly as a consequence, personal consumption expenditures grew throughout the recession and early recovery rather than contracting as typically happens in a recession.
By sustaining personal consumption levels, the tax relief also helped the economy avoid the typical pro-cyclical ballooning of inventories usually accompanying and exacerbating a recession. Typically in a recession, personal consumption contracts and so businesses face rapidly increasing and unwanted inventory. Businesses respond by dramatically cutting orders for new goods, putting additional strong downward pressure on output, which leads to more layoffs, which leads in turn to a further decline in consumption, and so on. In contrast, thanks to the tax relief that sustained personal consumption, businesses were able to avoid unwanted inventory accumulation.
The 2001 and 2003 tax relief bills also contained important supply-side help for the economy through the reductions in marginal income tax rates. Even as the economy was slipping into recession, many economic sectors remained relatively strong. Lower marginal tax rates improved incentives to increase work effort and investment throughout the economy, but especially in those areas that remained relatively robust throughout the recession and early recovery, which then helped to accelerate the process of restoring vitality to weaker sectors.
The reduction in marginal tax rates played a very important role in revitalizing the health of the small business sector as did the increase in the amount of investment in equipment and software a business can write-off for tax purposes (expense) from $25,000 to $100,000. The rate reductions and the small business expensing provision led to two important stabilizing effects. First, they increased business cash flow at a time when cash had become tight for many small businesses. When small businesses’ cash gets tight, often their only recourse is to lay off workers. By supporting small business cash flow, the rate reduction and increase in expensing helped keep a great many small businesses afloat and a great many employees to keep their jobs until the recovery could take hold.
The second effect of the small business expensing provision, along with the broader ‘‘bonus depreciation’’ provision enacted as part of the 2002 bill and increased in the 2003 bill, was to encourage businesses of all sizes to maintain and in many cases increase their level of purchases of new equipment and software. In addition to helping to sustain the level of demand in the economy overall, this helped businesses to prepare to become more productive and more internationally competitive as economic activity returns to normal.
Finally, the 2003 tax bill included critical tax relief for savers and investors, the effects of which were quickly seen in higher stock market prices and, therefore, higher levels of household wealth. The 2003 tax bill reduced the top tax rate on long-term capital gains from 20 percent to 15 percent and set the top tax rate on dividend income at 15 percent. In addition to raising after-tax incomes and thus further supporting personal consumption, the most important consequence of these provisions was to increase significantly the after-tax returns to investment, risk-taking, and entrepreneurship. These provisions, along with the marginal rate cuts, the small business expensing, and other provisions have had a powerful influence in returning our economy to strong growth, and will continue to provide additional vitality to job creation and real wage growth in the years ahead.
8 MID–SESSION REVIEW
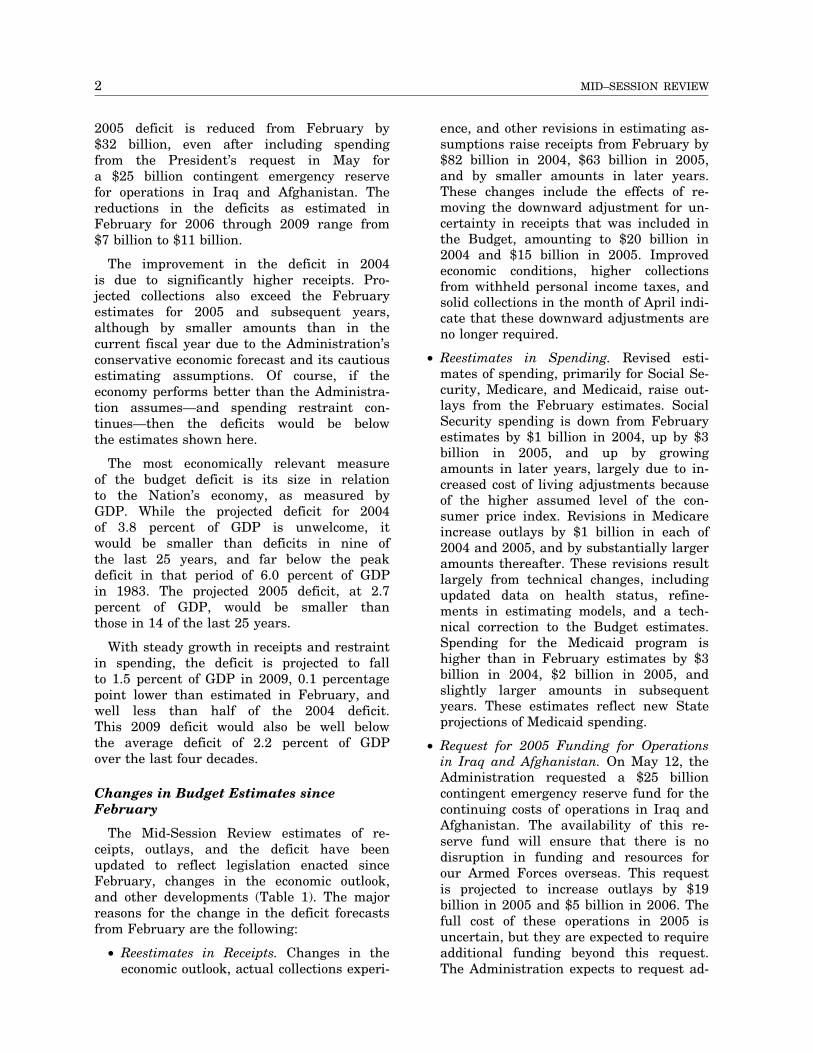
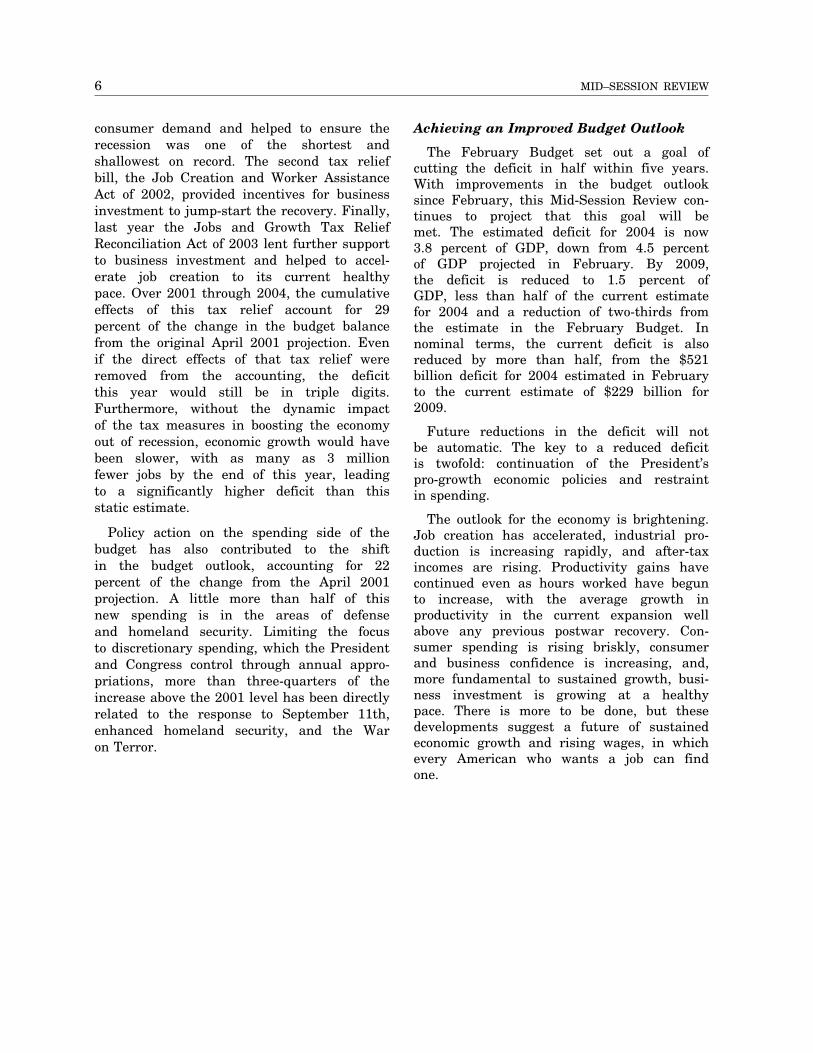
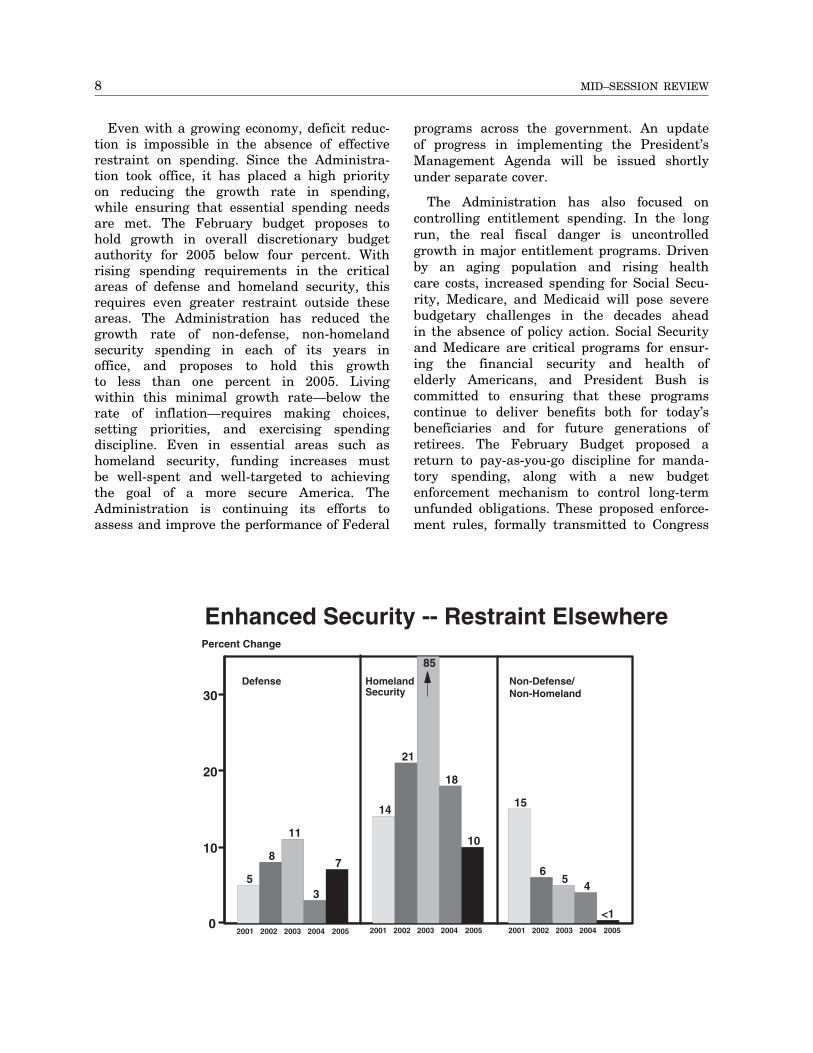
Even with a growing economy, deficit reduction is impossible in the absence of effective restraint on spending. Since the Administration took office, it has placed a high priority on reducing the growth rate in spending, while ensuring that essential spending needs are met. The February budget proposes to hold growth in overall discretionary budget authority for 2005 below four percent. With rising spending requirements in the critical areas of defense and homeland security, this requires even greater restraint outside these areas. The Administration has reduced the growth rate of non-defense, non-homeland security spending in each of its years in office, and proposes to hold this growth to less than one percent in 2005. Living within this minimal growth rate—below the rate of inflation—requires making choices, setting priorities, and exercising spending discipline. Even in essential areas such as homeland security, funding increases must be well-spent and well-targeted to achieving the goal of a more secure America. The Administration is continuing its efforts to assess and improve the performance of Federal
programs across the government. An update of progress in implementing the President’s Management Agenda will be issued shortly under separate cover.
The Administration has also focused on controlling entitlement spending. In the long run, the real fiscal danger is uncontrolled growth in major entitlement programs. Driven by an aging population and rising health care costs, increased spending for Social Security, Medicare, and Medicaid will pose severe budgetary challenges in the decades ahead in the absence of policy action. Social Security and Medicare are critical programs for ensuring the financial security and health of elderly Americans, and President Bush is committed to ensuring that these programs continue to deliver benefits both for today’s beneficiaries and for future generations of retirees. The February Budget proposed a return to pay-as-you-go discipline for mandatory spending, along with a new budget enforcement mechanism to control long-term unfunded obligations. These proposed enforcement rules, formally transmitted to Congress
Enhanced Security -- Restraint Elsewhere Percent Change
30
20
10
0
7
10
<1
3
18
4
11
85
5
8
21
65
14 15
Defense Homeland Security
Non-Defense/ Non-Homeland
2001 2002 2003 2004 2005 2001 2002 2003 2004 2005 2001 2002 2003 2004 2005

9 SUMMARY
on April 2, would ensure that the problem restraining spending as the Administration is not made worse by entitlement expansions. has proposed, we can maintain the deficit’s
By continuing a policy course that promotes downward path and return the budget to
economic growth and job creation, and by stronger footing in the years ahead.
ECONOMIC ASSUMPTIONS The growth-enhancing policies pursued by
the Administration and the Federal Reserve during the past three years are now paying off handsomely. The expansion is strong, industrial production is rising, employment is into normal levels.
Forward-looking indicators suggest that these trends will continue, although the growth rate will, as always, vary from quarter to quarter. Absent any significant unexpected events, the coming years are likely to be characterized by solid growth, expanding job opportunities, increasing wages, and relatively low inflation and interest rates. The Adminis-tration’s strong economic forecast is shared by the consensus of private sector forecasters.
A year ago, most forecasters, including the Administration, anticipated that the economy was about to strengthen noticeably in response to the expansionary fiscal and monetary policies then in place. That prediction has proven to be correct: during the second half of last year, the economy grew at one of the fastest rates in two decades. During the first quarter of this year, the economy continued to expand briskly. Second quarter growth was not available when the Mid-Session Review went to press. Significantly, business capital spending has joined consumer spending as an additional source of growth in demand. Strong capital spending is the hallmark of a strong, self-sustaining expansion.
Robust growth has meant more jobs for American workers. Since last August, the Nation’s payrolls have increased by 1.5 million new jobs. The unemployment rate has fallen from 6.3 percent in June 2003 to 5.6 percent in June 2004. That level is lower than the decade averages for the 1970s, 1980s, and 1990s. All major demographic groups and 47 states have seen a decline in their unemployment rate during the past year.
Since the Administration took office, fiscal and monetary policies have focused primarily on overcoming the powerful forces that brought growth to a near standstill in the second
half of 2000, pulled the economy into recession in 2001, and then impeded the recovery that began in November of that year. These forces included: the sharp fall in the stock market that began in March 2000; the decline in business fixed investment beginning in early 2001; the terrorist attacks of September 11th; the ensuing War on Terror and concerns about further attacks; the slow growth, and even recession, in many industrialized countries that curtailed U.S. exports; and the revelation of corporate accounting scandals years in the making that depressed the stock market. Thanks to the policies that were put in place and the inherent resilience of U.S. workers and businesses, the economy has overcome these obstacles and is again on a solid expansionary path.
At this juncture, fiscal policy can shift from providing short-term demand stimulus to promoting long-term economic growth by fostering work, saving, and investment. To achieve these goals, and as part of the President’s Six-Point Plan for Economic Growth, the FY 2005 Budget proposed making permanent many of the recently enacted tax relief provisions.
The stance of monetary policy is also changing as the economy improves. The Federal Reserve decided at the end of June to raise the target Federal funds rate by 1⁄4 percentage point to 11⁄4 percent, reflecting its belief that the economy has made the transition from recovery to self-sustaining growth.
In light of the ongoing strength in the economy, the step up in productivity growth during the past decade, and the growth-promoting policies of this Administration, it would not be surprising if actual economic performance during the next five years turns out to be better than that envisaged in the economic projections. In the interest of prudent budgeting, the Mid-Session Review budget projections are based on a cautious view of the economic outlook that is close
11
12 MID–SESSION REVIEW
to the current consensus of professional fore- growth and push the economy onto a positive, casters. (See Tables 2 and 3.) self-sustaining trajectory.1
Policy Actions
Fiscal Policy: In each of the past three years, the Administration proposed, and Congress enacted, significant tax relief measures designed to overcome the obstacles to job
• In June 2001, following swift action by the Congress on his proposals, the President signed the Economic Growth and Tax Relief and Reconciliation Act. It lowered marginal income tax rates; reduced the marriage tax penalty; and created a new,
1For further details on the provisions of the three Acts, see ‘‘Economic Assumptions,’’ Chapter 11, Analytical Perspectives, FY 2005 Budget.
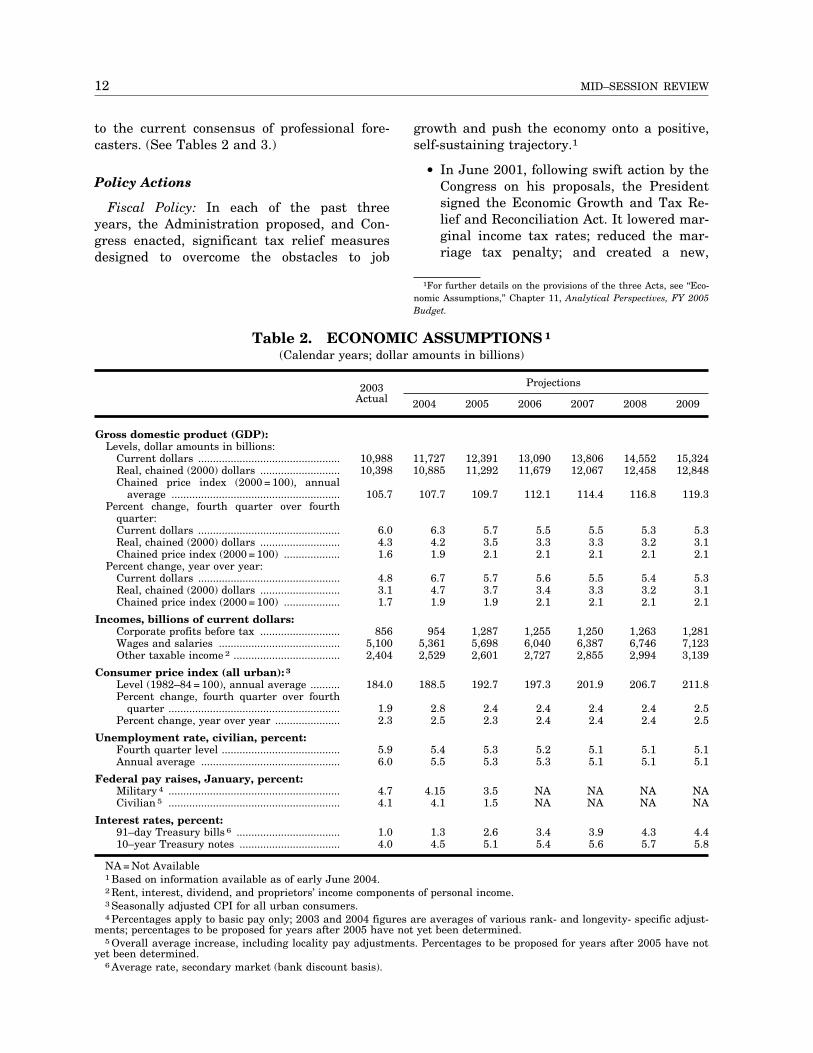
Table 2. ECONOMIC ASSUMPTIONS 1
(Calendar years; dollar amounts in billions)
2003 Projections Actual 2004 2005 2006 2007 2008 2009
Gross domestic product (GDP): Levels, dollar amounts in billions:
Current dollars ................................................ 10,988 11,727 12,391 13,090 13,806 14,552 15,324 Real, chained (2000) dollars ........................... 10,398 10,885 11,292 11,679 12,067 12,458 12,848 Chained price index (2000 = 100), annual
average ......................................................... 105.7 107.7 109.7 112.1 114.4 116.8 119.3 Percent change, fourth quarter over fourth
quarter: Current dollars ................................................ 6.0 6.3 5.7 5.5 5.5 5.3 5.3 Real, chained (2000) dollars ........................... 4.3 4.2 3.5 3.3 3.3 3.2 3.1 Chained price index (2000 = 100) ................... 1.6 1.9 2.1 2.1 2.1 2.1 2.1
Percent change, year over year: Current dollars ................................................ 4.8 6.7 5.7 5.6 5.5 5.4 5.3 Real, chained (2000) dollars ........................... 3.1 4.7 3.7 3.4 3.3 3.2 3.1 Chained price index (2000 = 100) ................... 1.7 1.9 1.9 2.1 2.1 2.1 2.1
Incomes, billions of current dollars: Corporate profits before tax ........................... 856 954 1,287 1,255 1,250 1,263 1,281 Wages and salaries ......................................... 5,100 5,361 5,698 6,040 6,387 6,746 7,123 Other taxable income 2 .................................... 2,404 2,529 2,601 2,727 2,855 2,994 3,139
Consumer price index (all urban): 3
Level (1982–84 = 100), annual average .......... 184.0 188.5 192.7 197.3 201.9 206.7 211.8 Percent change, fourth quarter over fourth
quarter .......................................................... 1.9 2.8 2.4 2.4 2.4 2.4 2.5 Percent change, year over year ...................... 2.3 2.5 2.3 2.4 2.4 2.4 2.5
Unemployment rate, civilian, percent: Fourth quarter level ........................................ 5.9 5.4 5.3 5.2 5.1 5.1 5.1 Annual average ............................................... 6.0 5.5 5.3 5.3 5.1 5.1 5.1
Federal pay raises, January, percent: Military 4 .......................................................... 4.7 4.15 3.5 NA NA NA NA Civilian 5 .......................................................... 4.1 4.1 1.5 NA NA NA NA
Interest rates, percent: 91–day Treasury bills 6 ................................... 1.0 1.3 2.6 3.4 3.9 4.3 4.4 10–year Treasury notes .................................. 4.0 4.5 5.1 5.4 5.6 5.7 5.8
NA = Not Available1 Based on information available as of early June 2004.2 Rent, interest, dividend, and proprietors’ income components of personal income.3 Seasonally adjusted CPI for all urban consumers.4 Percentages apply to basic pay only; 2003 and 2004 figures are averages of various rank- and longevity- specific adjust
ments; percentages to be proposed for years after 2005 have not yet been determined. 5 Overall average increase, including locality pay adjustments. Percentages to be proposed for years after 2005 have not
yet been determined. 6 Average rate, secondary market (bank discount basis).
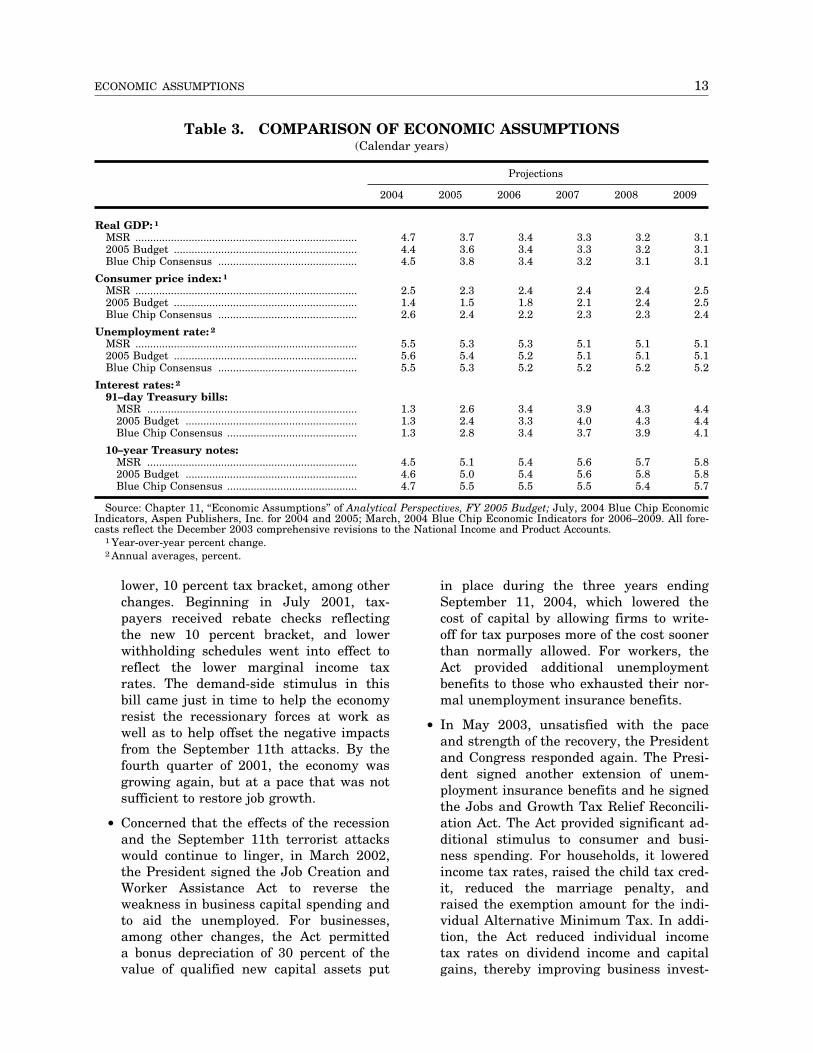
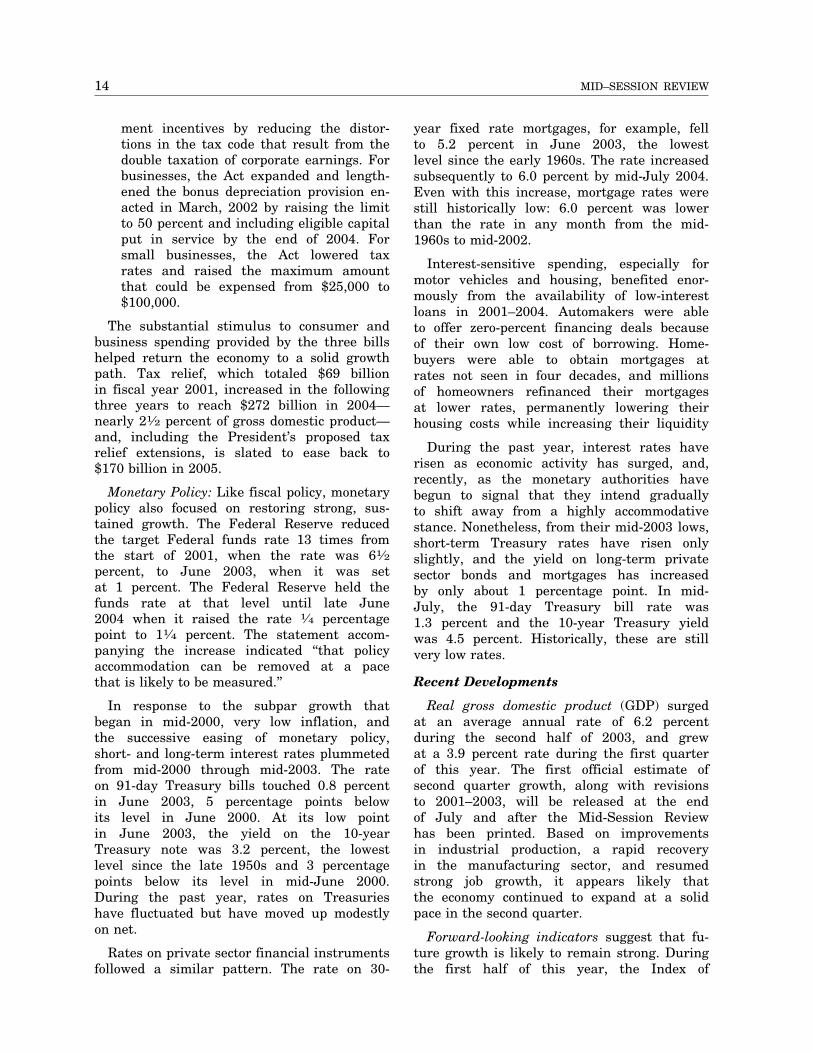
ECONOMIC ASSUMPTIONS 13
Table 3. COMPARISON OF ECONOMIC ASSUMPTIONS (Calendar years)
Projections
2004 2005 2006 2007 2008 2009
Real GDP: 1
MSR ........................................................................... 4.7 3.7 3.4 3.3 3.2 3.1 2005 Budget .............................................................. 4.4 3.6 3.4 3.3 3.2 3.1 Blue Chip Consensus ............................................... 4.5 3.8 3.4 3.2 3.1 3.1
Consumer price index: 1
MSR ........................................................................... 2.5 2.3 2.4 2.4 2.4 2.5 2005 Budget .............................................................. 1.4 1.5 1.8 2.1 2.4 2.5 Blue Chip Consensus ............................................... 2.6 2.4 2.2 2.3 2.3 2.4
Unemployment rate: 2
MSR ........................................................................... 5.5 5.3 5.3 5.1 5.1 5.1 2005 Budget .............................................................. 5.6 5.4 5.2 5.1 5.1 5.1 Blue Chip Consensus ............................................... 5.5 5.3 5.2 5.2 5.2 5.2
Interest rates: 2
91–day Treasury bills: MSR ....................................................................... 1.3 2.6 3.4 3.9 4.3 4.4 2005 Budget .......................................................... 1.3 2.4 3.3 4.0 4.3 4.4 Blue Chip Consensus ............................................ 1.3 2.8 3.4 3.7 3.9 4.1
10–year Treasury notes: MSR ....................................................................... 4.5 5.1 5.4 5.6 5.7 5.8 2005 Budget .......................................................... 4.6 5.0 5.4 5.6 5.8 5.8 Blue Chip Consensus ............................................ 4.7 5.5 5.5 5.5 5.4 5.7
Source: Chapter 11, ‘‘Economic Assumptions’’ of Analytical Perspectives, FY 2005 Budget; July, 2004 Blue Chip Economic Indicators, Aspen Publishers, Inc. for 2004 and 2005; March, 2004 Blue Chip Economic Indicators for 2006–2009. All forecasts reflect the December 2003 comprehensive revisions to the National Income and Product Accounts.
1 Year-over-year percent change. 2 Annual averages, percent.
lower, 10 percent tax bracket, among other in place during the three years ending changes. Beginning in July 2001, tax- September 11, 2004, which lowered the payers received rebate checks reflecting cost of capital by allowing firms to write-the new 10 percent bracket, and lower off for tax purposes more of the cost sooner withholding schedules went into effect to than normally allowed. For workers, the reflect the lower marginal income tax Act provided additional unemployment rates. The demand-side stimulus in this benefits to those who exhausted their nor-bill came just in time to help the economy mal unemployment insurance benefits. resist the recessionary forces at work as well as to help offset the negative impacts from the September 11th attacks. By the fourth quarter of 2001, the economy was growing again, but at a pace that was not sufficient to restore job growth.
• In May 2003, unsatisfied with the pace and strength of the recovery, the President and Congress responded again. The President signed another extension of unemployment insurance benefits and he signed the Jobs and Growth Tax Relief Reconcili
• Concerned that the effects of the recession ation Act. The Act provided significant ad-and the September 11th terrorist attacks ditional stimulus to consumer and busiwould continue to linger, in March 2002, ness spending. For households, it lowered the President signed the Job Creation and income tax rates, raised the child tax cred-Worker Assistance Act to reverse the it, reduced the marriage penalty, and weakness in business capital spending and raised the exemption amount for the indito aid the unemployed. For businesses, vidual Alternative Minimum Tax. In addiamong other changes, the Act permitted tion, the Act reduced individual income a bonus depreciation of 30 percent of the tax rates on dividend income and capital value of qualified new capital assets put gains, thereby improving business invest
14 MID–SESSION REVIEW
ment incentives by reducing the distortions in the tax code that result from the double taxation of corporate earnings. For businesses, the Act expanded and lengthened the bonus depreciation provision enacted in March, 2002 by raising the limit to 50 percent and including eligible capital put in service by the end of 2004. For small businesses, the Act lowered tax rates and raised the maximum amount that could be expensed from $25,000 to $100,000.
The substantial stimulus to consumer and business spending provided by the three bills helped return the economy to a solid growth path. Tax relief, which totaled $69 billion in fiscal year 2001, increased in the following three years to reach $272 billion in 2004— nearly 21⁄2 percent of gross domestic product— and, including the President’s proposed tax relief extensions, is slated to ease back to $170 billion in 2005.
Monetary Policy: Like fiscal policy, monetary policy also focused on restoring strong, sustained growth. The Federal Reserve reduced the target Federal funds rate 13 times from the start of 2001, when the rate was 61⁄2
percent, to June 2003, when it was set at 1 percent. The Federal Reserve held the funds rate at that level until late June 2004 when it raised the rate 1⁄4 percentage point to 11⁄4 percent. The statement accompanying the increase indicated ‘‘that policy accommodation can be removed at a pace that is likely to be measured.’’
In response to the subpar growth that began in mid-2000, very low inflation, and the successive easing of monetary policy, short- and long-term interest rates plummeted from mid-2000 through mid-2003. The rate on 91-day Treasury bills touched 0.8 percent in June 2003, 5 percentage points below its level in June 2000. At its low point in June 2003, the yield on the 10-year Treasury note was 3.2 percent, the lowest level since the late 1950s and 3 percentage points below its level in mid-June 2000. During the past year, rates on Treasuries have fluctuated but have moved up modestly on net.
Rates on private sector financial instruments followed a similar pattern. The rate on 30
year fixed rate mortgages, for example, fell to 5.2 percent in June 2003, the lowest level since the early 1960s. The rate increased subsequently to 6.0 percent by mid-July 2004. Even with this increase, mortgage rates were still historically low: 6.0 percent was lower than the rate in any month from the mid1960s to mid-2002.
Interest-sensitive spending, especially for motor vehicles and housing, benefited enormously from the availability of low-interest loans in 2001–2004. Automakers were able to offer zero-percent financing deals because of their own low cost of borrowing. Homebuyers were able to obtain mortgages at rates not seen in four decades, and millions of homeowners refinanced their mortgages at lower rates, permanently lowering their housing costs while increasing their liquidity
During the past year, interest rates have risen as economic activity has surged, and, recently, as the monetary authorities have begun to signal that they intend gradually to shift away from a highly accommodative stance. Nonetheless, from their mid-2003 lows, short-term Treasury rates have risen only slightly, and the yield on long-term private sector bonds and mortgages has increased by only about 1 percentage point. In mid-July, the 91-day Treasury bill rate was 1.3 percent and the 10-year Treasury yield was 4.5 percent. Historically, these are still very low rates.
Recent Developments
Real gross domestic product (GDP) surged at an average annual rate of 6.2 percent during the second half of 2003, and grew at a 3.9 percent rate during the first quarter of this year. The first official estimate of second quarter growth, along with revisions to 2001–2003, will be released at the end of July and after the Mid-Session Review has been printed. Based on improvements in industrial production, a rapid recovery in the manufacturing sector, and resumed strong job growth, it appears likely that the economy continued to expand at a solid pace in the second quarter.
Forward-looking indicators suggest that future growth is likely to remain strong. During the first half of this year, the Index of
15 ECONOMIC ASSUMPTIONS
Leading Indicators rose 1.5 percent, with eight of the ten components advancing. Significantly for the outlook, in July, the Conference Board Index of Consumer Confidence reached its highest level in two years.
The improving economy is also evident in the business sector. In the second quarter, manufacturing production increased at a 7.1 percent annual rate, the fastest advance since the end of 1999. Surveys of purchasing managers indicate strong growth. As of June, the purchasing managers’ index was above the 60 percent mark for eight consecutive months, the best showing in 20 years. A reading above 50 percent indicates an expanding manufacturing sector.
Business investment in plant and equipment is increasing strongly again and the outlook is bright. The fundamentals underlying capital spending are favorable: sales have accelerated, corporate cash flow is strong, interest rates are low, and the expiration of the bonus depreciation provision at the end of this year provides further incentive for firms to take advantage of the temporary lowering in the after-tax cost of new equipment investment.
Shipments of capital goods in the second quarter were well above the first-quarter average. Equipment spending in the second quarter, after adjustment for inflation, grew at a solid pace following an already-strong 9 percent advance in the first quarter. Nonresidential construction investment, which had been on a downward trend for three years, is beginning to turn around with spending in May well above the first quarter average.
Consumer spending, which accounts for 70 percent of GDP, remains a mainstay of the expansion. In the first quarter of this year, personal consumption, adjusted for inflation, increased at a 3.8 percent annual rate and spending grew further in the second quarter. Home sales, too, have been very strong. In June, combined new and existing home sales reached a record level. Relatively low interest rates, the improving labor market, growing confidence in the future, and the recovery of household wealth has made consumers willing and able to make big-ticket purchases, such as cars, homes, and major home improvement projects. During the year
ending in March 2004, household wealth rose by $5.5 trillion, a 14 percent gain, because of large increases in equity and home prices.
In the labor market, payrolls have increased by 1.5 million since last August, with nearly 1.3 million new jobs being added this year alone. Since June 2003, the number of unemployed persons has fallen by 1 million. Attitudes about job market conditions have improved as well. In July, the Conference Board survey revealed that more people believed that jobs were plentiful than at any time in nearly two years.
In contrast to the early years of the recovery when productivity growth entirely accounted for the increase in GDP, more recently both productivity growth and increased labor hours have contributed to the increased output. From mid-2003 through the first quarter, productivity grew at a 5.1 percent average annual rate in the non-farm business sector at the same time that labor hours increased at a 1.4 percent rate.
The remarkable productivity performance since the end of 2000 may be in part a temporary development that reflects intense cost-cutting by businesses. However, productivity growth has been quite strong since the mid-1990s suggesting that an upward structural shift has taken place. A permanent improvement in productivity growth would be a welcome development: strong productivity growth would eventually translate into strong growth in real wages and our standard of living.
Inflation has picked up this year, largely because of a surge in energy prices caused by a spike in oil prices. During the first six months of this year, the consumer price index (CPI) increased at a 4.9 percent annual rate, up from just 1.9 percent during 2003. Energy prices increased at a 36 percent rate from December to June. Excluding volatile food and energy prices, the core CPI rose at a 2.6 percent annual rate from December to June, which is a step up from the 1.1 percent advance during 2003. The modest uptick in core inflation so far this year may include a transitory component from the passthrough of the recent jump in energy
16 MID–SESSION REVIEW
prices and may also provide further evidence that labor and product markets are firming.
Revised Economic Assumptions
The economic assumptions for the Mid-Session Review (MSR), which were finalized in early June, are summarized in Table 2. The projections for real GDP growth, unemployment, inflation, and interest rates have been revised very little from the 2005 Budget assumptions (after adjusting the assumptions for the comprehensive revisions to GDP and incomes released by the Department of Commerce in late-December).2 The MSR assumptions through 2005 for these key economic variables are quite close to the latest forecasts of the Federal Reserve Governors and Reserve Bank Presidents and the Blue Chip consensus, an average of about 50 private-sector forecasts. From 2006 to 2009, the MSR assumptions are very close to the long-term Blue Chip forecast published in March (see Table 3).
Real GDP, Potential GDP, and Unemployment: Real GDP growth in the fourth quarter of 2003 and the first quarter of this year was close to the Budget assumptions. In light of the growing evidence that the expansion is now on a solid foundation, real GDP growth this year and next has been revised up slightly from the Budget forecast. On a year-over-year basis, real GDP is expected to grow 4.7 percent this year, moderating to 3.7 percent next year. Growth is projected to slow gradually to 3.1 percent in 2009, the Administration’s estimate of the Nation’s long-run potential growth rate. The growth projection beginning with 2006 is the same as in the Budget. During the six years 2004–2009, growth is expected to average 3.6 percent, nearly the same as the Blue Chip consensus. The 3.1 percent estimate of the potential long-run growth rate is unchanged from that in the Budget.
The unemployment rate, currently at a level that is low in historical terms, is projected to continue to decline through 2007 when it is expected to level off at 5.1 percent. That is the center of the range
2The Budget assumptions on a post-revision basis were presented in an Addendum to Table 11–1 in the ‘‘Economic Assumptions,’’ Chapter 11, Analytical Perspectives, FY 2005 Budget.
that is thought to be consistent with stable inflation. The MSR unemployment rate projection is very close to those of the Budget and the Blue Chip consensus.
Inflation: The faster-than-expected inflation so far this year has resulted in an upward revision to the near-term inflation forecast. On a year-over-year basis, the CPI is projected to increase 2.5 percent this year and close to that rate during the subsequent years of the forecast period. The CPI projection is close to that of the Blue Chip consensus. An upward revision also has been made to the projection of the GDP chain-weighted price index.
Interest rates: Interest rates are projected to rise slowly, with short-term rates increasing more than long-term rates, the usual pattern at this stage of the business cycle. The late June decision of the Federal Reserve to raise the Federal funds rate 1⁄4 percentage point is consistent with the gradual increase in short-term rates projected in the MSR. By 2009, the 91-day Treasury bill rate is projected to be 4.4 percent; the yield on the 10-year Treasury note is assumed to be 5.8 percent. The interest rate projections are nearly identical to those in the Budget and the Blue Chip consensus forecasts.
Income Shares: New information contained in the December national income accounts revision and first quarter income data, as well as new forecasts for health insurance costs and employer contributions to defined benefit pension plans, have resulted in significant revisions to the Budget assumptions— projection of income shares. The share of wages and salaries is projected to rise, although not quite as quickly as in the Budget assumptions. New forecasts for health insurance costs and employer contributions to defined benefit pension plans show that these fringe benefit costs are likely to rise more rapidly than expected in the 2005 Budget economic assumptions. Higher fringe benefits tend to moderate the rise in wages and salaries. Because fringe benefits are not taxed, an increase in their share at the expense of the shares of wages and profits tends to reduce the projection of budget revenues.
Corporate profits before tax will also be affected by the temporary bonus depreciation
17 ECONOMIC ASSUMPTIONS
provision, which expires at the end of this year. The provision lowers profits before tax this year compared to what they otherwise would have been. After 2004, corporate taxable profits will increase because the provision expires, and because less capital will remain on the books to depreciate. Taking all these factors into account, the share of corporate profits before tax in GDP is expected to increase sharply in 2005 and then edge down gradually through 2009.
Summary: The economic news during the last half year is highly favorable: growth is strong, more new jobs are being created, and, even following their recent increases, inflation and interest rates remain quite low. For the most part, the 2005 Budget assumptions anticipated these developments. The MSR assumptions, like those of the Budget and the consensus of private-sector forecasts, call for solid growth, falling unemployment, low inflation, and historically low but moderately rising interest rates.
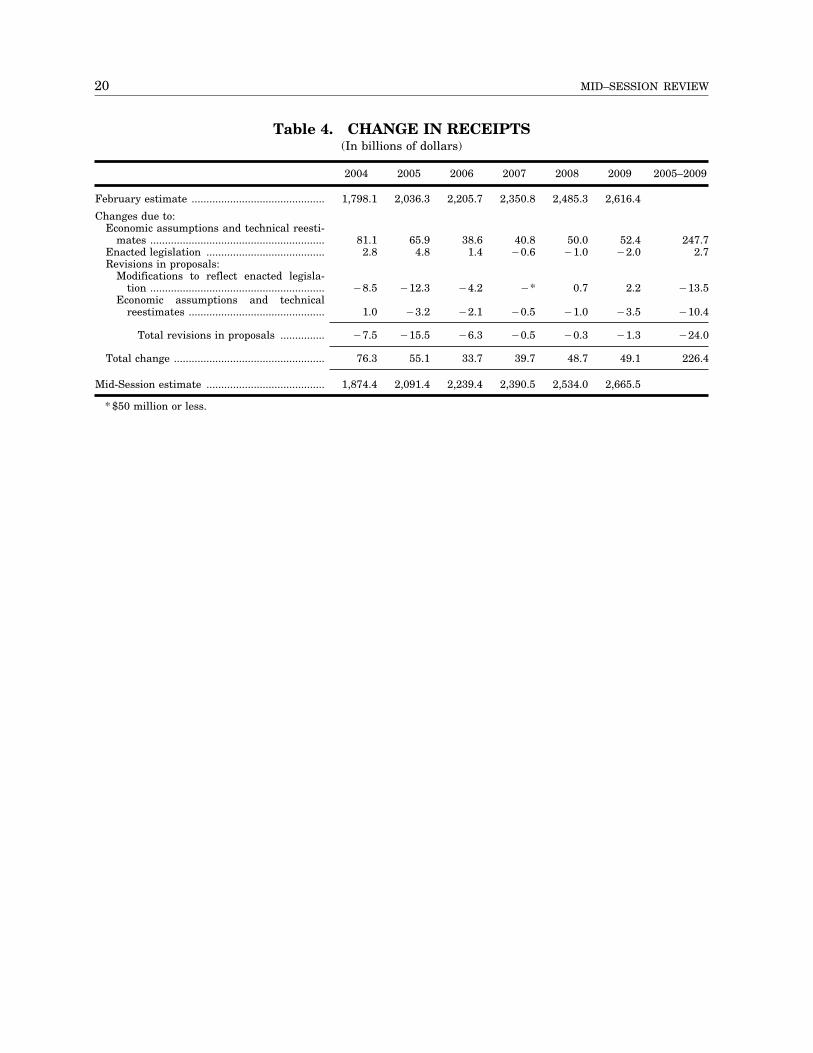
RECEIPTS The current estimates of receipts for 2004
and 2005 exceed the February Budget estimates by $76 billion and $55 billion, respectively. The current estimates for 2006 through 2009 also exceed the February Budget estimates, resulting in receipts that are higher by $226 billion over the five years, 2005 through 2009. These changes are the net effect of revised economic assumptions, technical reestimates, enactment of the Pension Funding Equity Act of 2004, and revisions in the estimates of the Administration’s proposals. In the interest of cautious and prudent forecasting, the February Budget estimates for 2004 and 2005 included downward adjustments in receipts beyond what the economic and receipts models were forecasting. These adjustments reduced receipts by $20 billion in 2004 and $15 billion in 2005. Improved economic conditions and collection experience since February indicate that these adjustments for revenue uncertainty are no longer necessary and their elimination is reflected in the technical reestimates.
Revised economic assumptions and technical reestimates (including elimination of the adjustments for revenue uncertainty) account for most of the revisions in receipts since February, increasing receipts by $81 billion in 2004, $66 billion in 2005, and $248 billion over the five-year period, 2005 through 2009. Removal of the adjustments for revenue uncertainty accounts for $20 billion of the increase in 2004 and $15 billion of the increase in 2005. Higher-than-expected collections of individual and corporation income taxes account for most of the remaining net increase in receipts for both 2004 and 2005. These increases in income tax receipts
are in large part attributable to higher-than-expected individual and corporation income tax liability in tax years 2003 and 2004, as reflected in collection experience since February. The revisions in subsequent years primarily reflect increases in individual income taxes and social security and Medicare payroll taxes attributable in large part to upward revisions in wages and salaries and revisions in estimating models to reflect current collection experience.
The Pension Funding Equity Act, which was signed by President Bush on April 10, 2004, lowered required employer contributions to traditional pension plans for two years, established temporary alternative minimum funding requirements for certain underfunded plans, and allowed certain multiemployer plans to delay temporarily the amortization of specified losses. The provisions of this Act are estimated to increase receipts in each year, 2004 through 2006, but reduce receipts in each subsequent year, 2007 through 2009. Receipts are expected to increase by $3 billion over the five-year period, 2005 through 2009.
Although the Administration is not proposing new tax relief in this Mid-Session Review, the estimated net cost of the Adminis-tration’s proposals has increased by $24 billion over the five years, 2005 through 2009, relative to February. This increase reflects the impact of enactment of the Pension Funding Equity Act on the Administration’s proposal to improve the accuracy of pension liability measures and reestimates of other February Budget initiatives to reflect updated economic assumptions and estimating models.
19
20 MID–SESSION REVIEW
Table 4. CHANGE IN RECEIPTS (In billions of dollars)
2004 2005 2006 2007 2008 2009 2005–2009
February estimate ............................................. 1,798.1 2,036.3 2,205.7 2,350.8 2,485.3 2,616.4
Changes due to: Economic assumptions and technical reesti
mates ........................................................... 81.1 65.9 38.6 40.8 50.0 52.4 247.7 Enacted legislation ........................................ 2.8 4.8 1.4 ¥0.6 ¥1.0 ¥2.0 2.7 Revisions in proposals:
Modifications to reflect enacted legislation ........................................................... ¥8.5 ¥12.3 ¥4.2 ¥* 0.7 2.2 ¥13.5
Economic assumptions and technical reestimates .............................................. 1.0 ¥3.2 ¥2.1 ¥0.5 ¥1.0 ¥3.5 ¥10.4
Total revisions in proposals ............... ¥7.5 ¥15.5 ¥6.3 ¥0.5 ¥0.3 ¥1.3 ¥24.0
Total change ................................................... 76.3 55.1 33.7 39.7 48.7 49.1 226.4
Mid-Session estimate ........................................ 1,874.4 2,091.4 2,239.4 2,390.5 2,534.0 2,665.5
* $50 million or less.
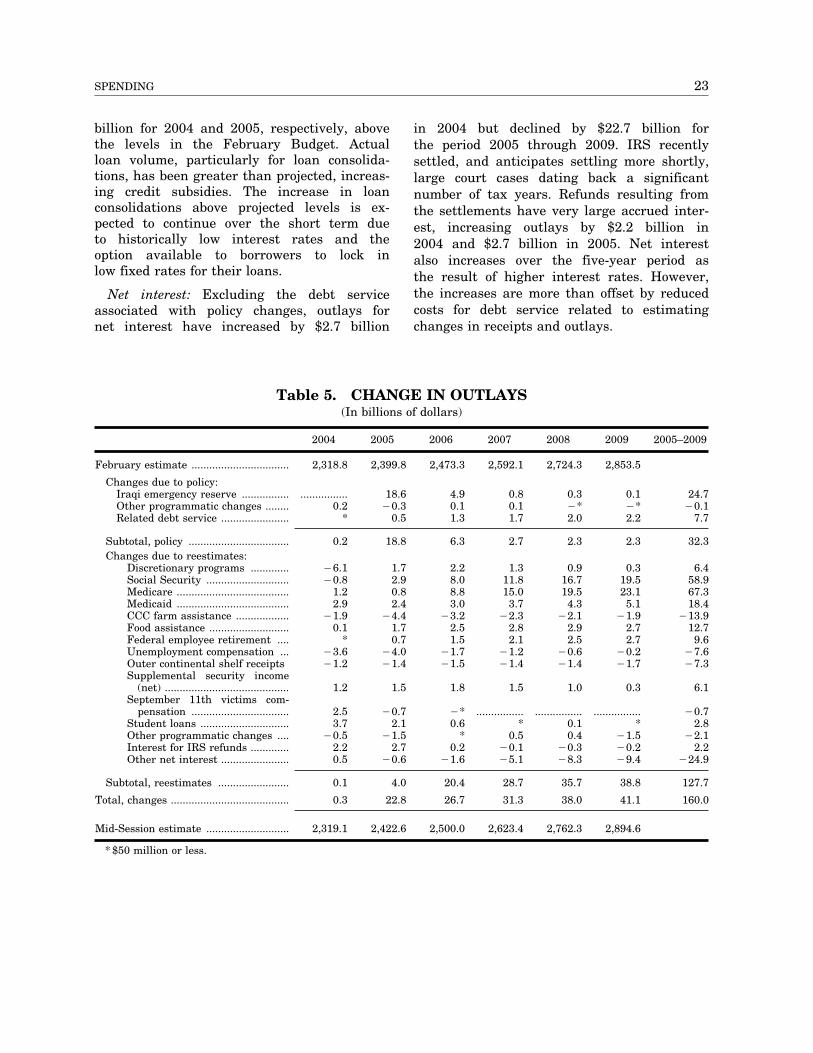
SPENDING Total outlays for 2004 are now estimated
to be $2,319.1 billion, nearly unchanged since the February budget estimate. This is largely the net effect of estimating changes that reduced estimates for discretionary program outlays and increased estimates for mandatory programs and net interest. If this year follows the pattern of recent years, outlays for 2004 are likely to be lower than this estimate when final accounting is available in October (see further explanation on page 4). For 2005, the estimate of total outlays has increased by $22.8 billion relative to February, to $2,422.6 billion. This increase is largely the result of policy changes, primarily the request for additional funding for Iraq and Afghanistan.
Policy changes
In total, policy changes increase outlays by $0.2 billion in 2004 and $18.8 billion in 2005. Over the five-year period 2005 through 2009, policy changes increase outlays by $32.3 billion. Since the transmittal of the Budget, the Administration has requested 2005 contingent emergency reserve funding for operations in Iraq and Afghanistan of $25 billion. Outlays from this funding are estimated to occur over several years raising 2005 outlays by $18.6 billion and 2006 outlays by $4.9 billion. Other policy changes increase outlays by $7.7 billion over the period 2005 through 2009.
Estimating changes
Changes in estimates arise from non-policy related factors including changes in economic assumptions, discussed earlier in this Review, and changes in technical factors. For 2004, estimated outlays are $0.1 billion higher than in February for non-policy related reasons. For 2005, estimated outlays are $4.0 billion higher and over the five-year period 2005 through 2009, they are $127.7 billion higher.
Discretionary appropriations: Outlays for discretionary programs decrease by $6.1 billion in 2004 relative to the February budget
as a result of estimating changes. Most of this reflects changes in the assumed timing of outlays, based largely on experience to date, particularly for international aid programs. Agencies obligated Iraq Relief and Reconstruction Funds at a slower pace than originally anticipated. Recently, agencies have begun obligating these funds at a steady pace. However, since much of the funding will be used for large construction projects of one to two-year duration, payments against these obligations will be spread across months or years. In addition, spending from the economic support fund for the Turkey Financing Facility has been delayed. The Turkish government has not yet ratified the Financing Agreement, which would allow them to begin using the U.S. loans authorized in the Emergency Wartime Supplemental Appropriations Act.
Social Security: Estimated outlays for Social Security are higher than in February by $2.9 billion in 2005 and $58.9 billion over 5 years. Most of the increase is the result of higher projected inflation rates, which increase annual cost of living adjustments.
Medicare: Estimates of Medicare outlays are increased by $67 billion over the five-year period 2005 through 2009. About 39 percent of this increase, or approximately $26 billion, is due to a technical correction made by the actuaries at the Department of Health and Human Services (HHS). The HHS actuaries fully included estimates of the Medicare Advantage provisions in their cost estimate of the Medicare Modernization Act. However, in the FY 2005 Budget, the actuaries did not incorporate some of the estimated cost of Medicare Advantage in their baseline estimates for the entire Medicare program. This is corrected in the MSR. The remaining $41 billion is due to technical and economic changes, including a net projected increase in the Medicare Advantage program, due primarily to new data on beneficiaries’ average health status; the net effect of a variety of factors on drug expenditures, including higher projected usage of the drug
21
22 MID–SESSION REVIEW
benefit because of greater than expected incomes; and updated economic assumptions, including slightly higher medical inflation. The HHS actuaries do not generally reestimate the costs of enacted modifications to the Medicare program, such as the Medicare Modernization Act, once those modifications have been incorporated into their baseline estimates. They have informed OMB, however, that no more than $19 billion of the overall increase in Medicare outlays is likely to be either directly or indirectly related to the Medicare Modernization Act.
Medicaid: As a result of estimating changes, Medicaid outlays are projected to increase by $2.9 billion in 2004, $2.4 billion in 2005, and $18.4 billion over 2005 through 2009 relative to the February estimates. Of the five-year increase, approximately 25 percent is due to changes in economic assumptions, primarily inflationary increases and changes in GDP growth. The remaining increases are largely due to State reestimates of their Medicaid spending. Prescription drugs, home and community-based services, inpatient services, and managed care payments are Medicaid cost drivers that account for most of the increase over the February estimates.
Commodity Credit Corporation (CCC) farm assistance: As a result of estimating assumptions, outlays for CCC farm assistance have decreased by $1.9 billion in 2004, $4.4 billion in 2005, and $13.9 billion over the period 2005 through 2009. This reduction is the result of a revised crop forecast, which projects higher prices for the major agricultural commodities, such as corn, wheat, soybeans, and dairy, than the forecast used to develop the February estimates. When commodity prices are higher than the legislated target rate, payments to farmers for price and income support programs are reduced.
Food assistance: Projected outlays for food assistance programs have increased by $12.7 billion over the five-year period, including $10.2 billion for the food stamp program and $2.4 billion for child nutrition programs. The food stamp program increases result largely from higher projections of increases in the Thrifty Food Plan, which is used to annually adjust food stamp payments, and adjustments to estimating models used
to project the impact of provisions enacted in the 2002 Farm Bill. Child nutrition program increases are due to revised estimates of food price inflation and the number of meals projected to be served.
Federal employee retirement: Projected outlays for Federal employee retirement programs, including both civilian and military personnel, increase by $9.6 billion over five years relative to the February estimates, reflecting higher projected inflation rates, which increase annual cost of living adjustments.
Unemployment compensation: A strengthening labor market has led to a faster than expected decline in the number of unemployment insurance beneficiaries, resulting in outlays for unemployment compensation $3.6 billion below the February estimate for 2004 and $4.0 billion below for 2005.
Outer continental shelf receipts: Increases in projected oil and gas prices increase anticipated receipts from drilling on the outer continental shelf. Because these receipts are recorded as offsets to outlays, the increases reduce projected outlays by $7.3 billion over the five-year period.
Supplemental security income (SSI): Projected outlays for SSI are now $1.2 billion and $1.5 billion higher in 2004 and 2005, respectively, than in the February Budget. A change in the schedule for processing the special disability workload reduces recoveries of benefit overpayments, which increases reported outlays.
September 11th victims compensation: The Special Master administering the September 11th victims compensation fund accelerated award determinations, shifting awards that were assumed to be made in 2005 into 2004. In addition, financial payments to victims’ families have been higher than originally anticipated and the number of eligible beneficiaries, particularly for those physically injured, has been greater than projected in February. In total for all years, payments from the September 11th victims compensation fund are now estimated to be $7.2 billion, $1.8 billion over the February estimate.
Student loans: Outlays for student loans are now projected at $3.7 billion and $2.1
23 SPENDING
billion for 2004 and 2005, respectively, above the levels in the February Budget. Actual loan volume, particularly for loan consolidations, has been greater than projected, increasing credit subsidies. The increase in loan consolidations above projected levels is expected to continue over the short term due to historically low interest rates and the option available to borrowers to lock in low fixed rates for their loans.
Net interest: Excluding the debt service associated with policy changes, outlays for net interest have increased by $2.7 billion
in 2004 but declined by $22.7 billion for the period 2005 through 2009. IRS recently settled, and anticipates settling more shortly, large court cases dating back a significant number of tax years. Refunds resulting from the settlements have very large accrued interest, increasing outlays by $2.2 billion in 2004 and $2.7 billion in 2005. Net interest also increases over the five-year period as the result of higher interest rates. However, the increases are more than offset by reduced costs for debt service related to estimating changes in receipts and outlays.
Table 5. CHANGE IN OUTLAYS (In billions of dollars)
2004 2005 2006 2007 2008 2009 2005–2009
February estimate ................................. 2,318.8 2,399.8 2,473.3 2,592.1 2,724.3 2,853.5
Changes due to policy: Iraqi emergency reserve ................ ................Other programmatic changes ........ 0.2Related debt service ....................... *
18.6 4.9 0.8 0.3 0.1 24.7 ¥0.3 0.1 0.1 ¥* ¥* ¥0.1
0.5 1.3 1.7 2.0 2.2 7.7
Subtotal, policy .................................. Changes due to reestimates:
Discretionary programs ............. Social Security ............................ Medicare ...................................... Medicaid ...................................... CCC farm assistance .................. Food assistance ........................... Federal employee retirement .... Unemployment compensation ... Outer continental shelf receipts Supplemental security income
(net) .......................................... September 11th victims com
pensation ................................. Student loans .............................. Other programmatic changes .... Interest for IRS refunds ............. Other net interest .......................
0.2
¥6.1 ¥0.8
1.2 2.9
¥1.9 0.1
* ¥3.6 ¥1.2
1.2
2.5 3.7
¥0.5 2.2 0.5
18.8
1.7 2.9 0.8 2.4
¥4.4 1.7 0.7
¥4.0 ¥1.4
1.5
¥0.7 2.1
¥1.5 2.7
¥0.6
6.3
2.2 8.0 8.8 3.0
¥3.2 2.5 1.5
¥1.7 ¥1.5
1.8
¥* 0.6
* 0.2
¥1.6
2.7
1.3 11.8 15.0
3.7 ¥2.3
2.8 2.1
¥1.2 ¥1.4
1.5
................ *
0.5 ¥0.1 ¥5.1
2.3 2.3 32.3
0.9 0.3 6.4 16.7 19.5 58.9 19.5 23.1 67.3 4.3 5.1 18.4
¥2.1 ¥1.9 ¥13.9 2.9 2.7 12.7 2.5 2.7 9.6
¥0.6 ¥0.2 ¥7.6 ¥1.4 ¥1.7 ¥7.3
1.0 0.3 6.1
................ ................ ¥0.70.1 * 2.8 0.4 ¥1.5 ¥2.1
¥0.3 ¥0.2 2.2 ¥8.3 ¥9.4 ¥24.9
Subtotal, reestimates ........................ 0.1 4.0 20.4 28.7 35.7 38.8 127.7
Total, changes ........................................ 0.3 22.8 26.7 31.3 38.0 41.1 160.0
Mid-Session estimate ............................ 2,319.1 2,422.6 2,500.0 2,623.4 2,762.3 2,894.6
* $50 million or less.
SUMMARY TABLES
25
SUMMARY TABLES
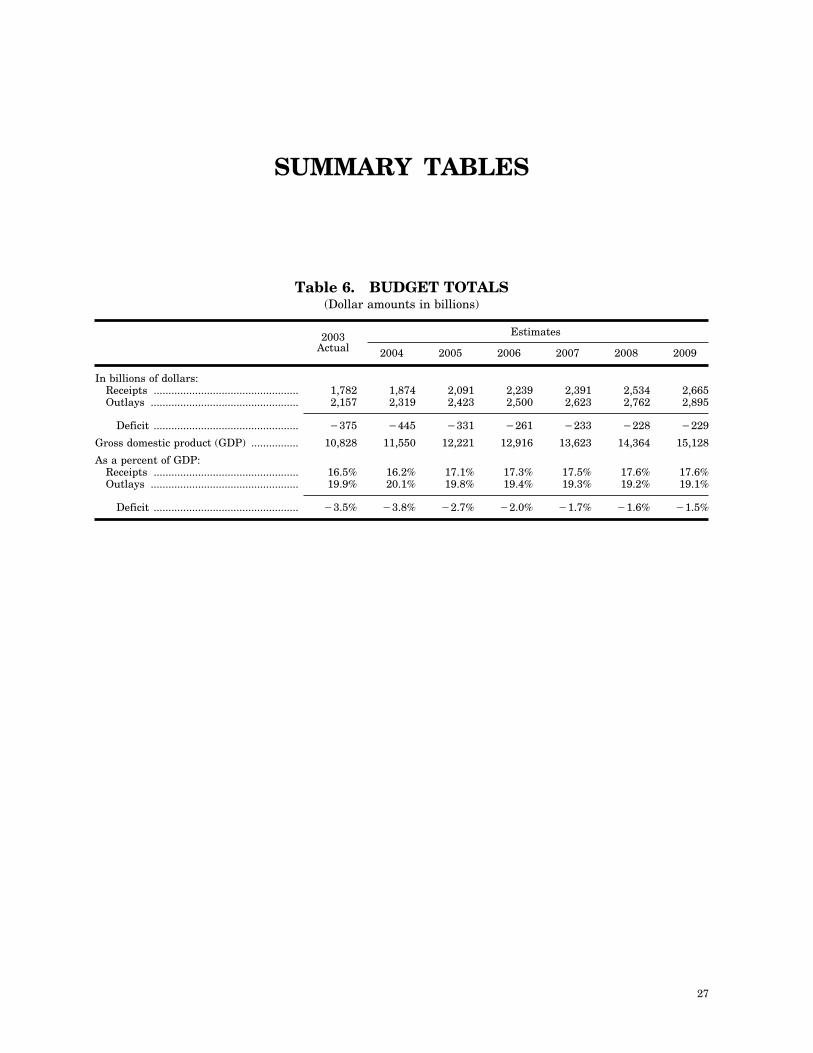
Table 6. BUDGET TOTALS (Dollar amounts in billions)
2003 Estimates Actual 2004 2005 2006 2007 2008 2009
In billions of dollars: Receipts ................................................. 1,782 1,874 2,091 2,239 2,391 2,534 2,665 Outlays .................................................. 2,157 2,319 2,423 2,500 2,623 2,762 2,895
Deficit ................................................. ¥375 ¥445 ¥331 ¥261 ¥233 ¥228 ¥229
Gross domestic product (GDP) ................ 10,828 11,550 12,221 12,916 13,623 14,364 15,128
As a percent of GDP: Receipts ................................................. 16.5% 16.2% 17.1% 17.3% 17.5% 17.6% 17.6% Outlays .................................................. 19.9% 20.1% 19.8% 19.4% 19.3% 19.2% 19.1%
Deficit ................................................. ¥3.5% ¥3.8% ¥2.7% ¥2.0% ¥1.7% ¥1.6% ¥1.5%
27
28 MID–SESSION REVIEW
Table 7. CHANGES FROM APRIL 2001 PROJECTION (In billions of dollars)
2001 Actual 2002 Actual 2003 Actual 2004 Estimate 2001–2004
Percent Percent Percent Percent Percent Amount of total Amount of total Amount of total Amount of total Amount of total
change change change change change
April 2001 Baseline surplus projection ................................ 284 ............ 283 ............ 334 ............ 387 ............ 1,288 ..............
Economic and technical reestimates: Receipts ............................... ¥79 50 ¥288 65 ¥404 57 ¥333 40 ¥1,104 52 Outlays ................................ ¥3 2 ¥4 1 58 ¥8 8 ¥1 58 ¥3
Enacted policy: Tax relief:
2001 tax relief ................. ¥69 44 ¥41 9 ¥94 13 ¥119 14 ¥324 15 2002 stimulus act ........... ........... ............ ¥52 12 ¥38 5 ¥30 4 ¥121 6 2003 jobs and growth act ........... ............ ........... ............ ¥36 5 ¥141 17 ¥176 8
War, homeland, and other enacted legislation .......... ¥6 4 ¥55 12 ¥194 27 ¥216 26 ¥470 22
Pending budget proposals ..... ........... ............ ........... ............ ........... ............ ¥1 * ¥1 *
Total change ....................... ¥157 100 ¥441 100 ¥709 100 ¥832 100 ¥2,137 100
2005 Mid-session policy deficit 127 ............ ¥158 ............ ¥375 ............ ¥445 ............ ¥850 ..............
Note: Each change includes associated debt service. * 0.5 percent or less.
29 SUMMARY TABLES
Table 8. DISCRETIONARY TOTALS (Budget authority; dollar amounts in billions)
2001
Actual
2002 2003 2004
Estimate 2005
Request 2004–2005
Dollar change
Discretionary budget authority:
Homeland Security (non-Defense) ........................ 10 13 24 28 30 3 Department of Defense ......................................... 303 328 365 375 402 26 Other Operations of Government ......................... 331 351 370 385 387 2
Total, Discretionary budget authority ............. 644 691 758 788 819 31
Percent change by category:
Homeland Security (non-Defense) ........................ 13.9% 21.5% 84.9% 18.2% 9.7% Department of Defense ......................................... 5.3% 8.3% 11.5% 2.7% 7.1% Other Operations of Government ......................... 14.9% 6.0% 5.4% 4.2% 0.4%
Total, Percent change ............................................... 10.2% 7.3% 9.8% 3.9% 3.9%
Supplementals:
Homeland Security ................................................Defense and Other Global War on Terror 1 .........Non-Defense, Non-Homeland ...............................
3 12 6 * ................ 14 18 80 87 25 3 14 5 * ................
Total, Supplemental funding .............................. 20 44 91 87 25
Discretionary budget authority:
Homeland Security (non-Defense) .................... 13 24 30 28 30 3 Department of Defense ...................................... 317 346 446 462 427 ¥35 Other Operations of Government ..................... 334 365 374 385 387 1
Total, Discretionary budget authority with supplementals ..................................................... 664 735 849 875 844 Ø31
Percent change by category with supplementals:
Homeland Security (non-Defense) ........................ 41.6% 86.3% 21.8% ¥5.5% 9.3% Department of Defense ......................................... 10.3% 9.1% 28.9% 3.7% ¥7.7% Other Operations of Government ......................... 16.0% 9.2% 2.6% 3.0% 0.4%
Total, Percent change ............................................... 13.6% 10.7% 15.6% 3.1% ¥3.6%
* $0.5 billion or less. 1 The 2005 level reflects the Administration’s request for a $25 billion contingency reserve for continuing operations in
Iraq and Afghanistan.
30 MID–SESSION REVIEW
Table 9. AGENCY GROWTH IN DISCRETIONARY SPENDING (Budget authority in billions of dollars)
Actuals Growth
Agency 2001 2002 2003
2004 Estimate
2005 Request 2004–05 2001–05
Average 2001–05
CumulativeChange Percent
Agriculture ................................. 19.2 20.1 21.7 21.0 19.1 ¥1.9 ¥9.2% ¥0.2% ¥0.9% Commerce ................................... 5.1 5.4 5.6 5.8 5.7 ¥0.1 ¥1.0% 2.9% 12.1% Defense ....................................... 302.5 327.8 365.3 375.3 401.7 26.5 7.1% 7.3% 32.8% Education ................................... 40.1 48.5 53.1 55.7 57.3 1.7 3.0% 9.3% 43.0% Energy ........................................ 20.0 20.9 22.0 23.3 23.6 0.3 1.4% 4.2% 17.9% Health and Human Services .... 54.0 59.5 65.7 69.3 68.2 ¥1.1 ¥1.6% 6.0% 26.2% Homeland Security .................... 14.0 15.7 21.9 27.1 28.3 1.3 4.6% 19.3% 102.3% Housing and Urban Develop
ment ........................................ 28.4 29.4 30.1 31.0 31.3 0.3 1.0% 2.5% 10.3% Interior ....................................... 10.3 10.5 10.5 10.6 10.8 0.2 1.6% 1.3% 5.3% Justice ........................................ 18.4 18.6 19.0 19.3 18.7 ¥0.6 ¥3.1% 0.5% 2.1% Labor .......................................... 11.9 12.1 11.8 11.7 11.9 0.2 1.9% ¥0.1% ¥0.4% State and International Assist
ance Programs ........................ 20.3 21.7 22.8 24.9 29.6 4.7 18.7% 9.9% 45.7% Transportation ........................... 14.6 12.8 13.5 13.9 13.3 ¥0.5 ¥3.9% ¥2.1% ¥8.3% Treasury ..................................... 10.3 10.5 10.7 11.2 11.3 0.1 1.3% 2.3% 9.6% Veterans Affairs ......................... 22.4 23.8 26.4 29.1 29.7 0.5 1.8% 7.3% 32.5% Corps of Engineers .................... 4.7 4.5 4.6 4.6 4.0 ¥0.6 ¥13.0% ¥4.1% ¥15.3% Environmental Protection
Agency ..................................... 7.8 7.9 8.1 8.4 7.8 ¥0.6 ¥7.2% ¥0.2% ¥1.0% Executive Office of the Presi
dent ......................................... 0.3 0.3 0.3 0.3 0.3 0.0 0.5% 6.8% 30.2% Judiciary Branch ....................... 4.0 4.3 4.6 4.9 5.4 0.5 10.3% 7.8% 35.2% Legislative Branch ..................... 2.8 3.0 3.4 3.6 4.0 0.4 12.4% 9.8% 45.5% National Aeronautics and
Space Administration ............ 14.3 14.8 15.3 15.4 16.2 0.9 5.6% 3.3% 14.0% National Science Foundation .... 4.4 4.8 5.3 5.6 5.7 0.2 3.0% 6.7% 29.7% Social Security Administration 6.0 6.4 6.7 7.2 7.6 0.4 5.9% 5.9% 25.8% Other Agencies ........................... 8.1 7.7 10.0 9.2 7.4 ¥1.8 ¥19.8% ¥2.3% ¥8.8%
Total, Discretionary Spending ........................................... 643.8 691.0 758.5 788.1 819.0 30.9 3.9% 6.2% 27.2%
Emergency Response Funds and Supplementals ........................ 20.0 43.8 90.9 87.3 25.0
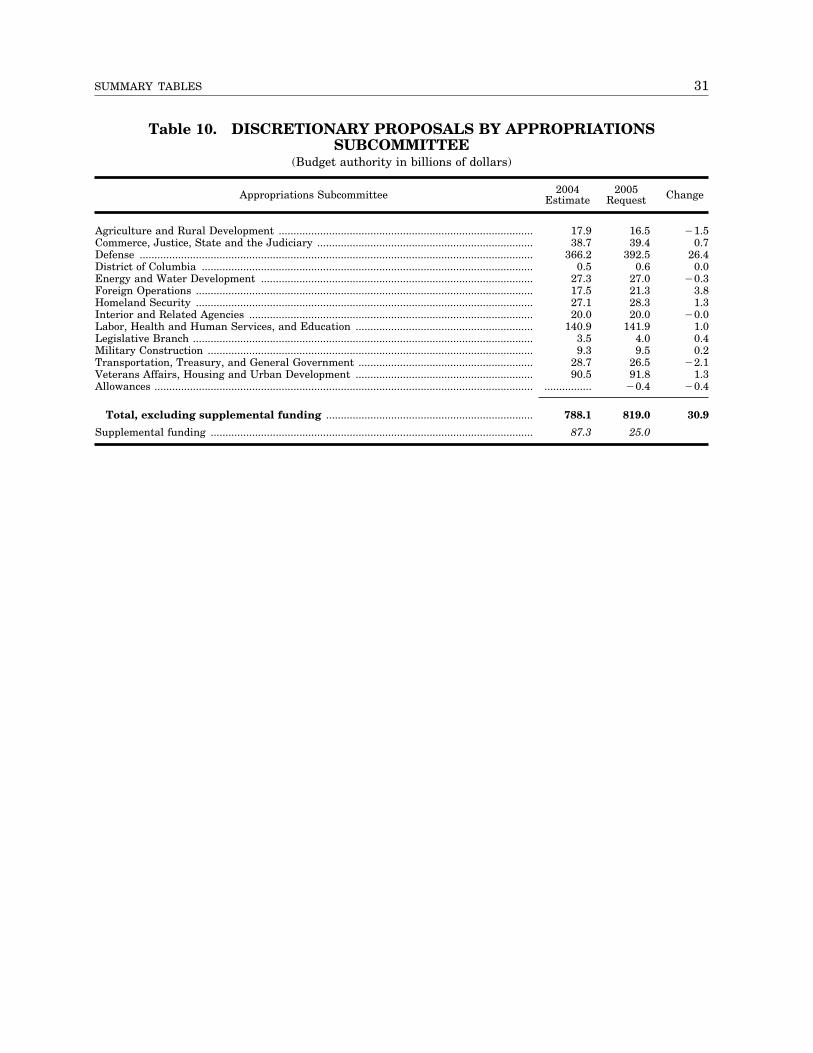
SUMMARY TABLES 31
Table 10. DISCRETIONARY PROPOSALS BY APPROPRIATIONS SUBCOMMITTEE
(Budget authority in billions of dollars)
Appropriations Subcommittee 2004 Estimate
2005 Request Change
Agriculture and Rural Development ...................................................................................... 17.9 16.5 ¥1.5 Commerce, Justice, State and the Judiciary ......................................................................... 38.7 39.4 0.7 Defense ..................................................................................................................................... 366.2 392.5 26.4 District of Columbia ................................................................................................................ 0.5 0.6 0.0 Energy and Water Development ............................................................................................ 27.3 27.0 ¥0.3 Foreign Operations .................................................................................................................. 17.5 21.3 3.8 Homeland Security .................................................................................................................. 27.1 28.3 1.3 Interior and Related Agencies ................................................................................................ 20.0 20.0 ¥0.0 Labor, Health and Human Services, and Education ............................................................ 140.9 141.9 1.0 Legislative Branch ................................................................................................................... 3.5 4.0 0.4 Military Construction .............................................................................................................. 9.3 9.5 0.2 Transportation, Treasury, and General Government ........................................................... 28.7 26.5 ¥2.1 Veterans Affairs, Housing and Urban Development ............................................................ 90.5 91.8 1.3 Allowances ................................................................................................................................ ................ ¥0.4 ¥0.4
Total, excluding supplemental funding ...................................................................... 788.1 819.0 30.9
Supplemental funding ............................................................................................................. 87.3 25.0
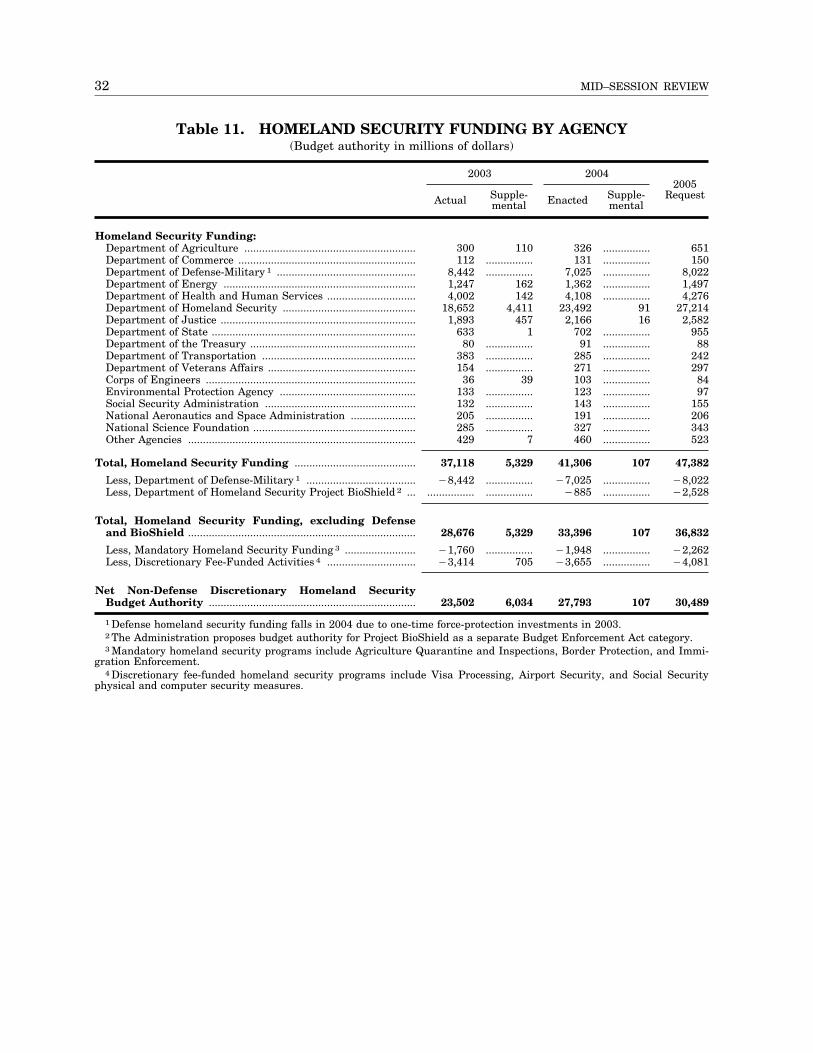
32
2005
MID–SESSION REVIEW
Table 11. HOMELAND SECURITY FUNDING BY AGENCY (Budget authority in millions of dollars)
Homeland Security Funding: Department of Agriculture ..........................................................Department of Commerce ............................................................Department of Defense-Military 1 ...............................................Department of Energy .................................................................Department of Health and Human Services ..............................Department of Homeland Security .............................................Department of Justice ..................................................................Department of State .....................................................................Department of the Treasury ........................................................Department of Transportation ....................................................Department of Veterans Affairs ..................................................Corps of Engineers .......................................................................Environmental Protection Agency ..............................................Social Security Administration ...................................................National Aeronautics and Space Administration ......................National Science Foundation .......................................................Other Agencies .............................................................................
Total, Homeland Security Funding .........................................
Less, Department of Defense-Military 1 ..................................... Less, Department of Homeland Security Project BioShield 2 ...
Total, Homeland Security Funding, excluding Defense and BioShield .............................................................................
Less, Mandatory Homeland Security Funding 3 ........................Less, Discretionary Fee-Funded Activities 4 ..............................
Net Non-Defense Discretionary Homeland Security Budget Authority ......................................................................
2003 2004
Actual Supple- Enacted Supple- Request mental mental
300 110112 ................
8,442 ................1,247 1624,002 142
18,652 4,4111,893 457
633 180 ................
383 ................154 ................
36 39133 ................132 ................205 ................285 ................429 7
326 ................ 651131 ................ 150
7,025 ................ 8,0221,362 ................ 1,4974,108 ................ 4,276
23,492 91 27,2142,166 16 2,582
702 ................ 95591 ................ 88
285 ................ 242271 ................ 297103 ................ 84123 ................ 97143 ................ 155191 ................ 206327 ................ 343460 ................ 523
37,118 5,329 41,306 107 47,382
¥8,442 ................ ¥7,025 ................ ¥8,022................ ................ ¥885 ................ ¥2,528
28,676 5,329 33,396 107 36,832
¥1,760 ................ ¥1,948 ................ ¥2,262¥3,414 705 ¥3,655 ................ ¥4,081
23,502 6,034 27,793 107 30,489
1 Defense homeland security funding falls in 2004 due to one-time force-protection investments in 2003. 2 The Administration proposes budget authority for Project BioShield as a separate Budget Enforcement Act category. 3 Mandatory homeland security programs include Agriculture Quarantine and Inspections, Border Protection, and Immi
gration Enforcement. 4 Discretionary fee-funded homeland security programs include Visa Processing, Airport Security, and Social Security
physical and computer security measures.
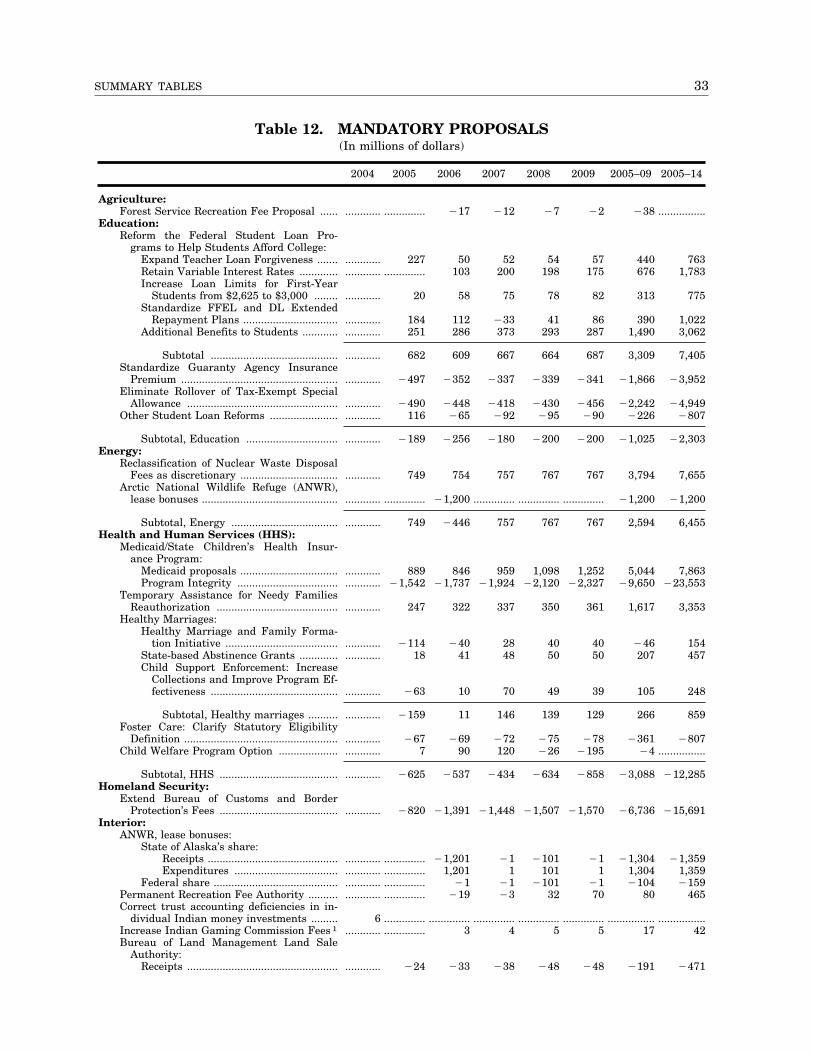
33 SUMMARY TABLES
Table 12. MANDATORY PROPOSALS (In millions of dollars)
2004 2005 2006 2007 2008 2009 2005–09 2005–14
Agriculture: Forest Service Recreation Fee Proposal ...... ............ .............. ¥17 ¥12 ¥7 ¥2 ¥38 ................
Education: Reform the Federal Student Loan Pro
grams to Help Students Afford College: Expand Teacher Loan Forgiveness ....... ............ 227 50 52 54 57 440 763 Retain Variable Interest Rates ............. ............ .............. 103 200 198 175 676 1,783 Increase Loan Limits for First-Year
Students from $2,625 to $3,000 ........ ............ 20 58 75 78 82 313 775 Standardize FFEL and DL Extended
Repayment Plans ................................ ............ 184 112 ¥33 41 86 390 1,022 Additional Benefits to Students ............ ............ 251 286 373 293 287 1,490 3,062
Subtotal ........................................... ............ 682 609 667 664 687 3,309 7,405 Standardize Guaranty Agency Insurance
Premium ..................................................... ............ ¥497 ¥352 ¥337 ¥339 ¥341 ¥1,866 ¥3,952 Eliminate Rollover of Tax-Exempt Special
Allowance ................................................... ............ ¥490 ¥448 ¥418 ¥430 ¥456 ¥2,242 ¥4,949 Other Student Loan Reforms ....................... ............ 116 ¥65 ¥92 ¥95 ¥90 ¥226 ¥807
Subtotal, Education ............................... ............ ¥189 ¥256 ¥180 ¥200 ¥200 ¥1,025 ¥2,303Energy:
Reclassification of Nuclear Waste Disposal Fees as discretionary ................................. ............ 749 754 757 767 767 3,794 7,655
Arctic National Wildlife Refuge (ANWR), lease bonuses .............................................. ............ .............. ¥1,200 .............. .............. .............. ¥1,200 ¥1,200
Subtotal, Energy .................................... ............ 749 ¥446 757 767 767 2,594 6,455Health and Human Services (HHS):
Medicaid/State Children’s Health Insurance Program:
Medicaid proposals ................................. ............ 889 846 959 1,098 1,252 5,044 7,863 Program Integrity .................................. ............ ¥1,542 ¥1,737 ¥1,924 ¥2,120 ¥2,327 ¥9,650 ¥23,553
Temporary Assistance for Needy Families Reauthorization ......................................... ............ 247 322 337 350 361 1,617 3,353
Healthy Marriages: Healthy Marriage and Family Forma
tion Initiative ...................................... ............ ¥114 ¥40 28 40 40 ¥46 154 State-based Abstinence Grants ............. ............ 18 41 48 50 50 207 457 Child Support Enforcement: Increase
Collections and Improve Program Effectiveness ........................................... ............ ¥63 10 70 49 39 105 248
Subtotal, Healthy marriages .......... ............ ¥159 11 146 139 129 266 859 Foster Care: Clarify Statutory Eligibility
Definition .................................................... ............ ¥67 ¥69 ¥72 ¥75 ¥78 ¥361 ¥807 Child Welfare Program Option .................... ............ 7 90 120 ¥26 ¥195 ¥4 ................
Subtotal, HHS ........................................ ............ ¥625 ¥537 ¥434 ¥634 ¥858 ¥3,088 ¥12,285 Homeland Security:
Extend Bureau of Customs and Border Protection’s Fees ........................................ ............ ¥820 ¥1,391 ¥1,448 ¥1,507 ¥1,570 ¥6,736 ¥15,691
Interior: ANWR, lease bonuses:
State of Alaska’s share: Receipts ............................................ ............ .............. ¥1,201 ¥1 ¥101 ¥1 ¥1,304 ¥1,359 Expenditures ................................... ............ .............. 1,201 1 101 1 1,304 1,359
Federal share .......................................... ............ .............. ¥1 ¥1 ¥101 ¥1 ¥104 ¥159 Permanent Recreation Fee Authority .......... ............ .............. ¥19 ¥3 32 70 80 465 Correct trust accounting deficiencies in in
dividual Indian money investments ......... 6 .............. .............. .............. .............. .............. ................ ................ Increase Indian Gaming Commission Fees 1 ............ .............. 3 4 5 5 17 Bureau of Land Management Land Sale
Authority: Receipts ................................................... ............ ¥24 ¥33 ¥38 ¥48 ¥48 ¥191 ¥471
42
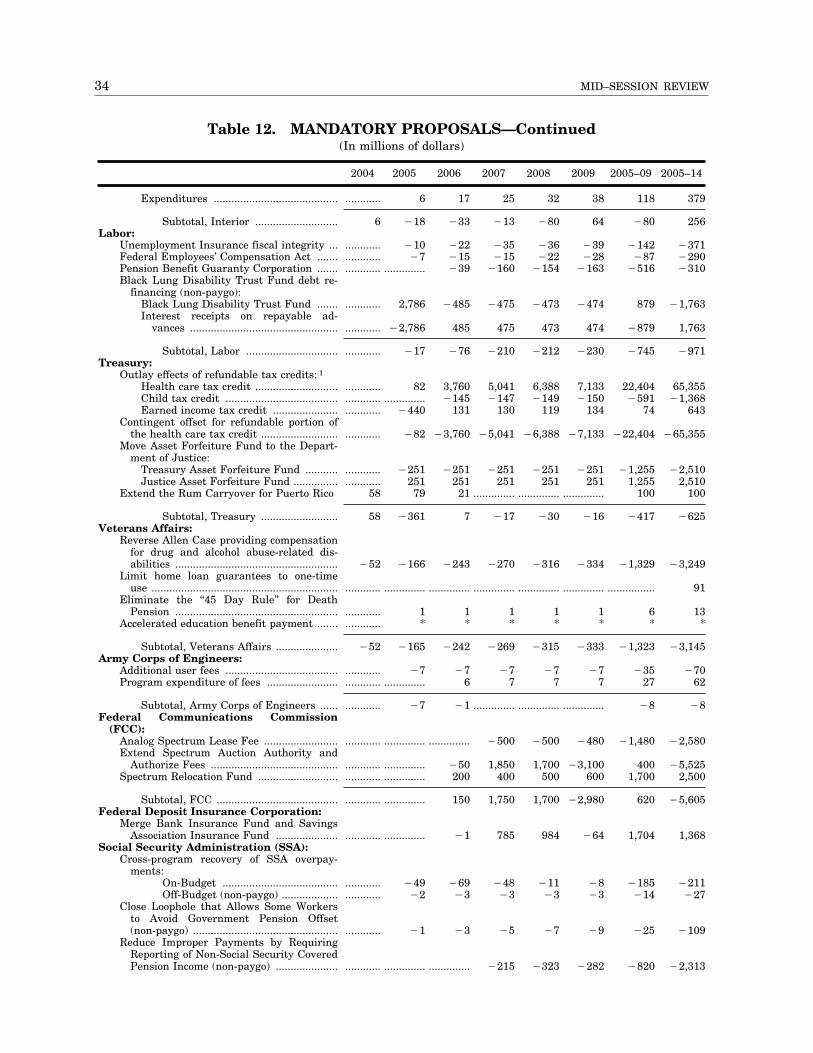
34 MID–SESSION REVIEW
Table 12. MANDATORY PROPOSALS—Continued (In millions of dollars)
2004 2005 2006 2007 2008 2009 2005–09 2005–14
Expenditures .......................................... ............ 6 17 25 32 38 118 379
Subtotal, Interior ............................ 6 ¥18 ¥33 ¥13 ¥80 64 ¥80 256Labor:
Unemployment Insurance fiscal integrity ... ............ ¥10 ¥22 ¥35 ¥36 ¥39 ¥142 ¥371 Federal Employees’ Compensation Act ....... ............ ¥7 ¥15 ¥15 ¥22 ¥28 ¥87 ¥290 Pension Benefit Guaranty Corporation ....... ............ .............. ¥39 ¥160 ¥154 ¥163 ¥516 ¥310 Black Lung Disability Trust Fund debt re
financing (non-paygo): Black Lung Disability Trust Fund ....... ............ 2,786 ¥485 ¥475 ¥473 ¥474 879 ¥1,763Interest receipts on repayable ad
vances .................................................. ............ ¥2,786 485 475 473 474 ¥879 1,763
Subtotal, Labor ............................... ............ ¥17 ¥76 ¥210 ¥212 ¥230 ¥745 ¥971 Treasury:
Outlay effects of refundable tax credits: 1
Health care tax credit ............................ ............ 82 3,760 5,041 6,388 7,133 22,404 65,355 Child tax credit ...................................... ............ .............. ¥145 ¥147 ¥149 ¥150 ¥591 ¥1,368 Earned income tax credit ...................... ............ ¥440 131 130 119 134 74 643
Contingent offset for refundable portion of the health care tax credit .......................... ............ ¥82 ¥3,760 ¥5,041 ¥6,388 ¥7,133 ¥22,404 ¥65,355
Move Asset Forfeiture Fund to the Department of Justice:
Treasury Asset Forfeiture Fund ........... ............ ¥251 ¥251 ¥251 ¥251 ¥251 ¥1,255 ¥2,510 Justice Asset Forfeiture Fund ............... ............ 251 251 251 251 251 1,255 2,510
Extend the Rum Carryover for Puerto Rico 58 79 21 .............. .............. .............. 100 100
Subtotal, Treasury .......................... 58 ¥361 7 ¥17 ¥30 ¥16 ¥417 ¥625 Veterans Affairs:
Reverse Allen Case providing compensation for drug and alcohol abuse-related disabilities ....................................................... ¥52 ¥166 ¥243 ¥270 ¥316 ¥334 ¥1,329 ¥3,249
Limit home loan guarantees to one-time use ............................................................... ............ .............. .............. .............. .............. .............. ................ 91
Eliminate the ‘‘45 Day Rule’’ for Death Pension ....................................................... ............ 1 1 1 1 1 6 13
Accelerated education benefit payment ....... ............ * * * * * * *
Subtotal, Veterans Affairs ..................... ¥52 ¥165 ¥242 ¥269 ¥315 ¥333 ¥1,323 ¥3,145Army Corps of Engineers:
Additional user fees ...................................... ............ ¥7 ¥7 ¥7 ¥7 ¥7 ¥35 ¥70Program expenditure of fees ........................ ............ .............. 6 7 7 7 27
Subtotal, Army Corps of Engineers ...... ............ ¥7 ¥1 .............. .............. .............. ¥8 ¥8Federal Communications Commission
(FCC): Analog Spectrum Lease Fee ......................... ............ .............. .............. ¥500 ¥500 ¥480 ¥1,480 ¥2,580 Extend Spectrum Auction Authority and
Authorize Fees ........................................... ............ .............. ¥50 1,850 1,700 ¥3,100 400 ¥5,525 Spectrum Relocation Fund ........................... ............ .............. 200 400 500 600 1,700 2,500
Subtotal, FCC ......................................... ............ .............. 150 1,750 1,700 ¥2,980 620 ¥5,605Federal Deposit Insurance Corporation:
Merge Bank Insurance Fund and Savings Association Insurance Fund ..................... ............ .............. ¥1 785 984 ¥64 1,704 1,368
Social Security Administration (SSA): Cross-program recovery of SSA overpay
ments: On-Budget ....................................... ............ ¥49 ¥69 ¥48 ¥11 ¥8 ¥185 ¥211 Off-Budget (non-paygo) ................... ............ ¥2 ¥3 ¥3 ¥3 ¥3 ¥14 ¥27
Close Loophole that Allows Some Workers to Avoid Government Pension Offset (non-paygo) ................................................. ............ ¥1 ¥3 ¥5 ¥7 ¥9 ¥25 ¥109
Reduce Improper Payments by Requiring Reporting of Non-Social Security Covered Pension Income (non-paygo) ..................... ............ .............. .............. ¥215 ¥323 ¥282 ¥820 ¥2,313
62
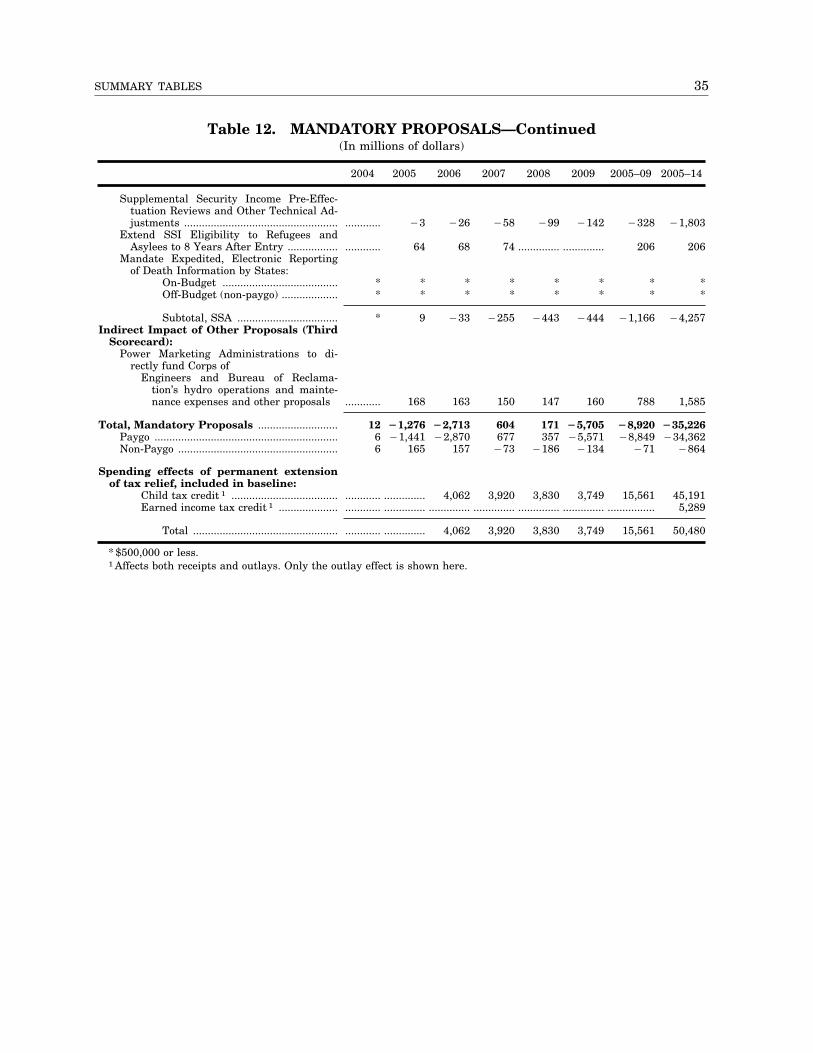
35 SUMMARY TABLES
Table 12. MANDATORY PROPOSALS—Continued (In millions of dollars)
2004 2005 2006 2007 2008 2009 2005–09 2005–14
Supplemental Security Income Pre-Effec-tuation Reviews and Other Technical Adjustments .................................................... ............ ¥3 ¥26 ¥58 ¥99 ¥142 ¥328 ¥1,803
Extend SSI Eligibility to Refugees and Asylees to 8 Years After Entry ................. ............ 64 68 74 .............. .............. 206 206
Mandate Expedited, Electronic Reporting of Death Information by States:
On-Budget ....................................... * * * * * * * *Off-Budget (non-paygo) ................... * * * * * * * *
Subtotal, SSA .................................. * 9 ¥33 ¥255 ¥443 ¥444 ¥1,166 ¥4,257 Indirect Impact of Other Proposals (Third
Scorecard): Power Marketing Administrations to di
rectly fund Corps of Engineers and Bureau of Reclama-
tion’s hydro operations and maintenance expenses and other proposals ............ 168 163 150 147 160 788 1,585
Total, Mandatory Proposals ........................... 12 Ø1,276 Ø2,713 604 171 Ø5,705 Ø8,920 Ø35,226 Paygo .............................................................. 6 ¥1,441 ¥2,870 677 357 ¥5,571 ¥8,849 ¥34,362 Non-Paygo ...................................................... 6 165 157 ¥73 ¥186 ¥134 ¥71 ¥864
Spending effects of permanent extension of tax relief, included in baseline:
Child tax credit 1 .................................... ............ .............. 4,062 3,920 3,830 3,749 15,561 45,191 Earned income tax credit 1 .................... ............ .............. .............. .............. .............. .............. ................ 5,289
Total ................................................. ............ .............. 4,062 3,920 3,830 3,749 15,561 50,480
* $500,000 or less.1 Affects both receipts and outlays. Only the outlay effect is shown here.
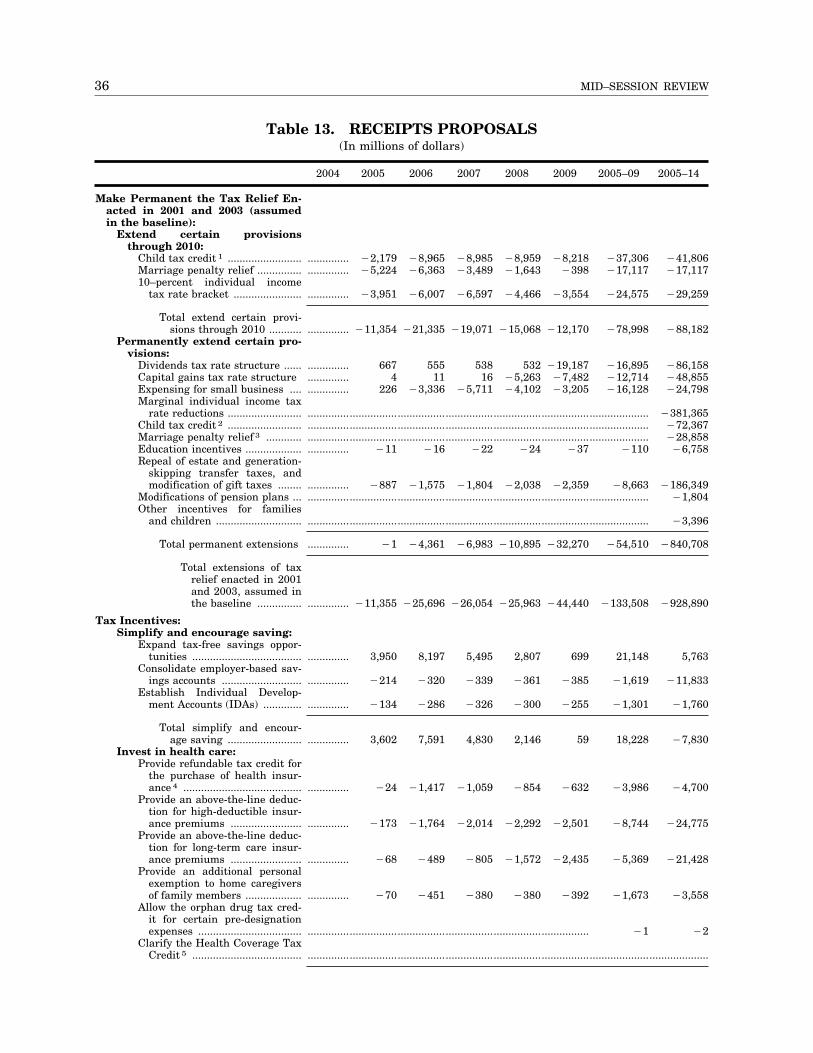
36 MID–SESSION REVIEW
Table 13. RECEIPTS PROPOSALS (In millions of dollars)
2004 2005 2006 2007 2008 2009 2005–09 2005–14
Make Permanent the Tax Relief Enacted in 2001 and 2003 (assumed in the baseline):
Extend certain provisions through 2010:
Child tax credit 1 ......................... .............. ¥2,179 ¥8,965 ¥8,985 ¥8,959 ¥8,218 ¥37,306 ¥41,806 Marriage penalty relief ............... .............. ¥5,224 ¥6,363 ¥3,489 ¥1,643 ¥398 ¥17,117 ¥17,117 10–percent individual income
tax rate bracket ....................... .............. ¥3,951 ¥6,007 ¥6,597 ¥4,466 ¥3,554 ¥24,575 ¥29,259
Total extend certain provisions through 2010 ........... .............. ¥11,354 ¥21,335 ¥19,071 ¥15,068 ¥12,170 ¥78,998 ¥88,182
Permanently extend certain provisions:
Dividends tax rate structure ...... .............. 667 555 538 532 ¥19,187 ¥16,895 ¥86,158 Capital gains tax rate structure .............. 4 11 16 ¥5,263 ¥7,482 ¥12,714 ¥48,855 Expensing for small business .... .............. 226 ¥3,336 ¥5,711 ¥4,102 ¥3,205 ¥16,128 ¥24,798 Marginal individual income tax
rate reductions ......................... .................................................................................................................. ¥381,365Child tax credit 2 ......................... .................................................................................................................. ¥72,367Marriage penalty relief 3 ............ .................................................................................................................. ¥28,858Education incentives ................... .............. ¥11 ¥16 ¥22 ¥24 ¥37 ¥110 ¥6,758Repeal of estate and generation-
skipping transfer taxes, and modification of gift taxes ........ .............. ¥887 ¥1,575 ¥1,804 ¥2,038 ¥2,359 ¥8,663 ¥186,349
Modifications of pension plans ... .................................................................................................................. ¥1,804 Other incentives for families
and children ............................. .................................................................................................................. ¥3,396
Total permanent extensions .............. ¥1 ¥4,361 ¥6,983 ¥10,895 ¥32,270 ¥54,510 ¥840,708
Total extensions of tax relief enacted in 2001 and 2003, assumed in the baseline ............... .............. ¥11,355 ¥25,696 ¥26,054 ¥25,963 ¥44,440 ¥133,508 ¥928,890
Tax Incentives: Simplify and encourage saving:
Expand tax-free savings opportunities ..................................... .............. 3,950 8,197 5,495 2,807 699 21,148 5,763
Consolidate employer-based savings accounts ........................... .............. ¥214 ¥320 ¥339 ¥361 ¥385 ¥1,619 ¥11,833
Establish Individual Development Accounts (IDAs) ............. .............. ¥134 ¥286 ¥326 ¥300 ¥255 ¥1,301 ¥1,760
Total simplify and encourage saving ......................... .............. 3,602 7,591 4,830 2,146 59 18,228 ¥7,830
Invest in health care: Provide refundable tax credit for
the purchase of health insurance 4 ........................................ .............. ¥24 ¥1,417 ¥1,059 ¥854 ¥632 ¥3,986 ¥4,700
Provide an above-the-line deduction for high-deductible insurance premiums ........................ .............. ¥173 ¥1,764 ¥2,014 ¥2,292 ¥2,501 ¥8,744 ¥24,775
Provide an above-the-line deduction for long-term care insurance premiums ........................ .............. ¥68 ¥489 ¥805 ¥1,572 ¥2,435 ¥5,369 ¥21,428
Provide an additional personal exemption to home caregivers of family members ................... .............. ¥70 ¥451 ¥380 ¥380 ¥392 ¥1,673 ¥3,558
Allow the orphan drug tax credit for certain pre-designation expenses ................................... .............................................................................................. ¥1 ¥2
Clarify the Health Coverage Tax Credit 5 ..................................... ......................................................................................................................................
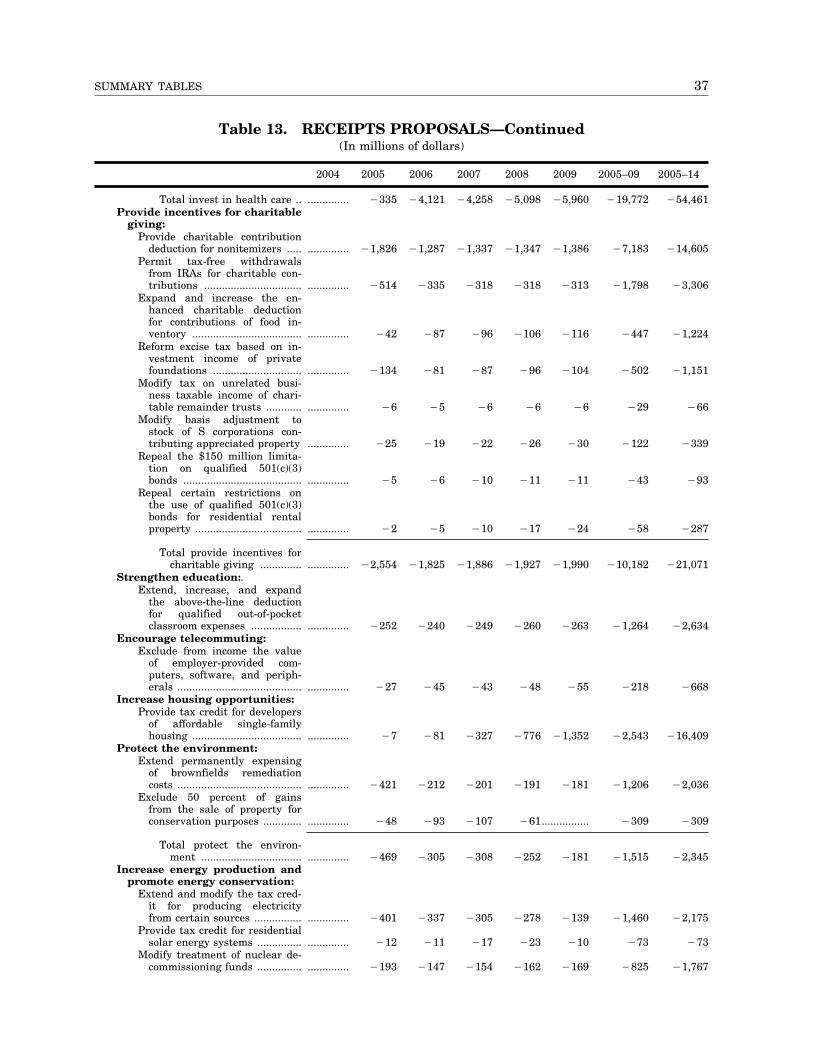
37 SUMMARY TABLES
Table 13. RECEIPTS PROPOSALS—Continued (In millions of dollars)
2004 2005 2006 2007 2008 2009 2005–09 2005–14
Total invest in health care .. .............. ¥335 ¥4,121 ¥4,258 ¥5,098 ¥5,960 ¥19,772 ¥54,461Provide incentives for charitable
giving: Provide charitable contribution
deduction for nonitemizers ..... .............. ¥1,826 ¥1,287 ¥1,337 ¥1,347 ¥1,386 ¥7,183 ¥14,605 Permit tax-free withdrawals
from IRAs for charitable contributions ................................. .............. ¥514 ¥335 ¥318 ¥318 ¥313 ¥1,798 ¥3,306
Expand and increase the enhanced charitable deduction for contributions of food inventory ..................................... .............. ¥42 ¥87 ¥96 ¥106 ¥116 ¥447 ¥1,224
Reform excise tax based on investment income of private foundations .............................. .............. ¥134 ¥81 ¥87 ¥96 ¥104 ¥502 ¥1,151
Modify tax on unrelated business taxable income of charitable remainder trusts ............ .............. ¥6 ¥5 ¥6 ¥6 ¥6 ¥29 ¥66
Modify basis adjustment to stock of S corporations contributing appreciated property .............. ¥25 ¥19 ¥22 ¥26 ¥30 ¥122 ¥339
Repeal the $150 million limitation on qualified 501(c)(3) bonds ........................................ .............. ¥5 ¥6 ¥10 ¥11 ¥11 ¥43 ¥93
Repeal certain restrictions on the use of qualified 501(c)(3) bonds for residential rental property .................................... .............. ¥2 ¥5 ¥10 ¥17 ¥24 ¥58 ¥287
Total provide incentives for charitable giving .............. .............. ¥2,554 ¥1,825 ¥1,886 ¥1,927 ¥1,990 ¥10,182 ¥21,071
Strengthen education:. Extend, increase, and expand
the above-the-line deduction for qualified out-of-pocket classroom expenses ................. .............. ¥252 ¥240 ¥249 ¥260 ¥263 ¥1,264 ¥2,634
Encourage telecommuting: Exclude from income the value
of employer-provided computers, software, and peripherals .......................................... .............. ¥27 ¥45 ¥43 ¥48 ¥55 ¥218 ¥668
Increase housing opportunities: Provide tax credit for developers
of affordable single-family housing ..................................... .............. ¥7 ¥81 ¥327 ¥776 ¥1,352 ¥2,543 ¥16,409
Protect the environment: Extend permanently expensing
of brownfields remediation costs .......................................... .............. ¥421 ¥212 ¥201 ¥191 ¥181 ¥1,206 ¥2,036
Exclude 50 percent of gains from the sale of property for conservation purposes ............. .............. ¥48 ¥93 ¥107 ¥61................ ¥309 ¥309
Total protect the environment .................................. .............. ¥469 ¥305 ¥308 ¥252 ¥181 ¥1,515 ¥2,345
Increase energy production and promote energy conservation:
Extend and modify the tax credit for producing electricity from certain sources ................ .............. ¥401 ¥337 ¥305 ¥278 ¥139 ¥1,460 ¥2,175
Provide tax credit for residential solar energy systems ............... .............. ¥12 ¥11 ¥17 ¥23 ¥10 ¥73 ¥73
Modify treatment of nuclear decommissioning funds ............... .............. ¥193 ¥147 ¥154 ¥162 ¥169 ¥825 ¥1,767
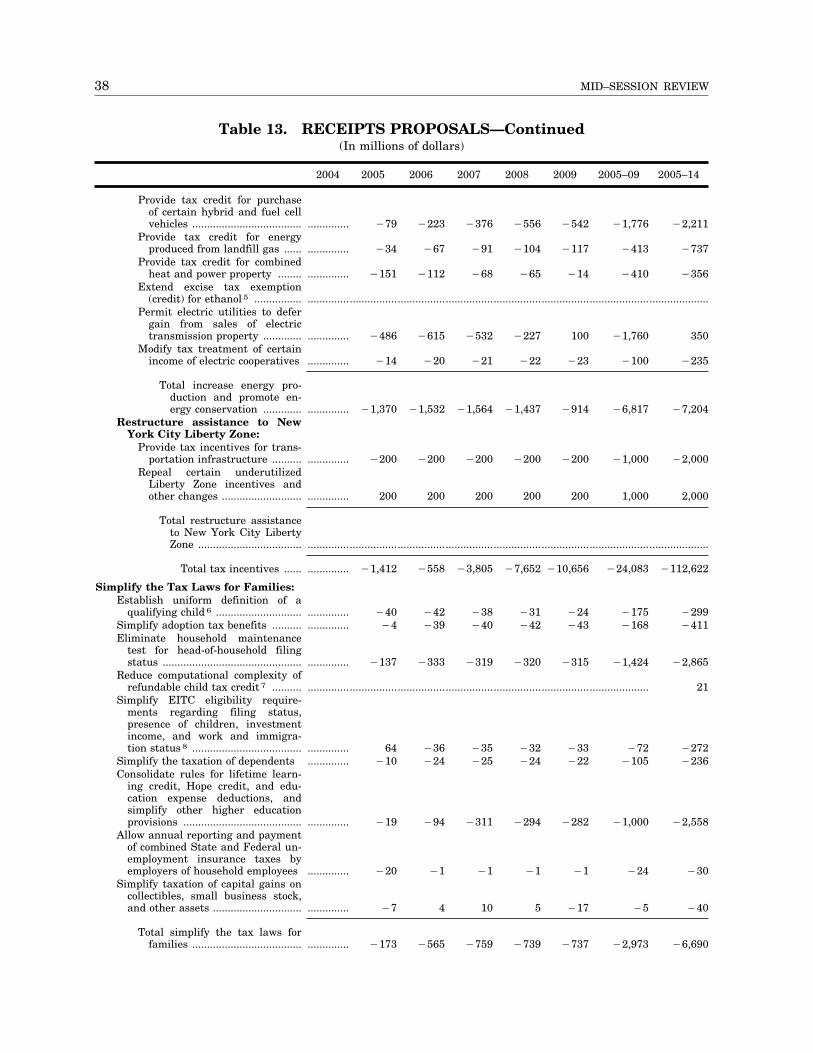
38 MID–SESSION REVIEW
Table 13. RECEIPTS PROPOSALS—Continued (In millions of dollars)
2004 2005 2006 2007 2008 2009 2005–09 2005–14
Provide tax credit for purchase of certain hybrid and fuel cell vehicles ..................................... .............. ¥79 ¥223 ¥376 ¥556 ¥542 ¥1,776 ¥2,211
Provide tax credit for energy produced from landfill gas ...... .............. ¥34 ¥67 ¥91 ¥104 ¥117 ¥413 ¥737
Provide tax credit for combined heat and power property ........ .............. ¥151 ¥112 ¥68 ¥65 ¥14 ¥410 ¥356
Extend excise tax exemption (credit) for ethanol 5 ................ ......................................................................................................................................
Permit electric utilities to defer gain from sales of electric transmission property ............. .............. ¥486 ¥615 ¥532 ¥227 100 ¥1,760
Modify tax treatment of certain income of electric cooperatives .............. ¥14 ¥20 ¥21 ¥22 ¥23 ¥100 ¥235
Total increase energy production and promote energy conservation ............. .............. ¥1,370 ¥1,532 ¥1,564 ¥1,437 ¥914 ¥6,817 ¥7,204
Restructure assistance to New York City Liberty Zone:
Provide tax incentives for transportation infrastructure .......... .............. ¥200 ¥200 ¥200 ¥200 ¥200 ¥1,000 ¥2,000
Repeal certain underutilized Liberty Zone incentives and other changes ........................... .............. 200 200 200 200 200 1,000 2,000
Total restructure assistance to New York City Liberty Zone ................................... ......................................................................................................................................
Total tax incentives ...... .............. ¥1,412 ¥558 ¥3,805 ¥7,652 ¥10,656 ¥24,083 ¥112,622
Simplify the Tax Laws for Families: Establish uniform definition of a
qualifying child 6 ............................. .............. ¥40 ¥42 ¥38 ¥31 ¥24 ¥175 ¥299 Simplify adoption tax benefits .......... .............. ¥4 ¥39 ¥40 ¥42 ¥43 ¥168 ¥411 Eliminate household maintenance
test for head-of-household filing status ............................................... .............. ¥137 ¥333 ¥319 ¥320 ¥315 ¥1,424 ¥2,865
Reduce computational complexity of refundable child tax credit 7 .......... ..................................................................................................................
Simplify EITC eligibility requirements regarding filing status, presence of children, investment income, and work and immigration status 8 ..................................... .............. 64 ¥36 ¥35 ¥32 ¥33 ¥72 ¥272
Simplify the taxation of dependents .............. ¥10 ¥24 ¥25 ¥24 ¥22 ¥105 ¥236Consolidate rules for lifetime learn
ing credit, Hope credit, and education expense deductions, and simplify other higher education provisions ........................................ .............. ¥19 ¥94 ¥311 ¥294 ¥282 ¥1,000 ¥2,558
Allow annual reporting and payment of combined State and Federal unemployment insurance taxes by employers of household employees .............. ¥20 ¥1 ¥1 ¥1 ¥1 ¥24 ¥30
Simplify taxation of capital gains on collectibles, small business stock, and other assets .............................. .............. ¥7 4 10 5 ¥17 ¥5 ¥40
Total simplify the tax laws for families ..................................... .............. ¥173 ¥565 ¥759 ¥739 ¥737 ¥2,973 ¥6,690
350
21
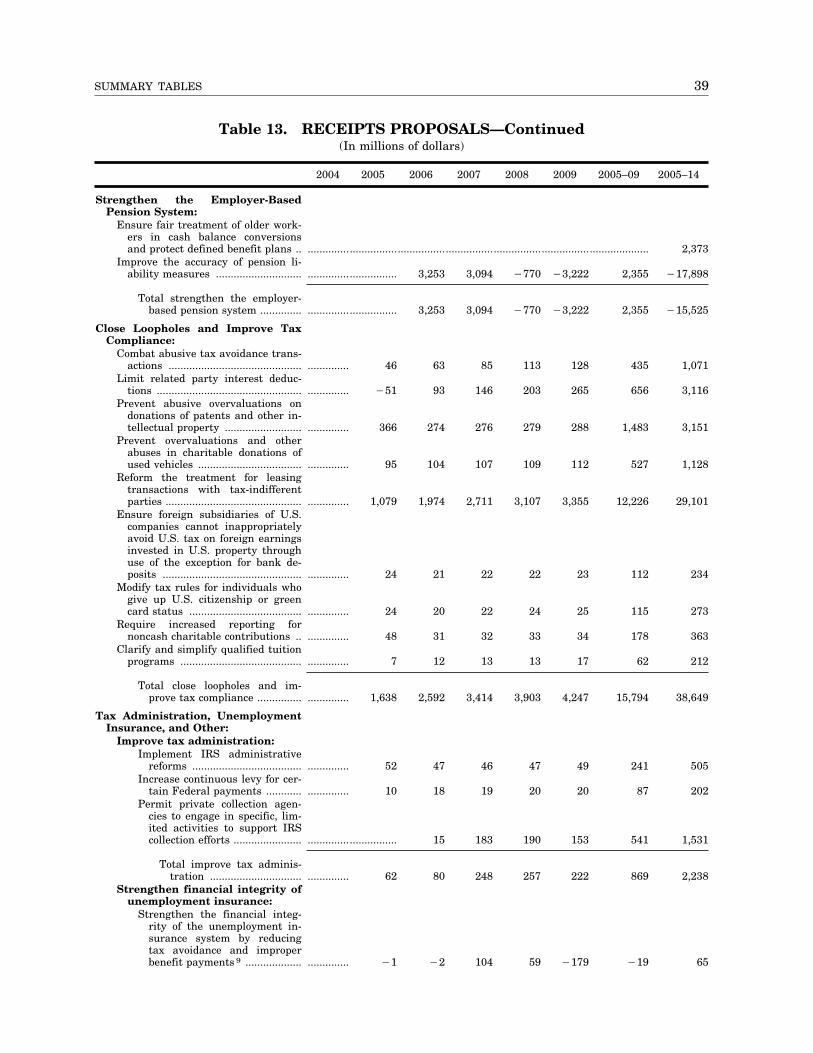
39 SUMMARY TABLES
Table 13. RECEIPTS PROPOSALS—Continued (In millions of dollars)
2004 2005 2006 2007 2008 2009 2005–09 2005–14
Strengthen the Employer-Based Pension System:
Ensure fair treatment of older workers in cash balance conversions and protect defined benefit plans .. .................................................................................................................. 2,373
Improve the accuracy of pension liability measures ............................. .............................. 3,253 3,094 ¥770 ¥3,222 2,355 ¥17,898
Total strengthen the employer-based pension system .............. .............................. 3,253 3,094 ¥770 ¥3,222 2,355 ¥15,525
Close Loopholes and Improve Tax Compliance:
Combat abusive tax avoidance transactions ............................................. .............. 46 63 85 113 128 435 1,071
Limit related party interest deductions ................................................. .............. ¥51 93 146 203 265 656 3,116
Prevent abusive overvaluations on donations of patents and other intellectual property .......................... .............. 366 274 276 279 288 1,483 3,151
Prevent overvaluations and other abuses in charitable donations of used vehicles ................................... .............. 95 104 107 109 112 527 1,128
Reform the treatment for leasing transactions with tax-indifferent parties .............................................. .............. 1,079 1,974 2,711 3,107 3,355 12,226 29,101
Ensure foreign subsidiaries of U.S. companies cannot inappropriately avoid U.S. tax on foreign earnings invested in U.S. property through use of the exception for bank deposits ............................................... .............. 24 21 22 22 23 112 234
Modify tax rules for individuals who give up U.S. citizenship or green card status ...................................... .............. 24 20 22 24 25 115 273
Require increased reporting for noncash charitable contributions .. .............. 48 31 32 33 34 178 363
Clarify and simplify qualified tuition programs ......................................... .............. 7 12 13 13 17 62 212
Total close loopholes and improve tax compliance ............... .............. 1,638 2,592 3,414 3,903 4,247 15,794 38,649
Tax Administration, Unemployment Insurance, and Other:
Improve tax administration: Implement IRS administrative
reforms ..................................... .............. 52 47 46 47 49 241 505 Increase continuous levy for cer
tain Federal payments ............ .............. 10 18 19 20 20 87 202 Permit private collection agen
cies to engage in specific, limited activities to support IRS collection efforts ....................... .............................. 15 183 190 153 541 1,531
Total improve tax administration ............................... .............. 62 80 248 257 222 869 2,238
Strengthen financial integrity of unemployment insurance:
Strengthen the financial integrity of the unemployment insurance system by reducing tax avoidance and improper benefit payments 9 ................... .............. ¥1 ¥2 104 59 ¥179 ¥19 65
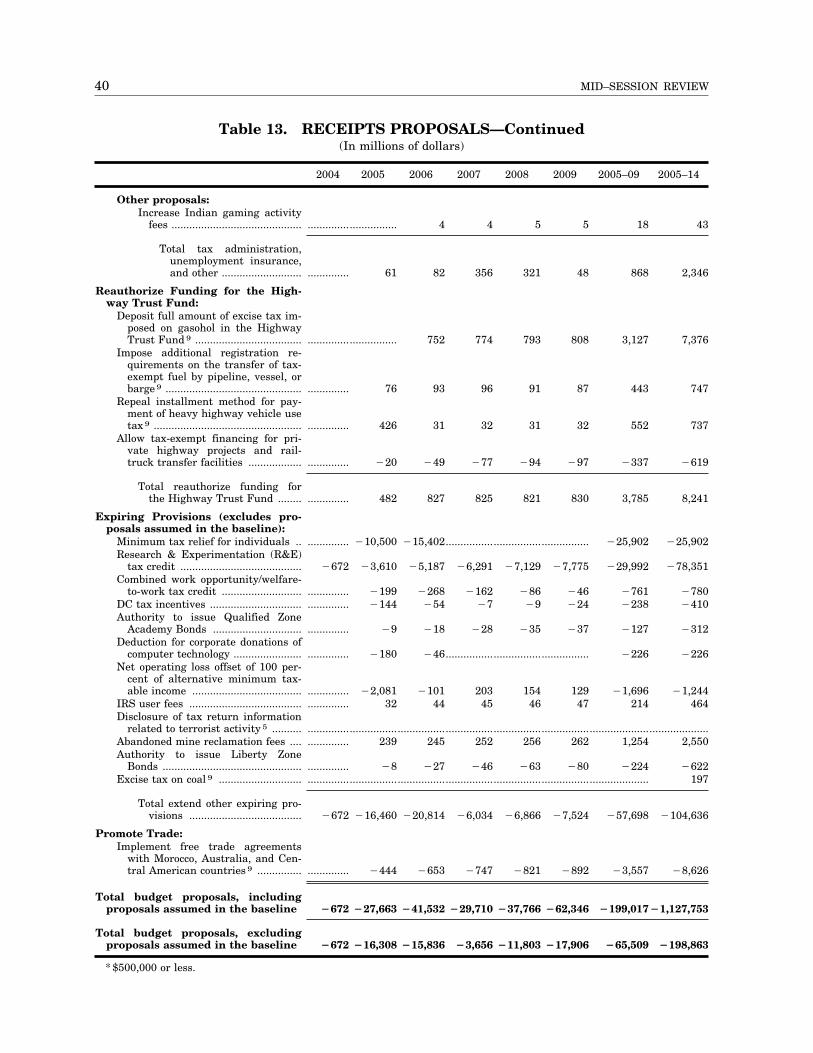
40 MID–SESSION REVIEW
Table 13. RECEIPTS PROPOSALS—Continued (In millions of dollars)
2004 2005 2006 2007 2008 2009 2005–09 2005–14
Other proposals: Increase Indian gaming activity
fees ............................................ .............................. 4 4 5 5 18 43
Total tax administration, unemployment insurance, and other ........................... .............. 61 82 356 321 48 868 2,346
Reauthorize Funding for the Highway Trust Fund:
Deposit full amount of excise tax imposed on gasohol in the Highway Trust Fund 9 .................................... .............................. 752 774 793 808 3,127 7,376
Impose additional registration requirements on the transfer of tax-exempt fuel by pipeline, vessel, or barge 9 .............................................. .............. 76 93 96 91 87 443 747
Repeal installment method for payment of heavy highway vehicle use tax 9 .................................................. .............. 426 31 32 31 32 552 737
Allow tax-exempt financing for private highway projects and rail-truck transfer facilities .................. .............. ¥20 ¥49 ¥77 ¥94 ¥97 ¥337 ¥619
Total reauthorize funding for the Highway Trust Fund ........ .............. 482 827 825 821 830 3,785 8,241
Expiring Provisions (excludes proposals assumed in the baseline):
Minimum tax relief for individuals .. .............. ¥10,500 ¥15,402................................................ ¥25,902 ¥25,902 Research & Experimentation (R&E)
tax credit ......................................... ¥672 ¥3,610 ¥5,187 ¥6,291 ¥7,129 ¥7,775 ¥29,992 ¥78,351 Combined work opportunity/welfare-
to-work tax credit ........................... .............. ¥199 ¥268 ¥162 ¥86 ¥46 ¥761 ¥780 DC tax incentives ............................... .............. ¥144 ¥54 ¥7 ¥9 ¥24 ¥238 ¥410 Authority to issue Qualified Zone
Academy Bonds .............................. .............. ¥9 ¥18 ¥28 ¥35 ¥37 ¥127 ¥312 Deduction for corporate donations of
computer technology ....................... .............. ¥180 ¥46................................................ ¥226 ¥226 Net operating loss offset of 100 per
cent of alternative minimum taxable income ..................................... .............. ¥2,081 ¥101 203 154 129 ¥1,696 ¥1,244
IRS user fees ...................................... .............. 32 44 45 46 47 214 464 Disclosure of tax return information
related to terrorist activity 5 .......... ...................................................................................................................................... Abandoned mine reclamation fees .... .............. 239 245 252 256 262 1,254 2,550 Authority to issue Liberty Zone
Bonds ............................................... .............. ¥8 ¥27 ¥46 ¥63 ¥80 ¥224 ¥622Excise tax on coal 9 ............................ ..................................................................................................................
Total extend other expiring provisions ...................................... ¥672 ¥16,460 ¥20,814 ¥6,034 ¥6,866 ¥7,524 ¥57,698 ¥104,636
Promote Trade: Implement free trade agreements
with Morocco, Australia, and Central American countries 9 ............... .............. ¥444 ¥653 ¥747 ¥821 ¥892 ¥3,557 ¥8,626
Total budget proposals, including proposals assumed in the baseline Ø672 Ø27,663 Ø41,532 Ø29,710 Ø37,766 Ø62,346 Ø199,017Ø1,127,753
Total budget proposals, excluding proposals assumed in the baseline Ø672 Ø16,308 Ø15,836 Ø3,656 Ø11,803 Ø17,906 Ø65,509 Ø198,863
* $500,000 or less.
197
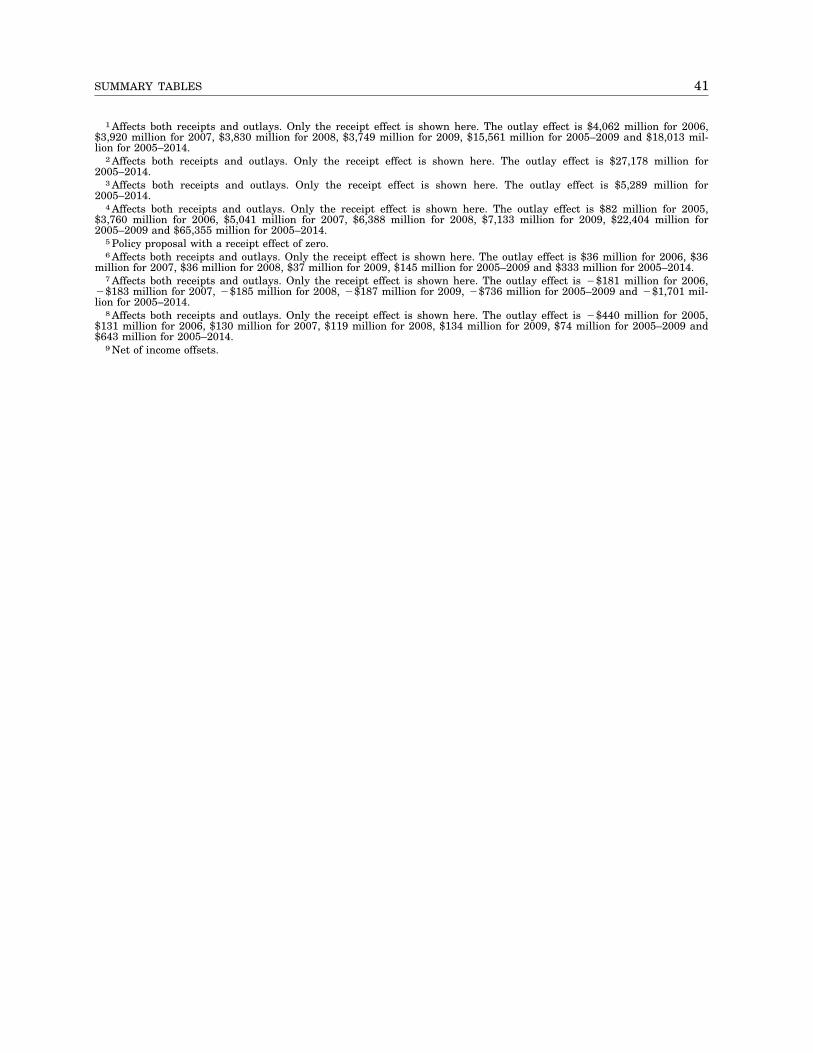
41 SUMMARY TABLES
1 Affects both receipts and outlays. Only the receipt effect is shown here. The outlay effect is $4,062 million for 2006, $3,920 million for 2007, $3,830 million for 2008, $3,749 million for 2009, $15,561 million for 2005–2009 and $18,013 million for 2005–2014.
2 Affects both receipts and outlays. Only the receipt effect is shown here. The outlay effect is $27,178 million for 2005–2014.
3 Affects both receipts and outlays. Only the receipt effect is shown here. The outlay effect is $5,289 million for 2005–2014.
4 Affects both receipts and outlays. Only the receipt effect is shown here. The outlay effect is $82 million for 2005, $3,760 million for 2006, $5,041 million for 2007, $6,388 million for 2008, $7,133 million for 2009, $22,404 million for 2005–2009 and $65,355 million for 2005–2014.
5 Policy proposal with a receipt effect of zero. 6 Affects both receipts and outlays. Only the receipt effect is shown here. The outlay effect is $36 million for 2006, $36
million for 2007, $36 million for 2008, $37 million for 2009, $145 million for 2005–2009 and $333 million for 2005–2014. 7 Affects both receipts and outlays. Only the receipt effect is shown here. The outlay effect is ¥$181 million for 2006,
¥$183 million for 2007, ¥$185 million for 2008, ¥$187 million for 2009, ¥$736 million for 2005–2009 and ¥$1,701 million for 2005–2014.
8 Affects both receipts and outlays. Only the receipt effect is shown here. The outlay effect is ¥$440 million for 2005, $131 million for 2006, $130 million for 2007, $119 million for 2008, $134 million for 2009, $74 million for 2005–2009 and $643 million for 2005–2014.
9 Net of income offsets.
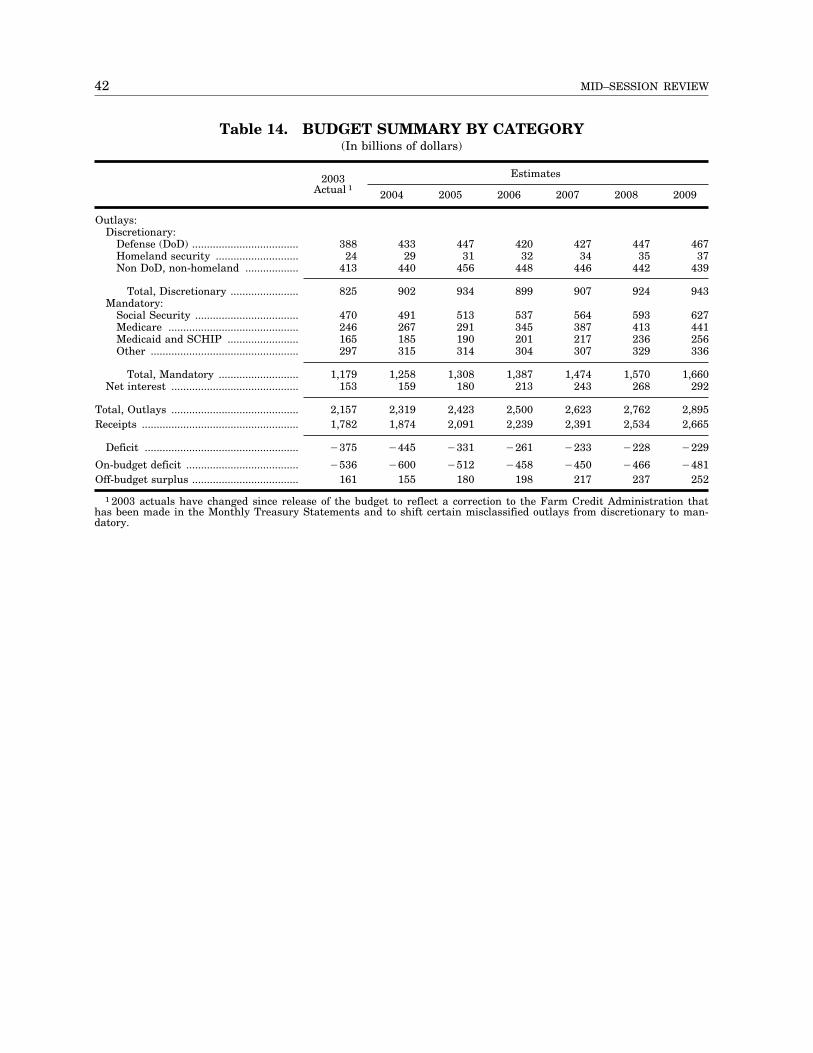
42 MID–SESSION REVIEW
Table 14. BUDGET SUMMARY BY CATEGORY (In billions of dollars)
Estimates2003 Actual 1
2004 2005 2006 2007 2008 2009
Outlays: Discretionary:
Defense (DoD) .................................... 388 433 447 420 427 447 467 Homeland security ............................ 24 29 31 32 34 35 37 Non DoD, non-homeland .................. 413 440 456 448 446 442 439
Total, Discretionary ....................... 825Mandatory:
Social Security ................................... 470Medicare ............................................ 246Medicaid and SCHIP ........................ 165Other .................................................. 297
902 934 899 907 924 943
491 513 537 564 593 627 267 291 345 387 413 441 185 190 201 217 236 256 315 314 304 307 329 336
Total, Mandatory ........................... 1,179 1,258 1,308 1,387 1,474 1,570 1,660Net interest ........................................... 153 159 180 213 243 268
Total, Outlays ........................................... 2,157 2,319 2,423 2,500 2,623 2,762 2,895Receipts ..................................................... 1,782 1,874 2,091 2,239 2,391 2,534 2,665
Deficit .................................................... ¥375
On-budget deficit ...................................... ¥536Off-budget surplus .................................... 161
¥445 ¥331 ¥261 ¥233 ¥228 ¥229
¥600 ¥512 ¥458 ¥450 ¥466 ¥481 155 180 198 217 237
1 2003 actuals have changed since release of the budget to reflect a correction to the Farm Credit Administration that has been made in the Monthly Treasury Statements and to shift certain misclassified outlays from discretionary to mandatory.
292
252
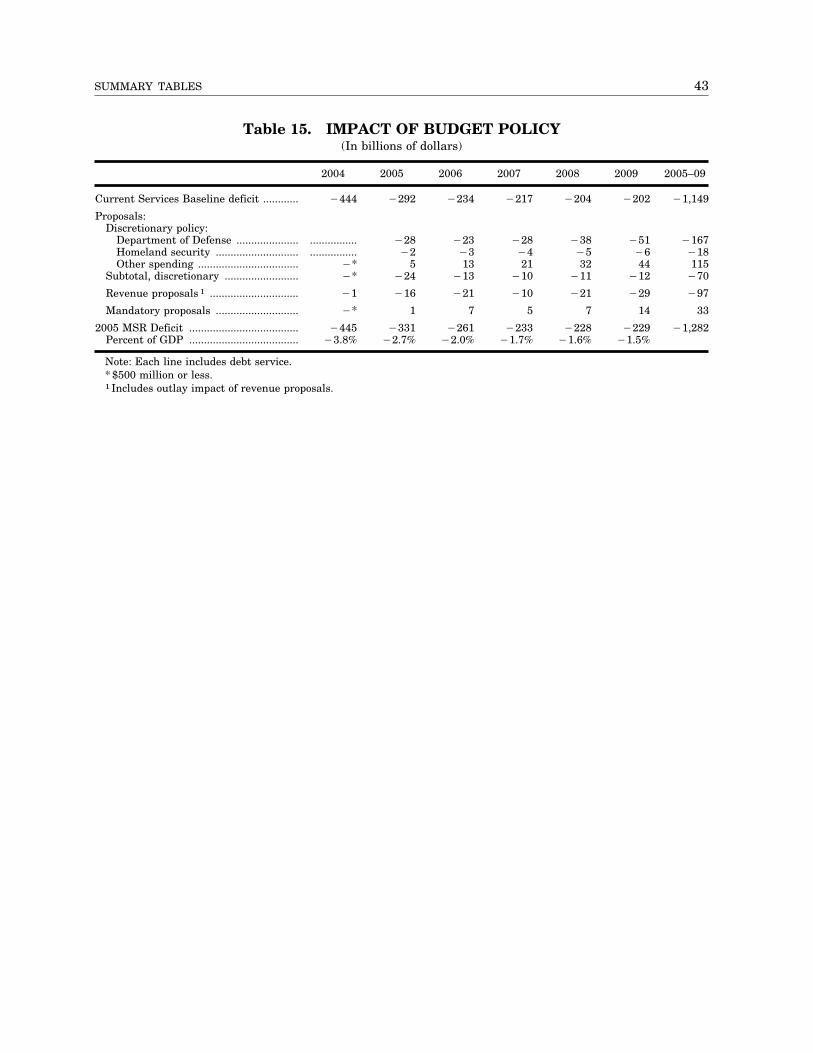
43 SUMMARY TABLES
Table 15. IMPACT OF BUDGET POLICY (In billions of dollars)
Current Services Baseline deficit ............
Proposals: Discretionary policy:
Department of Defense ..................... Homeland security ............................ Other spending ..................................
Subtotal, discretionary .........................
Revenue proposals 1 ..............................
Mandatory proposals ............................
2005 MSR Deficit .....................................Percent of GDP .....................................
2004 2005 2006 2007 2008 2009 2005–09
¥444 ¥292 ¥234 ¥217 ¥204 ¥202 ¥1,149
................ ¥28 ¥23
................ ¥2 ¥3 ¥* 5 13 ¥* ¥24 ¥13
¥28 ¥38 ¥51 ¥167 ¥4 ¥5 ¥6 ¥18 21 32 44 115
¥10 ¥11 ¥12 ¥70
¥1 ¥16 ¥21 ¥10 ¥21 ¥29 ¥97
¥* 1 7 5 7 14 33
¥445 ¥331 ¥261 ¥233 ¥228 ¥229 ¥1,282 ¥3.8% ¥2.7% ¥2.0% ¥1.7% ¥1.6% ¥1.5%
Note: Each line includes debt service. * $500 million or less.1 Includes outlay impact of revenue proposals.
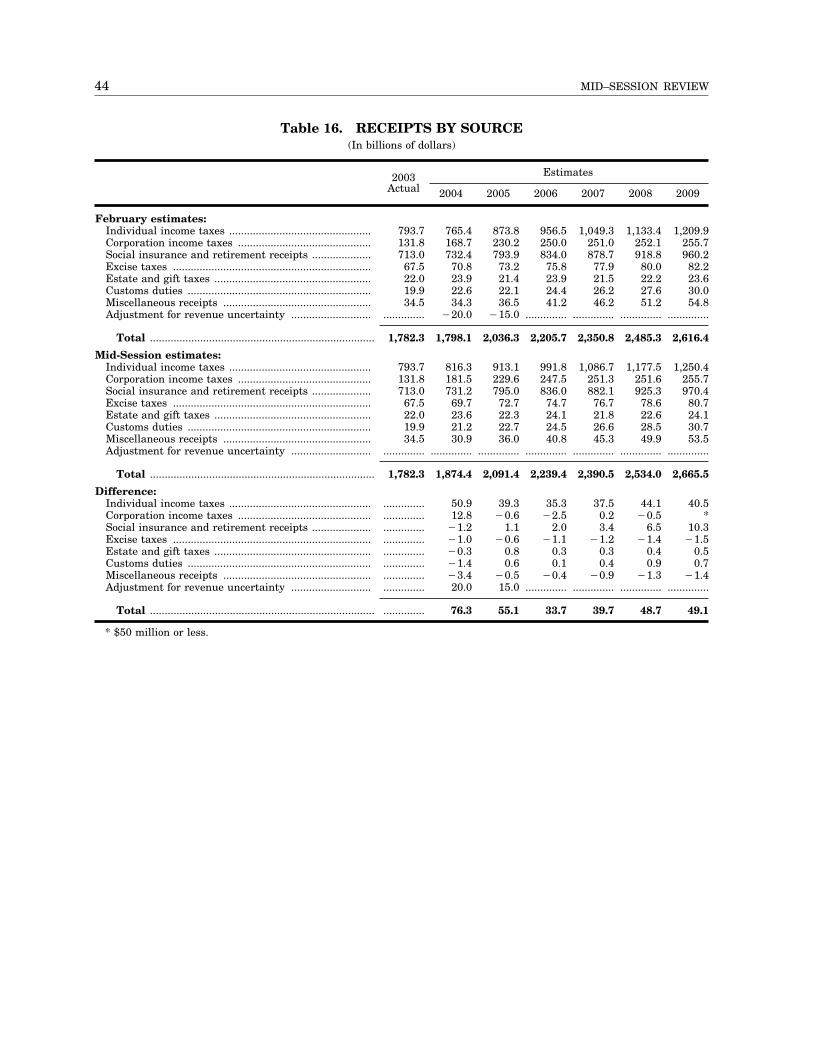
44 MID–SESSION REVIEW
Table 16. RECEIPTS BY SOURCE (In billions of dollars)
Estimates2003 Actual 2004 2005 2006 2007 2008 2009
February estimates: Individual income taxes ................................................ 793.7 765.4 873.8 956.5 1,049.3 1,133.4 1,209.9Corporation income taxes ............................................. 131.8 168.7 230.2 250.0 251.0 252.1 255.7Social insurance and retirement receipts .................... 713.0 732.4 793.9 834.0 878.7 918.8 960.2Excise taxes ................................................................... 67.5 70.8 73.2 75.8 77.9 80.0 82.2Estate and gift taxes ..................................................... 22.0 23.9 21.4 23.9 21.5 22.2 23.6Customs duties .............................................................. 19.9 22.6 22.1 24.4 26.2 27.6 30.0Miscellaneous receipts .................................................. 34.5 34.3 36.5 41.2 46.2 51.2 54.8Adjustment for revenue uncertainty ........................... .............. ¥20.0 ¥15.0 .............. .............. .............. ..............
Total ............................................................................ 1,782.3 1,798.1 2,036.3 2,205.7 2,350.8 2,485.3 2,616.4
Mid-Session estimates: Individual income taxes ................................................ 793.7 816.3 913.1 991.8 1,086.7 1,177.5 1,250.4Corporation income taxes ............................................. 131.8 181.5 229.6 247.5 251.3 251.6 255.7Social insurance and retirement receipts .................... 713.0 731.2 795.0 836.0 882.1 925.3 970.4Excise taxes ................................................................... 67.5 69.7 72.7 74.7 76.7 78.6 80.7Estate and gift taxes ..................................................... 22.0 23.6 22.3 24.1 21.8 22.6 24.1Customs duties .............................................................. 19.9 21.2 22.7 24.5 26.6 28.5 30.7Miscellaneous receipts .................................................. 34.5 30.9 36.0 40.8 45.3 49.9 53.5Adjustment for revenue uncertainty ........................... .............. .............. .............. .............. .............. .............. ..............
Total ............................................................................ 1,782.3 1,874.4 2,091.4 2,239.4 2,390.5 2,534.0 2,665.5
Difference: Individual income taxes ................................................ .............. 50.9 39.3 35.3 37.5 44.1 40.5Corporation income taxes ............................................. .............. 12.8 ¥0.6 ¥2.5 0.2 ¥0.5 *Social insurance and retirement receipts .................... .............. ¥1.2 1.1 2.0 3.4 6.5 10.3Excise taxes ................................................................... .............. ¥1.0 ¥0.6 ¥1.1 ¥1.2 ¥1.4 ¥1.5Estate and gift taxes ..................................................... .............. ¥0.3 0.8 0.3 0.3 0.4 0.5Customs duties .............................................................. .............. ¥1.4 0.6 0.1 0.4 0.9 0.7Miscellaneous receipts .................................................. .............. ¥3.4 ¥0.5 ¥0.4 ¥0.9 ¥1.3 ¥1.4Adjustment for revenue uncertainty ........................... .............. 20.0 15.0 .............. .............. .............. ..............
Total ............................................................................ .............. 76.3 55.1 33.7 39.7 48.7 49.1
* $50 million or less.
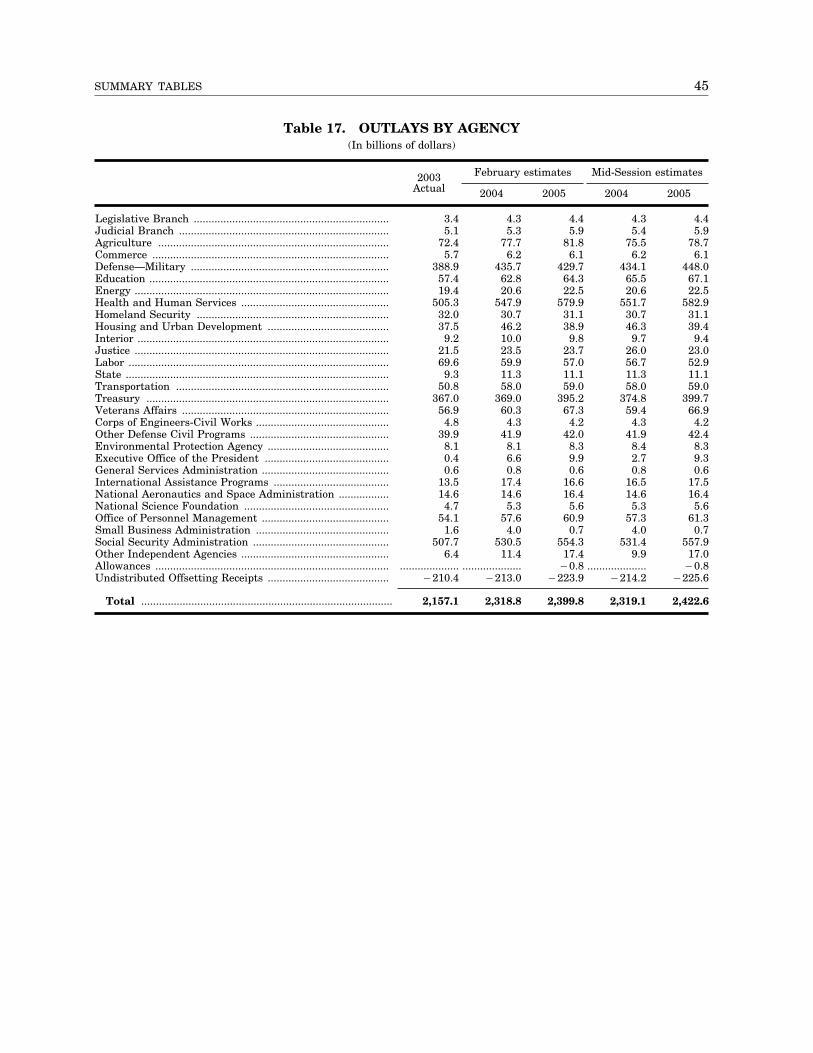
45 SUMMARY TABLES
Table 17. OUTLAYS BY AGENCY (In billions of dollars)
2003 February estimates Mid-Session estimates Actual 2004 2005 2004 2005
Legislative Branch .................................................................. 3.4 4.3 4.4 4.3 4.4Judicial Branch ....................................................................... 5.1 5.3 5.9 5.4 5.9Agriculture .............................................................................. 72.4 77.7 81.8 75.5 78.7Commerce ................................................................................ 5.7 6.2 6.1 6.2 6.1Defense—Military ................................................................... 388.9 435.7 429.7 434.1 448.0Education ................................................................................. 57.4 62.8 64.3 65.5 67.1Energy ...................................................................................... 19.4 20.6 22.5 20.6 22.5Health and Human Services .................................................. 505.3 547.9 579.9 551.7 582.9Homeland Security ................................................................. 32.0 30.7 31.1 30.7 31.1Housing and Urban Development ......................................... 37.5 46.2 38.9 46.3 39.4Interior ..................................................................................... 9.2 10.0 9.8 9.7 9.4Justice ...................................................................................... 21.5 23.5 23.7 26.0 23.0Labor ........................................................................................ 69.6 59.9 57.0 56.7 52.9State ......................................................................................... 9.3 11.3 11.1 11.3 11.1Transportation ........................................................................ 50.8 58.0 59.0 58.0 59.0Treasury .................................................................................. 367.0 369.0 395.2 374.8 399.7Veterans Affairs ...................................................................... 56.9 60.3 67.3 59.4 66.9Corps of Engineers-Civil Works ............................................. 4.8 4.3 4.2 4.3 4.2Other Defense Civil Programs ............................................... 39.9 41.9 42.0 41.9 42.4Environmental Protection Agency ......................................... 8.1 8.1 8.3 8.4 8.3Executive Office of the President .......................................... 0.4 6.6 9.9 2.7 9.3General Services Administration ........................................... 0.6 0.8 0.6 0.8 0.6International Assistance Programs ....................................... 13.5 17.4 16.6 16.5 17.5National Aeronautics and Space Administration ................. 14.6 14.6 16.4 14.6 16.4National Science Foundation ................................................. 4.7 5.3 5.6 5.3 5.6Office of Personnel Management ........................................... 54.1 57.6 60.9 57.3 61.3Small Business Administration ............................................. 1.6 4.0 0.7 4.0 0.7Social Security Administration .............................................. 507.7 530.5 554.3 531.4 557.9Other Independent Agencies .................................................. 6.4 11.4 17.4 9.9 17.0Allowances ............................................................................... .................... .................... ¥0.8 .................... ¥0.8Undistributed Offsetting Receipts ......................................... ¥210.4 ¥213.0 ¥223.9 ¥214.2 ¥225.6
Total ..................................................................................... 2,157.1 2,318.8 2,399.8 2,319.1 2,422.6
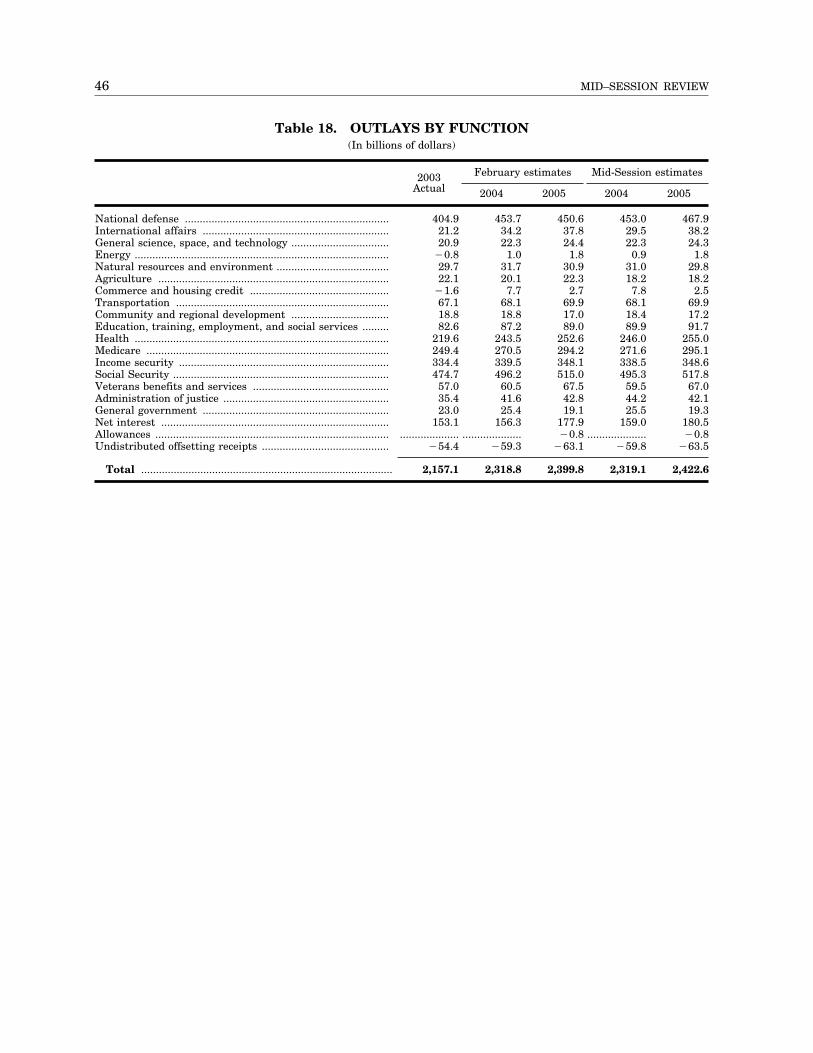
46 MID–SESSION REVIEW
Table 18. OUTLAYS BY FUNCTION (In billions of dollars)
2003 February estimates Mid-Session estimates Actual 2004 2005 2004 2005
National defense ..................................................................... 404.9 453.7 450.6 453.0 467.9International affairs ............................................................... 21.2 34.2 37.8 29.5 38.2General science, space, and technology ................................. 20.9 22.3 24.4 22.3 24.3Energy ...................................................................................... ¥0.8 1.0 1.8 0.9 1.8Natural resources and environment ...................................... 29.7 31.7 30.9 31.0 29.8Agriculture .............................................................................. 22.1 20.1 22.3 18.2 18.2Commerce and housing credit ............................................... ¥1.6 7.7 2.7 7.8 2.5Transportation ........................................................................ 67.1 68.1 69.9 68.1 69.9Community and regional development ................................. 18.8 18.8 17.0 18.4 17.2Education, training, employment, and social services ......... 82.6 87.2 89.0 89.9 91.7Health ...................................................................................... 219.6 243.5 252.6 246.0 255.0Medicare .................................................................................. 249.4 270.5 294.2 271.6 295.1Income security ....................................................................... 334.4 339.5 348.1 338.5 348.6Social Security ......................................................................... 474.7 496.2 515.0 495.3 517.8Veterans benefits and services .............................................. 57.0 60.5 67.5 59.5 67.0Administration of justice ........................................................ 35.4 41.6 42.8 44.2 42.1General government ............................................................... 23.0 25.4 19.1 25.5 19.3Net interest ............................................................................. 153.1 156.3 177.9 159.0 180.5Allowances ............................................................................... .................... .................... ¥0.8 .................... ¥0.8Undistributed offsetting receipts ........................................... ¥54.4 ¥59.3 ¥63.1 ¥59.8 ¥63.5
Total ..................................................................................... 2,157.1 2,318.8 2,399.8 2,319.1 2,422.6
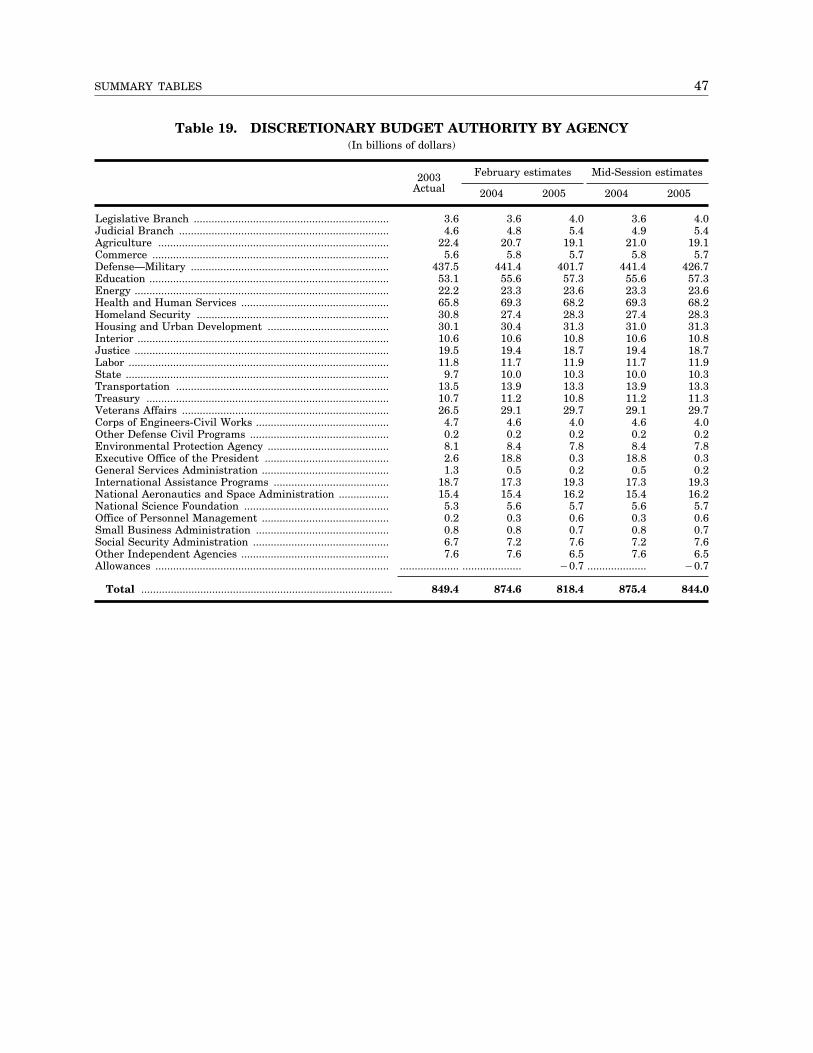
47 SUMMARY TABLES
Table 19. DISCRETIONARY BUDGET AUTHORITY BY AGENCY (In billions of dollars)
2003 February estimates Mid-Session estimates Actual 2004 2005 2004 2005
Legislative Branch .................................................................. 3.6 3.6 4.0 3.6 4.0Judicial Branch ....................................................................... 4.6 4.8 5.4 4.9 5.4Agriculture .............................................................................. 22.4 20.7 19.1 21.0 19.1Commerce ................................................................................ 5.6 5.8 5.7 5.8 5.7Defense—Military ................................................................... 437.5 441.4 401.7 441.4 426.7Education ................................................................................. 53.1 55.6 57.3 55.6 57.3Energy ...................................................................................... 22.2 23.3 23.6 23.3 23.6Health and Human Services .................................................. 65.8 69.3 68.2 69.3 68.2Homeland Security ................................................................. 30.8 27.4 28.3 27.4 28.3Housing and Urban Development ......................................... 30.1 30.4 31.3 31.0 31.3Interior ..................................................................................... 10.6 10.6 10.8 10.6 10.8Justice ...................................................................................... 19.5 19.4 18.7 19.4 18.7Labor ........................................................................................ 11.8 11.7 11.9 11.7 11.9State ......................................................................................... 9.7 10.0 10.3 10.0 10.3Transportation ........................................................................ 13.5 13.9 13.3 13.9 13.3Treasury .................................................................................. 10.7 11.2 10.8 11.2 11.3Veterans Affairs ...................................................................... 26.5 29.1 29.7 29.1 29.7Corps of Engineers-Civil Works ............................................. 4.7 4.6 4.0 4.6 4.0Other Defense Civil Programs ............................................... 0.2 0.2 0.2 0.2 0.2Environmental Protection Agency ......................................... 8.1 8.4 7.8 8.4 7.8Executive Office of the President .......................................... 2.6 18.8 0.3 18.8 0.3General Services Administration ........................................... 1.3 0.5 0.2 0.5 0.2International Assistance Programs ....................................... 18.7 17.3 19.3 17.3 19.3National Aeronautics and Space Administration ................. 15.4 15.4 16.2 15.4 16.2National Science Foundation ................................................. 5.3 5.6 5.7 5.6 5.7Office of Personnel Management ........................................... 0.2 0.3 0.6 0.3 0.6Small Business Administration ............................................. 0.8 0.8 0.7 0.8 0.7Social Security Administration .............................................. 6.7 7.2 7.6 7.2 7.6Other Independent Agencies .................................................. 7.6 7.6 6.5 7.6 6.5Allowances ............................................................................... .................... .................... ¥0.7 .................... ¥0.7
Total ..................................................................................... 849.4 874.6 818.4 875.4 844.0
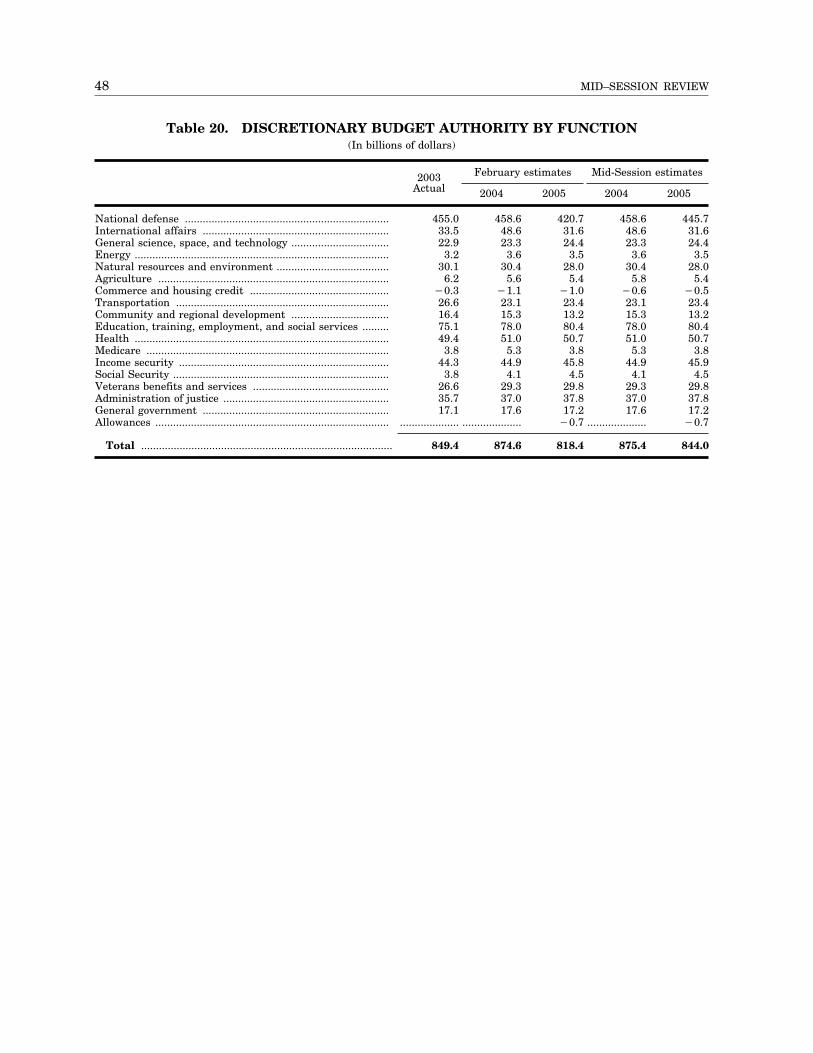
48 MID–SESSION REVIEW
Table 20. DISCRETIONARY BUDGET AUTHORITY BY FUNCTION (In billions of dollars)
2003 February estimates Mid-Session estimates Actual 2004 2005 2004 2005
National defense ..................................................................... 455.0 458.6 420.7 458.6 445.7International affairs ............................................................... 33.5 48.6 31.6 48.6 31.6General science, space, and technology ................................. 22.9 23.3 24.4 23.3 24.4Energy ...................................................................................... 3.2 3.6 3.5 3.6 3.5Natural resources and environment ...................................... 30.1 30.4 28.0 30.4 28.0Agriculture .............................................................................. 6.2 5.6 5.4 5.8 5.4Commerce and housing credit ............................................... ¥0.3 ¥1.1 ¥1.0 ¥0.6 ¥0.5Transportation ........................................................................ 26.6 23.1 23.4 23.1 23.4Community and regional development ................................. 16.4 15.3 13.2 15.3 13.2Education, training, employment, and social services ......... 75.1 78.0 80.4 78.0 80.4Health ...................................................................................... 49.4 51.0 50.7 51.0 50.7Medicare .................................................................................. 3.8 5.3 3.8 5.3 3.8Income security ....................................................................... 44.3 44.9 45.8 44.9 45.9Social Security ......................................................................... 3.8 4.1 4.5 4.1 4.5Veterans benefits and services .............................................. 26.6 29.3 29.8 29.3 29.8Administration of justice ........................................................ 35.7 37.0 37.8 37.0 37.8General government ............................................................... 17.1 17.6 17.2 17.6 17.2Allowances ............................................................................... .................... .................... ¥0.7 .................... ¥0.7
Total ..................................................................................... 849.4 874.6 818.4 875.4 844.0
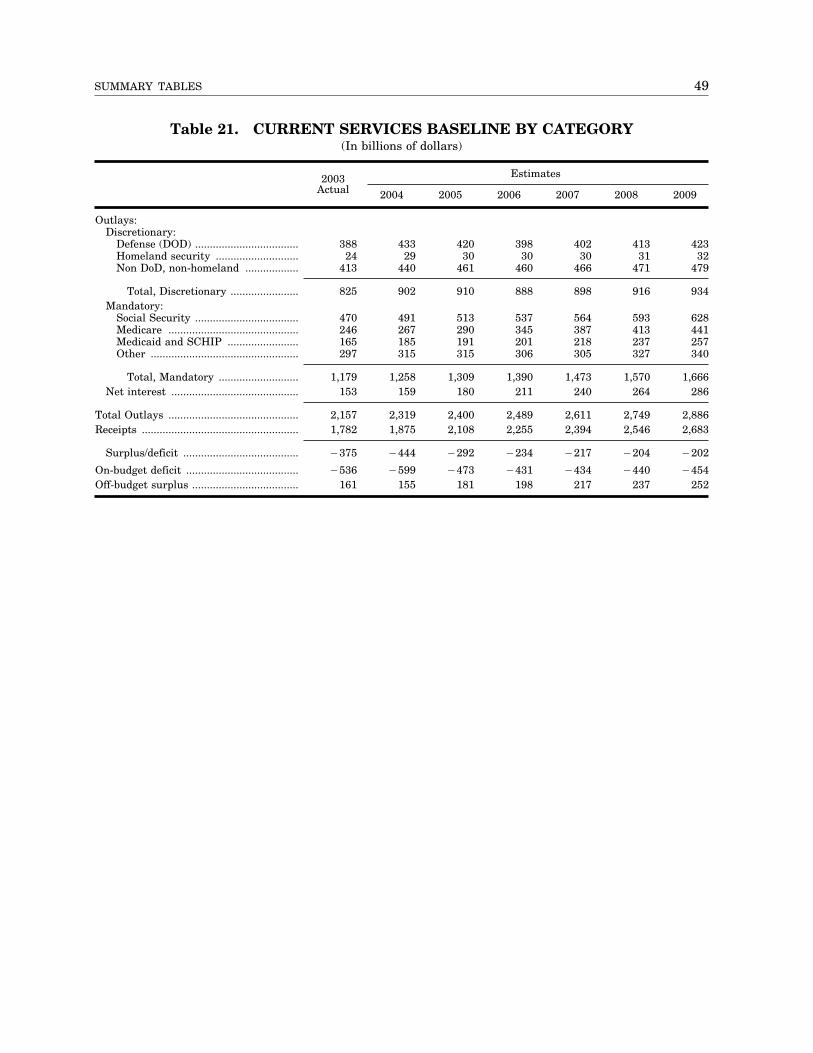
49SUMMARY TABLES
Table 21. CURRENT SERVICES BASELINE BY CATEGORY (In billions of dollars)
2003 Estimates Actual 2004 2005 2006 2007 2008 2009
Outlays: Discretionary:
Defense (DOD) ................................... 388 433 420 398 402 413 423 Homeland security ............................ 24 29 30 30 30 31 32 Non DoD, non-homeland .................. 413 440 461 460 466 471 479
Total, Discretionary ....................... 825 902 910 888 898 916 934 Mandatory:
Social Security ................................... 470 491 513 537 564 593 628 Medicare ............................................ 246 267 290 345 387 413 441 Medicaid and SCHIP ........................ 165 185 191 201 218 237 257 Other .................................................. 297 315 315 306 305 327 340
Total, Mandatory ........................... 1,179 1,258 1,309 1,390 1,473 1,570 1,666 Net interest ........................................... 153 159 180 211 240 264 286
Total Outlays ............................................ 2,157 2,319 2,400 2,489 2,611 2,749 2,886 Receipts ..................................................... 1,782 1,875 2,108 2,255 2,394 2,546 2,683
Surplus/deficit ....................................... ¥375 ¥444 ¥292 ¥234 ¥217 ¥204 ¥202
On-budget deficit ...................................... ¥536 ¥599 ¥473 ¥431 ¥434 ¥440 ¥454Off-budget surplus .................................... 161 155 181 198 217 237 252
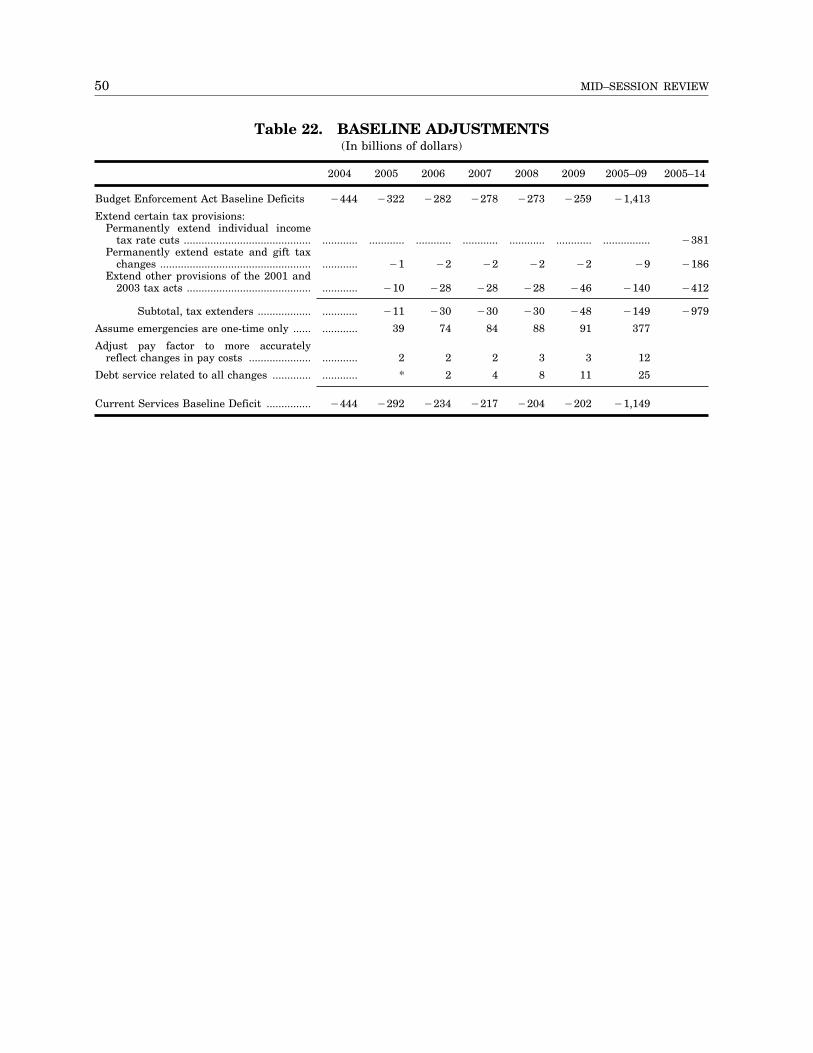
50 MID–SESSION REVIEW
Table 22. BASELINE ADJUSTMENTS (In billions of dollars)
Budget Enforcement Act Baseline Deficits
Extend certain tax provisions: Permanently extend individual income
tax rate cuts ........................................... Permanently extend estate and gift tax
changes ................................................... Extend other provisions of the 2001 and
2003 tax acts ..........................................
2004 2005 2006 2007 2008 2009 2005–09 2005–14
¥444 ¥322 ¥282 ¥278 ¥273 ¥259 ¥1,413
............ ............ ............ ............ ............ ............ ................ ¥381
............ ¥1 ¥2 ¥2 ¥2 ¥2 ¥9 ¥186
............ ¥10 ¥28 ¥28 ¥28 ¥46 ¥140 ¥412
Subtotal, tax extenders .................. ............ ¥11 ¥30 ¥30 ¥30 ¥48 ¥149 ¥979
Assume emergencies are one-time only ...... ............ 39 74 84 88 91 377
Adjust pay factor to more accurately reflect changes in pay costs ..................... ............ 2 2 2 3 3 12
Debt service related to all changes ............. ............ * 2 4 8 11 25
Current Services Baseline Deficit ............... ¥444 ¥292 ¥234 ¥217 ¥204 ¥202 ¥1,149
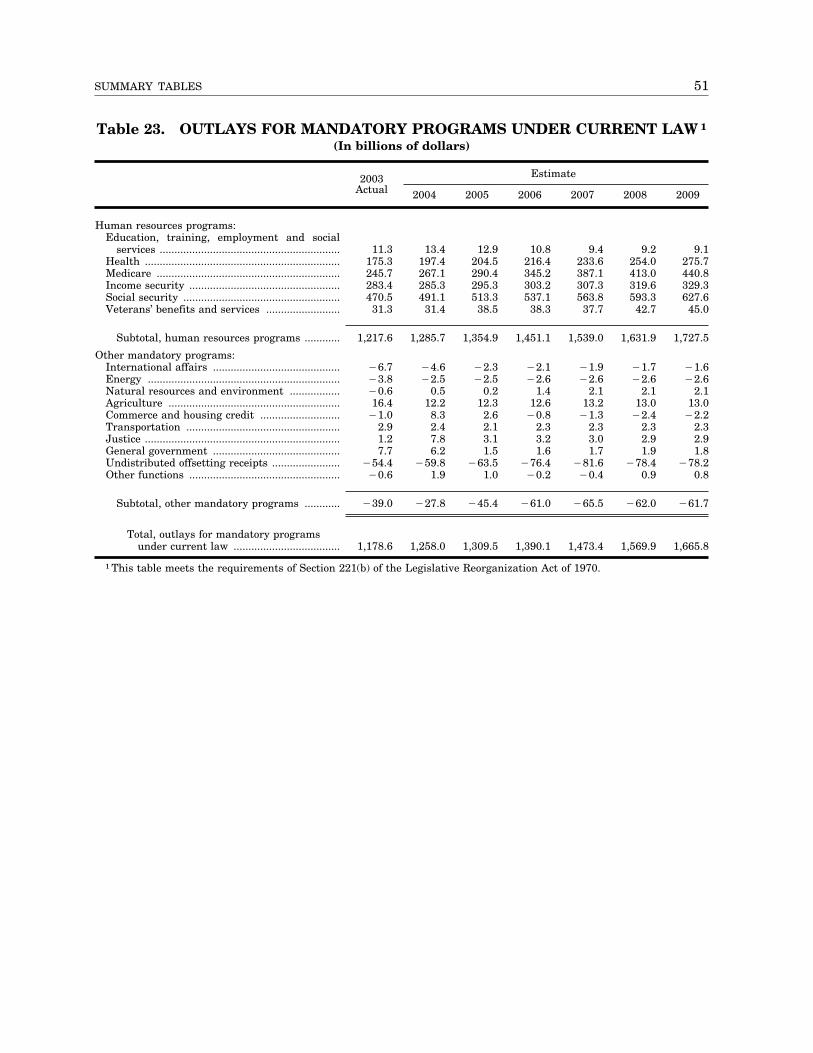
51 SUMMARY TABLES
Table 23. OUTLAYS FOR MANDATORY PROGRAMS UNDER CURRENT LAW 1
(In billions of dollars)
Estimate2003 Actual 2004 2005 2006 2007 2008 2009
Human resources programs: Education, training, employment and social
services ............................................................. 11.3 13.4 12.9 10.8 9.4 9.2 9.1 Health .................................................................. 175.3 197.4 204.5 216.4 233.6 254.0 275.7 Medicare .............................................................. 245.7 267.1 290.4 345.2 387.1 413.0 440.8 Income security ................................................... 283.4 285.3 295.3 303.2 307.3 319.6 329.3 Social security ..................................................... 470.5 491.1 513.3 537.1 563.8 593.3 627.6 Veterans’ benefits and services ......................... 31.3 31.4 38.5 38.3 37.7 42.7 45.0
Subtotal, human resources programs ............ 1,217.6 1,285.7 1,354.9 1,451.1 1,539.0 1,631.9 1,727.5
Other mandatory programs: International affairs ........................................... ¥6.7 ¥4.6 ¥2.3 ¥2.1 ¥1.9 ¥1.7 ¥1.6 Energy ................................................................. ¥3.8 ¥2.5 ¥2.5 ¥2.6 ¥2.6 ¥2.6 ¥2.6 Natural resources and environment ................. ¥0.6 0.5 0.2 1.4 2.1 2.1 2.1 Agriculture .......................................................... 16.4 12.2 12.3 12.6 13.2 13.0 13.0 Commerce and housing credit ........................... ¥1.0 8.3 2.6 ¥0.8 ¥1.3 ¥2.4 ¥2.2 Transportation .................................................... 2.9 2.4 2.1 2.3 2.3 2.3 2.3 Justice .................................................................. 1.2 7.8 3.1 3.2 3.0 2.9 2.9 General government ........................................... 7.7 6.2 1.5 1.6 1.7 1.9 1.8 Undistributed offsetting receipts ....................... ¥54.4 ¥59.8 ¥63.5 ¥76.4 ¥81.6 ¥78.4 ¥78.2 Other functions ................................................... ¥0.6 1.9 1.0 ¥0.2 ¥0.4 0.9 0.8
Subtotal, other mandatory programs ............ ¥39.0 ¥27.8 ¥45.4 ¥61.0 ¥65.5 ¥62.0 ¥61.7
Total, outlays for mandatory programs under current law .................................... 1,178.6 1,258.0 1,309.5 1,390.1 1,473.4 1,569.9 1,665.8
1 This table meets the requirements of Section 221(b) of the Legislative Reorganization Act of 1970.
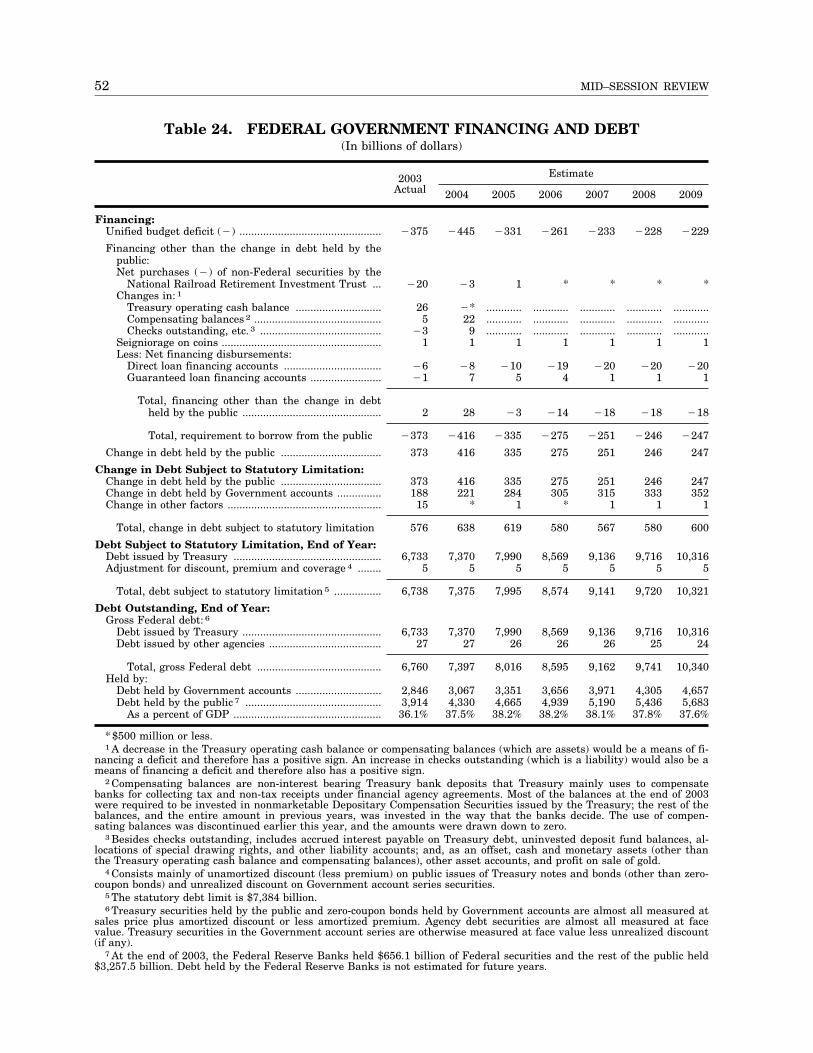
52 MID–SESSION REVIEW
Table 24. FEDERAL GOVERNMENT FINANCING AND DEBT (In billions of dollars)
Estimate2003 Actual 2004 2005 2006 2007 2008 2009
Financing: Unified budget deficit (¥) ................................................ ¥375 ¥445 ¥331 ¥261 ¥233 ¥228 ¥229
Financing other than the change in debt held by the public: Net purchases (¥) of non-Federal securities by the
National Railroad Retirement Investment Trust ... ¥20 ¥3 1 * * * * Changes in: 1
Treasury operating cash balance ............................. 26 ¥* ............ ............ ............ ............ ............ Compensating balances 2 ........................................... 5 22 ............ ............ ............ ............ ............ Checks outstanding, etc. 3 ......................................... ¥3 9 ............ ............ ............ ............ ............
Seigniorage on coins ...................................................... 1 1 1 1 1 1 1 Less: Net financing disbursements:
Direct loan financing accounts ................................. ¥6 ¥8 ¥10 ¥19 ¥20 ¥20 ¥20 Guaranteed loan financing accounts ........................ ¥1 7 5 4 1 1 1
Total, financing other than the change in debt held by the public ............................................... 2 28 ¥3 ¥14 ¥18 ¥18 ¥18
Total, requirement to borrow from the public
Change in debt held by the public ..................................
Change in Debt Subject to Statutory Limitation: Change in debt held by the public ..................................Change in debt held by Government accounts ...............Change in other factors ....................................................
¥373
373
373 188
15
¥416
416
416 221
*
¥335
335
335 284
1
¥275
275
275 305
*
¥251
251
251 315
1
¥246
246
246 333
1
¥247
247
247 352
1
Total, change in debt subject to statutory limitation 576 638 619 580 567 580 600
Debt Subject to Statutory Limitation, End of Year: Debt issued by Treasury .................................................. 6,733 7,370 7,990 8,569 9,136 9,716 10,316 Adjustment for discount, premium and coverage 4 ........ 5 5 5 5 5 5 5
Total, debt subject to statutory limitation 5 ................ 6,738 7,375 7,995 8,574 9,141 9,720 10,321
Debt Outstanding, End of Year: Gross Federal debt: 6
Debt issued by Treasury ............................................... 6,733 7,370 7,990 8,569 9,136 9,716 10,316 Debt issued by other agencies ...................................... 27 27 26 26 26 25 24
Total, gross Federal debt .......................................... 6,760 7,397 8,016 8,595 9,162 9,741 10,340 Held by:
Debt held by Government accounts ............................. 2,846 3,067 3,351 3,656 3,971 4,305 4,657 Debt held by the public 7 .............................................. 3,914 4,330 4,665 4,939 5,190 5,436 5,683
As a percent of GDP .................................................. 36.1% 37.5% 38.2% 38.2% 38.1% 37.8% 37.6%
* $500 million or less. 1 A decrease in the Treasury operating cash balance or compensating balances (which are assets) would be a means of fi
nancing a deficit and therefore has a positive sign. An increase in checks outstanding (which is a liability) would also be a means of financing a deficit and therefore also has a positive sign.
2 Compensating balances are non-interest bearing Treasury bank deposits that Treasury mainly uses to compensate banks for collecting tax and non-tax receipts under financial agency agreements. Most of the balances at the end of 2003 were required to be invested in nonmarketable Depositary Compensation Securities issued by the Treasury; the rest of the balances, and the entire amount in previous years, was invested in the way that the banks decide. The use of compensating balances was discontinued earlier this year, and the amounts were drawn down to zero.
3 Besides checks outstanding, includes accrued interest payable on Treasury debt, uninvested deposit fund balances, allocations of special drawing rights, and other liability accounts; and, as an offset, cash and monetary assets (other than the Treasury operating cash balance and compensating balances), other asset accounts, and profit on sale of gold.
4 Consists mainly of unamortized discount (less premium) on public issues of Treasury notes and bonds (other than zero-coupon bonds) and unrealized discount on Government account series securities.
5 The statutory debt limit is $7,384 billion. 6 Treasury securities held by the public and zero-coupon bonds held by Government accounts are almost all measured at
sales price plus amortized discount or less amortized premium. Agency debt securities are almost all measured at face value. Treasury securities in the Government account series are otherwise measured at face value less unrealized discount (if any).
7 At the end of 2003, the Federal Reserve Banks held $656.1 billion of Federal securities and the rest of the public held $3,257.5 billion. Debt held by the Federal Reserve Banks is not estimated for future years.