Embed Size (px)
Citation preview
F I S C A L Y E A R 2 0 0 6
O F T H E U . S .B U D G E T G O V E R N M E N T
MIDSESSION REVIEW
EXECUTIVE OFFICE OF THE PRESIDENT OFFICE OF MANAGEMENT AND BUDGET
WASHINGTON, D.C. 20503
The Director
July 13, 2005
The Honorable J. Dennis Hastert Speaker of the Houseof Representatives
Washington, DC 20515
Dear Mr. Speaker:
Section 1106 of Title 31, United States Code, calls for the President to transmit to the Congress a supplemental update of the Budget that was transmitted to the Congress earlier in the year. This supplemental update of the Budget, commonly known as the Mid-Session Review, contains revised estimates of the budget deficit, receipts, outlays, and budget authority for fiscal years 2005 through 2010. An update of executive branch progress in implementing the President=s Management Agenda will be provided under separate cover.
Sincerely,
Joshua B. Bolten Director
Enclosure
Identical Letter Sent to The President of the Senate
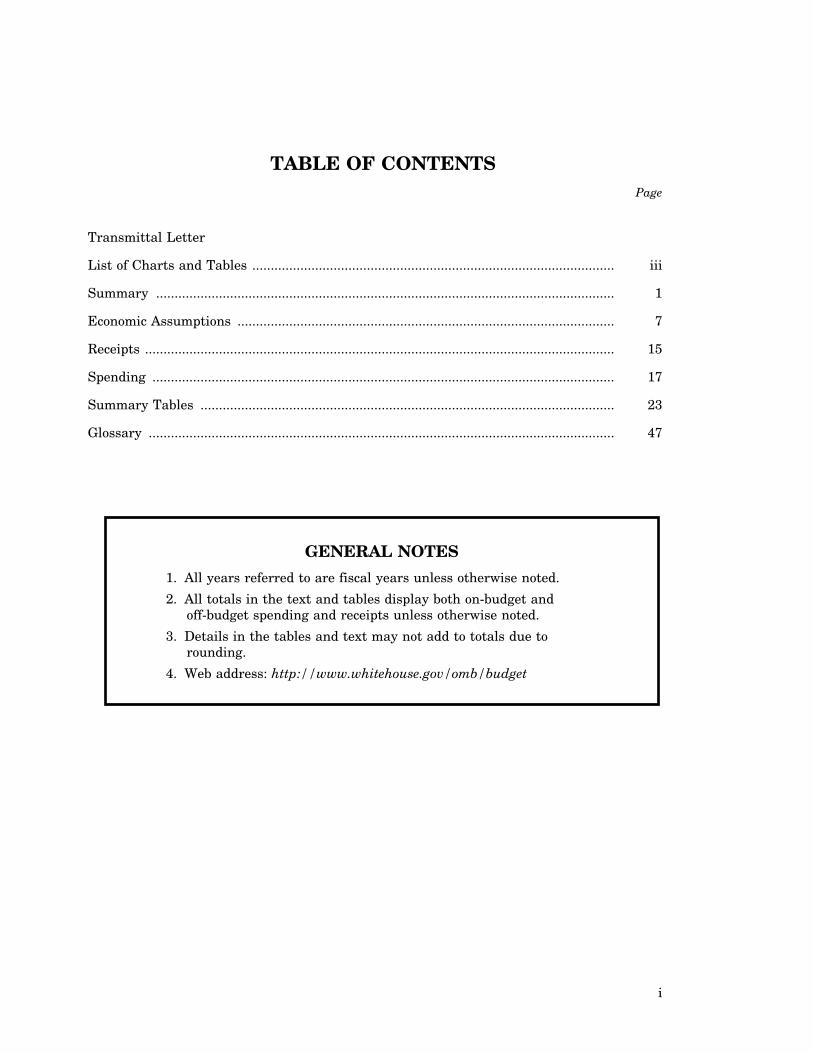
TABLE OF CONTENTS Page
Transmittal Letter
List of Charts and Tables .................................................................................................. iii
Summary ............................................................................................................................ 1
Economic Assumptions ...................................................................................................... 7
Receipts ............................................................................................................................... 15
Spending ............................................................................................................................. 17
Summary Tables ................................................................................................................ 23
Glossary .............................................................................................................................. 47
GENERAL NOTES
1. All years referred to are fiscal years unless otherwise noted.
2. All totals in the text and tables display both on-budget and off-budget spending and receipts unless otherwise noted.
3. Details in the tables and text may not add to totals due to rounding.
4. Web address: http://www.whitehouse.gov/omb/budget
i
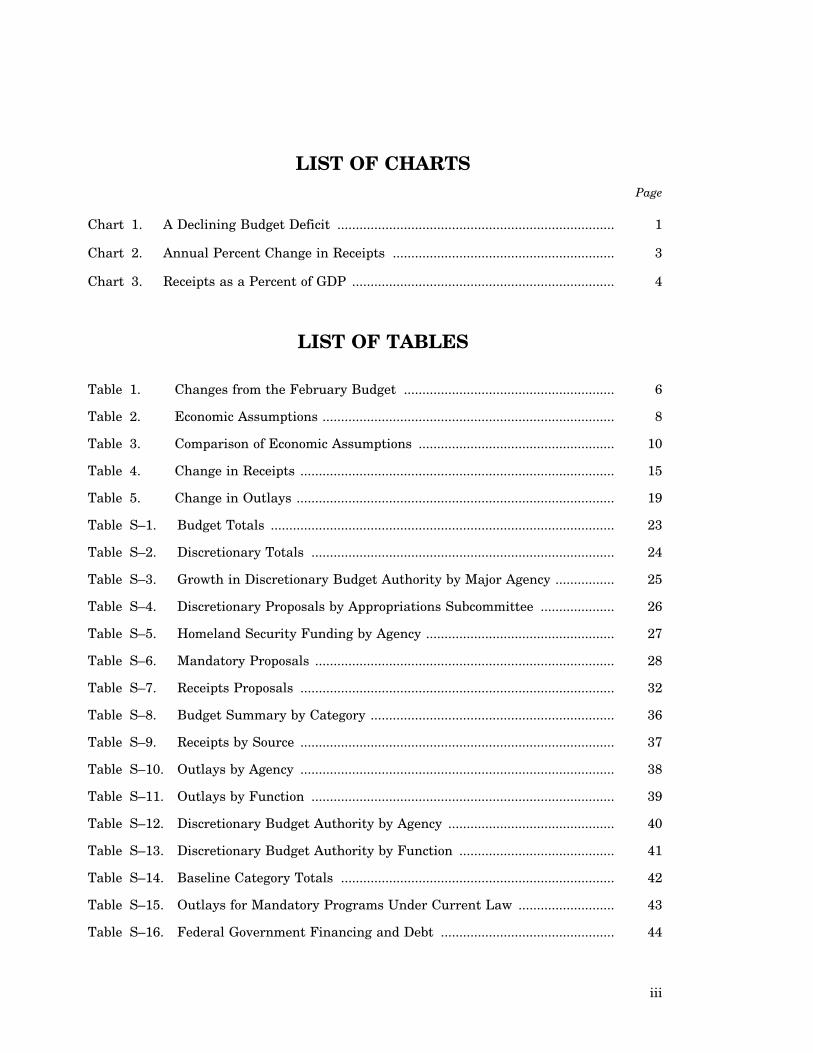
LIST OF CHARTS Page
Chart 1. A Declining Budget Deficit ........................................................................... 1
Chart 2. Annual Percent Change in Receipts ............................................................ 3
Chart 3. Receipts as a Percent of GDP ....................................................................... 4
Table 1. Changes from the February Budget ......................................................... 6
............................................................................... 8
..................................................... 10
..................................................................................... 15
...................................................................................... 19
............................................................................................. 23
.................................................................................. 24
................ 25
.................... 26
................................................... 27
................................................................................. 28
..................................................................................... 32
.................................................................. 36
..................................................................................... 37
..................................................................................... 38
.................................................................................. 39
............................................. 40
.......................................... 41
.......................................................................... 42
.......................... 43
............................................... 44
Table 2. Economic Assumptions
Table 3. Comparison of Economic Assumptions
Table 4. Change in Receipts
Table 5. Change in Outlays
Table S–1. Budget Totals
Table S–2. Discretionary Totals
Table S–3. Growth in Discretionary Budget Authority by Major Agency
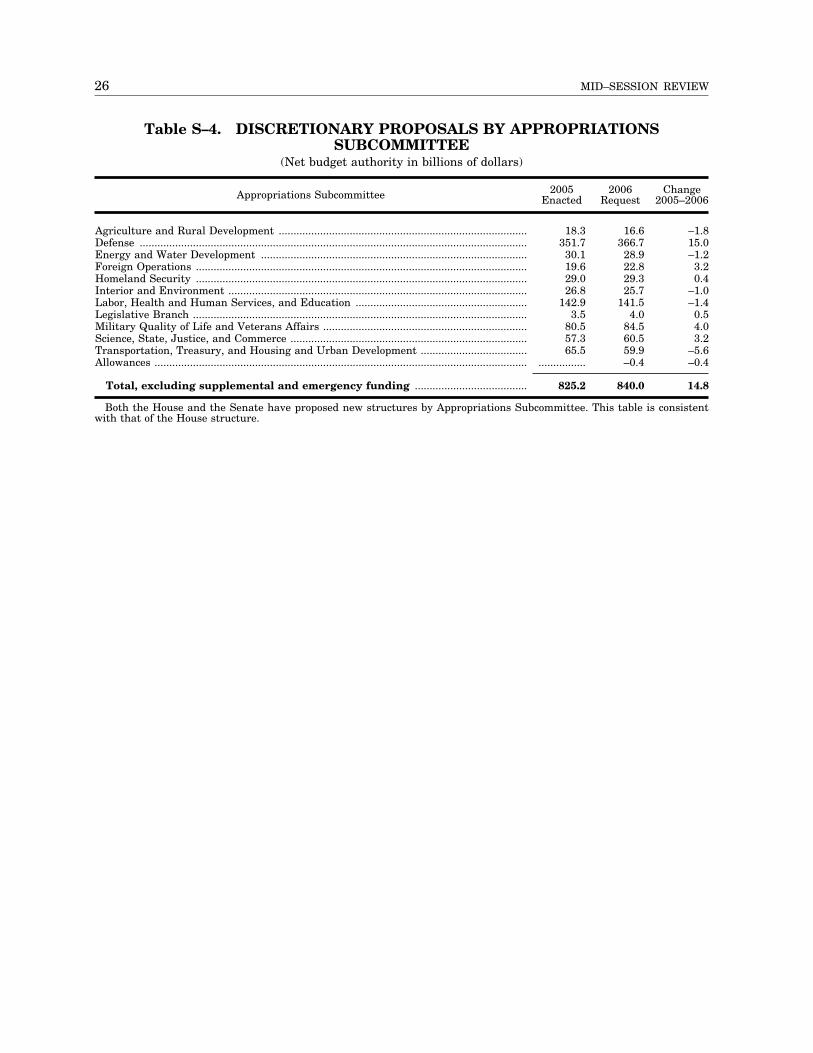
Table S–4. Discretionary Proposals by Appropriations Subcommittee
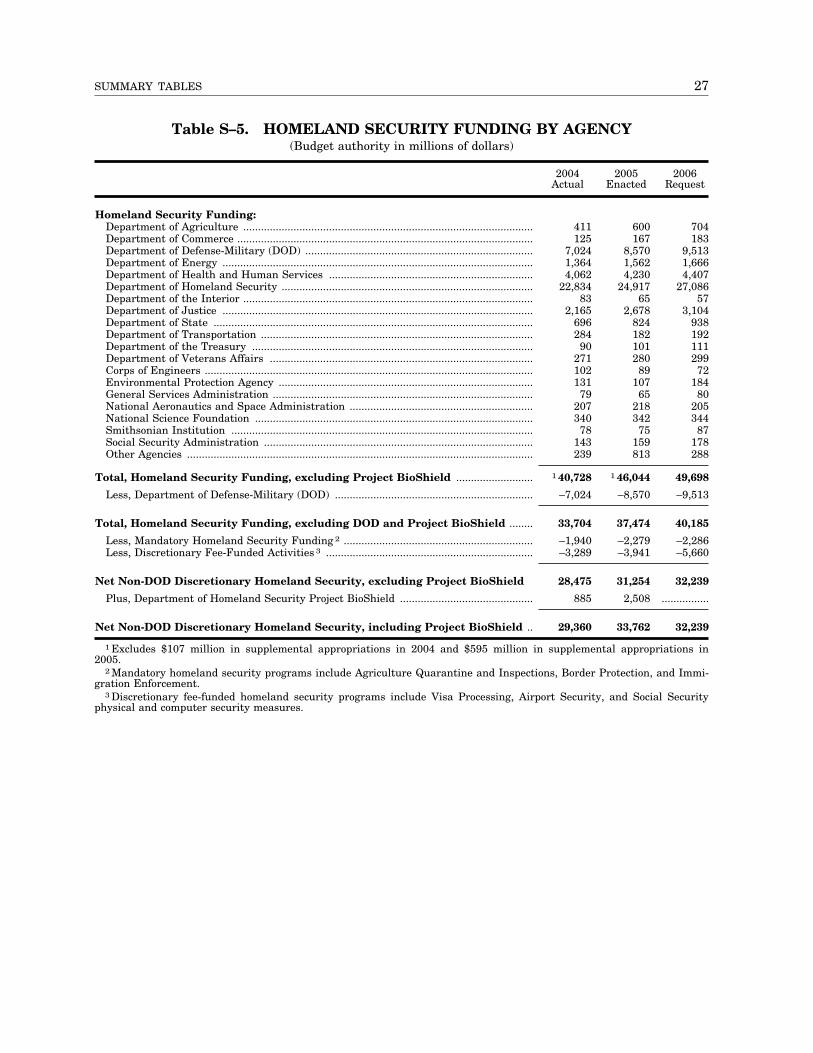
Table S–5. Homeland Security Funding by Agency
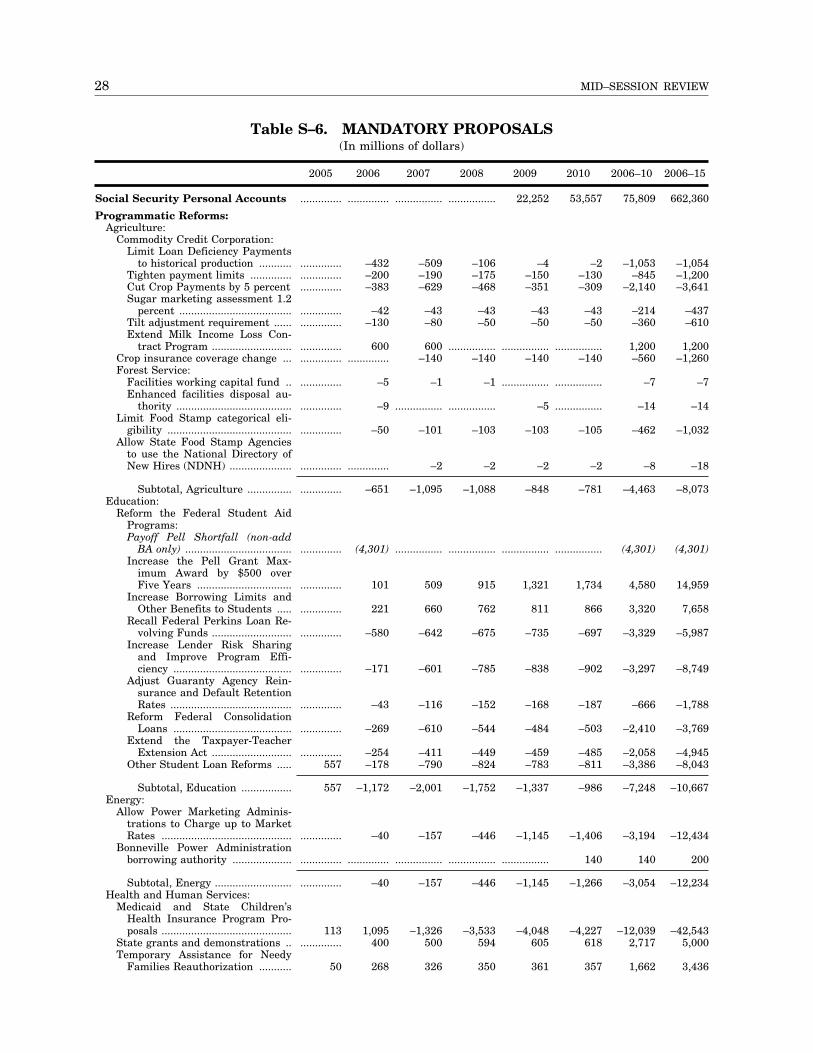
Table S–6. Mandatory Proposals
Table S–7. Receipts Proposals
Table S–8. Budget Summary by Category
Table S–9. Receipts by Source
Table S–10. Outlays by Agency
Table S–11. Outlays by Function
Table S–12. Discretionary Budget Authority by Agency
Table S–13. Discretionary Budget Authority by Function
Table S–14. Baseline Category Totals
Table S–15. Outlays for Mandatory Programs Under Current Law
Table S–16. Federal Government Financing and Debt
LIST OF TABLES
iii
SUMMARY Since the 2006 Budget was released, the
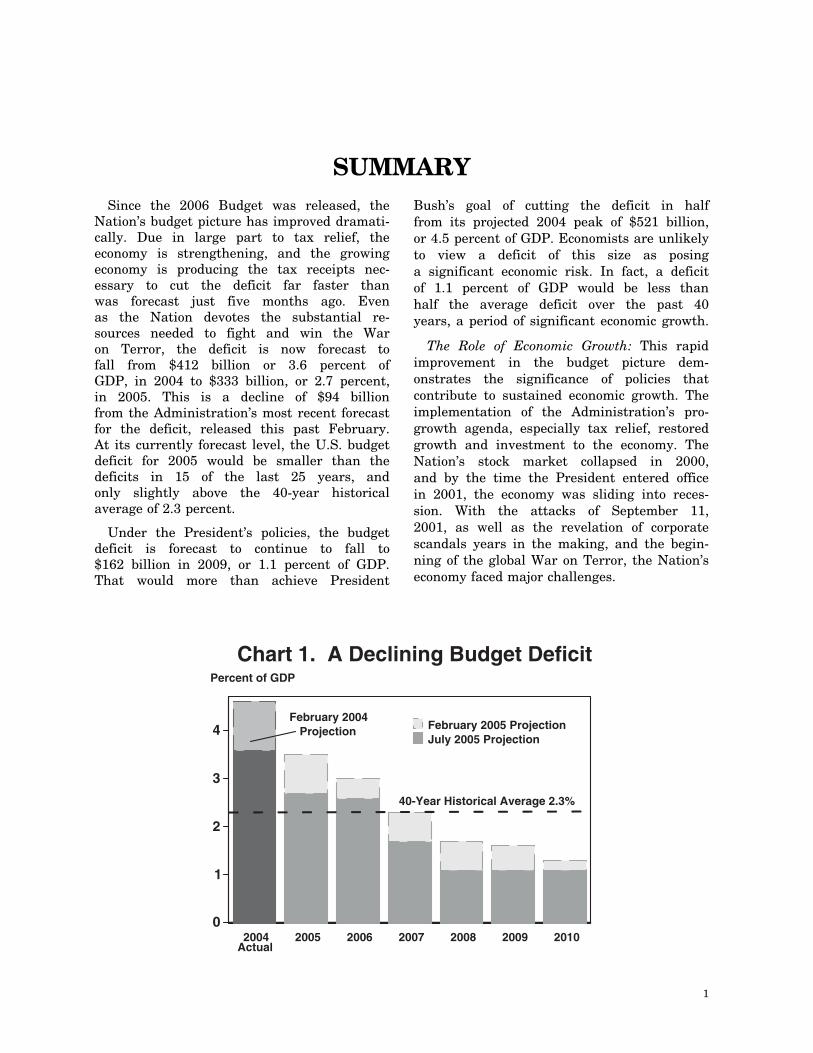
Nation’s budget picture has improved dramatically. Due in large part to tax relief, the economy is strengthening, and the growing economy is producing the tax receipts necessary to cut the deficit far faster than was forecast just five months ago. Even as the Nation devotes the substantial resources needed to fight and win the War on Terror, the deficit is now forecast to fall from $412 billion or 3.6 percent of GDP, in 2004 to $333 billion, or 2.7 percent, in 2005. This is a decline of $94 billion from the Administration’s most recent forecast for the deficit, released this past February. At its currently forecast level, the U.S. budget deficit for 2005 would be smaller than the deficits in 15 of the last 25 years, and only slightly above the 40-year historical average of 2.3 percent.
Under the President’s policies, the budget deficit is forecast to continue to fall to $162 billion in 2009, or 1.1 percent of GDP. That would more than achieve President
Bush’s goal of cutting the deficit in half from its projected 2004 peak of $521 billion, or 4.5 percent of GDP. Economists are unlikely to view a deficit of this size as posing a significant economic risk. In fact, a deficit of 1.1 percent of GDP would be less than half the average deficit over the past 40 years, a period of significant economic growth.
The Role of Economic Growth: This rapid improvement in the budget picture demonstrates the significance of policies that contribute to sustained economic growth. The implementation of the Administration’s pro-growth agenda, especially tax relief, restored growth and investment to the economy. The Nation’s stock market collapsed in 2000, and by the time the President entered office in 2001, the economy was sliding into recession. With the attacks of September 11, 2001, as well as the revelation of corporate scandals years in the making, and the beginning of the global War on Terror, the Nation’s economy faced major challenges.
Chart 1. A Declining Budget Deficit Percent of GDP
4
3
2
1
0
February 2005 Projection July 2005 Projection
February 2004 Projection
40-Year Historical Average 2.3%
2004 2005 2006 2007 2008 2009 2010 Actual
1
2 MID–SESSION REVIEW
Tax relief proposed by the President and enacted by the Congress in each year from 2001 through 2004 reduced income tax rates, raised incentives for small businesses to invest in new equipment, dramatically reduced the tax rate on dividends and capital gains, and phased out the death tax. Once fully in place, tax relief produced the desired results: The economy has grown by 12.4 percent since the recession ended in November, 2001, and has expanded by at least 3 percent for eight consecutive quarters. Employment is up by 3.7 million jobs since May of 2003, and the unemployment rate has fallen to 5 percent, lower than the average unemployment rate of the 1970s, 1980s, and 1990s. Both inflation and interest rates have remained low.
If made permanent, the President’s tax relief will continue strengthening our economy. Accelerated depreciation of investments will make it easier for small businesses to invest in new equipment. Lower taxes on investment income will make more capital available to businesses to hire and grow. Lower marginal income tax rates will increase incentives to work and encourage workers to save more. Allowing this tax relief to expire would endanger the economy’s prospects, placing into doubt gains in job creation and business investment that are critical to increases in tax revenues and further reductions in the size of the deficit.
The Role of Spending Discipline: As part of President Bush’s efforts to restore and sustain economic growth, he has focused on spending discipline. If the Federal Government sets priorities and limits its claim on resources taken from the private sector, it helps sustain a stronger, more productive economy. When achieved through spending restraint rather than through tax increases, deficit reduction bolsters confidence in the U.S. economy. This confidence of global capital markets brings important advantages to Amer-ica’s economy through lower interest rates and lower borrowing costs, which in turn lead to more investment and more jobs. Keeping America’s fiscal house in order, while holding taxes down, sustains growth and justifies investors’ confidence in the U.S. economy.
In each year of President Bush’s administration, he and the Congress have brought down the rate of growth in discretionary spending unrelated to defense and homeland security. His 2006 Budget calls for an outright reduction in such spending, the first such proposed cut since the Reagan Administration. The improved deficit picture in the later years of the budgetary window reflected in this Review assumes the continuation of the President’s policies of spending restraint.
The Congress has passed a 2006 Budget Resolution that holds overall discretionary spending to an increase less than the newly-revised 2.4 percent projected rate of inflation. The Resolution’s total discretionary spending figures assume an actual reduction in non-defense/non-security discretionary spending compared to last year’s levels.
While the House of Representatives has completed work on 2006 appropriations bills that remain within the President’s overall level and also achieve a reduction in non-security related spending, much work remains to be done to ensure that the final spending bills reflect this level of restraint.
Still, discretionary spending accounts for only about 40 percent of all Federal spending. Therefore, fiscal policy must also address the rate of growth in mandatory programs, which consume more than half of federal spending now, and are projected to rise steadily in coming decades.
The President’s 2006 Budget proposed reforms in mandatory programs that would produce savings of $85 billion over five years. Congress agreed to $35 billion of these savings in its Budget Resolution. This would be the first time since 1997 that Congress will have employed the expedited reconciliation process to reduce mandatory spending.
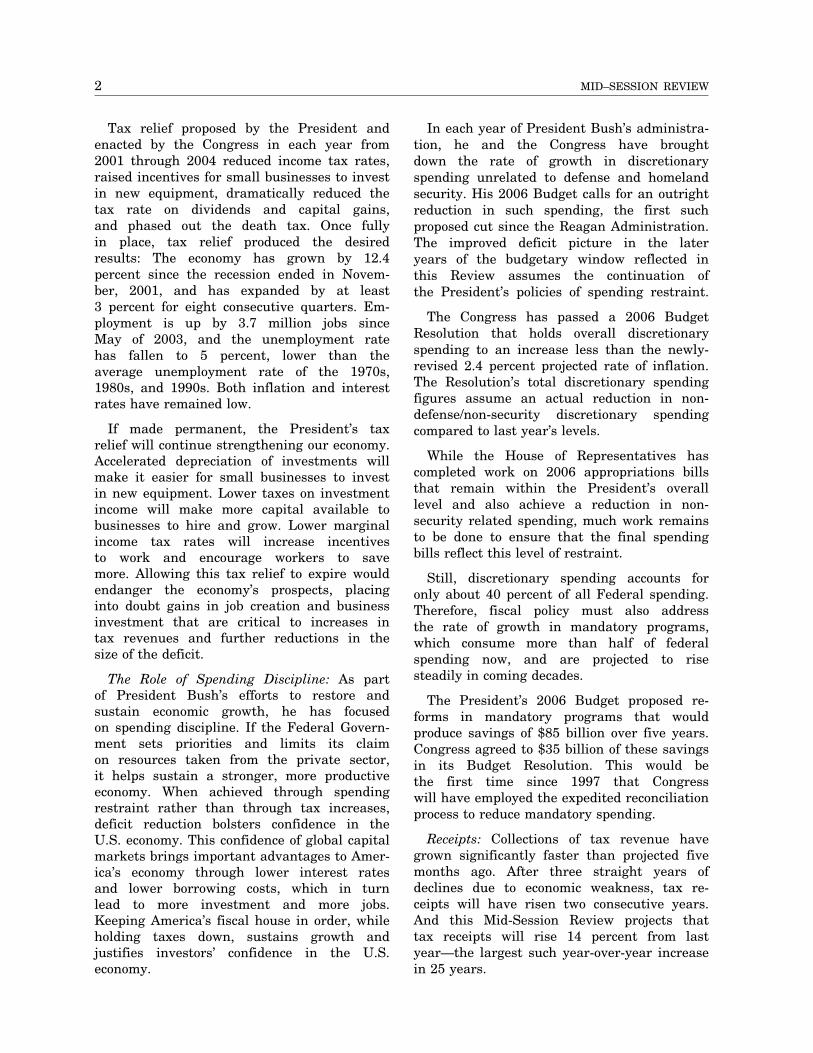
Receipts: Collections of tax revenue have grown significantly faster than projected five months ago. After three straight years of declines due to economic weakness, tax receipts will have risen two consecutive years. And this Mid-Session Review projects that tax receipts will rise 14 percent from last year—the largest such year-over-year increase in 25 years.
3 SUMMARY
Chart 2. Annual Percent Change in Receipts Percent change 20
15
10
5
0
-5
-10 1980 1984 1988 1992
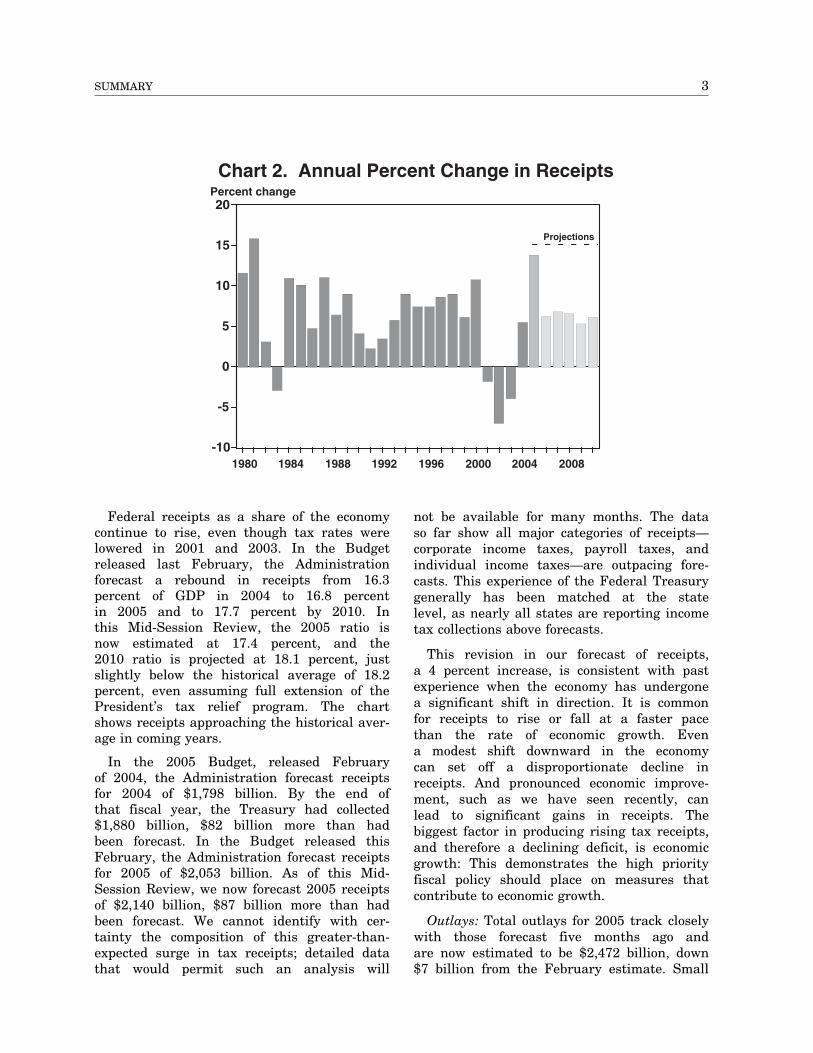
Federal receipts as a share of the economy continue to rise, even though tax rates were lowered in 2001 and 2003. In the Budget released last February, the Administration forecast a rebound in receipts from 16.3 percent of GDP in 2004 to 16.8 percent in 2005 and to 17.7 percent by 2010. In this Mid-Session Review, the 2005 ratio is now estimated at 17.4 percent, and the 2010 ratio is projected at 18.1 percent, just slightly below the historical average of 18.2 percent, even assuming full extension of the President’s tax relief program. The chart shows receipts approaching the historical average in coming years.
In the 2005 Budget, released February of 2004, the Administration forecast receipts for 2004 of $1,798 billion. By the end of that fiscal year, the Treasury had collected $1,880 billion, $82 billion more than had been forecast. In the Budget released this February, the Administration forecast receipts for 2005 of $2,053 billion. As of this Mid-Session Review, we now forecast 2005 receipts of $2,140 billion, $87 billion more than had been forecast. We cannot identify with certainty the composition of this greater-than-expected surge in tax receipts; detailed data that would permit such an analysis will
Projections
1996 2000 2004 2008
not be available for many months. The data so far show all major categories of receipts— corporate income taxes, payroll taxes, and individual income taxes—are outpacing forecasts. This experience of the Federal Treasury generally has been matched at the state level, as nearly all states are reporting income tax collections above forecasts.
This revision in our forecast of receipts, a 4 percent increase, is consistent with past experience when the economy has undergone a significant shift in direction. It is common for receipts to rise or fall at a faster pace than the rate of economic growth. Even a modest shift downward in the economy can set off a disproportionate decline in receipts. And pronounced economic improvement, such as we have seen recently, can lead to significant gains in receipts. The biggest factor in producing rising tax receipts, and therefore a declining deficit, is economic growth: This demonstrates the high priority fiscal policy should place on measures that contribute to economic growth.
Outlays: Total outlays for 2005 track closely with those forecast five months ago and are now estimated to be $2,472 billion, down $7 billion from the February estimate. Small
4 MID–SESSION REVIEW
Chart 3. Receipts as a Percent of GDP Percent of GDP 20
19
18
17
16 2001 2002 2003 2004 2005
increases due to policy changes are more than offset by reductions due to estimating changes.
The Budget Resolution passed by the Congress assumes an additional $50 billion in 2006 for the continuing costs of operations in Iraq and Afghanistan. This Review assumes enactment of this funding, which would increase outlays by $37 billion in 2006 and $13 billion in 2007 and beyond. The full cost of these operations in 2006 is uncertain, but they are expected to require additional funding beyond the $50 billion included in the Congress’ Budget Resolution. The Administration expects to request additional 2006 funding from the Congress when requirements for these operations can be estimated more reliably. This Review also does not reflect the effect of undetermined but anticipated supplemental requests for operations beyond 2006.
This update also includes the estimated budget impact from the creation of personal accounts under the President’s Social Security reform proposal. Transition financing for these accounts would not begin to take effect until 2009, and is easily accommodated within the President’s deficit reduction goal. Although
40-Year Historical Average 18.2%
2006 2007 2008 2009 2010
transition financing is incorporated into our deficit projections, it should not have the same effect on capital markets as traditional federal borrowing. First, such financing would essentially bring forward obligations already owed in the form of promised future benefits, and as a result, would reduce existing future obligations by a roughly equal amount. Second, unlike debt issued to fund government spending, there would be no impact on net national savings, because every dollar of transition financing would be saved in a personal account and invested in the capital markets.
Long-Term Fiscal Outlook: The greatest fiscal danger over the long-term is posed by the unfunded obligations in major entitlement programs—Social Security, Medicare, and Medicaid. The rising costs of these programs are tied largely to two factors: The aging of the population, and the growing use and cost of health care. Both of these factors are largely structural. In 2008, the first of the Baby Boom generation begins to collect Social Security benefits. In 2017, the program will collect less in payroll taxes than it pays out in benefits. At that point, the system will be funded partially by general tax revenue. In 2041, the system is projected to go bankrupt because it will have insufficient
5 SUMMARY
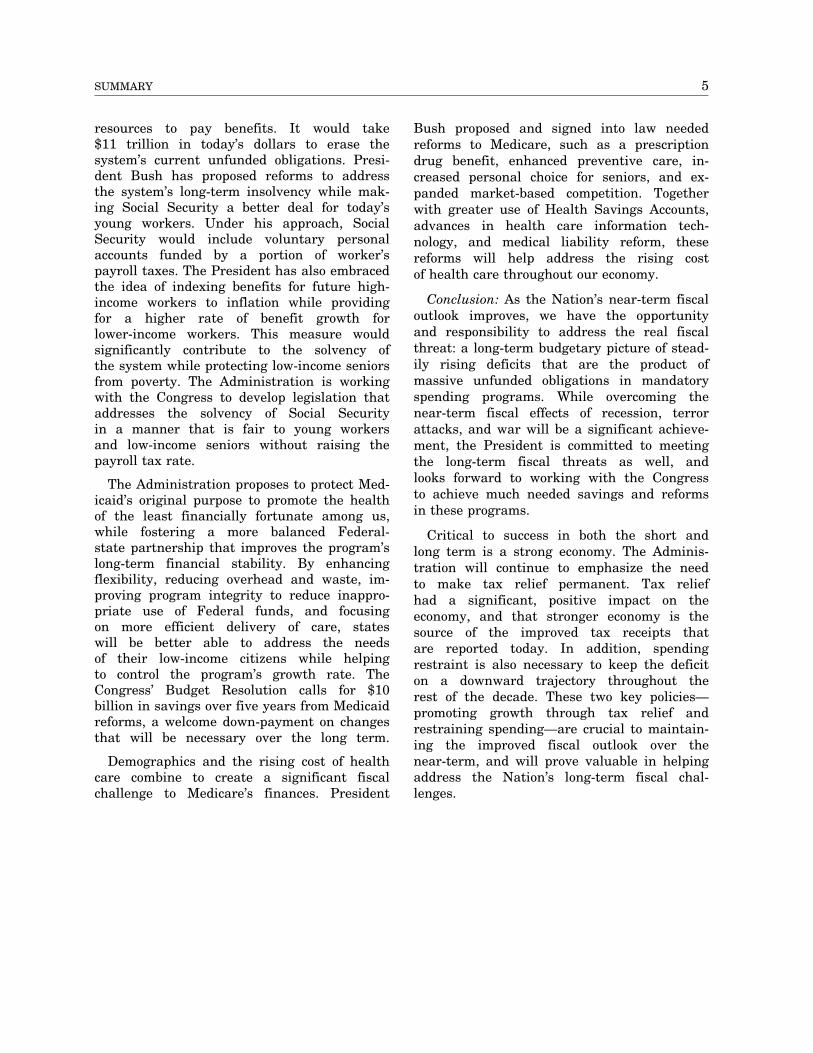
resources to pay benefits. It would take $11 trillion in today’s dollars to erase the system’s current unfunded obligations. President Bush has proposed reforms to address the system’s long-term insolvency while making Social Security a better deal for today’s young workers. Under his approach, Social Security would include voluntary personal accounts funded by a portion of worker’s payroll taxes. The President has also embraced the idea of indexing benefits for future high-income workers to inflation while providing for a higher rate of benefit growth for lower-income workers. This measure would significantly contribute to the solvency of the system while protecting low-income seniors from poverty. The Administration is working with the Congress to develop legislation that addresses the solvency of Social Security in a manner that is fair to young workers and low-income seniors without raising the payroll tax rate.
The Administration proposes to protect Med-icaid’s original purpose to promote the health of the least financially fortunate among us, while fostering a more balanced Federal-state partnership that improves the program’s long-term financial stability. By enhancing flexibility, reducing overhead and waste, improving program integrity to reduce inappropriate use of Federal funds, and focusing on more efficient delivery of care, states will be better able to address the needs of their low-income citizens while helping to control the program’s growth rate. The Congress’ Budget Resolution calls for $10 billion in savings over five years from Medicaid reforms, a welcome down-payment on changes that will be necessary over the long term.
Demographics and the rising cost of health care combine to create a significant fiscal challenge to Medicare’s finances. President
Bush proposed and signed into law needed reforms to Medicare, such as a prescription drug benefit, enhanced preventive care, increased personal choice for seniors, and expanded market-based competition. Together with greater use of Health Savings Accounts, advances in health care information technology, and medical liability reform, these reforms will help address the rising cost of health care throughout our economy.
Conclusion: As the Nation’s near-term fiscal outlook improves, we have the opportunity and responsibility to address the real fiscal threat: a long-term budgetary picture of steadily rising deficits that are the product of massive unfunded obligations in mandatory spending programs. While overcoming the near-term fiscal effects of recession, terror attacks, and war will be a significant achievement, the President is committed to meeting the long-term fiscal threats as well, and looks forward to working with the Congress to achieve much needed savings and reforms in these programs.
Critical to success in both the short and long term is a strong economy. The Administration will continue to emphasize the need to make tax relief permanent. Tax relief had a significant, positive impact on the economy, and that stronger economy is the source of the improved tax receipts that are reported today. In addition, spending restraint is also necessary to keep the deficit on a downward trajectory throughout the rest of the decade. These two key policies— promoting growth through tax relief and restraining spending—are crucial to maintaining the improved fiscal outlook over the near-term, and will prove valuable in helping address the Nation’s long-term fiscal challenges.
6 MID–SESSION REVIEW
Table 1. CHANGES FROM THE FEBRUARY BUDGET (In billions of dollars)
2005 2006 2007 2008 2009 2010 2006–2010
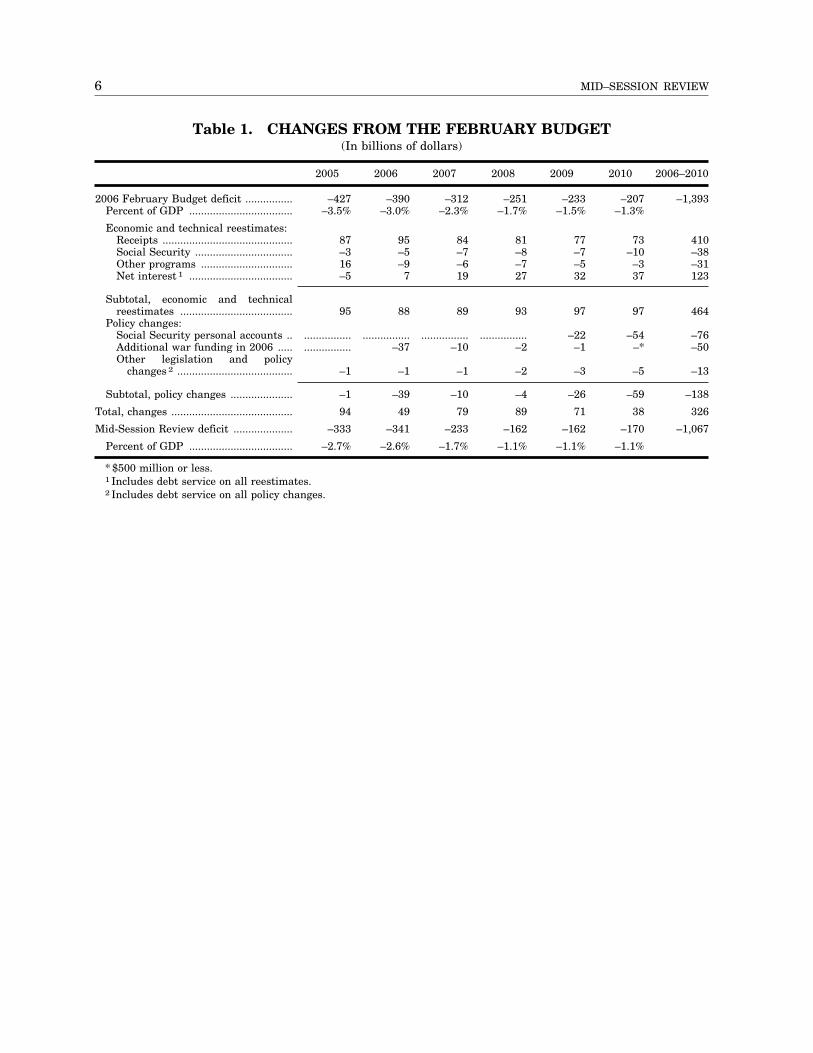
2006 February Budget deficit ................ –427 –390 –312 –251 –233 –207 –1,393 Percent of GDP ................................... –3.5% –3.0% –2.3% –1.7% –1.5% –1.3%
Economic and technical reestimates: Receipts ............................................ 87 95 84 81 77 73 410 Social Security ................................. –3 –5 –7 –8 –7 –10 –38 Other programs ............................... 16 –9 –6 –7 –5 –3 –31 Net interest 1 ................................... –5 7 19 27 32 37 123
Subtotal, economic and technical reestimates ...................................... 95 88 89 93 97 97 464
Policy changes: Social Security personal accounts .. ................ ................ ................ ................ –22 –54 –76 Additional war funding in 2006 ..... ................ –37 –10 –2 –1 –* –50 Other legislation and policy
changes 2 ....................................... –1 –1 –1 –2 –3 –5 –13
Subtotal, policy changes ..................... –1 –39 –10 –4 –26 –59 –138
Total, changes ......................................... 94 49 79 89 71 38 326
Mid-Session Review deficit .................... –333 –341 –233 –162 –162 –170 –1,067
Percent of GDP ................................... –2.7% –2.6% –1.7% –1.1% –1.1% –1.1%
* $500 million or less. 1 Includes debt service on all reestimates. 2 Includes debt service on all policy changes.
ECONOMIC ASSUMPTIONS The economy is growing and employment
is rising. The policies pursued by the Administration and the Federal Reserve have paid off handsomely by reigniting economic growth and job creation. Since May 2003 payroll jobs have risen by 3.7 million, while the unemployment rate, which peaked in June 2003, has fallen to 5.0 percent. Job gains have been widespread across industries and regions. Compared with two years ago, the unemployment rate was lower in 41 of the 50 States in May 2005.
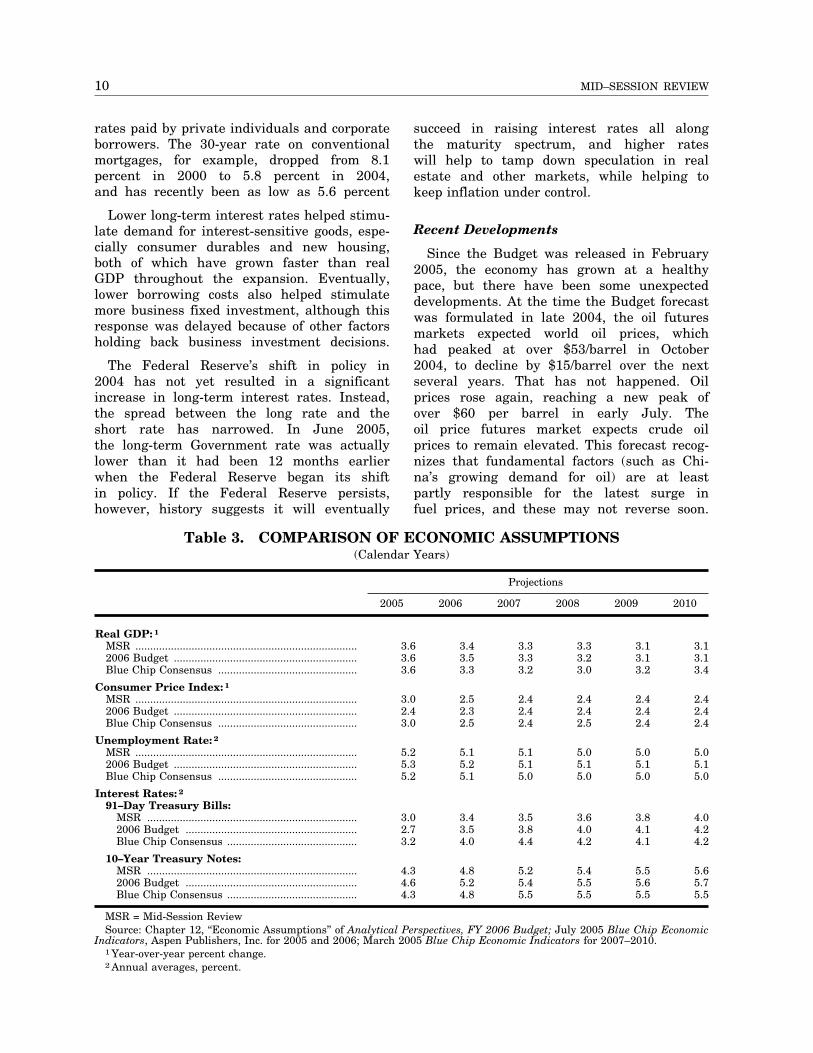
The economic expansion that began three and one half years ago continues on a self-sustaining course that should give the economy great resilience against the normal disruptions that arise with time. The updated Administration forecast for this Mid-Session Review anticipates that growth will continue at between 3 and 31⁄2 percent per year over the next five years with substantial job gains. As the expansion matures, the growth rate is projected to ease somewhat while remaining close to the long-run rate of change in potential GDP. Inflation is projected to remain under control, falling back to around 21⁄2 percent per year as measured by the Consumer Price Index (CPI). Low inflation and steady growth should result in solid gains in income which can support the continuing expansion on a self-sustained basis. This view of the economic outlook is broadly shared by most private economic forecasters, as represented, for example, by the Blue Chip Consensus. Table 3, below, compares the Mid-Session Review forecast with the original forecast for the 2006 Budget and the July Blue Chip Consensus forecast.
In the Administration’s first term, fiscal and monetary policies were focused on overcoming a series of powerful shocks that had brought economic growth to a near standstill in 2000–2001, and which continued to impede the economy in 2002 and early 2003. A steep decline in stock prices began in 2000, reducing household wealth and hurting consumption. Real GDP fell in the third quarter of 2000, and a recession began early
in 2001. The stock market decline contributed to falling business investment, which declined for nine straight quarters in 2001–2003. The terrorist attacks in September 2001 and the onset of the global War on Terror delayed the recovery in business investment by adding to uncertainty and raising costs. This held down growth at the beginning of the expansion and delayed firms’ investment and hiring decisions until these uncertainties began to fade. The sluggishness in investment was further prolonged by the corporate accounting scandals dating back to the 1990s revealed in the aftermath of the stock market decline.
Administration policy, especially broad-based tax relief, and the inherent resilience of U.S. workers and businesses succeeded in overcoming these shocks, and since 2003 the economy has proceeded on a solid expansionary path. Investment is growing again and providing the underpinnings for future income growth. There have been subsequent shocks to the economy, notably the sharp rise in energy prices, but the expansion has continued apace despite these further disruptions.
With the economic expansion firmly established, fiscal policy has moved toward greater spending restraint and monetary policy has become less accommodative, while both have emphasized policies that will sustain the expansion in the long run. A year ago, the Federal Reserve began to raise short-term interest rates, seeking to reduce the policy accommodation it had been providing at a pace it described in its public statements as ‘‘measured’’. This shift moves policy toward a neutral monetary stance intended to provide enough liquidity to sustain the expansion while maintaining control of the rate of inflation. Since June 2004, the Federal Reserve has raised the Federal Funds rate from 1 percent to 31⁄4 percent. Meanwhile, the Administration has sought to extend permanently most of the tax changes enacted in 2001–2004 with the goal of fostering long-run incentives for work, saving, and investment. The Administration proposes to
7
8 MID–SESSION REVIEW
reduce the budget deficit through the revenue growth that follows from a strong economy and through spending discipline and budgetary reforms aimed at cutting back inefficient and unnecessary Government programs.
So far in 2005, the budget deficit has declined much more than projected at the beginning of the year, largely because of a surge in Federal receipts. The rapid growth of receipts partly reflects the revival of economic growth in 2003–2005. In the interest of prudent budgeting, the Mid-Session Review takes a cautious view of the economic outlook
that is close to the current Blue Chip Consensus of professional forecasters. If the consensus view on growth prevails, the budget deficit will improve as shown in this report as long as spending remains restrained.
Fiscal and Monetary Policy
Fiscal Policy: When the Administration took office the economy had already slowed substantially from the rapid pace of growth in the late 1990s. Indeed, it was on the brink of a recession. Acting promptly, Congress and the Administration put in place tax
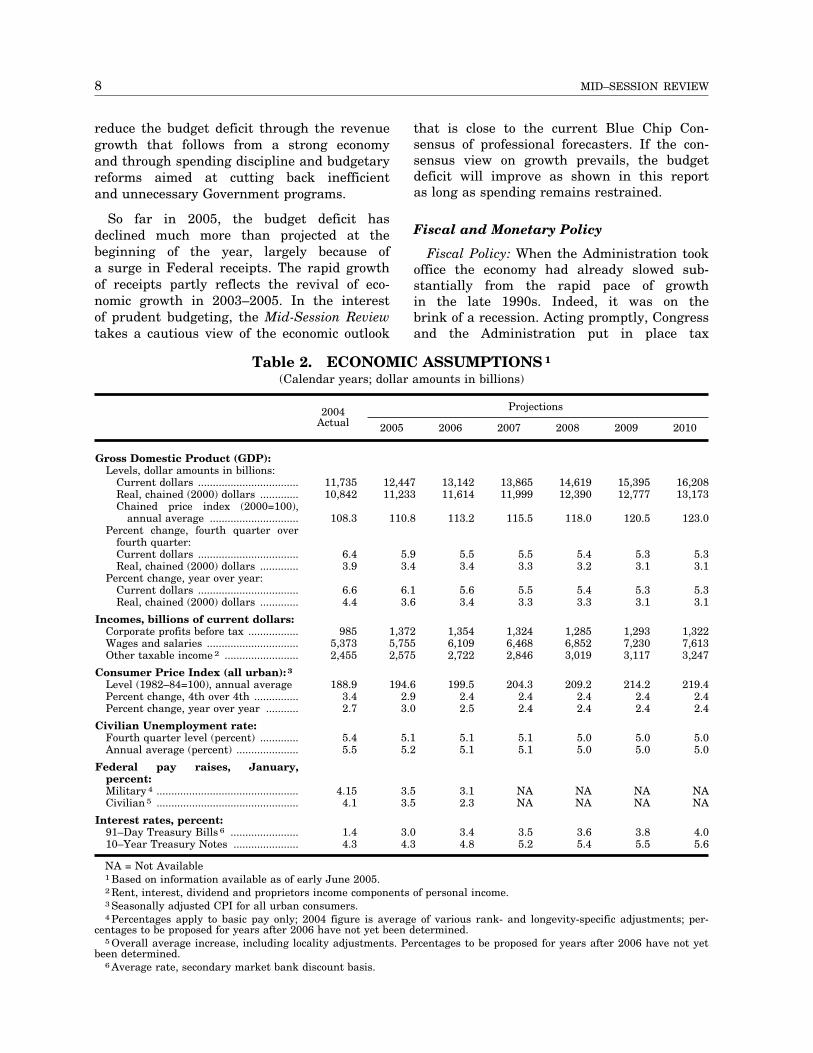
Table 2. ECONOMIC ASSUMPTIONS 1
(Calendar years; dollar amounts in billions)
2004 Projections Actual 2005 2006 2007 2008 2009 2010
Gross Domestic Product (GDP): Levels, dollar amounts in billions:
Current dollars .................................. 11,735 12,447 13,142 13,865 14,619 15,395 16,208 Real, chained (2000) dollars ............. 10,842 11,233 11,614 11,999 12,390 12,777 13,173 Chained price index (2000=100),
annual average .............................. 108.3 110.8 113.2 115.5 118.0 120.5 123.0 Percent change, fourth quarter over
fourth quarter: Current dollars .................................. 6.4 5.9 5.5 5.5 5.4 5.3 5.3 Real, chained (2000) dollars ............. 3.9 3.4 3.4 3.3 3.2 3.1 3.1
Percent change, year over year: Current dollars .................................. 6.6 6.1 5.6 5.5 5.4 5.3 5.3 Real, chained (2000) dollars ............. 4.4 3.6 3.4 3.3 3.3 3.1 3.1
Incomes, billions of current dollars: Corporate profits before tax ................. 985 1,372 1,354 1,324 1,285 1,293 1,322 Wages and salaries ............................... 5,373 5,755 6,109 6,468 6,852 7,230 7,613 Other taxable income 2 ......................... 2,455 2,575 2,722 2,846 3,019 3,117 3,247
Consumer Price Index (all urban): 3
Level (1982–84=100), annual average 188.9 194.6 199.5 204.3 209.2 214.2 219.4 Percent change, 4th over 4th ............... 3.4 2.9 2.4 2.4 2.4 2.4 2.4 Percent change, year over year ........... 2.7 3.0 2.5 2.4 2.4 2.4 2.4
Civilian Unemployment rate: Fourth quarter level (percent) ............. 5.4 5.1 5.1 5.1 5.0 5.0 5.0 Annual average (percent) ..................... 5.5 5.2 5.1 5.1 5.0 5.0 5.0
Federal pay raises, January, percent: Military 4 ................................................ 4.15 3.5 3.1 NA NA NA NA Civilian 5 ................................................ 4.1 3.5 2.3 NA NA NA NA
Interest rates, percent: 91–Day Treasury Bills 6 ....................... 1.4 3.0 3.4 3.5 3.6 3.8 4.0 10–Year Treasury Notes ...................... 4.3 4.3 4.8 5.2 5.4 5.5 5.6
NA = Not Available1 Based on information available as of early June 2005.2 Rent, interest, dividend and proprietors income components of personal income.3 Seasonally adjusted CPI for all urban consumers.4 Percentages apply to basic pay only; 2004 figure is average of various rank- and longevity-specific adjustments; per
centages to be proposed for years after 2006 have not yet been determined. 5 Overall average increase, including locality adjustments. Percentages to be proposed for years after 2006 have not yet
been determined. 6 Average rate, secondary market bank discount basis.
9 ECONOMIC ASSUMPTIONS
reductions that helped shorten the recession and limited the decline in real GDP. The economic recovery threatened to stall following the terrorist attacks on September 11, 2001, and the beginning of the global War on Terror, and so further tax reductions were enacted, intended to strengthen the expansion. Altogether there were four major tax bills enacted in the Administration’s first term which combined to revive and strengthen economic growth:
• The Economic Growth and Tax Relief and Reconciliation Act passed in 2001 lowered marginal income tax rates, began the phase-out and eventual elimination of the ‘‘death tax’’, reduced the tax code’s marriage penalty, and created a new 10 percent bottom tax bracket.
• The Job Creation and Worker Assistance Act passed in 2002 had a twofold purpose. It provided additional, temporary unemployment benefits and it created temporary investment incentives for business by allowing firms to expense up to 30 percent of the cost of newly purchased assets.
• The Jobs and Growth Tax Relief Reconciliation Act passed in 2003 again extended temporary unemployment insurance benefits, advanced the effective date of many of the previously enacted tax cuts, expanded the expensing provisions passed in 2002, and reduced individual income tax rates on dividends and capital gains, removing much of the ‘‘double’’ taxation to which such income was previously subject.
• The Working Families Tax Relief Act of 2004 extended most of the tax relief for working families through 2010, provided temporary relief from the Alternative Minimum Tax, and extended the Research and Experimentation Tax Credit.
Together the four tax measures provided a significant boost to household disposable income. The initial tax relief in fiscal year 2001 amounted to $68 billion and it rose to $289 billion in 2004, about 21⁄2 percent of GDP. In 2005, the amount of tax relief has been scaled back to around $180 billion with the expiration of the temporary investment incentives. The economy responded strongly to the stimulus. After growing at
an anemic 2.2 percent annual rate during the first five quarters of the recovery, the growth rate jumped to 4.1 percent in the second quarter of 2003, and jumped again to 7.4 percent three months later following passage of the 2003 tax act. This was the fastest growth rate in almost twenty years. Since then the growth rate has subsided, but it has averaged 3.9 percent, which is much faster than earlier in the recovery and fast enough to spur substantial job growth.
With growth reestablished on a solid basis, the Administration’s fiscal policy has achieved one of its main objectives. Making the tax changes permanent will ensure that the incentives for work, saving, and investment are maintained. Meanwhile, the Administration seeks to control the deficit through the revenue growth that follows from a strong economy and by restraining spending and promoting greater efficiency in Government program operations.
Monetary Policy: The Federal Reserve also sought to revive economic growth. From the start of 2001 through June 2003, it lowered its target for the federal funds rate thirteen times, reducing it from 61⁄2 percent to 1 percent. For the next twelve months, the Federal Reserve held the funds rate at 1 percent, and then, when it was clear that growth had rebounded, it began slowly raising interest rates. Over the last twelve months, the Federal Reserve has raised interest rates nine times, bringing its target rate up to 31⁄4 percent. The Federal Reserve has explained that its goal is to remove the policy accommodation adopted in 2001–2003 at a ‘‘measured pace.’’
While short-term interest rates have closely tracked changes in Federal Reserve policy, long-term rates have shown a looser connection. When the Federal Reserve was easing policy in 2001–2003 there was some concern that long-term rates did not decline immediately with the cuts in the Federal Reserve’s interest rate target. Eventually, however, the yield on 10-year Treasury notes did decline from 6.0 percent in 2000 (calendar-year average) to 4.0 percent in 2003. The decline in long-term interest rates lowered Government borrowing costs and reduced the interest
10 MID–SESSION REVIEW
rates paid by private individuals and corporate borrowers. The 30-year rate on conventional mortgages, for example, dropped from 8.1 percent in 2000 to 5.8 percent in 2004, and has recently been as low as 5.6 percent
Lower long-term interest rates helped stimulate demand for interest-sensitive goods, especially consumer durables and new housing, both of which have grown faster than real GDP throughout the expansion. Eventually, lower borrowing costs also helped stimulate more business fixed investment, although this response was delayed because of other factors holding back business investment decisions.
The Federal Reserve’s shift in policy in 2004 has not yet resulted in a significant increase in long-term interest rates. Instead, the spread between the long rate and the short rate has narrowed. In June 2005, the long-term Government rate was actually lower than it had been 12 months earlier when the Federal Reserve began its shift in policy. If the Federal Reserve persists, however, history suggests it will eventually
succeed in raising interest rates all along the maturity spectrum, and higher rates will help to tamp down speculation in real estate and other markets, while helping to keep inflation under control.
Recent Developments
Since the Budget was released in February 2005, the economy has grown at a healthy pace, but there have been some unexpected developments. At the time the Budget forecast was formulated in late 2004, the oil futures markets expected world oil prices, which had peaked at over $53/barrel in October 2004, to decline by $15/barrel over the next several years. That has not happened. Oil prices rose again, reaching a new peak of over $60 per barrel in early July. The oil price futures market expects crude oil prices to remain elevated. This forecast recognizes that fundamental factors (such as Chi-na’s growing demand for oil) are at least partly responsible for the latest surge in fuel prices, and these may not reverse soon.
Table 3. COMPARISON OF ECONOMIC ASSUMPTIONS (Calendar Years)
Projections
2005 2006 2007 2008 2009 2010
Real GDP: 1
MSR ........................................................................... 3.6 3.4 3.3 3.3 3.1 3.1 2006 Budget .............................................................. 3.6 3.5 3.3 3.2 3.1 3.1 Blue Chip Consensus ............................................... 3.6 3.3 3.2 3.0 3.2 3.4
Consumer Price Index: 1
MSR ........................................................................... 3.0 2.5 2.4 2.4 2.4 2.4 2006 Budget .............................................................. 2.4 2.3 2.4 2.4 2.4 2.4 Blue Chip Consensus ............................................... 3.0 2.5 2.4 2.5 2.4 2.4
Unemployment Rate: 2
MSR ........................................................................... 5.2 5.1 5.1 5.0 5.0 5.0 2006 Budget .............................................................. 5.3 5.2 5.1 5.1 5.1 5.1 Blue Chip Consensus ............................................... 5.2 5.1 5.0 5.0 5.0 5.0
Interest Rates: 2
91–Day Treasury Bills: MSR ....................................................................... 3.0 3.4 3.5 3.6 3.8 4.0 2006 Budget .......................................................... 2.7 3.5 3.8 4.0 4.1 4.2 Blue Chip Consensus ............................................ 3.2 4.0 4.4 4.2 4.1 4.2
10–Year Treasury Notes: MSR ....................................................................... 4.3 4.8 5.2 5.4 5.5 5.6 2006 Budget .......................................................... 4.6 5.2 5.4 5.5 5.6 5.7 Blue Chip Consensus ............................................ 4.3 4.8 5.5 5.5 5.5 5.5
MSR = Mid-Session Review Source: Chapter 12, ‘‘Economic Assumptions’’ of Analytical Perspectives, FY 2006 Budget; July 2005 Blue Chip Economic
Indicators, Aspen Publishers, Inc. for 2005 and 2006; March 2005 Blue Chip Economic Indicators for 2007–2010. 1 Year-over-year percent change. 2 Annual averages, percent.
11 ECONOMIC ASSUMPTIONS
Despite the changing outlook for oil prices, the U.S. economic outlook has remained essentially unchanged in the last six months, and the Administration’s forecast for the Mid-Session Review is very similar to the FY 2006 Budget forecast. Rising oil prices have a much smaller effect on the economy than they did thirty-five years ago before the oil price shocks of the 1970s. Since then U.S. energy use per dollar of GDP has declined by about 47 percent. Also, measured in real terms, relative to the CPI, oil prices are still well below the peak levels reached in the early 1980s. At that time, the price of oil was around $40 per barrel, which would be $80 per barrel in today’s prices. Growth would likely have been even faster in 2004–2005 had it not been for the run-up in the price of oil, but the net impact of these changes on the growth rate appears to have been small.
Real Gross Domestic Product (GDP): In the first quarter of 2005, the growth rate was initially reported as 3.1 percent, leading some analysts to speculate that the economy was encountering a ‘‘soft patch,’’ perhaps reflecting the effects of higher oil prices. By the time that the final data arrived in June, however, the growth rate had increased to 3.8 percent, casting doubt on such analysis. Over the last four quarters, real GDP increased by 3.7 percent. Based on early indications, most forecasters polled in the Blue Chip survey believe growth continued at a healthy clip in the 3 to 4 percent range in the second quarter (preliminary official data for second quarter GDP will not be available until after the Mid-Session Review is issued), and that growth will continue in this range for the rest of 2005 and into 2006.
Business Investment: Business spending on new equipment has increased rapidly since the beginning of 2003. Growth was especially strong in the second half of 2004, perhaps reflecting the bonus depreciation provisions in the 2002 and 2003 tax bills, which expired at the end of 2004. Investment slowed somewhat in the first quarter of 2005, but shipments of capital goods strengthened in April and May, holding out the promise that equipment investment may be firming again.
Business investment in new structures has not revived as vigorously as equipment spending, but that is a typical cyclical pattern. It takes longer for businesses to adjust their plans for new plant or office buildings, so these investments tend to lag the turnaround in equipment spending. Structures investment in future quarters should also see a revival. Higher oil prices will encourage more oil drilling which will show up in this component of GDP.
Consumption and Housing: The consumer has been the mainstay of the current expansion, and household spending on consumption and housing helped to sustain economic growth at the beginning of the recovery even when other components of GDP were declining. With the other components of GDP again on the upswing, consumption and residential investment can grow more slowly without threatening the expansion. Household wealth is high thanks to rising home prices and the revival in the stock market since 2002. Household debt has also surged, but the value of household assets has increased much more than debt. In real terms, household wealth was higher at the end of 2004 than at any time since the peak of the stock market boom in the first quarter of 2000. Rising real wages and salaries, thanks to rising productivity and increased employment, provide a solid foundation for future increases in consumption.
Net Exports: The U.S. trade balance has declined substantially during the current expansion. U.S. consumers have expanded their purchases of foreign goods at a much faster rate than U.S. exports have increased. The oil price shock has also worsened the trade balance by adding to the cost of imported oil. The decline in net exports has been the single biggest restraint on U.S. economic growth since 2001. Our major trading partners have not matched the U.S. success in stimulating faster domestic growth, and there are other imbalances arising from developing economies. Consequently, U.S. consumers are the mainstay of worldwide demand.
Inflation: The rate of price inflation increased in 2004–2005. The 12-month change in the CPI reached 2.8 percent in May 2005. Most of this increase was due to
12 MID–SESSION REVIEW
the surge in oil prices. The energy component of the CPI was up 9.8 percent over the 12 months ending in May. Excluding the volatile food and energy components, the index was up only 2.2 percent. There has been an uptick in this underlying measure of ‘‘core’’ inflation, but a relatively modest one. During 2003, core inflation was 1.1 percent, and it has increased by about 1 percentage point since then. As oil prices stabilize, most forecasters expect overall CPI inflation to subside to a range around 21⁄2
percent per year.
Labor Markets and Productivity: Payroll jobs have increased by 3.7 million since the second quarter of 2003, when the real GDP growth rate increased, and the unemployment rate has declined from 6.3 percent in June 2003 to 5.0 percent in June 2005. So far in 2005, the economy has been adding jobs at the rate of about 180,000 per month. Unlike the first 2 years of the expansion, growth is currently being driven by both employment increases and productivity gains. Up until 2003, productivity growth had accounted for all of the increase in output during the expansion.
The average rate of productivity growth since the beginning of the expansion is 3.8 percent. This is the fastest productivity has grown over any comparable phase of the business cycle since the 1960s. Productivity growth, however, has slowed to a pace more consistent with recent history as job growth has increased. Over the last four quarters, productivity has advanced at an average rate of 2.6 percent. This is similar to the productivity growth in the latter half of the 1990s, and a substantial improvement compared with the trend from 1975 to 1995, but it is less than the stellar performance in the early stages of the expansion. Rapid productivity growth is welcome because it is the main channel through which average living standards can improve over time, but the growth of productivity was so rapid earlier in the expansion that firms did not need to hire more workers to meet new demands for their products and job growth was sluggish. That has changed, and as productivity growth has slowed significantly more workers are being added to payrolls. The current rate of productivity growth can
support a healthy increase in the standard of living while allowing for substantial employment gains without requiring further macroeconomic stimulus.
The economy is healthy and the expansion has a solid foundation which should allow growth to continue. Unexpected events are always possible, but so far the economy, with the help of timely shifts in macroeconomic policy, has been able to withstand the shocks that have occurred since 2000. The spike in oil prices over the last two years is the latest shock, but it did not derail the expansion. Core inflation has edged up, but shifts in monetary and fiscal policy since 2004 are keeping inflation under control. With low inflation and strong productivity growth, the economy should be able to continue producing solid gains in employment and output.
Revised Economic Assumptions
The economic assumptions for the Mid-Session Review were determined in early June and they are summarized in table 2. The projections for the main macroeconomic variables—real GDP, inflation, unemployment, and interest rates—have not changed materially since the 2006 Budget. The Mid-Session assumptions are also quite close to those of the Blue Chip Consensus, an average of about 50 leading private forecasters.
Real GDP: Real GDP growth has been close to the 2006 Budget assumptions in the last quarter of 2004 and the first quarter of 2005. Some forecasters reduced their projected growth for the year when the preliminary GDP figures for the first quarter showed less growth than expected, but with the revised data showing 3.8 percent growth, the Administration has maintained its view of the likely outcome for 2005. Over the next three years, 2006–2008, growth is expected to average 3.3 percent and then to edge down in 2009–2010 to 3.1 percent. The year 2008 marks the year in which the oldest of the ‘‘baby-boom’’ generation reach 62 and become eligible for early retirement under Social Security. The aging of the population will accelerate with the retirement of the baby boomers and that is likely to reduce the growth of the labor force
13 ECONOMIC ASSUMPTIONS
and real GDP. The main effects of this demographic transition, however, will not show up until after 2010, which is outside of the current budget horizon.
Potential GDP and Unemployment: Potential GDP measures how much the economy is capable of producing when the national labor market is in balance with no tendency for inflation to increase or decrease. This is sometimes described as full employment, although in a dynamic economy, with firms and workers entering and exiting the market, measured unemployment, even when the labor market is in balance, will never be zero. The Administration estimates that an unemployment rate of 5.0 percent is roughly consistent with actual GDP being close to potential. As projected, real GDP grows near the rate of growth in potential GDP throughout the forecast period.
Inflation: With output close to potential throughout the forecast, inflation is projected to remain roughly stable following this year’s temporary upsurge, which was driven by higher oil prices. The CPI is projected to rise 3.0 percent this year, but next year the CPI inflation rate is projected to drop to and sustain 2.4 percent (fourth quarter to fourth quarter) as oil prices stabilize. The chain-weighted price index for GDP reflects all of the prices that enter GDP and so is a broader measure of inflation than the CPI, which reflects only prices of consumption items. For this and other reasons, inflation as measured by the two indices diverges. The Administration projects that the GDP price index will rise 2.3 percent this year before receding to 2.1 percent in 2006 and beyond. The difference between the two inflation measures is significant for the Budget forecast, because outlays tend to rise with the CPI while receipts tend to increase with the GDP price index. Increasing the divergence, other things being equal, makes the projected deficit larger.
Interest Rates: The largest changes in the forecast since the Budget are in the projected interest rates. The Administration bases its projection of short-term interest rates on
the financial futures markets. This is a cautious forecasting rule which reflects the collective insights of all the millions of market participants. In early June, when the forecast was finalized, the markets expected short-term rates to rise. In forecasting the 10year Treasury rate, the Administration has assumed that the normal yield spread between this rate and the short-term rates will reestablish itself over the next year or so, which would raise the 10-year rate to around 5.0 percent by the end of 2006.
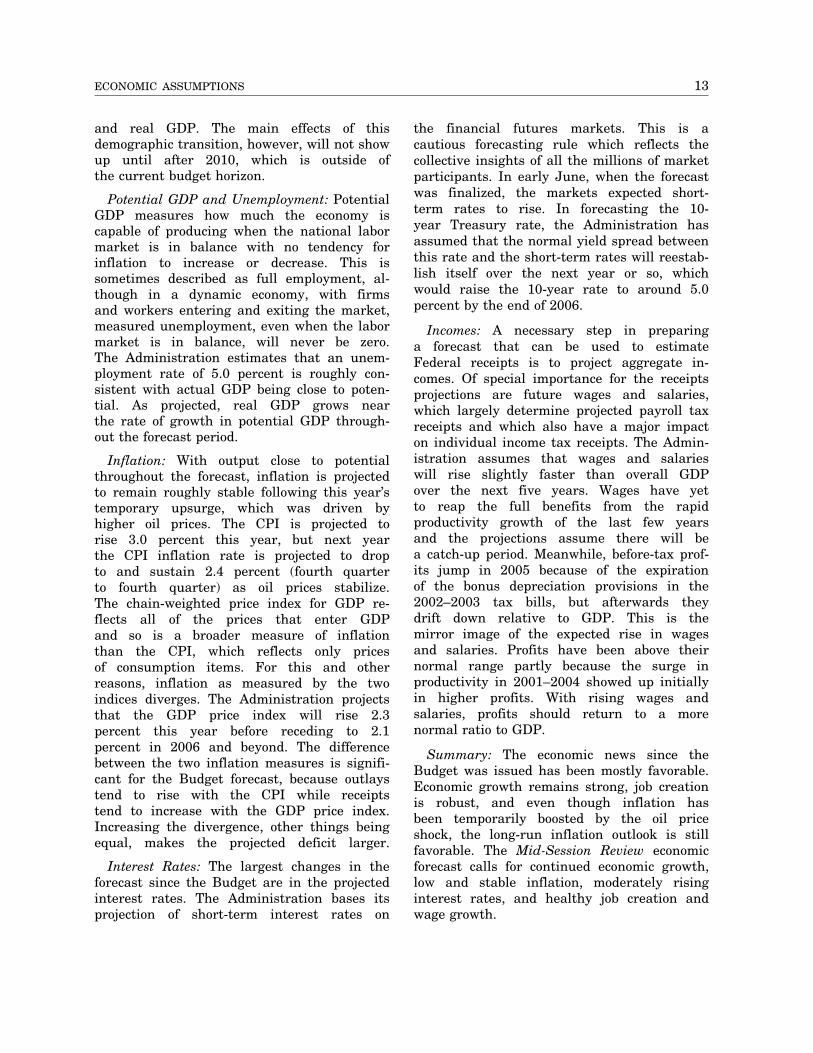
Incomes: A necessary step in preparing a forecast that can be used to estimate Federal receipts is to project aggregate incomes. Of special importance for the receipts projections are future wages and salaries, which largely determine projected payroll tax receipts and which also have a major impact on individual income tax receipts. The Administration assumes that wages and salaries will rise slightly faster than overall GDP over the next five years. Wages have yet to reap the full benefits from the rapid productivity growth of the last few years and the projections assume there will be a catch-up period. Meanwhile, before-tax profits jump in 2005 because of the expiration of the bonus depreciation provisions in the 2002–2003 tax bills, but afterwards they drift down relative to GDP. This is the mirror image of the expected rise in wages and salaries. Profits have been above their normal range partly because the surge in productivity in 2001–2004 showed up initially in higher profits. With rising wages and salaries, profits should return to a more normal ratio to GDP.
Summary: The economic news since the Budget was issued has been mostly favorable. Economic growth remains strong, job creation is robust, and even though inflation has been temporarily boosted by the oil price shock, the long-run inflation outlook is still favorable. The Mid-Session Review economic forecast calls for continued economic growth, low and stable inflation, moderately rising interest rates, and healthy job creation and wage growth.
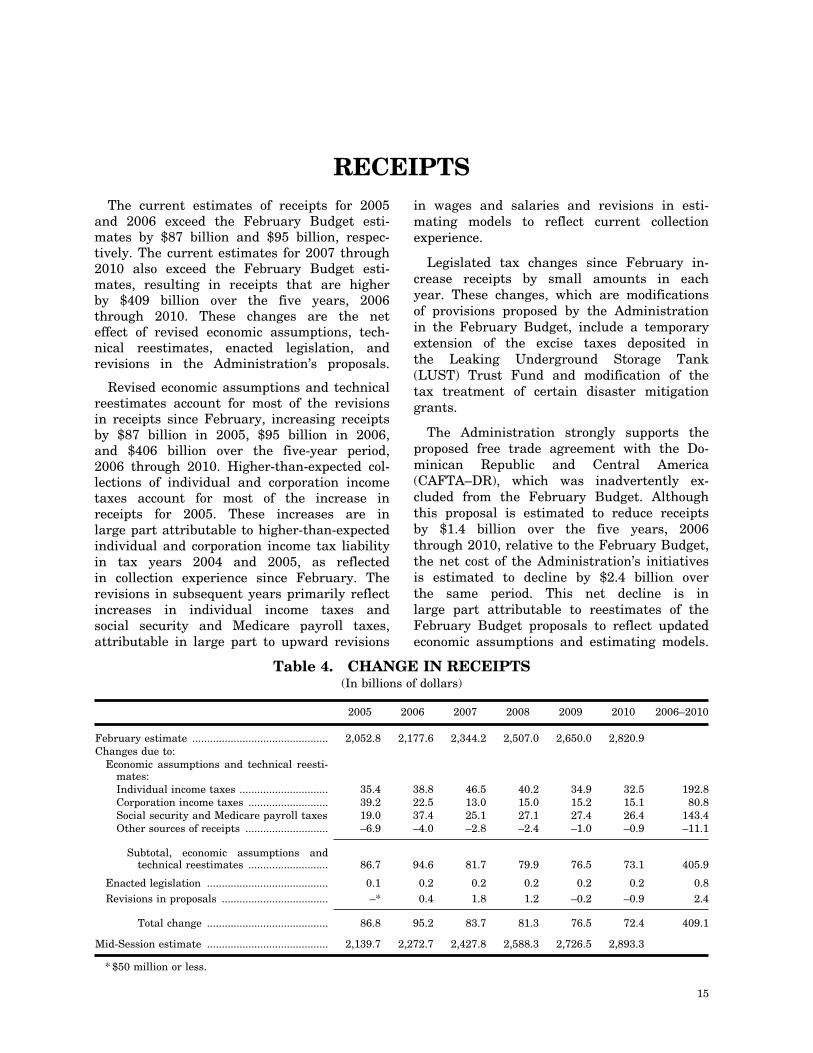
RECEIPTS The current estimates of receipts for 2005
and 2006 exceed the February Budget estimates by $87 billion and $95 billion, respectively. The current estimates for 2007 through 2010 also exceed the February Budget estimates, resulting in receipts that are higher by $409 billion over the five years, 2006 through 2010. These changes are the net effect of revised economic assumptions, technical reestimates, enacted legislation, and revisions in the Administration’s proposals.
Revised economic assumptions and technical reestimates account for most of the revisions in receipts since February, increasing receipts by $87 billion in 2005, $95 billion in 2006, and $406 billion over the five-year period, 2006 through 2010. Higher-than-expected collections of individual and corporation income taxes account for most of the increase in receipts for 2005. These increases are in large part attributable to higher-than-expected individual and corporation income tax liability in tax years 2004 and 2005, as reflected in collection experience since February. The revisions in subsequent years primarily reflect increases in individual income taxes and social security and Medicare payroll taxes, attributable in large part to upward revisions
in wages and salaries and revisions in estimating models to reflect current collection experience.
Legislated tax changes since February increase receipts by small amounts in each year. These changes, which are modifications of provisions proposed by the Administration in the February Budget, include a temporary extension of the excise taxes deposited in the Leaking Underground Storage Tank (LUST) Trust Fund and modification of the tax treatment of certain disaster mitigation grants.
The Administration strongly supports the proposed free trade agreement with the Dominican Republic and Central America (CAFTA–DR), which was inadvertently excluded from the February Budget. Although this proposal is estimated to reduce receipts by $1.4 billion over the five years, 2006 through 2010, relative to the February Budget, the net cost of the Administration’s initiatives is estimated to decline by $2.4 billion over the same period. This net decline is in large part attributable to reestimates of the February Budget proposals to reflect updated economic assumptions and estimating models.
Table 4. CHANGE IN RECEIPTS (In billions of dollars)
February estimate .............................................. Changes due to:
Economic assumptions and technical reestimates: Individual income taxes .............................. Corporation income taxes ........................... Social security and Medicare payroll taxes Other sources of receipts ............................
Subtotal, economic assumptions and technical reestimates ...........................
Enacted legislation ......................................... Revisions in proposals ....................................
Total change .........................................
Mid-Session estimate .........................................
2005
2,052.8
35.4 39.2 19.0 –6.9
2006
2,177.6
38.8 22.5 37.4 –4.0
2007
2,344.2
46.5 13.0 25.1 –2.8
2008
2,507.0
40.2 15.0 27.1 –2.4
2009
2,650.0
34.9 15.2 27.4 –1.0
2010 2
2,820.9
32.5 15.1 26.4 –0.9
006–2010
192.8 80.8
143.4 –11.1
86.7
0.1 –*
86.8
2,139.7
94.6
0.2 0.4
95.2
2,272.7
81.7
0.2 1.8
83.7
2,427.8
79.9
0.2 1.2
81.3
2,588.3
76.5
0.2 –0.2
76.5
2,726.5
73.1
0.2 –0.9
72.4
2,893.3
405.9
0.8 2.4
409.1
* $50 million or less.
15
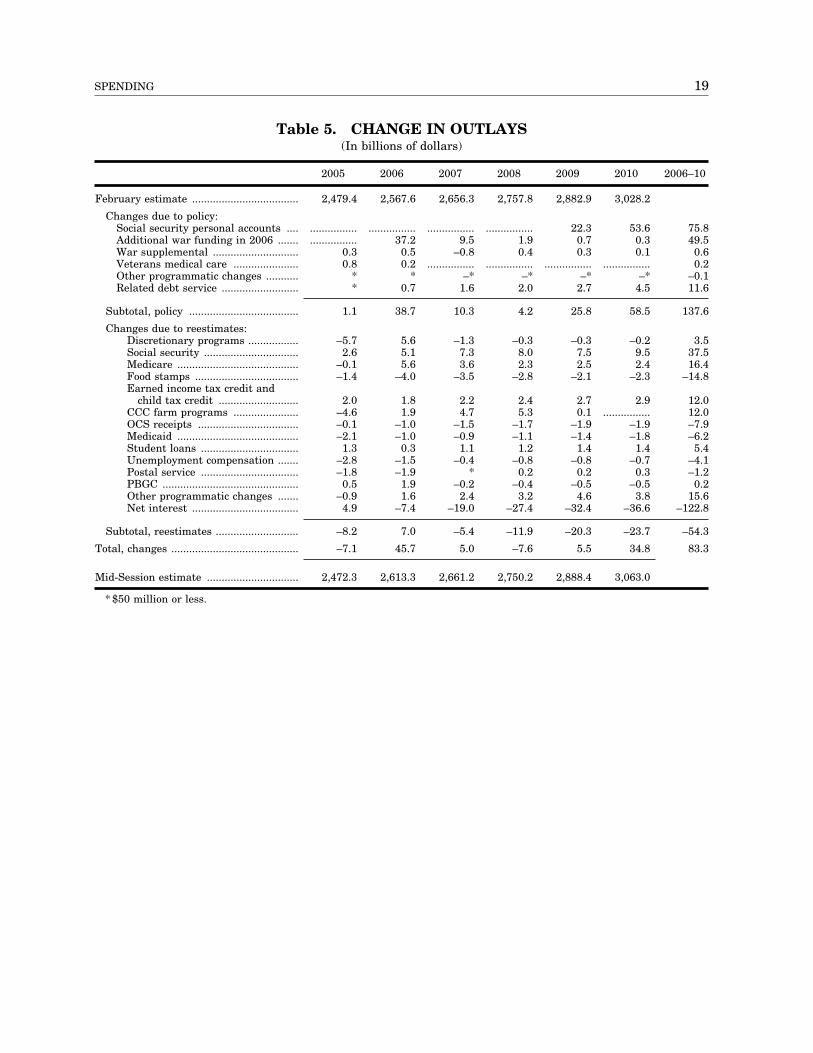
SPENDING Total outlays for 2005 are now estimated
to be $2,472 billion, down $7 billion from the February estimate. Small increases due to policy changes are more than offset from reductions due to estimating changes. For 2006, the estimate for total outlays has increased by $46 billion relative to February to $2,613 billion. This increase is largely the result of additional funding for Iraq and Afghanistan.
Policy changes
In total, policy changes increase outlays by $1.1 billion in 2005 and $38.7 billion in 2006. Over the five-year period 2006 through 2010, policy changes increase outlays by $137.6 billion. Since the transmittal of the budget, the Congressional Budget Resolution assumed an additional $50 billion in 2006 funding for the global war against terrorism in Iraq and Afghanistan and this amount is included in the Mid-Session estimates. Outlays from this funding will occur over several years, raising 2006 outlays by $37.2 billion and 2007 outlays by $9.5 billion. The Mid-Session estimates also include the Administration’s proposal for Social Security personal accounts, which are estimated to cost $75.8 billion for 2009 and 2010. That proposal was not fully detailed in time for the printing of the President’s Budget and thus could not be estimated.
Estimating changes
Changes in estimates arise from non-policy related factors including changes in economic assumptions, discussed earlier in this Review, and changes in technical factors. For 2005, estimated outlays are $8.2 billion lower than in February for non-policy related reasons while for 2006, they are $7.0 billion higher. Over the period 2006 through 2010, outlays are $54.3 billion lower than in February for non-policy related reasons.
Discretionary appropriations.—Outlays for discretionary programs decrease by $5.7 billion in 2005 and increase by $5.6 billion in 2006 relative to the February budget, as
a result of estimating changes. Most of this reflects delays in the assumed timing of outlays, based largely on experience to date, for defense programs.
Social security.—As the result of estimating changes, outlays for Social Security increase by $2.6 billion in 2005, $5.1 billion in 2006, and $37.5 billion over 2006 through 2010 relative to the February estimates. Much of the increase is driven by higher inflation in 2005, which raises cost-of-living adjustments notably in 2006, increasing payments throughout the five-year period. In addition, recent program experience suggests higher average benefit amounts than previously projected.
Medicare.—Estimates of medicare outlays have increased by $16.4 billion over the five-year period relative to February. This reflects increases in projections for payments to skilled nursing facilities, inpatient hospitals, managed care, and prescription drug coverage, offset in part by reductions for physician and durable medical equipment payments.
Food stamps.—Projected outlays for the food stamp program are $14.8 billion lower than the February estimate for the period 2006 through 2010. This is largely attributable to experience so far this year, which indicates that program participation has leveled off sooner than expected.
Earned income and child tax credits.— Outlays for the earned income and child care tax credits have increased by $12.0 billion over the period 2006 through 2010. The increases are based largely on experience to date this year, which indicates larger than anticipated increases in average credits as well as in the number of credit recipients.
CCC farm programs.—As a result of estimating assumptions, outlays for CCC farm assistance have decreased by $4.6 billion in 2005 because prices for a few crops, including corn and soybeans, are higher than expected. However, outlay estimates have increased by $12.0 billion over the period
17
18 MID–SESSION REVIEW
2006 through 2010 as the result of a revised crop forecast, which projects record or near record crop supplies for corn both in the United States and overseas and higher production for other commodities, resulting in lower prices for many major agricultural products in the near future. When commodity prices are lower than the legislated target rate, payments to farmers for price and income support programs are increased.
Outer continental shelf (OCS) receipts.— Increases in projected oil and gas prices increase anticipated receipts from drilling on the outer continental shelf. Because these receipts are recorded as offsets to outlays, the increases reduce expected outlays by $7.9 billion over the five-year period.
Medicaid.—As a result of estimating changes, medicaid outlays are projected to decrease by $2.1 billion in 2005, $1.0 billion in 2006, and $6.2 billion over the period 2006 through 2010. The largest factor in the decrease is a reduction in estimates for medical assistance payments, driven by lower estimates provided by the States this Spring.
Student loans.—Outlays for student loan programs are projected to increase by $5.4 billion over the period 2006 through 2010 relative to the February estimates. This increase is largely the result of improved estimating models, which should now more accurately measure the expected costs of deferment and forbearance benefits provided under the programs.
Unemployment compensation.—Continuing strength in the labor market has led to a faster than expected decline in the number of unemployment compensation beneficiaries, resulting in outlays for unemployment compensation $2.8 billion below the February estimate for 2005 and $1.5 billion below for 2006.
Postal service.—Higher than anticipated mail volumes and associated revenues as well as revised estimates of the levels of capital outlays have reduced projected net outlays for the Postal Service by $1.8 billion and $1.9 billion in 2005 and 2006, respectively. The reestimates do not assume rate increases over current rates of postage.
Pension benefit guaranty corporation (PBGC).—Outlays estimates for the PBGC increase by $1.9 billion in 2006 and $0.2 billion total over 2006 to 2010, primarily reflecting correction of the accounting for the Administration’s pension reform proposal.
Net interest.—Excluding the debt service associated with policy changes, outlays for net interest have increased by $4.9 billion in 2005. This reflects slightly higher short-term interest rates than assumed in the February budget as well as the expected settlement of a very large IRS tax case, dating back a significant number of tax years. Net interest decreases over the five year period by $122.8 billion. Roughly half of this reduction is the result of lower assumed interest rates and half is the reduced cost of debt service related to estimating changes in receipts and outlays.
19 SPENDING
Table 5. CHANGE IN OUTLAYS (In billions of dollars)
February estimate ....................................
Changes due to policy: Social security personal accounts .... Additional war funding in 2006 ....... War supplemental ............................. Veterans medical care ...................... Other programmatic changes ........... Related debt service ..........................
2005 2006 2007 2008 2009 2010 2006–10
2,479.4 2,567.6 2,656.3 2,757.8 2,882.9 3,028.2
................ ................ ................ ................ 22.3 53.6 75.8
................ 37.2 9.5 1.9 0.7 0.3 49.50.3 0.5 –0.8 0.4 0.3 0.1 0.6 0.8 0.2 ................ ................ ................ ................ 0.2
* * –* –* –* –* –0.1 * 0.7 1.6 2.0 2.7 4.5 11.6
Subtotal, policy ..................................... 1.1 38.7 10.3 4.2 25.8 58.5 137.6
Changes due to reestimates: Discretionary programs ................. –5.7 5.6 –1.3 –0.3 –0.3 –0.2 3.5 Social security ................................ 2.6 5.1 7.3 8.0 7.5 9.5 37.5 Medicare ......................................... –0.1 5.6 3.6 2.3 2.5 2.4 16.4 Food stamps ................................... –1.4 –4.0 –3.5 –2.8 –2.1 –2.3 –14.8 Earned income tax credit and
child tax credit ........................... 2.0 1.8 2.2 2.4 2.7 2.9 12.0 CCC farm programs ...................... –4.6 1.9 4.7 5.3 0.1 ................ 12.0 OCS receipts .................................. –0.1 –1.0 –1.5 –1.7 –1.9 –1.9 –7.9 Medicaid ......................................... –2.1 –1.0 –0.9 –1.1 –1.4 –1.8 –6.2 Student loans ................................. 1.3 0.3 1.1 1.2 1.4 1.4 5.4 Unemployment compensation ....... –2.8 –1.5 –0.4 –0.8 –0.8 –0.7 –4.1 Postal service ................................. –1.8 –1.9 * 0.2 0.2 0.3 –1.2 PBGC .............................................. 0.5 1.9 –0.2 –0.4 –0.5 –0.5 0.2 Other programmatic changes ....... –0.9 1.6 2.4 3.2 4.6 3.8 15.6 Net interest .................................... 4.9 –7.4 –19.0 –27.4 –32.4 –36.6 –122.8
Subtotal, reestimates ............................ –8.2 7.0 –5.4 –11.9 –20.3 –23.7 –54.3
Total, changes ........................................... –7.1 45.7 5.0 –7.6 5.5 34.8 83.3
Mid-Session estimate ............................... 2,472.3 2,613.3 2,661.2 2,750.2 2,888.4 3,063.0
* $50 million or less.

SUMMARY TABLES
21
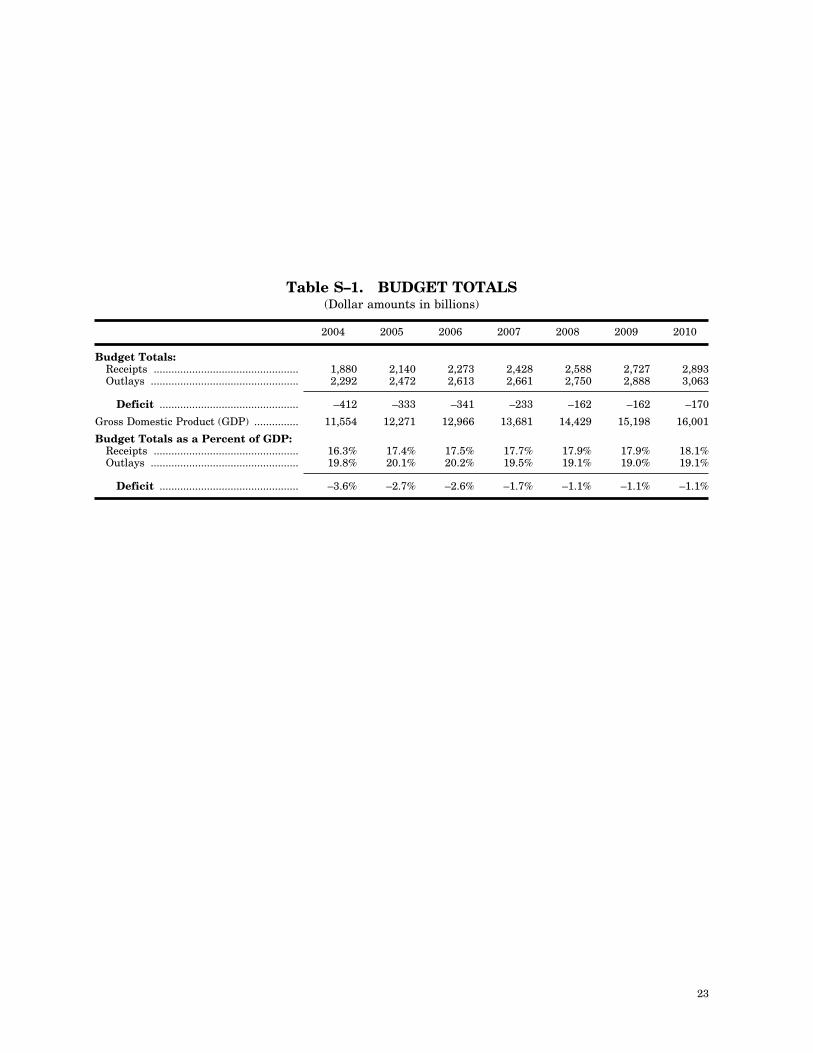
Table S–1. BUDGET TOTALS (Dollar amounts in billions)
2004 2005 2006 2007 2008 2009 2010
Budget Totals: Receipts ................................................. 1,880 2,140 2,273 2,428 2,588 2,727 2,893 Outlays .................................................. 2,292 2,472 2,613 2,661 2,750 2,888 3,063
Deficit ............................................... –412 –333 –341 –233 –162 –162 –170
Gross Domestic Product (GDP) ............... 11,554 12,271 12,966 13,681 14,429 15,198 16,001
Budget Totals as a Percent of GDP: Receipts ................................................. 16.3% 17.4% 17.5% 17.7% 17.9% 17.9% 18.1% Outlays .................................................. 19.8% 20.1% 20.2% 19.5% 19.1% 19.0% 19.1%
Deficit ............................................... –3.6% –2.7% –2.6% –1.7% –1.1% –1.1% –1.1%
23
24 MID–SESSION REVIEW
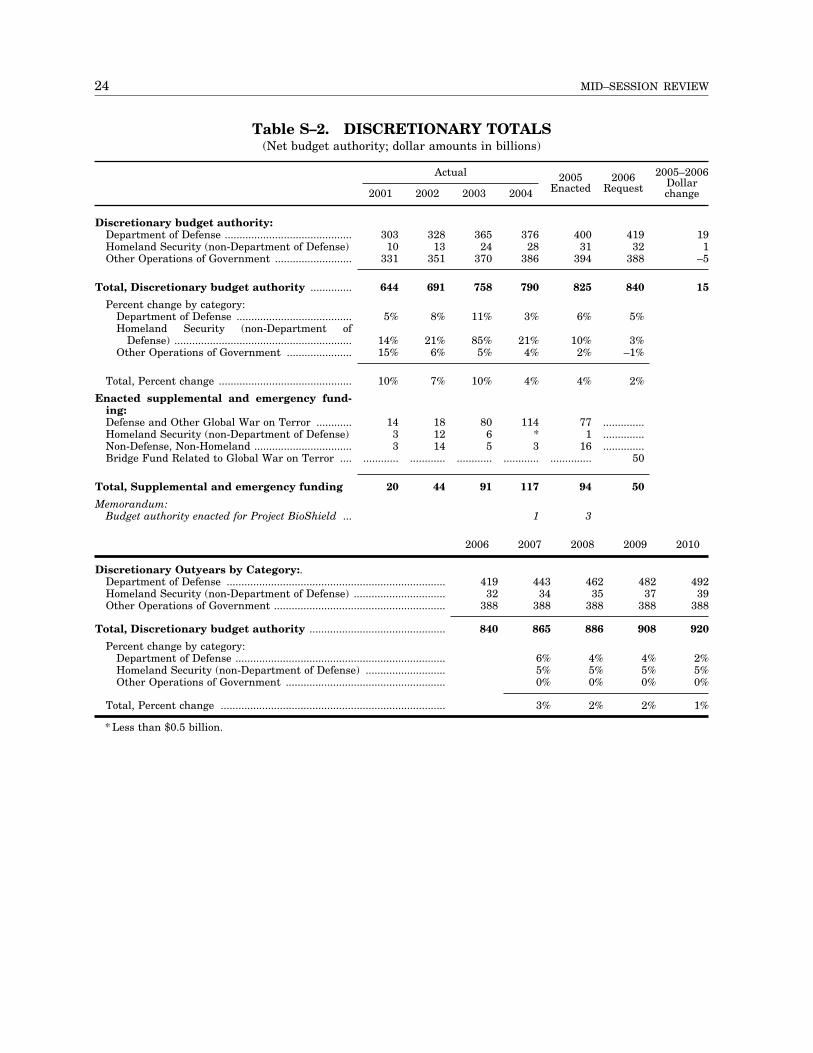
Table S–2. DISCRETIONARY TOTALS (Net budget authority; dollar amounts in billions)
Actual 2005–20062005 2006 Dollar 2004 Enacted Request change2001 2002 2003
Discretionary budget authority: Department of Defense ........................................... 303 328 365 376 400 419 19Homeland Security (non-Department of Defense) 10 13 24 28 31 32 1Other Operations of Government .......................... 331 351 370 386 394 388 –5
Total, Discretionary budget authority .............. 644 691 758 790 825 840
Percent change by category: Department of Defense ....................................... 5% 8% 11% 3% 6% 5%Homeland Security (non-Department of
Defense) ............................................................ 14% 21% 85% 21% 10% 3%Other Operations of Government ...................... 15% 6% 5% 4% 2% –1%
Total, Percent change ............................................. 10% 7% 10% 4% 4% 2%
Enacted supplemental and emergency funding: Defense and Other Global War on Terror ............Homeland Security (non-Department of Defense) Non-Defense, Non-Homeland .................................Bridge Fund Related to Global War on Terror ....
14 18 80 114 77 ..............3 12 6 * 1 ..............3 14 5 3 16 ..............
............ ............ ............ ............ .............. 50
Total, Supplemental and emergency funding 20 44 91 117 94 50
Memorandum: Budget authority enacted for Project BioShield ... 1 3
2006 2007 2008 2009 2010
Discretionary Outyears by Category:. Department of Defense .......................................................................... Homeland Security (non-Department of Defense) ............................... Other Operations of Government ..........................................................
419 443 462 482 49232 34 35 37 39
388 388 388 388 388
Total, Discretionary budget authority .............................................. 840 865 886 908 920
Percent change by category: Department of Defense ....................................................................... 6% 4% 4% 2% Homeland Security (non-Department of Defense) ........................... 5% 5% 5% 5% Other Operations of Government ...................................................... 0% 0% 0% 0%
Total, Percent change ............................................................................ 3% 2% 2% 1%
* Less than $0.5 billion.
15
25 SUMMARY TABLES
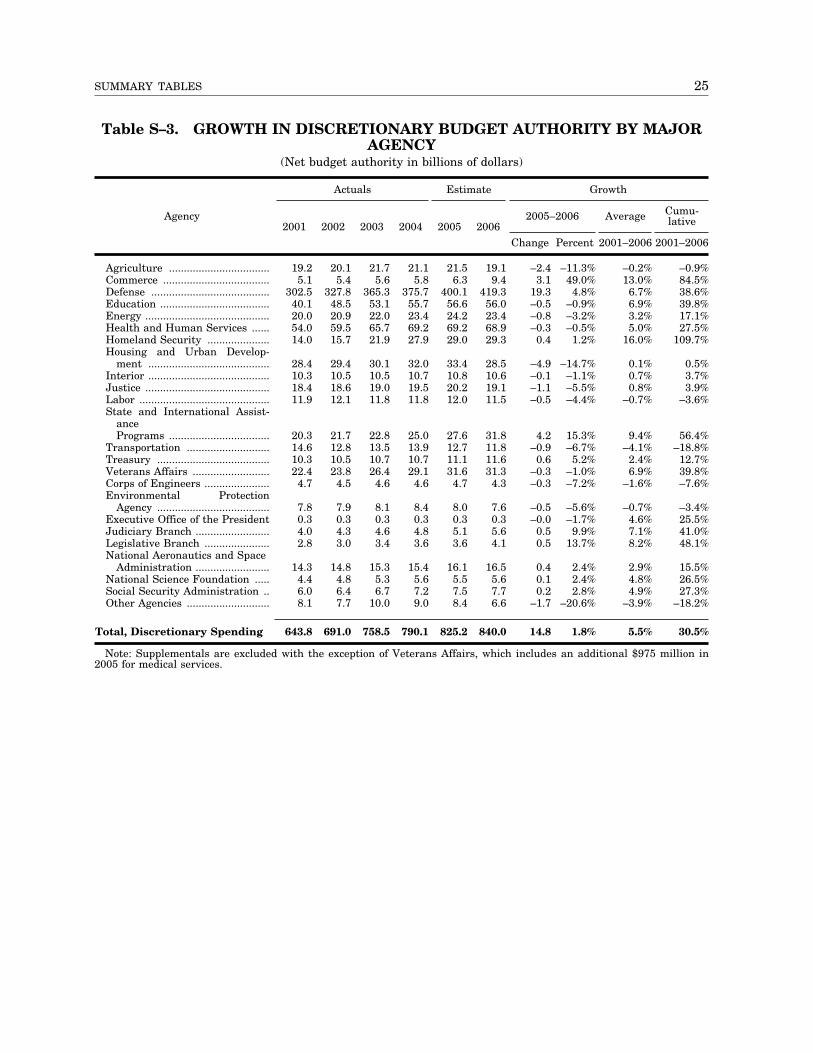
Table S–3. GROWTH IN DISCRETIONARY BUDGET AUTHORITY BY MAJOR AGENCY
(Net budget authority in billions of dollars)
Actuals Estimate Growth
Agency 2005–2006 Average Cumulative2001 2002 2003 2004 2005 2006
Change Percent 2001–2006 2001–2006
Agriculture .................................. 19.2 20.1 21.7 21.1 21.5 19.1 –2.4 –11.3% –0.2% –0.9% Commerce .................................... 5.1 5.4 5.6 5.8 6.3 9.4 3.1 49.0% 13.0% 84.5% Defense ........................................ 302.5 327.8 365.3 375.7 400.1 419.3 19.3 4.8% 6.7% 38.6% Education ..................................... 40.1 48.5 53.1 55.7 56.6 56.0 –0.5 –0.9% 6.9% 39.8% Energy .......................................... 20.0 20.9 22.0 23.4 24.2 23.4 –0.8 –3.2% 3.2% 17.1% Health and Human Services ...... 54.0 59.5 65.7 69.2 69.2 68.9 –0.3 –0.5% 5.0% 27.5% Homeland Security ..................... 14.0 15.7 21.9 27.9 29.0 29.3 0.4 1.2% 16.0% 109.7% Housing and Urban Develop
ment ......................................... 28.4 29.4 30.1 32.0 33.4 28.5 –4.9 –14.7% 0.1% 0.5% Interior ......................................... 10.3 10.5 10.5 10.7 10.8 10.6 –0.1 –1.1% 0.7% 3.7% Justice .......................................... 18.4 18.6 19.0 19.5 20.2 19.1 –1.1 –5.5% 0.8% 3.9% Labor ............................................ 11.9 12.1 11.8 11.8 12.0 11.5 –0.5 –4.4% –0.7% –3.6% State and International Assist
ance Programs .................................. 20.3 21.7 22.8 25.0 27.6 31.8 4.2 15.3% 9.4% 56.4%
Transportation ............................ 14.6 12.8 13.5 13.9 12.7 11.8 –0.9 –6.7% –4.1% –18.8% Treasury ...................................... 10.3 10.5 10.7 10.7 11.1 11.6 0.6 5.2% 2.4% 12.7% Veterans Affairs .......................... 22.4 23.8 26.4 29.1 31.6 31.3 –0.3 –1.0% 6.9% 39.8% Corps of Engineers ...................... 4.7 4.5 4.6 4.6 4.7 4.3 –0.3 –7.2% –1.6% –7.6% Environmental Protection
Agency ...................................... 7.8 7.9 8.1 8.4 8.0 7.6 –0.5 –5.6% –0.7% –3.4% Executive Office of the President 0.3 0.3 0.3 0.3 0.3 0.3 –0.0 –1.7% 4.6% 25.5% Judiciary Branch ......................... 4.0 4.3 4.6 4.8 5.1 5.6 0.5 9.9% 7.1% 41.0% Legislative Branch ...................... 2.8 3.0 3.4 3.6 3.6 4.1 0.5 13.7% 8.2% 48.1% National Aeronautics and Space
Administration ......................... 14.3 14.8 15.3 15.4 16.1 16.5 0.4 2.4% 2.9% 15.5% National Science Foundation ..... 4.4 4.8 5.3 5.6 5.5 5.6 0.1 2.4% 4.8% 26.5% Social Security Administration .. 6.0 6.4 6.7 7.2 7.5 7.7 0.2 2.8% 4.9% 27.3% Other Agencies ............................ 8.1 7.7 10.0 9.0 8.4 6.6 –1.7 –20.6% –3.9% –18.2%
Total, Discretionary Spending 643.8 691.0 758.5 790.1 825.2 840.0 14.8 1.8% 5.5% 30.5%
Note: Supplementals are excluded with the exception of Veterans Affairs, which includes an additional $975 million in 2005 for medical services.
26 MID–SESSION REVIEW
Table S–4. DISCRETIONARY PROPOSALS BY APPROPRIATIONS SUBCOMMITTEE
(Net budget authority in billions of dollars)
Appropriations Subcommittee 2005 Enacted
2006 Request 20
Change 05–2006
Agriculture and Rural Development .................................................................................... 18.3 16.6 –1.8 Defense ................................................................................................................................... 351.7 366.7 15.0 Energy and Water Development .......................................................................................... 30.1 28.9 –1.2 Foreign Operations ................................................................................................................ 19.6 22.8 3.2 Homeland Security ................................................................................................................ 29.0 29.3 0.4 Interior and Environment ..................................................................................................... 26.8 25.7 –1.0 Labor, Health and Human Services, and Education .......................................................... 142.9 141.5 –1.4 Legislative Branch ................................................................................................................. 3.5 4.0 0.5 Military Quality of Life and Veterans Affairs ..................................................................... 80.5 84.5 4.0 Science, State, Justice, and Commerce ................................................................................ 57.3 60.5 3.2 Transportation, Treasury, and Housing and Urban Development .................................... 65.5 59.9 –5.6 Allowances .............................................................................................................................. ................ –0.4 –0.4
Total, excluding supplemental and emergency funding ...................................... 825.2 840.0 14.8
Both the House and the Senate have proposed new structures by Appropriations Subcommittee. This table is consistent with that of the House structure.
SUMMARY TABLES 27
Table S–5. HOMELAND SECURITY FUNDING BY AGENCY (Budget authority in millions of dollars)
2004 Actual
2005 Enacted
2006 Request
Homeland Security Funding: Department of Agriculture .................................................................................................. 411 600 704 Department of Commerce .................................................................................................... 125 167 183 Department of Defense-Military (DOD) ............................................................................. 7,024 8,570 9,513 Department of Energy ......................................................................................................... 1,364 1,562 1,666 Department of Health and Human Services ..................................................................... 4,062 4,230 4,407 Department of Homeland Security ..................................................................................... 22,834 24,917 27,086 Department of the Interior .................................................................................................. 83 65 57 Department of Justice ......................................................................................................... 2,165 2,678 3,104 Department of State ............................................................................................................ 696 824 938 Department of Transportation ............................................................................................ 284 182 192 Department of the Treasury ............................................................................................... 90 101 111 Department of Veterans Affairs ......................................................................................... 271 280 299 Corps of Engineers ............................................................................................................... 102 89 72 Environmental Protection Agency ...................................................................................... 131 107 184 General Services Administration ........................................................................................ 79 65 80 National Aeronautics and Space Administration .............................................................. 207 218 205 National Science Foundation .............................................................................................. 340 342 344 Smithsonian Institution ...................................................................................................... 78 75 87 Social Security Administration ........................................................................................... 143 159 178 Other Agencies ..................................................................................................................... 239 813 288
Total, Homeland Security Funding, excluding Project BioShield .......................... 1 40,728 1 46,044 49,698
Less, Department of Defense-Military (DOD) ................................................................... –7,024 –8,570 –9,513
Total, Homeland Security Funding, excluding DOD and Project BioShield ........ 33,704 37,474 40,185
Less, Mandatory Homeland Security Funding 2 ................................................................ –1,940 –2,279 –2,286 Less, Discretionary Fee-Funded Activities 3 ...................................................................... –3,289 –3,941 –5,660
Net Non-DOD Discretionary Homeland Security, excluding Project BioShield 28,475 31,254 32,239
Plus, Department of Homeland Security Project BioShield ............................................. 885 2,508 ................
Net Non-DOD Discretionary Homeland Security, including Project BioShield .. 29,360 33,762 32,239
1 Excludes $107 million in supplemental appropriations in 2004 and $595 million in supplemental appropriations in 2005.
2 Mandatory homeland security programs include Agriculture Quarantine and Inspections, Border Protection, and Immigration Enforcement.
3 Discretionary fee-funded homeland security programs include Visa Processing, Airport Security, and Social Security physical and computer security measures.
28 MID–SESSION REVIEW
Table S–6. MANDATORY PROPOSALS (In millions of dollars)
2005 2006 2007 2008 2009 2010 2006–10 2006–15
Social Security Personal Accounts .............. .............. ................ ................ 22,252 53,557 75,809 662,360
Programmatic Reforms: Agriculture:
Commodity Credit Corporation: Limit Loan Deficiency Payments
to historical production ........... .............. –432 –509 –106 –4 –2 –1,053 –1,054 Tighten payment limits .............. .............. –200 –190 –175 –150 –130 –845 –1,200 Cut Crop Payments by 5 percent .............. –383 –629 –468 –351 –309 –2,140 –3,641 Sugar marketing assessment 1.2
percent ...................................... .............. –42 –43 –43 –43 –43 –214 –437Tilt adjustment requirement ...... .............. –130 –80 –50 –50 –50 –360 –610Extend Milk Income Loss Con
tract Program ........................... .............. 600 600 ................ ................ ................ 1,200 1,200 Crop insurance coverage change ... .............. .............. –140 –140 –140 –140 –560 –1,260 Forest Service:
Facilities working capital fund .. .............. –5 –1 –1 ................ ................ –7 –7 Enhanced facilities disposal au
thority ....................................... .............. –9 ................ ................ –5 ................ –14 –14 Limit Food Stamp categorical eli
gibility .......................................... .............. –50 –101 –103 –103 –105 –462 –1,032 Allow State Food Stamp Agencies
to use the National Directory of New Hires (NDNH) ..................... .............. .............. –2 –2 –2 –2 –8 –18
Subtotal, Agriculture ............... .............. –651 –1,095 –1,088 –848 –781 –4,463 –8,073 Education:
Reform the Federal Student Aid Programs: Payoff Pell Shortfall (non-add
BA only) .................................... .............. (4,301) ................ ................ ................ ................ (4,301) (4,301) Increase the Pell Grant Max
imum Award by $500 over Five Years ................................ .............. 101 509 915 1,321 1,734 4,580 14,959
Increase Borrowing Limits and Other Benefits to Students ..... .............. 221 660 762 811 866 3,320 7,658
Recall Federal Perkins Loan Revolving Funds ........................... .............. –580 –642 –675 –735 –697 –3,329 –5,987
Increase Lender Risk Sharing and Improve Program Efficiency ........................................ .............. –171 –601 –785 –838 –902 –3,297 –8,749
Adjust Guaranty Agency Reinsurance and Default Retention Rates ......................................... .............. –43 –116 –152 –168 –187 –666 –1,788
Reform Federal Consolidation Loans ........................................ .............. –269 –610 –544 –484 –503 –2,410 –3,769
Extend the Taxpayer-Teacher Extension Act ........................... .............. –254 –411 –449 –459 –485 –2,058 –4,945
Other Student Loan Reforms ..... 557 –178 –790 –824 –783 –811 –3,386 –8,043
Subtotal, Education ................. 557 –1,172 –2,001 –1,752 –1,337 –986 –7,248 –10,667 Energy:
Allow Power Marketing Administrations to Charge up to Market Rates ............................................ .............. –40 –157 –446 –1,145 –1,406 –3,194 –12,434
Bonneville Power Administration borrowing authority .................... .............. .............. ................ ................ ................ 140 140
Subtotal, Energy .......................... .............. –40 –157 –446 –1,145 –1,266 –3,054 –12,234 Health and Human Services:
Medicaid and State Children’s Health Insurance Program Proposals ............................................ 113 1,095 –1,326 –3,533 –4,048 –4,227 –12,039 –42,543
State grants and demonstrations .. .............. 400 500 594 605 618 2,717 5,000 Temporary Assistance for Needy
Families Reauthorization ........... 50 268 326 350 361 357 1,662 3,436
200
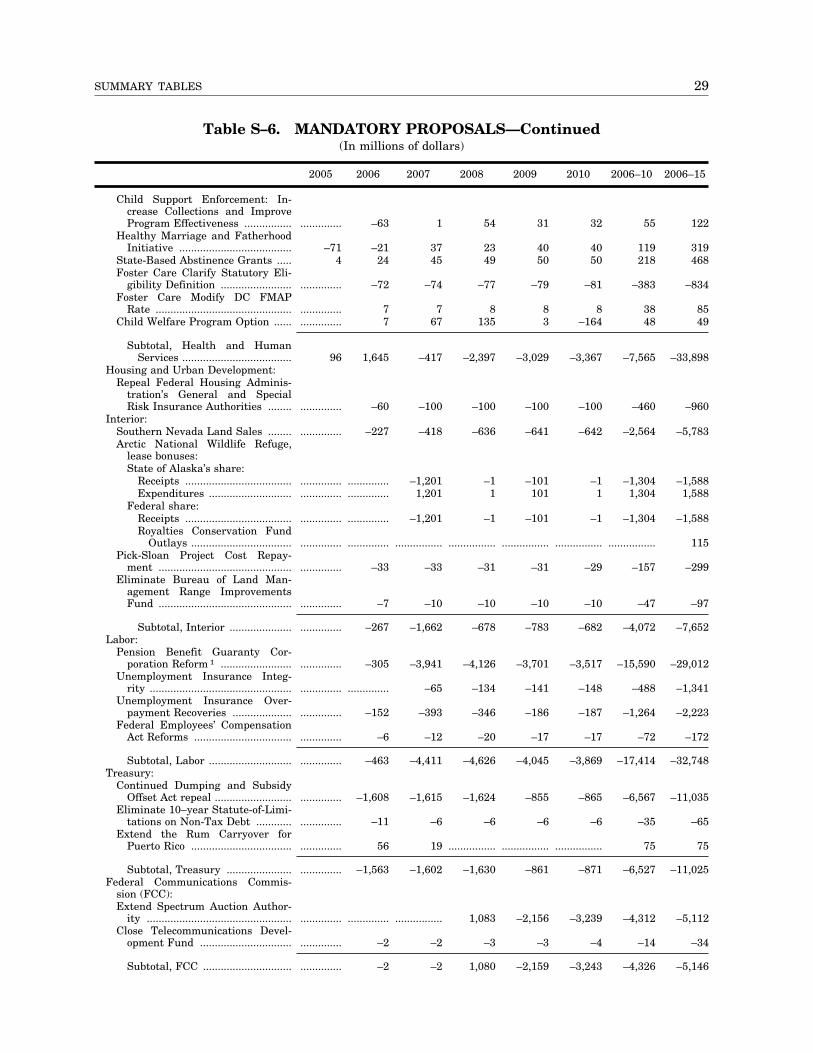
29 SUMMARY TABLES
Table S–6. MANDATORY PROPOSALS—Continued (In millions of dollars)
2005 2006 2007 2008 2009 2010 2006–10 2006–15
Child Support Enforcement: Increase Collections and Improve Program Effectiveness ................ .............. –63 1 54 31 32 55 122
Healthy Marriage and Fatherhood Initiative ...................................... –71 –21 37 23 40 40 119 319
State-Based Abstinence Grants ..... 4 24 45 49 50 50 218 468 Foster Care Clarify Statutory Eli
gibility Definition ........................ .............. –72 –74 –77 –79 –81 –383 –834 Foster Care Modify DC FMAP
Rate .............................................. .............. 7 7 8 8 8 38 85Child Welfare Program Option ...... .............. 7 67 135 3 –164 48 49
Subtotal, Health and Human Services ..................................... 96 1,645 –417 –2,397 –3,029 –3,367 –7,565 –33,898
Housing and Urban Development: Repeal Federal Housing Adminis-
tration’s General and Special Risk Insurance Authorities ........ .............. –60 –100 –100 –100 –100 –460 –960
Interior: Southern Nevada Land Sales ........ .............. –227 –418 –636 –641 –642 –2,564 –5,783Arctic National Wildlife Refuge,
lease bonuses: State of Alaska’s share:
Receipts .................................... .............. .............. –1,201 –1 –101 –1 –1,304 –1,588Expenditures ............................ .............. .............. 1,201 1 101 1 1,304 1,588
Federal share: Receipts .................................... .............. .............. –1,201 –1 –101 –1 –1,304 –1,588Royalties Conservation Fund
Outlays .................................. .............. .............. ................ ................ ................ ................ ................ Pick-Sloan Project Cost Repay
ment ............................................. .............. –33 –33 –31 –31 –29 –157 –299 Eliminate Bureau of Land Man
agement Range Improvements Fund ............................................. .............. –7 –10 –10 –10 –10 –47 –97
Subtotal, Interior ..................... .............. –267 –1,662 –678 –783 –682 –4,072 –7,652 Labor:
Pension Benefit Guaranty Corporation Reform 1 ........................ .............. –305 –3,941 –4,126 –3,701 –3,517 –15,590 –29,012
Unemployment Insurance Integrity ................................................ .............. .............. –65 –134 –141 –148 –488 –1,341
Unemployment Insurance Overpayment Recoveries .................... .............. –152 –393 –346 –186 –187 –1,264 –2,223
Federal Employees’ Compensation Act Reforms ................................. .............. –6 –12 –20 –17 –17 –72 –172
Subtotal, Labor ............................ .............. –463 –4,411 –4,626 –4,045 –3,869 –17,414 –32,748 Treasury:
Continued Dumping and Subsidy Offset Act repeal .......................... .............. –1,608 –1,615 –1,624 –855 –865 –6,567 –11,035
Eliminate 10–year Statute-of-Limi-tations on Non-Tax Debt ............ .............. –11 –6 –6 –6 –6 –35 –65
Extend the Rum Carryover for Puerto Rico .................................. .............. 56 19 ................ ................ ................ 75
Subtotal, Treasury ...................... .............. –1,563 –1,602 –1,630 –861 –871 –6,527 –11,025Federal Communications Commis
sion (FCC): Extend Spectrum Auction Author
ity ................................................. .............. .............. ................ 1,083 –2,156 –3,239 –4,312 –5,112 Close Telecommunications Devel
opment Fund ............................... .............. –2 –2 –3 –3 –4 –14 –34
Subtotal, FCC .............................. .............. –2 –2 1,080 –2,159 –3,243 –4,326 –5,146
115
75
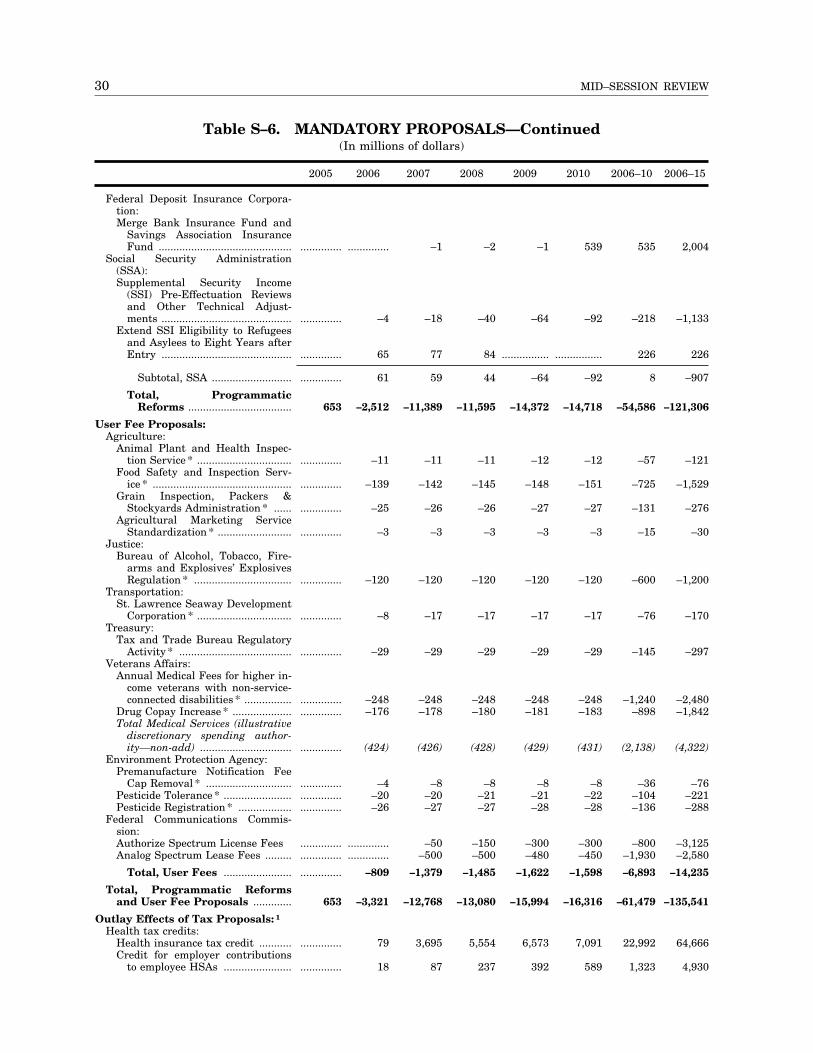
30 MID–SESSION REVIEW
Table S–6. MANDATORY PROPOSALS—Continued (In millions of dollars)
2005 2006 2007 2008 2009 2010 2006–10 2006–15
Federal Deposit Insurance Corporation: Merge Bank Insurance Fund and
Savings Association Insurance Fund ............................................. .............. .............. –1 –2 –1 539 535 2,004
Social Security Administration (SSA): Supplemental Security Income
(SSI) Pre-Effectuation Reviews and Other Technical Adjustments ............................................ .............. –4 –18 –40 –64 –92 –218 –1,133
Extend SSI Eligibility to Refugees and Asylees to Eight Years after Entry ............................................ .............. 65 77 84 ................ ................ 226
Subtotal, SSA ........................... .............. 61 59 44 –64 –92 8 –907
Total, Programmatic Reforms ................................... 653 –2,512 –11,389 –11,595 –14,372 –14,718 –54,586 –121,306
User Fee Proposals: Agriculture:
Animal Plant and Health Inspection Service * ................................ .............. –11 –11 –11 –12 –12 –57 –121
Food Safety and Inspection Service * ............................................... .............. –139 –142 –145 –148 –151 –725 –1,529
Grain Inspection, Packers & Stockyards Administration * ...... .............. –25 –26 –26 –27 –27 –131 –276
Agricultural Marketing Service Standardization * ......................... .............. –3 –3 –3 –3 –3 –15 –30
Justice: Bureau of Alcohol, Tobacco, Fire
arms and Explosives’ Explosives Regulation * ................................. .............. –120 –120 –120 –120 –120 –600 –1,200
Transportation: St. Lawrence Seaway Development
Corporation * ................................ .............. –8 –17 –17 –17 –17 –76 –170 Treasury:
Tax and Trade Bureau Regulatory Activity * ...................................... .............. –29 –29 –29 –29 –29 –145 –297
Veterans Affairs: Annual Medical Fees for higher in
come veterans with non-service-connected disabilities * ................ .............. –248 –248 –248 –248 –248 –1,240 –2,480
Drug Copay Increase * .................... .............. –176 –178 –180 –181 –183 –898 –1,842Total Medical Services (illustrative
discretionary spending author-ity—non-add) ............................... .............. (424) (426) (428) (429) (431) (2,138) (4,322)
Environment Protection Agency: Premanufacture Notification Fee
Cap Removal * ............................. .............. –4 –8 –8 –8 –8 –36 –76Pesticide Tolerance * ....................... .............. –20 –20 –21 –21 –22 –104 –221Pesticide Registration * .................. .............. –26 –27 –27 –28 –28 –136 –288
Federal Communications Commission: Authorize Spectrum License Fees .............. .............. –50 –150 –300 –300 –800 –3,125 Analog Spectrum Lease Fees ......... .............. .............. –500 –500 –480 –450 –1,930 –2,580
Total, User Fees ....................... .............. –809 –1,379 –1,485 –1,622 –1,598 –6,893 –14,235
Total, Programmatic Reforms and User Fee Proposals ............. 653 –3,321 –12,768 –13,080 –15,994 –16,316 –61,479 –135,541
Outlay Effects of Tax Proposals: 1
Health tax credits: Health insurance tax credit ........... .............. 79 3,695 5,554 6,573 7,091 22,992 64,666Credit for employer contributions
to employee HSAs ....................... .............. 18 87 237 392 589 1,323 4,930
226
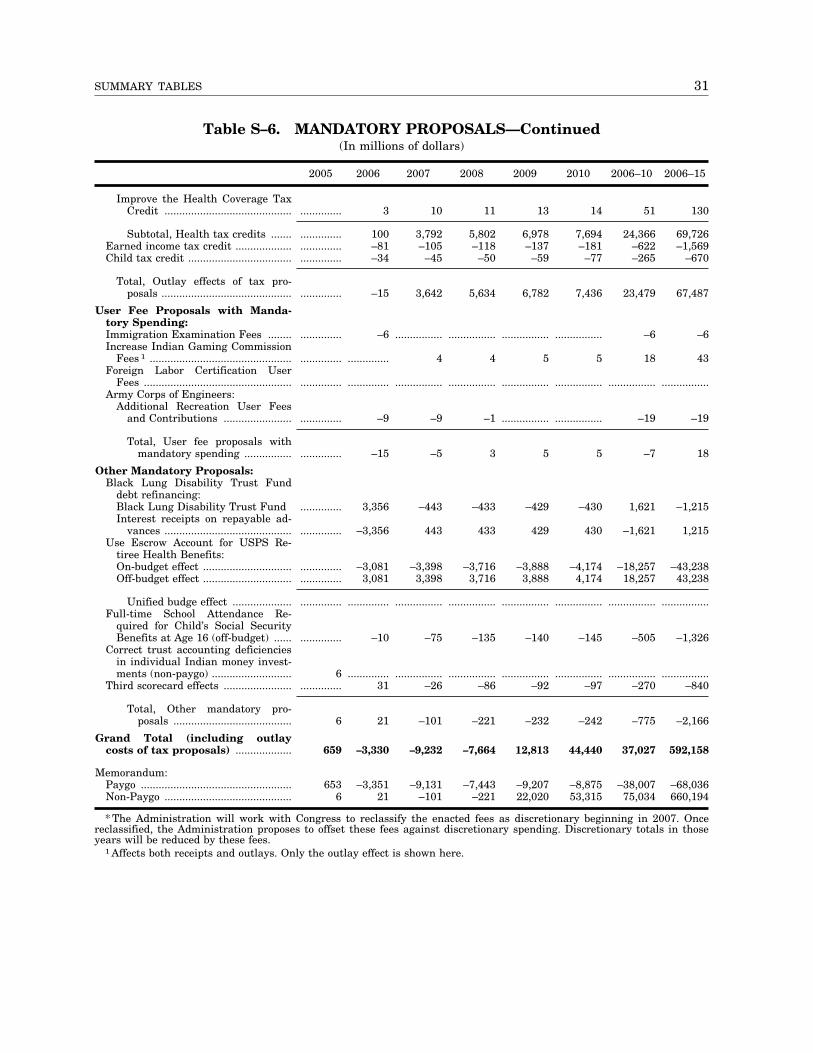
31 SUMMARY TABLES
Table S–6. MANDATORY PROPOSALS—Continued (In millions of dollars)
2005 2006 2007 2008 2009 2010 2006–10 2006–15
Improve the Health Coverage Tax Credit ........................................... .............. 3 10 11 13 14 51 130
Subtotal, Health tax credits ....... ..............Earned income tax credit ................... ..............Child tax credit ................................... ..............
100 3,792 5,802 6,978 7,694 24,366 69,726 –81 –105 –118 –137 –181 –622 –1,569 –34 –45 –50 –59 –77 –265 –670
Total, Outlay effects of tax proposals ............................................ .............. –15 3,642 5,634 6,782 7,436 23,479 67,487
User Fee Proposals with Mandatory Spending: Immigration Examination Fees ........ .............. –6 ................ ................ ................ ................ –6 –6 Increase Indian Gaming Commission
Fees 1 ................................................ .............. .............. 4 4 5 5 18 43 Foreign Labor Certification User
Fees .................................................. .............. .............. ................ ................ ................ ................ ................ ................ Army Corps of Engineers:
Additional Recreation User Fees and Contributions ....................... .............. –9 –9 –1 ................ ................ –19 –19
Total, User fee proposals with mandatory spending ................ .............. –15 –5 3 5 5 –7 18
Other Mandatory Proposals: Black Lung Disability Trust Fund
debt refinancing: Black Lung Disability Trust Fund .............. 3,356 –443 –433 –429 –430 1,621 –1,215 Interest receipts on repayable ad
vances ........................................... .............. –3,356 443 433 429 430 –1,621 1,215 Use Escrow Account for USPS Re
tiree Health Benefits: On-budget effect .............................. .............. –3,081 –3,398 –3,716 –3,888 –4,174 –18,257 –43,238 Off-budget effect .............................. .............. 3,081 3,398 3,716 3,888 4,174 18,257 43,238
Unified budge effect .................... .............. .............. ................ ................ ................ ................ ................ ................ Full-time School Attendance Re
quired for Child’s Social Security Benefits at Age 16 (off-budget) ...... .............. –10 –75 –135 –140 –145 –505 –1,326
Correct trust accounting deficiencies in individual Indian money investments (non-paygo) ........................... 6 .............. ................ ................ ................ ................ ................ ................
Third scorecard effects ....................... .............. 31 –26 –86 –92 –97 –270 –840
Total, Other mandatory proposals ........................................ 6 21 –101 –221 –232 –242 –775 –2,166
Grand Total (including outlay costs of tax proposals) ................... 659 –3,330 –9,232 –7,664 12,813 44,440 37,027 592,158
Memorandum: Paygo ................................................... 653 –3,351 –9,131 –7,443 –9,207 –8,875 –38,007 –68,036 Non-Paygo ........................................... 6 21 –101 –221 22,020 53,315 75,034 660,194
* The Administration will work with Congress to reclassify the enacted fees as discretionary beginning in 2007. Once reclassified, the Administration proposes to offset these fees against discretionary spending. Discretionary totals in those years will be reduced by these fees.
1 Affects both receipts and outlays. Only the outlay effect is shown here.
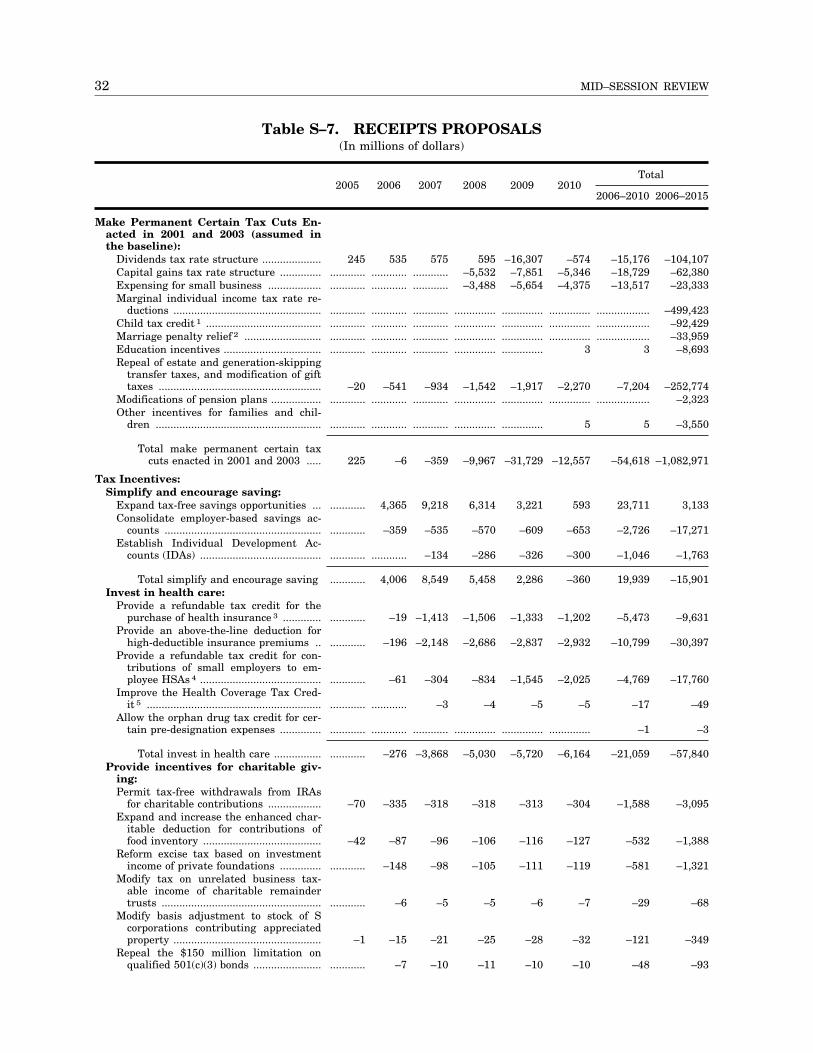
32 MID–SESSION REVIEW
Table S–7. RECEIPTS PROPOSALS (In millions of dollars)
Total 2005 2006 2007 2008 2009 2010
2006–2010 2006–2015
Make Permanent Certain Tax Cuts Enacted in 2001 and 2003 (assumed in the baseline):
Dividends tax rate structure .................... 245 535 575 595 –16,307 –574 –15,176 –104,107 Capital gains tax rate structure .............. ............ ............ ............ –5,532 –7,851 –5,346 –18,729 –62,380 Expensing for small business .................. ............ ............ ............ –3,488 –5,654 –4,375 –13,517 –23,333 Marginal individual income tax rate re
ductions .................................................. ............ ............ ............ .............. .............. .............. .................. –499,423Child tax credit 1 ....................................... ............ ............ ............ .............. .............. .............. .................. –92,429Marriage penalty relief 2 .......................... ............ ............ ............ .............. .............. .............. .................. –33,959Education incentives ................................. ............ ............ ............ .............. .............. 3 3 –8,693Repeal of estate and generation-skipping
transfer taxes, and modification of gift taxes ....................................................... –20 –541 –934 –1,542 –1,917 –2,270 –7,204 –252,774
Modifications of pension plans ................. ............ ............ ............ .............. .............. .............. .................. –2,323 Other incentives for families and chil
dren ........................................................ ............ ............ ............ .............. .............. 5 5 –3,550
Total make permanent certain tax cuts enacted in 2001 and 2003 ..... 225 –6 –359 –9,967 –31,729 –12,557 –54,618 –1,082,971
Tax Incentives: Simplify and encourage saving:
Expand tax-free savings opportunities ... ............ 4,365 9,218 6,314 3,221 593 23,711 3,133 Consolidate employer-based savings ac
counts ..................................................... ............ –359 –535 –570 –609 –653 –2,726 –17,271 Establish Individual Development Ac
counts (IDAs) ......................................... ............ ............ –134 –286 –326 –300 –1,046 –1,763
Total simplify and encourage saving ............ 4,006 8,549 5,458 2,286 –360 19,939 –15,901Invest in health care:
Provide a refundable tax credit for the purchase of health insurance 3 ............. ............ –19 –1,413 –1,506 –1,333 –1,202 –5,473 –9,631
Provide an above-the-line deduction for high-deductible insurance premiums .. ............ –196 –2,148 –2,686 –2,837 –2,932 –10,799 –30,397
Provide a refundable tax credit for contributions of small employers to employee HSAs 4 ......................................... ............ –61 –304 –834 –1,545 –2,025 –4,769 –17,760
Improve the Health Coverage Tax Credit 5 ........................................................... ............ ............ –3 –4 –5 –5 –17 –49
Allow the orphan drug tax credit for certain pre-designation expenses .............. ............ ............ ............ .............. .............. .............. –1 –3
Total invest in health care ................ ............ –276 –3,868 –5,030 –5,720 –6,164 –21,059 –57,840Provide incentives for charitable giv
ing: Permit tax-free withdrawals from IRAs
for charitable contributions .................. –70 –335 –318 –318 –313 –304 –1,588 –3,095 Expand and increase the enhanced char
itable deduction for contributions of food inventory ........................................ –42 –87 –96 –106 –116 –127 –532 –1,388
Reform excise tax based on investment income of private foundations .............. ............ –148 –98 –105 –111 –119 –581 –1,321
Modify tax on unrelated business taxable income of charitable remainder trusts ...................................................... ............ –6 –5 –5 –6 –7 –29 –68
Modify basis adjustment to stock of S corporations contributing appreciated property .................................................. –1 –15 –21 –25 –28 –32 –121 –349
Repeal the $150 million limitation on qualified 501(c)(3) bonds ....................... ............ –7 –10 –11 –10 –10 –48 –93
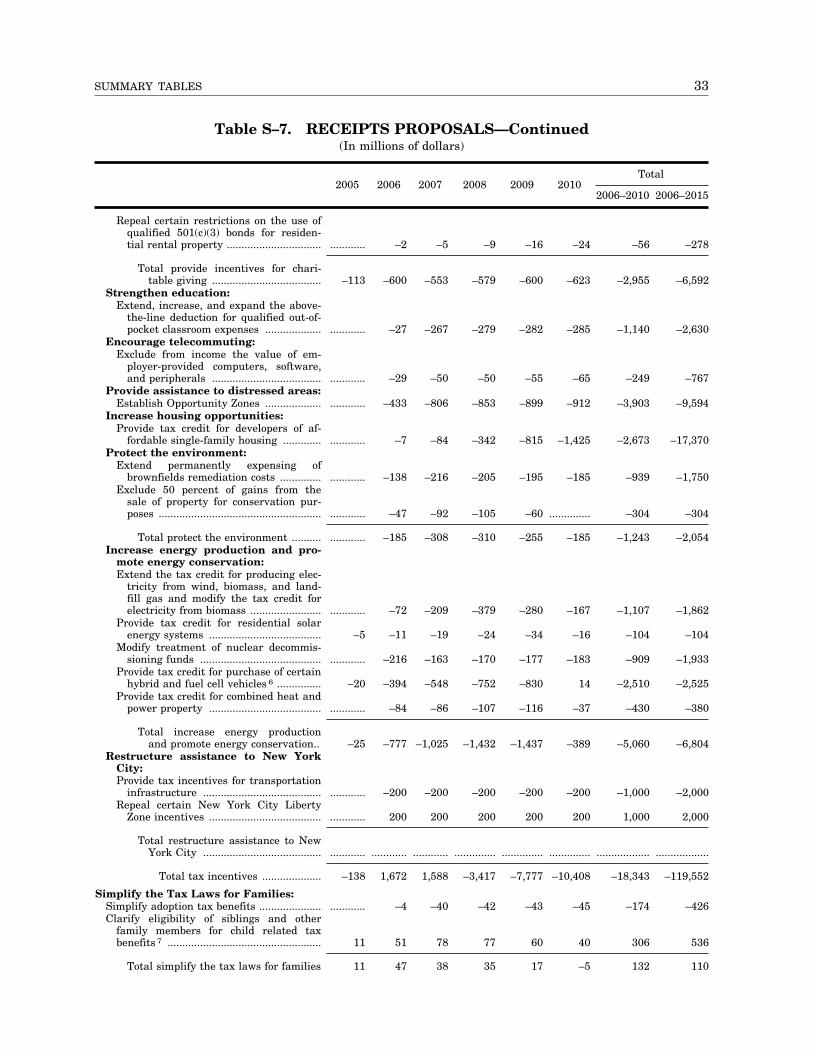
33 SUMMARY TABLES
Table S–7. RECEIPTS PROPOSALS—Continued (In millions of dollars)
Total 2005 2006 2007 2008 2009 2010
2006–2010 2006–2015
Repeal certain restrictions on the use of qualified 501(c)(3) bonds for residential rental property ................................ ............ –2 –5 –9 –16 –24 –56 –278
Total provide incentives for charitable giving ..................................... –113 –600 –553 –579 –600 –623 –2,955 –6,592
Strengthen education: Extend, increase, and expand the above-
the-line deduction for qualified out-of-pocket classroom expenses ................... ............ –27 –267 –279 –282 –285 –1,140 –2,630
Encourage telecommuting: Exclude from income the value of em-
ployer-provided computers, software, and peripherals ..................................... ............ –29 –50 –50 –55 –65 –249 –767
Provide assistance to distressed areas: Establish Opportunity Zones ................... ............ –433 –806 –853 –899 –912 –3,903 –9,594
Increase housing opportunities: Provide tax credit for developers of af
fordable single-family housing ............. ............ –7 –84 –342 –815 –1,425 –2,673 –17,370 Protect the environment:
Extend permanently expensing of brownfields remediation costs .............. ............ –138 –216 –205 –195 –185 –939 –1,750
Exclude 50 percent of gains from the sale of property for conservation purposes ....................................................... ............ –47 –92 –105 –60 .............. –304 –304
Total protect the environment .......... ............ –185 –308 –310 –255 –185 –1,243 –2,054Increase energy production and pro
mote energy conservation: Extend the tax credit for producing elec
tricity from wind, biomass, and landfill gas and modify the tax credit for electricity from biomass ........................ ............ –72 –209 –379 –280 –167 –1,107 –1,862
Provide tax credit for residential solar energy systems ...................................... –5 –11 –19 –24 –34 –16 –104 –104
Modify treatment of nuclear decommissioning funds ......................................... ............ –216 –163 –170 –177 –183 –909 –1,933
Provide tax credit for purchase of certain hybrid and fuel cell vehicles 6 ............... –20 –394 –548 –752 –830 14 –2,510 –2,525
Provide tax credit for combined heat and power property ...................................... ............ –84 –86 –107 –116 –37 –430 –380
Total increase energy production and promote energy conservation.. –25 –777 –1,025 –1,432 –1,437 –389 –5,060 –6,804
Restructure assistance to New York City: Provide tax incentives for transportation
infrastructure ........................................ ............ –200 –200 –200 –200 –200 –1,000 –2,000 Repeal certain New York City Liberty
Zone incentives ...................................... ............ 200 200 200 200 200 1,000 2,000
Total restructure assistance to New York City ........................................ ............ ............ ............ .............. .............. .............. .................. ..................
Total tax incentives .................... –138 1,672 1,588 –3,417 –7,777 –10,408 –18,343 –119,552
Simplify the Tax Laws for Families: Simplify adoption tax benefits ..................... ............ –4 –40 –42 –43 –45 –174 –426 Clarify eligibility of siblings and other
family members for child related tax benefits 7 .................................................... 11 51 78 77 60 40 306
Total simplify the tax laws for families 11 47 38 35 17 –5 132
536
110
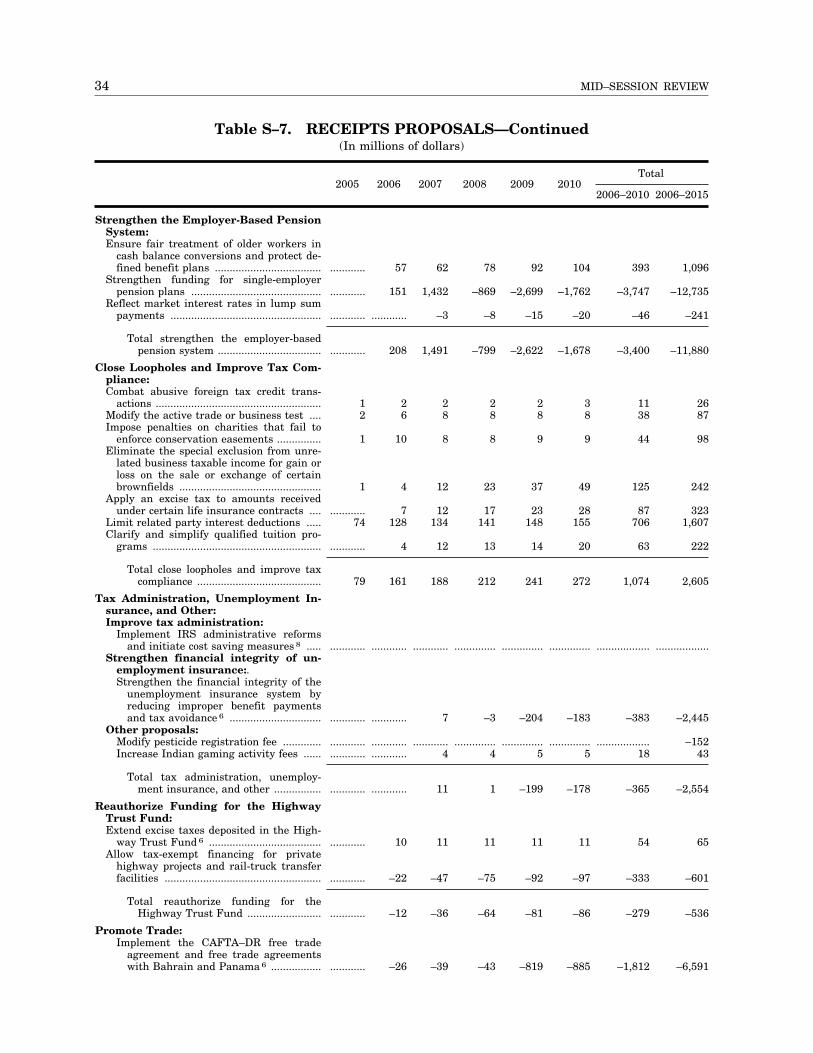
34 MID–SESSION REVIEW
Table S–7. RECEIPTS PROPOSALS—Continued (In millions of dollars)
Total 2005 2006 2007 2008 2009 2010
2006–2010 2006–2015
Strengthen the Employer-Based Pension System: Ensure fair treatment of older workers in
cash balance conversions and protect defined benefit plans .................................... ............ 57 62 78 92 104 393 1,096
Strengthen funding for single-employer pension plans ............................................ ............ 151 1,432 –869 –2,699 –1,762 –3,747 –12,735
Reflect market interest rates in lump sum payments ................................................... ............ ............ –3 –8 –15 –20 –46 –241
Total strengthen the employer-based pension system ................................... ............ 208 1,491 –799 –2,622 –1,678 –3,400 –11,880
Close Loopholes and Improve Tax Compliance: Combat abusive foreign tax credit trans
actions ........................................................ 1 2 2 2 2 3 11 26 Modify the active trade or business test .... 2 6 8 8 8 8 38 87 Impose penalties on charities that fail to
enforce conservation easements ............... 1 10 8 8 9 9 44 98 Eliminate the special exclusion from unre
lated business taxable income for gain or loss on the sale or exchange of certain brownfields ................................................ 1 4 12 23 37 49 125 242
Apply an excise tax to amounts received under certain life insurance contracts .... ............ 7 12 17 23 28 87 323
Limit related party interest deductions ..... 74 128 134 141 148 155 706 1,607 Clarify and simplify qualified tuition pro
grams ......................................................... ............ 4 12 13 14 20 63 222
Total close loopholes and improve tax compliance .......................................... 79 161 188 212 241 272 1,074 2,605
Tax Administration, Unemployment Insurance, and Other: Improve tax administration:
Implement IRS administrative reforms and initiate cost saving measures 8 ..... ............ ............ ............ .............. .............. .............. .................. ..................
Strengthen financial integrity of unemployment insurance:.Strengthen the financial integrity of the
unemployment insurance system by reducing improper benefit payments and tax avoidance 6 ............................... ............ ............ 7 –3 –204 –183 –383 –2,445
Other proposals: Modify pesticide registration fee ............. ............ ............ ............ .............. .............. .............. .................. –152Increase Indian gaming activity fees ...... ............ ............ 4 4 5 5 18
Total tax administration, unemployment insurance, and other ................ ............ ............ 11 1 –199 –178 –365 –2,554
Reauthorize Funding for the Highway Trust Fund: Extend excise taxes deposited in the High
way Trust Fund 6 ...................................... ............ 10 11 11 11 11 54 65 Allow tax-exempt financing for private
highway projects and rail-truck transfer facilities ..................................................... ............ –22 –47 –75 –92 –97 –333 –601
Total reauthorize funding for the Highway Trust Fund ......................... ............ –12 –36 –64 –81 –86 –279 –536
Promote Trade: Implement the CAFTA–DR free trade
agreement and free trade agreements with Bahrain and Panama 6 ................. ............ –26 –39 –43 –819 –885 –1,812 –6,591
43
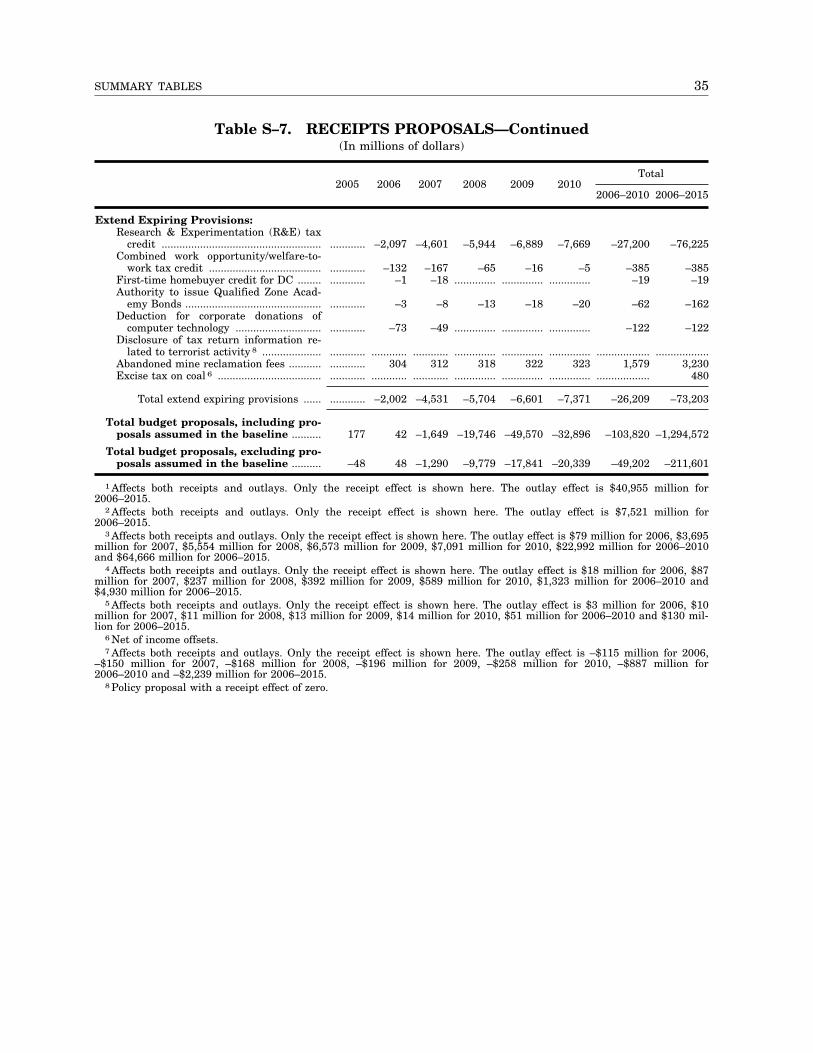
35 SUMMARY TABLES
Table S–7. RECEIPTS PROPOSALS—Continued (In millions of dollars)
Total 2005 2006 2007 2008 2009 2010
2006–2010 2006–2015
Extend Expiring Provisions: Research & Experimentation (R&E) tax
credit ...................................................... ............ –2,097 –4,601 –5,944 –6,889 –7,669 –27,200 –76,225 Combined work opportunity/welfare-to-
work tax credit ...................................... ............ –132 –167 –65 –16 –5 –385 –385 First-time homebuyer credit for DC ........ ............ –1 –18 .............. .............. .............. –19 –19 Authority to issue Qualified Zone Acad
emy Bonds .............................................. ............ –3 –8 –13 –18 –20 –62 –162 Deduction for corporate donations of
computer technology ............................. ............ –73 –49 .............. .............. .............. –122 –122 Disclosure of tax return information re
lated to terrorist activity 8 .................... ............ ............ ............ .............. .............. .............. .................. ..................Abandoned mine reclamation fees ........... ............ 304 312 318 322 323 1,579 3,230Excise tax on coal 6 ................................... ............ ............ ............ .............. .............. .............. ..................
Total extend expiring provisions ...... ............ –2,002 –4,531 –5,704 –6,601 –7,371 –26,209 –73,203
Total budget proposals, including proposals assumed in the baseline .......... 177 42 –1,649 –19,746 –49,570 –32,896 –103,820 –1,294,572
Total budget proposals, excluding proposals assumed in the baseline .......... –48 48 –1,290 –9,779 –17,841 –20,339 –49,202 –211,601
1 Affects both receipts and outlays. Only the receipt effect is shown here. The outlay effect is $40,955 million for 2006–2015.
2 Affects both receipts and outlays. Only the receipt effect is shown here. The outlay effect is $7,521 million for 2006–2015.
3 Affects both receipts and outlays. Only the receipt effect is shown here. The outlay effect is $79 million for 2006, $3,695 million for 2007, $5,554 million for 2008, $6,573 million for 2009, $7,091 million for 2010, $22,992 million for 2006–2010 and $64,666 million for 2006–2015.
4 Affects both receipts and outlays. Only the receipt effect is shown here. The outlay effect is $18 million for 2006, $87 million for 2007, $237 million for 2008, $392 million for 2009, $589 million for 2010, $1,323 million for 2006–2010 and $4,930 million for 2006–2015.
5 Affects both receipts and outlays. Only the receipt effect is shown here. The outlay effect is $3 million for 2006, $10 million for 2007, $11 million for 2008, $13 million for 2009, $14 million for 2010, $51 million for 2006–2010 and $130 million for 2006–2015.
6 Net of income offsets. 7 Affects both receipts and outlays. Only the receipt effect is shown here. The outlay effect is –$115 million for 2006,
–$150 million for 2007, –$168 million for 2008, –$196 million for 2009, –$258 million for 2010, –$887 million for 2006–2010 and –$2,239 million for 2006–2015.
8 Policy proposal with a receipt effect of zero.
480
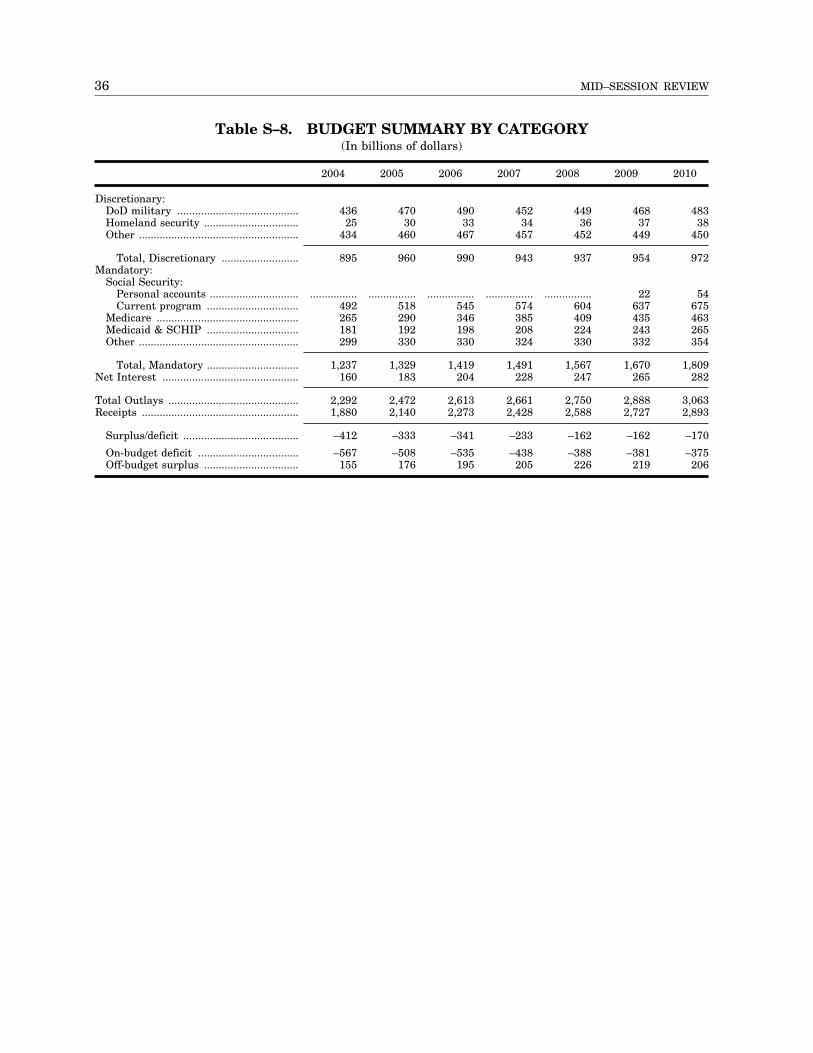
36 MID–SESSION REVIEW
Table S–8. BUDGET SUMMARY BY CATEGORY (In billions of dollars)
Discretionary: DoD military ......................................... Homeland security ................................ Other ......................................................
Total, Discretionary .......................... Mandatory:
Social Security: Personal accounts .............................. Current program ...............................
Medicare ................................................ Medicaid & SCHIP ............................... Other ......................................................
Total, Mandatory ............................... Net Interest ..............................................
Total Outlays ............................................ Receipts .....................................................
2004
436 25
434
895
................ 492 265 181 299
2005
470 30
460
960
................ 518 290 192 330
2006
490 33
467
990
................ 545 346 198 330
2007
452 34
457
943
................ 574 385 208 324
2008
449 36
452
937
................ 604 409 224 330
2009
468 37
449
954
22 637 435 243 332
2010
483 38
450
972
54 675 463 265 354
1,237 160
2,292 1,880
1,329 183
2,472 2,140
1,419 204
2,613 2,273
1,491 228
2,661 2,428
1,567 247
2,750 2,588
1,670 265
2,888 2,727
1,809 282
3,063 2,893
Surplus/deficit ....................................... –412
On-budget deficit .................................. –567Off-budget surplus ................................ 155
–333 –341 –233 –162 –162 –170
–508 –535 –438 –388 –381 –375 176 195 205 226 219 206
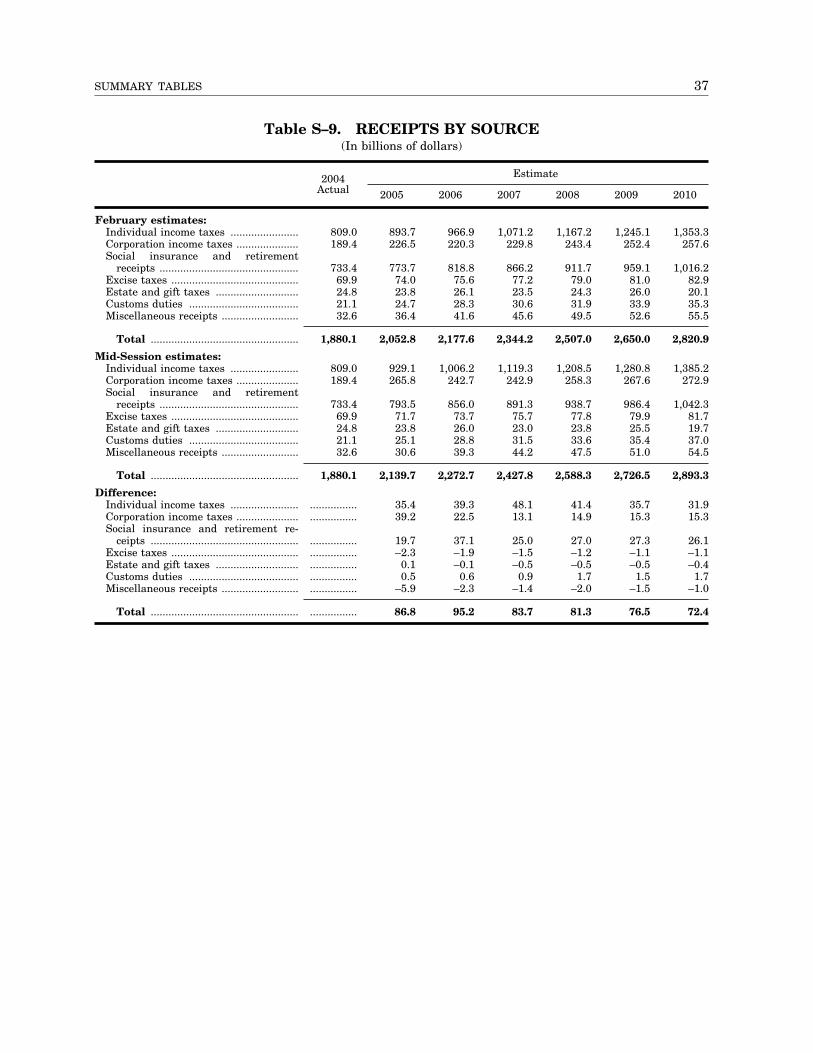
37 SUMMARY TABLES
Table S–9. RECEIPTS BY SOURCE (In billions of dollars)
February estimates: Individual income taxes .......................Corporation income taxes .....................Social insurance and retirement
receipts ...............................................Excise taxes ...........................................Estate and gift taxes ............................Customs duties .....................................Miscellaneous receipts ..........................
Estimate2004 Actual 2005 2006 2007 2008 2009 2010
809.0 893.7 966.9 1,071.2 1,167.2 1,245.1 1,353.3 189.4 226.5 220.3 229.8 243.4 252.4 257.6
733.4 773.7 818.8 866.2 911.7 959.1 1,016.2 69.9 74.0 75.6 77.2 79.0 81.0 82.9 24.8 23.8 26.1 23.5 24.3 26.0 20.1 21.1 24.7 28.3 30.6 31.9 33.9 35.3 32.6 36.4 41.6 45.6 49.5 52.6 55.5
Total ..................................................
Mid-Session estimates: Individual income taxes .......................Corporation income taxes .....................Social insurance and retirement
receipts ...............................................Excise taxes ...........................................Estate and gift taxes ............................Customs duties .....................................Miscellaneous receipts ..........................
1,880.1 2,052.8 2,177.6 2,344.2 2,507.0 2,650.0 2,820.9
809.0 929.1 1,006.2 1,119.3 1,208.5 1,280.8 1,385.2 189.4 265.8 242.7 242.9 258.3 267.6 272.9
733.4 793.5 856.0 891.3 938.7 986.4 1,042.3 69.9 71.7 73.7 75.7 77.8 79.9 81.7 24.8 23.8 26.0 23.0 23.8 25.5 19.7 21.1 25.1 28.8 31.5 33.6 35.4 37.0 32.6 30.6 39.3 44.2 47.5 51.0 54.5
Total ..................................................
Difference: Individual income taxes .......................Corporation income taxes .....................Social insurance and retirement re
ceipts ..................................................Excise taxes ...........................................Estate and gift taxes ............................Customs duties .....................................Miscellaneous receipts ..........................
1,880.1 2,139.7 2,272.7 2,427.8 2,588.3 2,726.5 2,893.3
................ 35.4 39.3 48.1 41.4 35.7 31.9
................ 39.2 22.5 13.1 14.9 15.3 15.3
................ 19.7 37.1
................ –2.3 –1.9
................ 0.1 –0.1
................ 0.5 0.6
................ –5.9 –2.3
25.0 27.0 27.3 26.1 –1.5 –1.2 –1.1 –1.1 –0.5 –0.5 –0.5 –0.4
0.9 1.7 1.5 1.7 –1.4 –2.0 –1.5 –1.0
Total .................................................. ................ 86.8 95.2 83.7 81.3 76.5 72.4
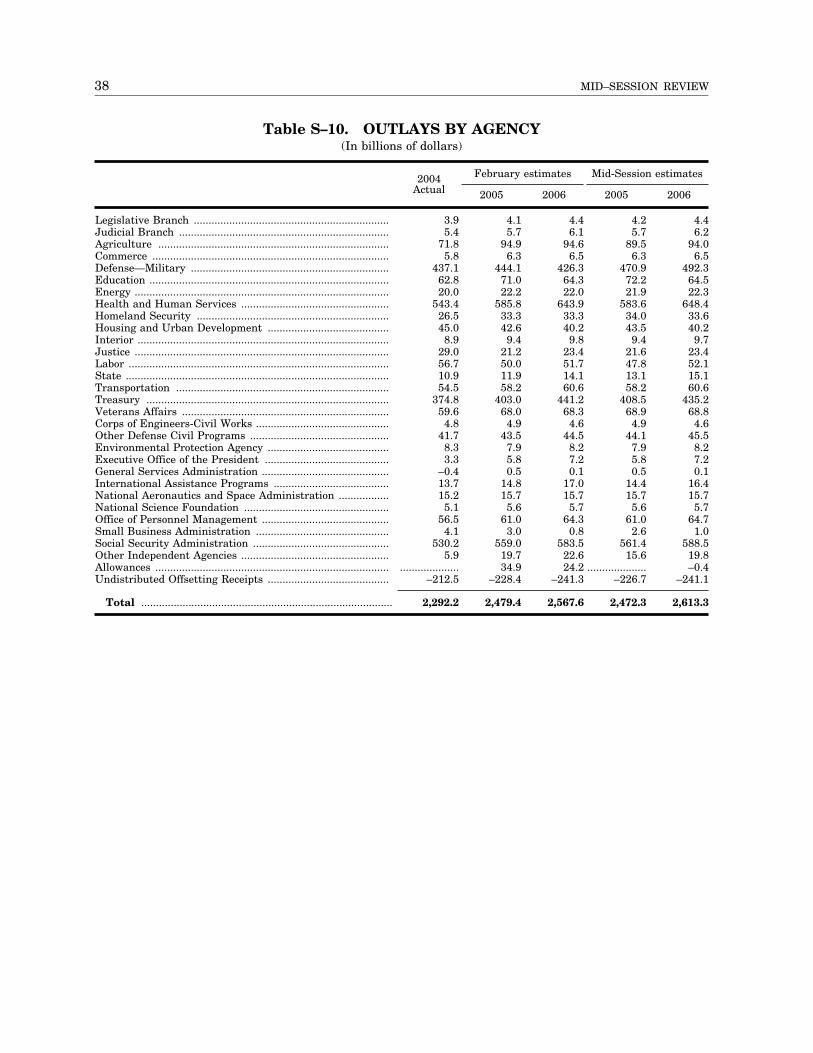
38 MID–SESSION REVIEW
Table S–10. OUTLAYS BY AGENCY (In billions of dollars)
2004 February estimates Mid-Session estimates Actual 2005 2006 2005 2006
Legislative Branch .................................................................. 3.9Judicial Branch ....................................................................... 5.4Agriculture .............................................................................. 71.8Commerce ................................................................................ 5.8Defense—Military ................................................................... 437.1Education ................................................................................. 62.8Energy ...................................................................................... 20.0Health and Human Services .................................................. 543.4Homeland Security ................................................................. 26.5Housing and Urban Development ......................................... 45.0Interior ..................................................................................... 8.9Justice ...................................................................................... 29.0Labor ........................................................................................ 56.7State ......................................................................................... 10.9Transportation ........................................................................ 54.5Treasury .................................................................................. 374.8Veterans Affairs ...................................................................... 59.6Corps of Engineers-Civil Works ............................................. 4.8Other Defense Civil Programs ............................................... 41.7Environmental Protection Agency ......................................... 8.3Executive Office of the President .......................................... 3.3General Services Administration ........................................... –0.4International Assistance Programs ....................................... 13.7National Aeronautics and Space Administration ................. 15.2National Science Foundation ................................................. 5.1Office of Personnel Management ........................................... 56.5Small Business Administration ............................................. 4.1Social Security Administration .............................................. 530.2Other Independent Agencies .................................................. 5.9Allowances ............................................................................... ....................Undistributed Offsetting Receipts ......................................... –212.5
4.1 4.4 4.2 4.4 5.7 6.1 5.7 6.2
94.9 94.6 89.5 94.0 6.3 6.5 6.3 6.5
444.1 426.3 470.9 492.3 71.0 64.3 72.2 64.5 22.2 22.0 21.9 22.3
585.8 643.9 583.6 648.4 33.3 33.3 34.0 33.6 42.6 40.2 43.5 40.2
9.4 9.8 9.4 9.7 21.2 23.4 21.6 23.4 50.0 51.7 47.8 52.1 11.9 14.1 13.1 15.1 58.2 60.6 58.2 60.6
403.0 441.2 408.5 435.2 68.0 68.3 68.9 68.8 4.9 4.6 4.9 4.6
43.5 44.5 44.1 45.5 7.9 8.2 7.9 8.2 5.8 7.2 5.8 7.2 0.5 0.1 0.5 0.1
14.8 17.0 14.4 16.4 15.7 15.7 15.7 15.7 5.6 5.7 5.6 5.7
61.0 64.3 61.0 64.7 3.0 0.8 2.6 1.0
559.0 583.5 561.4 588.5 19.7 22.6 15.6 19.8 34.9 24.2 .................... –0.4
–228.4 –241.3 –226.7 –241.1
Total ..................................................................................... 2,292.2 2,479.4 2,567.6 2,472.3 2,613.3
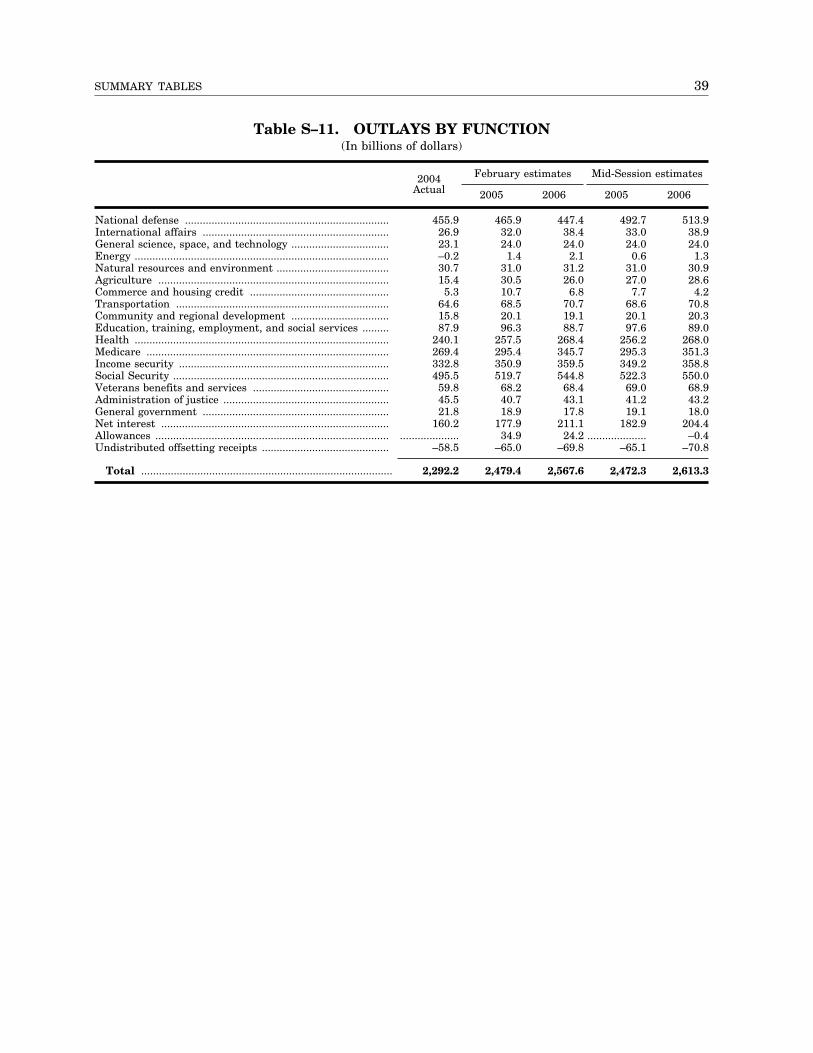
39 SUMMARY TABLES
Table S–11. OUTLAYS BY FUNCTION (In billions of dollars)
2004 February estimates Mid-Session estimates Actual 2005 2006 2005 2006
National defense ..................................................................... 455.9International affairs ............................................................... 26.9General science, space, and technology ................................. 23.1Energy ...................................................................................... –0.2Natural resources and environment ...................................... 30.7Agriculture .............................................................................. 15.4Commerce and housing credit ............................................... 5.3Transportation ........................................................................ 64.6Community and regional development ................................. 15.8Education, training, employment, and social services ......... 87.9Health ...................................................................................... 240.1Medicare .................................................................................. 269.4Income security ....................................................................... 332.8Social Security ......................................................................... 495.5Veterans benefits and services .............................................. 59.8Administration of justice ........................................................ 45.5General government ............................................................... 21.8Net interest ............................................................................. 160.2Allowances ............................................................................... ....................Undistributed offsetting receipts ........................................... –58.5
465.9 447.4 492.7 513.9 32.0 38.4 33.0 38.9 24.0 24.0 24.0 24.0 1.4 2.1 0.6 1.3
31.0 31.2 31.0 30.9 30.5 26.0 27.0 28.6 10.7 6.8 7.7 4.2 68.5 70.7 68.6 70.8 20.1 19.1 20.1 20.3 96.3 88.7 97.6 89.0
257.5 268.4 256.2 268.0 295.4 345.7 295.3 351.3 350.9 359.5 349.2 358.8 519.7 544.8 522.3 550.0 68.2 68.4 69.0 68.9 40.7 43.1 41.2 43.2 18.9 17.8 19.1 18.0
177.9 211.1 182.9 204.4 34.9 24.2 .................... –0.4
–65.0 –69.8 –65.1 –70.8
Total ..................................................................................... 2,292.2 2,479.4 2,567.6 2,472.3 2,613.3
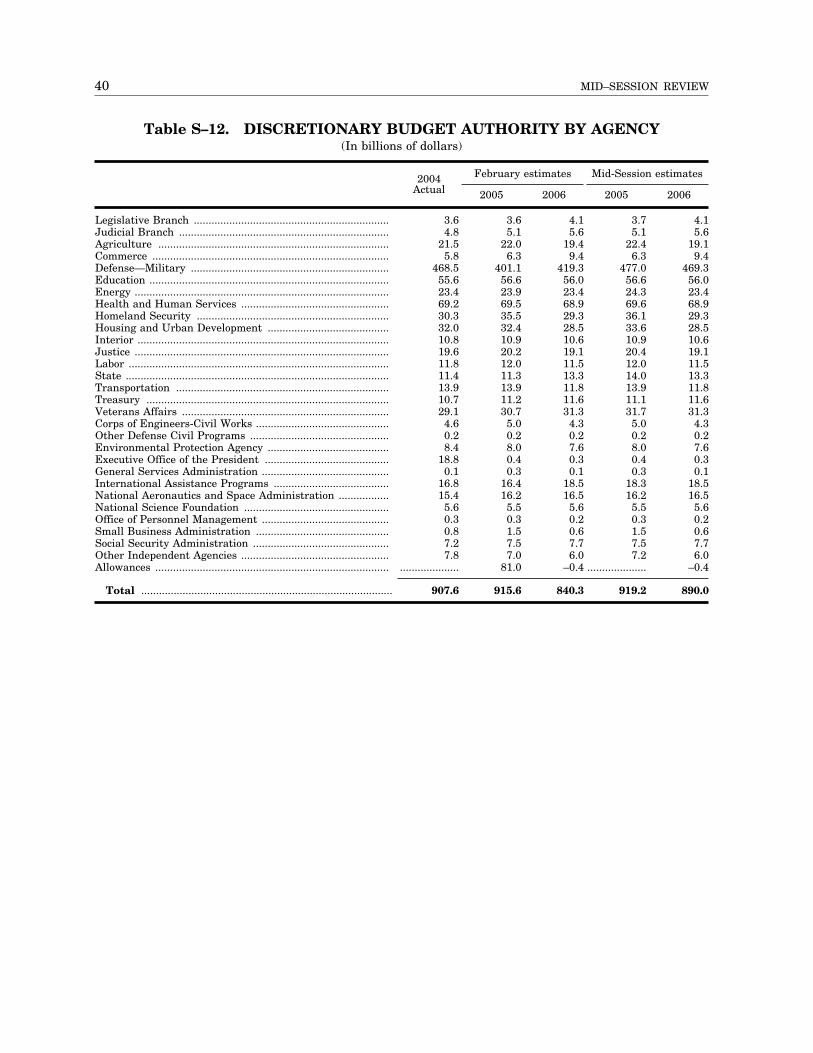
40 MID–SESSION REVIEW
Table S–12. DISCRETIONARY BUDGET AUTHORITY BY AGENCY (In billions of dollars)
2004 February estimates Mid-Session estimates Actual 2005 2006 2005 2006
Legislative Branch .................................................................. 3.6Judicial Branch ....................................................................... 4.8Agriculture .............................................................................. 21.5Commerce ................................................................................ 5.8Defense—Military ................................................................... 468.5Education ................................................................................. 55.6Energy ...................................................................................... 23.4Health and Human Services .................................................. 69.2Homeland Security ................................................................. 30.3Housing and Urban Development ......................................... 32.0Interior ..................................................................................... 10.8Justice ...................................................................................... 19.6Labor ........................................................................................ 11.8State ......................................................................................... 11.4Transportation ........................................................................ 13.9Treasury .................................................................................. 10.7Veterans Affairs ...................................................................... 29.1Corps of Engineers-Civil Works ............................................. 4.6Other Defense Civil Programs ............................................... 0.2Environmental Protection Agency ......................................... 8.4Executive Office of the President .......................................... 18.8General Services Administration ........................................... 0.1International Assistance Programs ....................................... 16.8National Aeronautics and Space Administration ................. 15.4National Science Foundation ................................................. 5.6Office of Personnel Management ........................................... 0.3Small Business Administration ............................................. 0.8Social Security Administration .............................................. 7.2Other Independent Agencies .................................................. 7.8Allowances ............................................................................... ....................
3.6 4.1 3.7 4.1 5.1 5.6 5.1 5.6
22.0 19.4 22.4 19.1 6.3 9.4 6.3 9.4
401.1 419.3 477.0 469.3 56.6 56.0 56.6 56.0 23.9 23.4 24.3 23.4 69.5 68.9 69.6 68.9 35.5 29.3 36.1 29.3 32.4 28.5 33.6 28.5 10.9 10.6 10.9 10.6 20.2 19.1 20.4 19.1 12.0 11.5 12.0 11.5 11.3 13.3 14.0 13.3 13.9 11.8 13.9 11.8 11.2 11.6 11.1 11.6 30.7 31.3 31.7 31.3 5.0 4.3 5.0 4.3 0.2 0.2 0.2 0.2 8.0 7.6 8.0 7.6 0.4 0.3 0.4 0.3 0.3 0.1 0.3 0.1
16.4 18.5 18.3 18.5 16.2 16.5 16.2 16.5 5.5 5.6 5.5 5.6 0.3 0.2 0.3 0.2 1.5 0.6 1.5 0.6 7.5 7.7 7.5 7.7 7.0 6.0 7.2 6.0
81.0 –0.4 .................... –0.4
Total ..................................................................................... 907.6 915.6 840.3 919.2 890.0
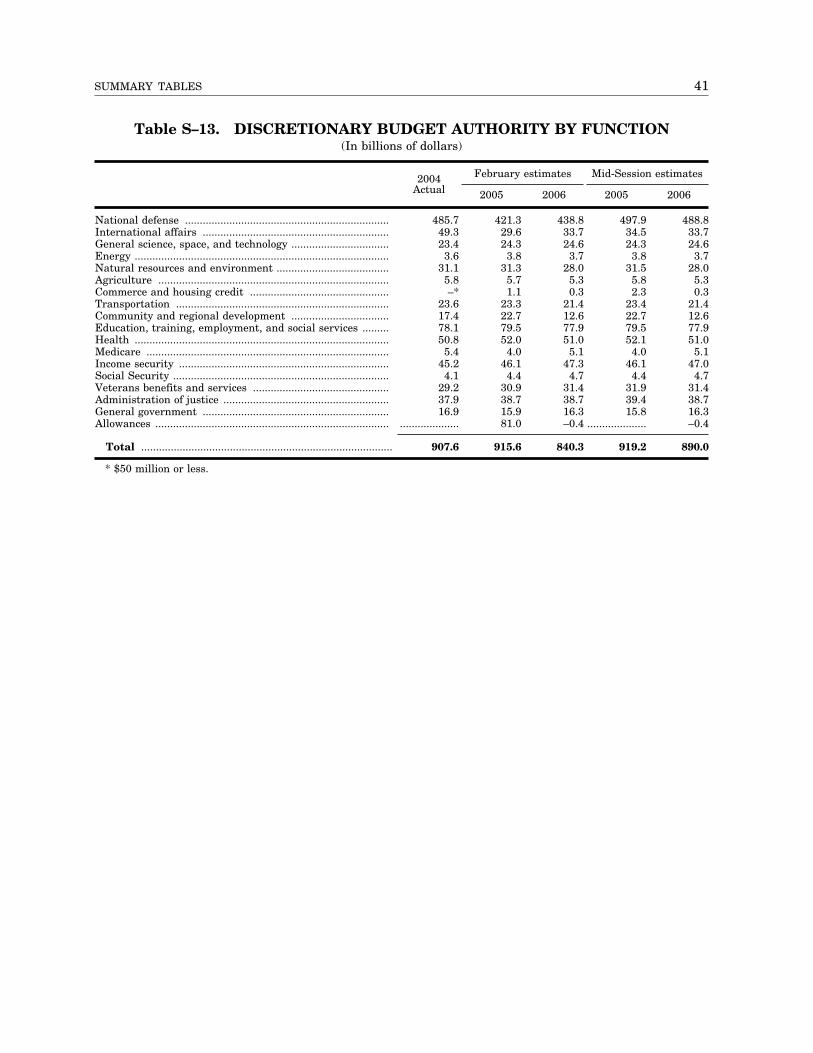
41 SUMMARY TABLES
Table S–13. DISCRETIONARY BUDGET AUTHORITY BY FUNCTION (In billions of dollars)
2004 February estimates Mid-Session estimates Actual 2005 2006 2005 2006
National defense ..................................................................... 485.7International affairs ............................................................... 49.3General science, space, and technology ................................. 23.4Energy ...................................................................................... 3.6Natural resources and environment ...................................... 31.1Agriculture .............................................................................. 5.8Commerce and housing credit ............................................... –*Transportation ........................................................................ 23.6Community and regional development ................................. 17.4Education, training, employment, and social services ......... 78.1Health ...................................................................................... 50.8Medicare .................................................................................. 5.4Income security ....................................................................... 45.2Social Security ......................................................................... 4.1Veterans benefits and services .............................................. 29.2Administration of justice ........................................................ 37.9General government ............................................................... 16.9Allowances ............................................................................... ....................
421.3 438.8 497.9 488.8 29.6 33.7 34.5 33.7 24.3 24.6 24.3 24.6 3.8 3.7 3.8 3.7
31.3 28.0 31.5 28.0 5.7 5.3 5.8 5.3 1.1 0.3 2.3 0.3
23.3 21.4 23.4 21.4 22.7 12.6 22.7 12.6 79.5 77.9 79.5 77.9 52.0 51.0 52.1 51.0 4.0 5.1 4.0 5.1
46.1 47.3 46.1 47.0 4.4 4.7 4.4 4.7
30.9 31.4 31.9 31.4 38.7 38.7 39.4 38.7 15.9 16.3 15.8 16.3 81.0 –0.4 .................... –0.4
Total ..................................................................................... 907.6 915.6 840.3 919.2 890.0
* $50 million or less.
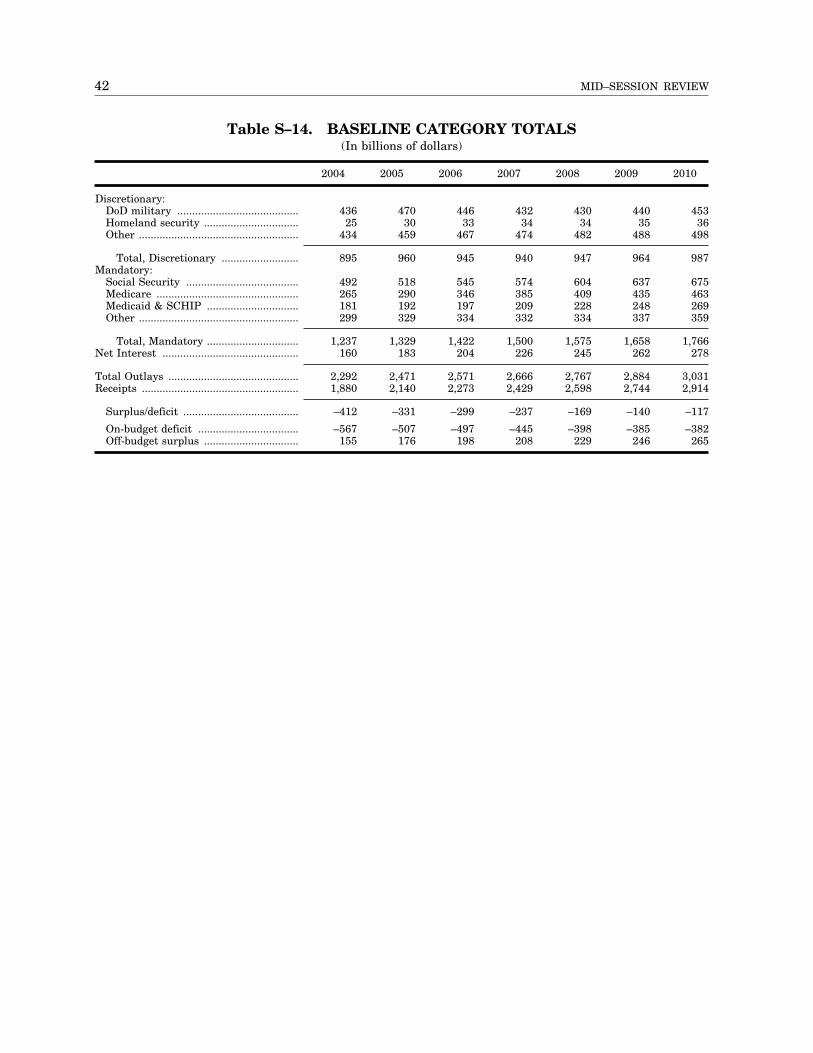
42 MID–SESSION REVIEW
Table S–14. BASELINE CATEGORY TOTALS (In billions of dollars)
2004 2005 2006 2007 2008 2009 2010
Discretionary: DoD military ......................................... 436 470 446 432 430 440 453 Homeland security ................................ 25 30 33 34 34 35 36 Other ...................................................... 434 459 467 474 482 488 498
Total, Discretionary .......................... 895 960 945 940 947 964 987 Mandatory:
Social Security ...................................... 492 518 545 574 604 637 675 Medicare ................................................ 265 290 346 385 409 435 463 Medicaid & SCHIP ............................... 181 192 197 209 228 248 269 Other ...................................................... 299 329 334 332 334 337 359
Total, Mandatory ............................... Net Interest ..............................................
1,237 160
1,329 183
1,422 204
1,500 226
1,575 245
1,658 262
1,766 278
Total Outlays ............................................ 2,292 2,471 2,571 2,666 2,767 2,884 3,031Receipts ..................................................... 1,880 2,140 2,273 2,429 2,598 2,744 2,914
Surplus/deficit ....................................... –412
On-budget deficit .................................. –567Off-budget surplus ................................ 155
–331 –299 –237 –169 –140 –117
–507 –497 –445 –398 –385 –382 176 198 208 229 246 265
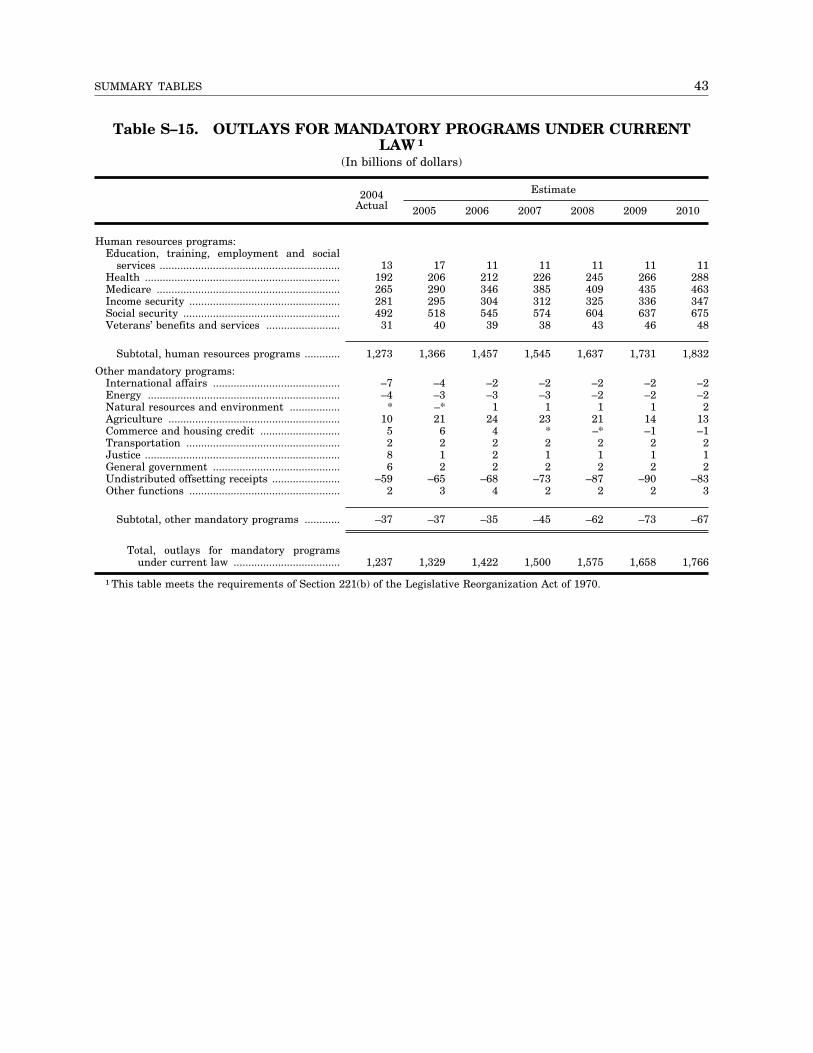
43 SUMMARY TABLES
Table S–15. OUTLAYS FOR MANDATORY PROGRAMS UNDER CURRENT LAW 1
(In billions of dollars)
Estimate2004 Actual 2005 2006 2007 2008 2009 2010
Human resources programs: Education, training, employment and social
services ............................................................. 13 17 11 11 11 11 11 Health .................................................................. 192 206 212 226 245 266 288 Medicare .............................................................. 265 290 346 385 409 435 463 Income security ................................................... 281 295 304 312 325 336 347 Social security ..................................................... 492 518 545 574 604 637 675 Veterans’ benefits and services ......................... 31 40 39 38 43 46 48
Subtotal, human resources programs ............ 1,273 1,366 1,457 1,545 1,637 1,731 1,832
Other mandatory programs: International affairs ........................................... –7 –4 –2 –2 –2 –2 –2 Energy ................................................................. –4 –3 –3 –3 –2 –2 –2 Natural resources and environment ................. * –* 1 1 1 1 2 Agriculture .......................................................... 10 21 24 23 21 14 13 Commerce and housing credit ........................... 5 6 4 * –* –1 –1 Transportation .................................................... 2 2 2 2 2 2 2 Justice .................................................................. 8 1 2 1 1 1 1 General government ........................................... 6 2 2 2 2 2 2 Undistributed offsetting receipts ....................... –59 –65 –68 –73 –87 –90 –83 Other functions ................................................... 2 3 4 2 2 2 3
Subtotal, other mandatory programs ............ –37 –37 –35 –45 –62 –73 –67
Total, outlays for mandatory programs under current law .................................... 1,237 1,329 1,422 1,500 1,575 1,658 1,766
1 This table meets the requirements of Section 221(b) of the Legislative Reorganization Act of 1970.
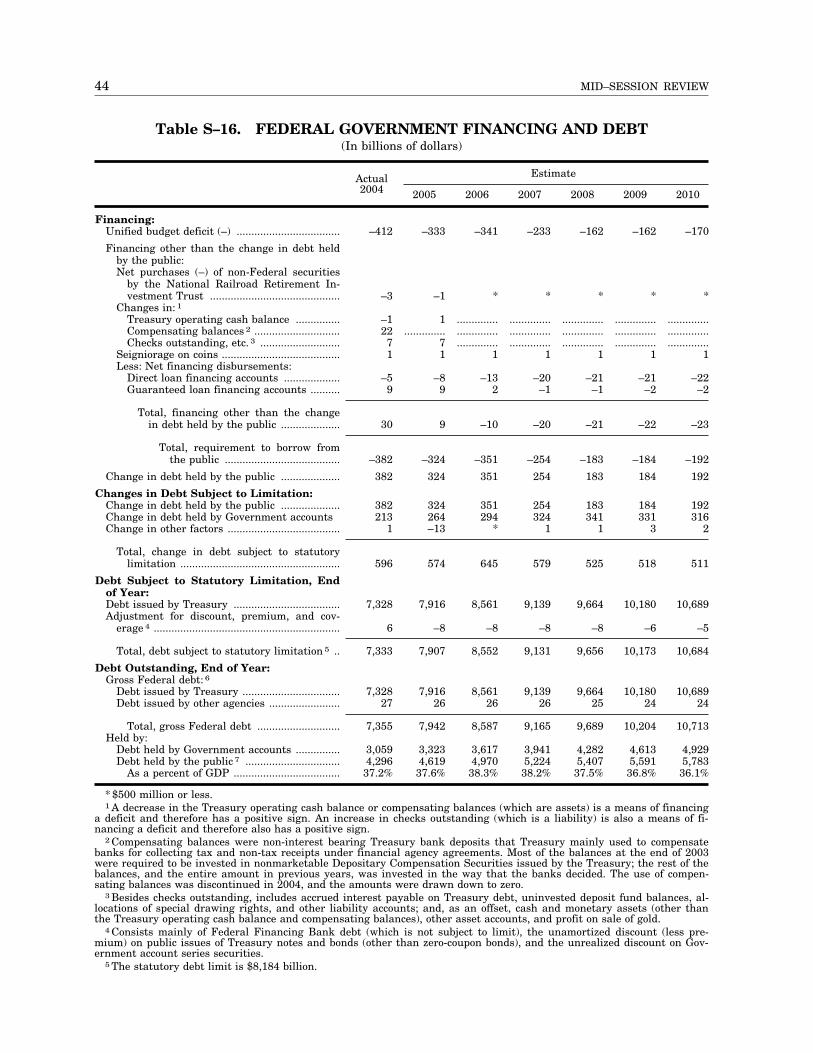
44 MID–SESSION REVIEW
Table S–16. FEDERAL GOVERNMENT FINANCING AND DEBT (In billions of dollars)
EstimateActual 2004 2005 2006 2007 2008 2009 2010
Financing: Unified budget deficit (–) ...................................
Financing other than the change in debt held by the public: Net purchases (–) of non-Federal securities
by the National Railroad Retirement Investment Trust ............................................
Changes in: 1
Treasury operating cash balance ............... Compensating balances 2 ............................. Checks outstanding, etc. 3 ...........................
Seigniorage on coins ........................................ Less: Net financing disbursements:
Direct loan financing accounts ................... Guaranteed loan financing accounts ..........
Total, financing other than the change in debt held by the public ....................
Total, requirement to borrow from the public .......................................
Change in debt held by the public ....................
Changes in Debt Subject to Limitation: Change in debt held by the public .................... Change in debt held by Government accounts Change in other factors ......................................
Total, change in debt subject to statutory limitation ......................................................
Debt Subject to Statutory Limitation, End of Year: Debt issued by Treasury .................................... Adjustment for discount, premium, and cov
erage 4 ...............................................................
–412
–3
–1 22 7 1
–5 9
–333
–1
1 ..............
7 1
–8 9
–341
*
..............
..............
.............. 1
–13 2
–233
*
..............
..............
.............. 1
–20 –1
–162
*
..............
..............
.............. 1
–21 –1
–162
*
..............
..............
.............. 1
–21 –2
–170
*
..............
..............
.............. 1
–22 –2
30
–382
382
382 213
1
596
7,328
6
9
–324
324
324 264 –13
574
7,916
–8
–10
–351
351
351 294
*
645
8,561
–8
–20
–254
254
254 324
1
579
9,139
–8
–21
–183
183
183 341
1
525
9,664
–8
–22
–184
184
184 331
3
518
10,180
–6
–23
–192
192
192 316
2
511
10,689
–5
Total, debt subject to statutory limitation 5 .. 7,333 7,907 8,552 9,131 9,656 10,173 10,684
Debt Outstanding, End of Year: Gross Federal debt: 6
Debt issued by Treasury ................................. 7,328 7,916 8,561 9,139 9,664 10,180 10,689 Debt issued by other agencies ........................ 27 26 26 26 25 24 24
Total, gross Federal debt ............................ 7,355 7,942 8,587 9,165 9,689 10,204 10,713 Held by:
Debt held by Government accounts ............... 3,059 3,323 3,617 3,941 4,282 4,613 4,929 Debt held by the public 7 ................................ 4,296 4,619 4,970 5,224 5,407 5,591 5,783
As a percent of GDP .................................... 37.2% 37.6% 38.3% 38.2% 37.5% 36.8% 36.1%
* $500 million or less. 1 A decrease in the Treasury operating cash balance or compensating balances (which are assets) is a means of financing
a deficit and therefore has a positive sign. An increase in checks outstanding (which is a liability) is also a means of financing a deficit and therefore also has a positive sign.
2 Compensating balances were non-interest bearing Treasury bank deposits that Treasury mainly used to compensate banks for collecting tax and non-tax receipts under financial agency agreements. Most of the balances at the end of 2003 were required to be invested in nonmarketable Depositary Compensation Securities issued by the Treasury; the rest of the balances, and the entire amount in previous years, was invested in the way that the banks decided. The use of compensating balances was discontinued in 2004, and the amounts were drawn down to zero.
3 Besides checks outstanding, includes accrued interest payable on Treasury debt, uninvested deposit fund balances, allocations of special drawing rights, and other liability accounts; and, as an offset, cash and monetary assets (other than the Treasury operating cash balance and compensating balances), other asset accounts, and profit on sale of gold.
4 Consists mainly of Federal Financing Bank debt (which is not subject to limit), the unamortized discount (less premium) on public issues of Treasury notes and bonds (other than zero-coupon bonds), and the unrealized discount on Government account series securities.
5 The statutory debt limit is $8,184 billion.

45 SUMMARY TABLES
6 Treasury securities held by the public and zero-coupon bonds held by Government accounts are almost all measured at sales price plus amortized discount or less amortized premium. Agency debt securities are almost all measured at face value. Treasury securities in the Government account series are otherwise measured at face value less unrealized discount (if any).
7 At the end of 2004, the Federal Reserve Banks held $700 billion of Federal securities and the rest of the public held $3,595 billion. Debt held by the Federal Reserve Banks is not estimated for future years.
GLOSSARY Appropriation.—An appropriation provides
legal authority for Federal agencies to incur obligations and to make payments out of the Treasury for specified purposes. Regular appropriations bills are considered every year by the Congress and supplemental appropriations are considered from time to time.
Authorization.—An authorization is an act of the Congress that establishes or continues a Federal program or agency and sets forth the guidelines to which it must adhere.
Budget Authority.—Budget authority is the authority provided by law to incur financial obligations that will result in outlays.
Budget Resolution.—The budget resolution is Congress’ annual framework that sets targets for total budget authority, total outlays, total revenues, and the deficit (on-budget), as well as discretionary and mandatory allocations within the spending targets. These targets guide the committees’ deliberations. A budget resolution does not become law and is not binding on the Executive Branch.
Cap.—A ‘‘cap’’ is a legal limit on annual discretionary spending.
Deficit.—A deficit is the amount by which outlays exceed receipts in a fiscal year.
Discretionary Spending.—Discretionary spending is what the President and the Congress decide to spend through annual appropriations bills. Examples include spending for such activities as the FBI, the Coast Guard, education, space exploration, highway construction, defense, and foreign aid. (See Mandatory Spending.)
Entitlement.—An entitlement program is one in which the Federal Government is legally obligated to make payments or provide aid to any person who meets the legal criteria for eligibility. Examples include Social Security, Medicare, Medicaid, and Food Stamps.
Fiscal Year.—The fiscal year is the Federal Government’s accounting period. It begins on October 1st and ends on September 30th. For example, fiscal year 2006 begins on October 1, 2005, and ends on September 30, 2006.
Gross Domestic Product (GDP).—GDP is a measure of the market value of goods and services produced within the United States. It is the standard measure of the size of the economy.
Mandatory Spending.—Mandatory spending is provided by permanent law rather than annual appropriations. Examples are Social Security and the Student Loan Program. The President and the Congress can change the law with respect to the eligibility criteria or the payment formula, and thus change the level of spending on mandatory programs, but they don’t have to take annual action to ensure the continuation of spending. (See Discretionary Spending.)
Obligations.—Obligations are binding agreements that result in outlays, immediately or in the future.
Outlays.—Outlays are the amount of money the Government spends, minus business-like collections, in a given fiscal year.
Receipts.—Governmental receipts (often simply ‘‘receipts’’) are the collections of money that primarily result from taxes and similar Government powers to compel payment. Examples of governmental receipts include income taxes, payroll taxes, excise taxes, and customs duties. They do not include offsetting receipts or collections from the Federal Government’s business-like activities, such as the entrance fees at national parks, or collections by one Government account from another.
Surplus.—A surplus is the amount by which receipts exceed outlays in a fiscal year.
47