Embed Size (px)
Citation preview
Building Urban LOD for Solving Illegally ParkedBicycles in Tokyo
Shusaku Egami1, Takahiro Kawamura1,2, and Akihiko Ohsuga1
1 Graduate School of Informatics and Engineering,The University of Electro-Communications, Tokyo, Japan
[email protected] Japan Science and Technology Agency
Abstract. The illegal parking of bicycles is an urban problem in Tokyoand other urban areas. The purpose of this study was to sustainablybuild Linked Open Data (LOD) for the illegally parked bicycles and tosupport the problem solving by raising social awareness, in cooperationwith the Bureau of General Affairs of Tokyo. We first extracted infor-mation on the problem factors and designed LOD schema for illegallyparked bicycles. Then we collected pieces of data from Social Network-ing Service (SNS) and websites of municipalities to build the illegallyparked bicycle LOD (IPBLOD) with more than 200,000 triples. We thenestimated the missing data in the LOD based on the causal relationsfrom the problem factors. As a result, the number of illegally parkedbicycles can be inferred with 70.9% accuracy. Finally, we published thecomplemented LOD and a Web application to visualize the distributionof illegally parked bicycles in the city. We hope this raises social attentionon this issue.
Keywords: Linked Open Data, Urban Problem, Illegally Parked Bicy-cles
1 Introduction
An increased awareness of health problems [1] and energy conservation [2] led to a2.6-fold increase in bicycle ownership in Japan from 1970 to 2013. Consequently,illegally parked bicycles around railway stations have become an urban problemin Tokyo and other urban areas. In addition to the insufficient availability ofbicycle parking spaces, inadequate public knowledge on bicycle parking laws hascontributed to this urban problem. Illegally parked bicycles obstruct vehicles,cause road accidents, encourage theft, and disfigure streets.
In order to address this problem, we believe it would be useful to publishthe distribution of illegally parked bicycles as Linked Open Data (LOD). Forexample, it would serve to visualize illegally parked bicycles, suggest locationsfor optimal bicycle parking spaces, and assist with the removal of illegally parked
2 Shusaku Egami, Takahiro Kawamura, and Akihiko Ohsuga
bicycles. However, Open Data sets available for illegally parked bicycles arecurrently distorted, and it is difficult for services to utilize the data. In addition,other data concerning issues such as bicycle parking spaces and governmentstatistics, have been published in a variety of formats. Hence, unification of thedata formats and definition of schema for data storage are important issues thatneed to be addressed. Bischof et al. [3] proposed a method for integrating OpenCity Data as Linked Data and proposed methods for the complementation ofmissing values. The study improved the utilization of unreusable Open Data.However, more spatio-temporal data and factor data are necessary to developservices for combating illegally parked bicycles.
In this study, we first extracted domain requirements of illegally parked bi-cycles from articles on the Web and design LOD schema. Next, we collecteddata about illegally parked bicycles from Twitter and the data describing fac-tors that affect the number of illegally parked bicycles. In order to reuse thesedata sets, which have different formats, we unify the data formats based on de-signed schema and publish the data on the Web as LOD. Moreover, we estimatethe missing data (the number of illegally parked bicycles) based on the causalrelations from the factors. Our predictions take into consideration factors suchas time, weather, nearby bicycle parking information, and nearby points of in-terest (POIs). However, since there are cases that lack these factor values, themissing factor values are also complemented by searching similar observationdata. We thus use Bayesian networks to estimate the number of illegally parkedbicycles for data sets after complementation of the factors. These results are alsoincorporated to build LOD with a specified property. In addition, we develop aservice that visualizes the illegally parked bicycles using the constructed LOD.This visualization service raises the awareness of the issue in local residentsand prompts users to provide more information about illegally parked bicycles.Therefore, our contributions are as follows.
1. Proposal of a methodology for designing LOD schema for an urban problem
2. Collection of data from SNS and municipalities of Tokyo and other urbanareas, and the building of illegally parked bicycle LOD (IPBLOD)
3. Development and evaluation of an approach for complementing the missingfactor values and estimating the missing values
4. Development and publishing of a Web application for visualizing illegallyparked bicycles in Tokyo and other urban areas
The remainder of this paper is organized as follows. In Section 2, relatedworks of data collection and urban LOD are described. In Section 3, the method-ology for designing the LOD schema and IPBLOD are presented. In Section 4,two approaches that complement the missing factors, and estimate the illegallyparked bicycles using Bayesian networks, are described. Also, we evaluate ourresults and our findings. In Section 5, visualization of the IPBLOD is described.Finally, Section 6 concludes this paper with future works.
Building Urban LOD for Solving Illegally Parked Bicycles in Tokyo 3
2 Related Work
In most cases, LOD sets have been built based on existing databases. How-ever, there is little LOD available so far that describes urban problems. Thus,methods for collecting new data to build urban LOD are required. Data collec-tion methods for building Open Data include crowdsourcing and gamification.A number of projects have employed these techniques. OpenStreetMap [4] is aproject that creates an open map using crowdsourced data. Anyone can edit themap, and the data are published as Open Data. Similarly, FixMyStreet [5] isa platform for reporting regional problems such as road conditions and illegaldumping. Crowdsourcing to collect information in FixMyStreet has meant thatregional problems are able to be solved more quickly than ever before. Zook etal. [6] reported a case, where crowdsourcing was used to link published satelliteimages with OpenStreetMap after the Haitian earthquake. A map of the reliefefforts was created, and the data were published as Open Data. Celino et al. [8]proposed an approach for editing and adding Linked Data using a game witha purpose (GWAP) [7] and human computation. However, since the data con-cerning illegally parked bicycles are time-series data, it is difficult to collect datausing these approaches. Therefore, new techniques are required. We propose amethod to build urban LOD while complementing the missing data.
Also, there have been studies about building Linked Data for cities. Lopezet al. [9] proposed a platform that publishes sensor data as Linked Data. Theplatform collects streamed data from sensor and publishes Resource DescriptionFramework (RDF) in real time using IBM InfoSphere Stream and C-SPARQL[10]. The system is used in Dublinked23, which is a data portal of Dublin, Ireland,that publishes information of bus routes, delays, and congestion updated every20 seconds. However, since embedding sensors is costly, this approach is notsuitable for our study.
Furthermore, Bischof et al. [3] proposed a method for the collection, com-plementation, and republishing of data as Linked Data, as with our study. Thismethod collects data from DBpedia [13], Urban Audit4, United Nations Statis-tics Division (UNSD)5, and U.S. Census6 and then utilizes the similarity amongsuch large Open Data sets on the Web. However, we could not find the corre-sponding data sets and thus could not apply the same approach to our study.
3 Building LOD
In this study, we propose a method for sustainably building urban LOD andapplying them to Tokyo and other urban areas. Managing urban problem datajoining multiple tables in (distributed) RDBs is troublesome from the aspect ofdata interoperability and maintenance, since the urban problem is closely related
3 http://www.dublinked.ie/4 http://ec.europa.eu/eurostat/web/cities5 http://unstats.un.org/unsd/default.htm6 http://www.census.gov/
4 Shusaku Egami, Takahiro Kawamura, and Akihiko Ohsuga
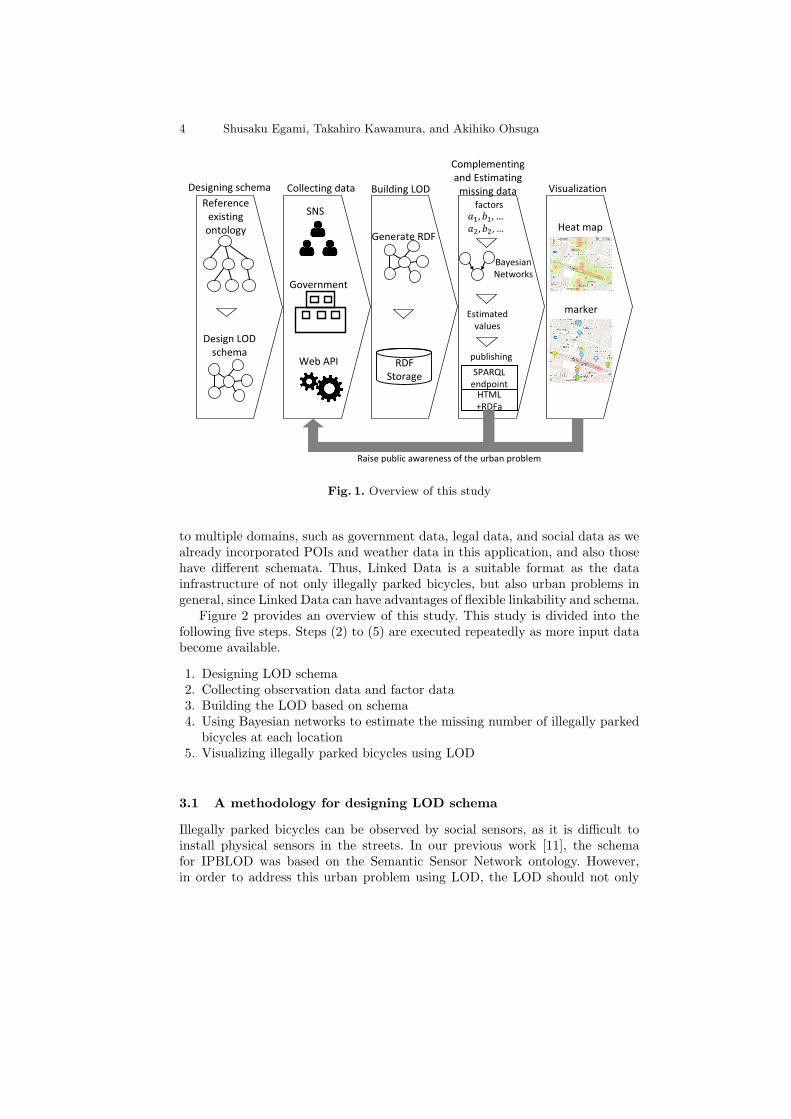
Fig. 1. Overview of this study
to multiple domains, such as government data, legal data, and social data as wealready incorporated POIs and weather data in this application, and also thosehave different schemata. Thus, Linked Data is a suitable format as the datainfrastructure of not only illegally parked bicycles, but also urban problems ingeneral, since Linked Data can have advantages of flexible linkability and schema.
Figure 2 provides an overview of this study. This study is divided into thefollowing five steps. Steps (2) to (5) are executed repeatedly as more input databecome available.
1. Designing LOD schema2. Collecting observation data and factor data3. Building the LOD based on schema4. Using Bayesian networks to estimate the missing number of illegally parked
bicycles at each location5. Visualizing illegally parked bicycles using LOD
3.1 A methodology for designing LOD schema
Illegally parked bicycles can be observed by social sensors, as it is difficult toinstall physical sensors in the streets. In our previous work [11], the schemafor IPBLOD was based on the Semantic Sensor Network ontology. However,in order to address this urban problem using LOD, the LOD should not only
Building Urban LOD for Solving Illegally Parked Bicycles in Tokyo 5
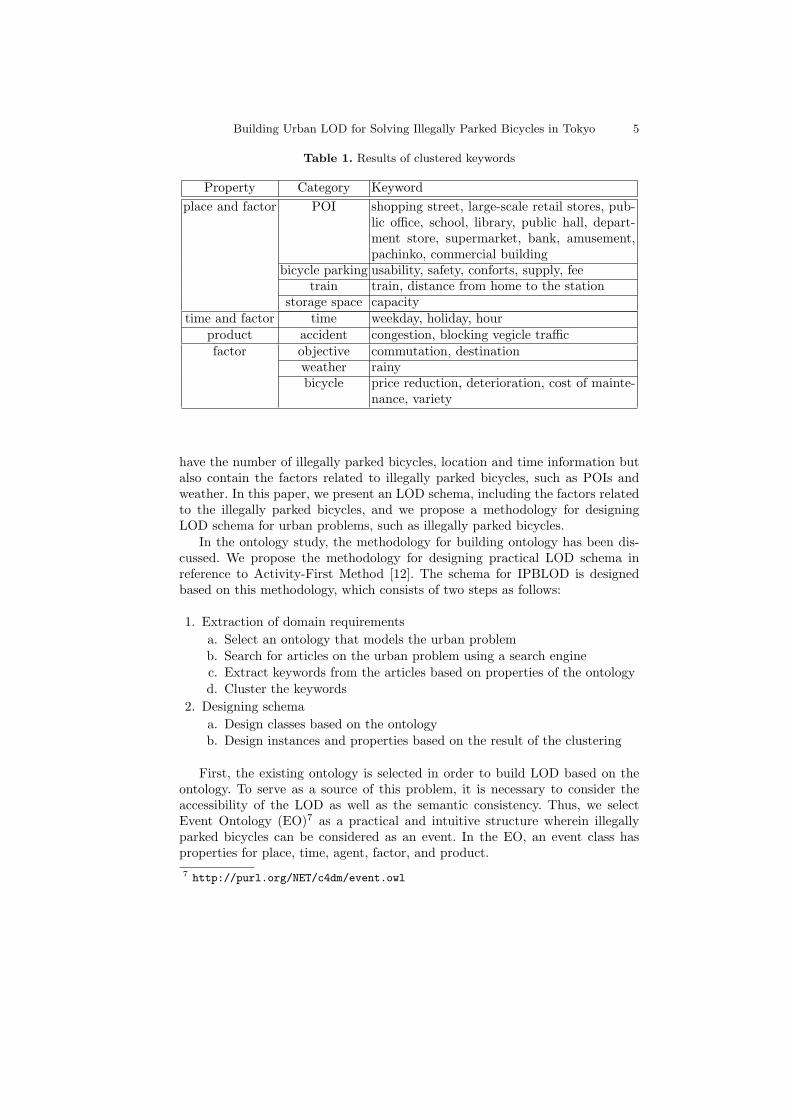
Table 1. Results of clustered keywords
Property Category Keyword
place and factor POI shopping street, large-scale retail stores, pub-lic office, school, library, public hall, depart-ment store, supermarket, bank, amusement,pachinko, commercial building
bicycle parking usability, safety, conforts, supply, feetrain train, distance from home to the station
storage space capacitytime and factor time weekday, holiday, hour
product accident congestion, blocking vegicle trafficfactor objective commutation, destination
weather rainybicycle price reduction, deterioration, cost of mainte-
nance, variety
have the number of illegally parked bicycles, location and time information butalso contain the factors related to illegally parked bicycles, such as POIs andweather. In this paper, we present an LOD schema, including the factors relatedto the illegally parked bicycles, and we propose a methodology for designingLOD schema for urban problems, such as illegally parked bicycles.
In the ontology study, the methodology for building ontology has been dis-cussed. We propose the methodology for designing practical LOD schema inreference to Activity-First Method [12]. The schema for IPBLOD is designedbased on this methodology, which consists of two steps as follows:
1. Extraction of domain requirements
a. Select an ontology that models the urban problemb. Search for articles on the urban problem using a search enginec. Extract keywords from the articles based on properties of the ontologyd. Cluster the keywords
2. Designing schema
a. Design classes based on the ontologyb. Design instances and properties based on the result of the clustering
First, the existing ontology is selected in order to build LOD based on theontology. To serve as a source of this problem, it is necessary to consider theaccessibility of the LOD as well as the semantic consistency. Thus, we selectEvent Ontology (EO)7 as a practical and intuitive structure wherein illegallyparked bicycles can be considered as an event. In the EO, an event class hasproperties for place, time, agent, factor, and product.
7 http://purl.org/NET/c4dm/event.owl
6 Shusaku Egami, Takahiro Kawamura, and Akihiko Ohsuga
Next we search for articles on illegally parked bicycles using Google. Then weinvestigate the top 10 articles and their references and then manually extract thekeywords based on the properties of the existing ontology. Specifically, keywordsare extracted from sentences that describe the place, time, agent, factor, andproduct. Even if keywords that are not defined in the ontology appear to beimportant in the article, the keywords are also extracted.
The extracted keywords are clustered manually as in Table 1. Then the classesare designed based on the EO. The expression of Description Logic (DL) is asfollows:
IllegallyParkedBicycles ⊑ Event
IllegallyParkedBicycles ⊑ ∃place.SpatialThingIllegallyParkedBicycles ⊑ ∃time.TemporalEntity
IllegallyParkedBicycles ⊑ ∃weather.WeatherState
IllegallyParkedBicycles ⊑ ∃factor.ThingIllegallyParkedBicycles ⊑ ∃agent.Agent
IllegallyParkedBicycles ⊑ ∃product.ThingIllegallyParkedBicycles ⊑ ∃value.Integer
The IllegallyParkedBicycles class refers to a set of illegally parked bicycles, andit is a subclass of the Event class. IllegallyParkedBicycles contains the place,time, weather, agent, factor, product, and number of illegally parked bicycles.Weather and the number of illegally parked bicycles are not defined in the EO,but since these are considered to be important in the domain of illegally parkedbicycles, we add them to the LOD schema.
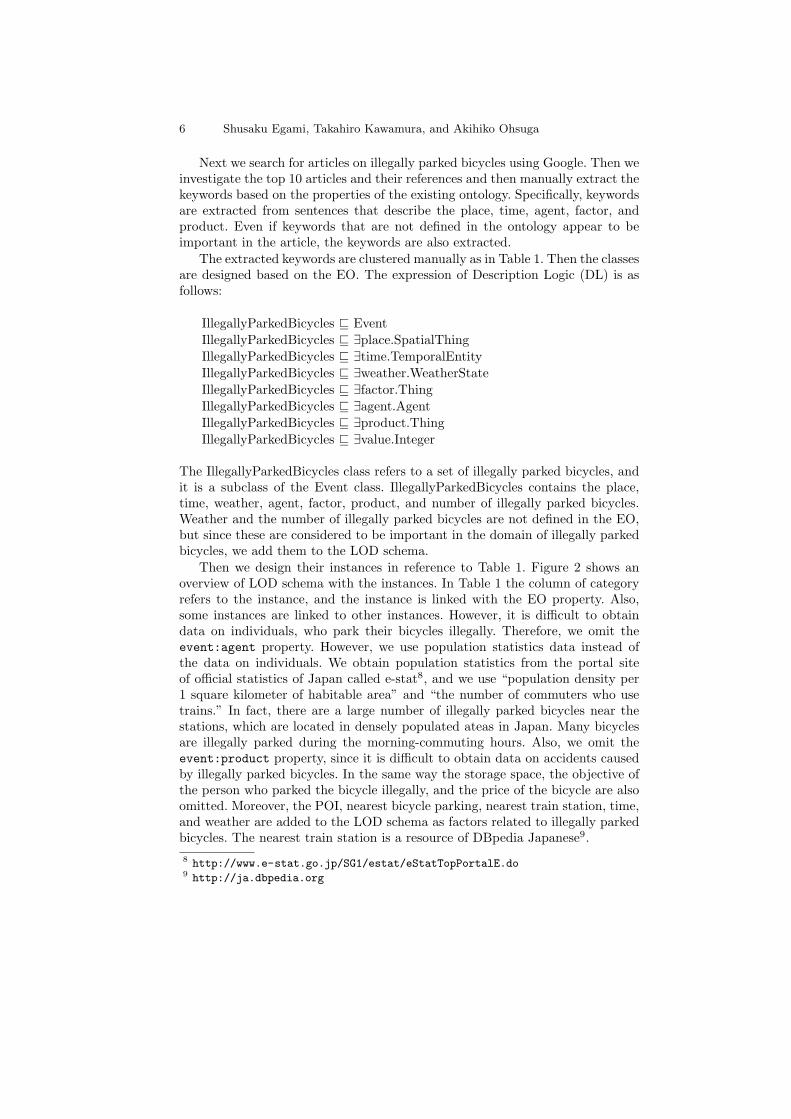
Then we design their instances in reference to Table 1. Figure 2 shows anoverview of LOD schema with the instances. In Table 1 the column of categoryrefers to the instance, and the instance is linked with the EO property. Also,some instances are linked to other instances. However, it is difficult to obtaindata on individuals, who park their bicycles illegally. Therefore, we omit theevent:agent property. However, we use population statistics data instead ofthe data on individuals. We obtain population statistics from the portal siteof official statistics of Japan called e-stat8, and we use “population density per1 square kilometer of habitable area” and “the number of commuters who usetrains.” In fact, there are a large number of illegally parked bicycles near thestations, which are located in densely populated ateas in Japan. Many bicyclesare illegally parked during the morning-commuting hours. Also, we omit theevent:product property, since it is difficult to obtain data on accidents causedby illegally parked bicycles. In the same way the storage space, the objective ofthe person who parked the bicycle illegally, and the price of the bicycle are alsoomitted. Moreover, the POI, nearest bicycle parking, nearest train station, time,and weather are added to the LOD schema as factors related to illegally parkedbicycles. The nearest train station is a resource of DBpedia Japanese9.
8 http://www.e-stat.go.jp/SG1/estat/eStatTopPortalE.do9 http://ja.dbpedia.org
Building Urban LOD for Solving Illegally Parked Bicycles in Tokyo 7
Fig. 2. LOD schema containing instances
3.2 Collection of observation data
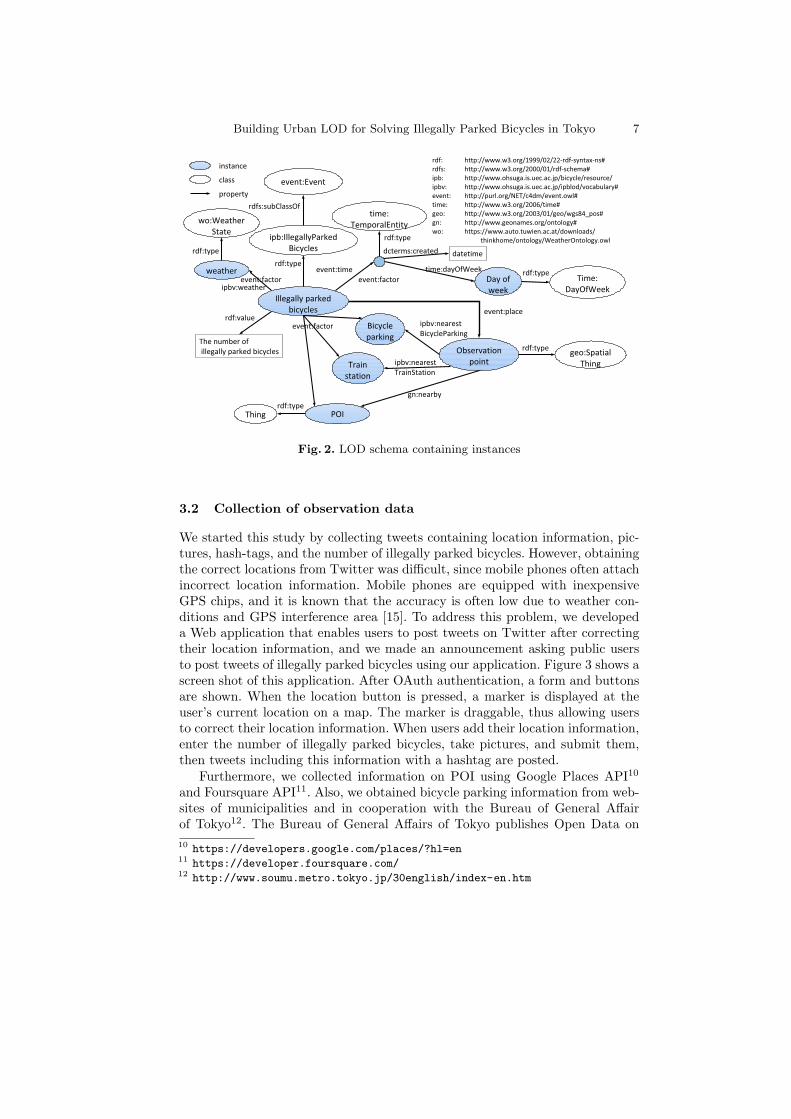
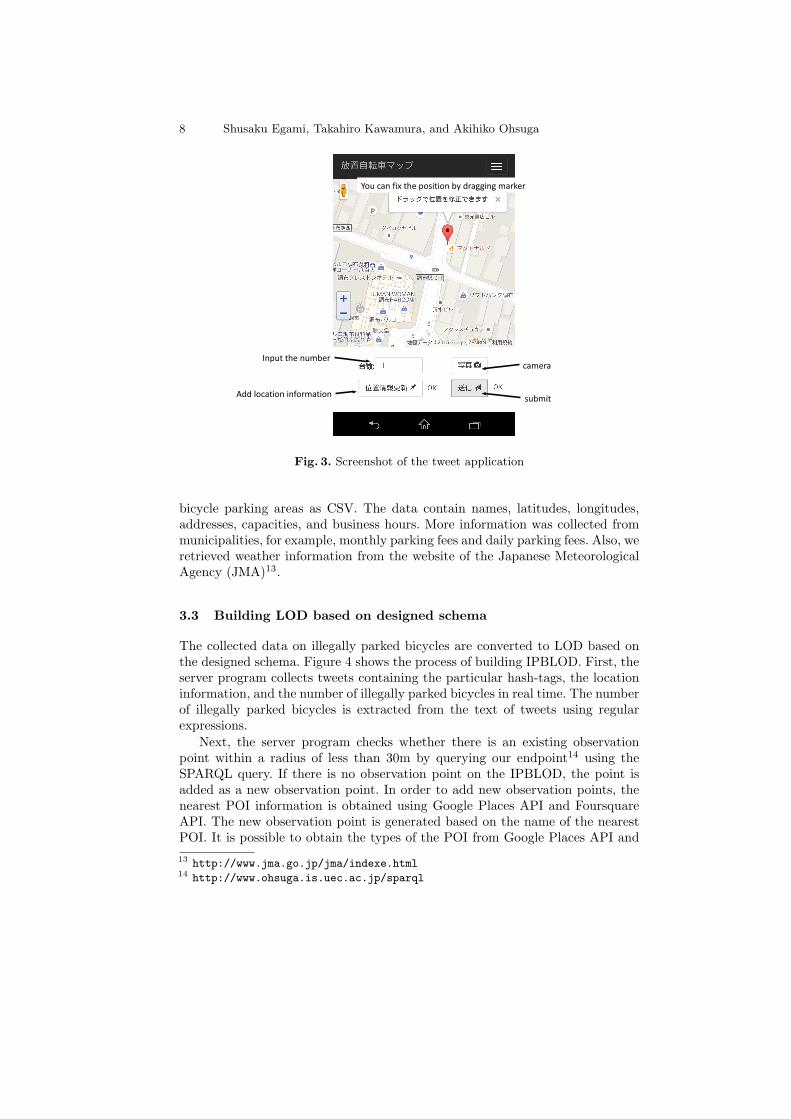
We started this study by collecting tweets containing location information, pic-tures, hash-tags, and the number of illegally parked bicycles. However, obtainingthe correct locations from Twitter was difficult, since mobile phones often attachincorrect location information. Mobile phones are equipped with inexpensiveGPS chips, and it is known that the accuracy is often low due to weather con-ditions and GPS interference area [15]. To address this problem, we developeda Web application that enables users to post tweets on Twitter after correctingtheir location information, and we made an announcement asking public usersto post tweets of illegally parked bicycles using our application. Figure 3 shows ascreen shot of this application. After OAuth authentication, a form and buttonsare shown. When the location button is pressed, a marker is displayed at theuser’s current location on a map. The marker is draggable, thus allowing usersto correct their location information. When users add their location information,enter the number of illegally parked bicycles, take pictures, and submit them,then tweets including this information with a hashtag are posted.
Furthermore, we collected information on POI using Google Places API10
and Foursquare API11. Also, we obtained bicycle parking information from web-sites of municipalities and in cooperation with the Bureau of General Affairof Tokyo12. The Bureau of General Affairs of Tokyo publishes Open Data on
10 https://developers.google.com/places/?hl=en11 https://developer.foursquare.com/12 http://www.soumu.metro.tokyo.jp/30english/index-en.htm
8 Shusaku Egami, Takahiro Kawamura, and Akihiko Ohsuga
Fig. 3. Screenshot of the tweet application
bicycle parking areas as CSV. The data contain names, latitudes, longitudes,addresses, capacities, and business hours. More information was collected frommunicipalities, for example, monthly parking fees and daily parking fees. Also, weretrieved weather information from the website of the Japanese MeteorologicalAgency (JMA)13.
3.3 Building LOD based on designed schema
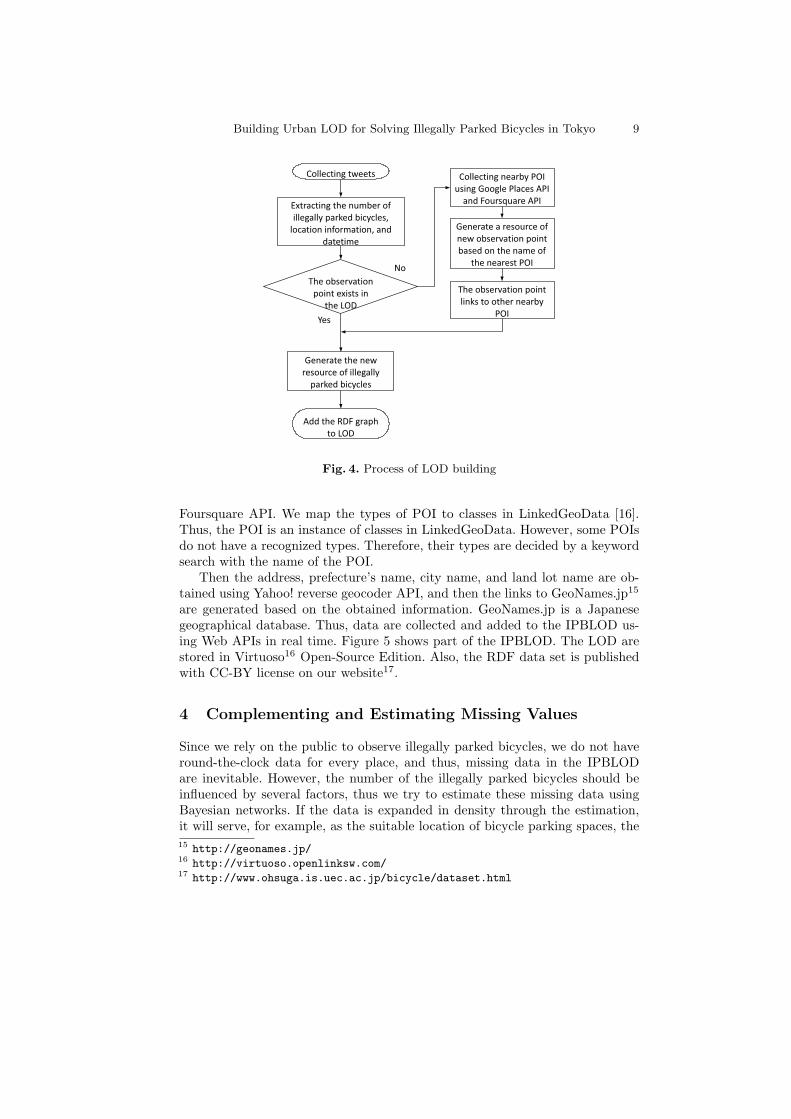
The collected data on illegally parked bicycles are converted to LOD based onthe designed schema. Figure 4 shows the process of building IPBLOD. First, theserver program collects tweets containing the particular hash-tags, the locationinformation, and the number of illegally parked bicycles in real time. The numberof illegally parked bicycles is extracted from the text of tweets using regularexpressions.
Next, the server program checks whether there is an existing observationpoint within a radius of less than 30m by querying our endpoint14 using theSPARQL query. If there is no observation point on the IPBLOD, the point isadded as a new observation point. In order to add new observation points, thenearest POI information is obtained using Google Places API and FoursquareAPI. The new observation point is generated based on the name of the nearestPOI. It is possible to obtain the types of the POI from Google Places API and
13 http://www.jma.go.jp/jma/indexe.html14 http://www.ohsuga.is.uec.ac.jp/sparql
Building Urban LOD for Solving Illegally Parked Bicycles in Tokyo 9
Fig. 4. Process of LOD building
Foursquare API. We map the types of POI to classes in LinkedGeoData [16].Thus, the POI is an instance of classes in LinkedGeoData. However, some POIsdo not have a recognized types. Therefore, their types are decided by a keywordsearch with the name of the POI.
Then the address, prefecture’s name, city name, and land lot name are ob-tained using Yahoo! reverse geocoder API, and then the links to GeoNames.jp15
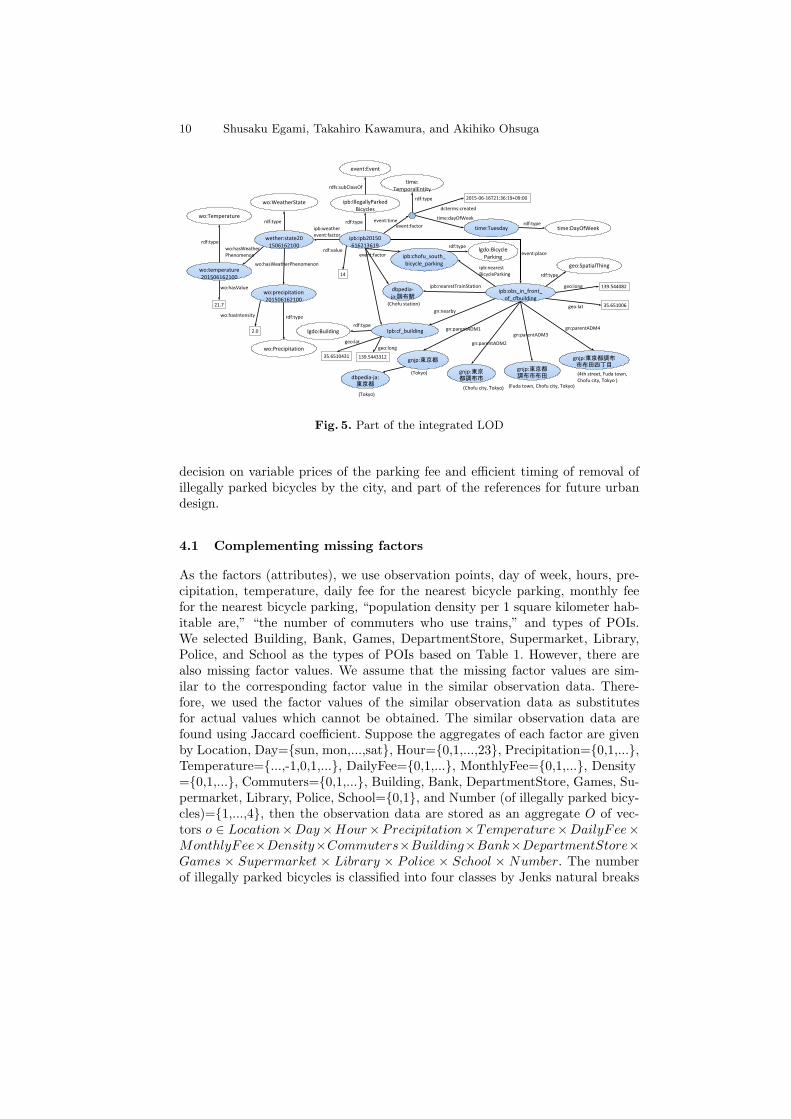
are generated based on the obtained information. GeoNames.jp is a Japanesegeographical database. Thus, data are collected and added to the IPBLOD us-ing Web APIs in real time. Figure 5 shows part of the IPBLOD. The LOD arestored in Virtuoso16 Open-Source Edition. Also, the RDF data set is publishedwith CC-BY license on our website17.
4 Complementing and Estimating Missing Values
Since we rely on the public to observe illegally parked bicycles, we do not haveround-the-clock data for every place, and thus, missing data in the IPBLODare inevitable. However, the number of the illegally parked bicycles should beinfluenced by several factors, thus we try to estimate these missing data usingBayesian networks. If the data is expanded in density through the estimation,it will serve, for example, as the suitable location of bicycle parking spaces, the
15 http://geonames.jp/16 http://virtuoso.openlinksw.com/17 http://www.ohsuga.is.uec.ac.jp/bicycle/dataset.html
10 Shusaku Egami, Takahiro Kawamura, and Akihiko Ohsuga
Fig. 5. Part of the integrated LOD
decision on variable prices of the parking fee and efficient timing of removal ofillegally parked bicycles by the city, and part of the references for future urbandesign.
4.1 Complementing missing factors
As the factors (attributes), we use observation points, day of week, hours, pre-cipitation, temperature, daily fee for the nearest bicycle parking, monthly feefor the nearest bicycle parking, “population density per 1 square kilometer hab-itable are,” “the number of commuters who use trains,” and types of POIs.We selected Building, Bank, Games, DepartmentStore, Supermarket, Library,Police, and School as the types of POIs based on Table 1. However, there arealso missing factor values. We assume that the missing factor values are sim-ilar to the corresponding factor value in the similar observation data. There-fore, we used the factor values of the similar observation data as substitutesfor actual values which cannot be obtained. The similar observation data arefound using Jaccard coefficient. Suppose the aggregates of each factor are givenby Location, Day={sun, mon,...,sat}, Hour={0,1,...,23}, Precipitation={0,1,...},Temperature={...,-1,0,1,...}, DailyFee={0,1,...}, MonthlyFee={0,1,...}, Density={0,1,...}, Commuters={0,1,...}, Building, Bank, DepartmentStore, Games, Su-permarket, Library, Police, School={0,1}, and Number (of illegally parked bicy-cles)={1,...,4}, then the observation data are stored as an aggregate O of vec-tors o ∈ Location×Day×Hour×Precipitation×Temperature×DailyFee×MonthlyFee×Density×Commuters×Building×Bank×DepartmentStore×Games × Supermarket × Library × Police × School × Number. The numberof illegally parked bicycles is classified into four classes by Jenks natural breaks
Building Urban LOD for Solving Illegally Parked Bicycles in Tokyo 11
[14], which are often used in Geographic Information Systems (GISs). The rangeis 0 to 6, 7 to 17, 18 to 35, and 36 to 100. Therefore, the similarity of observationdata o1 and o2 is sim(o1, o2) = |o1 ∩ o2|/|o1 ∪ o2|.
4.2 Estimating the number of illegally parked bicycles usingBayesian network
We then estimate the number of illegally parked bicycles, at observation points,where the number data are missing. The input dataset is the dataset comple-mented using the method described in Section 4.1. We use the Bayesian networktool Weka18 to estimate the unknown numbers of illegally parked bicycles. Thereare 897 observation data. The input data is a set O that consists of vectors witheight elements at first. We used HillClimber as a search algorithm, and also usedMarkov blanket classifier. The maximum number of parent nodes was two. As aresult of 10-fold cross validation, we got 65.2% accuracy.
To raise the accuracy, we focused on types of POIs. We did not restrict thetypes of POIs when building the IPBLOD, but we restricted types to the POIscontained in Table 1 when estimating the number of illegally parked bicyclesusing Bayesian networks. However, other POIs could become factors relatedto illegally parked bicycles. Hence, we first used all POI types as factors, andthe number of POI types became 68. However, the accuracy became relativelylow due to too many factors. Thus, we used super classes in LinkedGeoDataontology for clustering those types. Since we mapped the POI types to classesof LinkedGeoData, it was possible to obtain their super classes by querying theLinkedGeoData. As the result, the number of POI types became 46, as follows.
Pharmacy , Park , Reta i l , Restaurant , Po l i ce , Univers i ty ,FastFood , BusStation , Gym, Parking , Church , F l o r i s t , Cafe ,Supermarket , Hospita l , Nightclub , Sport , Advert i s ing , Casino ,Ha i rdre s s e r , Doctor , Bar , Bakery , Bank , TakeAway , Amenity ,Dentist , EmergencyThing , Hall , O f f i c e , Re s iden t i a l ,PlaceOfWorship , School , CommunityCentre , Bui lding , Spa ,CarRental , VideoRental , Hotel , Cinema , CoffeShop , Construct ion, Lawyer , HighwayThing , Shop , Publ icTransportThing
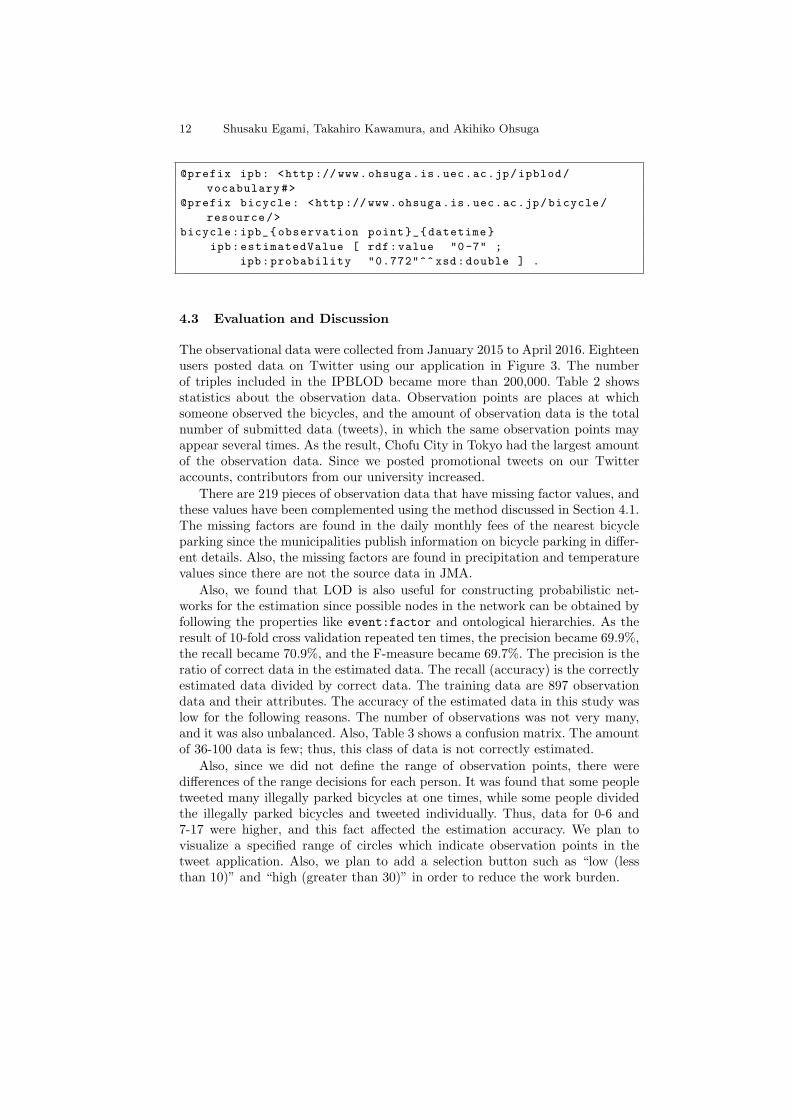
Therefore, an observation datum became a vector o ∈ Location×Day×Hour×Precipitation×Temperature×DailyFee×MonthlyFee×Density×Commuters×Pharmacy× ...×PublicTransportThing×Number, which resulted in 56 pos-sible elements. Finaly, the average estimation accuracy of ten times 10-fold crossvalidation became 70.9%. The maximum number of parent nodes was seven,after random sampling with a 90% rate. We estimated the number of illegallyparked bicycles on unobserved dates using the above parameters. Specifically,we examined the observation data in each observation point from the first ob-servation date to the last observation date. If there are no data at 9 am or 9 pm,we estimated and complemented the number of illegally parked bicycles. Then,we added the estimated number and its probability to IPBLOD as follows.18 http://www.cs.waikato.ac.nz/ml/weka/
12 Shusaku Egami, Takahiro Kawamura, and Akihiko Ohsuga
@prefix ipb: <http ://www.ohsuga.is.uec.ac.jp/ipblod/
vocabulary#>
@prefix bicycle: <http ://www.ohsuga.is.uec.ac.jp/bicycle/
resource/>
bicycle:ipb_{observation point}_{datetime}
ipb:estimatedValue [ rdf:value "0-7" ;
ipb:probability "0.772"^^ xsd:double ] .
4.3 Evaluation and Discussion
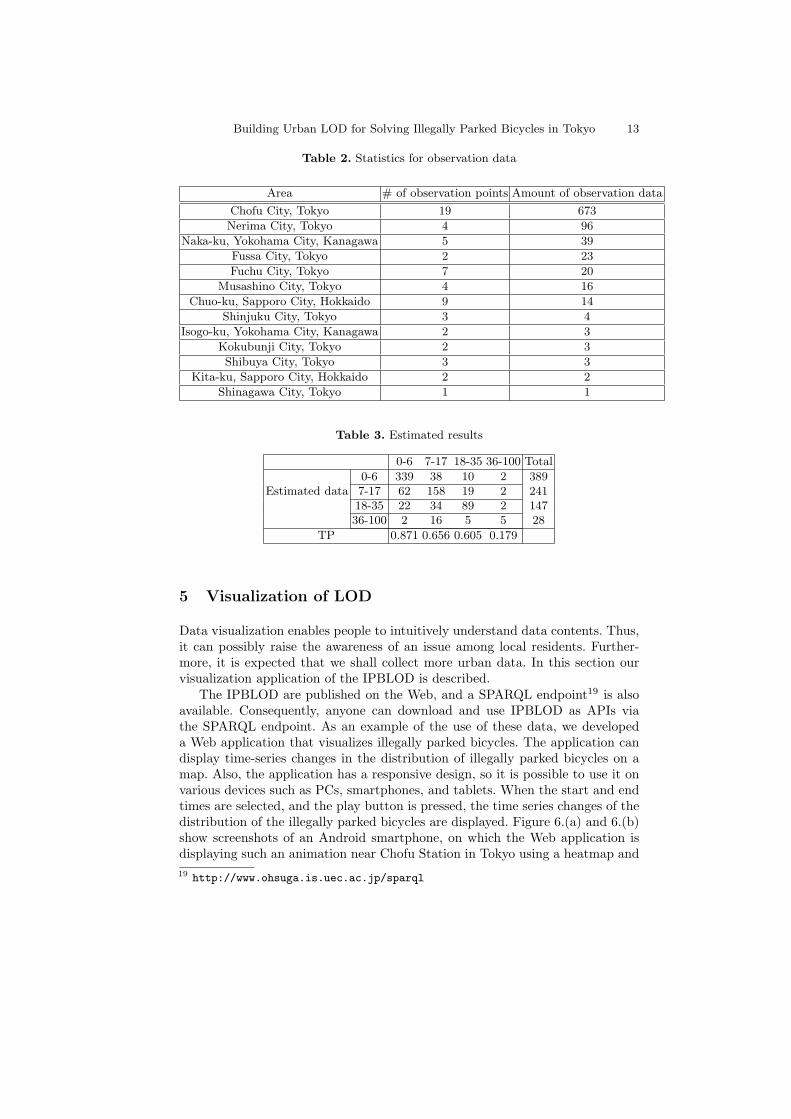
The observational data were collected from January 2015 to April 2016. Eighteenusers posted data on Twitter using our application in Figure 3. The numberof triples included in the IPBLOD became more than 200,000. Table 2 showsstatistics about the observation data. Observation points are places at whichsomeone observed the bicycles, and the amount of observation data is the totalnumber of submitted data (tweets), in which the same observation points mayappear several times. As the result, Chofu City in Tokyo had the largest amountof the observation data. Since we posted promotional tweets on our Twitteraccounts, contributors from our university increased.
There are 219 pieces of observation data that have missing factor values, andthese values have been complemented using the method discussed in Section 4.1.The missing factors are found in the daily monthly fees of the nearest bicycleparking since the municipalities publish information on bicycle parking in differ-ent details. Also, the missing factors are found in precipitation and temperaturevalues since there are not the source data in JMA.
Also, we found that LOD is also useful for constructing probabilistic net-works for the estimation since possible nodes in the network can be obtained byfollowing the properties like event:factor and ontological hierarchies. As theresult of 10-fold cross validation repeated ten times, the precision became 69.9%,the recall became 70.9%, and the F-measure became 69.7%. The precision is theratio of correct data in the estimated data. The recall (accuracy) is the correctlyestimated data divided by correct data. The training data are 897 observationdata and their attributes. The accuracy of the estimated data in this study waslow for the following reasons. The number of observations was not very many,and it was also unbalanced. Also, Table 3 shows a confusion matrix. The amountof 36-100 data is few; thus, this class of data is not correctly estimated.
Also, since we did not define the range of observation points, there weredifferences of the range decisions for each person. It was found that some peopletweeted many illegally parked bicycles at one times, while some people dividedthe illegally parked bicycles and tweeted individually. Thus, data for 0-6 and7-17 were higher, and this fact affected the estimation accuracy. We plan tovisualize a specified range of circles which indicate observation points in thetweet application. Also, we plan to add a selection button such as “low (lessthan 10)” and “high (greater than 30)” in order to reduce the work burden.
Building Urban LOD for Solving Illegally Parked Bicycles in Tokyo 13
Table 2. Statistics for observation data
Area # of observation points Amount of observation data
Chofu City, Tokyo 19 673
Nerima City, Tokyo 4 96
Naka-ku, Yokohama City, Kanagawa 5 39
Fussa City, Tokyo 2 23
Fuchu City, Tokyo 7 20
Musashino City, Tokyo 4 16
Chuo-ku, Sapporo City, Hokkaido 9 14
Shinjuku City, Tokyo 3 4
Isogo-ku, Yokohama City, Kanagawa 2 3
Kokubunji City, Tokyo 2 3
Shibuya City, Tokyo 3 3
Kita-ku, Sapporo City, Hokkaido 2 2
Shinagawa City, Tokyo 1 1
Table 3. Estimated results
0-6 7-17 18-35 36-100 Total
0-6 339 38 10 2 389Estimated data 7-17 62 158 19 2 241
18-35 22 34 89 2 14736-100 2 16 5 5 28
TP 0.871 0.656 0.605 0.179
5 Visualization of LOD
Data visualization enables people to intuitively understand data contents. Thus,it can possibly raise the awareness of an issue among local residents. Further-more, it is expected that we shall collect more urban data. In this section ourvisualization application of the IPBLOD is described.
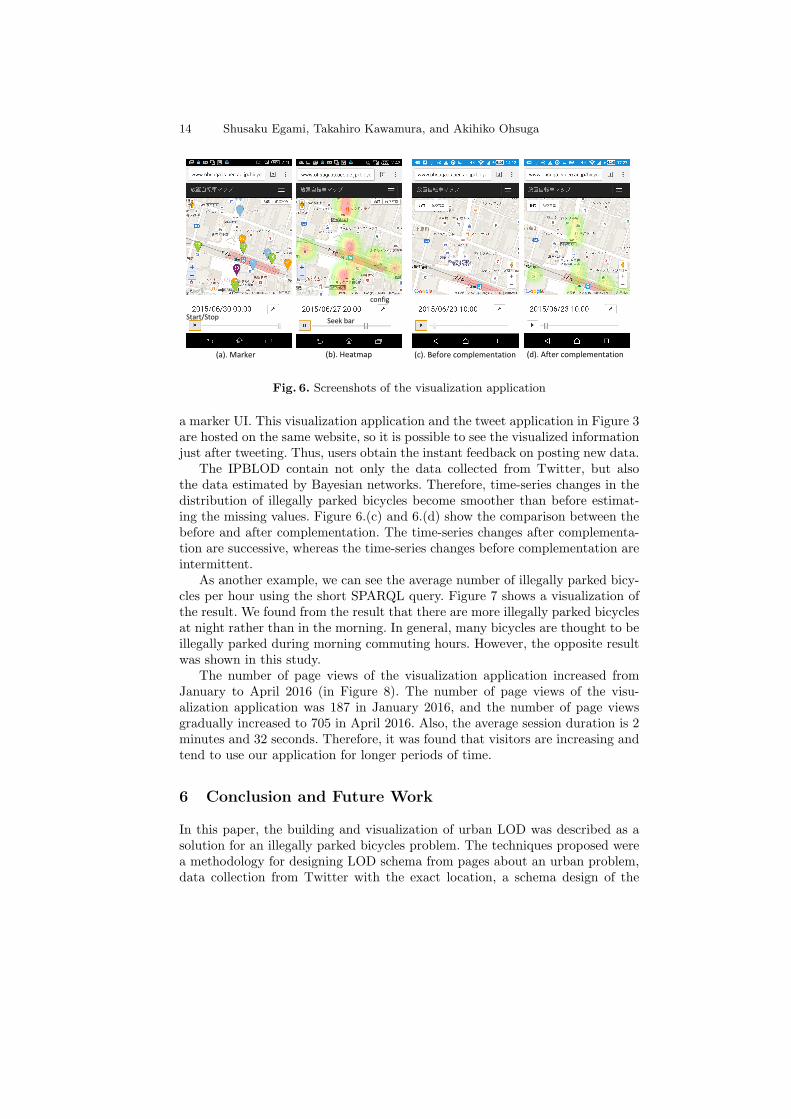
The IPBLOD are published on the Web, and a SPARQL endpoint19 is alsoavailable. Consequently, anyone can download and use IPBLOD as APIs viathe SPARQL endpoint. As an example of the use of these data, we developeda Web application that visualizes illegally parked bicycles. The application candisplay time-series changes in the distribution of illegally parked bicycles on amap. Also, the application has a responsive design, so it is possible to use it onvarious devices such as PCs, smartphones, and tablets. When the start and endtimes are selected, and the play button is pressed, the time series changes of thedistribution of the illegally parked bicycles are displayed. Figure 6.(a) and 6.(b)show screenshots of an Android smartphone, on which the Web application isdisplaying such an animation near Chofu Station in Tokyo using a heatmap and
19 http://www.ohsuga.is.uec.ac.jp/sparql
14 Shusaku Egami, Takahiro Kawamura, and Akihiko Ohsuga
Fig. 6. Screenshots of the visualization application
a marker UI. This visualization application and the tweet application in Figure 3are hosted on the same website, so it is possible to see the visualized informationjust after tweeting. Thus, users obtain the instant feedback on posting new data.
The IPBLOD contain not only the data collected from Twitter, but alsothe data estimated by Bayesian networks. Therefore, time-series changes in thedistribution of illegally parked bicycles become smoother than before estimat-ing the missing values. Figure 6.(c) and 6.(d) show the comparison between thebefore and after complementation. The time-series changes after complementa-tion are successive, whereas the time-series changes before complementation areintermittent.
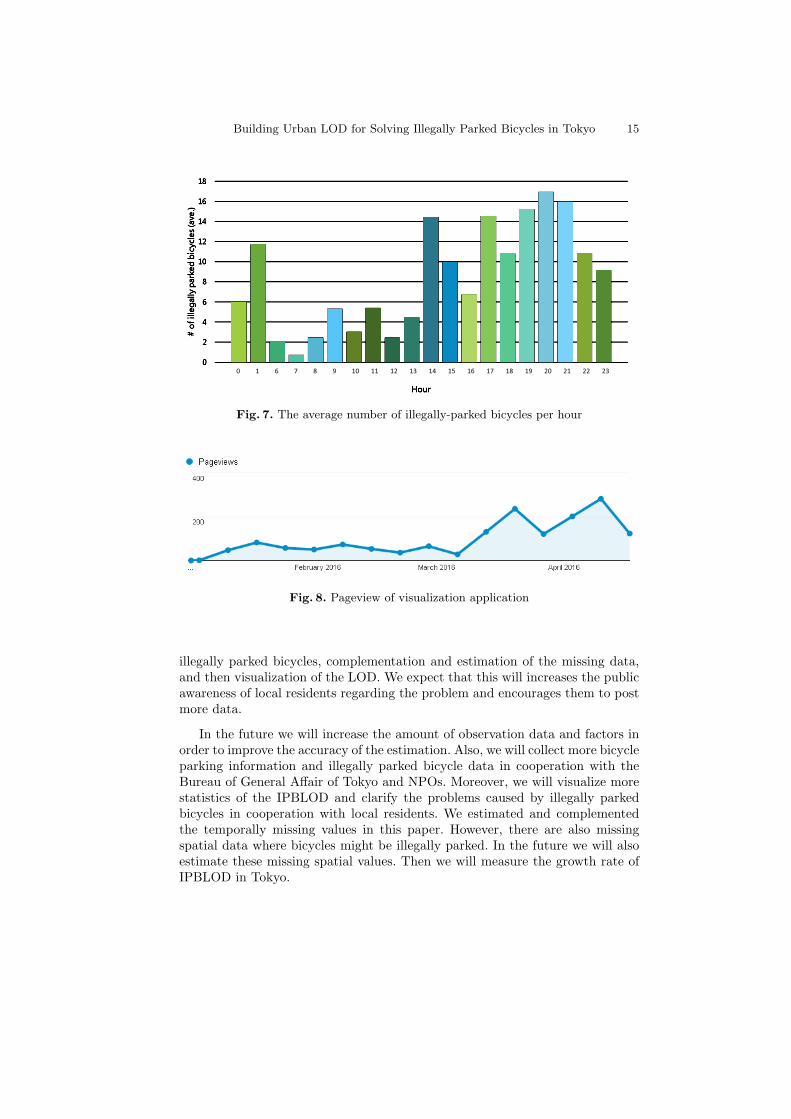
As another example, we can see the average number of illegally parked bicy-cles per hour using the short SPARQL query. Figure 7 shows a visualization ofthe result. We found from the result that there are more illegally parked bicyclesat night rather than in the morning. In general, many bicycles are thought to beillegally parked during morning commuting hours. However, the opposite resultwas shown in this study.
The number of page views of the visualization application increased fromJanuary to April 2016 (in Figure 8). The number of page views of the visu-alization application was 187 in January 2016, and the number of page viewsgradually increased to 705 in April 2016. Also, the average session duration is 2minutes and 32 seconds. Therefore, it was found that visitors are increasing andtend to use our application for longer periods of time.
6 Conclusion and Future Work
In this paper, the building and visualization of urban LOD was described as asolution for an illegally parked bicycles problem. The techniques proposed werea methodology for designing LOD schema from pages about an urban problem,data collection from Twitter with the exact location, a schema design of the
Building Urban LOD for Solving Illegally Parked Bicycles in Tokyo 15
Fig. 7. The average number of illegally-parked bicycles per hour
Fig. 8. Pageview of visualization application
illegally parked bicycles, complementation and estimation of the missing data,and then visualization of the LOD. We expect that this will increases the publicawareness of local residents regarding the problem and encourages them to postmore data.
In the future we will increase the amount of observation data and factors inorder to improve the accuracy of the estimation. Also, we will collect more bicycleparking information and illegally parked bicycle data in cooperation with theBureau of General Affair of Tokyo and NPOs. Moreover, we will visualize morestatistics of the IPBLOD and clarify the problems caused by illegally parkedbicycles in cooperation with local residents. We estimated and complementedthe temporally missing values in this paper. However, there are also missingspatial data where bicycles might be illegally parked. In the future we will alsoestimate these missing spatial values. Then we will measure the growth rate ofIPBLOD in Tokyo.
16 Shusaku Egami, Takahiro Kawamura, and Akihiko Ohsuga
Acknowledgments. This work was supported by JSPS KAKENHI GrantNumbers 16K12411, 16K00419, 16K12533.
References
1. Nishi, N.: The 2nd Health Japan 21: goals and challenges. The Journal of the Fed-eration of American Societies for Experimental Biology, vol.28, no.1, 632.19 (2014)
2. Ministry of Internal Affairs and Communications.: Current bicycle usage andbicycle-related accident. http://www.soumu.go.jp/main_content/000354710.pdf
(accessed: September 10, 2015) (Japanese)3. Bischof, S., Martin, C., Polleres, A., Schneider, P.: Collecting, Integrating, Enriching
and Republishing Open City Data as Linked Data. In: Proc. The 14th InternationalSemantic Web Conference, pp.57-75 (2015)
4. Haklay, M., Weber, P.: Openstreetmap: User-generated street maps. IEEE PervasiveComputing, vol.7, no.4, pp.12-18 (2008)
5. King, S.F., Brown, P.: Fix my street or else: using the internet to voice local publicservice concerns. In: Proc. The 1st international conference on Theory and practiceof electronic governance, pp.72-80 (2007)
6. Zook, M., Graham, M., Shelton, T., BA, Gorman, S.: Volunteered Geographic Infor-mation and Crowdsourcing Disaster Relief: A Case Study of the Haitian Earthquake,World Medical & Health Policy, vol.2, no.2, pp.7-33 (2010)
7. Ahn, L. V.: Games with a purpose. IEEE Computer, vol.39, no.6, pp. 92-94 (2006)8. Celino, I., Cerizza, D., Contessa, S., Corubolo, M., Dell ’Aglio. D., Valle, E. D.,
Fumeo, S., Piccinini, F.: Urbanopoly: Collection and Quality Assesment of Geo-spatial Linked Data via a Human Computation Game. In: Proc. The 10th SemanticWeb Challenge (2012)
9. Lopez, V., Kotoulas, S., Sbodio, M. L., Stephenson, M., Gkoulalas-Divanis, A.,Aonghusa, P. M.: QuerioCity: A Linked Data Platform for Urban Information Man-agement. In: Proc. The 11th International Semantic Web Conference, pp.148-163(2012)
10. Barbieri, D. F., Ceri, S.: C-SPARQL: SPARQL for continuous querying. In: Proc.The 18th International Conference on World Wide Web, pp.1061-1062 (2012)
11. Egami, S., Kawamura, T., Sei, Y., Tahara, Y., Ohsuga, A.: Visualization of OpenUrban Data for Illegally Parked Bicycles. CompleXity: Technology for ComplexUrban Systems in the 49th Hawaii International Conference on System Sciences(2016)
12. Mizoguchi, R., Ikeda, M., Seta, K., Vanwelkenhuysen, J.: Ontology for Modelingthe World from Problem Solving Perspectives. In: Proc. the 1995 International JointConference on AI (IJCAI) Workshop on Basic Ontological Issues in KnowledgeSharing, pp.1-12 (1995)
13. Auer, S., Bizer, C., Kobilarov, G., Lehmann, J., Cyganiak, R., Ives, Z.: DBpedia:A Nucleus for a Web of Open Data. In: Proc. The 6th International Semantic WebConference, 2nd Asian Semantic Web Conference (ISWC 2007 + ASWC 2007),pp.722-735 (2007)
14. Jenks, G. F.: The data model concept in statistical mapping. International year-book of cartography, vol.7, no.1, pp.186-190 (1967)
15. Hwang, S., Yu, D.: GPS Location Improvement of Smartphones Using Built inSensors, International Journal of Smart Home, vol.6, no.3, pp.1-8 (2012)
16. Stadler, C., Lehmann, J., Hoffner, K., Auer, S.: LinkedGeoData: A Core for a Webof SpatialOpen Data. Semantic Web Journal, vol.3, no.4, pp.333-354 (2012)