Embed Size (px)
Citation preview
BULETIN APLINDO N0.41/2014, Mei - Juli 2014
Asosiasi Industri Pengecoran Logam Indonesia
Gedung Manggala Wanabakti Blok IV Lantai 3 Ruang 303A
Jl. Gatot Subroto, Senayan, Jakarta 10270
Telp. 021.573 3832 ; 571 0486; Fax : 021.572 1328
Email : [email protected] Web Site : www.aplindo.web.id
APLINDO
BULETIN - APLINDO No.41/2014
1
DAFTAR ISI
No. Uraian Halaman
1. Pengantar Redaksi 2
2. Kenaikkan Tarif Dasar Listrik Kembali Naik
4
3. Peraturan Menteri Energi dan Sumber Daya Mineral No.9 tahun 2014 Tentang Tarif Tenaga Listrik Yang Disediakan Oleh Perusahaan Perseroan (Persero) PT Perusahaan Listrik Negara
6
4. Roadmap Hilirisasi Minerba 25
5. Reformulasi Roadmap Pengembangan Industri Besi Baja Berbasis Sumber daya Lokal
26
7. Reformulasi Roadmap Pengembangan Industri Aluminium Berbasis Sumber daya Lokal
33
8. Data Kendaraan Bermotor di Indonesia 1. Data kendaraan bermotor roda 4 2. Data kendaraan bermotor roda 2 (sepeda motor)
37 38
9. Informasi Umum dan Pameran 1. Website pemerintah yang dapat diakses 2. Website Asosiasi Industri Pengecoran Logam Indonesia 3. Website Himpunan Ahli Pengecoran Logam Indonesia 4. Pameran dan Seminar
39 39 39 39
BULETIN - APLINDO No.41/2014
2
Pengantar Redaksi
Pada edisi 41/2014 ini, membahas Kenaikan TDL yang terus berlanjut dan telah dikukuhkan
dengan Permen ESDM No.9 tahun 2014 tentang Tarif Tenaga Listrik Yang Disediakan Oleh
Perusahaan Perseroan (Persero) PT Perusahaan Listrik Negara sehingga industri tidak
memiliki kelonggaran waktu untuk mencicilnya walaupun Kenaikan listrik industri dinaikkan
secara bertahap. Dampak kenaikkan ini bagi semua kalangan usaha menyebabkan biaya
produksi industri membengkak dan akan mengganggu cash flow perusahaan yang berujung
pada kenaikan harga barang atau bahkan PHK bagi sebagian karyawan sebagai konsekuensi
kenaikan ongkos produksi dan tentu akan menimpa kinerja industri, menurunkan daya
saing, disisi lain Indonesia akan menghadapi Masyarakat Ekonomi Asean 2015.
Terkait dengan kebijakan pelarangan ekspor (hilirisasi) atau yang lebih dikenal dengan
peningkatan nilai tambah dan sesuai dengan amanat Inpres no.3 tahun 2013 Tentang
Percepatan Peningkatan Nilai Tambah Mineral Melalui Pengolahan Dan Pemurnian Di
Dalam Negeri, maka Kementerian Perindustrian telah membuat roadmap kebijakan
pengembangan industri berbasis mineral logam dan telah dilakukan sosialisasi pada
tanggal 8 April 2014 dengan memprioritas 4 jenis industri yaitu industri besi baja; industri
aluminium; industri nikel dan industri tembaga. Dalam edisi kini dimuat roadmap
alumunium dan roadmap besi baja.
Selanjutnya kami mengharapkan agar buletin ini menjadi media antar anggota maupun
antar industri pengecoran didalam negeri dan diluar negeri. Harapan kami, seluruh anggota
dapat mengisi buletin ini menjadi kenyataan.
Redaksi buletin APLINDO menghimbau anggota APLINDO berpartisipasi dalam mengisi
tulisan/artikel, data maupun informasi lain yang berhubungan dengan industri pengecoran
logam. Naskah tulisan/artikel dapat dikirim ke sekretariat APLINDO, melalui email ataupun
fax.
Redaksi
BULETIN - APLINDO No.41/2014
3
BULETIN - APLINDO No.41/2014
4
Kenaikkan Tarif Dasar Listrik (TDL)
Kembali Naik
Sebagaimana kita tahu bahwa Pemerintah baru saja melakukan kebijakan menaikan TDL
yang diperkuat dengan Peraturan Menteri Energi dan Sumber Daya Mineral no.9 tahun 2014
tertanggal 1 April 2014 yang menetapkan 2 macam tariff dengan dalih ingin mencabutan
subsidi sehingga ada penghematan sebesar Rp. 5 triliun. Bagi pelanggan industri (I-3)
berdaya pasang diatas 200 KVA khusus untuk perusahaan berstatus terbuka ditetapkan 8,6
persen per dua bulan sekali dan untuk pelanggan industri (I-4) berdaya pasang di atas
30.000 KVA ditetapkan 13,3 persen per dua bulan sekali sebanyak empat kali dalam 2014
yaitu 1 Mei, 1 Juli, 1 September, dan 1 November 2014 dengan total pada 2014, tarif I3 tbk
akan naik 38,9 persen dan I4 naik 64,7 persen. dengan dalih ingin mencabutan subsidi
sehingga ada penghematan sebesar Rp. 5 triliun.
Sekarang Pemerintah melalui Kementerian Energi dan Sumber Daya Mineral (ESDM) dan Dewan
Perwakilan Rakyat (DPR) kembali menaikkan tarif listrik bagi enam golongan pelanggan
rumah tangga dan pelanggan industri I3 non terbuka (tbk) mulai berlaku 1 Juli 2014, dengan
alasan menyama-ratakan antara I3 terbuka dan I3 bukan Terbuka dan aka nada penghematan
anggaran subsidi listrik di Anggaran Pendapatan Belanja Negara (APBN) Perubahan 2014
sebesar Rp 8,51 triliun.
Berikut daftar enam golongan pelanggan yang mengalami kenaikan tarif listrik mulai 1
Juli 2014:
1. Pelanggan industri I3 non terbuka (tbk) dinaikkan secara bertahap 11,57 persen setiap dua
bulan terhitung 1 Juli 2014. Perkiraan penghematan subsidi kenaikan ini sebesar Rp 4,78
triliun.
2. Pelanggan rumah tangga R3 dengan 3.500-5.500 voltampere (VA), naik bertahap 5,7
persen setiap dua bulan mulai 1 Juli 2014. Potensi penghematan subsidi dari kenaikan ini
sebesar Rp 370 miliar.
3. Pelanggan pemerintah (P2) dengan daya di atas 200 kilovoltamper (kVA). Kenaikan
secara bertahap setiap dua bulan sebesar 5,36 persen mulai 1 Juli 2014. Potensi
penghematan subsidi dari kenaikan golongan ini sebesar Rp 100 miliar.
BULETIN - APLINDO No.41/2014
5
4. Pelanggan rumah tangga (R1) dengan daya 2.200 VA yang kenaikan bertahap rata-rata
10,43 persen setiap dua bulan. Kenaikan mulai 1 Juli dengan perkiraan penghematan
sebesar Rp 990 miliar.
5. Pelanggan penerangan jalan umum (P3) dengan kenaikan bertahap sebesar 10,69 persen
setiap dua bulan mulai 1Juli 2014. Potensi penghematan subsidi dari pelanggan ini
sebesar Rp 430 miliar.
6. Pelanggan rumah tangga (R1) dengan daya 1.300 VA yang kenaikan bertahap 11,36
persen setiap dua bulan mulai 1 Juli 2014. Dengan potensi penghematan subsidi dari
pelanggan ini sebesar Rp 1,84 triliun.
Seharusnya Pemerintah lebih memilih kenaikan BBM dengan mengurangi subsidi BBM
dibanding dengan TTL, karena kenaikan BBM lebih efisien dan dampaknya tidak luas.
Kenaikan TTL dapat mempengaruhi perekonomian Indonesia dan membuat menurunnya
penyerapan tenaga kerja karena banyak industri yang mengalami kerugian.
Industri merupakan sektor yang paling penting dalam pertumbuhan ekonomi nasional yang
dapat menciptakan lapangan kerja, menghasilkan produk yang bisa diekspor, dan bayar pajak.
Dengan kenaikan tarif listrik ini, tidak heran jika nantinya banyak industri yang gulung tikar
atau memindahkan pabriknya ke negara lain yang biaya produksinya lebih murah.
Dengan semakin sedikitrnya lapangan kerja yang dapat menyerap tenaga kerja maka daya
beli akan menurun karena tidak ada penghasilan, tentunya akan berpengaruh pada barang
yang diproduksi.
Bagi kalangan industri kenaikkan ini akan menyebabkan naikknya biaya produksi industri
dan akan mengganggu cash flow perusahaan yang berujung pada kenaikan harga barang
atau bahkan PHK bagi sebagian karyawan sebagai konsekuensi kenaikan ongkos produksi,
termasuk konsekwensi di masyarakat yang berpotensi melemahnya daya beli. Dampak
tersebut tentu akan menimpa kinerja industri, melemahkan daya saing, disisi lain Indonesia
akan menghadapi Masyarakat Ekonomi Asean 2015.
---ooo---
BULETIN - APLINDO No.41/2014
6
Reformulasi Roadmap Pengembangan Industri
Nikel Berbasis Sumber daya Lokal
Pada edisi 40/2014 telah dibahas reformulasi pengembangan industri besi baja dan industri
alumunium berbasis sumber daya lokal yang telah dilakukan oleh Kementerian Perindustrian
dalam program hilirisasi industri berbasis migas dan bahan tambang mineral serta
peningkatan daya saing industri berbasis sumber daya mineral (SDM) sebagai amanat dari
Intruksi Presiden Instruksi Presiden Republik Indonesia Nomor 3 Tahun 2013 Tentang
Percepatan Peningkatan Nilai Tambah Mineral Melalui Pengolahan Dan Pemurnian Di Dalam
Negeri.
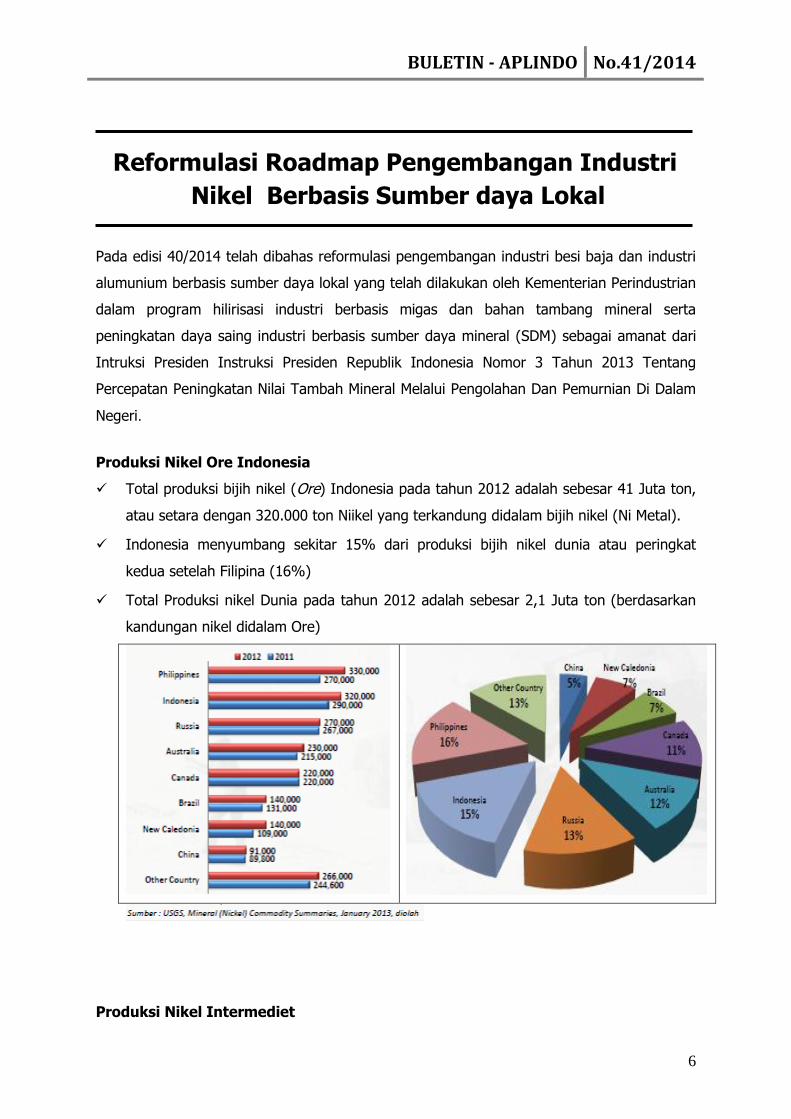
Produksi Nikel Ore Indonesia
Total produksi bijih nikel (Ore) Indonesia pada tahun 2012 adalah sebesar 41 Juta ton,
atau setara dengan 320.000 ton Niikel yang terkandung didalam bijih nikel (Ni Metal).
Indonesia menyumbang sekitar 15% dari produksi bijih nikel dunia atau peringkat
kedua setelah Filipina (16%)
Total Produksi nikel Dunia pada tahun 2012 adalah sebesar 2,1 Juta ton (berdasarkan
kandungan nikel didalam Ore)
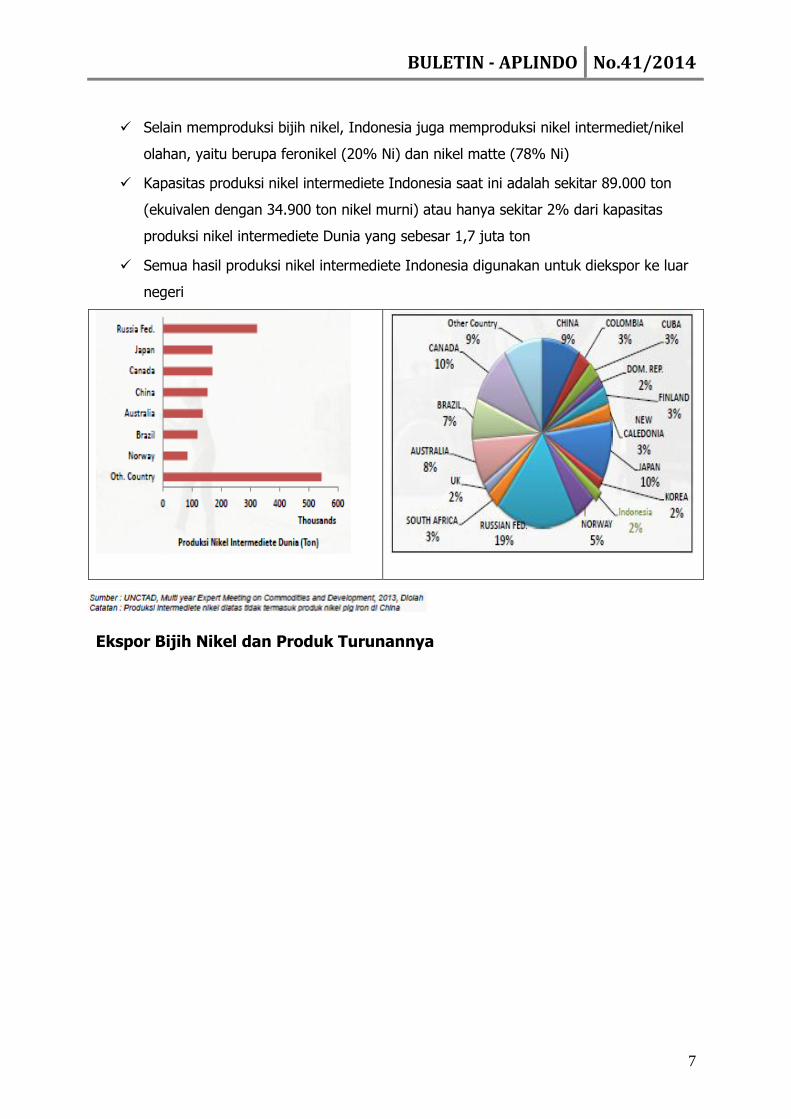
Produksi Nikel Intermediet
BULETIN - APLINDO No.41/2014
7
Selain memproduksi bijih nikel, Indonesia juga memproduksi nikel intermediet/nikel
olahan, yaitu berupa feronikel (20% Ni) dan nikel matte (78% Ni)
Kapasitas produksi nikel intermediete Indonesia saat ini adalah sekitar 89.000 ton
(ekuivalen dengan 34.900 ton nikel murni) atau hanya sekitar 2% dari kapasitas
produksi nikel intermediete Dunia yang sebesar 1,7 juta ton
Semua hasil produksi nikel intermediete Indonesia digunakan untuk diekspor ke luar
negeri
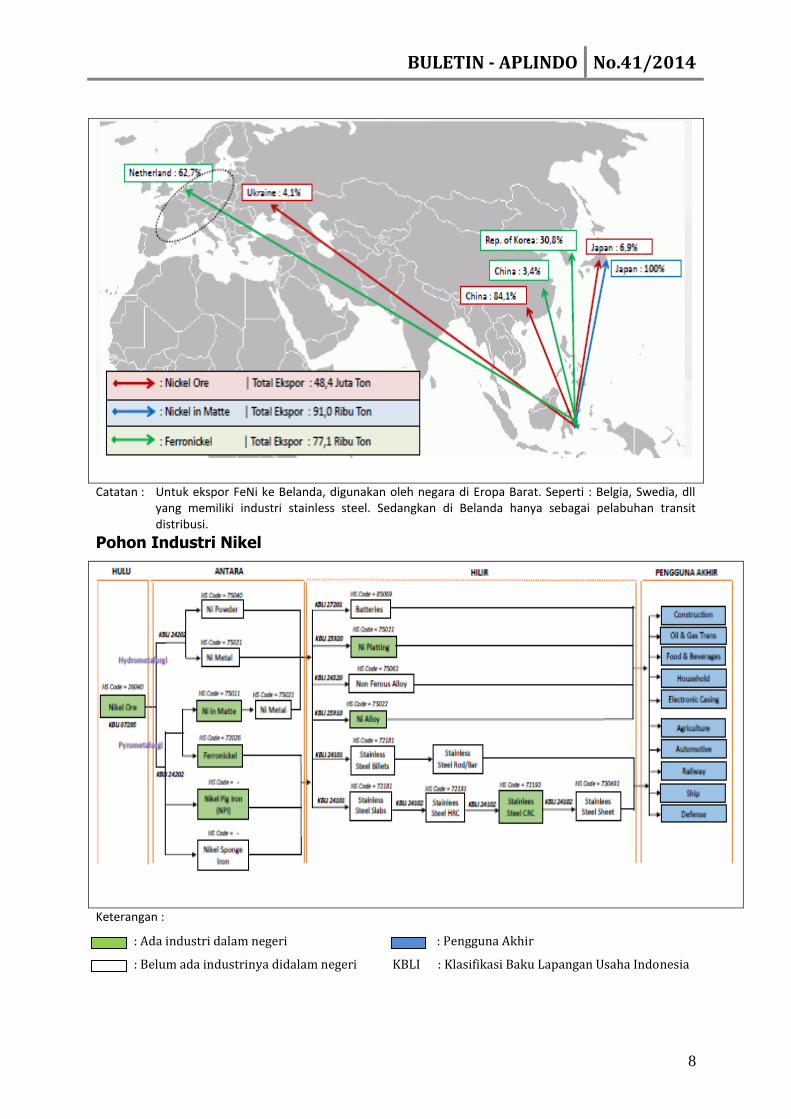
Ekspor Bijih Nikel dan Produk Turunannya
BULETIN - APLINDO No.41/2014
8
Catatan : Untuk ekspor FeNi ke Belanda, digunakan oleh negara di Eropa Barat. Seperti : Belgia, Swedia, dll yang memiliki industri stainless steel. Sedangkan di Belanda hanya sebagai pelabuhan transit distribusi.
Pohon Industri Nikel
Keterangan :
: Ada industri dalam negeri : Pengguna Akhir
: Belum ada industrinya didalam negeri KBLI : Klasifikasi Baku Lapangan Usaha Indonesia
BULETIN - APLINDO No.41/2014
9
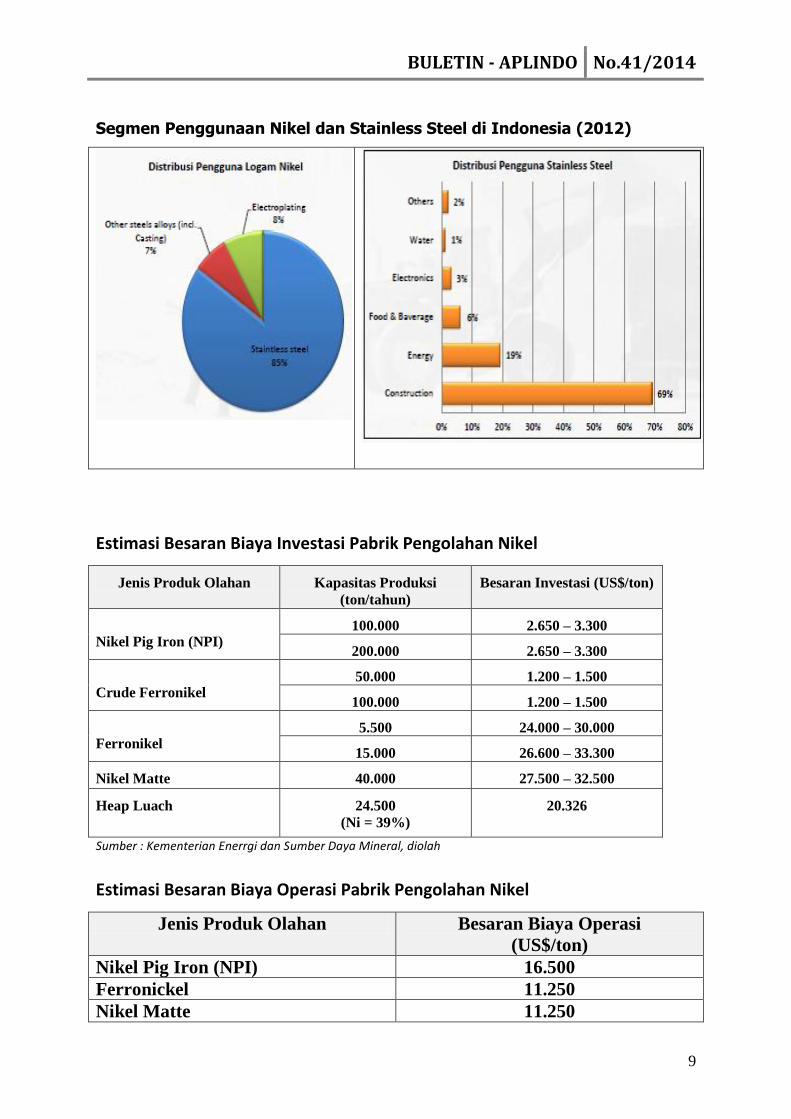
Segmen Penggunaan Nikel dan Stainless Steel di Indonesia (2012)
Estimasi Besaran Biaya Investasi Pabrik Pengolahan Nikel
Jenis Produk Olahan Kapasitas Produksi
(ton/tahun)
Besaran Investasi (US$/ton)
Nikel Pig Iron (NPI) 100.000 2.650 – 3.300
200.000 2.650 – 3.300
Crude Ferronikel 50.000 1.200 – 1.500
100.000 1.200 – 1.500
Ferronikel 5.500 24.000 – 30.000
15.000 26.600 – 33.300
Nikel Matte 40.000 27.500 – 32.500
Heap Luach 24.500
(Ni = 39%)
20.326
Sumber : Kementerian Enerrgi dan Sumber Daya Mineral, diolah
Estimasi Besaran Biaya Operasi Pabrik Pengolahan Nikel
Jenis Produk Olahan Besaran Biaya Operasi
(US$/ton)
Nikel Pig Iron (NPI) 16.500
Ferronickel 11.250
Nikel Matte 11.250
BULETIN - APLINDO No.41/2014
10
HPAL 8.600 Sumber : USAID, Economic Effects of Indonesia Mineral Processing Requirements for Export, 2013 Catatan : Masih perlu dilakukan kajian yang lebih mendalam
Struktur Biaya Smelter Nikel
Produk Keterangan
A. Feronikel dan Nikel Matte
NPV 639 Juta dollar
IRR 20%
Payback Period 8 tahun
B. Nikel Hydroxide
NPV 284 juta dollar
IRR 15%
Payback Period 12 tahun Keterangan :
NPV adalah arus kas yang diperkirakan pada masa yang akan datang yang didiskonkan
pada saat ini.
IRR (Internal Rate of Return) ialah indikator tingkat efisiensi dari suatu investasi.
Payback Period : suatu periode yang diperlukan untuk dapat menutup kembali
pengeluaran investasi dengan menggunakan proceed atau net cash flow.
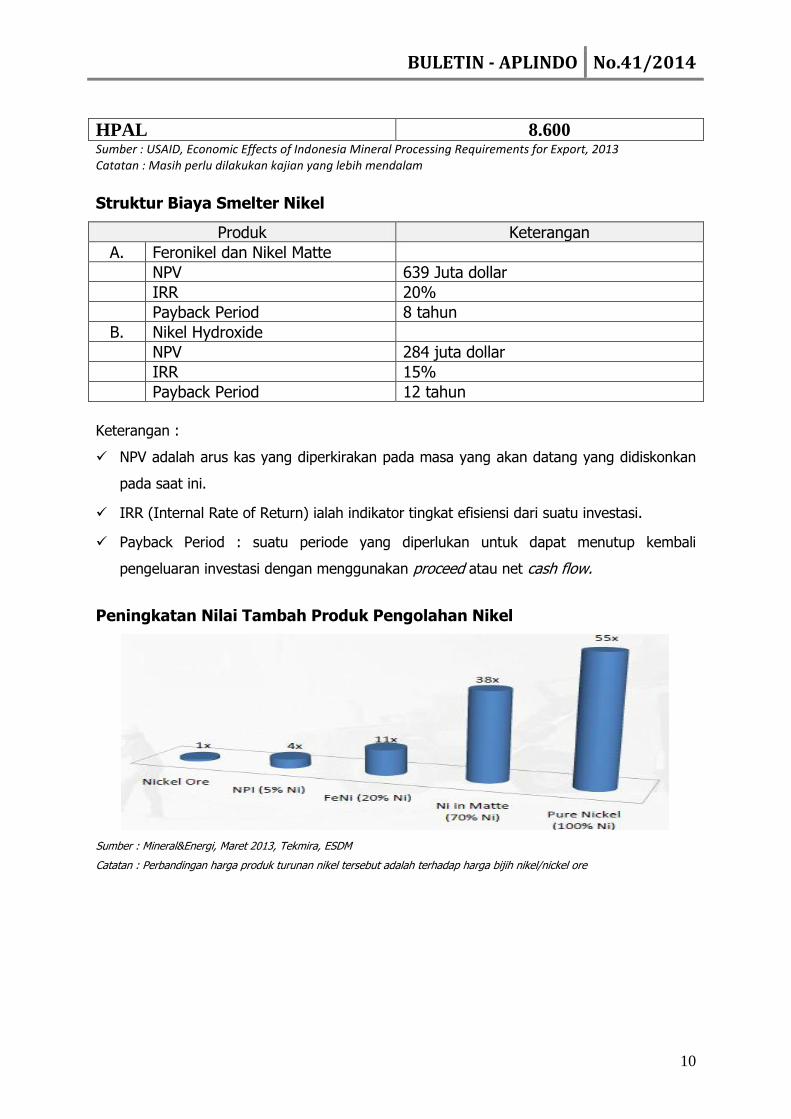
Peningkatan Nilai Tambah Produk Pengolahan Nikel
Sumber : Mineral&Energi, Maret 2013, Tekmira, ESDM
Catatan : Perbandingan harga produk turunan nikel tersebut adalah terhadap harga bijih nikel/nickel ore
BULETIN - APLINDO No.41/2014
11
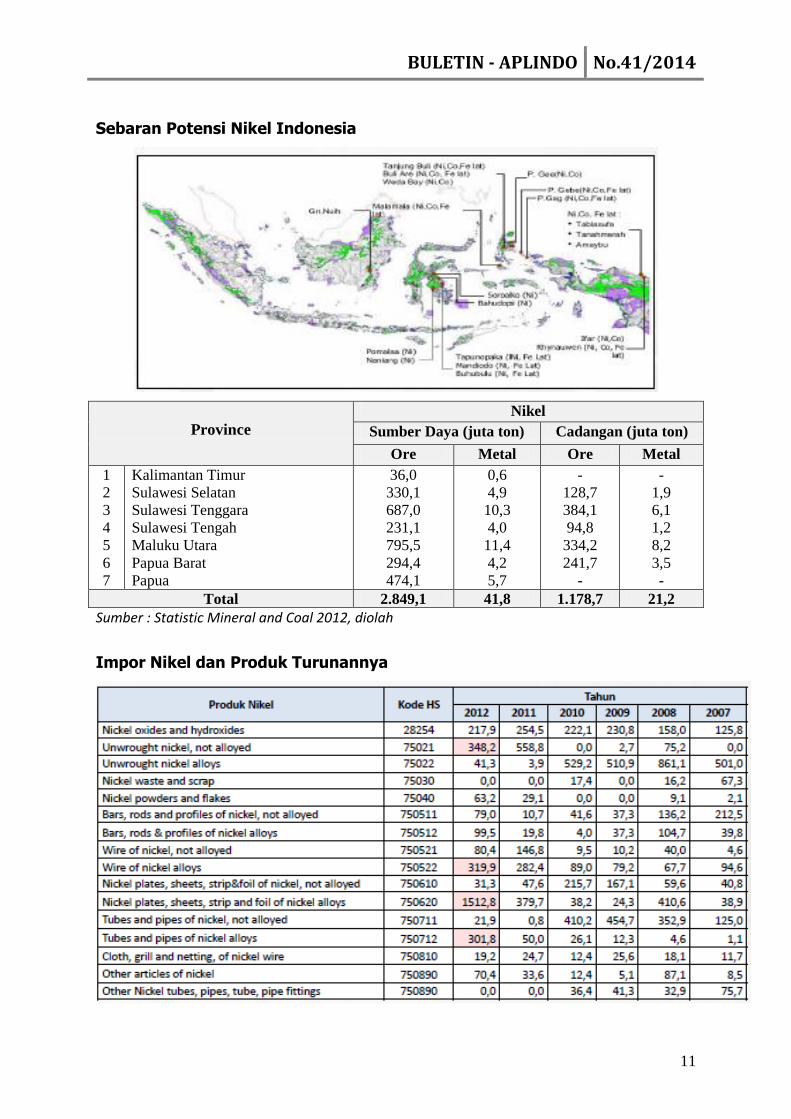
Sebaran Potensi Nikel Indonesia
Province
Nikel
Sumber Daya (juta ton) Cadangan (juta ton)
Ore Metal Ore Metal
1
2
3
4
5
6
7
Kalimantan Timur
Sulawesi Selatan
Sulawesi Tenggara
Sulawesi Tengah
Maluku Utara
Papua Barat
Papua
36,0
330,1
687,0
231,1
795,5
294,4
474,1
0,6
4,9
10,3
4,0
11,4
4,2
5,7
-
128,7
384,1
94,8
334,2
241,7
-
-
1,9
6,1
1,2
8,2
3,5
-
Total 2.849,1 41,8 1.178,7 21,2
Sumber : Statistic Mineral and Coal 2012, diolah
Impor Nikel dan Produk Turunannya
BULETIN - APLINDO No.41/2014
12
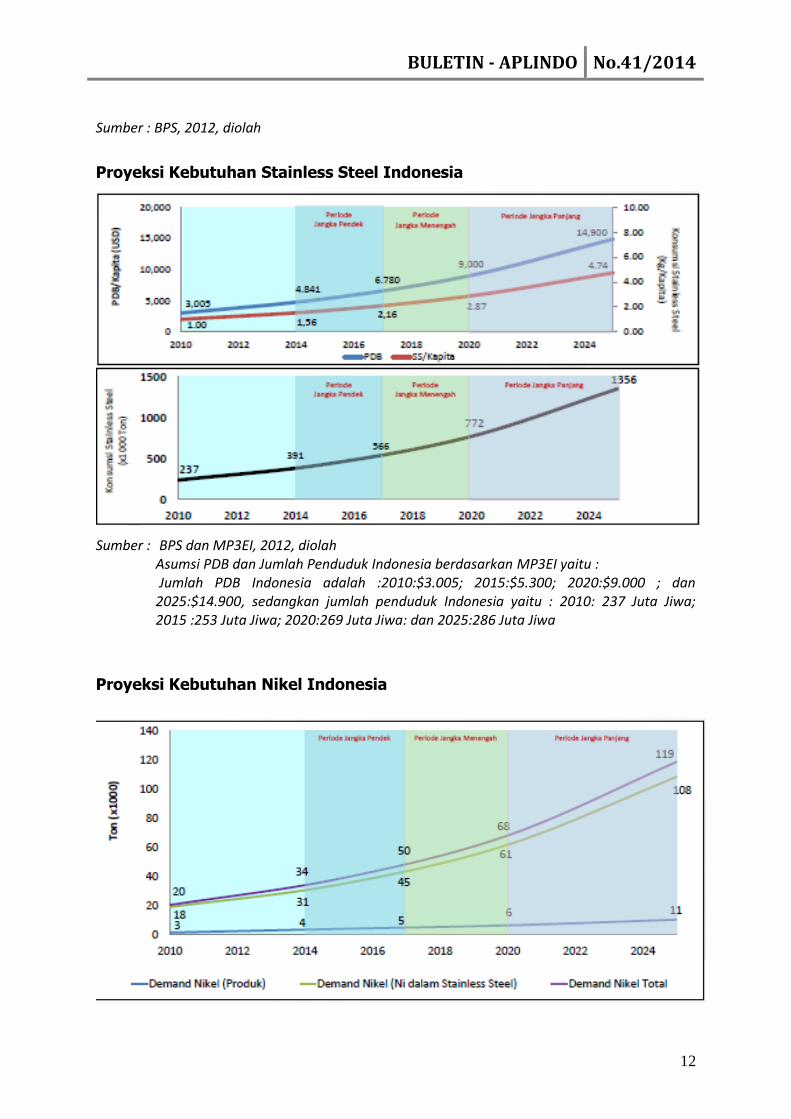
Sumber : BPS, 2012, diolah
Proyeksi Kebutuhan Stainless Steel Indonesia
Sumber : BPS dan MP3EI, 2012, diolah Asumsi PDB dan Jumlah Penduduk Indonesia berdasarkan MP3EI yaitu :
Jumlah PDB Indonesia adalah :2010:$3.005; 2015:$5.300; 2020:$9.000 ; dan 2025:$14.900, sedangkan jumlah penduduk Indonesia yaitu : 2010: 237 Juta Jiwa; 2015 :253 Juta Jiwa; 2020:269 Juta Jiwa: dan 2025:286 Juta Jiwa
Proyeksi Kebutuhan Nikel Indonesia
BULETIN - APLINDO No.41/2014
13
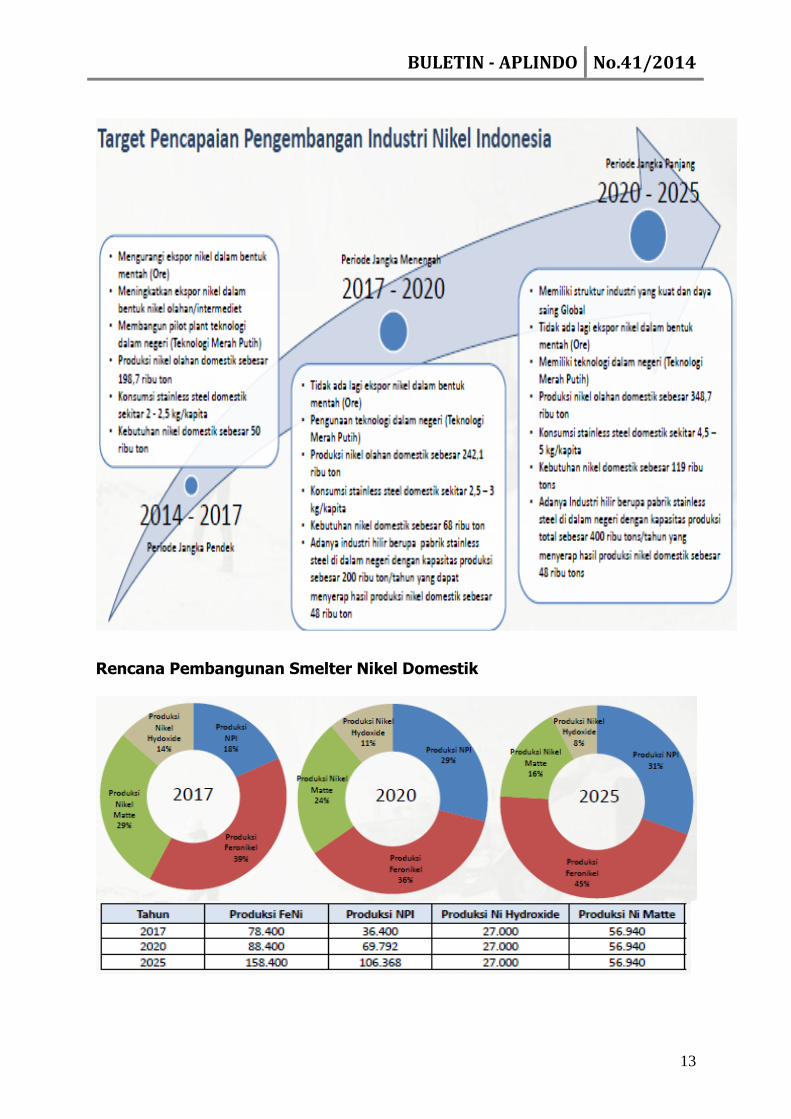
Rencana Pembangunan Smelter Nikel Domestik
BULETIN - APLINDO No.41/2014
14
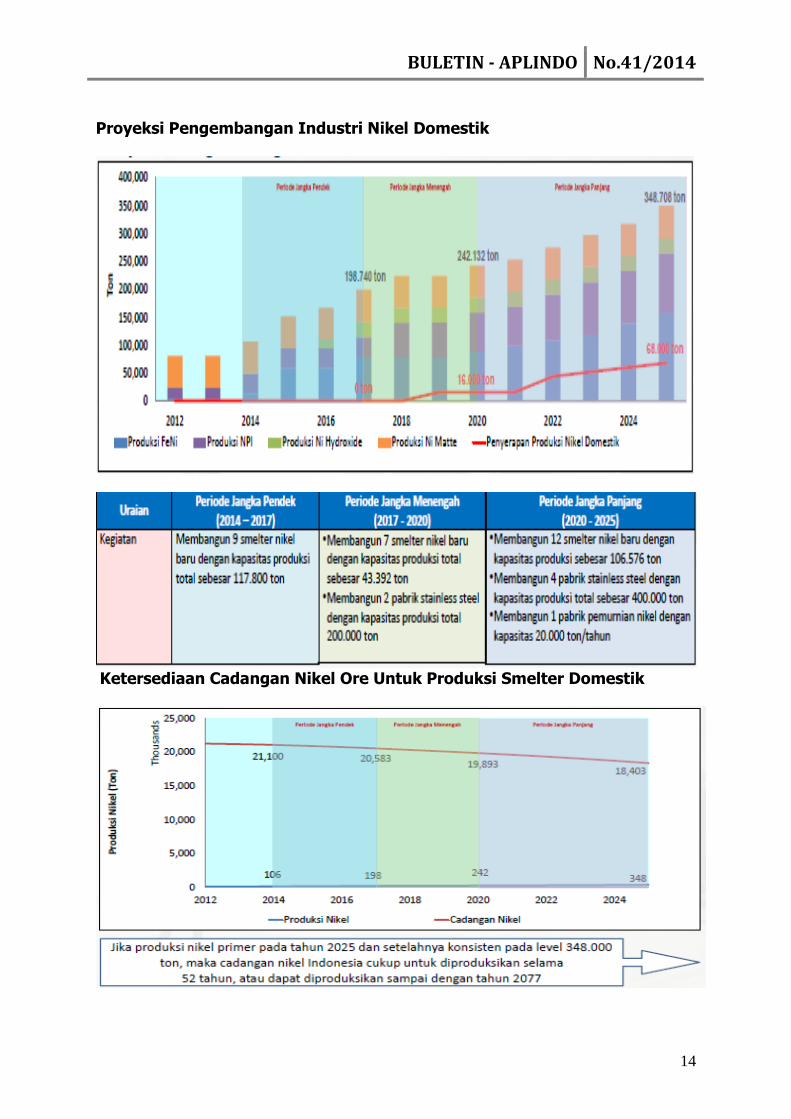
Proyeksi Pengembangan Industri Nikel Domestik
Ketersediaan Cadangan Nikel Ore Untuk Produksi Smelter Domestik
BULETIN - APLINDO No.41/2014
15
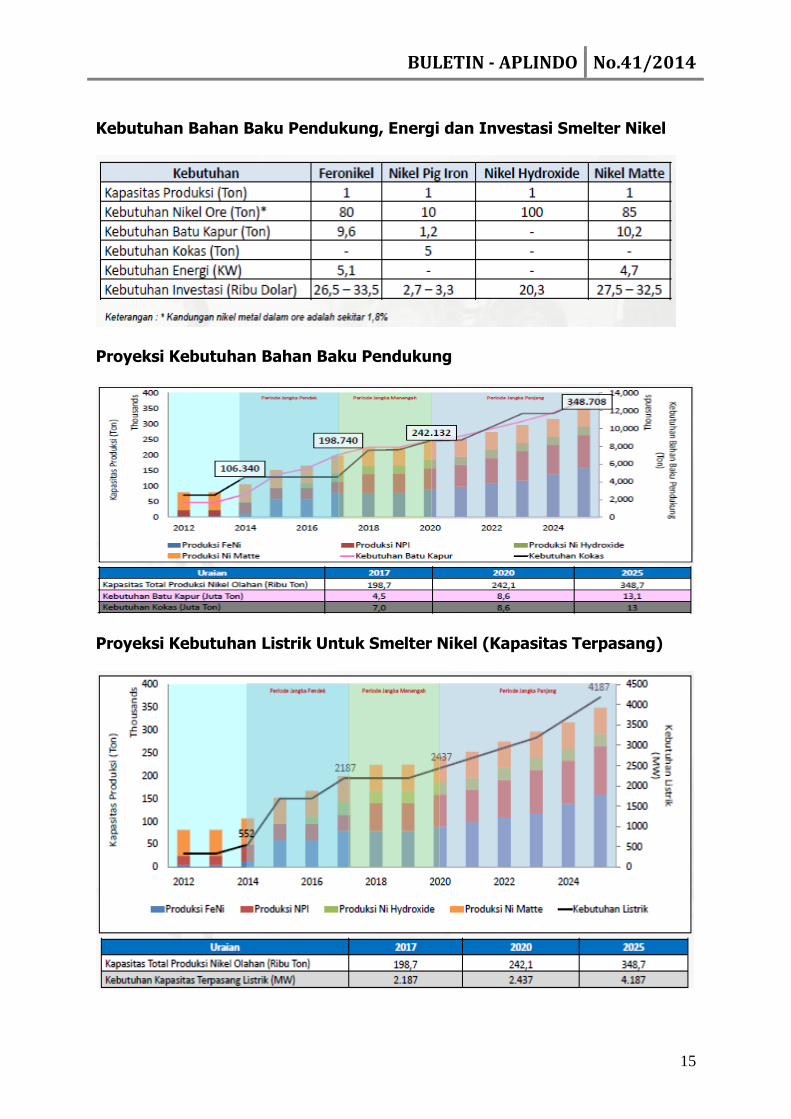
Kebutuhan Bahan Baku Pendukung, Energi dan Investasi Smelter Nikel
Proyeksi Kebutuhan Bahan Baku Pendukung
Proyeksi Kebutuhan Listrik Untuk Smelter Nikel (Kapasitas Terpasang)
BULETIN - APLINDO No.41/2014
16
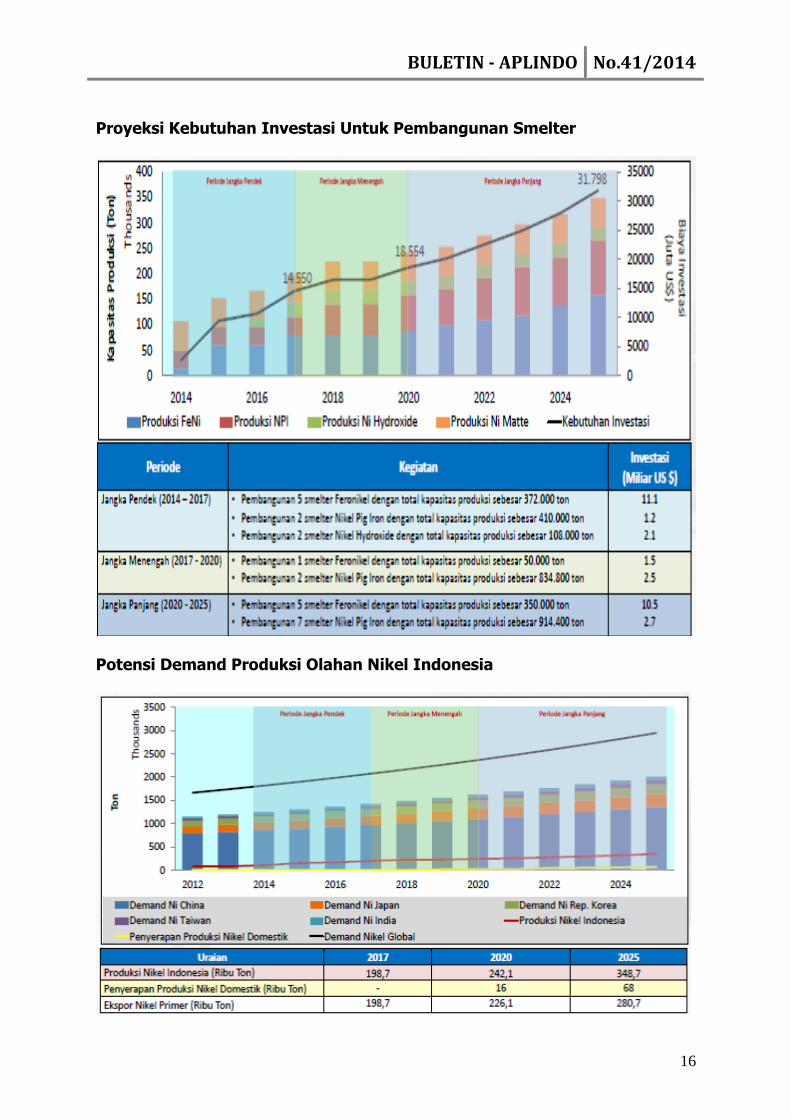
Proyeksi Kebutuhan Investasi Untuk Pembangunan Smelter
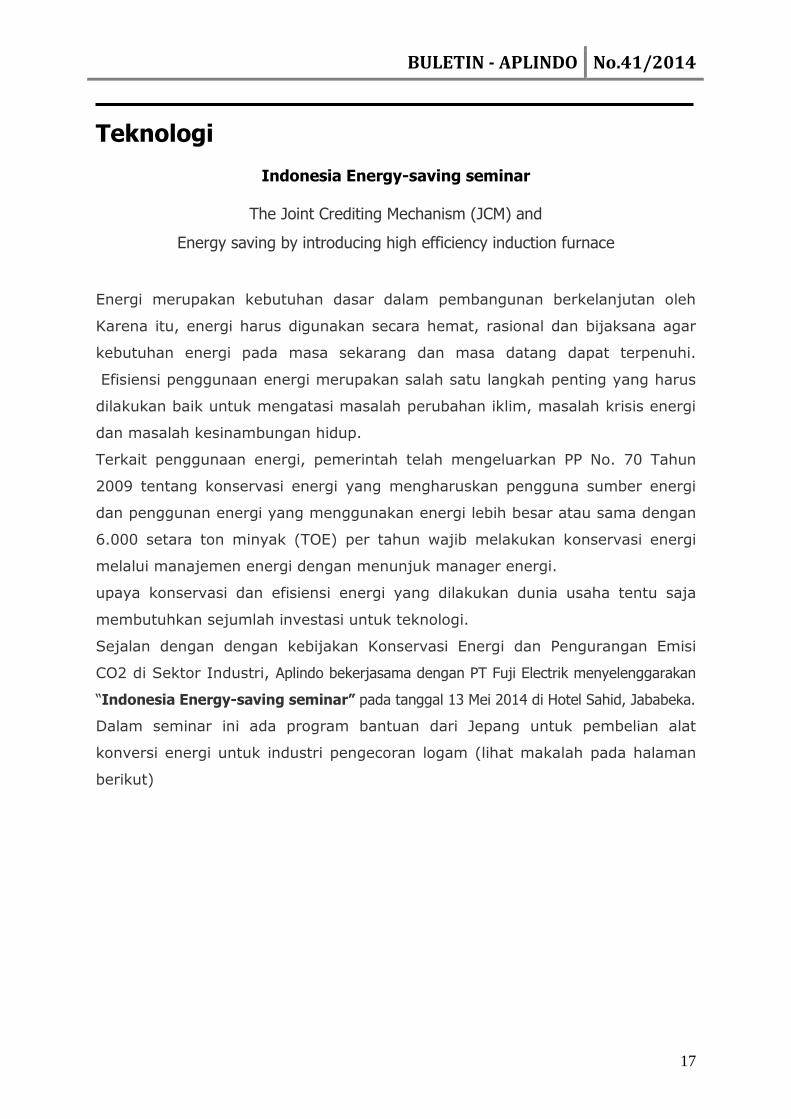
Potensi Demand Produksi Olahan Nikel Indonesia
BULETIN - APLINDO No.41/2014
17
Teknologi
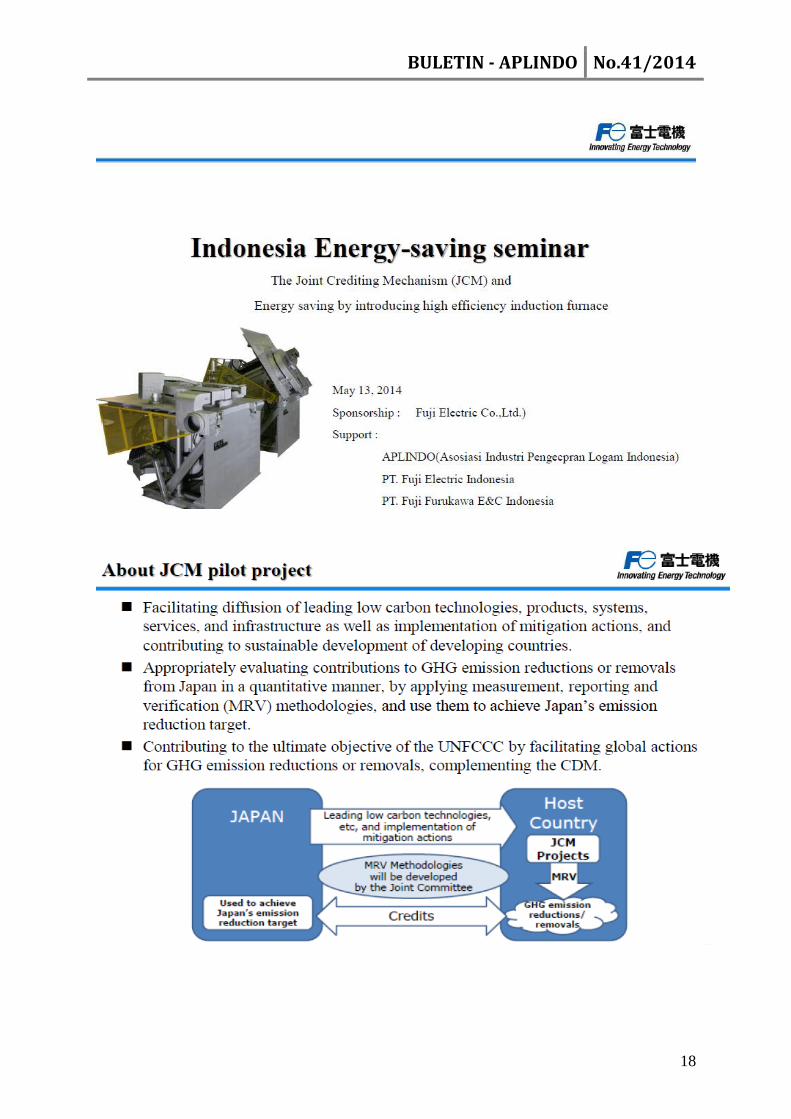
Indonesia Energy-saving seminar
The Joint Crediting Mechanism (JCM) and
Energy saving by introducing high efficiency induction furnace
Energi merupakan kebutuhan dasar dalam pembangunan berkelanjutan oleh
Karena itu, energi harus digunakan secara hemat, rasional dan bijaksana agar
kebutuhan energi pada masa sekarang dan masa datang dapat terpenuhi.
Efisiensi penggunaan energi merupakan salah satu langkah penting yang harus
dilakukan baik untuk mengatasi masalah perubahan iklim, masalah krisis energi
dan masalah kesinambungan hidup.
Terkait penggunaan energi, pemerintah telah mengeluarkan PP No. 70 Tahun
2009 tentang konservasi energi yang mengharuskan pengguna sumber energi
dan penggunan energi yang menggunakan energi lebih besar atau sama dengan
6.000 setara ton minyak (TOE) per tahun wajib melakukan konservasi energi
melalui manajemen energi dengan menunjuk manager energi.
upaya konservasi dan efisiensi energi yang dilakukan dunia usaha tentu saja
membutuhkan sejumlah investasi untuk teknologi.
Sejalan dengan dengan kebijakan Konservasi Energi dan Pengurangan Emisi
CO2 di Sektor Industri, Aplindo bekerjasama dengan PT Fuji Electrik menyelenggarakan
“Indonesia Energy-saving seminar” pada tanggal 13 Mei 2014 di Hotel Sahid, Jababeka.
Dalam seminar ini ada program bantuan dari Jepang untuk pembelian alat
konversi energi untuk industri pengecoran logam (lihat makalah pada halaman
berikut)
BULETIN - APLINDO No.41/2014
18
BULETIN - APLINDO No.41/2014
19
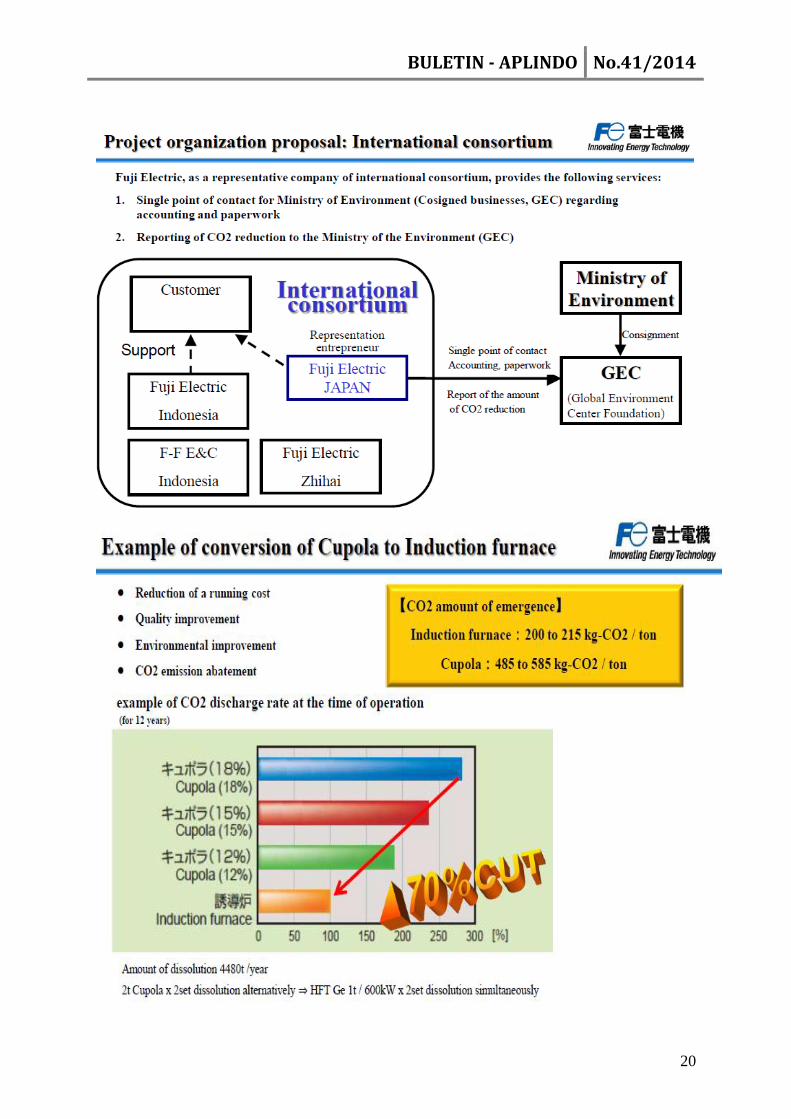
BULETIN - APLINDO No.41/2014
20
BULETIN - APLINDO No.41/2014
21
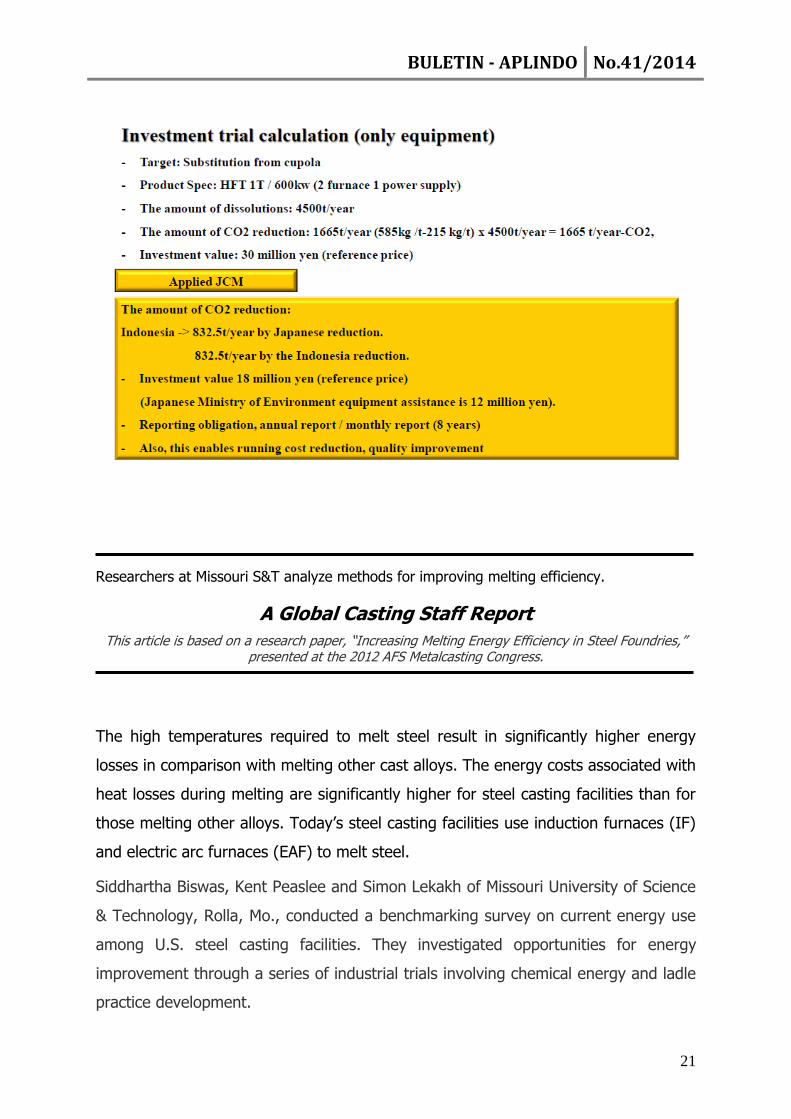
Researchers at Missouri S&T analyze methods for improving melting efficiency.
A Global Casting Staff Report
This article is based on a research paper, “Increasing Melting Energy Efficiency in Steel Foundries,” presented at the 2012 AFS Metalcasting Congress.
The high temperatures required to melt steel result in significantly higher energy
losses in comparison with melting other cast alloys. The energy costs associated with
heat losses during melting are significantly higher for steel casting facilities than for
those melting other alloys. Today’s steel casting facilities use induction furnaces (IF)
and electric arc furnaces (EAF) to melt steel.
Siddhartha Biswas, Kent Peaslee and Simon Lekakh of Missouri University of Science
& Technology, Rolla, Mo., conducted a benchmarking survey on current energy use
among U.S. steel casting facilities. They investigated opportunities for energy
improvement through a series of industrial trials involving chemical energy and ladle
practice development.
BULETIN - APLINDO No.41/2014
22
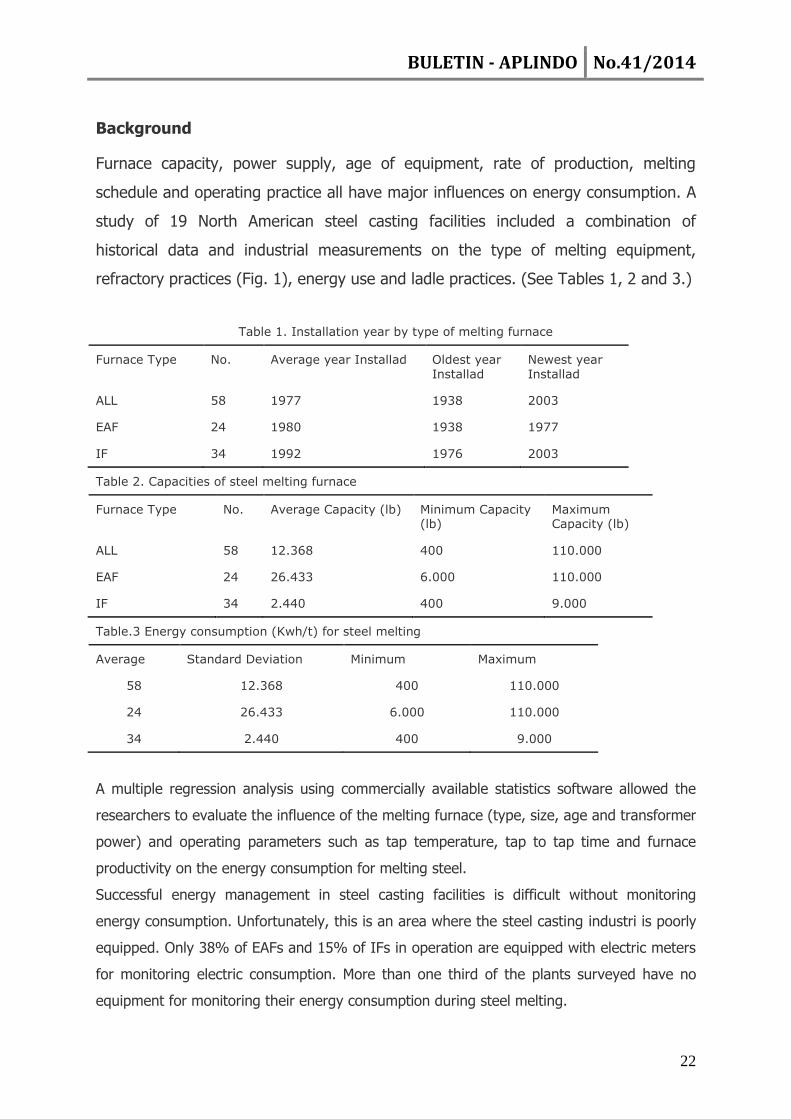
Background
Furnace capacity, power supply, age of equipment, rate of production, melting
schedule and operating practice all have major influences on energy consumption. A
study of 19 North American steel casting facilities included a combination of
historical data and industrial measurements on the type of melting equipment,
refractory practices (Fig. 1), energy use and ladle practices. (See Tables 1, 2 and 3.)
Table 1. Installation year by type of melting furnace
Furnace Type No. Average year Installad Oldest year Installad
Newest year Installad
ALL 58 1977 1938 2003
EAF 24 1980 1938 1977
IF 34 1992 1976 2003
Table 2. Capacities of steel melting furnace
Furnace Type No. Average Capacity (lb) Minimum Capacity (lb)
Maximum Capacity (lb)
ALL 58 12.368 400 110.000
EAF 24 26.433 6.000 110.000
IF 34 2.440 400 9.000
Table.3 Energy consumption (Kwh/t) for steel melting
Average Standard Deviation Minimum Maximum
58 12.368 400 110.000
24 26.433 6.000 110.000
34 2.440 400 9.000
A multiple regression analysis using commercially available statistics software allowed the
researchers to evaluate the influence of the melting furnace (type, size, age and transformer
power) and operating parameters such as tap temperature, tap to tap time and furnace
productivity on the energy consumption for melting steel.
Successful energy management in steel casting facilities is difficult without monitoring
energy consumption. Unfortunately, this is an area where the steel casting industri is poorly
equipped. Only 38% of EAFs and 15% of IFs in operation are equipped with electric meters
for monitoring electric consumption. More than one third of the plants surveyed have no
equipment for monitoring their energy consumption during steel melting.
BULETIN - APLINDO No.41/2014
23
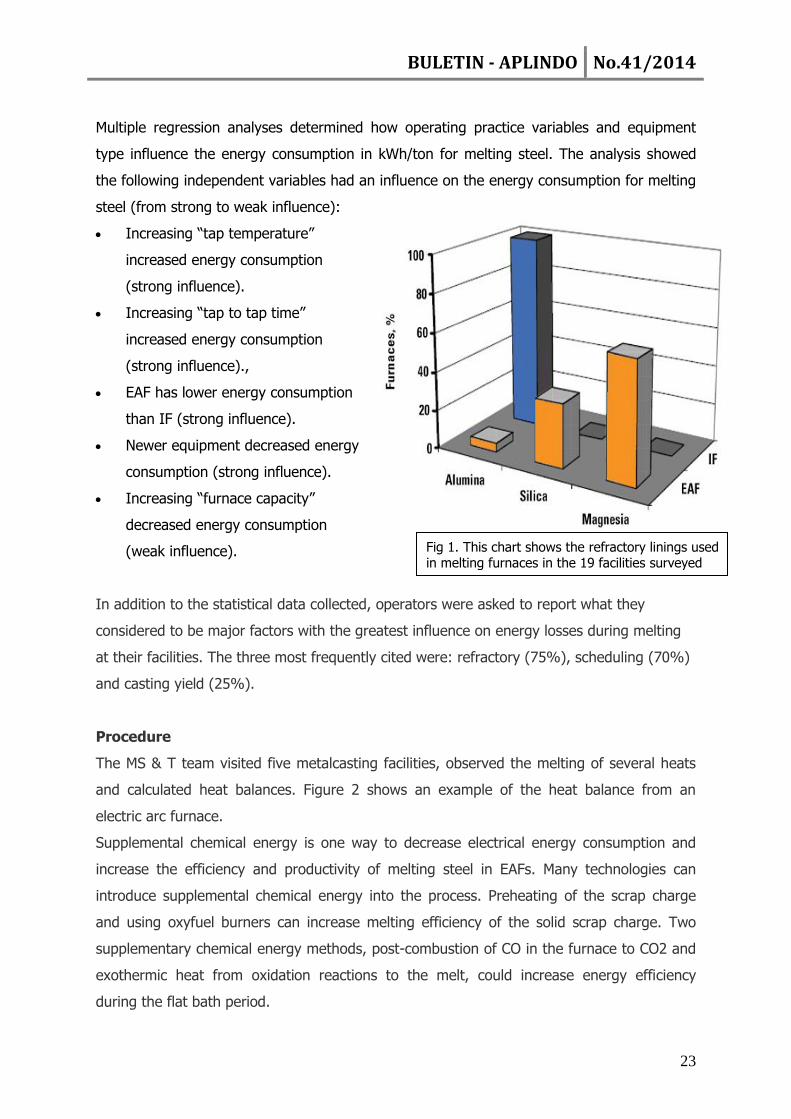
Multiple regression analyses determined how operating practice variables and equipment
type influence the energy consumption in kWh/ton for melting steel. The analysis showed
the following independent variables had an influence on the energy consumption for melting
steel (from strong to weak influence):
Increasing “tap temperature”
increased energy consumption
(strong influence).
Increasing “tap to tap time”
increased energy consumption
(strong influence).,
EAF has lower energy consumption
than IF (strong influence).
Newer equipment decreased energy
consumption (strong influence).
Increasing “furnace capacity”
decreased energy consumption
(weak influence).
In addition to the statistical data collected, operators were asked to report what they
considered to be major factors with the greatest influence on energy losses during melting
at their facilities. The three most frequently cited were: refractory (75%), scheduling (70%)
and casting yield (25%).
Procedure
The MS & T team visited five metalcasting facilities, observed the melting of several heats
and calculated heat balances. Figure 2 shows an example of the heat balance from an
electric arc furnace.
Supplemental chemical energy is one way to decrease electrical energy consumption and
increase the efficiency and productivity of melting steel in EAFs. Many technologies can
introduce supplemental chemical energy into the process. Preheating of the scrap charge
and using oxyfuel burners can increase melting efficiency of the solid scrap charge. Two
supplementary chemical energy methods, post-combustion of CO in the furnace to CO2 and
exothermic heat from oxidation reactions to the melt, could increase energy efficiency
during the flat bath period.
Fig 1. This chart shows the refractory linings used in melting furnaces in the 19 facilities surveyed
BULETIN - APLINDO No.41/2014
24
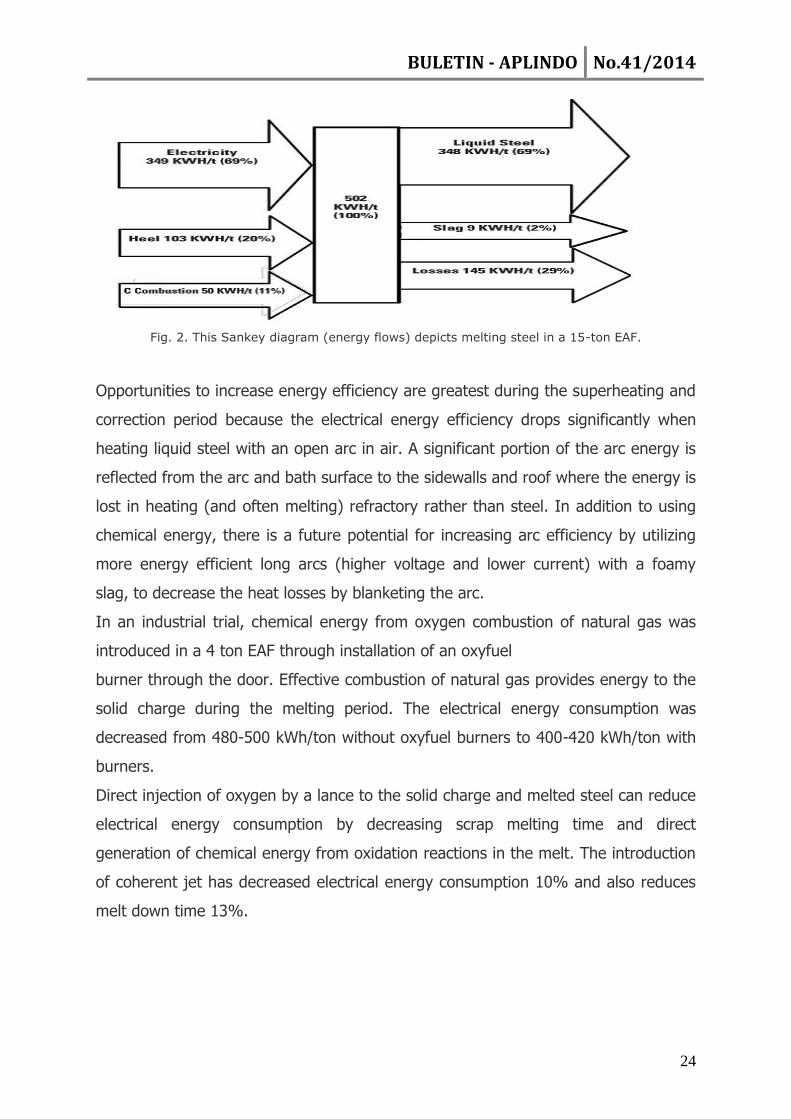
Fig. 2. This Sankey diagram (energy flows) depicts melting steel in a 15-ton EAF.
Opportunities to increase energy efficiency are greatest during the superheating and
correction period because the electrical energy efficiency drops significantly when
heating liquid steel with an open arc in air. A significant portion of the arc energy is
reflected from the arc and bath surface to the sidewalls and roof where the energy is
lost in heating (and often melting) refractory rather than steel. In addition to using
chemical energy, there is a future potential for increasing arc efficiency by utilizing
more energy efficient long arcs (higher voltage and lower current) with a foamy
slag, to decrease the heat losses by blanketing the arc.
In an industrial trial, chemical energy from oxygen combustion of natural gas was
introduced in a 4 ton EAF through installation of an oxyfuel
burner through the door. Effective combustion of natural gas provides energy to the
solid charge during the melting period. The electrical energy consumption was
decreased from 480-500 kWh/ton without oxyfuel burners to 400-420 kWh/ton with
burners.
Direct injection of oxygen by a lance to the solid charge and melted steel can reduce
electrical energy consumption by decreasing scrap melting time and direct
generation of chemical energy from oxidation reactions in the melt. The introduction
of coherent jet has decreased electrical energy consumption 10% and also reduces
melt down time 13%.
BULETIN - APLINDO No.41/2014
25
Scrap preheating systems, oxyfuel burners and postcombustion of CO require additional
capital investment. By comparison, the addition of a material such as SiC, which produces
exothermic reactions during the oxygen blow, does not require any capital investment (Fig.
3).
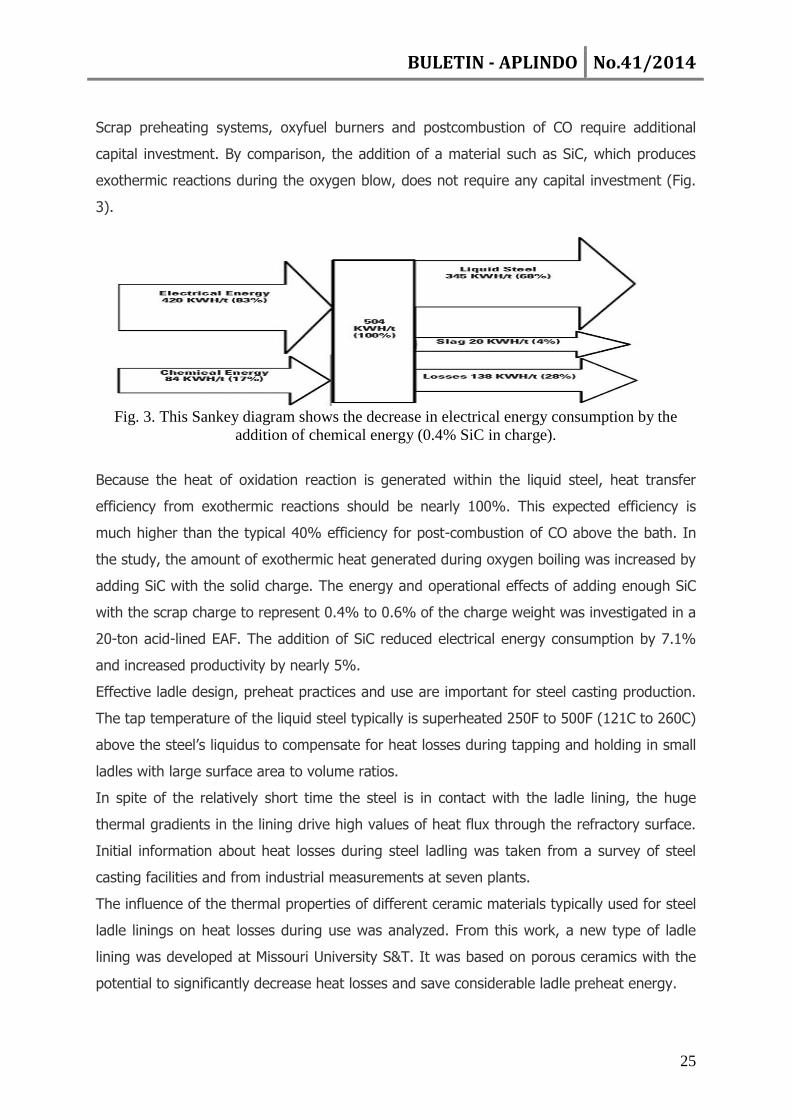
Fig. 3. This Sankey diagram shows the decrease in electrical energy consumption by the
addition of chemical energy (0.4% SiC in charge).
Because the heat of oxidation reaction is generated within the liquid steel, heat transfer
efficiency from exothermic reactions should be nearly 100%. This expected efficiency is
much higher than the typical 40% efficiency for post-combustion of CO above the bath. In
the study, the amount of exothermic heat generated during oxygen boiling was increased by
adding SiC with the solid charge. The energy and operational effects of adding enough SiC
with the scrap charge to represent 0.4% to 0.6% of the charge weight was investigated in a
20-ton acid-lined EAF. The addition of SiC reduced electrical energy consumption by 7.1%
and increased productivity by nearly 5%.
Effective ladle design, preheat practices and use are important for steel casting production.
The tap temperature of the liquid steel typically is superheated 250F to 500F (121C to 260C)
above the steel’s liquidus to compensate for heat losses during tapping and holding in small
ladles with large surface area to volume ratios.
In spite of the relatively short time the steel is in contact with the ladle lining, the huge
thermal gradients in the lining drive high values of heat flux through the refractory surface.
Initial information about heat losses during steel ladling was taken from a survey of steel
casting facilities and from industrial measurements at seven plants.
The influence of the thermal properties of different ceramic materials typically used for steel
ladle linings on heat losses during use was analyzed. From this work, a new type of ladle
lining was developed at Missouri University S&T. It was based on porous ceramics with the
potential to significantly decrease heat losses and save considerable ladle preheat energy.
BULETIN - APLINDO No.41/2014
26
The data collected through the survey and trials was analyzed to determine the factors that
were most important to energy losses in the ladle. One of the most important factors was
found to be the ladle capacity. The tap temperature was found to be significantly lower for
higher capacity ladles. A computational fluid dynamics (CFD) model was used to study the
effects of ladle size and validate the industrial measurements.
The temperature of the liquid steel at tap typically varies between 2,950F (1,621 C) and
3,200F (1,760C) at steel casting facilities. These temperatures are close to the softening
temperature of the complex Al, Ca, Si, and Mg oxide compounds which are often used for
ceramic linings. Also, the high rate of chemical reactions between the lining and components
of the liquid steel and slag takes place at these temperatures. As a rule, ladles are not fully
soaked even when used multiple times and are therefore used under unsteady state heat
transfer conditions. Even in cases where the lining is preheated prior to tap, a significant
part of the heat energy from the liquid steel accumulates inside the lining during the first 5-
30 minutes after tap.
Foundry ladle operations require special ceramic lining materials. A specially designed low
density porous alumina castable was introduced. It has very low thermal conductivity and
was determined to improve energy efficiency in the ladle (Table 4).
Results and Conclusions
Major opportunities for energy savings were identified as: improvement in scheduling and
decreasing delays while liquid metal is in the furnace; addition of chemical energy for melting
steel; and improvement in ladle practice. CFD modeling, and industrial and laboratory trials
determined the effects of these changes in reducing electrical power consumption. This data will be
used in the future for development of a spreadsheet type model to allow metalcasters to calculate
energy usage and melt temperature losses.
BULETIN - APLINDO No.41/2014
27
The Future of Light Metal Die Casting
Foundries
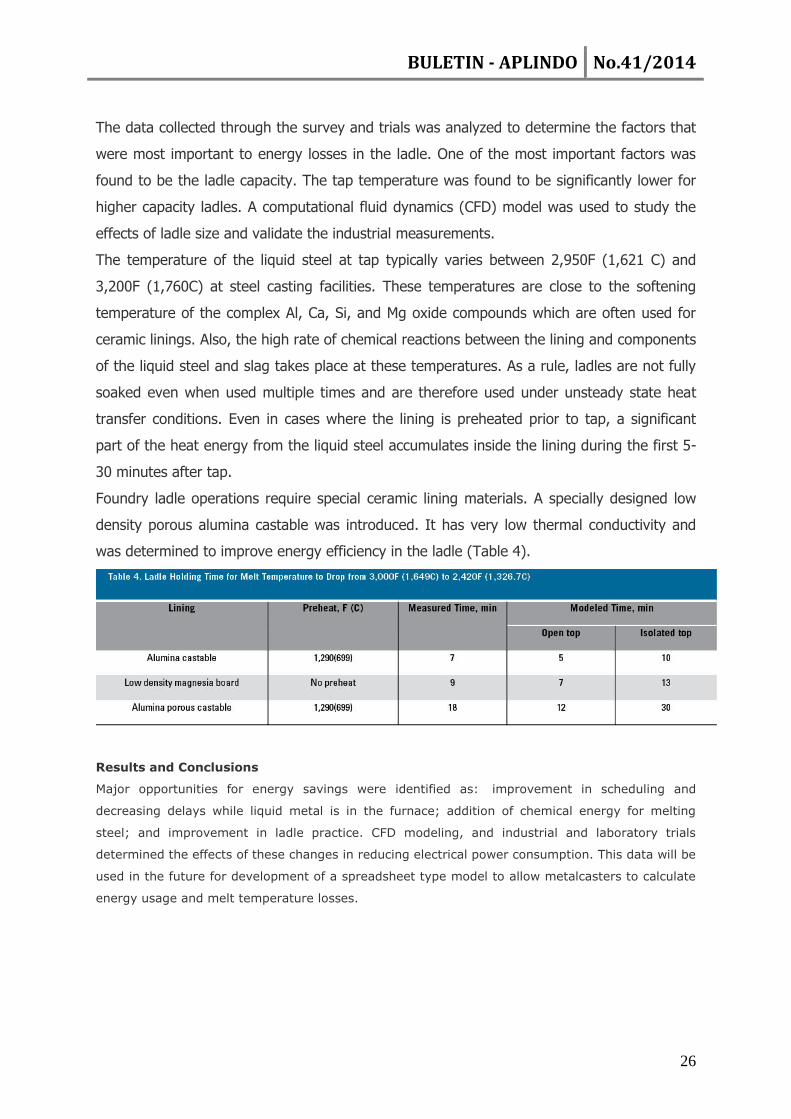
Fig. 1. Shown are options for application and possible savings in weight when aluminum die cast structural
components are used for the body structure of cars. (Source: Bühler, Annual Report 2010)
The optimization of energy consumption and the associated reduction of CO2 emissions are
top priorities for our society in the 21st century. In addition, the world’s resources are finite
which is why it is important to search for opportunities to use them as efficiently as possible.
The governmental regulation of emissions standards for vehicles in particular has led to a
paradigm change resulting in the promotion of innovative concepts for light construction.
Despite global efforts to reduce the use of non-renewable energy, the worldwide demand for
individual mobility has been unrelenting. Independent studies of trends and markets
conducted by well-known automobile manufacturers and research institutes have shown this
to be true. Optimistic predictions talk about a doubling of production volume for automobiles
within the next 20 years, whereby the classic drive technologies will be replaced with new,
future-oriented technologies. Regardless, an increased use of light and highly resilient
materials is to be expected. Aluminum and magnesium will play a crucial role in this.
With the demand for efficiency and sustainability, diecasters have encountered new and
recently yet unknown challenges, not least of which is to master the diecasting process and
ensure the required level of quality. An overall trend is moving toward more complex
components with increased functionality and lower weight at lower costs.
In addition to substituting heavy materials such as steel with lighter metals, the use of
structural components contributes to reducing the weight of automobiles. This makes it
BULETIN - APLINDO No.41/2014
28
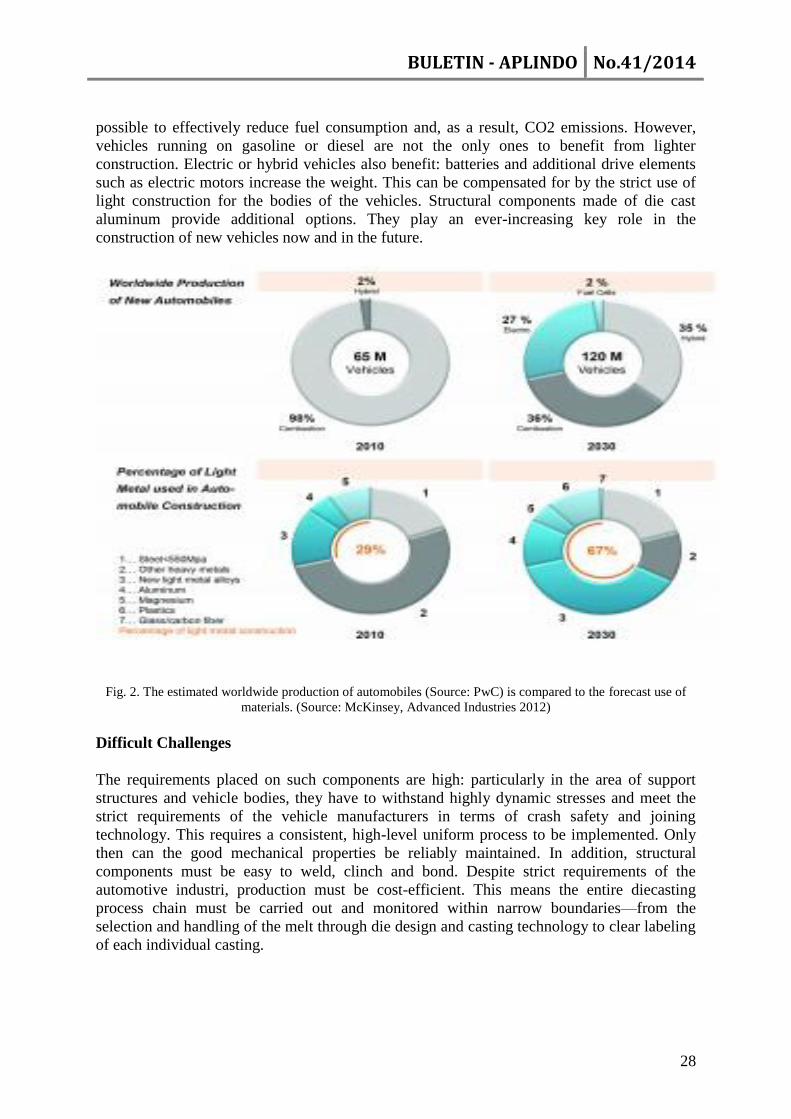
possible to effectively reduce fuel consumption and, as a result, CO2 emissions. However,
vehicles running on gasoline or diesel are not the only ones to benefit from lighter
construction. Electric or hybrid vehicles also benefit: batteries and additional drive elements
such as electric motors increase the weight. This can be compensated for by the strict use of
light construction for the bodies of the vehicles. Structural components made of die cast
aluminum provide additional options. They play an ever-increasing key role in the
construction of new vehicles now and in the future.
Fig. 2. The estimated worldwide production of automobiles (Source: PwC) is compared to the forecast use of
materials. (Source: McKinsey, Advanced Industries 2012)
Difficult Challenges
The requirements placed on such components are high: particularly in the area of support
structures and vehicle bodies, they have to withstand highly dynamic stresses and meet the
strict requirements of the vehicle manufacturers in terms of crash safety and joining
technology. This requires a consistent, high-level uniform process to be implemented. Only
then can the good mechanical properties be reliably maintained. In addition, structural
components must be easy to weld, clinch and bond. Despite strict requirements of the
automotive industri, production must be cost-efficient. This means the entire diecasting
process chain must be carried out and monitored within narrow boundaries—from the
selection and handling of the melt through die design and casting technology to clear labeling
of each individual casting.
BULETIN - APLINDO No.41/2014
29
The Right Process, the Right Plant Engineering
Structural components unify the function of many metal component parts, thereby reducing
the complexity required for body construction. By integrating many components into a single
casting, they continue to become larger and more complex. In order to minimize their weight,
wall thicknesses have been reduced from the 2.5-3 mm range to less than 2 mm and are only
reinforced according to local requirements. In order to ensure reliable production of such
components, having the right process run on machines and systems designed for that process
is critical.
Thinner wall thicknesses call for shorter die filling times; even larger castings with long flow
paths for the molten metal require very accurately dimensioned locking units. In order to
fulfill these tasks, very efficient and highly dynamic shot ends with little scattering of the
process parameters are required. Hydraulic clamping cylinders directly on the tie-bars allow
for each tie-bar to be clamped individually and therefore promote homogenous distribution of
the locking force. This results in little flashing or need for post-processing. In addition, the
unique control of the casting process in real-time ensures an extraordinarily high degree of
reproducibility over the entire production process.
Air-Tight and Free of Turbulence
To achieve the low vacuum in the cavity that determines the component properties in
diecasting, properly designed dies and high-performance die vacuum technology are required.
Wear resistance and thermal insulation of the shot sleeve are crucial: they guarantee the
tightness of the vacuum system between the shot sleeve and the plunger and reduce the heat
loss of the molten metal in the shot sleeve. Turbulence must be reduced for ladling metal
from the dosing furnace to ensure the molten metal in the shot sleeve is low in oxide and
hydrogen and ready for the next die filling process.
Precision in Post-Processing
In addition to how the material is molten and die cast, post-processing, thermal treatment and
logistics of the components must also be taken into consideration. Errors made when the die
releasing agent is applied could increase porosity due to gas which would have a negative
effect on the quality of the weld. For this reason, there is a clear trend for such castings
toward using a minimum of die releasing agent when spraying. However, this requires the
temperature control concept be adjusted for the die inserts in order to dissipate the process
energy efficiently.
The ejection and extraction of the castings in particular and the subsequent cooling has a
significant effect on warping. The large-scale dimensions of structural components present a
new challenge for high-volume production: trimming of components in the die casting cell
requires large trimming presses and an optimized flow of material for the cast part as well as
for recycled materials. A thermal treatment process that is not set correctly could lead to an
increase in rejects during production since the required mechanical properties cannot be
attained in a reproducible manner.
BULETIN - APLINDO No.41/2014
30
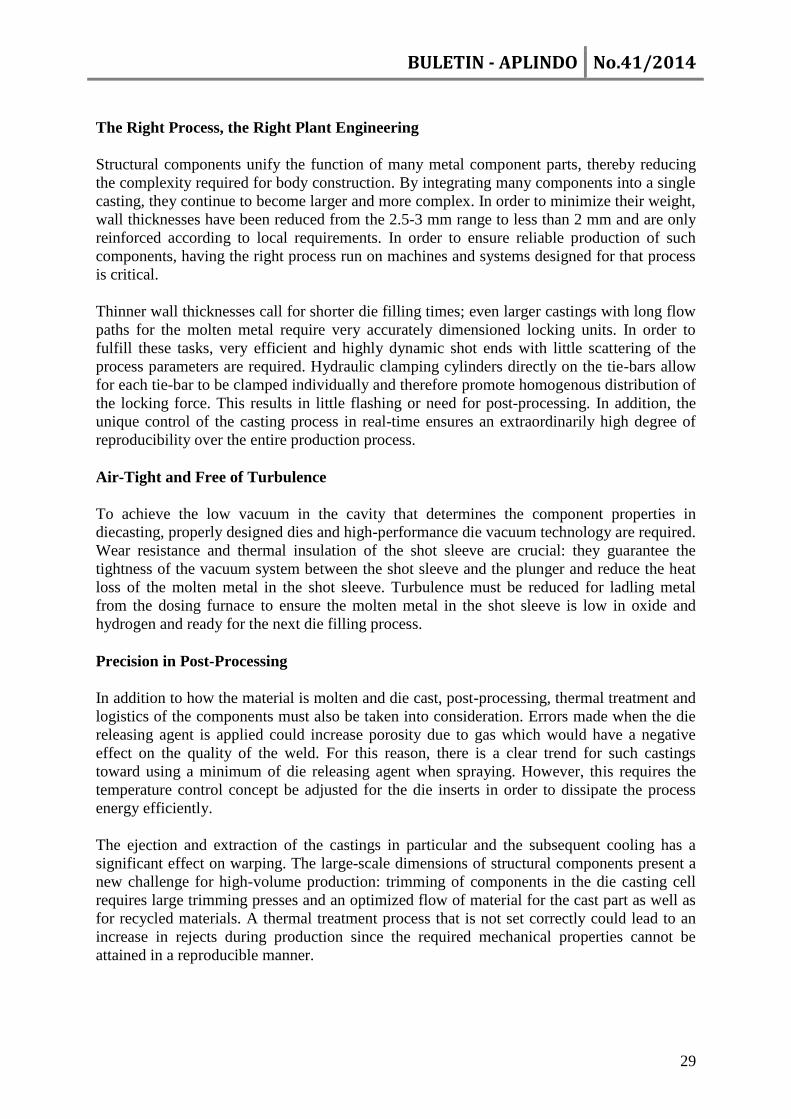
Fig. 3. An example of typical use of the lost core technology is this closed deck motor block
to increase the structural strength of highly charged diesel engines. (Source: Volkswagen
AG), on the right: salt core insert.
Keyword: Lost Core
The potential for light construction has been
further expanded with a process that has
been advanced by pioneers for years: lost
core technology. The internal design of a
casting can be more complex with
geometric undercuts, which allows for a
previously unknown component design and
a higher degree of functional integration.
For example, cylinder crankcases with closed deck construction can take advantage.
In this process, the water jacket is formed with a salt core that is flushed out later with water
under high pressure. The use of salt cores in a diecasting machine does not pose any
problems since, in contrast to sand cores, they are not abrasive and do not cause any wear.
This is how components from gravity and sand diecasting can be substituted and produced
even more economically with pressure diecasting: pressure die castings are near net-shape
and require fewer post-processing steps. Another advantage of the lost core technology is the
excellent quality of the surface of the cast wall by the salt core, comparable to the roughness
of a diecast component. Lost core is particularly well-suited for manufacturing components
for guiding flowing media, such as water and oil.
Aluminum castings with salt recesses demonstrate very little flow resistance.
When the salt core that determines the internal shape of the component is created, the
appropriate salt solution and process parameters play a crucial role. This guarantees the
stability of the core while making it possible to extract the core subsequently. The diecasting
machine manufacturer becomes the technology partner who supports customers throughout
the entire process, from the initial idea to the production stage, and from component design
for the salt core application to the die and salt core concept in the die casting process.
Keyword: Improving the Efficient Use of Resources
Special attention must be paid to the use of energy and materials during diecasting. The die
and the gating system play a crucial role here. The melting and holding processes alone use
between 50 and 70 percent of the energy required for the entire process. A lot of energy is
consumed initially to melt and overheat the metal to then solidify it in the die shortly
afterwards and cool and extract the casting. The die temperature control concept plays a
critical role in determining the cooling time and, consequently, the cycle time of the casting
process. The classic surface cooling by spraying with water-soluble die releasing agents uses
up to 50% of the entire cycle—and the same in terms of energy and resources.
BULETIN - APLINDO No.41/2014
31
In turn, the design of the shot system is critical for the amount of material used. Thin-walled
castings use the greatest portion of material for the gating proportionally. The material must
be returned and melted down again, which results in additional use of energy and, at the same
time, loss of material due to slagging. Cost-effectiveness demands sophisticated gating
concepts that make it possible to substantially reduce the amount of returns. Consistent
optimizing at an early stage of the concept is key to sustainable, economic success. More
precise and faster filling and solidifying simulations are created to find the right gating,
ventilating and cooling systems. These methods will grow in importance along with the
practical experience of the caster. In addition to the material and its solidification and casting
properties, post-processing, thermal treatment and logistics of the components are also taken
into consideration for the overall analysis. Knowledge of the individual process steps and
how they affect costs and function should be learned through well-founded training. The only
way to prevent costly mistakes is to have well-trained experts.
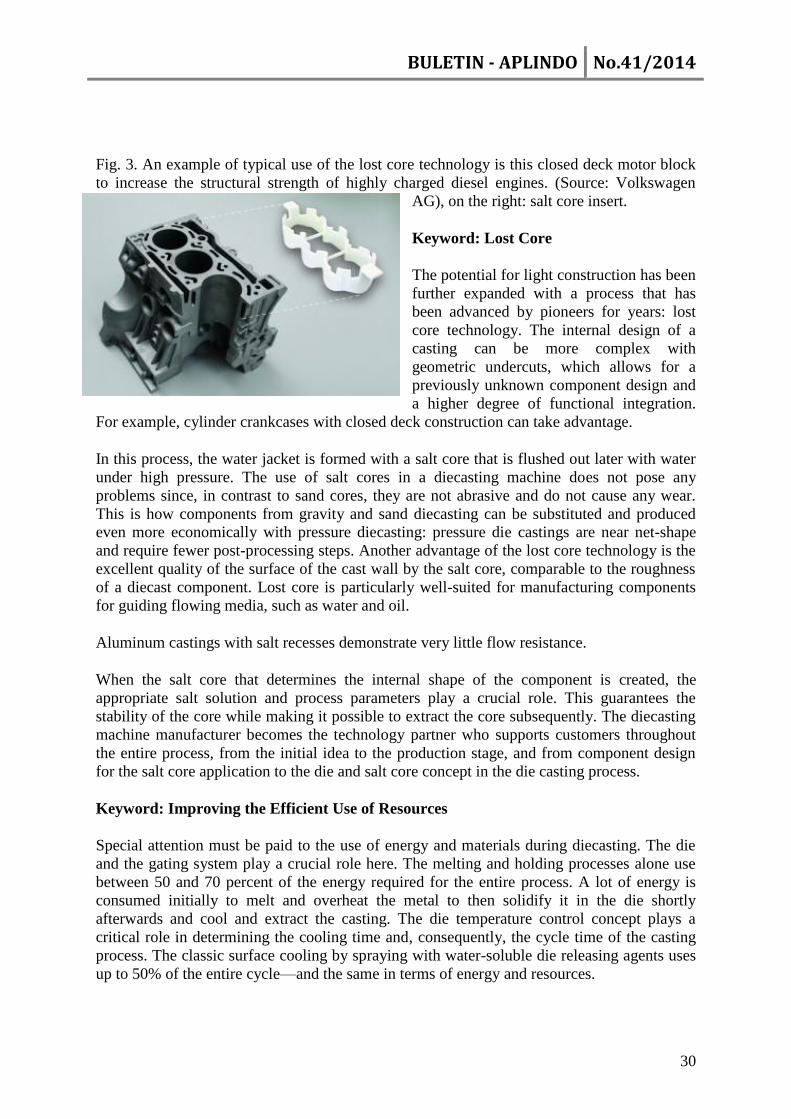
Fig. 4. Tools such as Bühler’s «Event Analyzer» support foundries in their strategic optimization of the OEE
(Overall Equipment Efficiency). The process data from the die casting machine are analyzed, statistically
evaluated and made available to the user as well-founded analyses.
Keyword: Increasing Productivity
The best indicator of the productivity of a diecasting cell are uptime and the efficiency of the
die casting process, i.e. the number of castings produced per unit of time. However, how can
we measure this as objectively as possible? The OEE (Overall Equipment Efficiency) method
of measurement was recently recommended throughout the industri and compares the
theoretical output capacity and actual capacity of the plant. Of particular interest is the fact
that this method of calculation includes the performance of the entire diecasting cell, i.e. the
diecasting machine and peripherals, while taking into account the factors of time, velocity
and quality in a meaningful and reliable manner. The reliability and uptime of individual
components is therefore less important for the output capacity of the diecasting cell. It is
BULETIN - APLINDO No.41/2014
32
much more determined by the weakest link and the interaction of the individual components
and sub-processes of the production chain. A clear connection between all components that
are relevant to the process is the key to uninterrupted and cost-efficient production.
The cell control system of current diecasting machines integrates all the activities of the
system peripherals throughout the process in monitoring and documenting the process.
Interfaces to higher level systems make it possible to collect, analyze and safeguard all the
data in a central location over the long term. Furthermore, they support the operator with a
sophisticated diagnosis system in optimizing the entire diecasting process and, therefore, the
OEE. The control system logs important information regarding the operating status of the
machine and its peripheral equipment, and any alarms that may have been sounded.
These logs should then be used actively for continuous improvement of the process and for
understanding the most common sources of error. Using specialized software packages, it is
possible to evaluate the data as needed. Downtimes can be assigned to corresponding alarms,
and any process errors can be identified. This is a key benefit to a diecasting facility: it can
increase the productivity and quality of its process in a targeted manner while improving
profitability.
The challenges of the future for diecasting can be met with new innovative concepts and
consistent implementation, along with existing expertise. These challenges are a result of
requirements for weight reduction, expanded functionality of components and improved
resource and cost efficiency of the castings to be produced. Machine concepts and
technologies continuously are being improved. However, as diecasters are confronted with
changing processing conditions, they need to rethink how they operate. In order to
manufacture components of the highest quality in a cost-efficient manner, all measures must
be coordinated individually to meet the different requirements of the component to be
produced and the particular production process.
BULETIN - APLINDO No.41/2014
33
Keys to Success in Semi-Permanent Mold
Casting
Developing a successful, repeatable, reliable process for pouring aluminum into a permanent
mold is no simple task. The many variables include metal and mold temperatures, shrink
factors, mold coatings, casting cycle times and melt quality. Considering the numerous
factors that influence quality and quantity, introducing sand cores to permanent molds only
complicates matters.
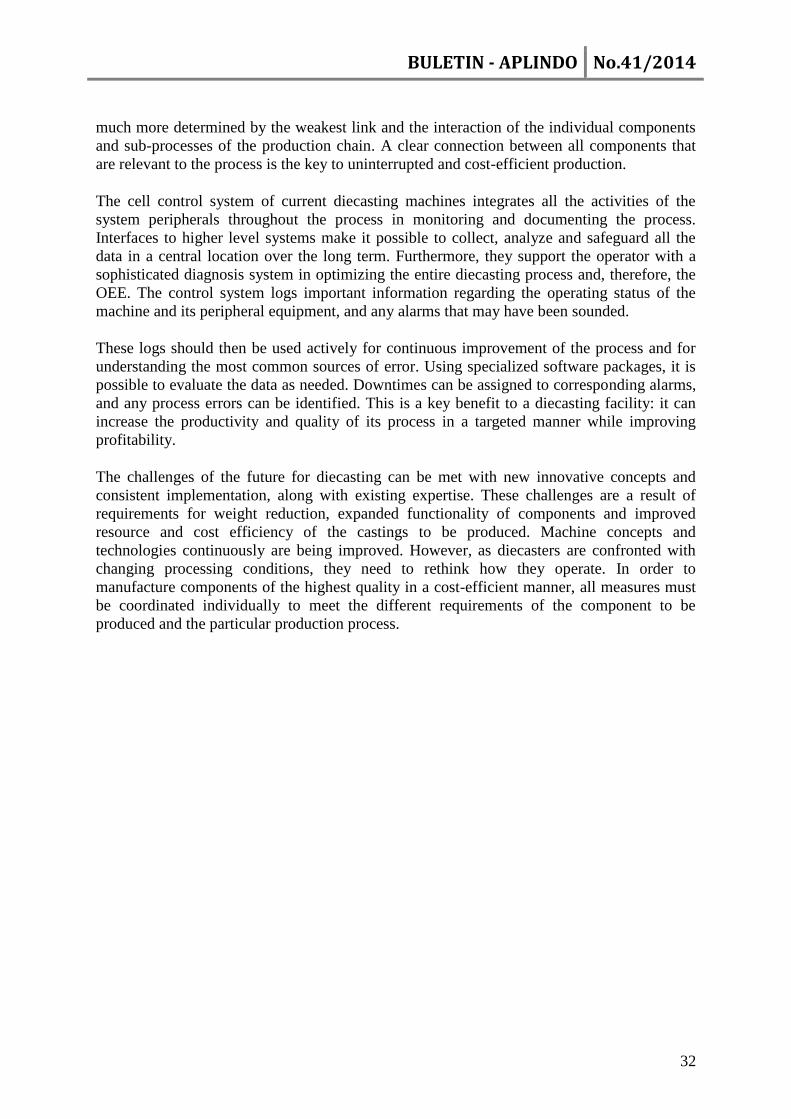
Figs. 1a-b: A metal ball detent pin (right) and bushing can help lift and set heavy cores (left).
Beyond the obvious issues of cost and binder material, a sand core can slow the heat transfer
(and extend solidification time for the casting), change shrinkage factors for the casting,
introduce potential core coatings and require additional venting for gases in semi-permanent
molds—so-called because of the disposable core. Additional issues arise in handling cores,
such as trimming, insertion and removal from the metal mold. Sand cores also require added
tooling, which includes validation and maintenance. The corebox itself is only one concern.
Tooling includes trimming methods, c ore assembly fixtures, transport materials, material
handling components and verification fixtures.
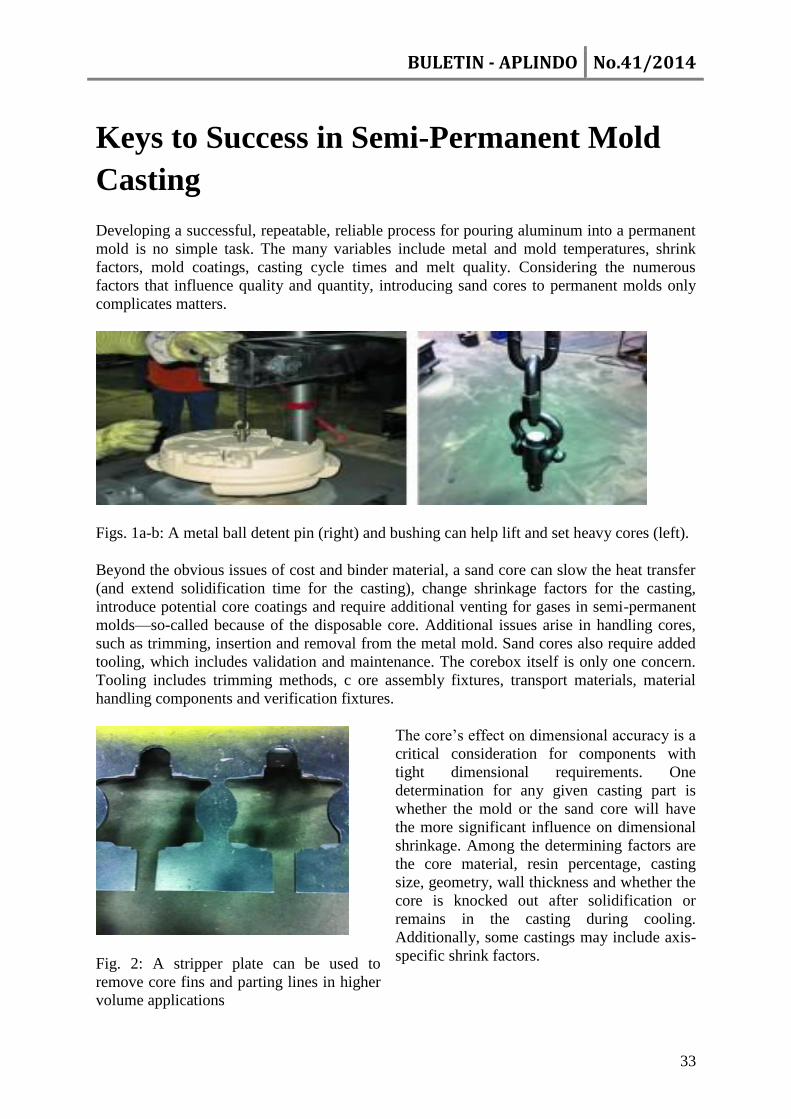
Fig. 2: A stripper plate can be used to
remove core fins and parting lines in higher
volume applications
The core’s effect on dimensional accuracy is a
critical consideration for components with
tight dimensional requirements. One
determination for any given casting part is
whether the mold or the sand core will have
the more significant influence on dimensional
shrinkage. Among the determining factors are
the core material, resin percentage, casting
size, geometry, wall thickness and whether the
core is knocked out after solidification or
remains in the casting during cooling.
Additionally, some castings may include axis-
specific shrink factors.
BULETIN - APLINDO No.41/2014
34
Gas and Venting
All sand cores generate gas due to binder decomposition when contacting molten metal; the
amount depends on the binder system and coating. Various core binders not only generate
different amounts of gas, but also show different gas evolution profiles (i.e., when and at
what rate gas is released). The gas amount and its evolution rate are affected by binder type,
melt temperature, core geometry and processing conditions. Binders that generate more gas
need increased venting—in total number and/or size—to allow for proper gassing of the mold
cavity. Vents should be placed to ease cleaning of core gas residue. Engineers also must
determine if the mold requires active or passive gas venting, that is, if the mold design and
filling pattern will push the gas out naturally or a more aggressive vacuum assist is necessary.
Gas evolution also can correlate with condensation in the mold cavity.
Core Handling and Placement
Handling sand cores and placing them into a hot metal mold can be sources of trouble. Some
practical suggestions include:
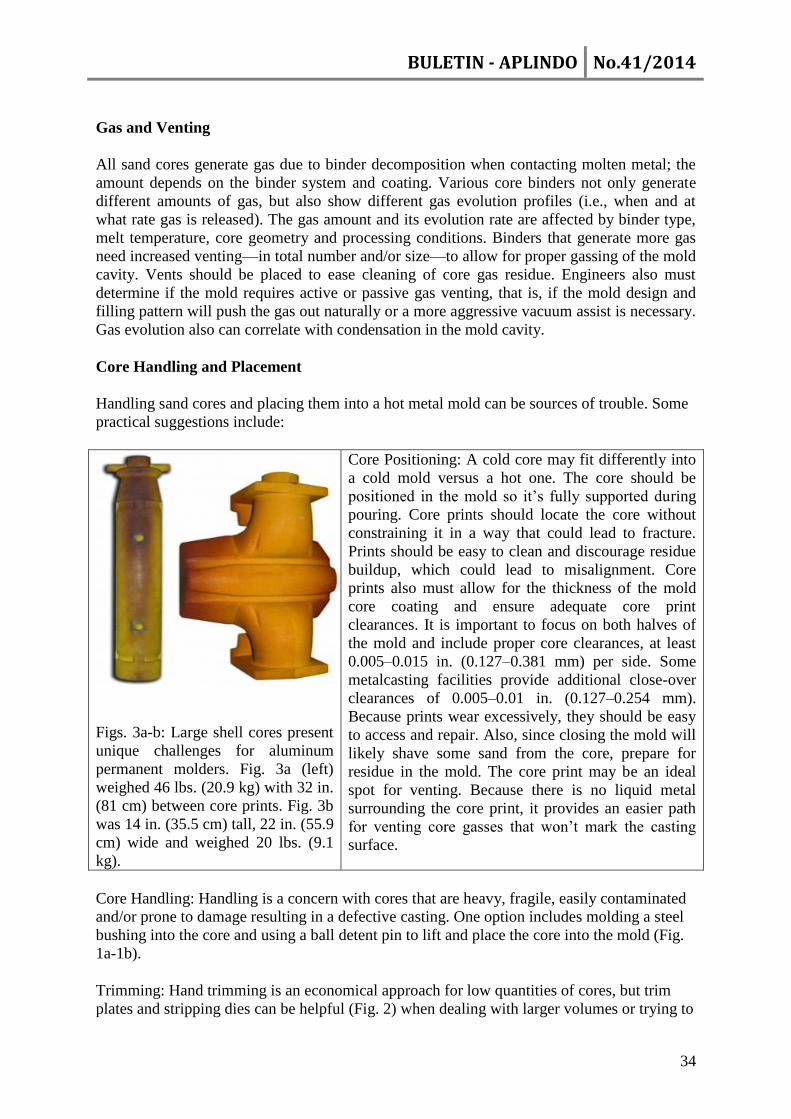
Figs. 3a-b: Large shell cores present
unique challenges for aluminum
permanent molders. Fig. 3a (left)
weighed 46 lbs. (20.9 kg) with 32 in.
(81 cm) between core prints. Fig. 3b
was 14 in. (35.5 cm) tall, 22 in. (55.9
cm) wide and weighed 20 lbs. (9.1
kg).
Core Positioning: A cold core may fit differently into
a cold mold versus a hot one. The core should be
positioned in the mold so it’s fully supported during
pouring. Core prints should locate the core without
constraining it in a way that could lead to fracture.
Prints should be easy to clean and discourage residue
buildup, which could lead to misalignment. Core
prints also must allow for the thickness of the mold
core coating and ensure adequate core print
clearances. It is important to focus on both halves of
the mold and include proper core clearances, at least
0.005–0.015 in. (0.127–0.381 mm) per side. Some
metalcasting facilities provide additional close-over
clearances of 0.005–0.01 in. (0.127–0.254 mm).
Because prints wear excessively, they should be easy
to access and repair. Also, since closing the mold will
likely shave some sand from the core, prepare for
residue in the mold. The core print may be an ideal
spot for venting. Because there is no liquid metal
surrounding the core print, it provides an easier path
for venting core gasses that won’t mark the casting
surface.
Core Handling: Handling is a concern with cores that are heavy, fragile, easily contaminated
and/or prone to damage resulting in a defective casting. One option includes molding a steel
bushing into the core and using a ball detent pin to lift and place the core into the mold (Fig.
1a-1b).
Trimming: Hand trimming is an economical approach for low quantities of cores, but trim
plates and stripping dies can be helpful (Fig. 2) when dealing with larger volumes or trying to
BULETIN - APLINDO No.41/2014
35
limit hand trimming variability. Automation, including CNC machines and robotics, is
another viable option for higher volume cores.
Core Coating: The first consideration is to determine if a coating is needed, with the surface
finish of the casting around the core the essential factor. Coatings usually are added in areas
that require a smoother casting surface finish, or to prevent molten metal penetration issues
such as erosion, veining or burn-in-type defects. Coating also can help direct the core gas
toward vents.
Core Removal: How the core will be removed from the casting and how soon after
solidification can affect casting dimensions. Most metalcasting facilities use a combination of
vibration, abrasion (e.g., hammers, drills, blasting) and bake-out ovens. Knockout is faster
and allows for quicker inspection times. Shot blasting removes final residues after knockout.
Large Shell Cores
Large shell cores—those weighing more than 10 lbs. (4.54 kg), longer than 24 in. (61 cm) or
with a length-to-diameter ratio greater than four (Figs. 3a-3b)—present a special set of
challenges, including the potential for core breakage, cracking, distortion and gas-related
porosity. When a core is damaged, the casting must undergo excessive cleaning room
operations, which can increase costs significantly, or be scrapped entirely. Such damage can
be caused by core and molten metal issues such as the pressure of the molten metal on the
core, insufficient core strength, excessive metal temperature, thermal shock or mold-related
issues like excessively tight core prints. Insufficient shell core curing or improper venting
will lead to gas porosity. A majority of issues relating to large shell cores can be resolved
with proper engineering controls and continual process review.
Here are a few basic steps to deal with large shell cores:
Core and Mold Alignment: Maintain proper mold and machine alignment by minimizing
contact points in core prints. Establish a formal preventative maintenance program on all
permanent mold machines. Use shell core cooling fixtures to maintain dimensional accuracy.
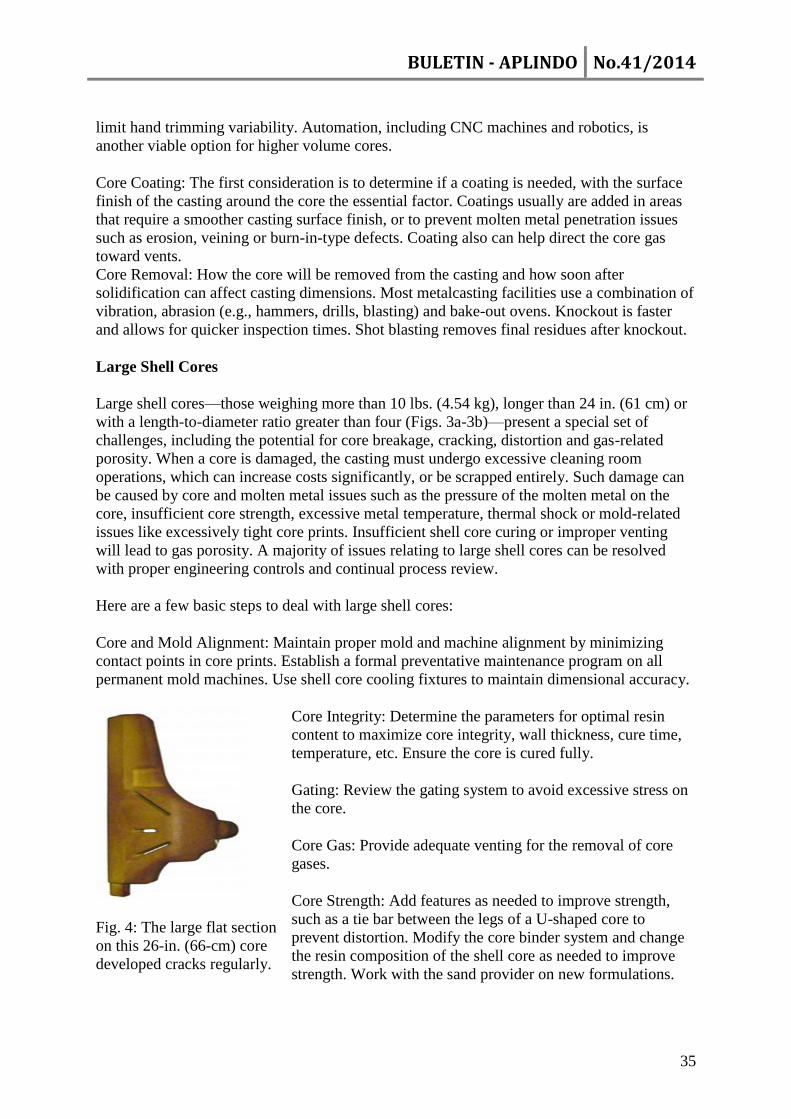
Fig. 4: The large flat section
on this 26-in. (66-cm) core
developed cracks regularly.
Core Integrity: Determine the parameters for optimal resin
content to maximize core integrity, wall thickness, cure time,
temperature, etc. Ensure the core is cured fully.
Gating: Review the gating system to avoid excessive stress on
the core.
Core Gas: Provide adequate venting for the removal of core
gases.
Core Strength: Add features as needed to improve strength,
such as a tie bar between the legs of a U-shaped core to
prevent distortion. Modify the core binder system and change
the resin composition of the shell core as needed to improve
strength. Work with the sand provider on new formulations.

BULETIN - APLINDO No.41/2014
36
Even after implementing these suggestions, large shell cores can remain difficult to use in
permanent mold applications. For example, at Wisconsin Aluminum Foundry Co. (WAFCO),
Manitowoc, Wis., the large cylindrical core in Figure 3a failed at a 75% rate due to a number
of problems. Engineers filled the 46-lb. (20.87-kg) shell core with air-set sand to produce
castings, but this process increased both core weight and knockout costs. Similarly, the core
in Figure 4, at nearly 26 x 6 in. (66.7 x 15.2 cm), featured a large flat section that developed
cracks regularly. While not leading to outright failure, as in the cylindrical core, it required
additional inspection to verify the surface finish in the cored casting cavity and extra cleaning
room labor to remove flashing caused by broken and cracked cores.
WAFCO continues to minimize variation in the core and molding process by working with
suppliers to modify sand recipes to improve core integrity, discussing necessary core support
prints with clients and avoiding new high risk jobs based on experience. Though networking
with other metalcasting facilities is helpful in learning techniques to overcome challenges,
large shell cores remain a complex endeavor.
BULETIN - APLINDO No.41/2014
37
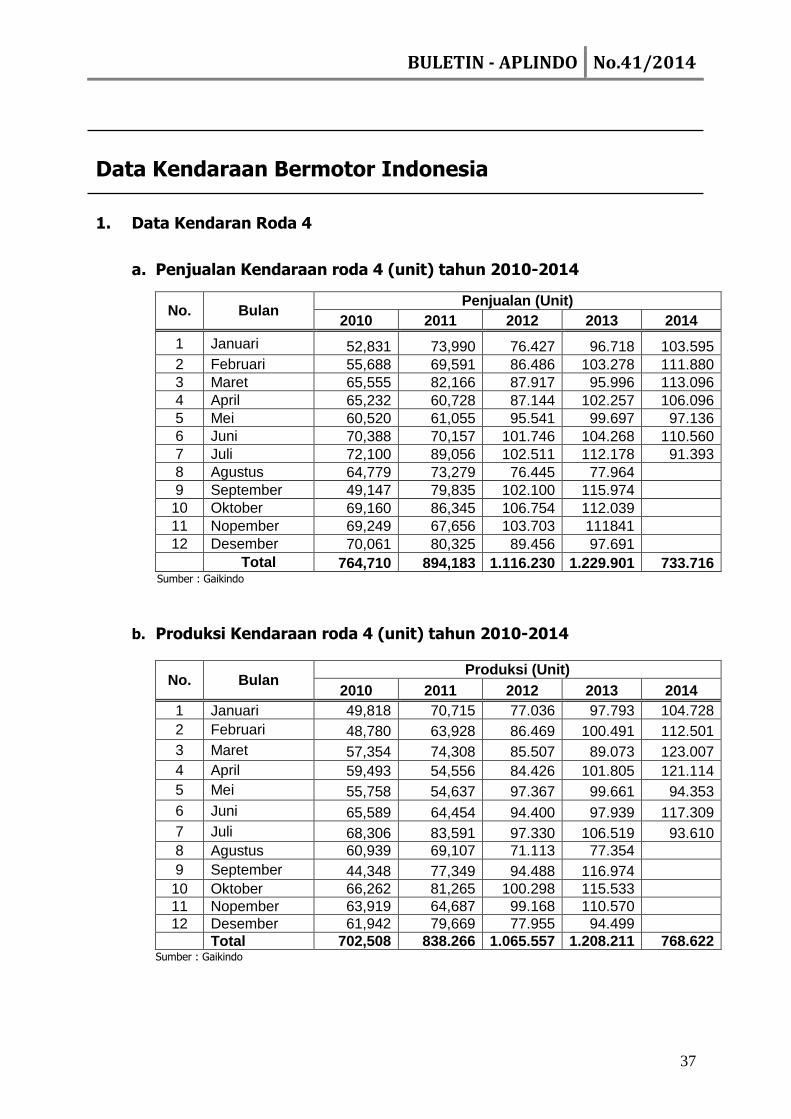
Data Kendaraan Bermotor Indonesia
1. Data Kendaran Roda 4
a. Penjualan Kendaraan roda 4 (unit) tahun 2010-2014
No. Bulan Penjualan (Unit)
2010 2011 2012 2013 2014
1 Januari 52,831 73,990 76.427 96.718 103.595
2 Februari 55,688 69,591 86.486 103.278 111.880
3 Maret 65,555 82,166 87.917 95.996 113.096
4 April 65,232 60,728 87.144 102.257 106.096
5 Mei 60,520 61,055 95.541 99.697 97.136
6 Juni 70,388 70,157 101.746 104.268 110.560
7 Juli 72,100 89,056 102.511 112.178 91.393
8 Agustus 64,779 73,279 76.445 77.964 9 September 49,147 79,835 102.100 115.974 10 Oktober 69,160 86,345 106.754 112.039 11 Nopember 69,249 67,656 103.703 111841 12 Desember 70,061 80,325 89.456 97.691 Total 764,710 894,183 1.116.230 1.229.901 733.716
Sumber : Gaikindo
b. Produksi Kendaraan roda 4 (unit) tahun 2010-2014
No. Bulan Produksi (Unit)
2010 2011 2012 2013 2014
1 Januari 49,818 70,715 77.036 97.793 104.728
2 Februari 48,780 63,928 86.469 100.491 112.501
3 Maret 57,354 74,308 85.507 89.073 123.007
4 April 59,493 54,556 84.426 101.805 121.114
5 Mei 55,758 54,637 97.367 99.661 94.353
6 Juni 65,589 64,454 94.400 97.939 117.309
7 Juli 68,306 83,591 97.330 106.519 93.610
8 Agustus 60,939 69,107 71.113 77.354 9 September 44,348 77,349 94.488 116.974 10 Oktober 66,262 81,265 100.298 115.533 11 Nopember 63,919 64,687 99.168 110.570 12 Desember 61,942 79,669 77.955 94.499 Total 702,508 838.266 1.065.557 1.208.211 768.622
Sumber : Gaikindo
BULETIN - APLINDO No.41/2014
38
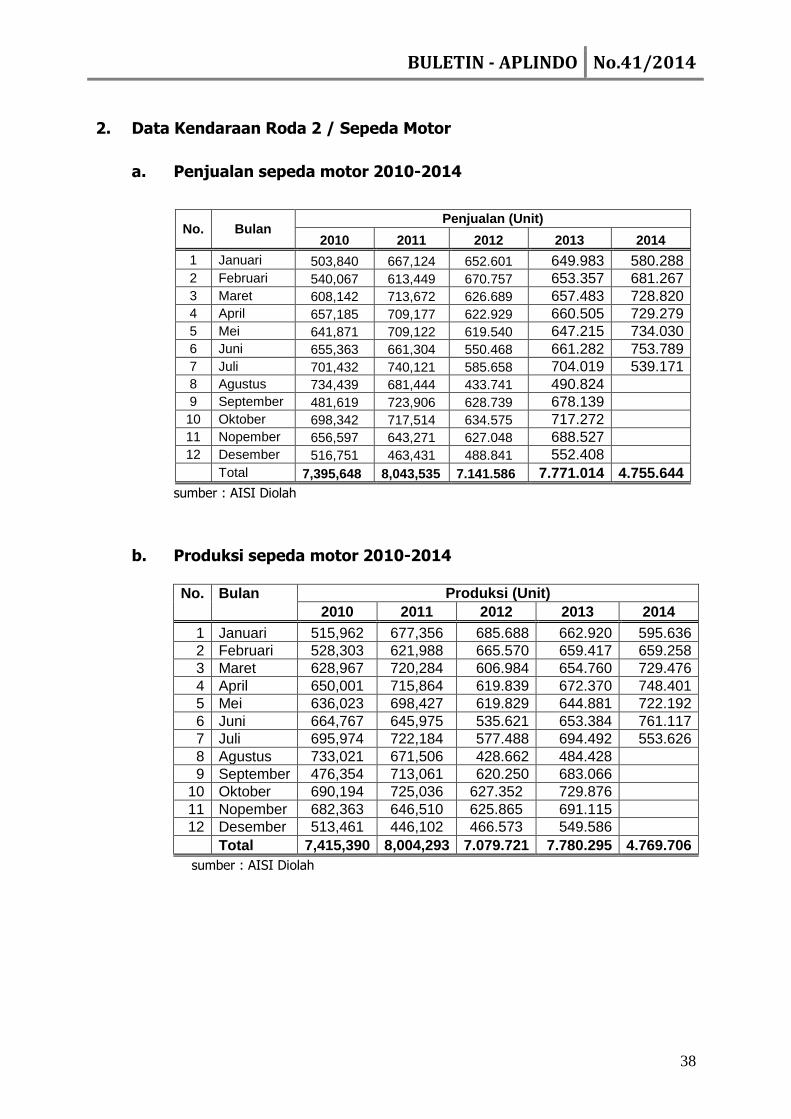
2. Data Kendaraan Roda 2 / Sepeda Motor
a. Penjualan sepeda motor 2010-2014
No. Bulan Penjualan (Unit)
2010 2011 2012 2013 2014
1 Januari 503,840 667,124 652.601 649.983 580.288 2 Februari 540,067 613,449 670.757 653.357 681.267 3 Maret 608,142 713,672 626.689 657.483 728.820 4 April 657,185 709,177 622.929 660.505 729.279 5 Mei 641,871 709,122 619.540 647.215 734.030 6 Juni 655,363 661,304 550.468 661.282 753.789 7 Juli 701,432 740,121 585.658 704.019 539.171 8 Agustus 734,439 681,444 433.741 490.824
9 September 481,619 723,906 628.739 678.139 10 Oktober 698,342 717,514 634.575 717.272 11 Nopember 656,597 643,271 627.048 688.527 12 Desember 516,751 463,431 488.841 552.408 Total 7,395,648 8,043,535 7.141.586 7.771.014 4.755.644
sumber : AISI Diolah
b. Produksi sepeda motor 2010-2014
No. Bulan Produksi (Unit)
2010 2011 2012 2013 2014
1 Januari 515,962 677,356 685.688 662.920 595.636
2 Februari 528,303 621,988 665.570 659.417 659.258
3 Maret 628,967 720,284 606.984 654.760 729.476
4 April 650,001 715,864 619.839 672.370 748.401
5 Mei 636,023 698,427 619.829 644.881 722.192
6 Juni 664,767 645,975 535.621 653.384 761.117
7 Juli 695,974 722,184 577.488 694.492 553.626
8 Agustus 733,021 671,506 428.662 484.428 9 September 476,354 713,061 620.250 683.066 10 Oktober 690,194 725,036 627.352 729.876 11 Nopember 682,363 646,510 625.865 691.115 12 Desember 513,461 446,102 466.573 549.586 Total 7,415,390 8,004,293 7.079.721 7.780.295 4.769.706
sumber : AISI Diolah
BULETIN - APLINDO No.41/2014
39
Informasi Umum & Pameran
A. Web site Pemerintah yang dapat diakses :
1. www.setneg.go.id (Sekretariat Negara)
2. www.kemenperin.go.id (Kementerian Perindustrian)
3. www.kemenkeu.go.id (Kementerian Keuangan)
4. www.kemendag.go.id (Kementerian Perdagangan)
5. www.beacukai.go.id (Direktorat Bea & Cukai, Kementerian Keuangan)
6. www.esdm.go.id (Kementerian ESDM)
7. www.bkpm.go.id (Badan Koordinasi Penanaman Modal)
8. www.bps.go.id (Biro Pusat Statistik)
B. Web site Asosiasi Industri Pengecoran Logam Indonesia (APLINDO)
Kini APLINDO telah tersedia Web site sendiri :
www.aplindo.web.id, mohon dukungan partisipasi aktif Bapak-bapak sekalian dan
diharapkan saran, masukan, permasalahan dan perkembangan yang terjadi di industri
pengecoran logam di Indonesia. Saran dan masukan anda dapat berupa artikel ke
alamat [email protected]
C. Web site Himpunan Ahli Pengecoran Logam Indonesia
Kini HAPLI telah tersedia Web-site sendiri :
http://hapli.wordpress.com/ , mohon dukungan partisipasi aktif Bapak-bapak
sekalian dan diharapkan saran serta masukan anda berupa artikel sesuai page yang
tersedia dalam format *.doc ke alamat [email protected] untuk
diupload, ataupun komentar langsung anda pada Blog.
D. Pameran dan Seminar
1. 11 Sep 2014 - 13 Sep 2014
Ankiros/Annofer/Turkcast 2014
Tuyap Centre, Istambul
www.ankiros.com/
2. Korea Metal Week 2014: 16 Sep 2014 - 19 Sep 2014
Kintex, South Korea
As the specialised leading international trade fair in Korea, Korea Metal Week provides the best
BULETIN - APLINDO No.41/2014
40
marketplace with the latest technology for suppliers, manufacturers and traders in the metal and
machinery industries around the world.
www.korea-metal.com
3. 54th International Foundry Conference - Slovenia: 17 Sep 2014 - 19 Sep 2014
Portorož, Slovenia
Contact: Mirjam Jan-Blažic, Slovenian Foundrymen Society, email: [email protected]
www.drustvo-livarjev.si
4. Fundiexpo 2014: 24 Sep 2014 - 26 Sep 2014
Cintermex Convention Centre
Congress and international exhibition.
http://www.fundiexpo2014.com/en/
5. International Foundry Forum: 26 Sep 2014 - 27 Sep 2014
Venice, Italy
www.international-foundry-forum.org
6. Midest 2014: 4 Nov 2014 - 7 Nov 2014
Paris Nord Villepinte - France
MIDEST is a key platform for international suppliers of industrial subcontracting, offering
manufacturers, component suppliers and assemblers the chance for face to face meetings with
suppliers of solutions in the fields of metals, plastics, electronics or industri services.
http://www.midest.com/site/GB,C6374,I6374.htm
7. Indometal 2014: 11 – 13 Des 2014
A robust intergrated platform for the metal and steel industries
JIEXPO, PRJ Kemayoran Jakarta
For enquiries, please contact : PT. Wahana Kemala Niaga,
telp. +6221.53660804 Fax. +6221.5325587/90
email : [email protected]
http://www.indometal.net
8. 27 Feb 2015 - 1 Mar 2015, FEX 2015
Greater Noida, Gautam Buddh Nager, UP, India
Alongside 63rd Indian Foundry Congress, IFEX 2015 – 11th edition of International Exhibition on
Foundry Technology, Equipment Supplies.
www.ifexindia.com
9. 16-20 June 2015
GIFA, METEC, THERMPROCESS and NEWCAST
Düsseldorf, Germany
Websites: www.gifa.de, www.metec.de, www.thermprocess.de and www.newcast.de.