Embed Size (px)
Citation preview
49Efficient Maintenance of the Japanese Geodetic Datum 2000 Using Crustal Deformation Models – PatchJGD & Semi-Dynamic Datum
Efficient Maintenance of the Japanese Geodetic Datum 2000 Using Crustal Deformation Models – PatchJGD & Semi-Dynamic Datum
Yoshiyuki TANAKA, Hiroaki SAITA, Jun SUGAWARA, Kazumi IWATA, Tomoo TOYODA, Hideaki HIRAI, Tamotsu KAWAGUCHI, Shigeru MATSUZAKA,
Yuki HATANAKA, Mikio TOBITA, Yuki KUROISHI and Tetsuro IMAKIIRE
Abstract
The Geographical Survey Institute published a new geodetic datum (the Japanese Geodetic Datum 2000, JGD2000) in April 2002. The JGD2000 is a static geocentric datum compliant with the International Terrestrial Reference Frame 1994 at the first epoch, January 1997, in which coordinates of control points are unchanged with time. Therefore, in order to keep the datum from becoming distorted, relative coordinate changes of markers due to crustal deformations caused by earthquakes and the steady plate motion must be corrected. So far, the changes induced by earthquakes have been revised with surface displacements detected by actual GPS observations. However, a large earthquake that occurs in a plate boundary such as the 2003 Tokachi-Oki event (M8.0) will cause deformation covering several hundred square kilometers, and resurveying all the relevant control points would be prohibitively expensive. On the other hand, the strain accumulation caused by the steady plate motion has been neglected since public projects have focused on local surveys using small networks (baselines < 10 km). However, this leads to significant positioning errors in the recently introduced Network RTK-GPS which needs larger networks (> 30–100 km). To cope with these two assignments, we develop crustal movement models to obtain coordinate corrections. With these models, we show that (1) an interpolation of observed displacements effectively reproduces co-seismic deformations without dense measurements and (2) the same method is valid for correcting the inter-seismic strain accumulation. For the latter, we show the validity of semi-dynamic datum correction already adopted in New Zealand. Combining these methods with the advanced GPS network enables us to efficiently and effectively maintain the JGD2000 for modern surveys.
1. Introduction – geodetic datum and its errors due to crustal deformation
The Geographical Survey Institute (GSI) has published a geodetic datum based on a geocentric reference system since April 2002. The datum is called the Japanese Geodetic Datum 2000 (JGD2000), which is compliant with the International Terrestrial Reference Frame 1994 (Boucher et al., 1996) at the first epoch, January 1997 (Tsuji and Matsuzaka, 2004). In addition to the release of the JGD2000, GSI has begun to provide RINEX data of GEONET for public surveys (GSI, 2003). The JGD2000, together with this dense GPS network, is expected to serve as a geospatial information infrastructure for the coming information society by expediting the use of the Geographic Information System (GIS) and GPS.
The establishment of the infrastructure has
facilitated the public control point surveys with GPS as originally intended, but has also led to requests that the JGD2000, to which coordinates of those markers refer, be revised as soon as possible when crustal movement deteriorates its relative accuracy. One such crustal movement is that caused by earthquakes. Especially, M8-class earthquakes that occur on plate subduction boundaries produce a regional deformation exceeding a few ppm in horizontal strain. Because this error is not negligible for GPS survey, coordinates of a large number of control points within the region must be corrected. However, this would incur a considerable amount of time and money.
Inter-seismic crustal deformation due to plate subduction also increases relative errors of the JGD2000. The strain accumulation rate averaged over the whole of Japan is 0.2 ppm/year (GSI, 2003). Since 10 years have
Table A5 Agencies and their roles in JARE
Core agency National Institute of Polar Research,
incorporated information systems and research
organization shared by universities
Core agency of JARE, implementation of the
research observation programs, logistic support for
JARE etc.
Ministry of Internal Affairs and
Communications (National Institute of
Information and Communications Technology)
In charge of monitoring of the ionosphere including
aurora
Geographical Survey Institute In charge of GPS observation and other geodetic
surveys including mapping of Antarctica
Meteorological Agency In charge of meteorology such as ozone and
upper-atmosphere observation
Agency for the
Regular
Observation
Programs
Hydrographic and Oceanographic Department,
Japan Coast Guard
In charge of physical and chemical oceanography
such as observing ocean currents and water
temperature, analyzing ocean water, improving
marine charts, and tides such as observing the level
of ocean water
Transport Ministry of Defense Transporting JARE members and supplies by ship
and aircraft
Antarctic Treaty
Notification and
registration of
Antarctic Place
Names
Ministry of Foreign Affairs Dealing with the Antarctic Treaty Consultative
Meeting (ATCM)
Notification and registration of the place names
decided by Headquarters for JARE to the relevant
countries and organizations
Environmental
protection of
Antarctica
Ministry of the Environment Holds jurisdiction over the “Act on Environmental
Protection in Antarctica” and governs the necessary
procedures for sightseeing and visiting in Antarctica
50 Bulletin of the Geographical Survey Institute, Vol.54 March, 2007
elapsed since the original epoch of the JGD2000, the error may have reached approximately 2 ppm. This can be neglected for local surveys with a small network (e.g. baselines < 1–10 km) using total station (TS) and GPS. However, this will not be the case for Network Real-Time Kinematic (RTK-) GPS that uses a large network (> 30–100 km) which has been allowed in public surveys since in 2005. For instance, the relative error amounts to 10 cm for a baseline length of 50 km, thus failing to satisfy the required accuracy for coordinates of reference stations in Network RTK-GPS (1–2 cm).
In this report, we introduce effective methods for correcting the relative errors of the JGD2000 caused by earthquakes and the plate motion by using crustal movement models. First, we outline the GPS observation networks in Japan. Then, we illustrate how to model earthquake-induced deformation and inter-seismic deformation.
2. Observational networks 2.1 Continuous GPS observation network
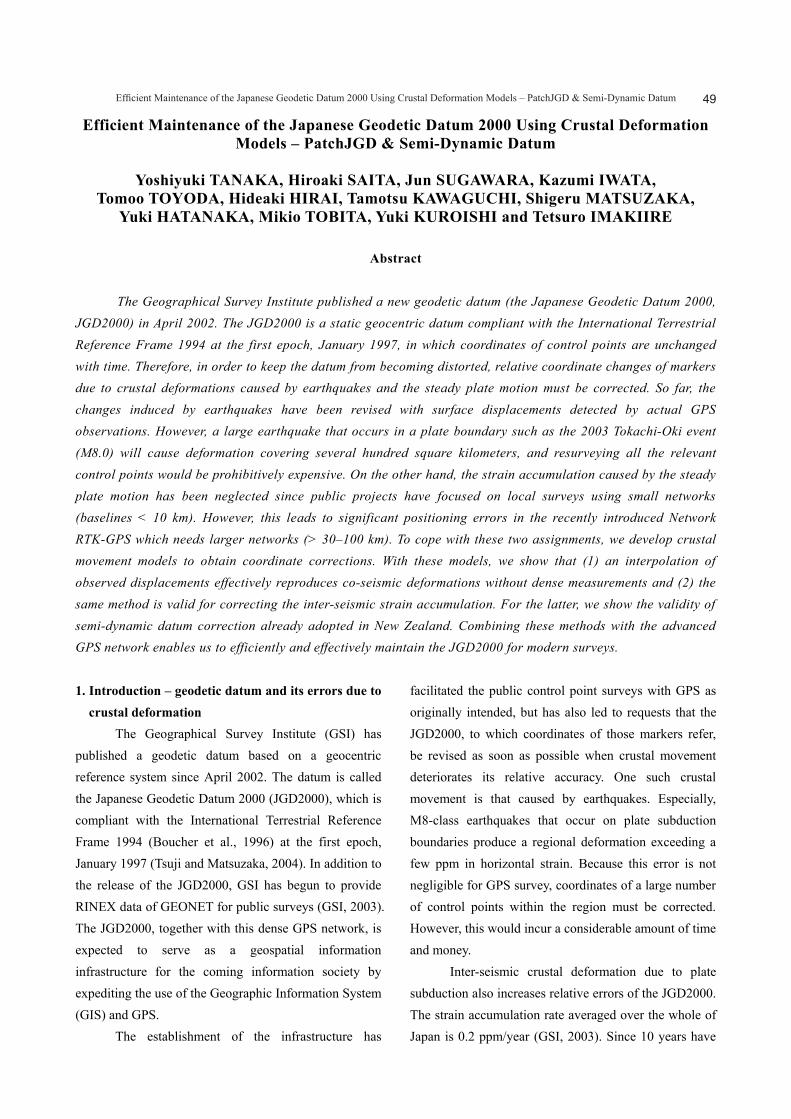
Approximately 1,200 control stations with an average spacing of 25 km are being used to monitor crustal deformation (the GPS Earth Observation Network, GEONET (Hatanaka et al., 2003)) and to provide real-time RINEX data (GSI, 2004). The Bernese software (Hugentobler et al., 2001) routinely calculates the daily coordinates based on ITRF2000 (Boucher et al., 2004). The root mean square of the deviation of the daily baseline vector solutions is approximately 2 mm in the horizontal component and 10 mm in the vertical component (Hatanaka et al., 2005).
2.2 Campaign GPS observation network In order to monitor more detailed crustal
movements that cannot be detected with the continuous GPS stations, campaign observations are repeated at higher-order triangulation points every 5 to 10 years. 2,400 points suitable for GPS survey are selected so that the average interval of observation points together with the continuous GPS stations becomes approximately 10 km (Fig. 1). The campaign observations consist of
multiple sessions of 6-hour simultaneous observation at 3 or 4 triangulation points and continuous GPS stations. GAMIT&GLOBAK software (Massachusetts Institute of Technology and Scripps Institution of Oceanography, 2000) is used for the baseline analyses and combinations of sessions. As a consequence, coordinates of the campaign observation sites are obtained with a precision of 1–2 cm in ITRF2000.
Fig. 1 Distribution of the GPS observation sites for crustal monitoring in Japan
2.3 Other networks In addition to the above backbone networks,
approximately 100,000 triangulation points have been deployed with an average spacing of 1–2 km as the reference for public surveys. The coordinates of these triangulation points were mostly determined by local surveys that used triangulation, electronic distance measurement (EDM), TS and GPS. Recently, direct simultaneous observations with the continuous GPS control stations have been mainly employed to place new markers; averaged precisions of those coordinates are within 10 cm in the horizontal.
On the other hand, municipalities maintain their own control point networks for local surveys, and the number of these public control points exceeds 3 million throughout Japan. The coordinates of these are determined in the same manner as in the surveys of the lower triangulation points, and so have a precision of
51Efficient Maintenance of the Japanese Geodetic Datum 2000 Using Crustal Deformation Models – PatchJGD & Semi-Dynamic Datum
typically 10 cm. In the lower-order public control point surveys with average spacing of less than 500 m, Network RTK-GPS has been also used.
3. Model of earthquake-induced crustal deformation 3.1 Overview
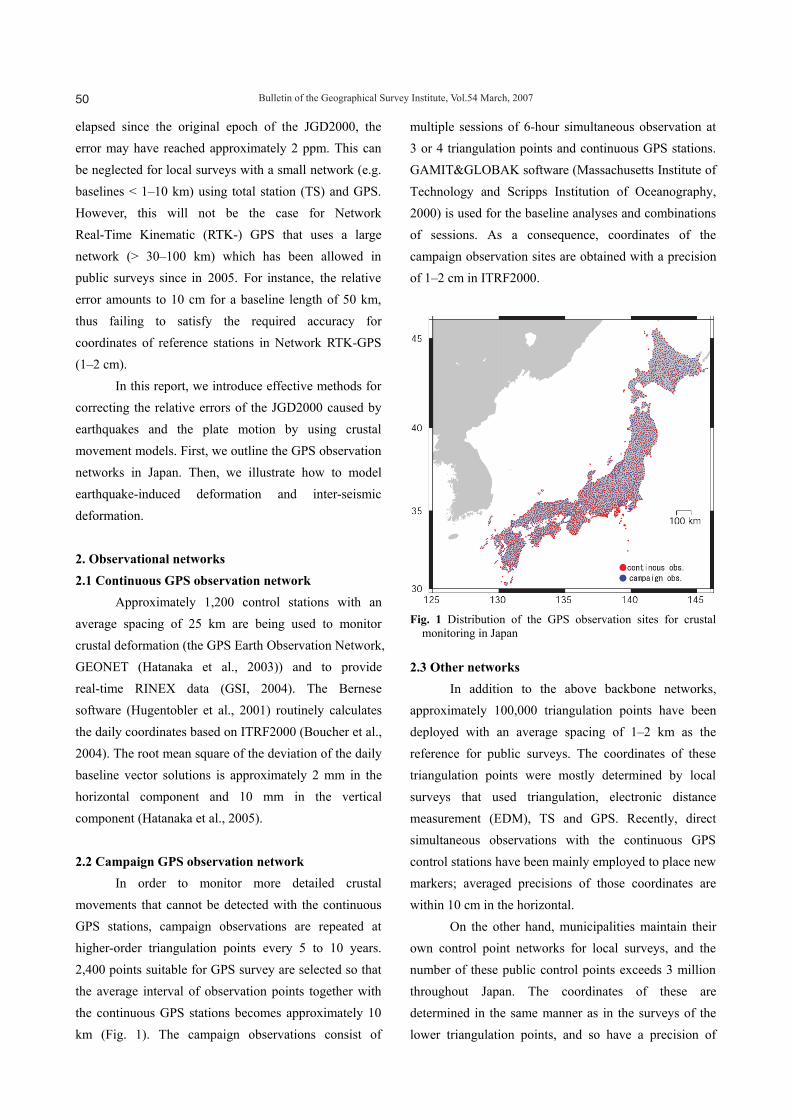
The purpose of modeling earthquake-induced deformation is to reduce the cost and time required to resurvey a large number of control points by replacing the true displacement of the positions by a modeled one. We model a coseismic displacement field by simply interpolating the observed change of coordinates rather than constructing a physical model (e.g. elastic dislocation model) in order to make the most of the dense continuous observation network (Section 3.2).
Fig. 2 The strain variation caused by the 2003 Tokachi-Oki earthquake inferred from the displacement observed with the continuous GPS control stations. The numerical values denote the magnitude of the strain in ppm.
The above method was developed for revising the JGD2000 due to the 2003 Tokachi-Oki earthquake (M8.0). Because earthquakes that had occurred prior to this event in Japan induced only local deformations, we resurveyed all the control points including lower-order triangulation points in the areas with a coseismic strain change of roughly more than 2 ppm. In this event, however, the area in which the strain variation exceeded 2 ppm covered almost the entire southern half of Hokkaido Island (Fig. 2), containing more than 5,500 national control points. Moreover, coordinates of
numerous public control points traced to those points must be corrected. Therefore, in order for users in public surveys to correct the coordinates of many points without difficulty, we developed an interface using a gridded correction parameter and distributed it through the website of GSI (Section 3.3). In the following section, we first describe the model for this Tokachi-Oki event.
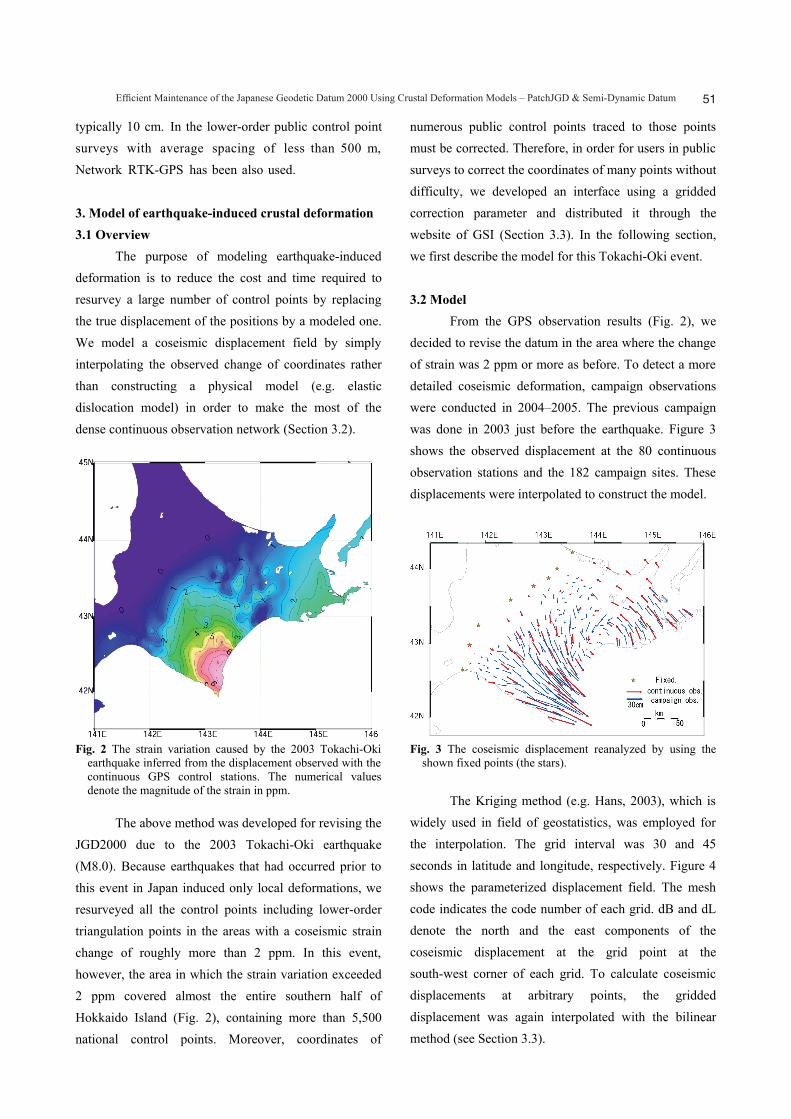
3.2 Model From the GPS observation results (Fig. 2), we
decided to revise the datum in the area where the change of strain was 2 ppm or more as before. To detect a more detailed coseismic deformation, campaign observations were conducted in 2004–2005. The previous campaign was done in 2003 just before the earthquake. Figure 3 shows the observed displacement at the 80 continuous observation stations and the 182 campaign sites. These displacements were interpolated to construct the model.
Fig. 3 The coseismic displacement reanalyzed by using the shown fixed points (the stars).
The Kriging method (e.g. Hans, 2003), which is widely used in field of geostatistics, was employed for the interpolation. The grid interval was 30 and 45 seconds in latitude and longitude, respectively. Figure 4 shows the parameterized displacement field. The mesh code indicates the code number of each grid. dB and dL denote the north and the east components of the coseismic displacement at the grid point at the south-west corner of each grid. To calculate coseismic displacements at arbitrary points, the gridded displacement was again interpolated with the bilinear method (see Section 3.3).
52 Bulletin of the Geographical Survey Institute, Vol.54 March, 2007
Fig. 4 The gridded parameter
The precision of the model was confirmed as follows. First, we checked consistency between the model and the displacement data used for the Kriging interpolation. We calculated the standard deviation of the difference between the inferred and the observed displacement at the 262 observation sites shown in Fig. 3. The standard deviation was sufficiently small (2 mm in both the north and the east components), implying that a consistent model was obtained because the observed displacement was smoothly changing in space.
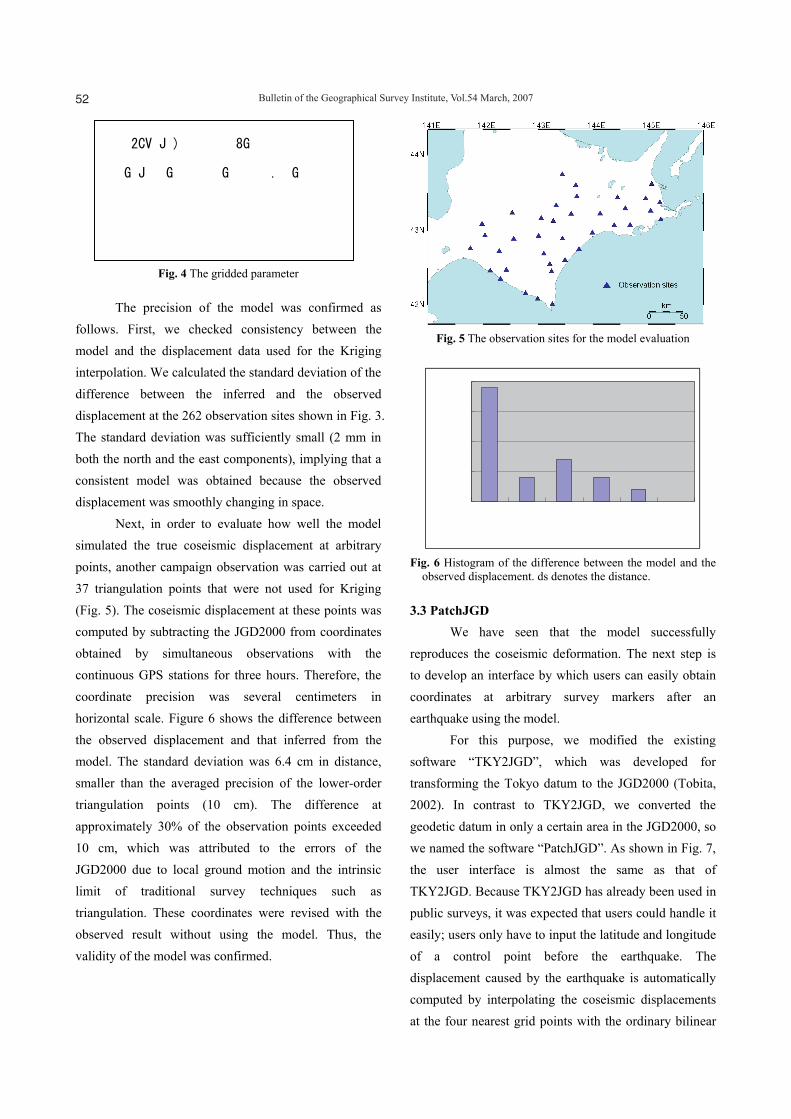
Next, in order to evaluate how well the model simulated the true coseismic displacement at arbitrary points, another campaign observation was carried out at 37 triangulation points that were not used for Kriging (Fig. 5). The coseismic displacement at these points was computed by subtracting the JGD2000 from coordinates obtained by simultaneous observations with the continuous GPS stations for three hours. Therefore, the coordinate precision was several centimeters in horizontal scale. Figure 6 shows the difference between the observed displacement and that inferred from the model. The standard deviation was 6.4 cm in distance, smaller than the averaged precision of the lower-order triangulation points (10 cm). The difference at approximately 30% of the observation points exceeded 10 cm, which was attributed to the errors of the JGD2000 due to local ground motion and the intrinsic limit of traditional survey techniques such as triangulation. These coordinates were revised with the observed result without using the model. Thus, the validity of the model was confirmed.
Fig. 5 The observation sites for the model evaluation
0
5
10
15
20
0-5 5-10 10-15 15-20 20-25 25-
ds (cm)
num
ber
Fig. 6 Histogram of the difference between the model and the observed displacement. ds denotes the distance.
3.3 PatchJGD We have seen that the model successfully
reproduces the coseismic deformation. The next step is to develop an interface by which users can easily obtain coordinates at arbitrary survey markers after an earthquake using the model.
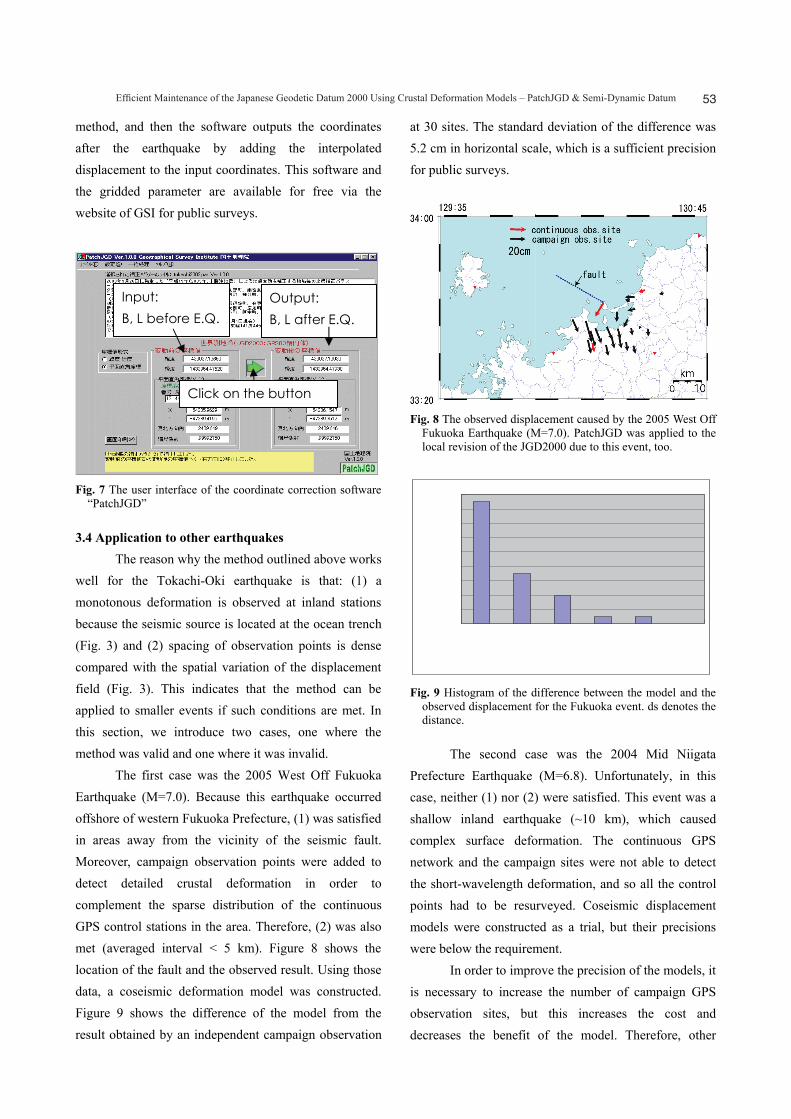
For this purpose, we modified the existing software “TKY2JGD”, which was developed for transforming the Tokyo datum to the JGD2000 (Tobita, 2002). In contrast to TKY2JGD, we converted the geodetic datum in only a certain area in the JGD2000, so we named the software “PatchJGD”. As shown in Fig. 7, the user interface is almost the same as that of TKY2JGD. Because TKY2JGD has already been used in public surveys, it was expected that users could handle it easily; users only have to input the latitude and longitude of a control point before the earthquake. The displacement caused by the earthquake is automatically computed by interpolating the coseismic displacements at the four nearest grid points with the ordinary bilinear
for PatchJGD Ver.1.0.0 001 MeshCode dB(sec) dL(sec) 62436280 -0.00928 0.01573 62436281 -0.00945 0.01594 62436282 -0.00958 0.01622 62436198 -0.00882 0.01575
53Efficient Maintenance of the Japanese Geodetic Datum 2000 Using Crustal Deformation Models – PatchJGD & Semi-Dynamic Datum
method, and then the software outputs the coordinates after the earthquake by adding the interpolated displacement to the input coordinates. This software and the gridded parameter are available for free via the website of GSI for public surveys.
Fig. 7 The user interface of the coordinate correction software “PatchJGD”
3.4 Application to other earthquakes The reason why the method outlined above works
well for the Tokachi-Oki earthquake is that: (1) a monotonous deformation is observed at inland stations because the seismic source is located at the ocean trench (Fig. 3) and (2) spacing of observation points is dense compared with the spatial variation of the displacement field (Fig. 3). This indicates that the method can be applied to smaller events if such conditions are met. In this section, we introduce two cases, one where the method was valid and one where it was invalid.
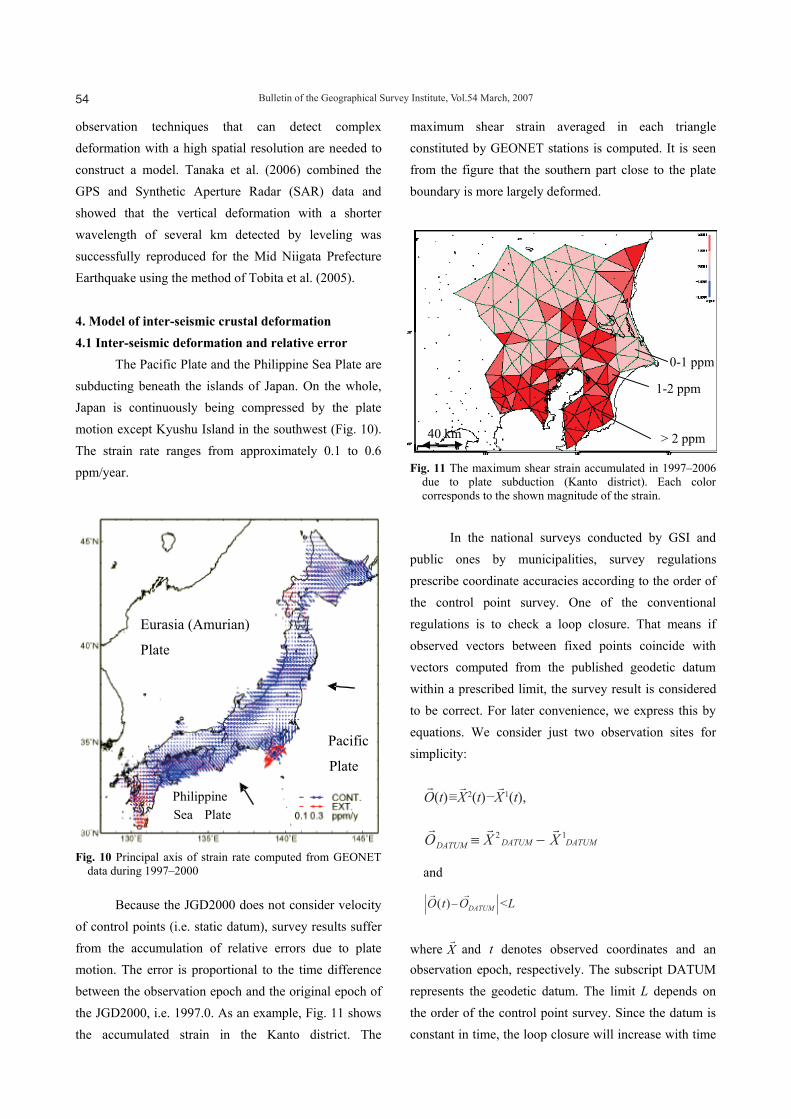
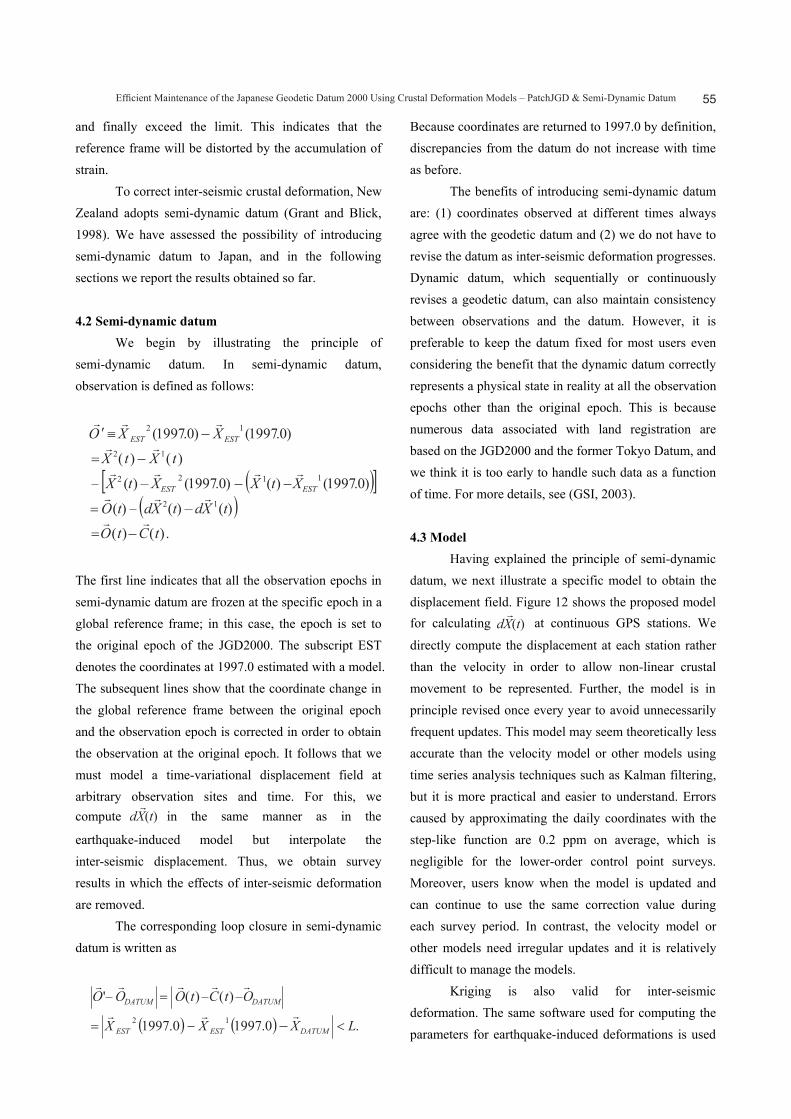
The first case was the 2005 West Off Fukuoka Earthquake (M=7.0). Because this earthquake occurred offshore of western Fukuoka Prefecture, (1) was satisfied in areas away from the vicinity of the seismic fault. Moreover, campaign observation points were added to detect detailed crustal deformation in order to complement the sparse distribution of the continuous GPS control stations in the area. Therefore, (2) was also met (averaged interval < 5 km). Figure 8 shows the location of the fault and the observed result. Using those data, a coseismic deformation model was constructed. Figure 9 shows the difference of the model from the result obtained by an independent campaign observation
at 30 sites. The standard deviation of the difference was 5.2 cm in horizontal scale, which is a sufficient precision for public surveys.
Fig. 8 The observed displacement caused by the 2005 West Off Fukuoka Earthquake (M=7.0). PatchJGD was applied to the local revision of the JGD2000 due to this event, too.
02468
1012141618
0-5 5-10 10-15 15-20 20-25 25-
ds (cm)
num
ber
Fig. 9 Histogram of the difference between the model and the observed displacement for the Fukuoka event. ds denotes the distance.
The second case was the 2004 Mid Niigata Prefecture Earthquake (M=6.8). Unfortunately, in this case, neither (1) nor (2) were satisfied. This event was a shallow inland earthquake (~10 km), which caused complex surface deformation. The continuous GPS network and the campaign sites were not able to detect the short-wavelength deformation, and so all the control points had to be resurveyed. Coseismic displacement models were constructed as a trial, but their precisions were below the requirement.
In order to improve the precision of the models, it is necessary to increase the number of campaign GPS observation sites, but this increases the cost and decreases the benefit of the model. Therefore, other
Input: B, L before E.Q.
Output: B, L after E.Q.
Click on the button
54 Bulletin of the Geographical Survey Institute, Vol.54 March, 2007
observation techniques that can detect complex deformation with a high spatial resolution are needed to construct a model. Tanaka et al. (2006) combined the GPS and Synthetic Aperture Radar (SAR) data and showed that the vertical deformation with a shorter wavelength of several km detected by leveling was successfully reproduced for the Mid Niigata Prefecture Earthquake using the method of Tobita et al. (2005).
4. Model of inter-seismic crustal deformation 4.1 Inter-seismic deformation and relative error
The Pacific Plate and the Philippine Sea Plate are subducting beneath the islands of Japan. On the whole, Japan is continuously being compressed by the plate motion except Kyushu Island in the southwest (Fig. 10). The strain rate ranges from approximately 0.1 to 0.6 ppm/year.
Fig. 10 Principal axis of strain rate computed from GEONET data during 1997–2000
Because the JGD2000 does not consider velocity of control points (i.e. static datum), survey results suffer from the accumulation of relative errors due to plate motion. The error is proportional to the time difference between the observation epoch and the original epoch of the JGD2000, i.e. 1997.0. As an example, Fig. 11 shows the accumulated strain in the Kanto district. The
maximum shear strain averaged in each triangle constituted by GEONET stations is computed. It is seen from the figure that the southern part close to the plate boundary is more largely deformed.
Fig. 11 The maximum shear strain accumulated in 1997–2006 due to plate subduction (Kanto district). Each color corresponds to the shown magnitude of the strain.
In the national surveys conducted by GSI and public ones by municipalities, survey regulations prescribe coordinate accuracies according to the order of the control point survey. One of the conventional regulations is to check a loop closure. That means if observed vectors between fixed points coincide with vectors computed from the published geodetic datum within a prescribed limit, the survey result is considered to be correct. For later convenience, we express this by equations. We consider just two observation sites for simplicity:
and
where X and t denotes observed coordinates and an observation epoch, respectively. The subscript DATUM represents the geodetic datum. The limit L depends on the order of the control point survey. Since the datum is constant in time, the loop closure will increase with time
PhilippineSea Plate
Pacific
Plate
Eurasia (Amurian)
Plate
> 2 ppm
1-2 ppm
0-1 ppm
40 km
55Efficient Maintenance of the Japanese Geodetic Datum 2000 Using Crustal Deformation Models – PatchJGD & Semi-Dynamic Datum
and finally exceed the limit. This indicates that the reference frame will be distorted by the accumulation of strain.
To correct inter-seismic crustal deformation, New Zealand adopts semi-dynamic datum (Grant and Blick, 1998). We have assessed the possibility of introducing semi-dynamic datum to Japan, and in the following sections we report the results obtained so far.
4.2 Semi-dynamic datum We begin by illustrating the principle of
semi-dynamic datum. In semi-dynamic datum, observation is defined as follows:
The first line indicates that all the observation epochs in semi-dynamic datum are frozen at the specific epoch in a global reference frame; in this case, the epoch is set to the original epoch of the JGD2000. The subscript EST denotes the coordinates at 1997.0 estimated with a model. The subsequent lines show that the coordinate change in the global reference frame between the original epoch and the observation epoch is corrected in order to obtain the observation at the original epoch. It follows that we must model a time-variational displacement field at arbitrary observation sites and time. For this, we compute in the same manner as in the
earthquake-induced model but interpolate the inter-seismic displacement. Thus, we obtain survey results in which the effects of inter-seismic deformation are removed.
The corresponding loop closure in semi-dynamic datum is written as
Because coordinates are returned to 1997.0 by definition, discrepancies from the datum do not increase with time as before.
The benefits of introducing semi-dynamic datum are: (1) coordinates observed at different times always agree with the geodetic datum and (2) we do not have to revise the datum as inter-seismic deformation progresses. Dynamic datum, which sequentially or continuously revises a geodetic datum, can also maintain consistency between observations and the datum. However, it is preferable to keep the datum fixed for most users even considering the benefit that the dynamic datum correctly represents a physical state in reality at all the observation epochs other than the original epoch. This is because numerous data associated with land registration are based on the JGD2000 and the former Tokyo Datum, and we think it is too early to handle such data as a function of time. For more details, see (GSI, 2003).
4.3 Model Having explained the principle of semi-dynamic
datum, we next illustrate a specific model to obtain the displacement field. Figure 12 shows the proposed model for calculating at continuous GPS stations. We
directly compute the displacement at each station rather than the velocity in order to allow non-linear crustal movement to be represented. Further, the model is in principle revised once every year to avoid unnecessarily frequent updates. This model may seem theoretically less accurate than the velocity model or other models using time series analysis techniques such as Kalman filtering, but it is more practical and easier to understand. Errors caused by approximating the daily coordinates with the step-like function are 0.2 ppm on average, which is negligible for the lower-order control point surveys. Moreover, users know when the model is updated and can continue to use the same correction value during each survey period. In contrast, the velocity model or other models need irregular updates and it is relatively difficult to manage the models.
Kriging is also valid for inter-seismic deformation. The same software used for computing the parameters for earthquake-induced deformations is used
56 Bulletin of the Geographical Survey Institute, Vol.54 March, 2007
to interpolate an inter-seismic crustal movement that occurred from 1997.0 to 2006.0 (Fig. 13). In future, campaign observation results (Section 2.2) will also be incorporated into the model in the same form.
34.9497571
34.9497572
34.9497573
34.9497574
34.9497575
34.9497576
34.9497577
34.9497578
34.9497579
2001 2002 2003 2004 2005 2006
F2モデル1cm
Fig. 12 The step-like coordinate model. The N-S component of a continuous GPS station is shown. The non-linear behavior is automatically represented by the annual update.
Fig. 13 The result of Kriging interpolation. The numerals indicate ID of the continuous GPS stations.
To reduce an observation to epoch 1997.0, displacements at both ends of each observed vector are first calculated by interpolating the gridded parameter with the bi-linear method. Next, the difference of the displacements is subtracted from each observed vector just before a network adjustment. Finally, the network adjustment is performed at the original epoch with the returned vectors. We are currently developing software that automatically carries out the above procedure online as is done in New Zealand.
4.4 Effect of semi-dynamic datum As seen in the inequalities in Section 4.2, loop
closures are expected to become smaller in semi-dynamic datum than in static datum. In this section, we show that the proposed model effectively decreases loop closure for the actual survey data.
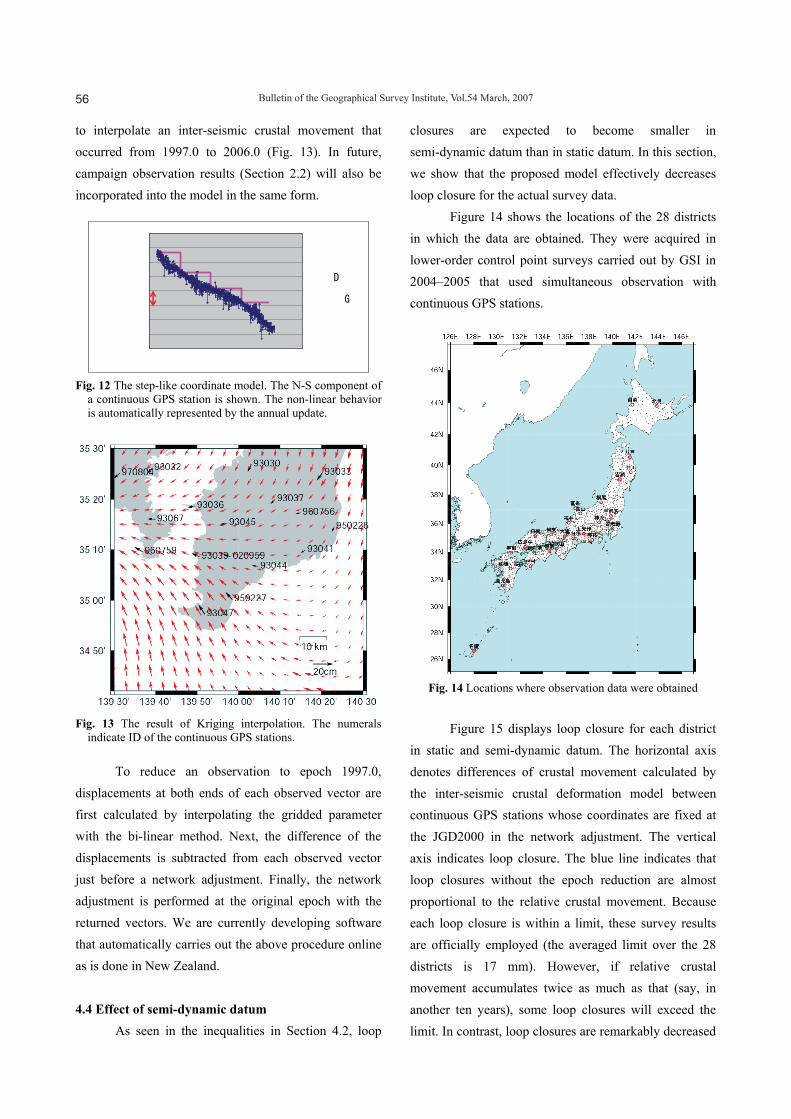
Figure 14 shows the locations of the 28 districts in which the data are obtained. They were acquired in lower-order control point surveys carried out by GSI in 2004–2005 that used simultaneous observation with continuous GPS stations.
Fig. 14 Locations where observation data were obtained
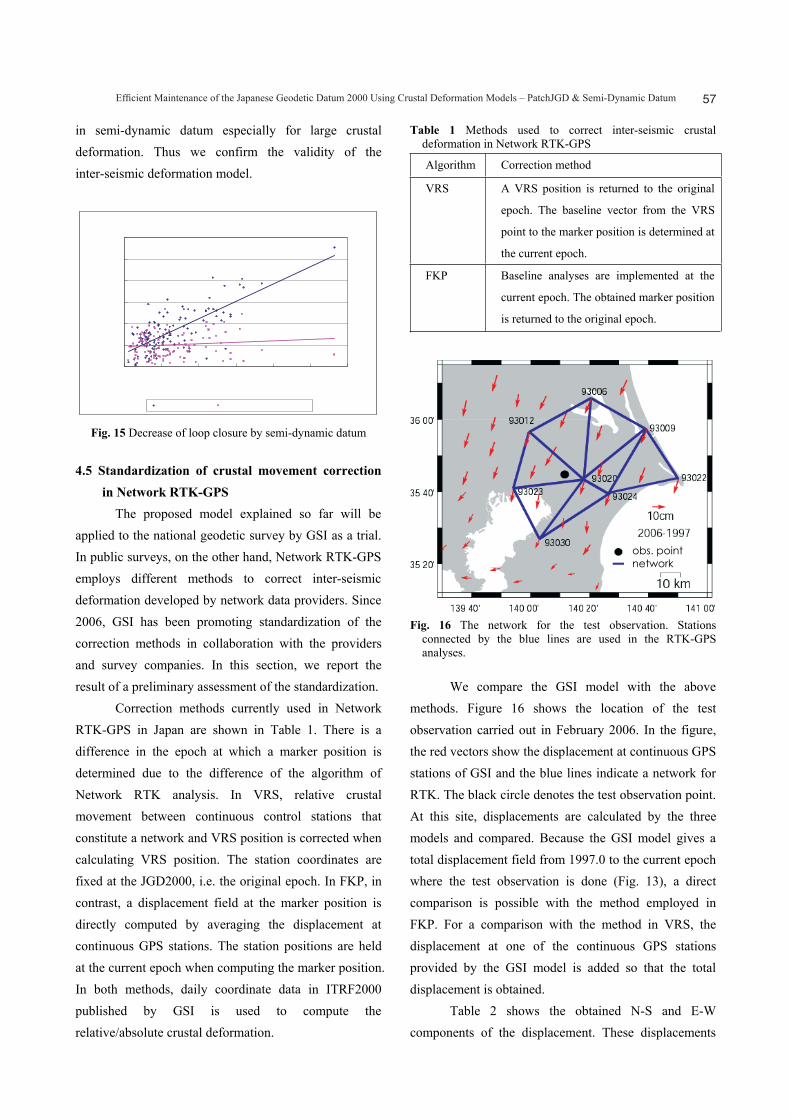
Figure 15 displays loop closure for each district in static and semi-dynamic datum. The horizontal axis denotes differences of crustal movement calculated by the inter-seismic crustal deformation model between continuous GPS stations whose coordinates are fixed at the JGD2000 in the network adjustment. The vertical axis indicates loop closure. The blue line indicates that loop closures without the epoch reduction are almost proportional to the relative crustal movement. Because each loop closure is within a limit, these survey results are officially employed (the averaged limit over the 28 districts is 17 mm). However, if relative crustal movement accumulates twice as much as that (say, in another ten years), some loop closures will exceed the limit. In contrast, loop closures are remarkably decreased
― obs.
― model
57Efficient Maintenance of the Japanese Geodetic Datum 2000 Using Crustal Deformation Models – PatchJGD & Semi-Dynamic Datum
in semi-dynamic datum especially for large crustal deformation. Thus we confirm the validity of the inter-seismic deformation model.
0.000
0.020
0.040
0.060
0.080
0.100
0.120
0.000 0.020 0.040 0.060 0.080 0.100 0.120
Relative crustal displacement from 1997.0 (m)
Loop
clo
sure
(m
)
static datum semi-dynamic datum
Fig. 15 Decrease of loop closure by semi-dynamic datum
4.5 Standardization of crustal movement correction in Network RTK-GPS
The proposed model explained so far will be applied to the national geodetic survey by GSI as a trial. In public surveys, on the other hand, Network RTK-GPS employs different methods to correct inter-seismic deformation developed by network data providers. Since 2006, GSI has been promoting standardization of the correction methods in collaboration with the providers and survey companies. In this section, we report the result of a preliminary assessment of the standardization.
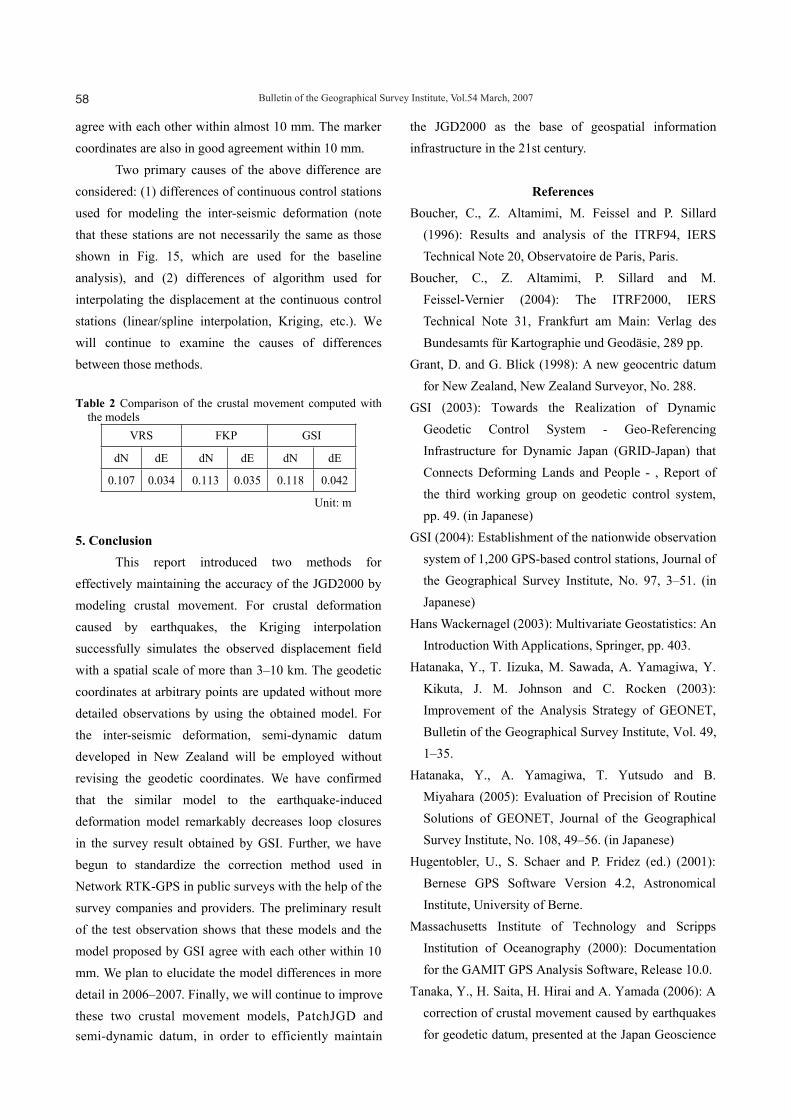
Correction methods currently used in Network RTK-GPS in Japan are shown in Table 1. There is a difference in the epoch at which a marker position is determined due to the difference of the algorithm of Network RTK analysis. In VRS, relative crustal movement between continuous control stations that constitute a network and VRS position is corrected when calculating VRS position. The station coordinates are fixed at the JGD2000, i.e. the original epoch. In FKP, in contrast, a displacement field at the marker position is directly computed by averaging the displacement at continuous GPS stations. The station positions are held at the current epoch when computing the marker position. In both methods, daily coordinate data in ITRF2000 published by GSI is used to compute the relative/absolute crustal deformation.
Table 1 Methods used to correct inter-seismic crustal deformation in Network RTK-GPS
Algorithm Correction method
VRS A VRS position is returned to the original
epoch. The baseline vector from the VRS
point to the marker position is determined at
the current epoch.
FKP Baseline analyses are implemented at the
current epoch. The obtained marker position
is returned to the original epoch.
Fig. 16 The network for the test observation. Stations connected by the blue lines are used in the RTK-GPS analyses.
We compare the GSI model with the above methods. Figure 16 shows the location of the test observation carried out in February 2006. In the figure, the red vectors show the displacement at continuous GPS stations of GSI and the blue lines indicate a network for RTK. The black circle denotes the test observation point. At this site, displacements are calculated by the three models and compared. Because the GSI model gives a total displacement field from 1997.0 to the current epoch where the test observation is done (Fig. 13), a direct comparison is possible with the method employed in FKP. For a comparison with the method in VRS, the displacement at one of the continuous GPS stations provided by the GSI model is added so that the total displacement is obtained.
Table 2 shows the obtained N-S and E-W
obs. point network
components of the displacement. These displacements
58 Bulletin of the Geographical Survey Institute, Vol.54 March, 2007
agree with each other within almost 10 mm. The marker coordinates are also in good agreement within 10 mm.
Two primary causes of the above difference are considered: (1) differences of continuous control stations used for modeling the inter-seismic deformation (note that these stations are not necessarily the same as those shown in Fig. 15, which are used for the baseline analysis), and (2) differences of algorithm used for interpolating the displacement at the continuous control stations (linear/spline interpolation, Kriging, etc.). We will continue to examine the causes of differences between those methods.
Table 2 Comparison of the crustal movement computed with the models
VRS FKP GSI
dN dE dN dE dN dE
0.107 0.034 0.113 0.035 0.118 0.042
Unit: m
5. Conclusion This report introduced two methods for
effectively maintaining the accuracy of the JGD2000 by modeling crustal movement. For crustal deformation caused by earthquakes, the Kriging interpolation successfully simulates the observed displacement field with a spatial scale of more than 3–10 km. The geodetic coordinates at arbitrary points are updated without more detailed observations by using the obtained model. For the inter-seismic deformation, semi-dynamic datum developed in New Zealand will be employed without revising the geodetic coordinates. We have confirmed that the similar model to the earthquake-induced deformation model remarkably decreases loop closures in the survey result obtained by GSI. Further, we have begun to standardize the correction method used in Network RTK-GPS in public surveys with the help of the survey companies and providers. The preliminary result of the test observation shows that these models and the model proposed by GSI agree with each other within 10 mm. We plan to elucidate the model differences in more detail in 2006–2007. Finally, we will continue to improvethese two crustal movement models, PatchJGD and semi-dynamic datum, in order to efficiently maintain
the JGD2000 as the base of geospatial information infrastructure in the 21st century.
References Boucher, C., Z. Altamimi, M. Feissel and P. Sillard
(1996): Results and analysis of the ITRF94, IERS Technical Note 20, Observatoire de Paris, Paris.
Boucher, C., Z. Altamimi, P. Sillard and M. Feissel-Vernier (2004): The ITRF2000, IERS Technical Note 31, Frankfurt am Main: Verlag des Bundesamts für Kartographie und Geodäsie, 289 pp.
Grant, D. and G. Blick (1998): A new geocentric datum for New Zealand, New Zealand Surveyor, No. 288.
GSI (2003): Towards the Realization of Dynamic Geodetic Control System - Geo-Referencing Infrastructure for Dynamic Japan (GRID-Japan) that Connects Deforming Lands and People - , Report of the third working group on geodetic control system, pp. 49. (in Japanese)
GSI (2004): Establishment of the nationwide observation system of 1,200 GPS-based control stations, Journal of the Geographical Survey Institute, No. 97, 3–51. (in Japanese)
Hans Wackernagel (2003): Multivariate Geostatistics: An Introduction With Applications, Springer, pp. 403.
Hatanaka, Y., T. Iizuka, M. Sawada, A. Yamagiwa, Y. Kikuta, J. M. Johnson and C. Rocken (2003): Improvement of the Analysis Strategy of GEONET, Bulletin of the Geographical Survey Institute, Vol. 49, 1–35.
Hatanaka, Y., A. Yamagiwa, T. Yutsudo and B. Miyahara (2005): Evaluation of Precision of Routine Solutions of GEONET, Journal of the Geographical Survey Institute, No. 108, 49–56. (in Japanese)
Hugentobler, U., S. Schaer and P. Fridez (ed.) (2001): Bernese GPS Software Version 4.2, Astronomical Institute, University of Berne.
Massachusetts Institute of Technology and Scripps Institution of Oceanography (2000): Documentation for the GAMIT GPS Analysis Software, Release 10.0.
Tanaka, Y., H. Saita, H. Hirai and A. Yamada (2006): A correction of crustal movement caused by earthquakes for geodetic datum, presented at the Japan Geoscience

59Efficient Maintenance of the Japanese Geodetic Datum 2000 Using Crustal Deformation Models – PatchJGD & Semi-Dynamic Datum
Union Meeting 2006, Chiba, Japan, 14–18, May, 2006, D123-010.
Tobita, M. (2002): Coordinate transformation software “TKY2JGD” from Tokyo Datum to a geocentric reference system, Japanese Geodetic Datum 2000, Journal of the Geographical Survey Institute, No. 97, 31–51. (in Japanese)
Tobita, M., H. Munekane, S. Matsuzaka, M. Kato, H.
Yarai, M. Murakami, S. Fujiwara, H. Nakagawa and T. Ozawa (2005): Studies on InSAR data processing technique, Journal of the Geographical Survey Institute, No. 106, 37–49. (in Japanese)
Tsuji, H. and S. Matsuzaka (2004): Realization of Horizontal Geodetic Coordinates 2000, Bulletin of the Geographical Survey Institute, Vol. 51, 11–30.


![GSI Forklift[1]](https://img.pdfslide.tips/doc/110x75/577dab0a1a28ab223f8bd316/gsi-forklift1.jpg)