Embed Size (px)
Citation preview

Bureau of Economic Geology, The University of Texas at Austin
Oil & Gas InvestmentUSEIA, April 7-8, 2009

©CEE-UT, 2
Dr. Michelle Michot Foss, CEE-UT
Trends Drivers
• Upstream cost structures and margins relative to financing
• Demand-side pricing policies by governments (oil)• Impact of financial markets• Resources and opportunities – “frontier” oil• “Frontier” natural gas• Cross-commodity pricing (fuel competition) – the
challenge of building value for nat gas• Climate• Investment trends – invest in what you know

©CEE-UT, 3
Dr. Michelle Michot Foss, CEE-UT
Players and Cost Structures
Oil & Gas Investor, October 2008

©CEE-UT, 4
Dr. Michelle Michot Foss, CEE-UT
ONGC
PetroBangla
OGDCL
QP KPC
Average NOC
Gazprom
ECOPETROL
StatoilHydro
PTT
GDF
Sonatrach
PETROBRAS
PDVSA
PEMEX
PetronasSinopec
PetroChina
CNOOC
Rosneft
Kazmun-aigas
-100%
-50%
0%
50%
100%
150%
200%
250%
300%
350%
400%
45 50 55 60 65 70 75 80 85 90
Average All Scores
Re
se
rve
Re
pla
ce
me
nt
Ra
te (
BO
E,
%)
AverageEast Asia and PacificEurope and Central AsiaLatin America and CaribbeanMiddle East and North AfricaSouth AsiaSub-Saharan Africa
Improvements in NOCs’ reserve replacement rate are supported by improvements in governance, more effective and stable alliances between NOCs and IOCs, sound competitive frameworks, and progressive fiscal regimes…
A Citizen’s Guide to NOCs, CEE and World Bank, www.worldbank.org/noc
©CEE-UT, 5
Dr. Michelle Michot Foss, CEE-UT
ONGC
PetroBangla
OGDCL
QP
KPC
Average NOC
Gazprom
ECOPETROL
StatoilHydro
PTTGDF
Sonatrach
PETROBRAS
PDVSA
PEMEX
PetronasSinopec
PetroChina
CNOOC
Rosneft
Kazmunaigas
-100%
0%
100%
200%
300%
400%
500%
-50 0 50 100 150 200
Value Creation Indicator
Eff
ec
tiv
e T
ax
Ra
te (
%)
AverageEast Asia and PacificEurope and Central AsiaLatin America and CaribbeanMiddle East and North AfricaSouth AsiaSub-Saharan Africa
…and enables them to create and optimize value from assets.
A Citizen’s Guide to NOCs, CEE and World Bank, www.worldbank.org/noc

©CEE-UT, 6
Dr. Michelle Michot Foss, CEE-UT
A Citizen’s Guide to NOCs, CEE and World Bank, www.worldbank.org/noc

©CEE-UT, 7
Dr. Michelle Michot Foss, CEE-UT
Non-Commercial PerformanceContributions by Type/Revenue (%)
24 316
23
58
-4
31
16
22
-4-20
0
20
40
60
80
100
StatHydro Petrobras Sinopec Petrochina Pemex
Taxes, Roys., Bonuses Price Subsidies
Direct Social Expenses Excess Labor Cost
CEE-UT

©CEE-UT, 8
Dr. Michelle Michot Foss, CEE-UT
IEA, NYMEX
Oil Demand Growth by Region, 2006-2008 (YTD)
-1.2-1
-0.8-0.6-0.4-0.2
00.20.40.60.8
11.21.4
China Middle East Other non-OECD Asia
OECD Rest of World World
mm
b/d
2006 2007 2008 YTD
WTI Price (Real), 2006-2008 (YTD)
0
5
10
15
20
25
30
35
40
WTI Price (Real)m
mb
/d
2006 2007 2008 YTD
Subsidies and Demand

©CEE-UT, 9
Dr. Michelle Michot Foss, CEE-UT
Not All Opportunities are the Same
From Holditch, 2005, “Statistical Correlations in Tight Gas Sands”, American Association of Petroleum Geologists (AAPG) Hedberg Conference Proceedings. http://www.searchanddiscovery.net/documents/abstracts/2005hedberg_vail/abstracts/extended/holditch01/holditch01.htm

©CEE-UT, 10
Dr. Michelle Michot Foss, CEE-UT
Electron Imagery of Barnett Fractures
Gale, J. F. W., Reed, R. M., and Holder, Jon, 2007, Natural fractures in the Barnett Shale and their importance for hydraulic fracture treatments: AAPG Bulletin, v. 91, no. 4, p. 603–622.

©CEE-UT, 11
Dr. Michelle Michot Foss, CEE-UT
US Gas Rigs, Production
200
400
600
800
1,000
1,200
1,400
1,600
1,800
Ave
rag
e G
as R
ig C
ou
nt
1,200
1,300
1,400
1,500
1,600
1,700
1,800
1,900
US
Dry
Gas
Pro
du
ctio
n (
Bcf
)
Average Gas Rig Count
US Dry Gas Production (Bcf)
12-Month Moving Average, US Dry Gas Production (Bcf)
Baker Hughes, USEIA
Production Backlog

©CEE-UT, 12
Dr. Michelle Michot Foss, CEE-UT
Source: NPC 2007
The Endless Resource
©CEE-UT, 13
Dr. Michelle Michot Foss, CEE-UT
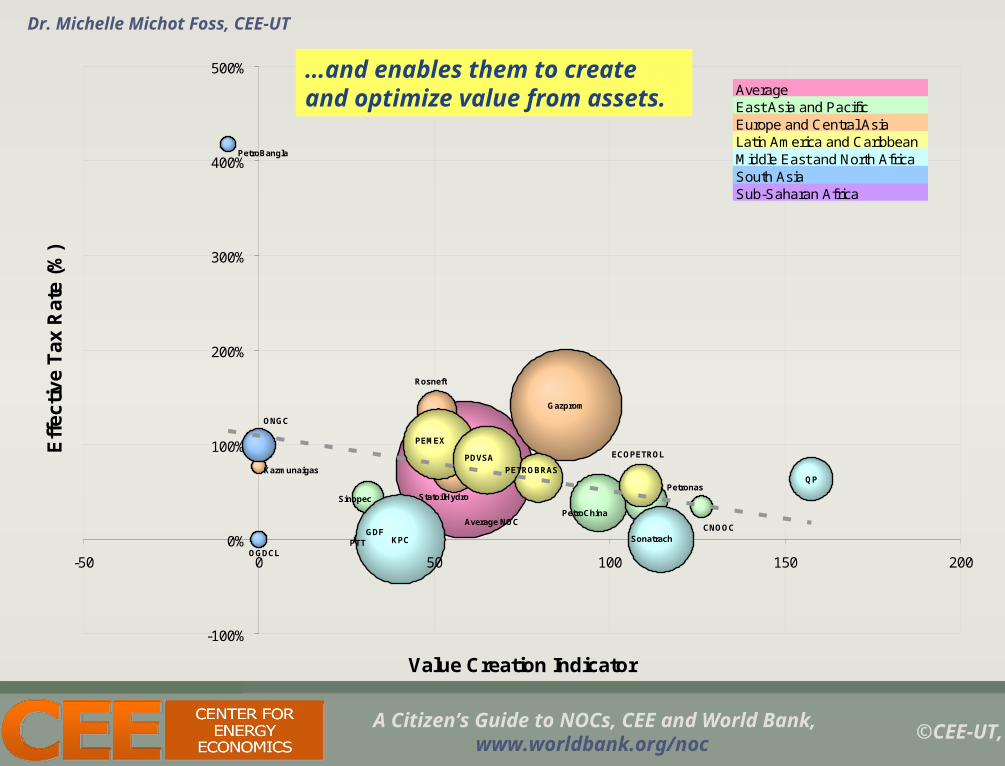
Natural Gas vs. Petroleum Prices
Sources: U.S. EIA; NYMEX; CEE
$0
$5
$10
$15
$20
$25
$30
$/M
MB
tu
0
5
10
15
20
25
Oil:
Nat
ura
l Gas
Pri
ce R
atio
U.S. Gulf Coast No 2 Diesel Low Sulfur Spot Price FOB ($/MMBtu)
U.S. Gulf Coast No. 2 Heating Oil Spot Price FOB ($/MMBtu)
U.S. Gulf Coast Residual Fuel Oil 1.0 % Sulfur LP Spot Price CIF ($/MMBtu)
Henry Hub Monthly Average Spot Price ($/MMBtu)
Actual Ratio, Crude Oil:Gas Prices
Rough 6:1 Oil:Nat Gas Ratio
What kind of business are we in?

©CEE-UT, 14
Dr. Michelle Michot Foss, CEE-UT
Public Acceptance: Sample LNG Projects in Same Region
1
2
3
4
5Safety/Security
Wetlands
Fisheries
Energy Costs
Roads
Taxes
Employment
Air Emissions
Property Value
Other/Intangibles
Immediate Site Community Waterway Community Local Community (City)
Greater Community (State) National Community (Federal) External Interest Group
1 - Perceived Benefit
3 - Indifferent
5 - Perceived Cost
What caused the differences?Onshore vs. Offshore?
Developer posture? Early dialogue?
Unlicensed Onshore Project
Licensed Offshore Project
Sources: CEE, Community and Economic Benefits of LNG, 2008

©CEE-UT, 15
Dr. Michelle Michot Foss, CEE-UT
Sample Projects in Different Regions
1
2
3
4
5Safety/Security
Wetlands
Fisheries
Energy Costs
Roads
Taxes
Employment
Air Emissions
Property Value
Other/Intangibles
Immediate Site Community Waterway Community Local Community (City)
Greater Community (State) National Community (Federal) External Interest Group
1 - Perceived Benefit3 - Indifferent5 - Perceived Cost
1
2
3
4
5Safety/Security
Wetlands
Fisheries
Energy Costs
Roads
Taxes
Employment
Air Emissions
Property Value
Other/Intangibles
Immediate Site Community Waterway Community Local Community (City)
Greater Community (State) National Community (Federal) External Interest Group
1 - Perceived Benefit
3 - Indifferent
5 - Perceived Cost
What caused the differences?Onshore vs. Offshore?
Developer posture? Early dialogue?
Unlicensed OnshoreProject
Licensed Onshore Project
Sources: CEE, Community and Economic Benefits of LNG, 2008

©CEE-UT, 16
Dr. Michelle Michot Foss, CEE-UT
Math Whiz
• Total annual CO2 emitted is 188 bn ton• 8bn is derived from human activity
– US produces 2 bn
• Net generation from US coal plants is ~170mm MWh– CO2 production is ~2,250 lbs/MWh, or 191mm tons
• The total atmosphere is 5 quadrillion tons– We would be removing 0.00000382% if all CO2 from US
coal-fired power gen was captured– We would be removing 0.00016% if all CO2 attributed
with human activity were captured or eliminated
©CEE-UT, 17
Dr. Michelle Michot Foss, CEE-UT
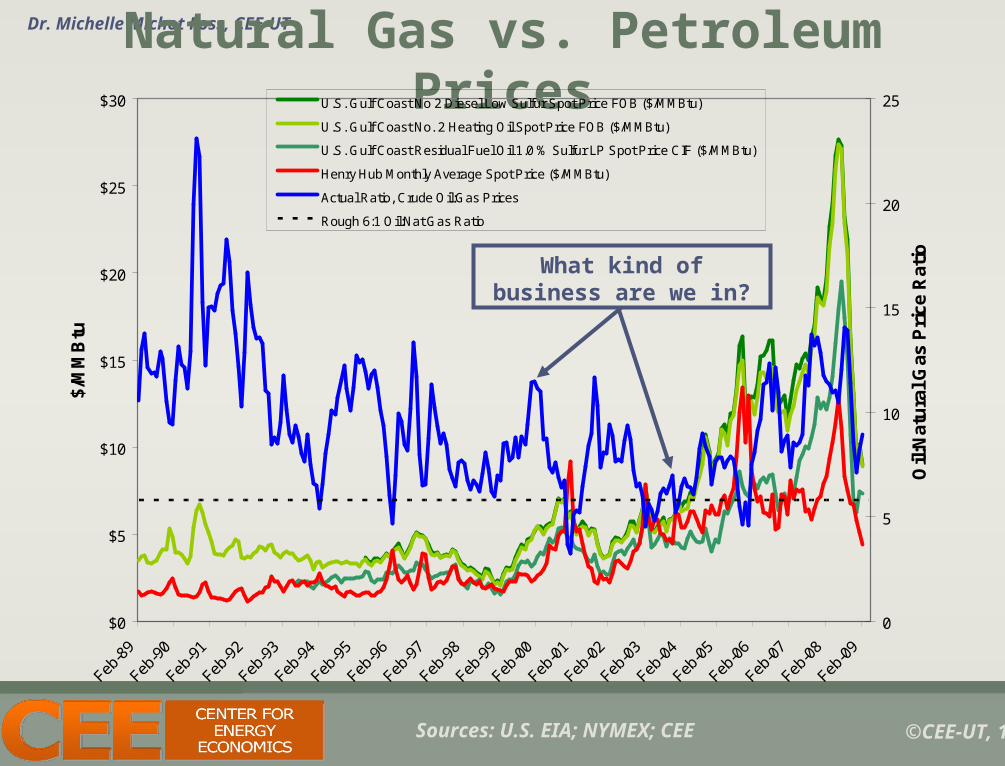
API Truth Primer
©CEE-UT, 18
Dr. Michelle Michot Foss, CEE-UT
API Truth Primer

©CEE-UT, 19
Dr. Michelle Michot Foss, CEE-UT
API Truth Primer

©CEE-UT, 20
Dr. Michelle Michot Foss, CEE-UT18
50
190
0
193
0
194
0
195
0
196
0
197
0
198
0
199
0
200
0
•Oil discovered in Titusville, Pennsylvania, 1859; natural gas replaces town gas, 1870s
•Advances in drilling, early seismic, shallow offshore E&P
•Long-line pipeline transmission•Directional drilling, offshore below 250ft water depth
•Pipeline trenching and welding, compression,pressure control, metering; national grid develops
•3-d seismic, horizontal drilling, measurementwhile drilling, offshore below 1,000ft
IT Pathway: Mainframes Minis Micros Work Stations
•Offshore below10,000ft
•Oil discovered at Spindletop (Texas), 1901
0
50,000
100,000
150,000
200,000
250,000
300,000
350,000
400,000
450,000
Impact of Technology – Deferring Declines
Cumulative U.S. Oil & GasProduction, 1936-2007BBOE (IncludesAlaska)
Not to scale
•Arctic?•Hydrates?
•4-d seismic, offshore below 5,000ft
Still looking for the peak…
Conventional porosity/permeability Unconventional Nano

©CEE-UT, 21
Dr. Michelle Michot Foss, CEE-UT
Center for Energy Economics
www.beg.utexas.edu/energyecon