Embed Size (px)
DESCRIPTION
CAPACITACIÓN PARA LOS ESTADOS MIEMBROS DE LA CURSO CAPEV 10 2009. CURSO DE CAPACITACIÓN VIRTUAL: INTRODUCCIÓN AL ESTUDIO DE LA TERMOCONVERSIÓN DE LA ENERGÍA SOLAR. Análisis Económico y Ambiental. Dr. Oscar Alfredo Jaramillo Salgado - PowerPoint PPT Presentation
Citation preview
CAPACITACIÓN PARA LOS ESTADOS MIEMBROS DE LA
CURSO CAPEV 10 2009
CURSO DE CAPACITACIÓN VIRTUAL: INTRODUCCIÓN AL ESTUDIO DE LA TERMOCONVERSIÓN DE LA ENERGÍA SOLAR
Análisis Económico y Ambiental
Dr. Oscar Alfredo Jaramillo SalgadoCentro de Investigación en Energía. Universidad Nacional Autónoma de México
[email protected] 28 sep 2009
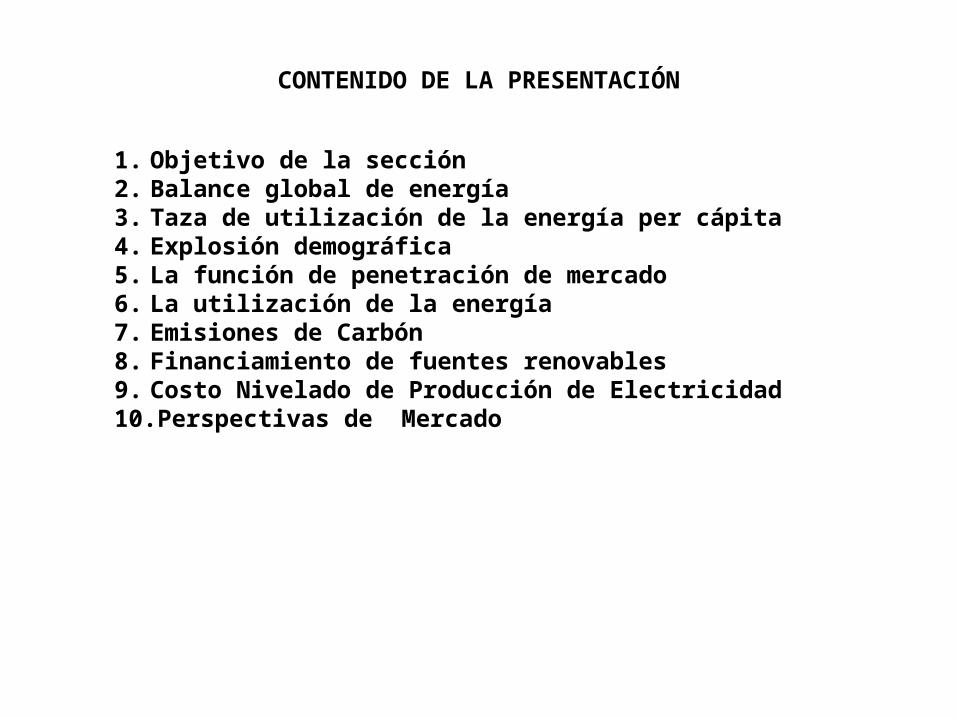
CONTENIDO DE LA PRESENTACIÓN
1. Objetivo de la sección2. Balance global de energía3. Taza de utilización de la energía per cápita4. Explosión demográfica5. La función de penetración de mercado6. La utilización de la energía7. Emisiones de Carbón8. Financiamiento de fuentes renovables9. Costo Nivelado de Producción de Electricidad10. Perspectivas de Mercado
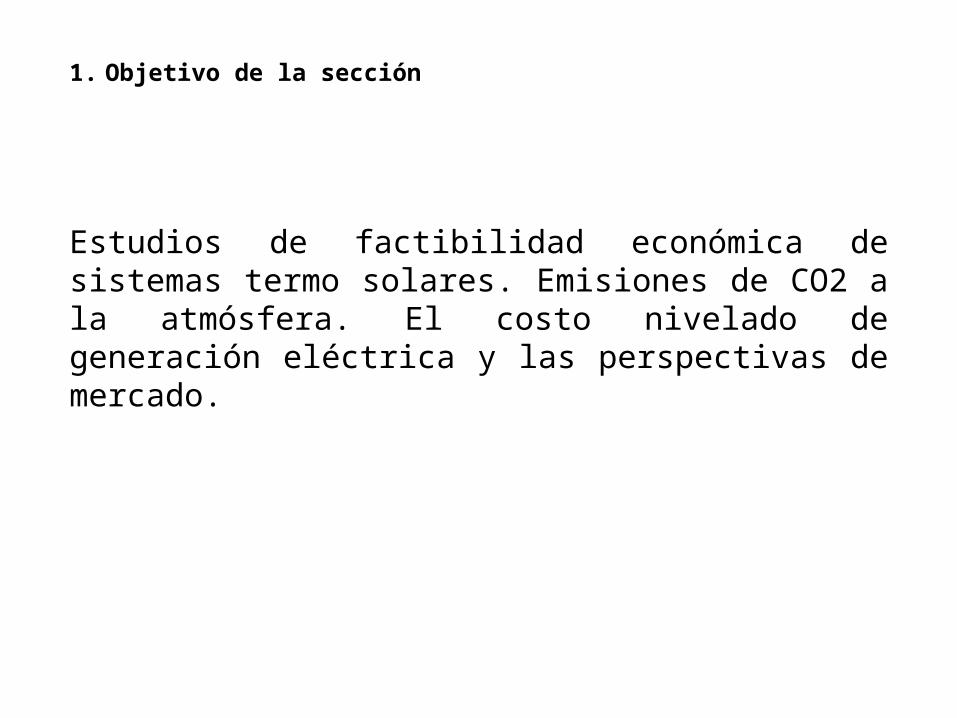
Estudios de factibilidad económica de sistemas termo solares. Emisiones de CO2 a la atmósfera. El costo nivelado de generación eléctrica y las perspectivas de mercado.
1. Objetivo de la sección
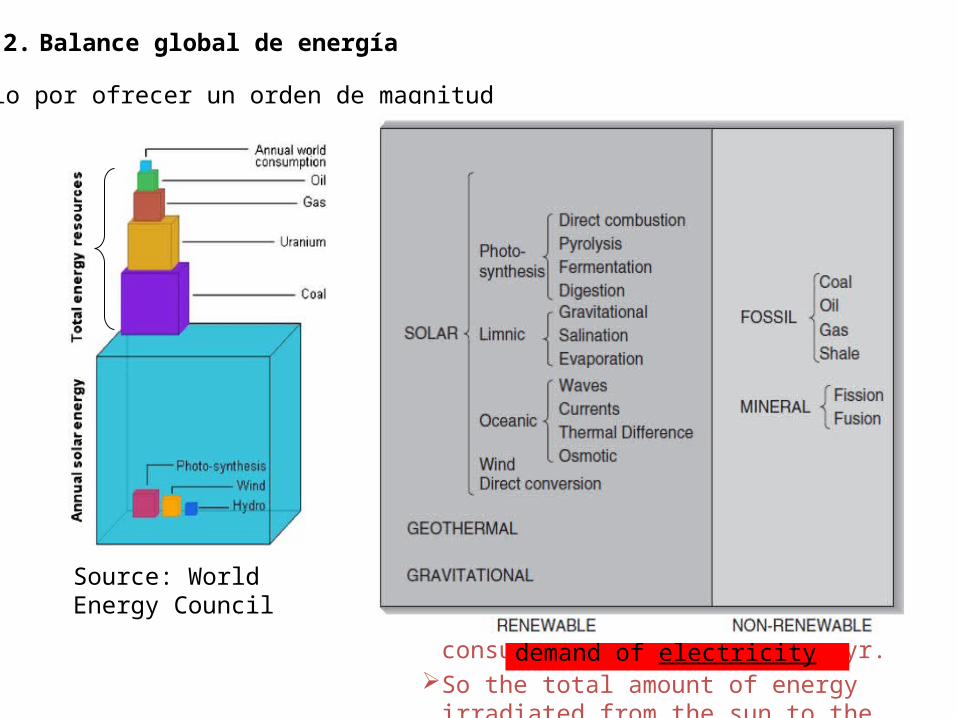
Source: World Energy Council
Sólo por ofrecer un orden de magnitud
Primary Energy:The energy content of the annual solar radiation
which reaches the earth and its atmosphere is 2,895,000 EJ,
The total non-renewable energy resources of 325,300 EJ (oil, 8,690 EJ (20 times); gas, 17,280 EJ (40 times); uranium, 114000 EJ (250 times); coal, 185 330 EJ (400 times)).
The energy content of other major renewables is estimated as 1960 EJ (4 times) (hydro, 90 EJ; wind, 630 EJ; photosynthetic storage/ biomass, 1 260 EJ),
Current world primary energy consumption is about 425 EJ/yr.
So the total amount of energy irradiated from the sun to the earth’s surface is enough to
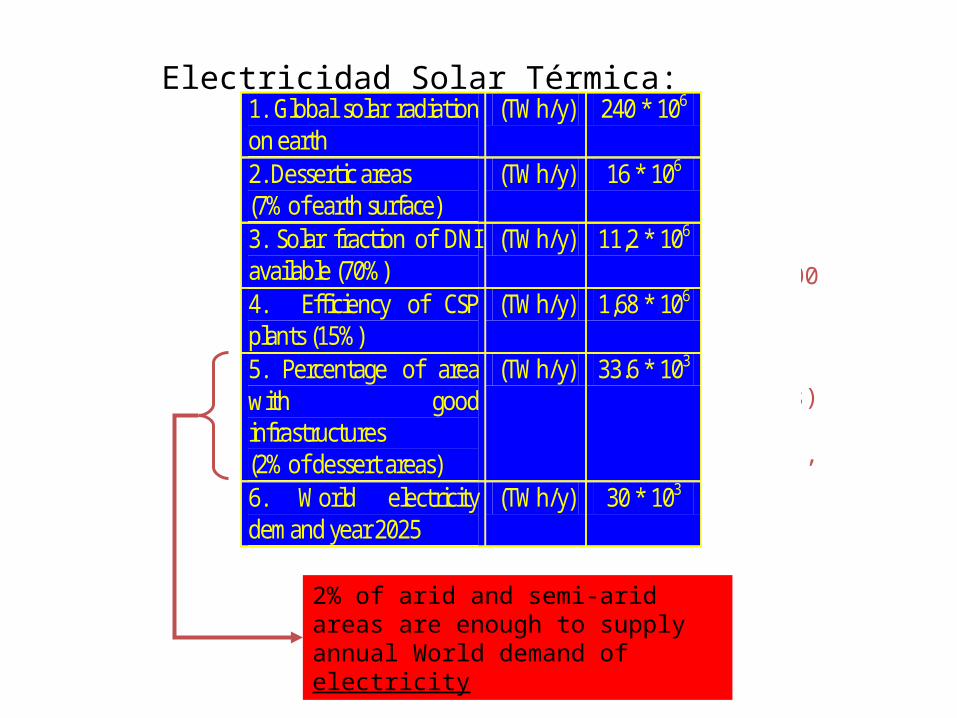
1. Global solar radiation on earth
(TWh/y) 240 * 106
2. Dessertic areas (7% of earth surface)
(TWh/y) 16 * 106
3. Solar fraction of DNI available (70%)
(TWh/y) 11,2 * 106
4. Efficiency of CSP plants (15%)
(TWh/y) 1,68 * 106
5. Percentage of area with good infrastructures (2% of dessert areas)
(TWh/y) 33.6 * 103
6. World electricity demand year 2025
(TWh/y) 30 * 103
2% of arid and semi-arid areas are enough to supply annual World demand of electricity
Electricidad Solar Térmica:
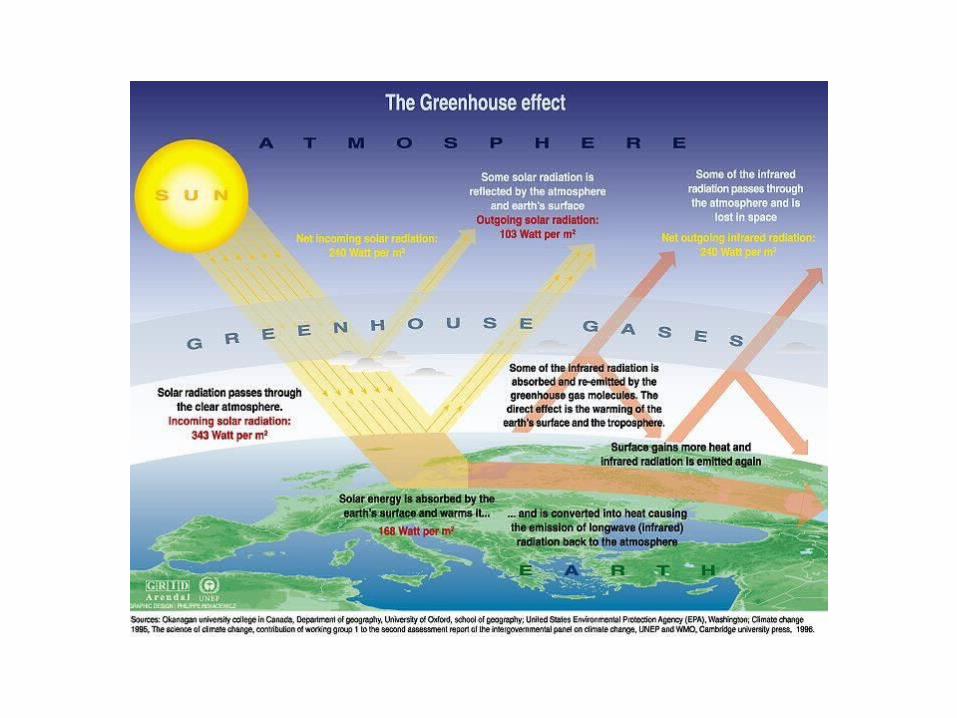
2. Balance global de energía
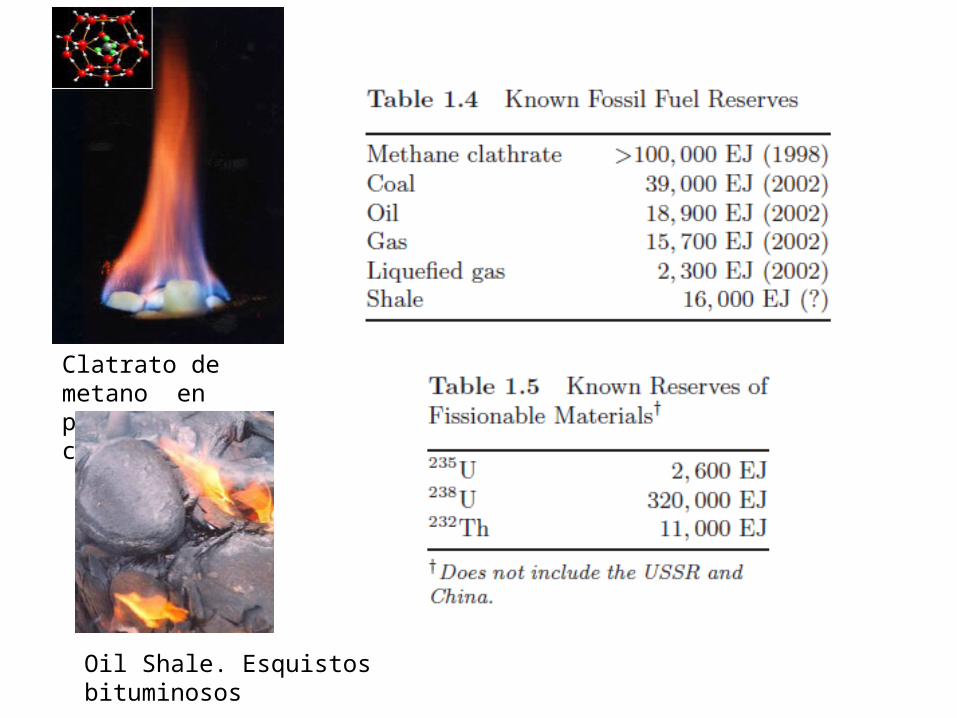
Clatrato de metano en plena combustión.
Oil Shale. Esquistos bituminosos
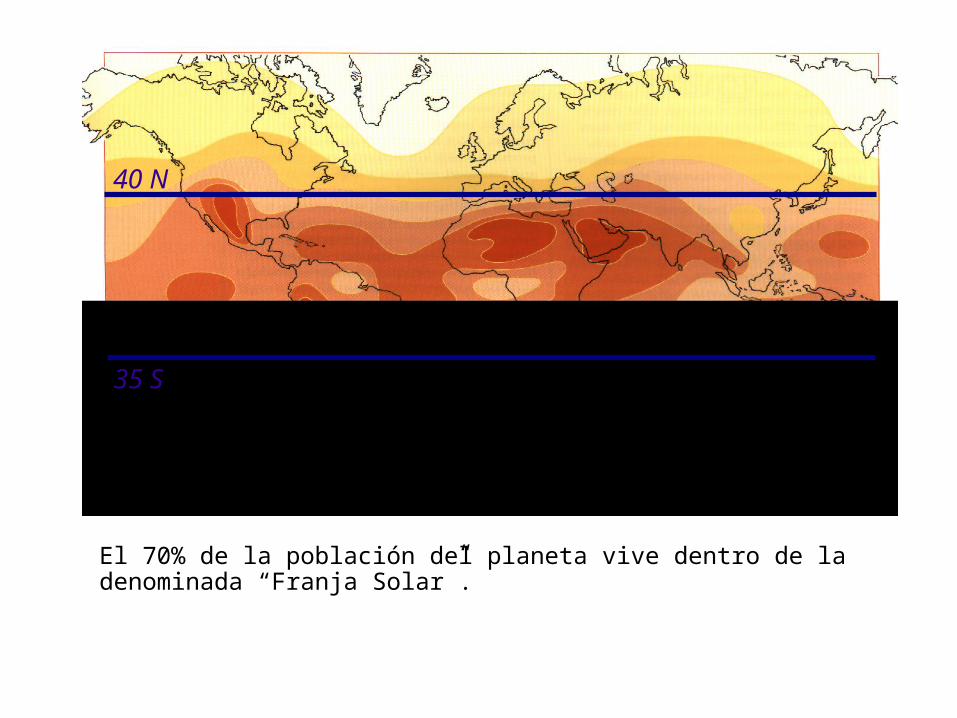
40 N
35 S
El 70% de la población del planeta vive dentro de la denominada “Franja Solar”.
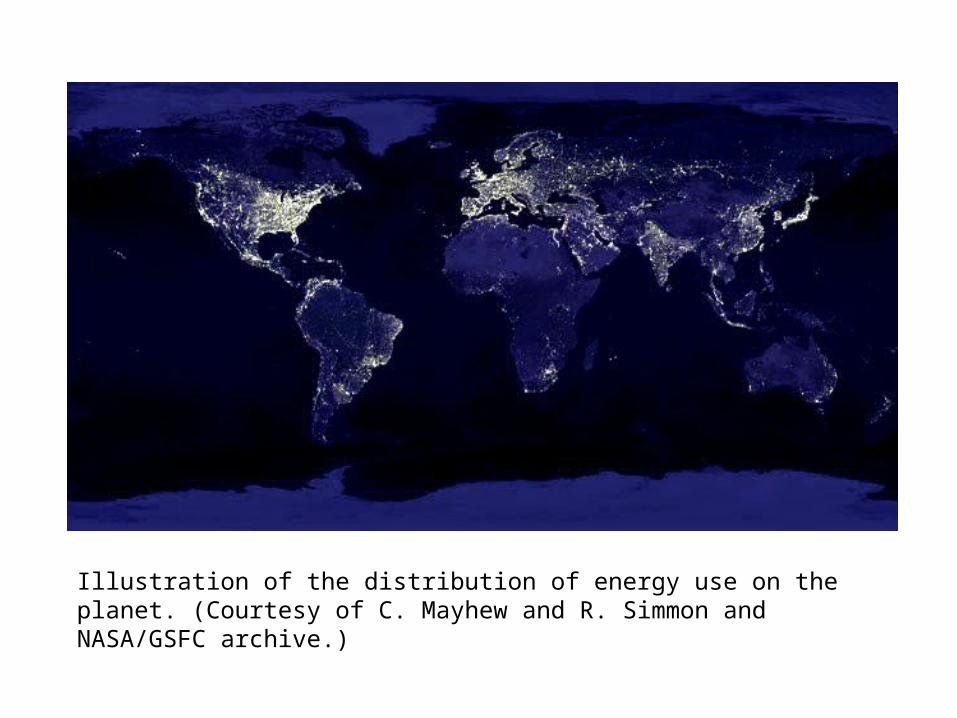
Illustration of the distribution of energy use on the planet. (Courtesy of C. Mayhew and R. Simmon and NASA/GSFC archive.)
Primary Energy:The energy content of the annual solar radiationwhich
reaches the earth and its atmosphere is 2,895,000 EJ,The total non-renewable energy resources of 325,300 EJ (oil,
8,690 EJ (20 times); gas, 17,280 EJ (40 times); uranium, 114000 EJ (250 times); coal, 185 330 EJ (400 times)).
The energy content of other major renewables isestimated a 1960 EJ (4 times) (hydro, 90 EJ; wind, 630 EJ; photosynthetic storage/ biomass, 260 EJ),
Current world primary energy consumption is about 425So the total amount of energy irradiated from the sun to the
earth’s surface is enough to
1. Global solar radiation on earth
(TWh/y) 240 * 106
2. Dessertic areas (7% of earth surface)
(TWh/y) 16 * 106
3. Solar fraction of DNI available (70%)
(TWh/y) 11,2 * 106
4. Efficiency of CSP plants (15%)
(TWh/y) 1,68 * 106
5. Percentage of area with good infrastructures (2% of dessert areas)
(TWh/y) 33.6 * 103
6. World electricity demand year 2025
(TWh/y) 30 * 103
2% of arid and semi-arid areas are enough to supply annual World demand of electricity
Electricidad Solar Térmica:
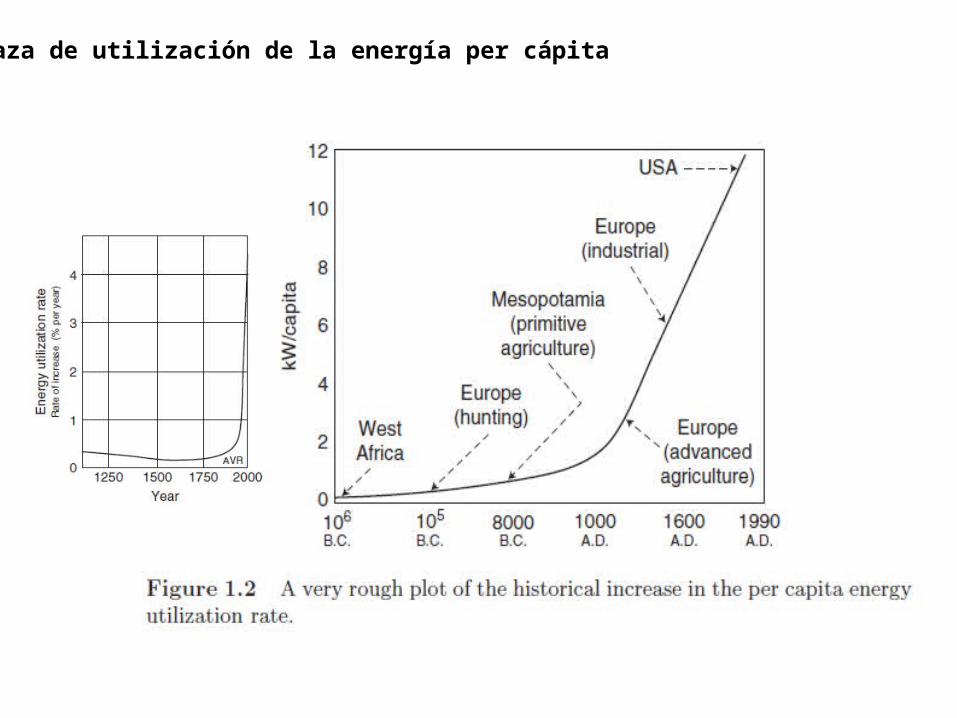
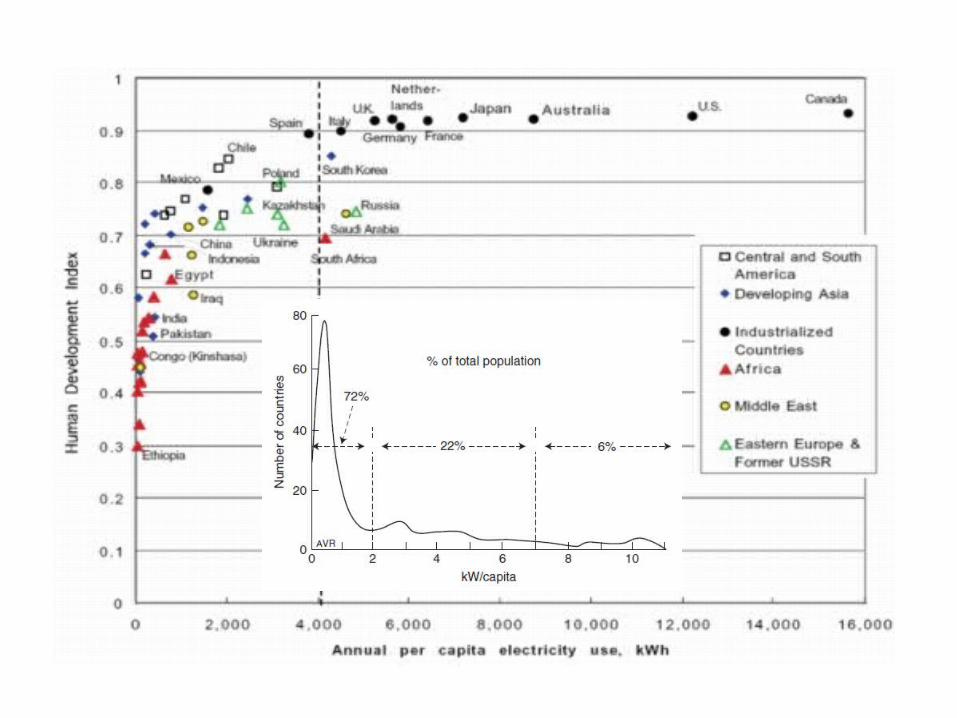
3. Taza de utilización de la energía per cápita
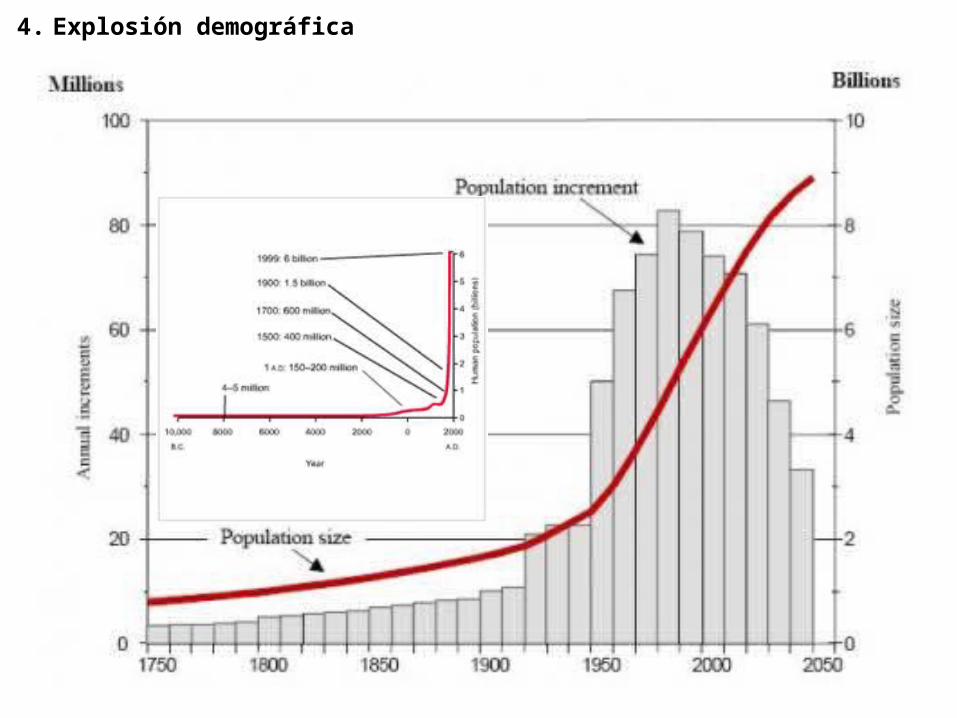
4. Explosión demográfica
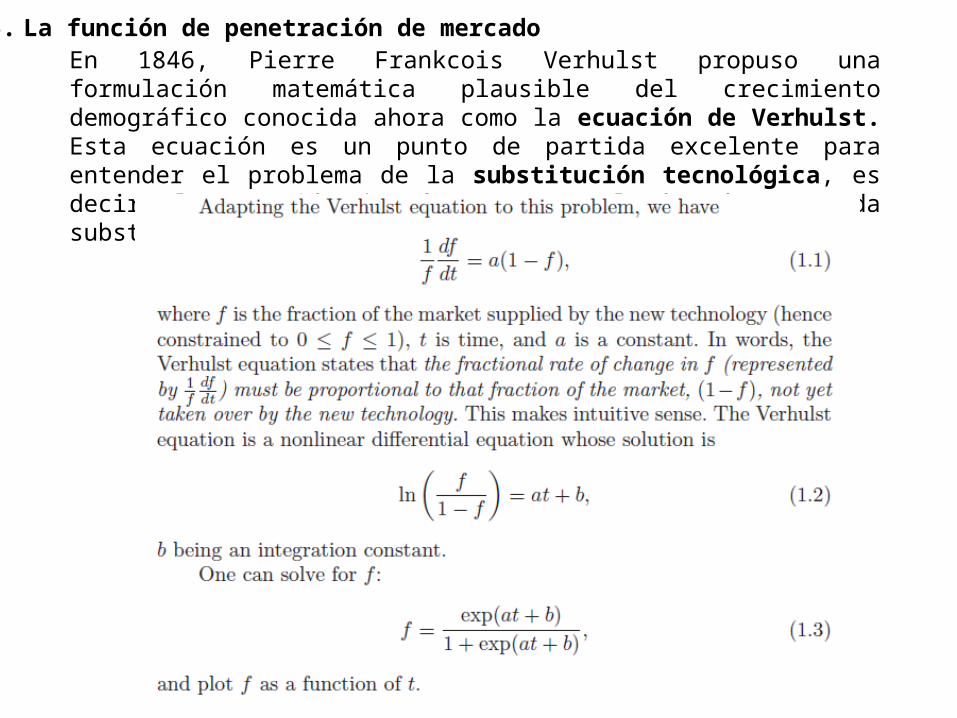
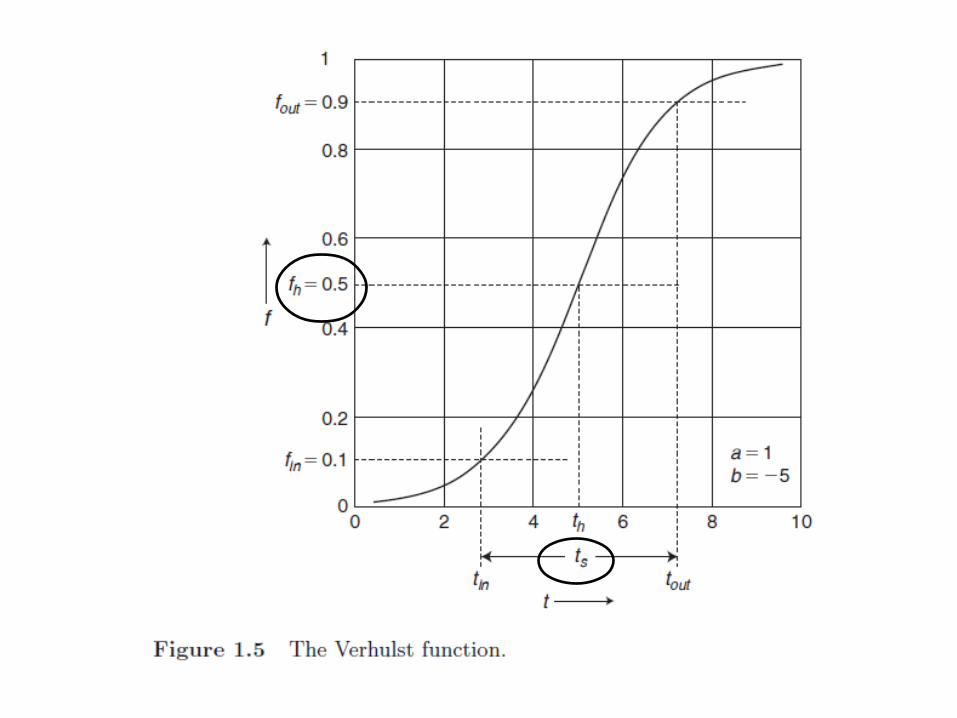
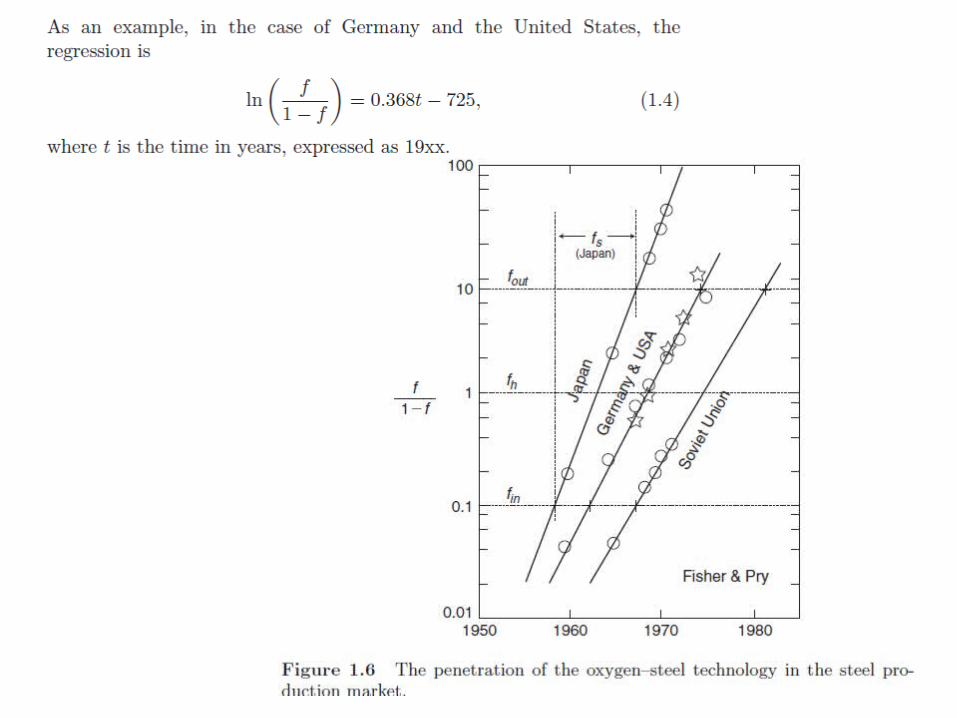
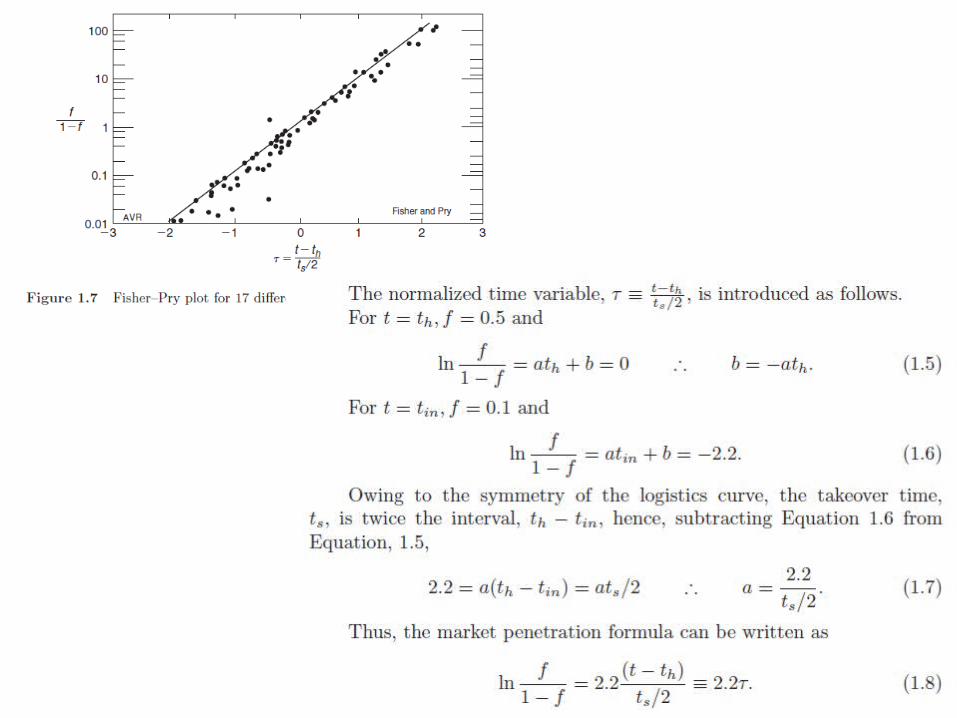
5. La función de penetración de mercadoEn 1846, Pierre Frankcois Verhulst propuso una formulación matemática plausible del crecimiento demográfico conocida ahora como la ecuación de Verhulst. Esta ecuación es un punto de partida excelente para entender el problema de la substitución tecnológica, es decir, la cuestión de cómo una tecnología más avanzada substituirá a una tecnología más vieja.
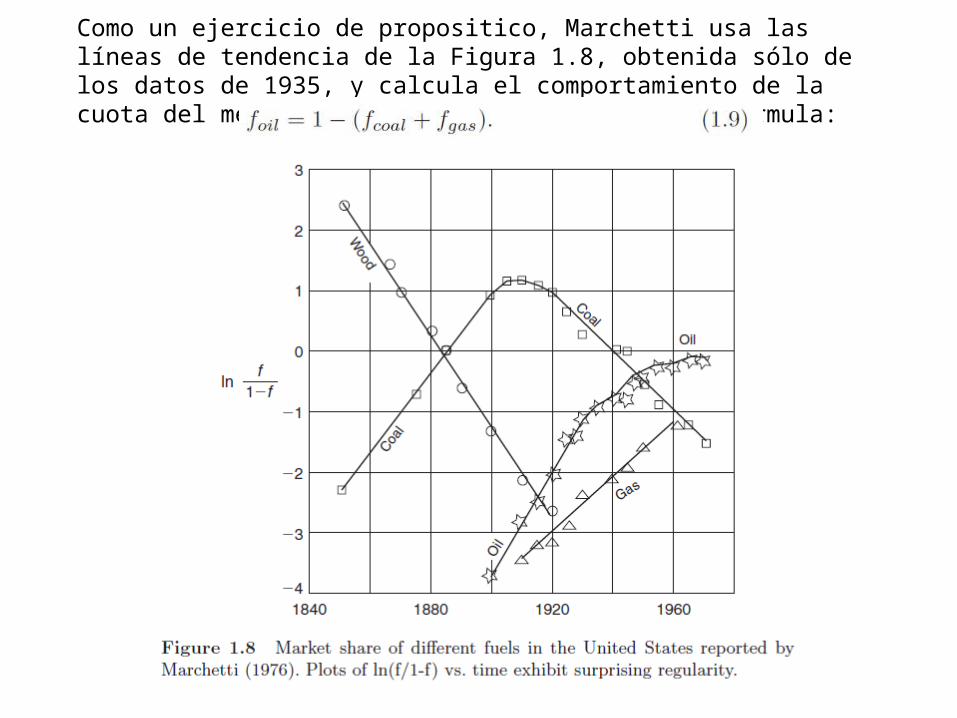
Como un ejercicio de propositico, Marchetti usa las líneas de tendencia de la Figura 1.8, obtenida sólo de los datos de 1935, y calcula el comportamiento de la cuota del mercado del petróleo empleando la formula:
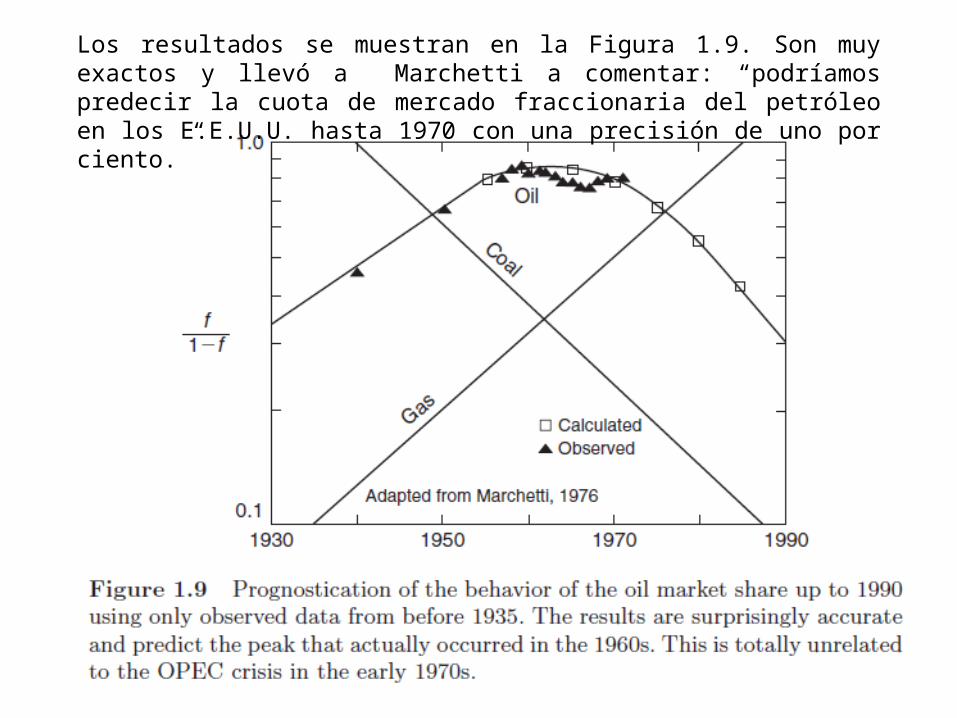
Los resultados se muestran en la Figura 1.9. Son muy exactos y llevó a Marchetti a comentar: “podríamos predecir la cuota de mercado fraccionaria del petróleo en los E.E.U.U. hasta 1970 con una precisión de uno por ciento.”
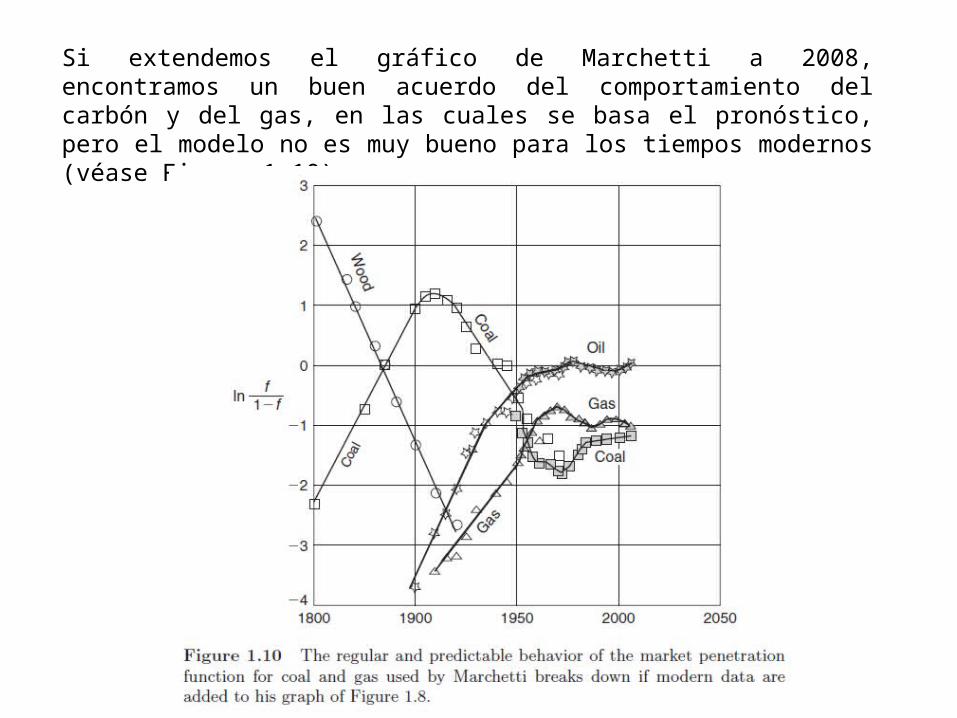
Si extendemos el gráfico de Marchetti a 2008, encontramos un buen acuerdo del comportamiento del carbón y del gas, en las cuales se basa el pronóstico, pero el modelo no es muy bueno para los tiempos modernos (véase Figura 1.10)
Si durante el período de la penetración del mercado, existe un aumento substancial en capital disponible, éste alterará el índice de penetración, aunque puede no aumentar lo beneficioso de la empresa. Sería de gran valor si fuera posible estimar cuánto se aceleraría la penetración en función de una cantidad de inversión dada en el nuevo mercado. Desafortunadamente, esto no es todavía posible. La formulación antedicha implica que cuando una tecnología comienza a penetrar el mercado, el mercado debe ya estar bien desarrollado y su grado de madurez determinará el índice de penetración eventualmente. Así, “la magnitud de la inversión externa original determina realmente las condiciones iniciales para el modelo” (Peterka, 1977). Las reglas de la penetración de mercado discutidas en esta subsección proporcionan una herramienta de gran alcance para el planeamiento, pero se deben utilizar con mucha precaución y con mucha atención a las suposiciones implícitas.
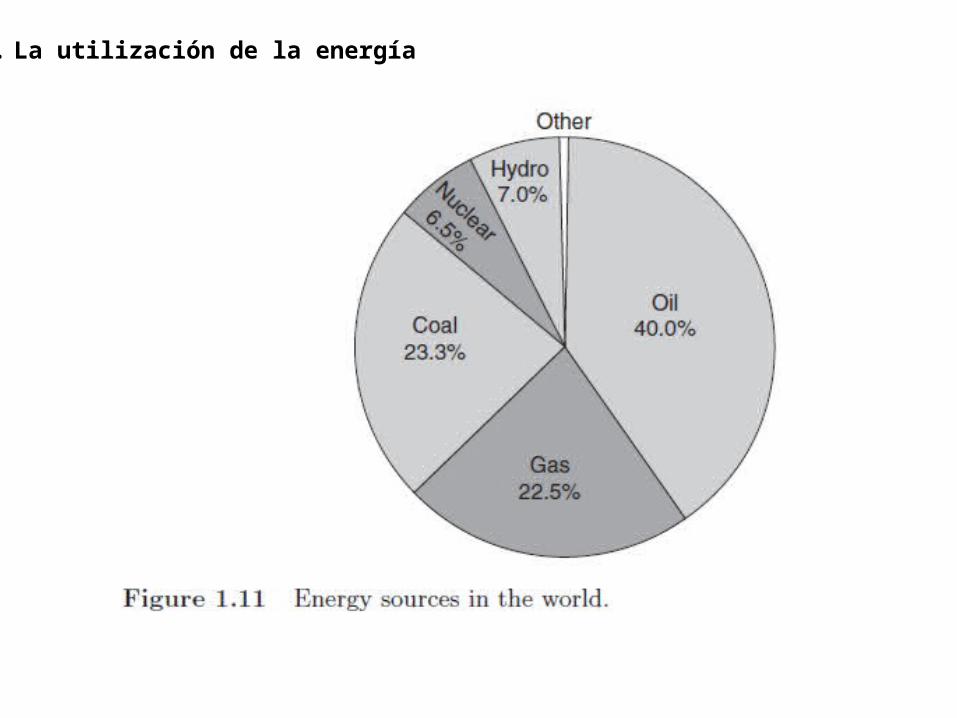
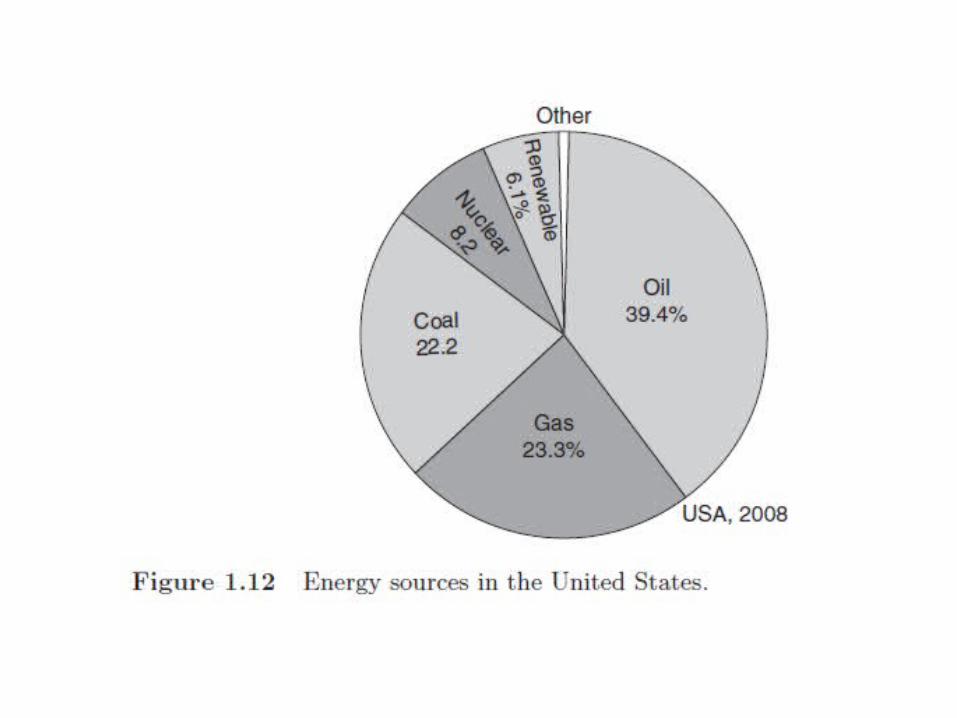
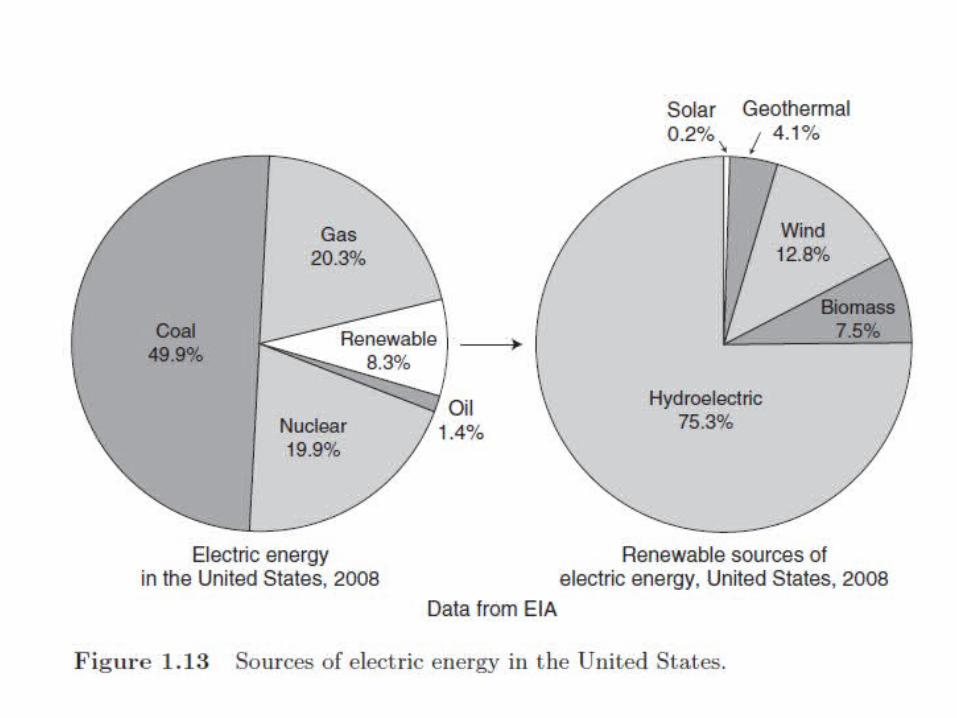
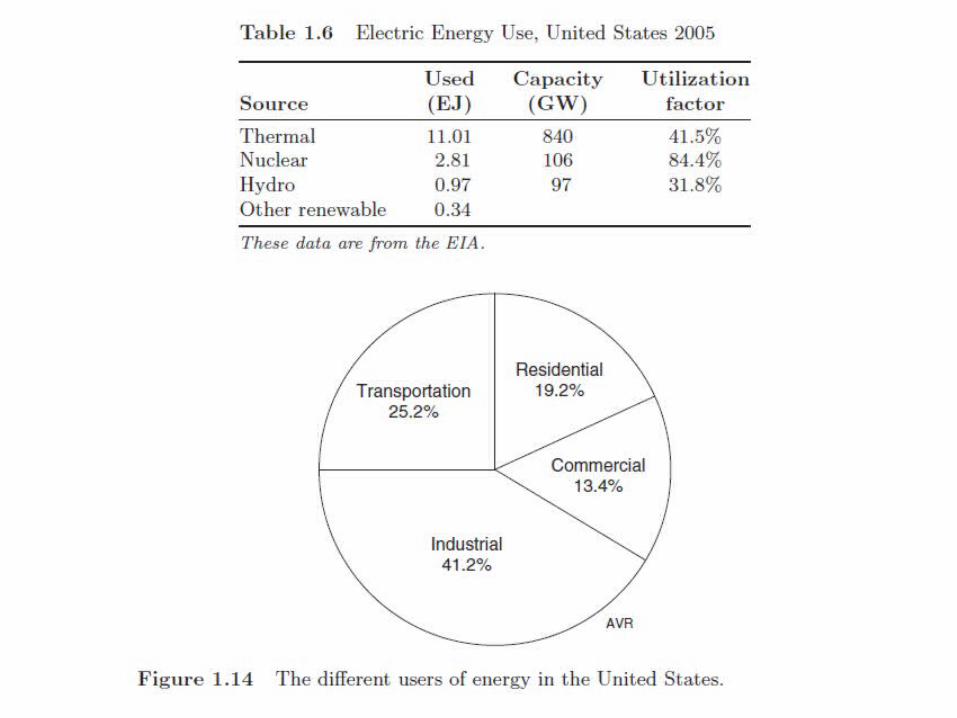
6. La utilización de la energía
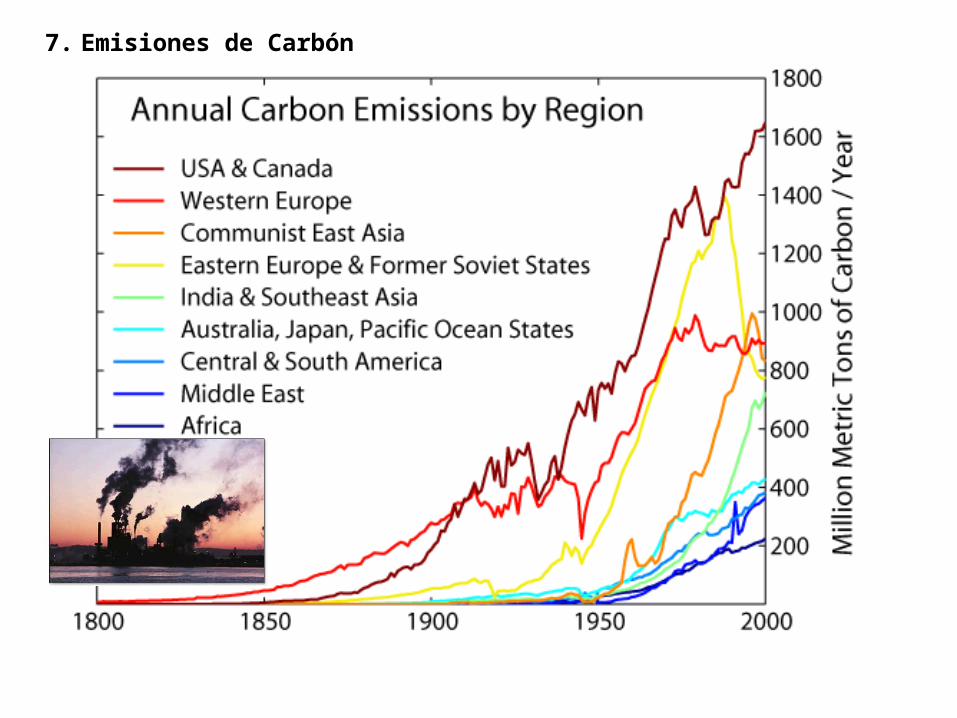
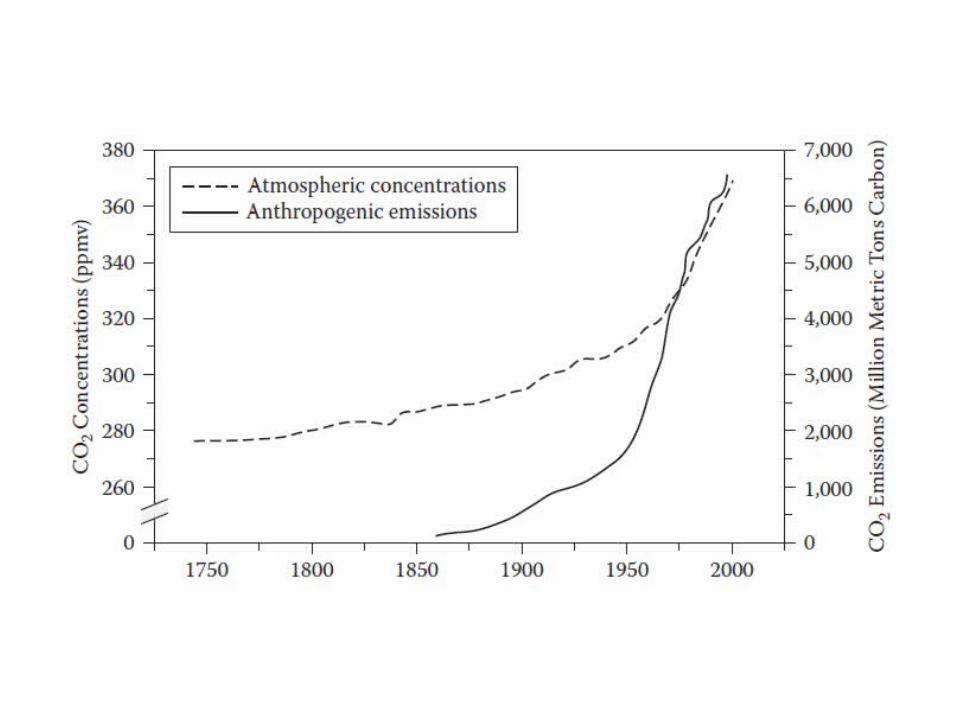
7. Emisiones de Carbón
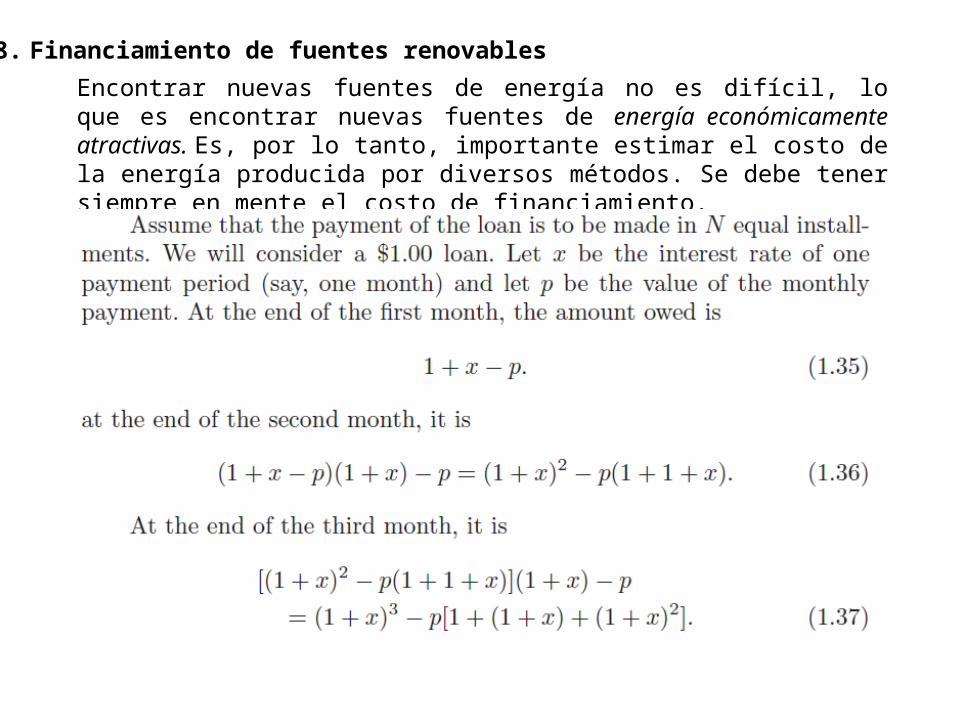
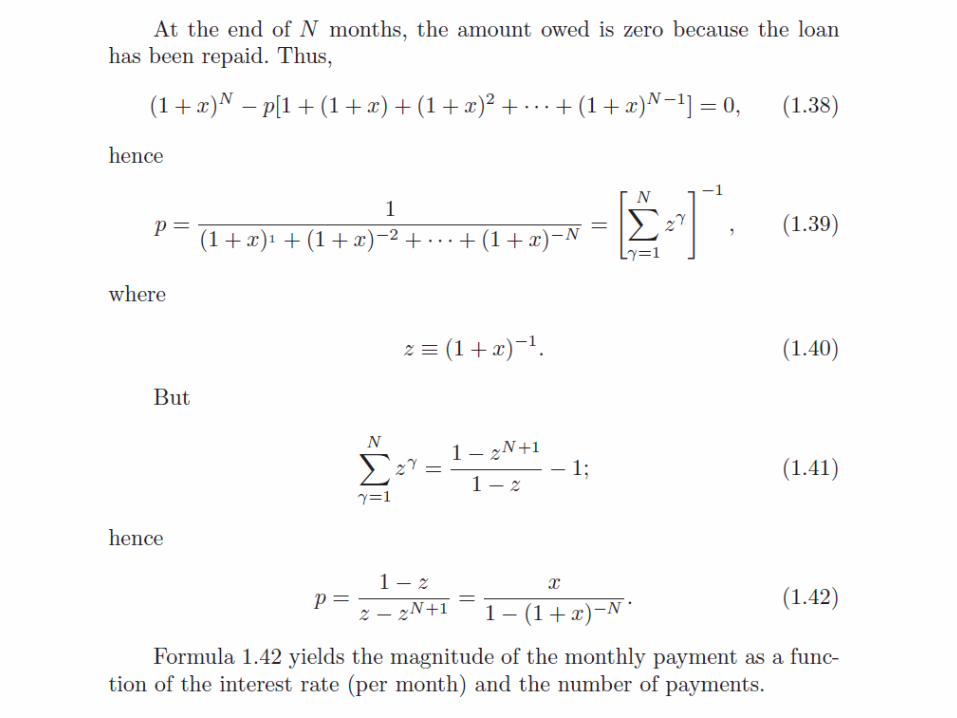
8. Financiamiento de fuentes renovables
Encontrar nuevas fuentes de energía no es difícil, lo que es encontrar nuevas fuentes de energía económicamente atractivas. Es, por lo tanto, importante estimar el costo de la energía producida por diversos métodos. Se debe tener siempre en mente el costo de financiamiento.
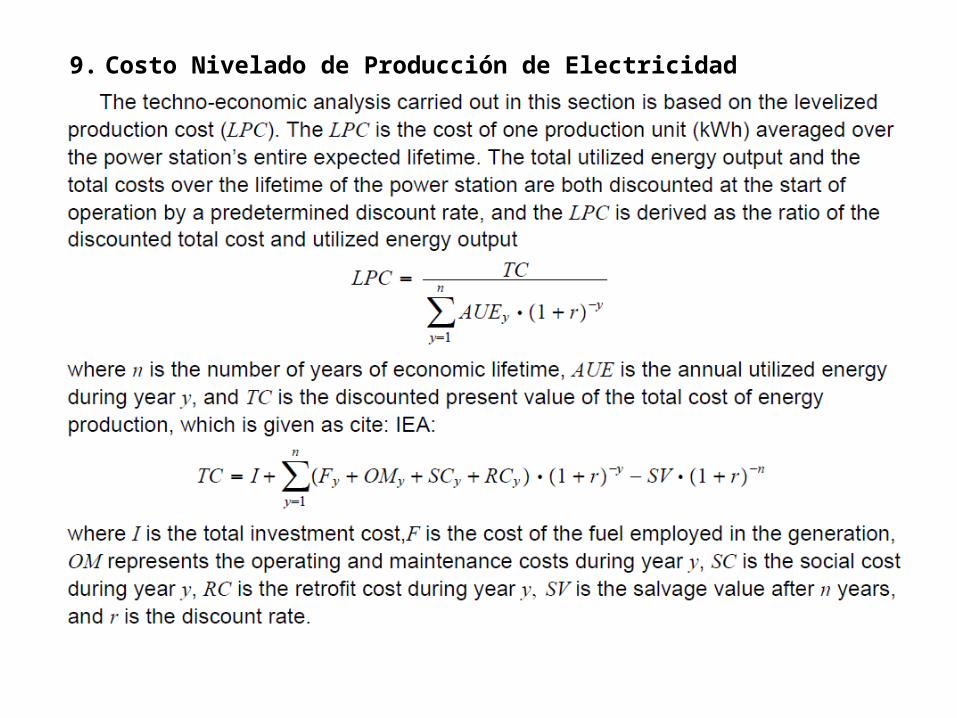
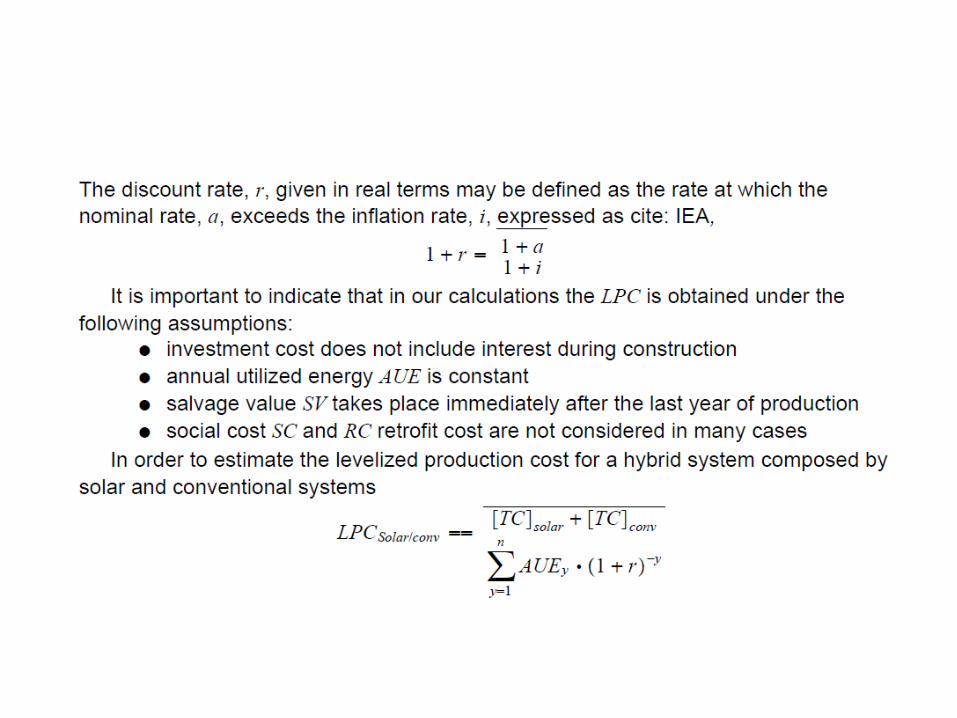
9. Costo Nivelado de Producción de Electricidad
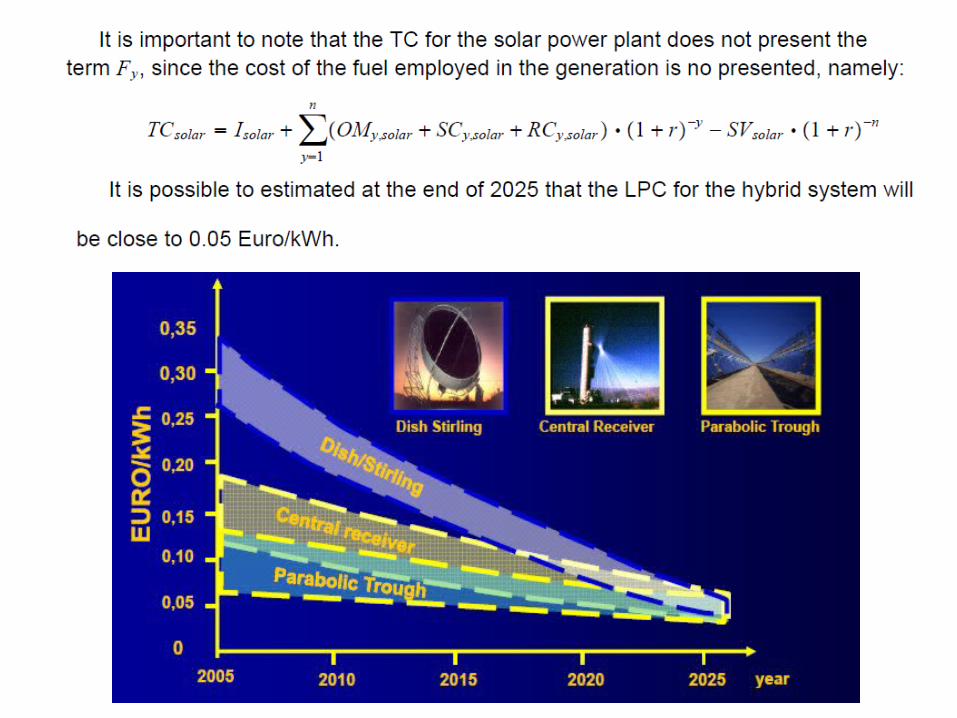
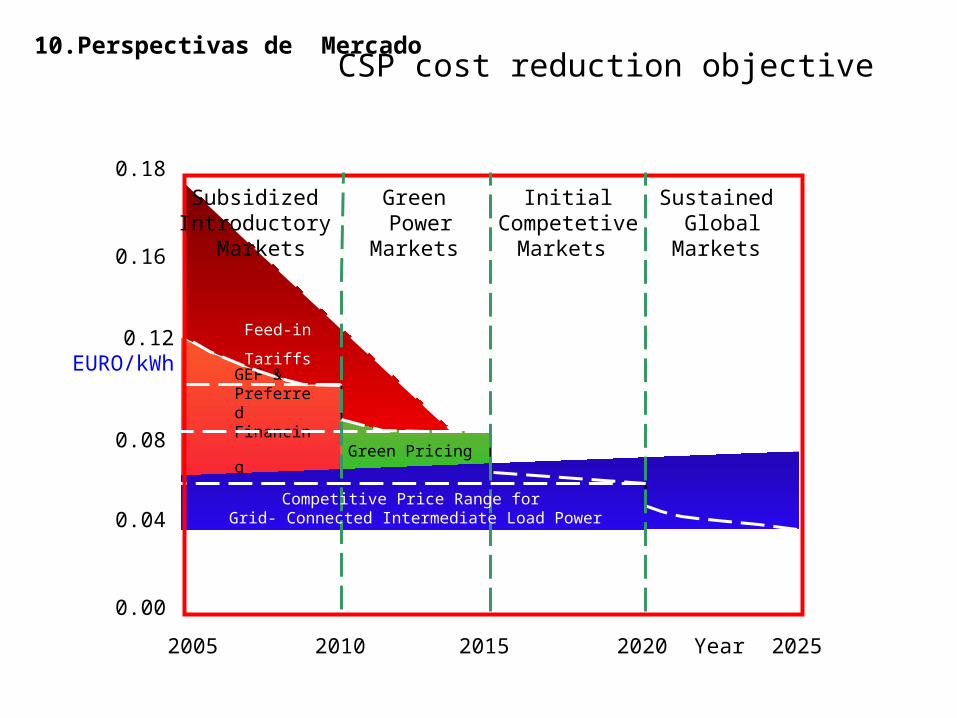
CSP cost reduction objective
0.00
0.16
0.04
0.08
GEF & Preferred
Financing Green Pricing
0.18Subsidized
Introductory Markets
Green Power
Markets
InitialCompetetive
Markets
Sustained Global
Markets
2005 2010 2015 2020 2025Year
0.12 EURO/kWh
Feed-in
Tariffs
Competitive Price Range for Grid- Connected Intermediate Load Power
10. Perspectivas de Mercado
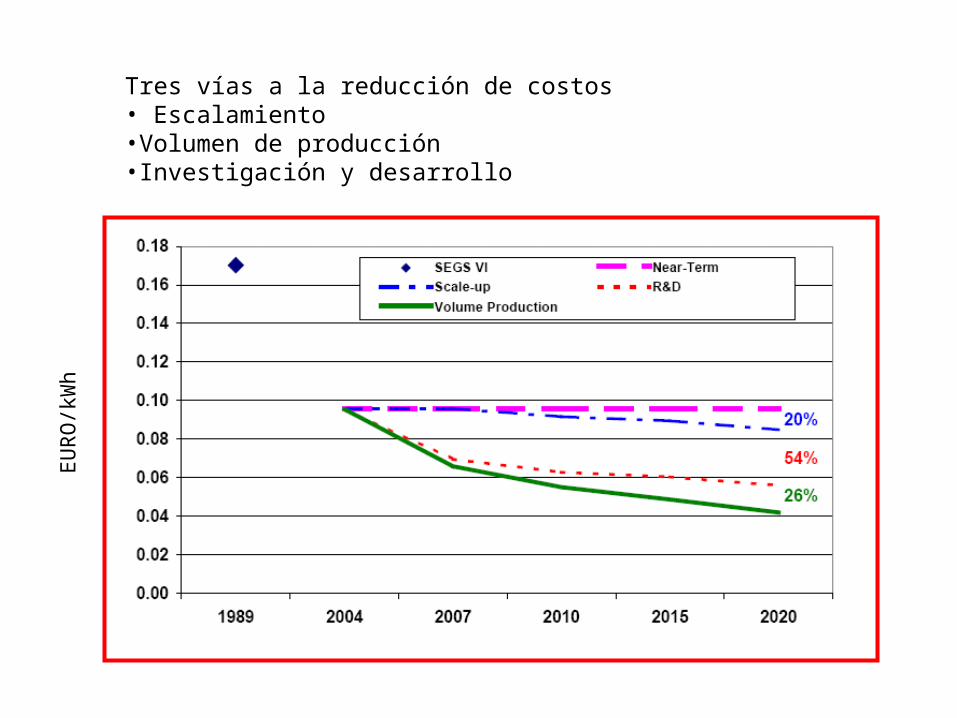
Tres vías a la reducción de costos• Escalamiento•Volumen de producción•Investigación y desarrollo
EU
RO
/kW
h
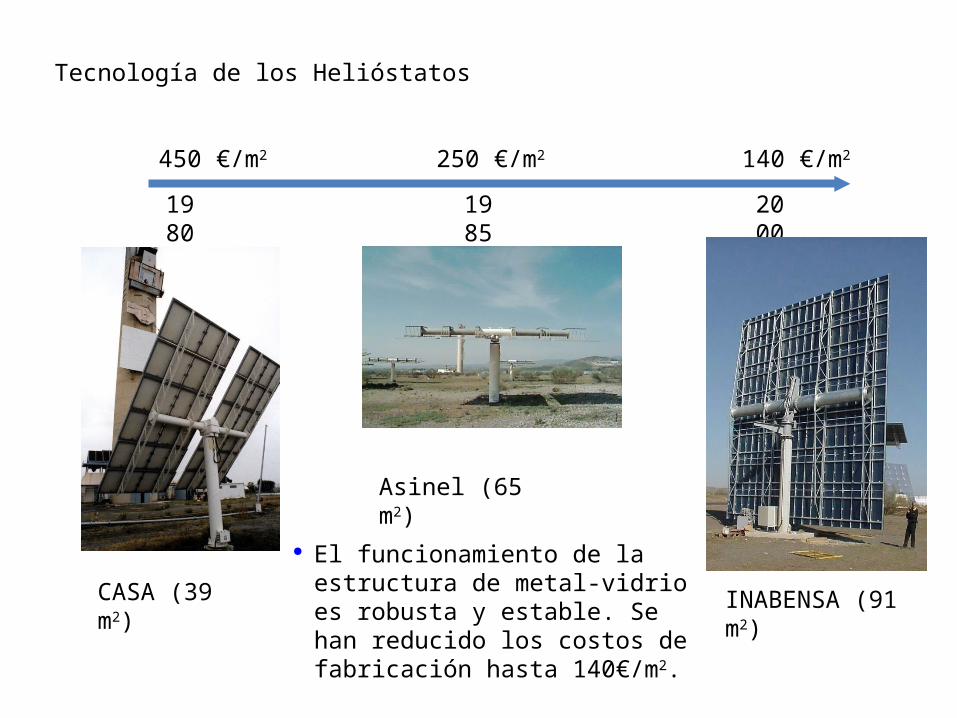
Tecnología de los Helióstatos
450 €/m2 250 €/m2 140 €/m2
1980
1985
2000
CASA (39 m2)
Asinel (65 m2)
INABENSA (91 m2)
El funcionamiento de la estructura de metal-vidrio es robusta y estable. Se han reducido los costos de fabricación hasta 140€/m2.
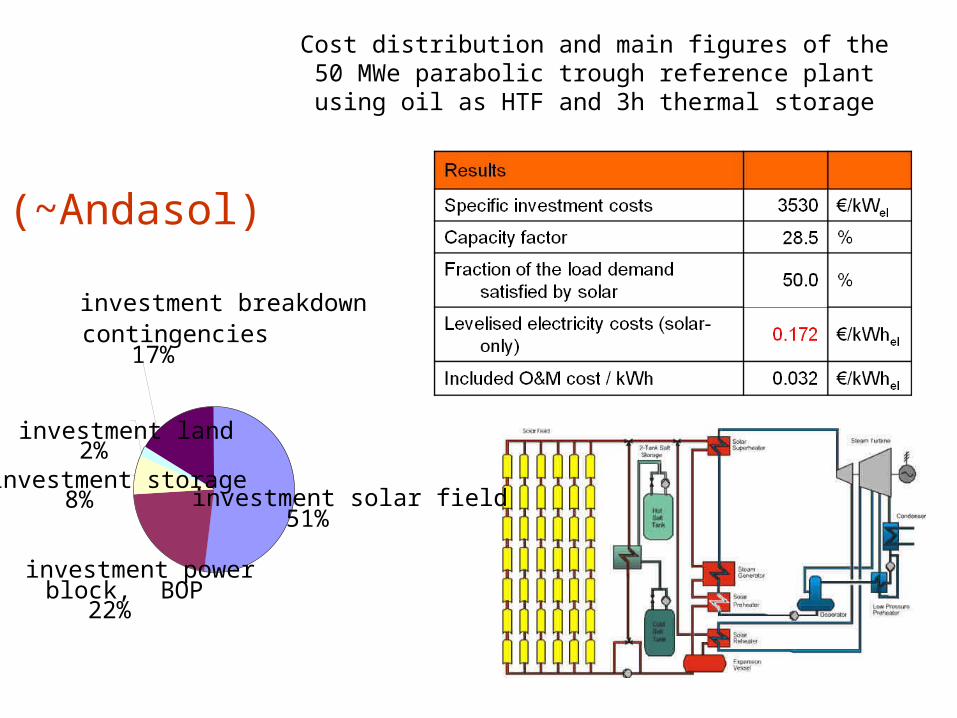
Cost distribution and main figures of the 50 MWe parabolic trough reference plant using oil as HTF and 3h thermal storage
investment breakdown
investment solar field51%
investment power block, BOP
22%
investment storage8%
investment land2%
contingencies17%
(~Andasol)
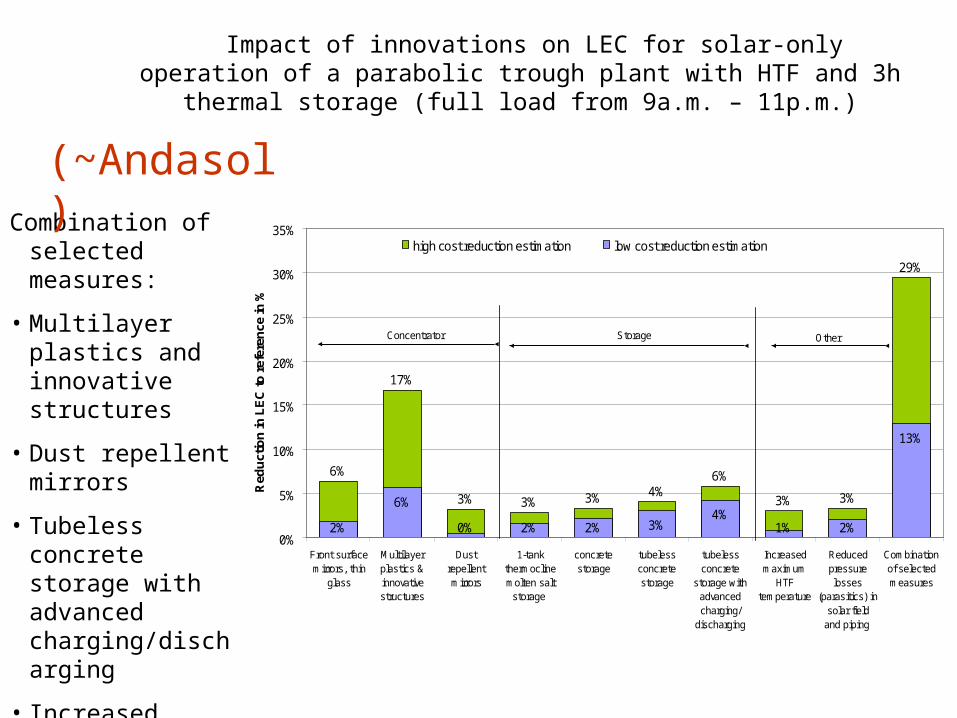
Impact of innovations on LEC for solar-only operation of a parabolic trough plant with HTF and 3h thermal storage (full load from 9a.m. – 11p.m.)
6%
17%
3% 3% 3% 4%6%
3% 3%
29%
2%
6%
0% 2% 2% 3%4%
1% 2%
13%
0%
5%
10%
15%
20%
25%
30%
35%
Front surfacemirrors, thin
glass
Multilayerplastics &innovativestructures
Dustrepellentmirrors
1-tankthermoclinemolten salt
storage
concretestorage
tubelessconcretestorage
tubelessconcrete
storage withadvancedcharging/
discharging
Increasedmaximum
HTFtemperature
Reducedpressurelosses
(parasitics) insolar field
and piping
Combinationof selectedmeasures
Red
uct
ion
in L
EC
to r
efer
ence
in %high cost reduction estimation low cost reduction estimation
Concentrator Storage Other
Combination of selected measures:
• Multilayer plastics and innovative structures
• Dust repellent mirrors
• Tubeless concrete storage with advanced charging/discharging
• Increased maximum HTF temperature
• Reduced parasitics
(~Andasol)
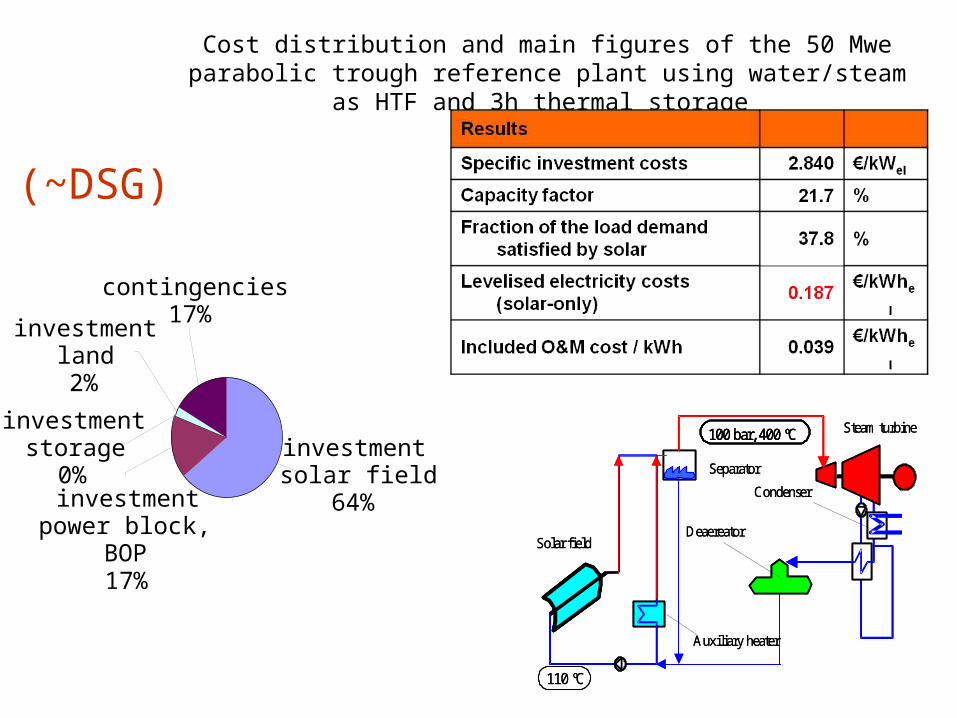
investment solar field
64%
investment storage
0%investment
power block, BOP17%
investment land2%
contingencies17%
Cost distribution and main figures of the 50 Mwe parabolic trough reference plant using water/steam as HTF and 3h thermal storage
110 ºC
100 bar, 400 ºC
Deaereator
Auxiliary heater
Solar field
Steam turbine
Condenser
Separator
110 ºC
100 bar, 400 ºC100 bar, 400 ºC
Deaereator
Auxiliary heater
Solar field
Steam turbine
Condenser
Separator
(~DSG)
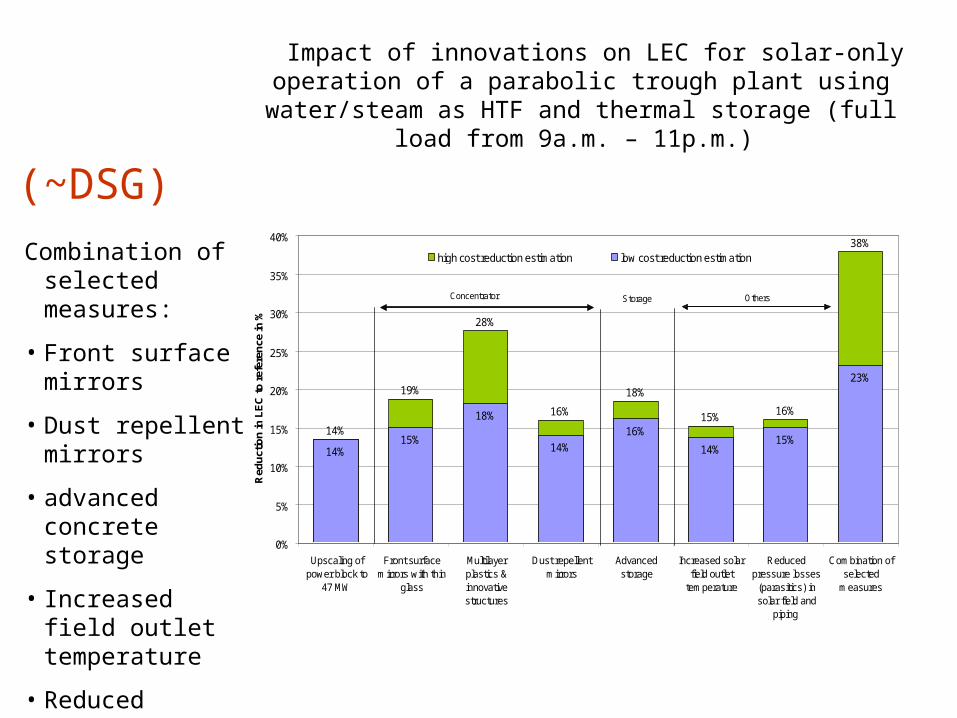
Impact of innovations on LEC for solar-only operation of a parabolic trough plant using water/steam as HTF and thermal
storage (full load from 9a.m. – 11p.m.)
14%
19%
28%
16%
18%
15%16%
38%
14%15%
18%
14%
16%
14%15%
23%
0%
5%
10%
15%
20%
25%
30%
35%
40%
Upscaling ofpower block to
47 MW
Front surfacemirrors with thin
glass
Multilayerplastics &innovativestructures
Dust repellentmirrors
Advancedstorage
Increased solarfield outlet
temperature
Reducedpressure losses
(parasitics) insolar field and
piping
Combination ofselected
measures
Red
uct
ion
in L
EC
to r
efer
ence
in %
high cost reduction estimation low cost reduction estimation
Concentrator Storage Others
Combination of selected measures:
• Front surface mirrors
• Dust repellent mirrors
• advanced concrete storage
• Increased field outlet temperature
• Reduced parasitics
(~DSG)
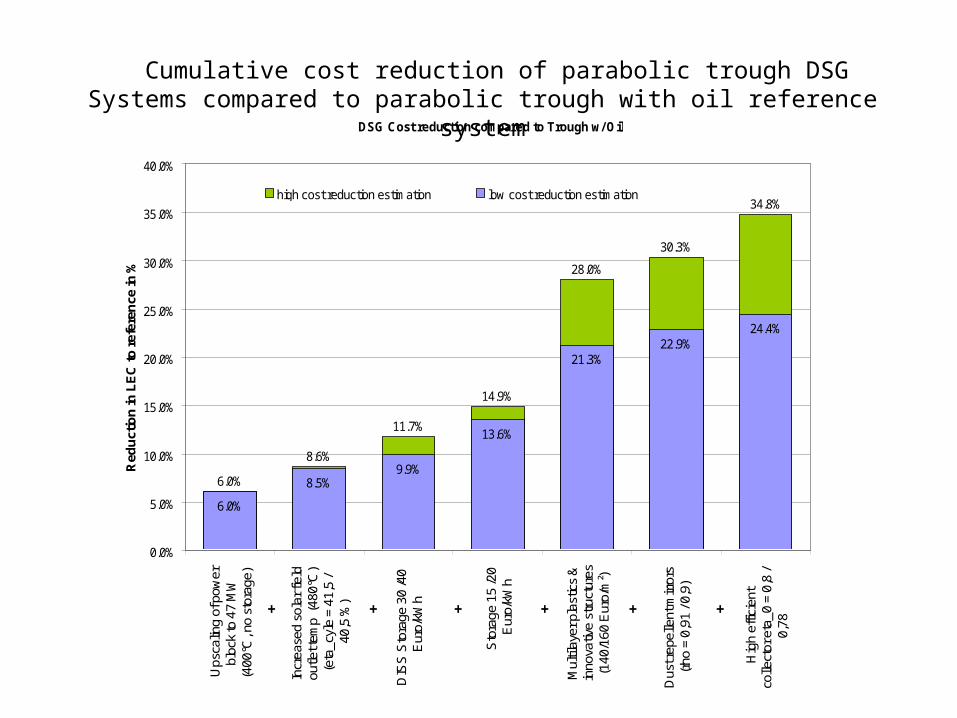
DSG Cost reduction compared to Trough w/ Oil
6.0%
8.6%
11.7%
14.9%
28.0%
30.3%
34.8%
6.0%
8.5%9.9%
13.6%
21.3%22.9%
24.4%
0.0%
5.0%
10.0%
15.0%
20.0%
25.0%
30.0%
35.0%
40.0%
Ups
calin
g of
pow
erbl
ock
to 4
7 M
W(4
00°C
, no
stor
age)
Incr
ease
d so
lar f
ield
outle
t tem
p (4
80°C
)(e
ta_c
yle
= 41
,5 /
40,5
%)
DIS
S S
tora
ge 3
0 /4
0E
uro/
kWh
Sto
rage
15
/20
Eur
o/kW
h
Mul
tilay
er p
last
ics
&in
nova
tive
stru
ctur
es(1
40/1
60 E
uro/
m²)
Dus
t rep
elle
nt m
irror
s(r
ho =
0,9
1 / 0
,9)
Hig
h ef
ficie
ntco
llect
or e
ta_0
= 0
,8 /
0,78
Red
uct
ion
in L
EC
to r
efer
ence
in %
high cost reduction estimation low cost reduction estimation
+ + + + + +
Cumulative cost reduction of parabolic trough DSG Systems compared to parabolic trough with oil reference system
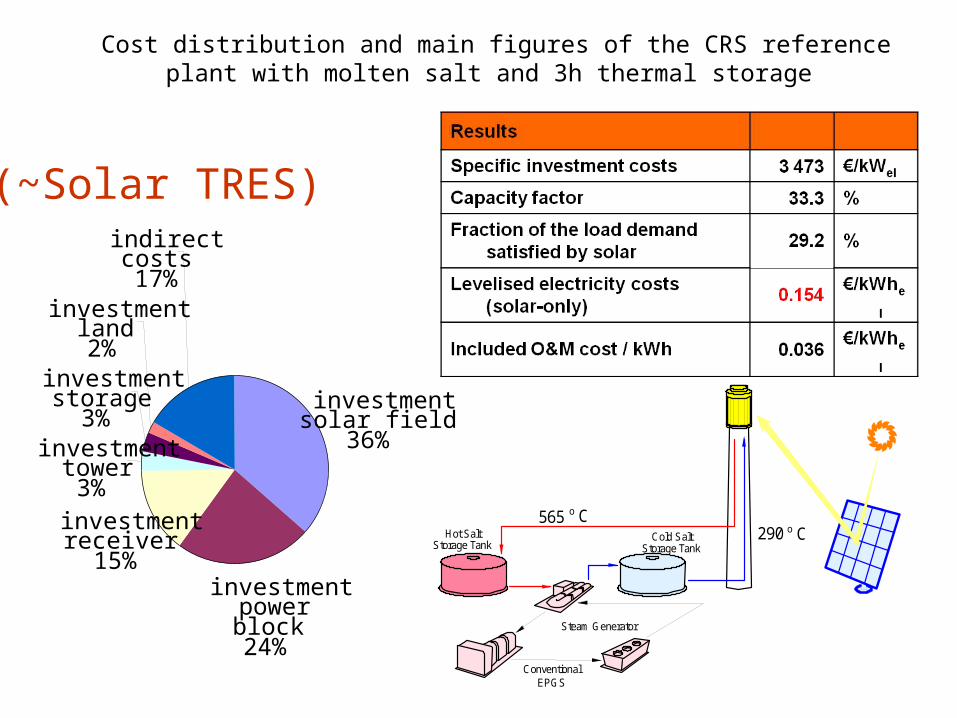
Storage TankCold Salt
Storage TankHot Salt
ConventionalEPGS
Steam Generator
o C565290 o C
Cost distribution and main figures of the CRS reference plant with molten salt and 3h thermal storage
investmentsolar field
36%
investment powerblock24%
investmentreceiver
15%
investmenttower3%
investmentstorage
3%
investmentland2%
indirectcosts17%
(~Solar TRES)
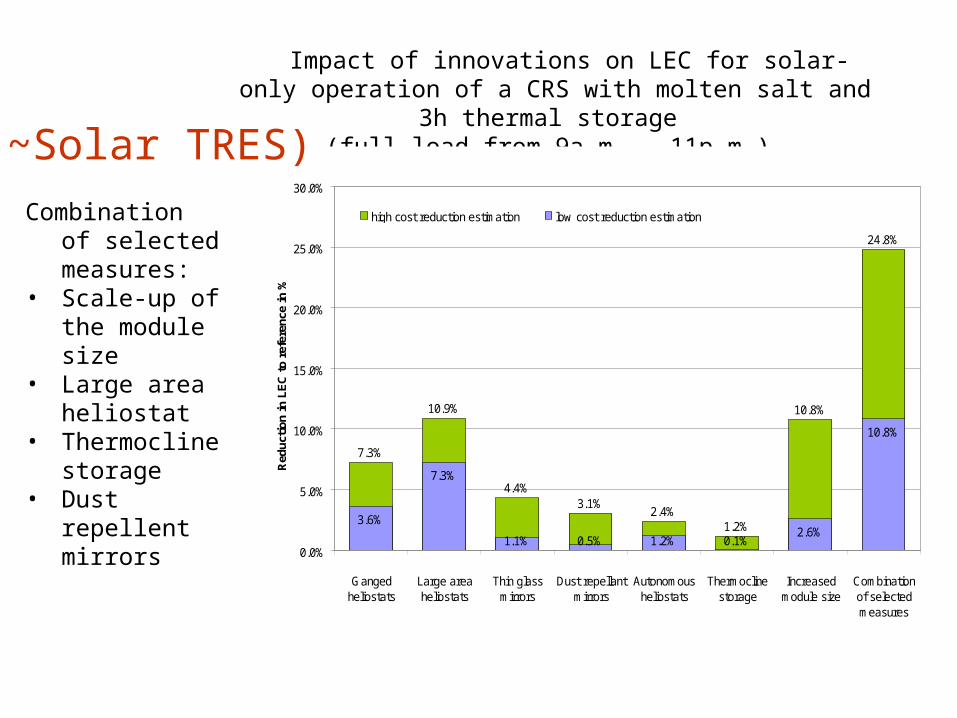
Impact of innovations on LEC for solar-only operation of a CRS with molten salt and 3h thermal storage
(full load from 9a.m. – 11p.m.)
Combination of selected measures:
• Scale-up of the module size
• Large area heliostat
• Thermocline storage
• Dust repellent mirrors
7.3%
10.9%
4.4%3.1%
2.4%1.2%
10.8%
24.8%
3.6%
7.3%
1.1% 0.5% 1.2% 0.1%2.6%
10.8%
0.0%
5.0%
10.0%
15.0%
20.0%
25.0%
30.0%
Gangedheliostats
Large areaheliostats
Thin glassmirrors
Dust repellantmirrors
Autonomousheliostats
Thermoclinestorage
Increasedmodule size
Combinationof selectedmeasures
Red
ucti
on in
LE
C t
o re
fere
nce
in %
high cost reduction estimation low cost reduction estimation
(~Solar TRES)
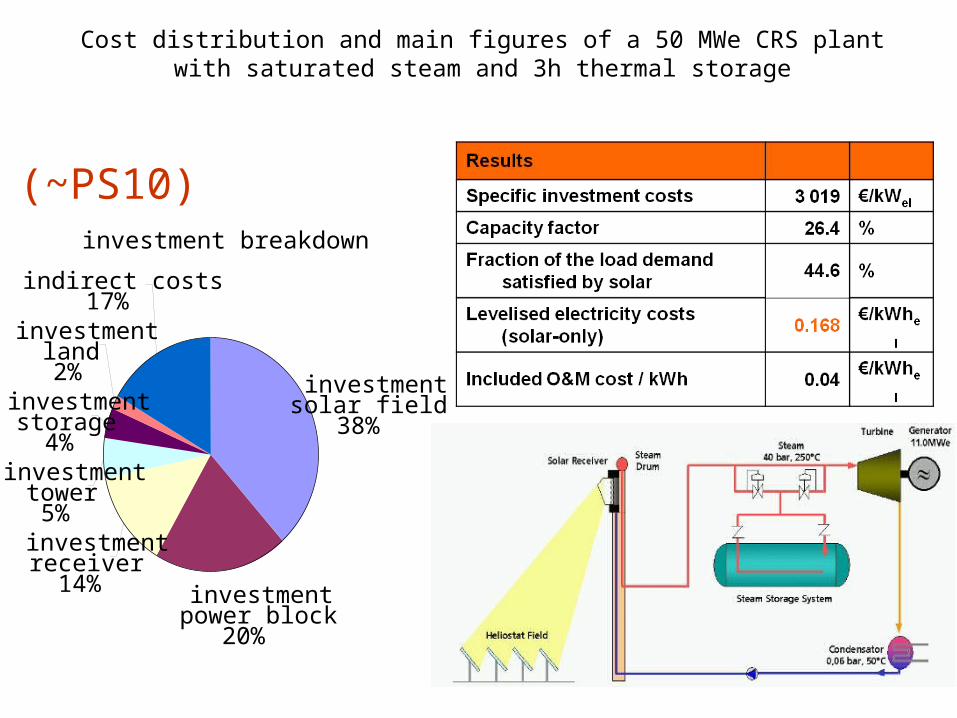
investment breakdown
investmentsolar field
38%
investmentpower block
20%
investmentreceiver
14%
investmenttower5%
investmentstorage
4%
investmentland2%
indirect costs17%
Cost distribution and main figures of a 50 MWe CRS plant with saturated steam and 3h thermal storage
(~PS10)
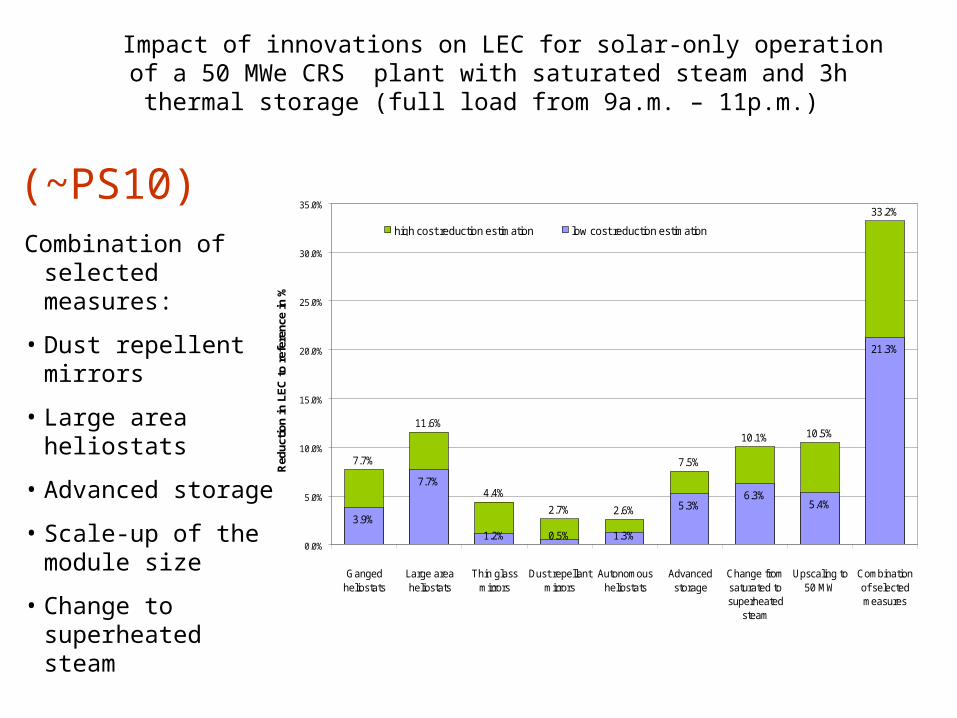
Impact of innovations on LEC for solar-only operation of a 50 MWe CRS plant with saturated steam and 3h thermal storage (full load from 9a.m. – 11p.m.)
7.7%
11.6%
4.4%
2.7% 2.6%
7.5%
10.1% 10.5%
33.2%
3.9%
7.7%
1.2% 0.5% 1.3%
5.3%6.3%
5.4%
21.3%
0.0%
5.0%
10.0%
15.0%
20.0%
25.0%
30.0%
35.0%
Gangedheliostats
Large areaheliostats
Thin glassmirrors
Dust repellantmirrors
Autonomousheliostats
Advancedstorage
Change fromsaturated tosuperheated
steam
Upscaling to50 MW
Combinationof selectedmeasures
Red
ucti
on in
LE
C t
o re
fere
nce
in %
high cost reduction estimation low cost reduction estimation
Combination of selected measures:
• Dust repellent mirrors
• Large area heliostats
• Advanced storage
• Scale-up of the module size
• Change to superheated steam
(~PS10)
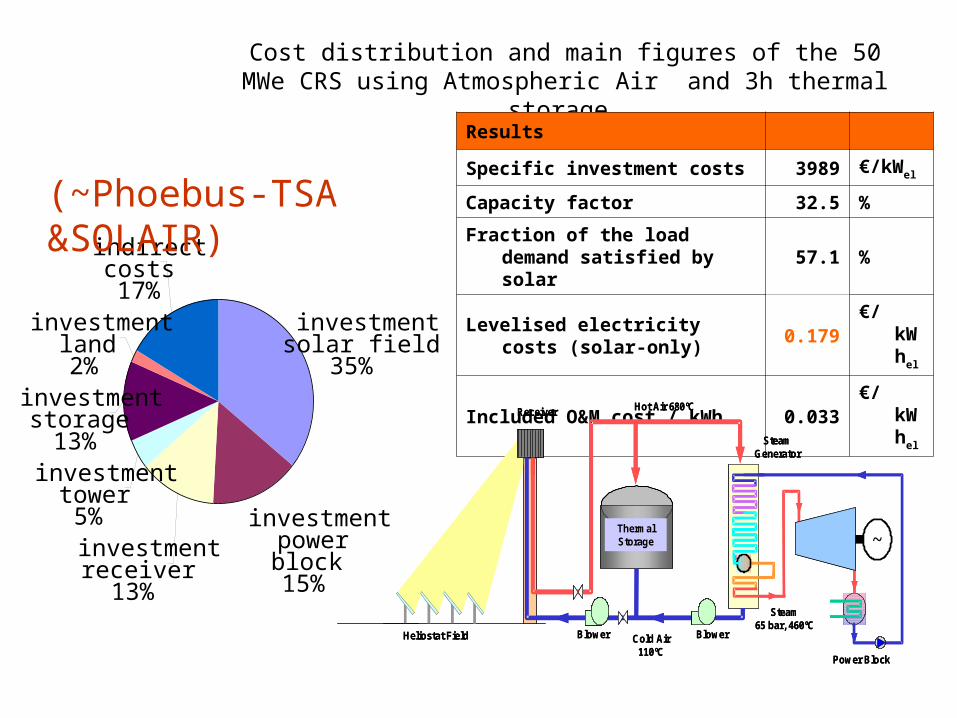
Cost distribution and main figures of the 50 MWe CRS using Atmospheric Air and 3h thermal storage
Results
Specific investment costs 3989 €/kWel
Capacity factor 32.5 %
Fraction of the load demand satisfied by solar
57.1 %
Levelised electricity costs (solar-only)
0.179 €/kWhel
Included O&M cost / kWh 0.033 €/kWhel
~
Heliostat Field
Receiver
Power Block
Steam Generator
Thermal Storage
Blower
Hot Air 680ºC
Cold Air 110ºC
Blower
Steam65 bar, 460ºC
~
Heliostat Field
Receiver
Power Block
Steam Generator
Thermal Storage
Blower
Hot Air 680ºC
Cold Air 110ºC
Blower
Steam65 bar, 460ºC
investmentsolar field
35%
investment powerblock15%
investmentreceiver
13%
investmenttower5%
investmentstorage
13%
investmentland2%
indirectcosts17%
(~Phoebus-TSA &SOLAIR)
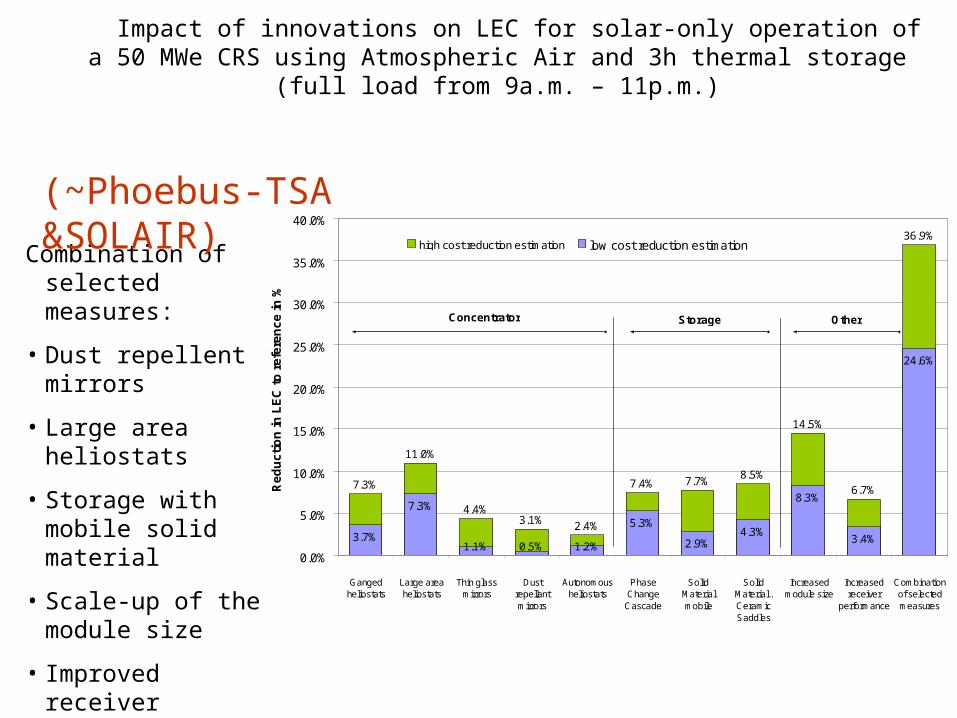
Impact of innovations on LEC for solar-only operation of a 50 MWe CRS using Atmospheric Air and 3h thermal storage
(full load from 9a.m. – 11p.m.)
7.3%
11.0%
4.4%3.1% 2.4%
7.4% 7.7%8.5%
14.5%
6.7%
36.9%
3.7%
7.3%
1.1% 0.5% 1.2%
5.3%
2.9%4.3%
8.3%
3.4%
24.6%
0.0%
5.0%
10.0%
15.0%
20.0%
25.0%
30.0%
35.0%
40.0%
Gangedheliostats
Large areaheliostats
Thin glassmirrors
Dustrepellantmirrors
Autonomousheliostats
PhaseChange
Cascade
SolidMaterialmobile
SolidMaterial .CeramicSaddles
Increasedmodule size
Increasedreceiver
performance
Combinationof selectedmeasures
Re
du
cti
on
in
LE
C t
o r
efe
ren
ce
in
%
high cost reduction estimation low cost reduction estimation
Concentrator Storage Other
Combination of selected measures:
• Dust repellent mirrors
• Large area heliostats
• Storage with mobile solid material
• Scale-up of the module size
• Improved receiver performance
(~Phoebus-TSA &SOLAIR)
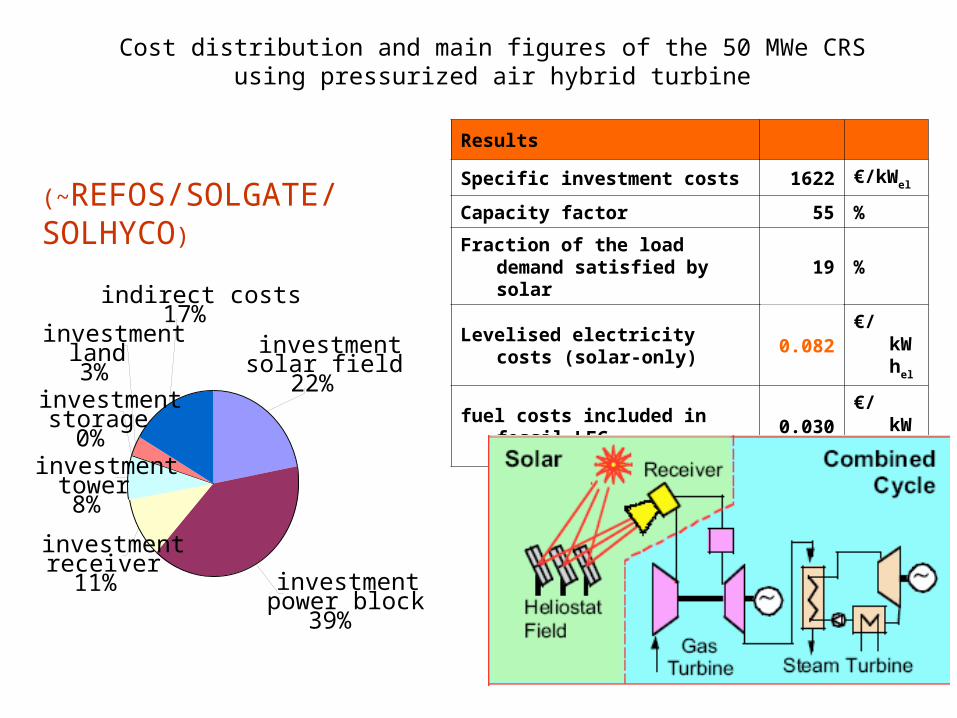
Cost distribution and main figures of the 50 MWe CRS using pressurized air hybrid turbine
Results
Specific investment costs 1622 €/kWel
Capacity factor 55 %
Fraction of the load demand satisfied by solar
19 %
Levelised electricity costs (solar-only)
0.082 €/kWhel
fuel costs included in fossil LEC 0.030 €/kWhel
investmenttower8%
investmentstorage
0%
investmentland3%
investmentsolar field
22%
investmentpower block
39%
indirect costs17%
investmentreceiver11%
(~REFOS/SOLGATE/SOLHYCO)
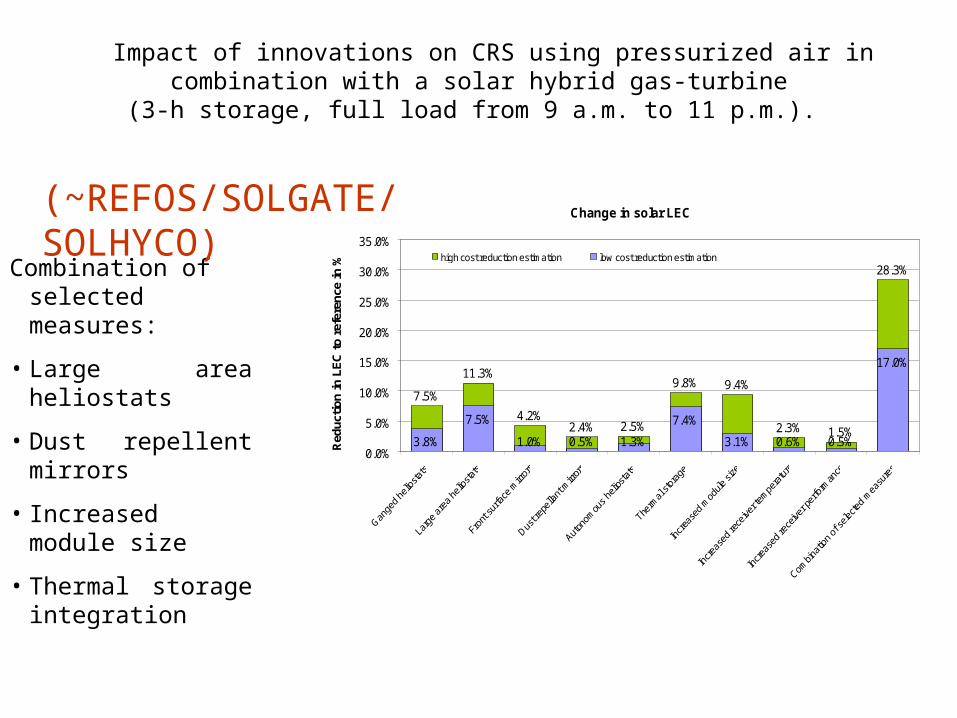
Impact of innovations on CRS using pressurized air in combination with a solar hybrid gas-turbine
(3-h storage, full load from 9 a.m. to 11 p.m.).
Combination of selected measures:
• Large area heliostats
• Dust repellent mirrors
• Increased module size
• Thermal storage integration
Change in solar LEC
7.5%
11.3%
4.2%2.4% 2.5%
9.8% 9.4%
2.3% 1.5%
28.3%
3.8%
7.5%
1.0% 0.5% 1.3%
7.4%
3.1% 0.6% 0.5%
17.0%
0.0%
5.0%
10.0%
15.0%
20.0%
25.0%
30.0%
35.0%
Red
ucti
on in
LE
C t
o re
fere
nce
in %
high cost reduction estimation low cost reduction estimation
(~REFOS/SOLGATE/SOLHYCO)
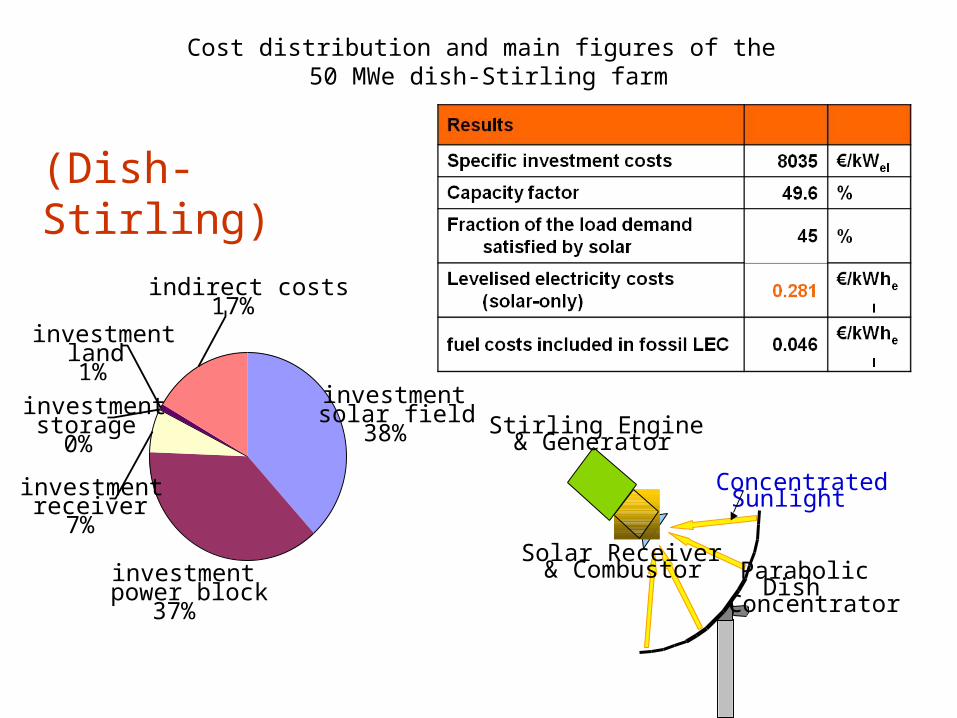
Cost distribution and main figures of the 50 MWe dish-Stirling farm
Solar Receiver & Combustor Parabolic
DishConcentrator
ConcentratedSunlight
Stirling Engine& Generator
investment solar field
38%
investment power block
37%
investmentstorage
0%
investment land1%
indirect costs17%
investment receiver
7%
(Dish-Stirling)
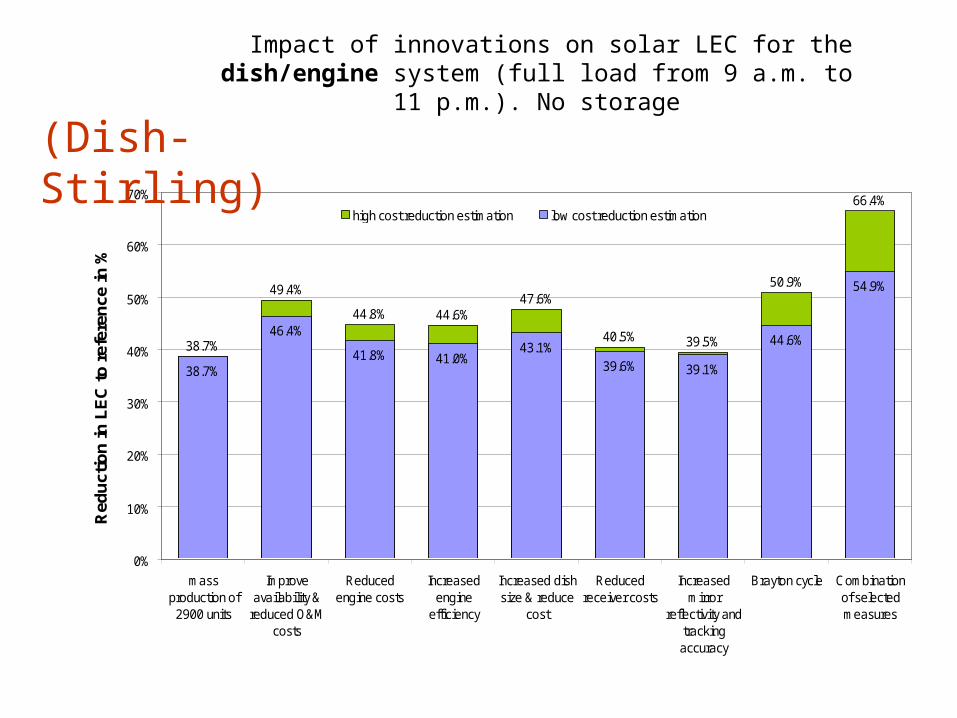
Impact of innovations on solar LEC for the dish/engine system (full load from 9 a.m. to 11 p.m.). No storage
38.7%
49.4%
44.8% 44.6%47.6%
40.5% 39.5%
50.9%
66.4%
38.7%
46.4%
41.8% 41.0%43.1%
39.6% 39.1%
44.6%
54.9%
0%
10%
20%
30%
40%
50%
60%
70%
massproduction of
2900 units
Improveavailability &
reduced O&Mcosts
Reducedengine costs
Increasedengine
efficiency
Increased dishsize & reduce
cost
Reducedreceiver costs
Increasedmirror
reflectivity andtrackingaccuracy
Brayton cycle Combinationof selectedmeasures
Red
uct
ion
in L
EC
to
ref
eren
ce in
%
high cost reduction estimation low cost reduction estimation
Change in solar LEC(Dish-Stirling)
0%
10%
20%
30%
40%
50%
Troug
h with
HTF
Troug
h DSG
CRS molt
en sa
lt
CRS sat
urat
ed s
team
CRS atm
osph
eric
air
CRS pre
ssur
ized
air /
solar
Dish e
ngine
rela
tive
cost
red
uct
ion
optimistic cost reduction estimationpessimistic cost reduction estimation
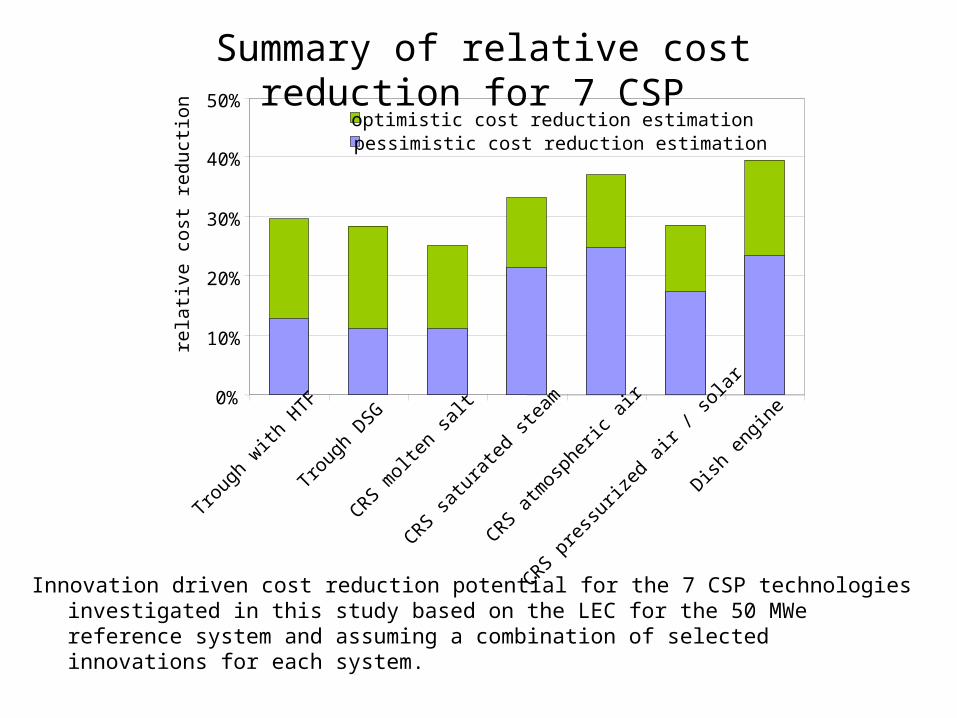
Summary of relative cost reduction for 7 CSP
Innovation driven cost reduction potential for the 7 CSP technologies investigated in this study based on the LEC for the 50 MWe reference system and assuming a combination of selected innovations for each system.
CURSO DE CAPACITACIÓN VIRTUAL: INTRODUCCIÓN AL ESTUDIO DE LA
TERMOCONVERSIÓN DE LA ENERGÍA SOLAR
Con especial atención al Profesor Victorio Oxilia y al Profesor Santiago Palacios
Muchas gracias a por la invitación a participar en el
Dr. Isaac Pilatowsky Figueroa [email protected]. Oscar Alfredo Jaramillo Salgado [email protected]
Centro de Investigación en Energía. Universidad Nacional Autónoma de México
SEPTIEMBRE DE 2009
Muchas gracias a todos Ustedes por la atención brinda a este curso
CENTRO DE INVESTIGACIÓN EN ENERGÍA www.cie.unam.mx
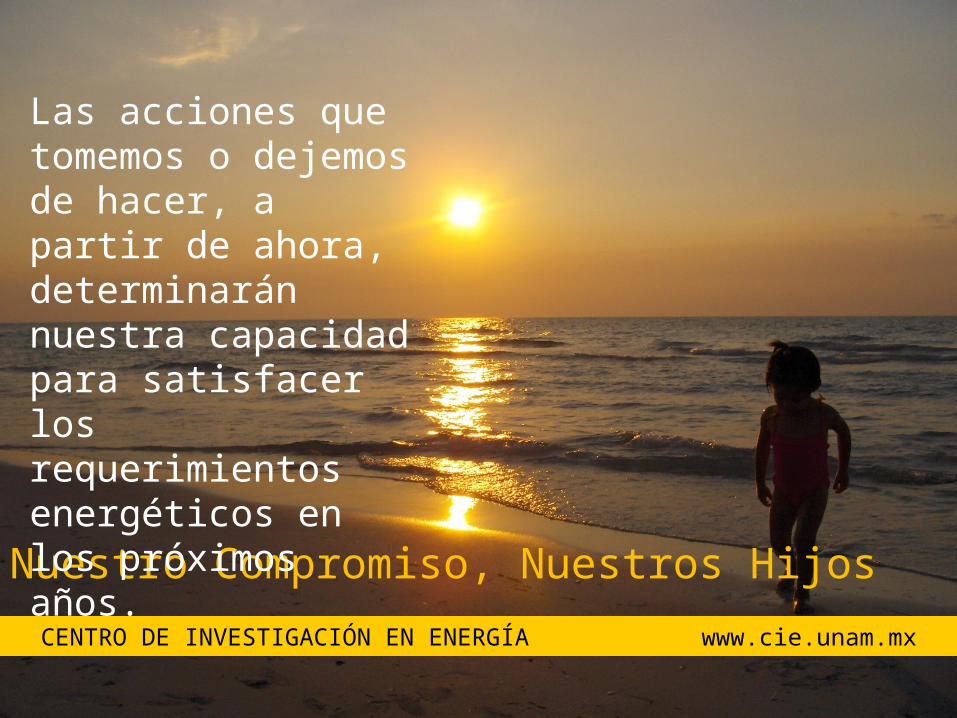
Nuestro Compromiso, Nuestros Hijos
Las acciones que tomemos o dejemos de hacer, a partir de ahora, determinarán nuestra capacidad para satisfacer los requerimientos energéticos en los próximos años.