Embed Size (px)
Citation preview
CAPSIM-Team FerrisNikita Motkur, Howie Hehrer, Cori Porasik, Priscilla
Gonzalez & Neha Noonemunthala
December 8, 2016- BUS 6990 Strategy Formulation and Org. Design
Mission
Premium products for the industry: our brand withstands the test of time. Ferris’ mission is to bring success and quality to our stakeholders.
We strive to offer excellent design, easy accessibility and best value to our customers.
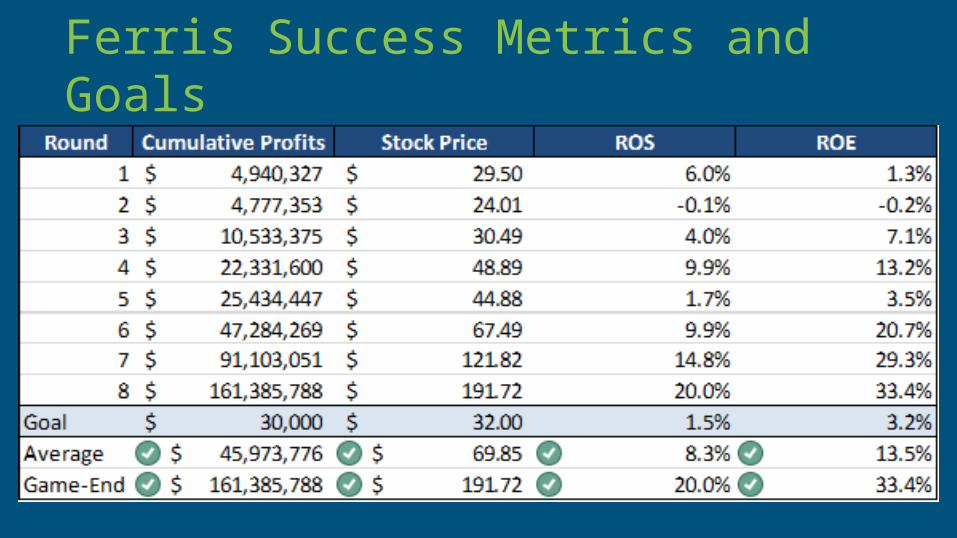
Ferris Success Metrics and Goals
Key Leadership- Org. Structure
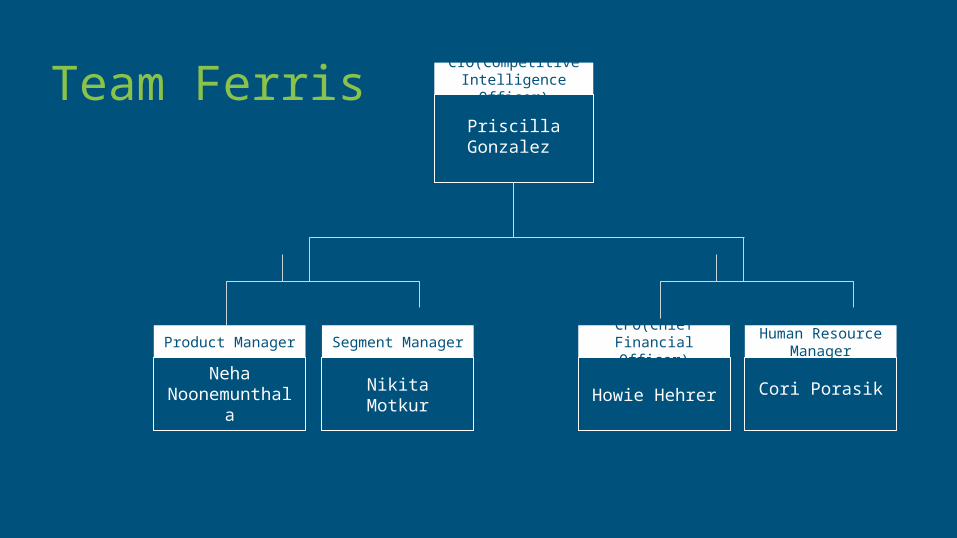
Team Ferris CIO(Competitive Intelligence
Officer)
Priscilla Gonzalez
Product Manager
Neha Noonemunthal
a
Segment Manager
Nikita Motkur
CFO(Chief Financial Officer)
Howie Hehrer
Human Resource Manager
Cori Porasik
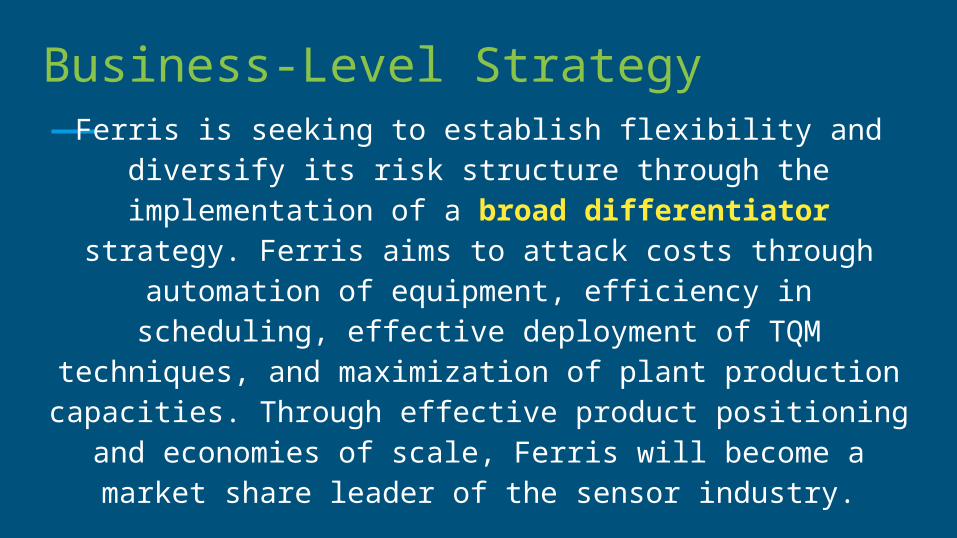
Ferris is seeking to establish flexibility and diversify its risk structure through the implementation of a broad
differentiator strategy. Ferris aims to attack costs through automation of equipment, efficiency in scheduling,
effective deployment of TQM techniques, and maximization of plant production capacities. Through
effective product positioning and economies of scale, Ferris will become a market share leader of the sensor industry.
Business-Level Strategy
09.05.XX
ANALYSIS OF COMPETITORS
EXECUTION:
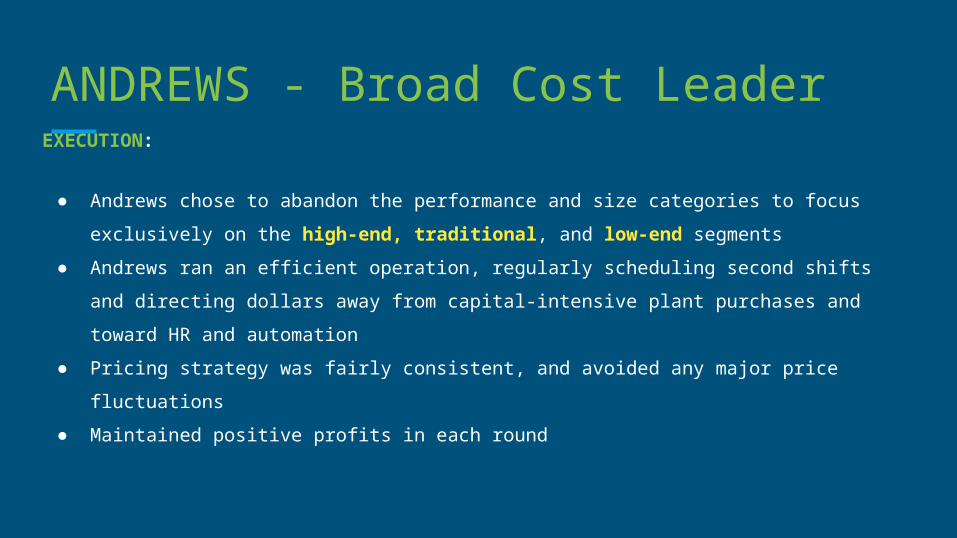
● Andrews chose to abandon the performance and size categories to focus exclusively on the high-end, traditional, and low-end segments
● Andrews ran an efficient operation, regularly scheduling second shifts and directing dollars away from capital-intensive plant purchases and toward HR and automation
● Pricing strategy was fairly consistent, and avoided any major price fluctuations● Maintained positive profits in each round
ANDREWS - Broad Cost Leader
09.05.XX
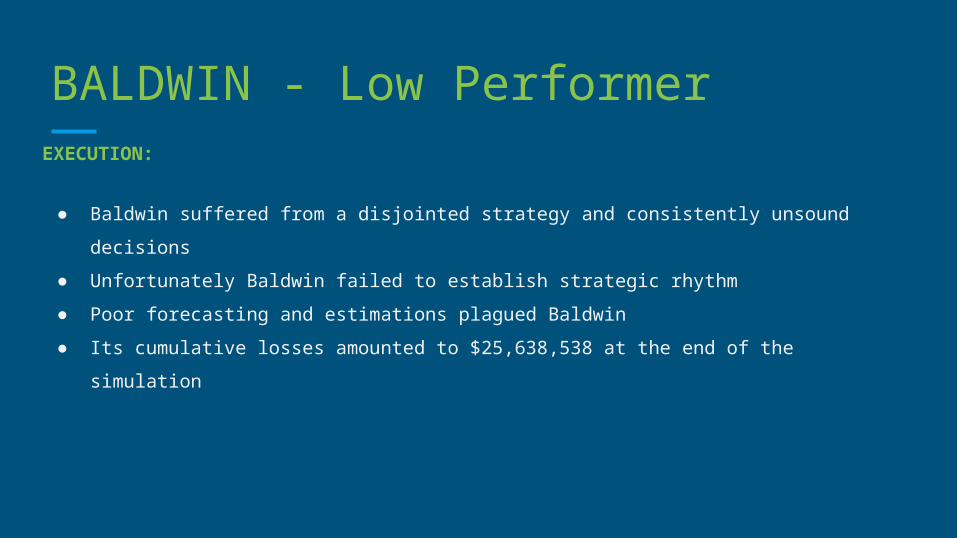
BALDWIN - Low PerformerEXECUTION:
● Baldwin suffered from a disjointed strategy and consistently unsound decisions● Unfortunately Baldwin failed to establish strategic rhythm● Poor forecasting and estimations plagued Baldwin ● Its cumulative losses amounted to $25,638,538 at the end of the simulation
09.05.XX
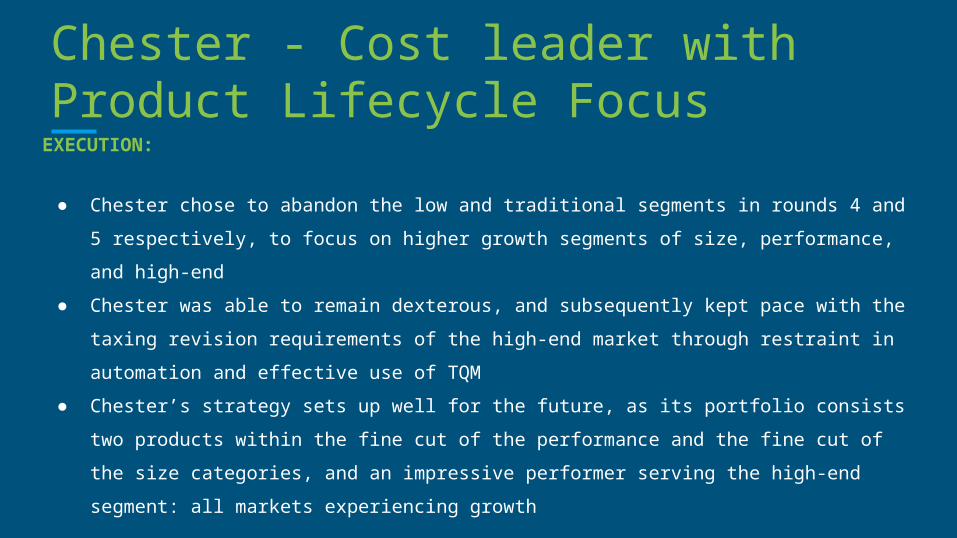
Chester - Cost leader with Product Lifecycle Focus
EXECUTION:
● Chester chose to abandon the low and traditional segments in rounds 4 and 5 respectively, to focus on higher growth segments of size, performance, and high-end
● Chester was able to remain dexterous, and subsequently kept pace with the taxing revision requirements of the high-end market through restraint in automation and effective use of TQM
● Chester’s strategy sets up well for the future, as its portfolio consists two products within the fine cut of the performance and the fine cut of the size categories, and an impressive performer serving the high-end segment: all markets experiencing growth
09.05.XX
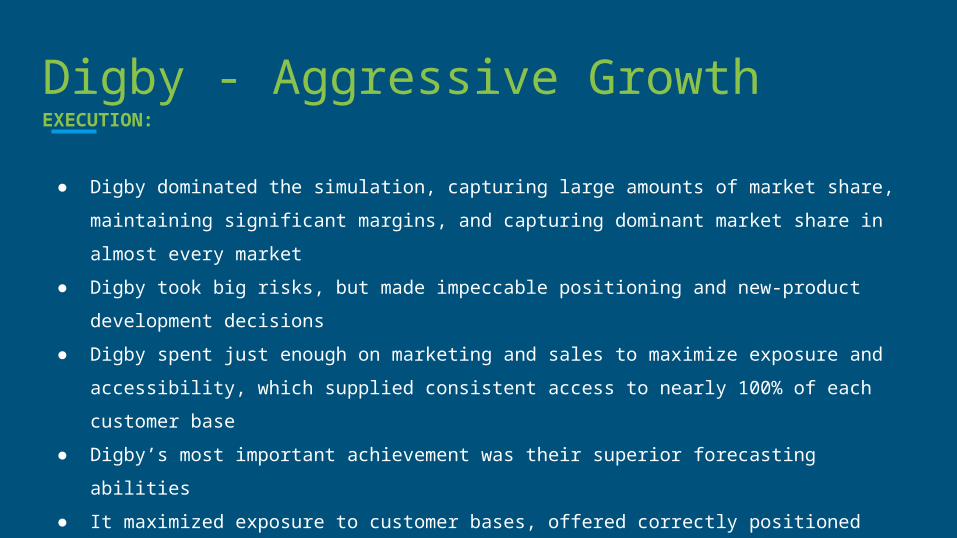
Digby - Aggressive GrowthEXECUTION:
● Digby dominated the simulation, capturing large amounts of market share, maintaining significant margins, and capturing dominant market share in almost every market
● Digby took big risks, but made impeccable positioning and new-product development decisions
● Digby spent just enough on marketing and sales to maximize exposure and accessibility, which supplied consistent access to nearly 100% of each customer base
● Digby’s most important achievement was their superior forecasting abilities● It maximized exposure to customer bases, offered correctly positioned products,
attacked variable costs, and drove significant returns to scale
09.05.XX
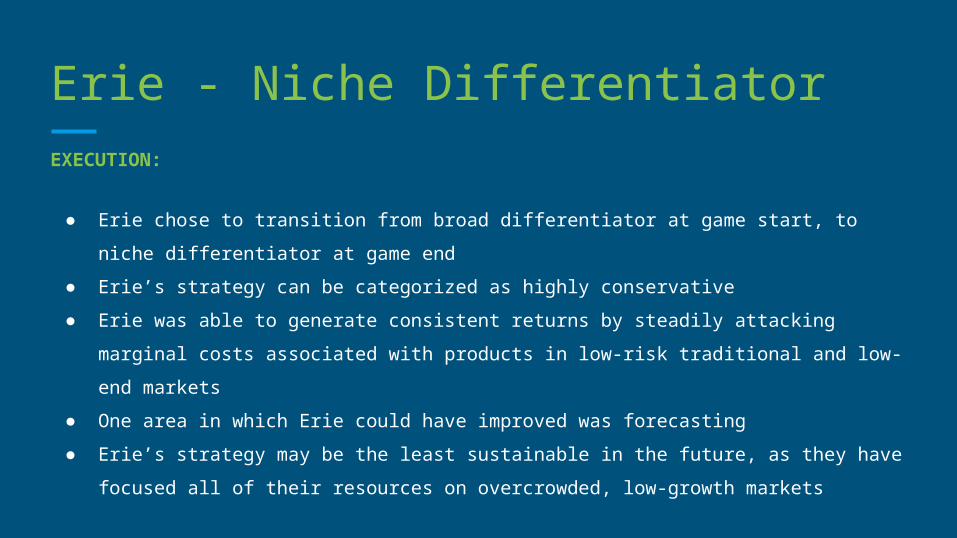
Erie - Niche DifferentiatorEXECUTION:
● Erie chose to transition from broad differentiator at game start, to niche differentiator at game end
● Erie’s strategy can be categorized as highly conservative● Erie was able to generate consistent returns by steadily attacking marginal costs
associated with products in low-risk traditional and low-end markets ● One area in which Erie could have improved was forecasting● Erie’s strategy may be the least sustainable in the future, as they have focused all of
their resources on overcrowded, low-growth markets
IMPLEMENTATION ANALYSIS
FERRIS
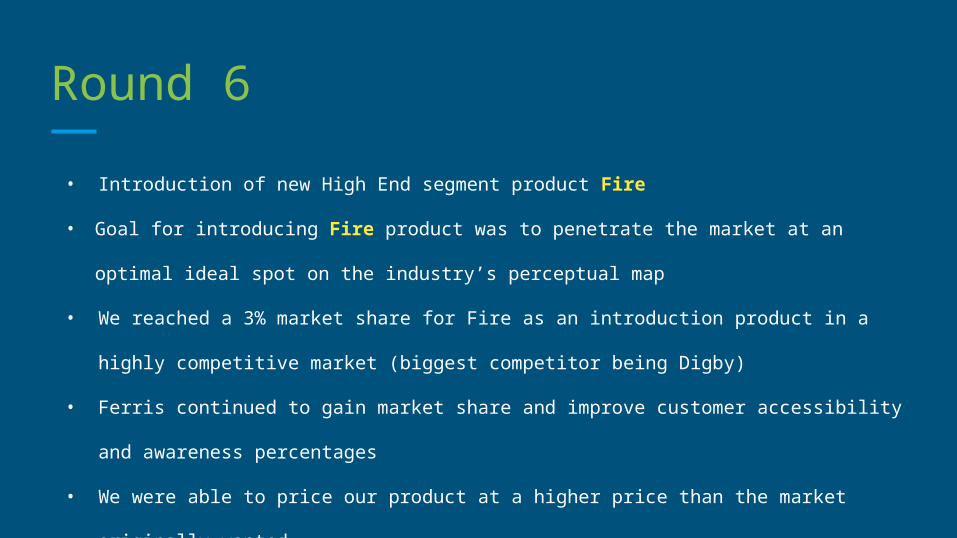
Round 6• Introduction of new High End segment product Fire
• Goal for introducing Fire product was to penetrate the market at an optimal ideal
spot on the industry’s perceptual map
• We reached a 3% market share for Fire as an introduction product in a highly
competitive market (biggest competitor being Digby)
• Ferris continued to gain market share and improve customer accessibility and
awareness percentages
• We were able to price our product at a higher price than the market originally wanted
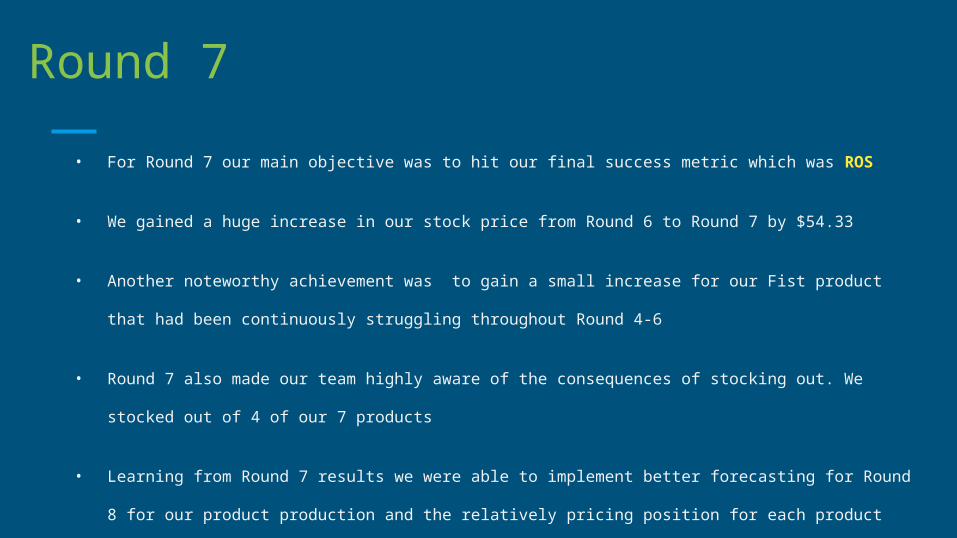
Round 7• For Round 7 our main objective was to hit our final success metric which was ROS
• We gained a huge increase in our stock price from Round 6 to Round 7 by $54.33
• Another noteworthy achievement was to gain a small increase for our Fist product that had been
continuously struggling throughout Round 4-6
• Round 7 also made our team highly aware of the consequences of stocking out. We stocked out of 4
of our 7 products
• Learning from Round 7 results we were able to implement better forecasting for Round 8 for our
product production and the relatively pricing position for each product
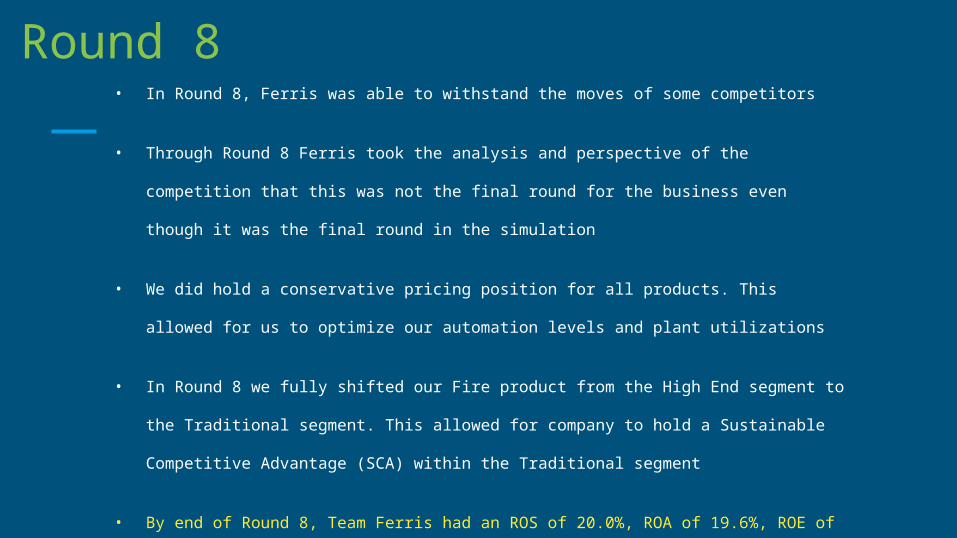
Round 8• In Round 8, Ferris was able to withstand the moves of some competitors
• Through Round 8 Ferris took the analysis and perspective of the competition that this
was not the final round for the business even though it was the final round in the
simulation
• We did hold a conservative pricing position for all products. This allowed for us to
optimize our automation levels and plant utilizations
• In Round 8 we fully shifted our Fire product from the High End segment to the
Traditional segment. This allowed for company to hold a Sustainable Competitive
Advantage (SCA) within the Traditional segment
• By end of Round 8, Team Ferris had an ROS of 20.0%, ROA of 19.6%, ROE of 1.7 with an
overall market share of 22.5 % and Stock Price of $191.72
CAPACITY ANALYSISFERRIS
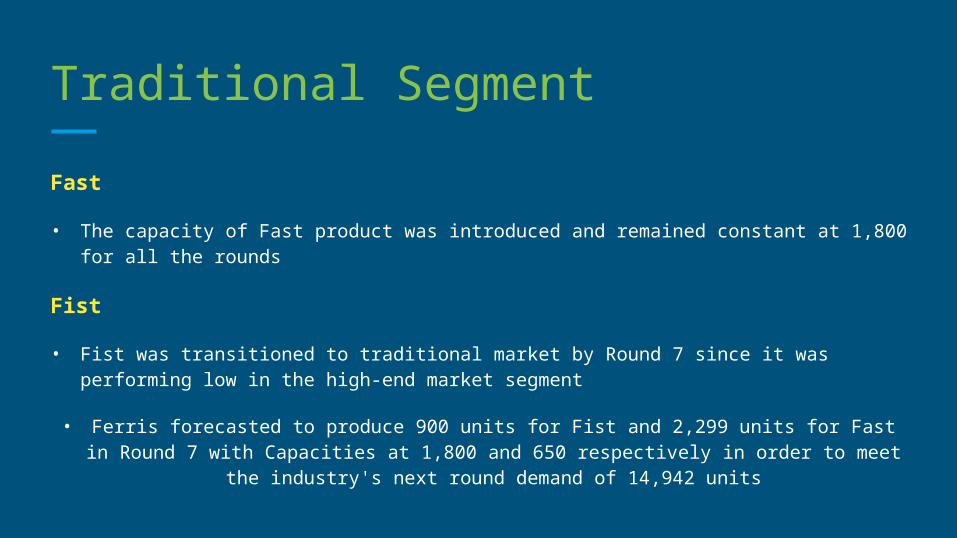
Traditional SegmentFast
• The capacity of Fast product was introduced and remained constant at 1,800 for all the rounds
Fist
• Fist was transitioned to traditional market by Round 7 since it was performing low in the high-end market segment
• Ferris forecasted to produce 900 units for Fist and 2,299 units for Fast in Round 7 with Capacities at 1,800 and 650 respectively in order to meet the industry's next round
demand of 14,942 units
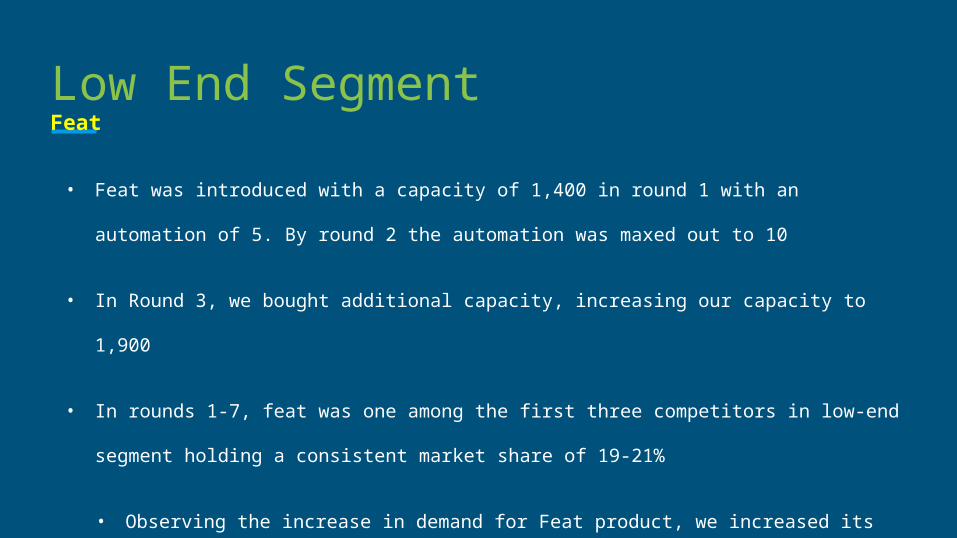
Low End SegmentFeat
• Feat was introduced with a capacity of 1,400 in round 1 with an automation of 5. By
round 2 the automation was maxed out to 10
• In Round 3, we bought additional capacity, increasing our capacity to 1,900
• In rounds 1-7, feat was one among the first three competitors in low-end segment
holding a consistent market share of 19-21%
• Observing the increase in demand for Feat product, we increased its capacity further to
2,400 to target a plant utilization of 198% in round 8 by producing 3,908 units
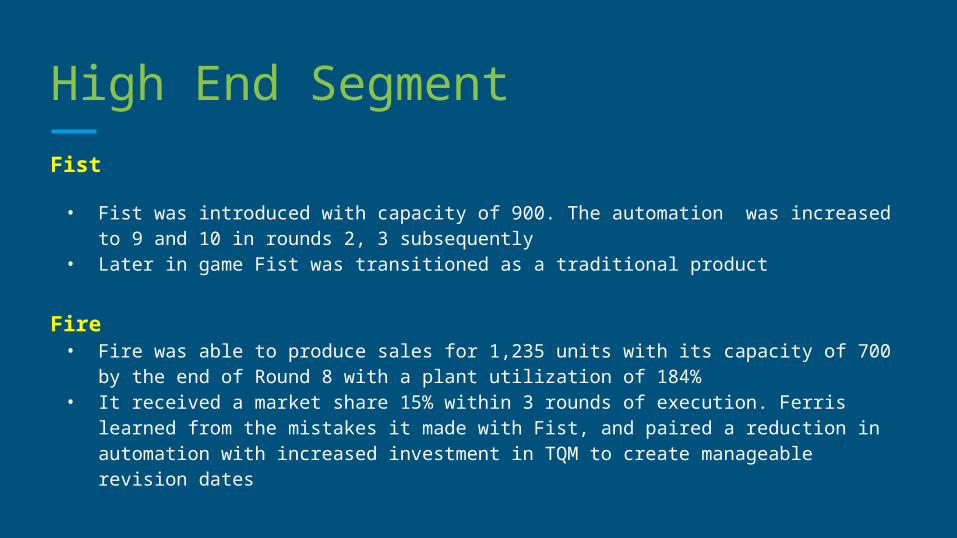
High End SegmentFist
• Fist was introduced with capacity of 900. The automation was increased to 9 and 10 in rounds 2, 3 subsequently
• Later in game Fist was transitioned as a traditional product
Fire• Fire was able to produce sales for 1,235 units with its capacity of 700 by the end of
Round 8 with a plant utilization of 184%• It received a market share 15% within 3 rounds of execution. Ferris learned from the
mistakes it made with Fist, and paired a reduction in automation with increased investment in TQM to create manageable revision dates
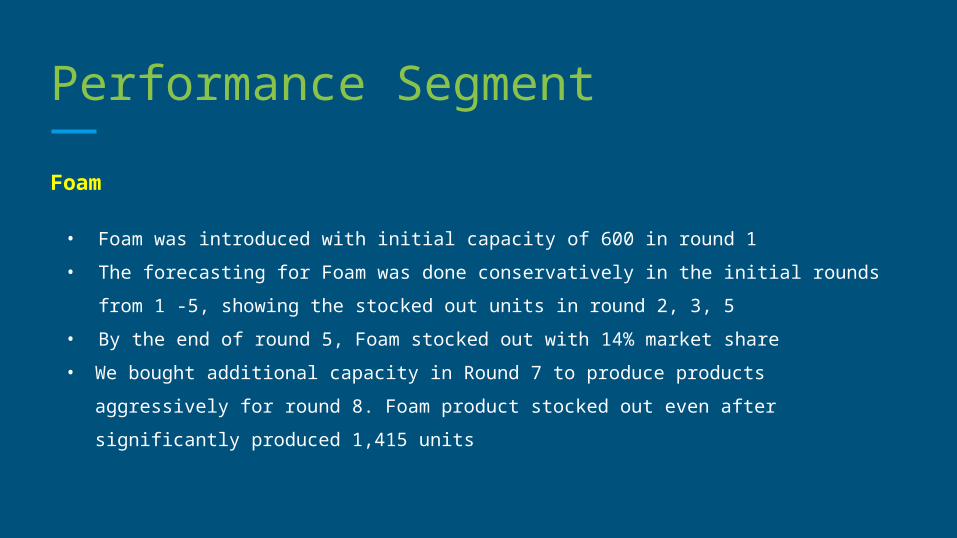
Performance SegmentFoam
• Foam was introduced with initial capacity of 600 in round 1 • The forecasting for Foam was done conservatively in the initial rounds from 1 -5,
showing the stocked out units in round 2, 3, 5• By the end of round 5, Foam stocked out with 14% market share• We bought additional capacity in Round 7 to produce products aggressively for round
8. Foam product stocked out even after significantly produced 1,415 units
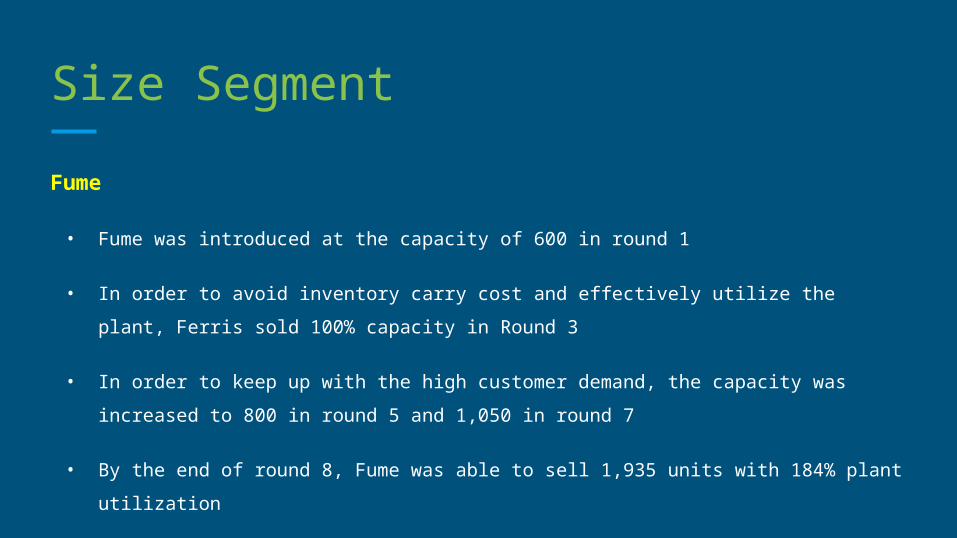
Size SegmentFume
• Fume was introduced at the capacity of 600 in round 1
• In order to avoid inventory carry cost and effectively utilize the plant, Ferris sold 100% capacity in Round 3
• In order to keep up with the high customer demand, the capacity was increased to 800 in round 5 and 1,050 in round 7
• By the end of round 8, Fume was able to sell 1,935 units with 184% plant utilization
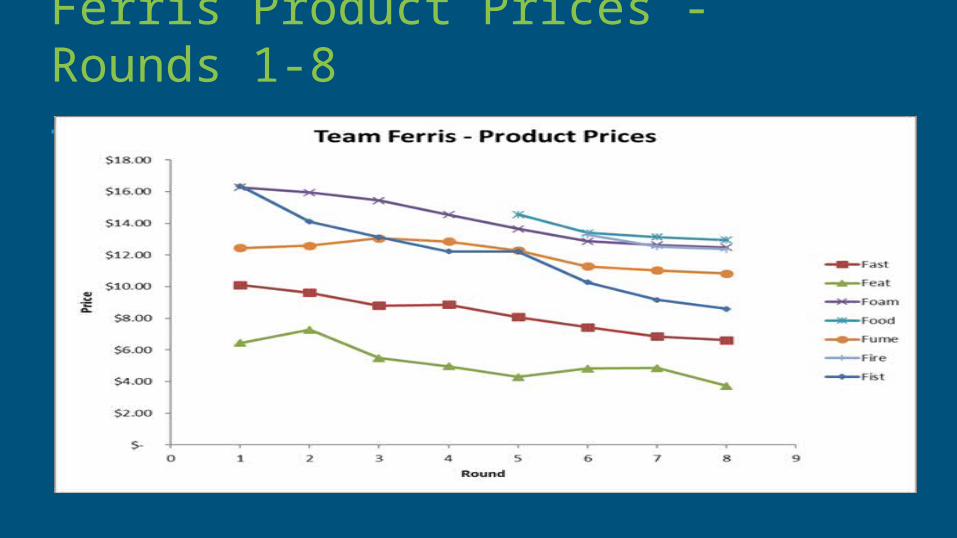
Ferris Product Prices - Rounds 1-8
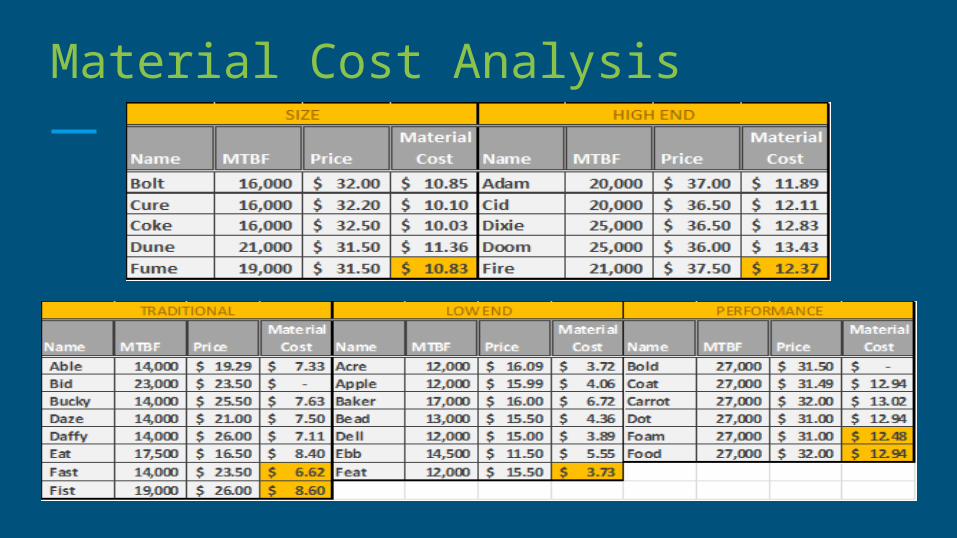
Material Cost Analysis
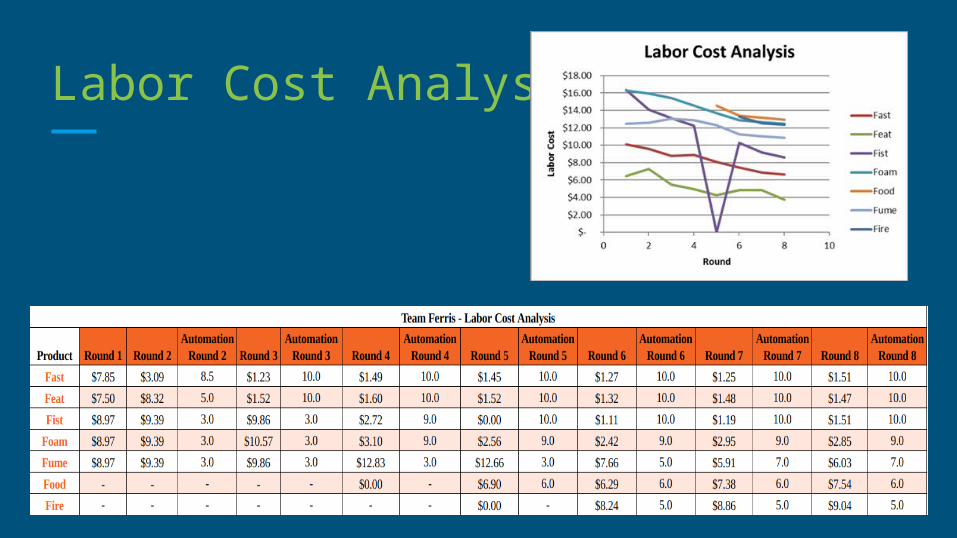
Labor Cost Analysis
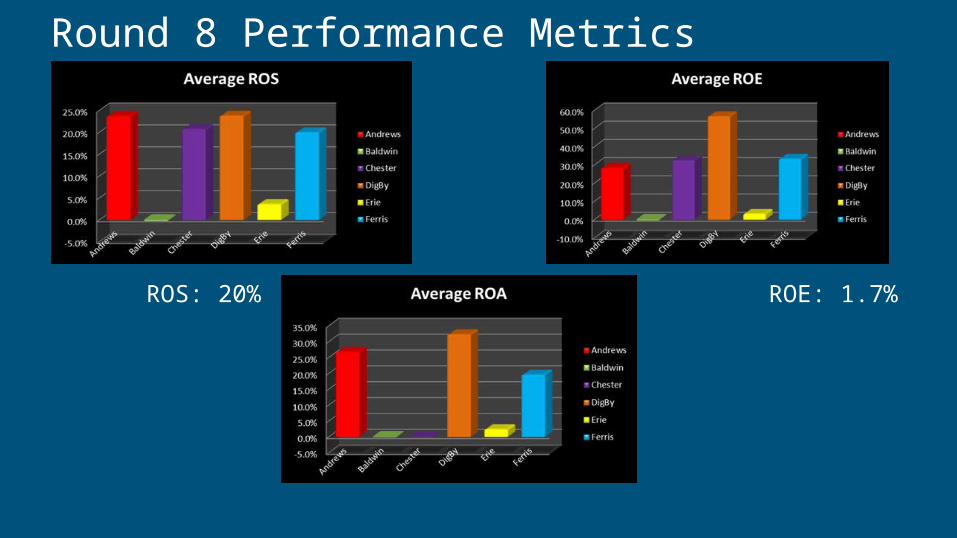
Round 8 Performance Metrics
ROS: 20% ROE: 1.7%ROE: 1.7%
ROA: 19.6%
R
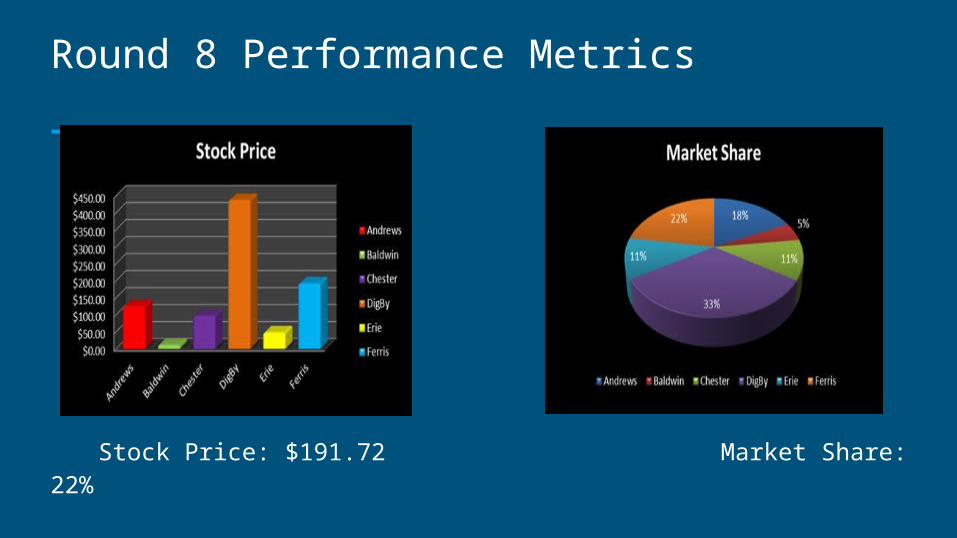
Round 8 Performance Metrics
Stock Price: $191.72 Market Share: 22%