Embed Size (px)
Citation preview
Carlo Pietrobelli [email protected] www.pietrobelli.tk
1
Carlo Pietrobelli
Roberta Rabellotti
Working Paper Cepal -Desarrollo Productivo No.13 www.eclac.org/cgi-bin/getProd.asp?xml=/publicaciones/xml/4/11094/P11094.
xml&xsl=/ddpe/tpl-i/p9f.xsl&base=/tpl/top-bottom.xslt
Business Development Service Centres in Italy: An empirical analysis of three regional
experiences: Emilia Romagna, Lombardia and Veneto
Carlo Pietrobelli [email protected] www.pietrobelli.tk
2
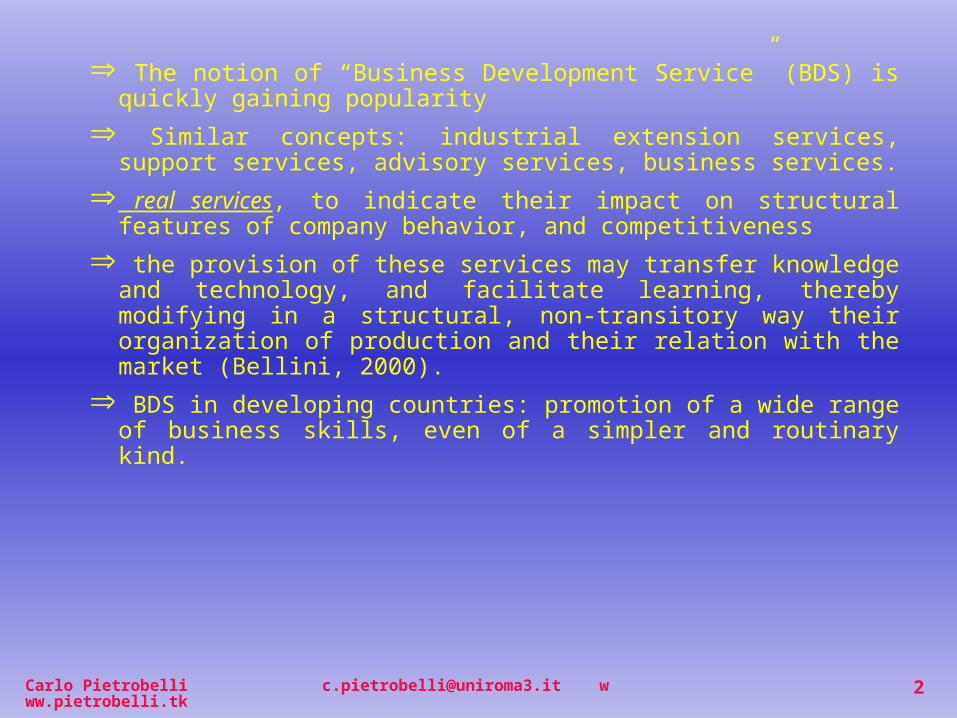
The notion of “Business Development Service” (BDS) is quickly gaining popularity
Similar concepts: industrial extension services, support services, advisory services, business services.
real services, to indicate their impact on structural features of company behavior, and competitiveness
the provision of these services may transfer knowledge and technology, and facilitate learning, thereby modifying in a structural, non-transitory way their organization of production and their relation with the market (Bellini, 2000).
BDS in developing countries: promotion of a wide range of business skills, even of a simpler and routinary kind.
Carlo Pietrobelli [email protected] www.pietrobelli.tk
3
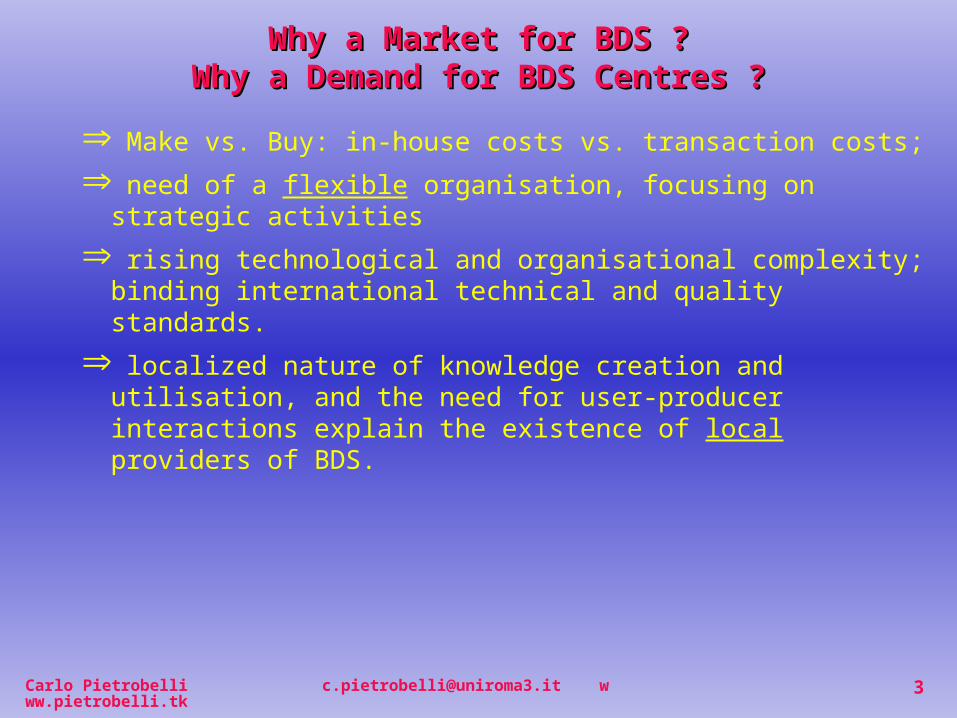
Make vs. Buy: in-house costs vs. transaction costs;
need of a flexible organisation, focusing on strategic activities
rising technological and organisational complexity; binding international technical and quality standards.
localized nature of knowledge creation and utilisation, and the need for user-producer interactions explain the existence of local providers of BDS.
Why a Market for BDS ?Why a Market for BDS ?Why a Demand for BDS Centres ?Why a Demand for BDS Centres ?
Carlo Pietrobelli [email protected] www.pietrobelli.tk
4
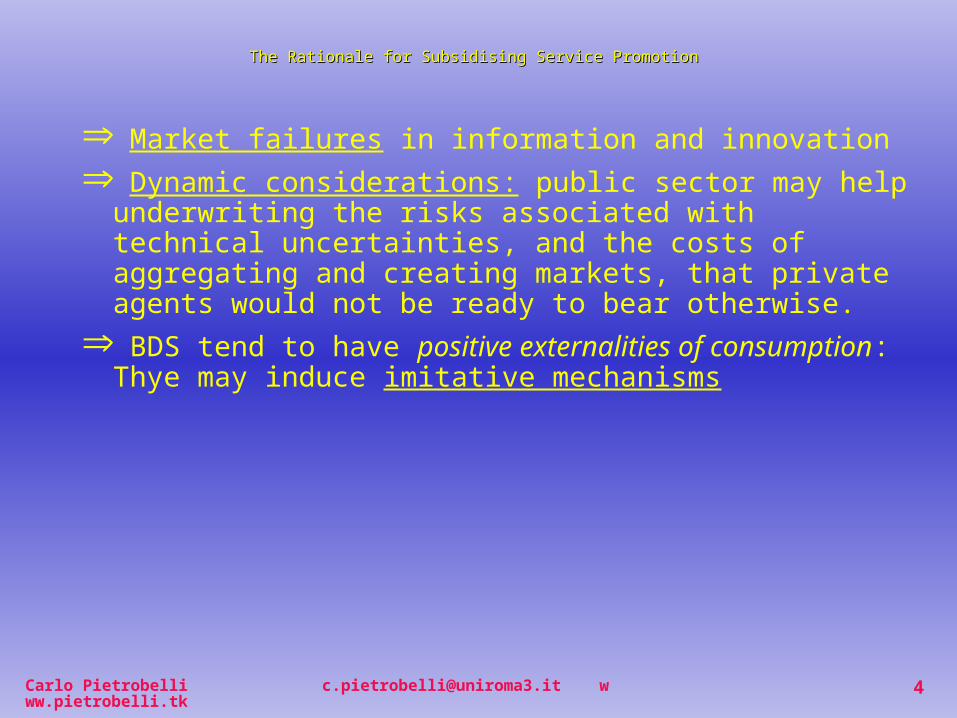
Market failures in information and innovation
Dynamic considerations: public sector may help underwriting the risks associated with technical uncertainties, and the costs of aggregating and creating markets, that private agents would not be ready to bear otherwise.
BDS tend to have positive externalities of consumption: Thye may induce imitative mechanisms
The Rationale for Subsidising Service Promotion The Rationale for Subsidising Service Promotion
Carlo Pietrobelli [email protected] www.pietrobelli.tk
5
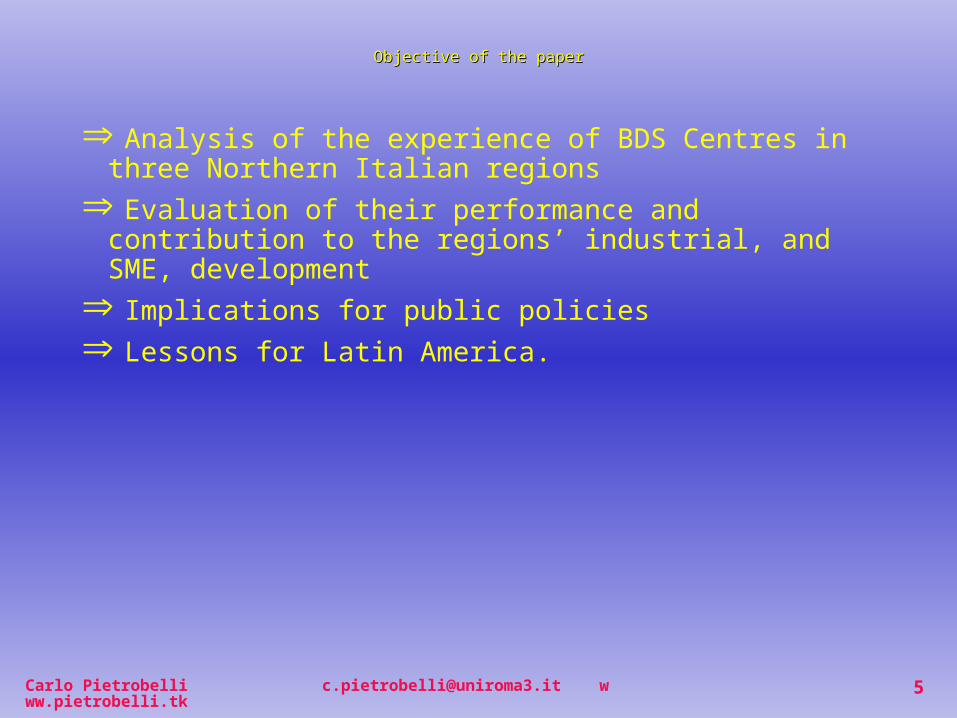
Analysis of the experience of BDS Centres in three Northern Italian regions
Evaluation of their performance and contribution to the regions’ industrial, and SME, development
Implications for public policies
Lessons for Latin America.
Objective of the paperObjective of the paper
Carlo Pietrobelli [email protected] www.pietrobelli.tk
6
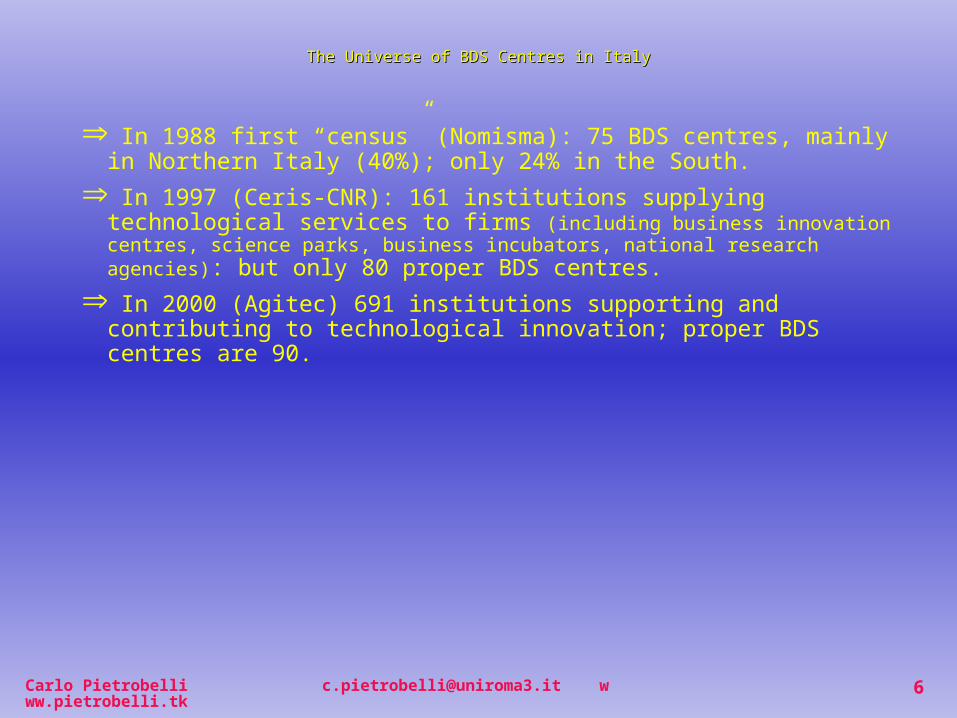
In 1988 first “census” (Nomisma): 75 BDS centres, mainly in Northern Italy (40%); only 24% in the South.
In 1997 (Ceris-CNR): 161 institutions supplying technological services to firms (including business innovation centres, science parks, business incubators, national research agencies): but only 80 proper BDS centres.
In 2000 (Agitec) 691 institutions supporting and contributing to technological innovation; proper BDS centres are 90.
The Universe of BDS Centres in ItalyThe Universe of BDS Centres in Italy
Carlo Pietrobelli [email protected] www.pietrobelli.tk
7
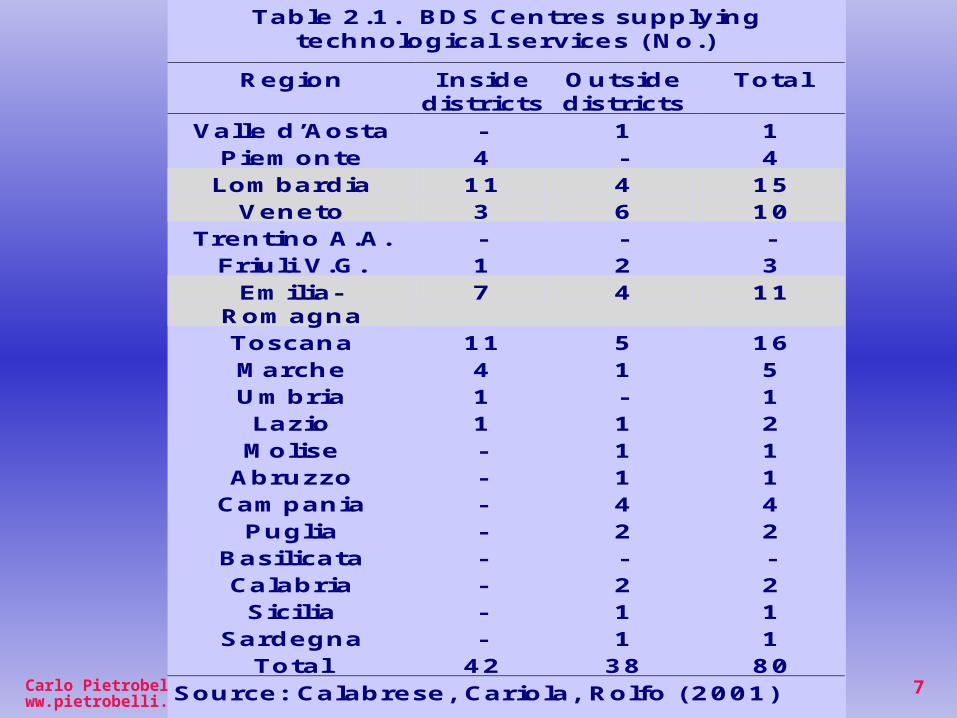
Table 2.1. BDS Centres supplying technological services (No.)
Region I nside
districts Outside districts
Total
Valle d’Aosta - 1 1 Piemonte 4 - 4 Lombardia 11 4 15
Veneto 3 6 10 Trentino A.A. - - -
Friuli V.G. 1 2 3 Emilia-
Romagna 7 4 11
Toscana 11 5 16 Marche 4 1 5 Umbria 1 - 1 Lazio 1 1 2 Molise - 1 1
Abruzzo - 1 1 Campania - 4 4
Puglia - 2 2 Basilicata - - - Calabria - 2 2 Sicilia - 1 1
Sardegna - 1 1 Total 42 38 80
Source: Calabrese, Cariola, Rolfo (2001)
Carlo Pietrobelli [email protected] www.pietrobelli.tk
8
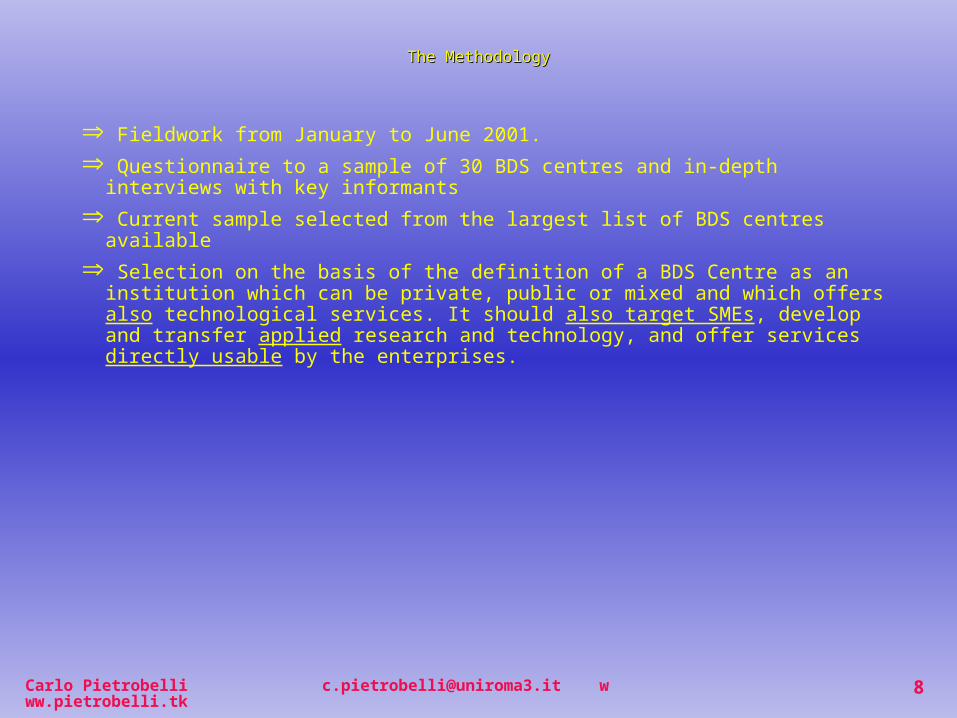
Fieldwork from January to June 2001.
Questionnaire to a sample of 30 BDS centres and in-depth interviews with key informants
Current sample selected from the largest list of BDS centres available
Selection on the basis of the definition of a BDS Centre as an institution which can be private, public or mixed and which offers also technological services. It should also target SMEs, develop and transfer applied research and technology, and offer services directly usable by the enterprises.
The MethodologyThe Methodology
Carlo Pietrobelli [email protected] www.pietrobelli.tk
9
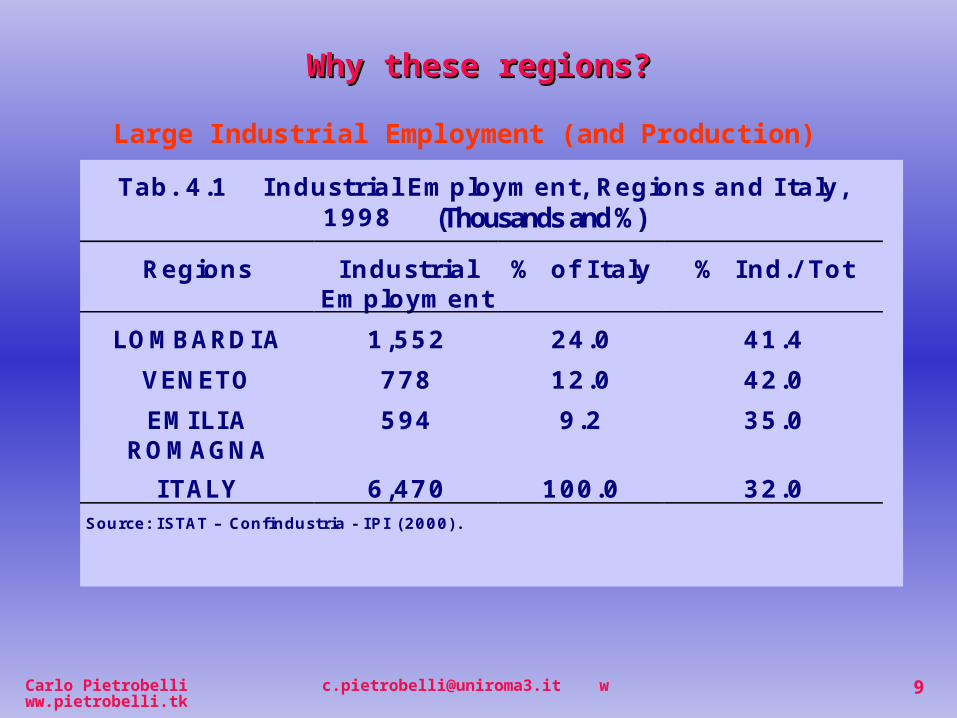
Why these regions?Why these regions?
Tab. 4.1 I ndustrial Employment, Regions and I taly, 1998 (Thousands and %)
Regions I ndustrial Employment
% of I taly % Ind./ Tot
LOMBARDI A 1,552 24.0 41.4
VENETO 778 12.0 42.0
EMI LI A ROMAGNA
594 9.2 35.0
I TALY 6,470 100.0 32.0 Source: ISTAT – Confindustria - IPI (2000).
Large Industrial Employment (and Production)
Carlo Pietrobelli [email protected] www.pietrobelli.tk
10
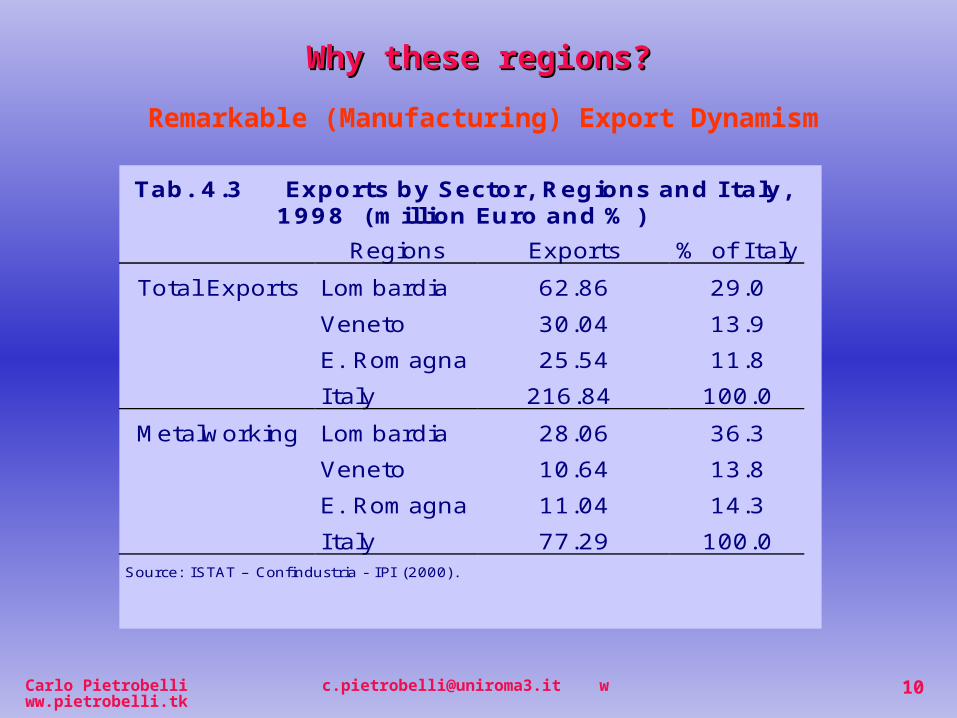
Why these regions?Why these regions?
Remarkable (Manufacturing) Export Dynamism
Tab. 4.3 Exports by Sector, Regions and I taly, 1998 (million Euro and % )
Regions Exports % of I taly
Total Exports Lombardia 62.86 29.0
Veneto 30.04 13.9
E. Romagna 25.54 11.8
I taly 216.84 100.0
Metalworking Lombardia 28.06 36.3
Veneto 10.64 13.8
E. Romagna 11.04 14.3
I taly 77.29 100.0 Source: ISTAT – Confindustria - IPI (2000).
Carlo Pietrobelli [email protected] www.pietrobelli.tk
11
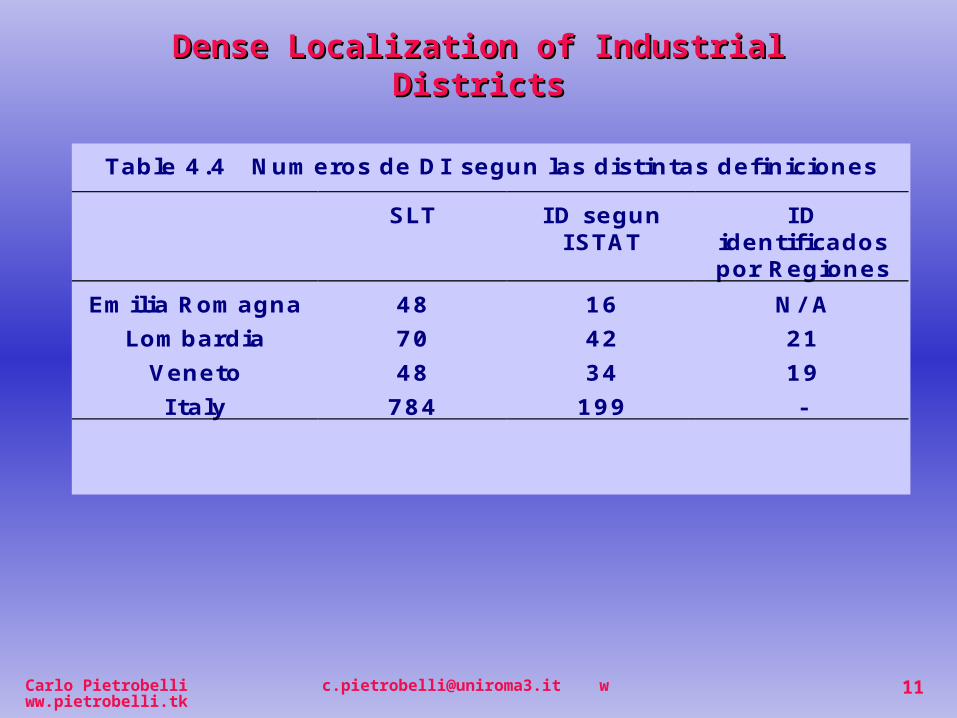
Table 4.4 Numeros de DI segun las distintas definiciones
SLT ID segun ISTAT
ID identificados por Regiones
Emilia Romagna 48 16 N/ A
Lombardia 70 42 21
Veneto 48 34 19
I taly 784 199 -
Dense Localization of Industrial DistrictsDense Localization of Industrial Districts
Carlo Pietrobelli [email protected] www.pietrobelli.tk
12
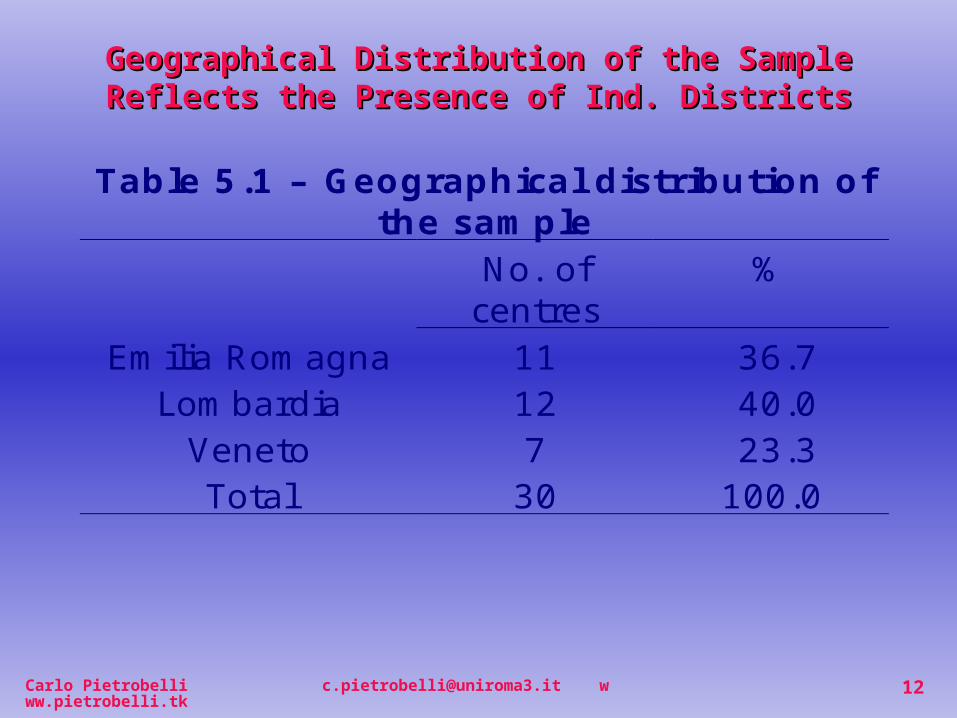
Geographical Distribution of the Sample Geographical Distribution of the Sample Reflects the Presence of Ind. DistrictsReflects the Presence of Ind. Districts
Table 5.1 – Geographical distribution ofthe sample
No. ofcentres
%
Emilia Romagna 11 36.7Lombardia 12 40.0
Veneto 7 23.3Total 30 100.0
Carlo Pietrobelli [email protected] www.pietrobelli.tk
13
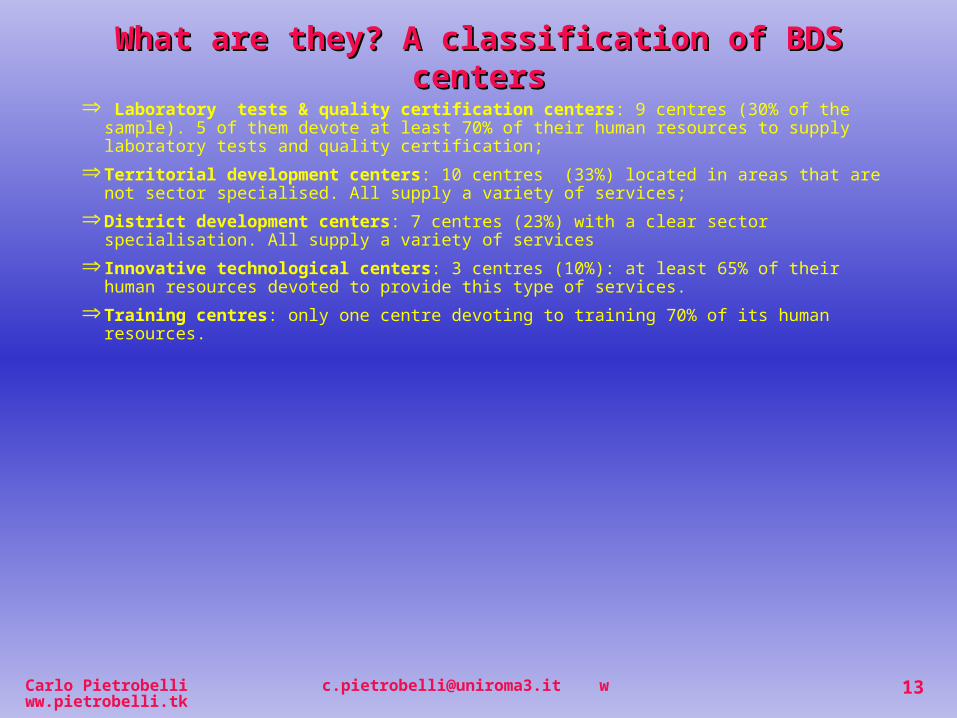
Laboratory tests & quality certification centers: 9 centres (30% of the sample). 5 of them devote at least 70% of their human resources to supply laboratory tests and quality certification;
Territorial development centers: 10 centres (33%) located in areas that are not sector specialised. All supply a variety of services;
District development centers: 7 centres (23%) with a clear sector specialisation. All supply a variety of services
Innovative technological centers: 3 centres (10%): at least 65% of their human resources devoted to provide this type of services.
Training centres: only one centre devoting to training 70% of its human resources.
What are they? A classification of BDS centersWhat are they? A classification of BDS centers
Carlo Pietrobelli [email protected] www.pietrobelli.tk
14
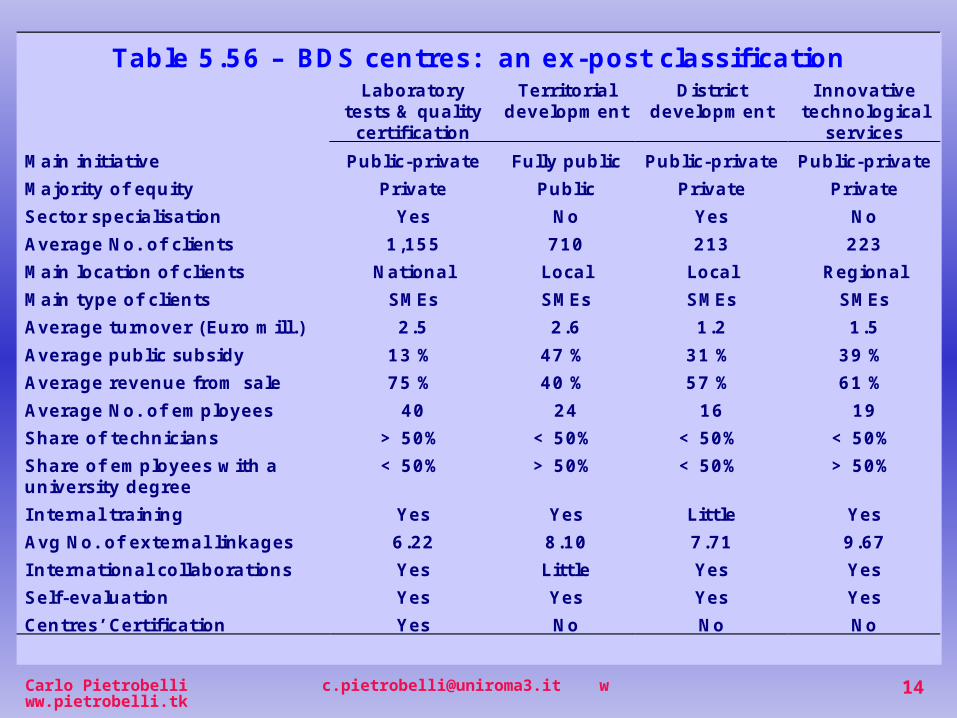
Table 5.56 – BDS centres: an ex-post classification Laboratory
tests & quality certification
Territorial development
District development
I nnovative technological
services
Main initiative Public-private Fully public Public-private Public-private
Majority of equity Private Public Private Private
Sector specialisation Yes No Yes No
Average No. of clients 1,155 710 213 223
Main location of clients National Local Local Regional
Main type of clients SMEs SMEs SMEs SMEs
Average turnover (Euro mill.) 2.5 2.6 1.2 1.5
Average public subsidy 13 % 47 % 31 % 39 %
Average revenue from sale 75 % 40 % 57 % 61 %
Average No. of employees 40 24 16 19
Share of technicians > 50% < 50% < 50% < 50%
Share of employees with a university degree
< 50% > 50% < 50% > 50%
I nternal training Yes Yes Little Yes
Avg No. of external linkages 6.22 8.10 7.71 9.67
I nternational collaborations Yes Little Yes Yes
Self-evaluation Yes Yes Yes Yes
Centres’ Certification Yes No No No
Carlo Pietrobelli [email protected] www.pietrobelli.tk
15
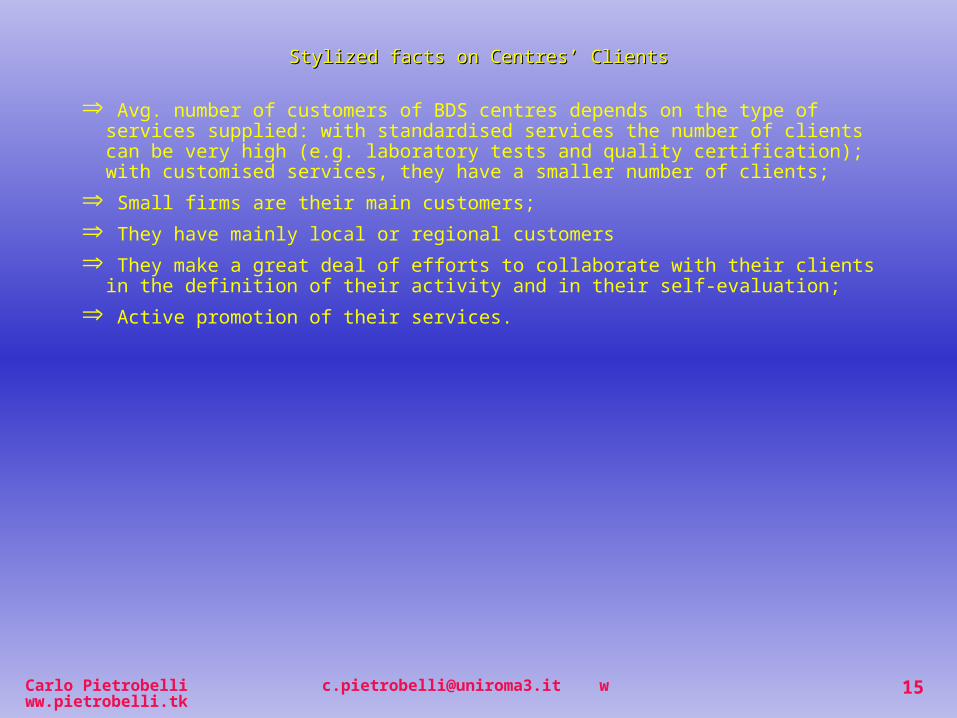
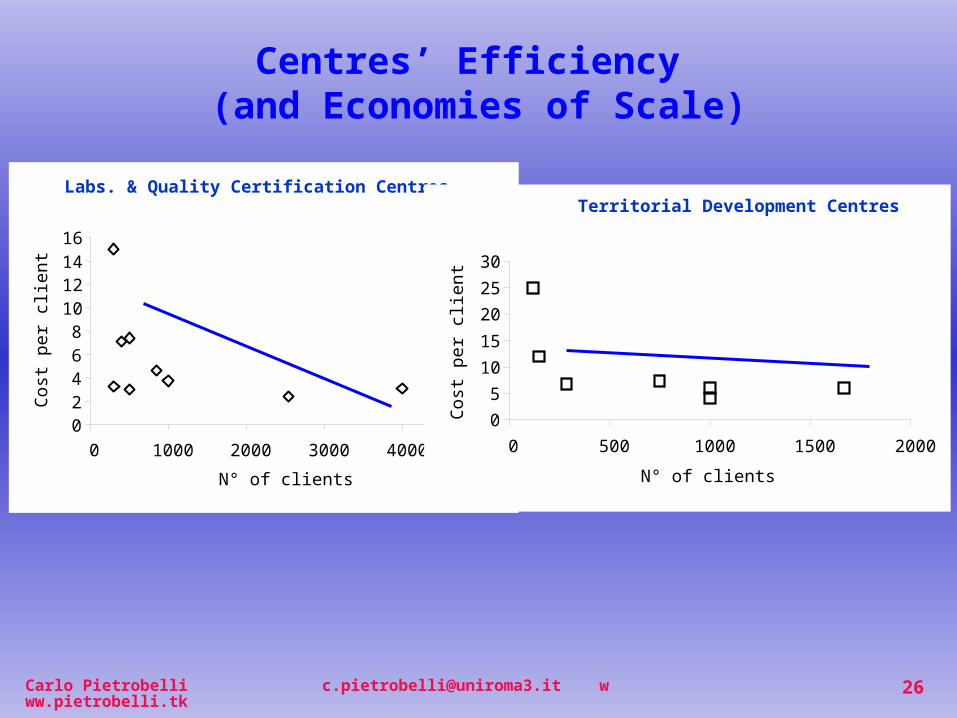
Avg. number of customers of BDS centres depends on the type of services supplied: with standardised services the number of clients can be very high (e.g. laboratory tests and quality certification); with customised services, they have a smaller number of clients;
Small firms are their main customers;
They have mainly local or regional customers
They make a great deal of efforts to collaborate with their clients in the definition of their activity and in their self-evaluation;
Active promotion of their services.
Stylized facts on Centres’ ClientsStylized facts on Centres’ Clients
Carlo Pietrobelli [email protected] www.pietrobelli.tk
16
Stylized facts on Centres’ ClientsStylized facts on Centres’ Clients
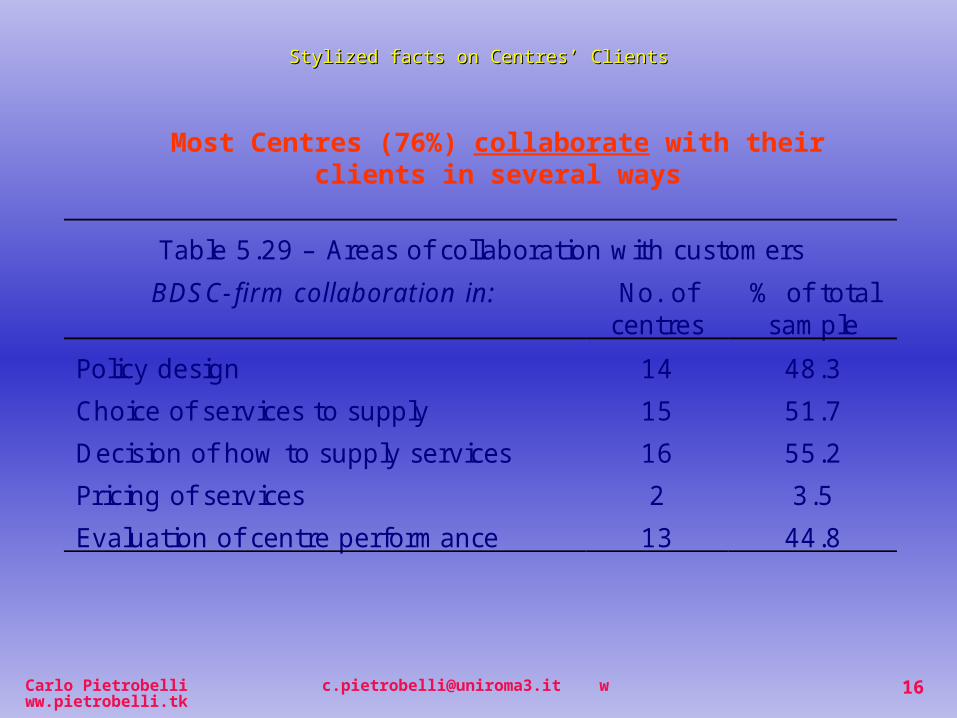
Table 5.29 – Areas of collaboration with customers
BDSC-firm collaboration in: No. ofcentres
% of totalsample
Policy design 14 48.3
Choice of services to supply 15 51.7
Decision of how to supply services 16 55.2
Pricing of services 2 3.5
Evaluation of centre performance 13 44.8
Most Centres (76%) collaborate with their clients in several ways
Carlo Pietrobelli [email protected] www.pietrobelli.tk
17
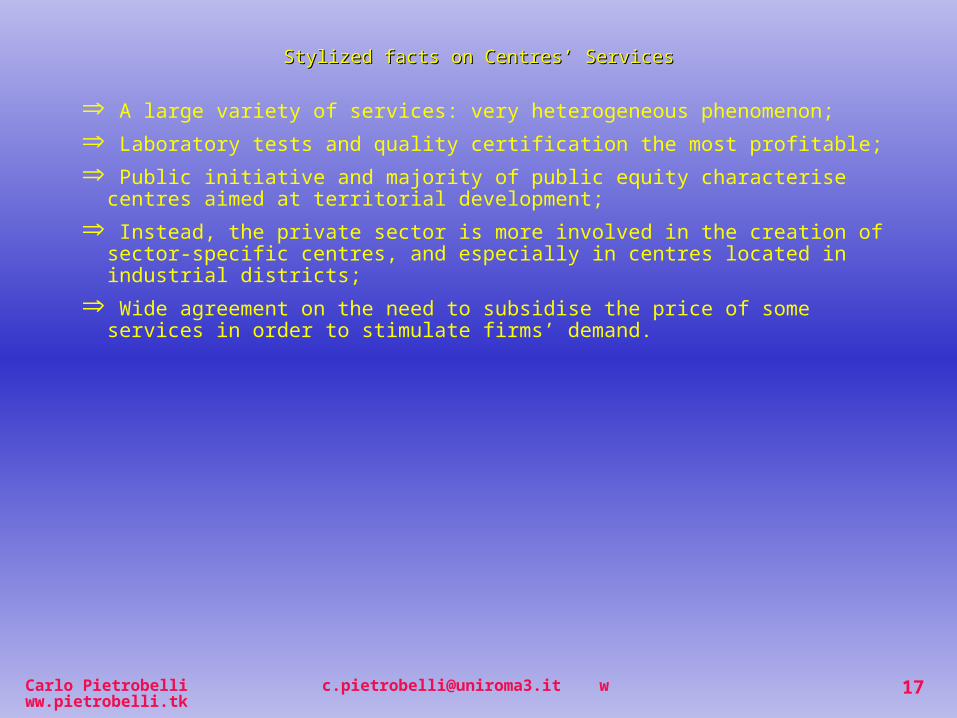
A large variety of services: very heterogeneous phenomenon;
Laboratory tests and quality certification the most profitable;
Public initiative and majority of public equity characterise centres aimed at territorial development;
Instead, the private sector is more involved in the creation of sector-specific centres, and especially in centres located in industrial districts;
Wide agreement on the need to subsidise the price of some services in order to stimulate firms’ demand.
Stylized facts on Centres’ ServicesStylized facts on Centres’ Services
Carlo Pietrobelli [email protected] www.pietrobelli.tk
18
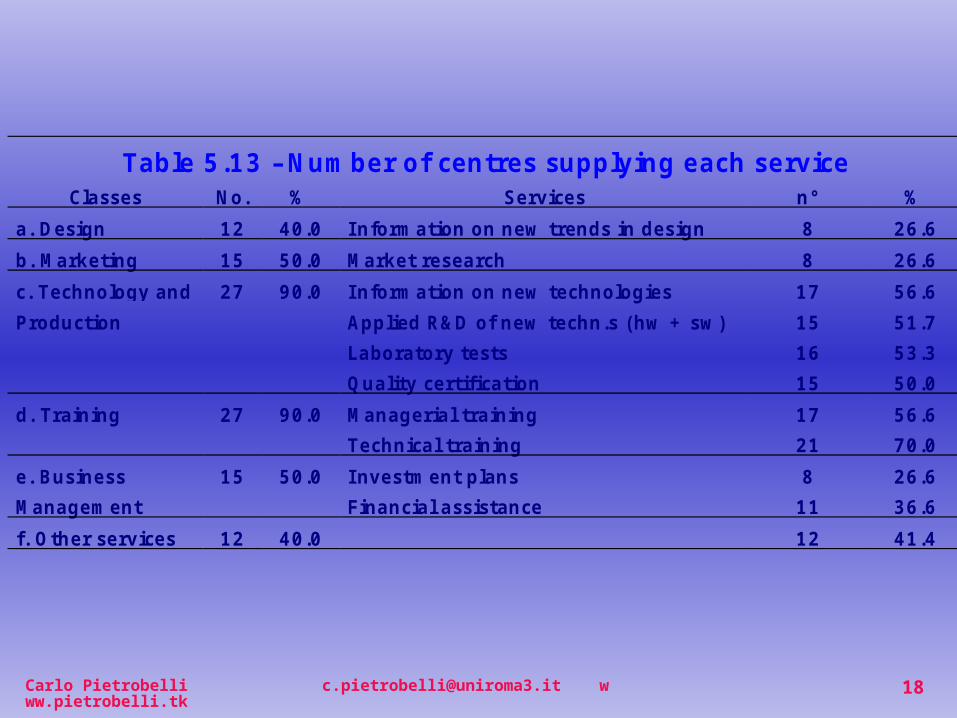
Table 5.13 – Number of centres supplying each serviceClasses No. % Services n° %
a. Design 12 40.0 I nformation on new trends in design 8 26.6
b. Marketing 15 50.0 Market research 8 26.6
c. Technology and 27 90.0 I nformation on new technologies 17 56.6
Applied R&D of new techn.s (hw + sw) 15 51.7
Laboratory tests 16 53.3
Production
Quality certification 15 50.0
d. Training 27 90.0 Managerial training 17 56.6
Technical training 21 70.0
e. Business 15 50.0 I nvestment plans 8 26.6
Management Financial assistance 11 36.6
f. Other services 12 40.0 12 41.4
Carlo Pietrobelli [email protected] www.pietrobelli.tk
19
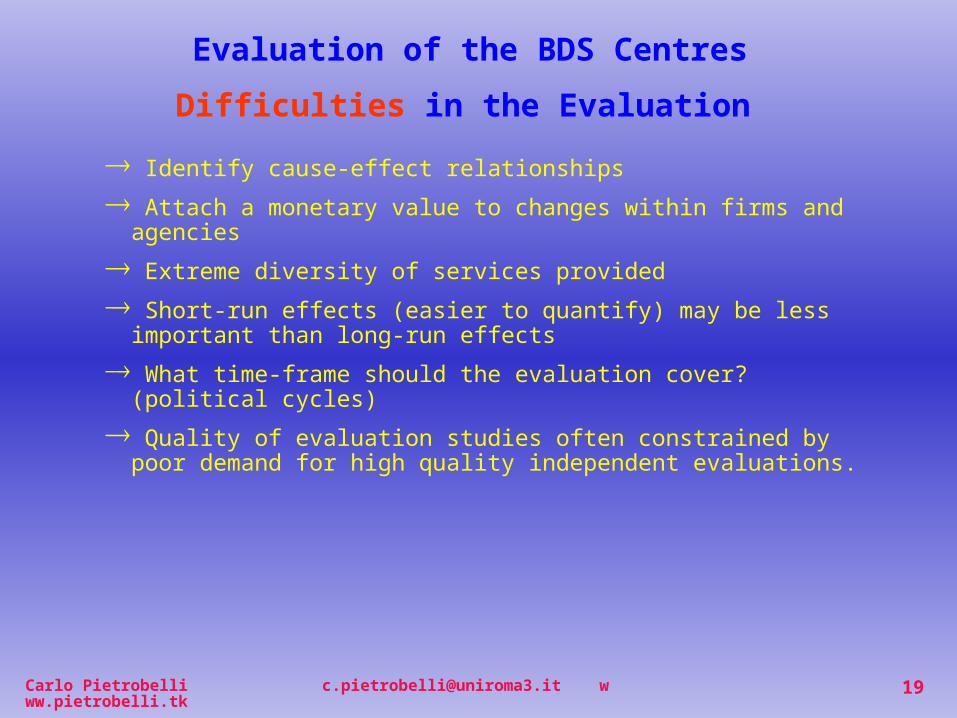
Identify cause-effect relationships
Attach a monetary value to changes within firms and agencies
Extreme diversity of services provided
Short-run effects (easier to quantify) may be less important than long-run effects
What time-frame should the evaluation cover? (political cycles)
Quality of evaluation studies often constrained by poor demand for high quality independent evaluations.
Evaluation of the BDS Centres
Difficulties in the Evaluation
Carlo Pietrobelli [email protected] www.pietrobelli.tk
20
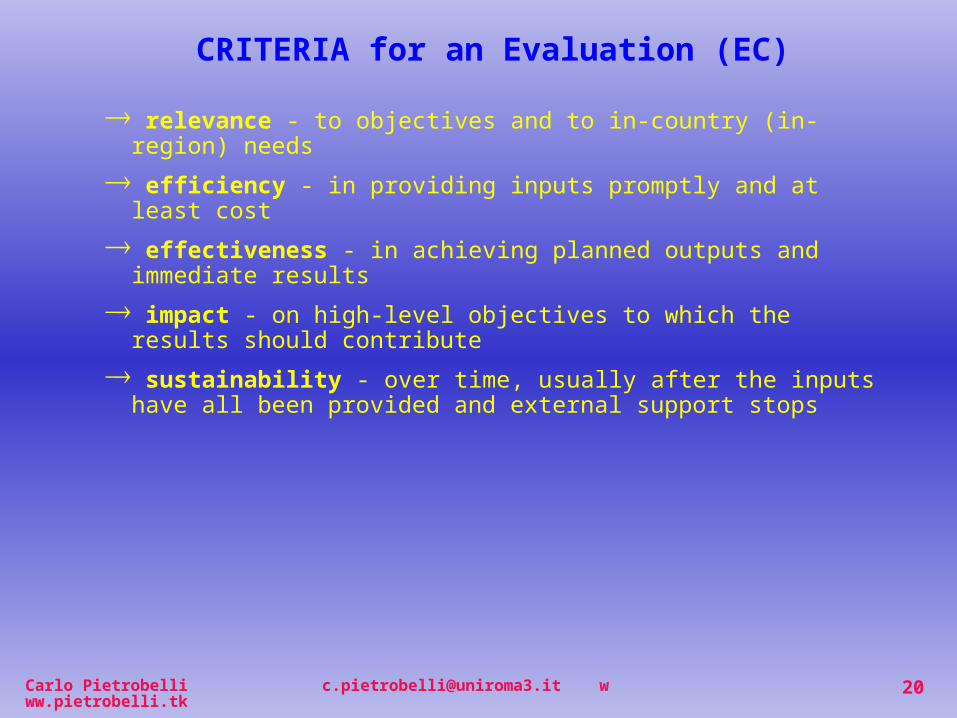
relevance - to objectives and to in-country (in-region) needs
efficiency - in providing inputs promptly and at least cost
effectiveness - in achieving planned outputs and immediate results
impact - on high-level objectives to which the results should contribute
sustainability - over time, usually after the inputs have all been provided and external support stops
CRITERIA for an Evaluation (EC)
Carlo Pietrobelli [email protected] www.pietrobelli.tk
21
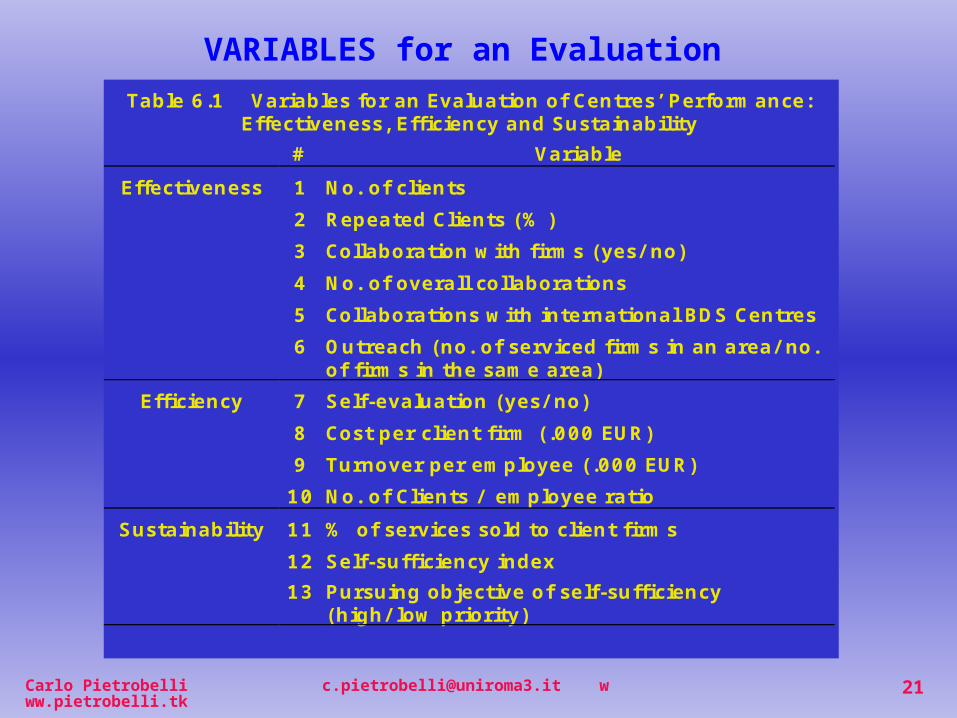
VARIABLES for an EvaluationTable 6.1 Variables for an Evaluation of Centres’ Performance:
Effectiveness, Efficiency and Sustainability
# Variable
Effectiveness 1 No. of clients
2 Repeated Clients (% )
3 Collaboration with firms (yes/ no)
4 No. of overall collaborations
5 Collaborations with international BDS Centres
6 Outreach (no. of serviced firms in an area/ no. of firms in the same area)
Efficiency 7 Self-evaluation (yes/ no)
8 Cost per client firm (.000 EUR)
9 Turnover per employee (.000 EUR)
10 No. of Clients / employee ratio
Sustainability 11 % of services sold to client firms
12 Self-sufficiency index
13 Pursuing objective of self-sufficiency (high/ low priority)
Carlo Pietrobelli [email protected] www.pietrobelli.tk
22
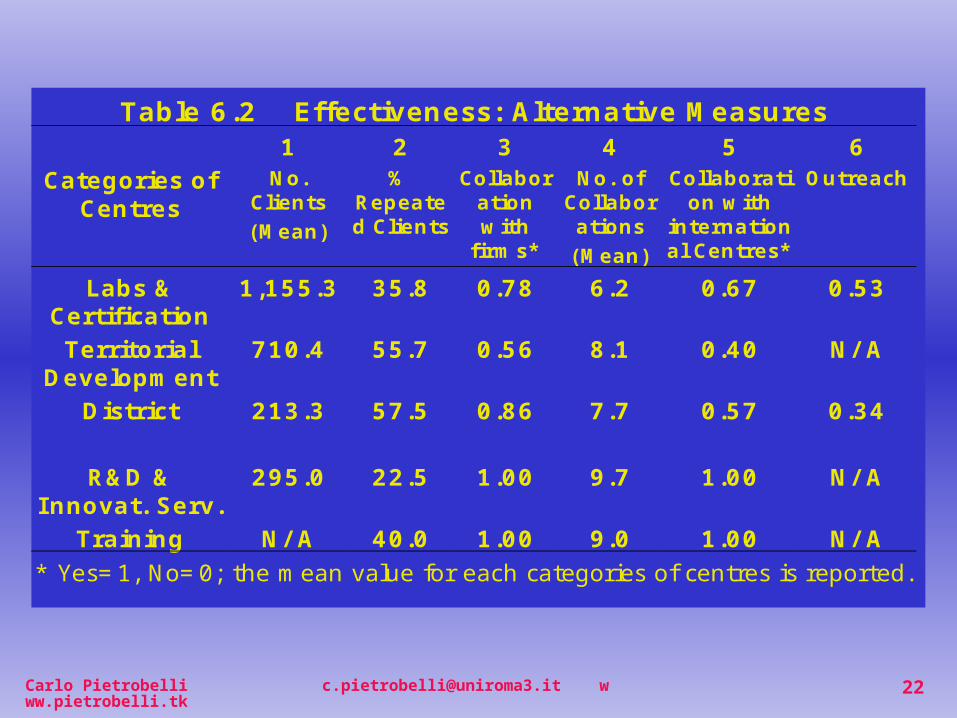
Table 6.2 Effectiveness: Alternative Measures 1 2 3 4 5 6
Categories of Centres
No. Clients
(Mean)
% Repeated Clients
Collaboration with
firms*
No. of Collaborations
(Mean)
Collaboration with
international Centres*
Outreach
Labs & Certification
1,155.3 35.8 0.78 6.2 0.67 0.53
Territorial Development
710.4 55.7 0.56 8.1 0.40 N/ A
District
213.3 57.5 0.86 7.7 0.57 0.34
R&D & I nnovat. Serv.
295.0 22.5 1.00 9.7 1.00 N/ A
Training N/ A 40.0 1.00 9.0 1.00 N/ A
* Yes=1, No=0; the mean value for each categories of centres is reported.
Carlo Pietrobelli [email protected] www.pietrobelli.tk
23
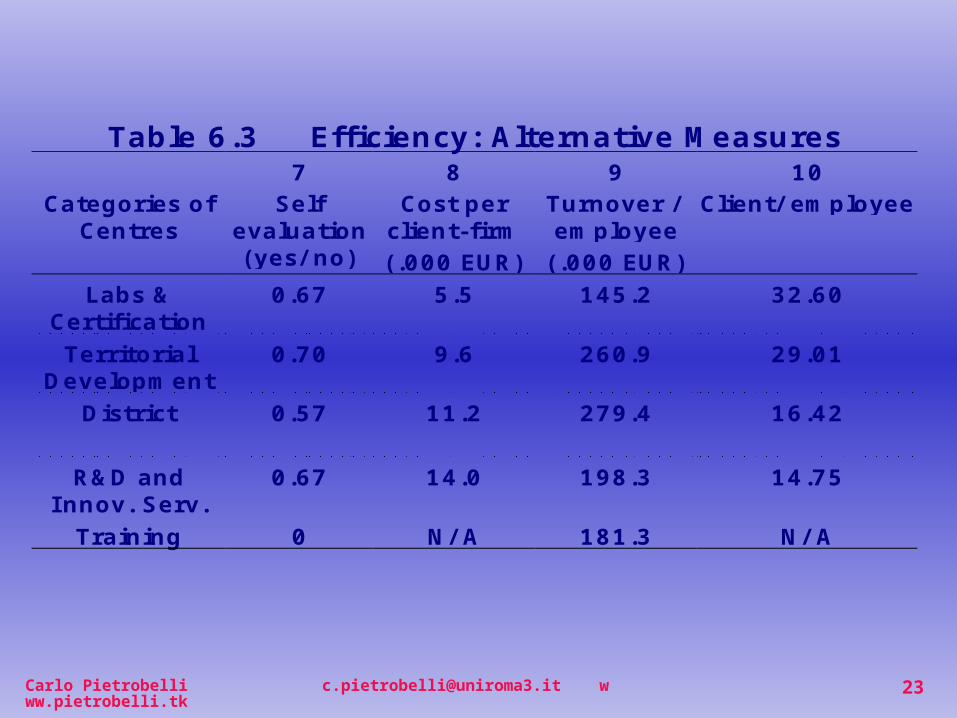
Table 6.3 Efficiency: Alternative Measures7 8 9 10
Categories ofCentres
Selfevaluation(yes/ no)
Cost perclient-firm(.000 EUR)
Turnover /employee
(.000 EUR)
Client/ employee
Labs &Certification
0.67 5.5 145.2 32.60
TerritorialDevelopment
0.70 9.6 260.9 29.01
District 0.57 11.2 279.4 16.42
R&D andInnov. Serv.
0.67 14.0 198.3 14.75
Training 0 N/ A 181.3 N/ A
Carlo Pietrobelli [email protected] www.pietrobelli.tk
24
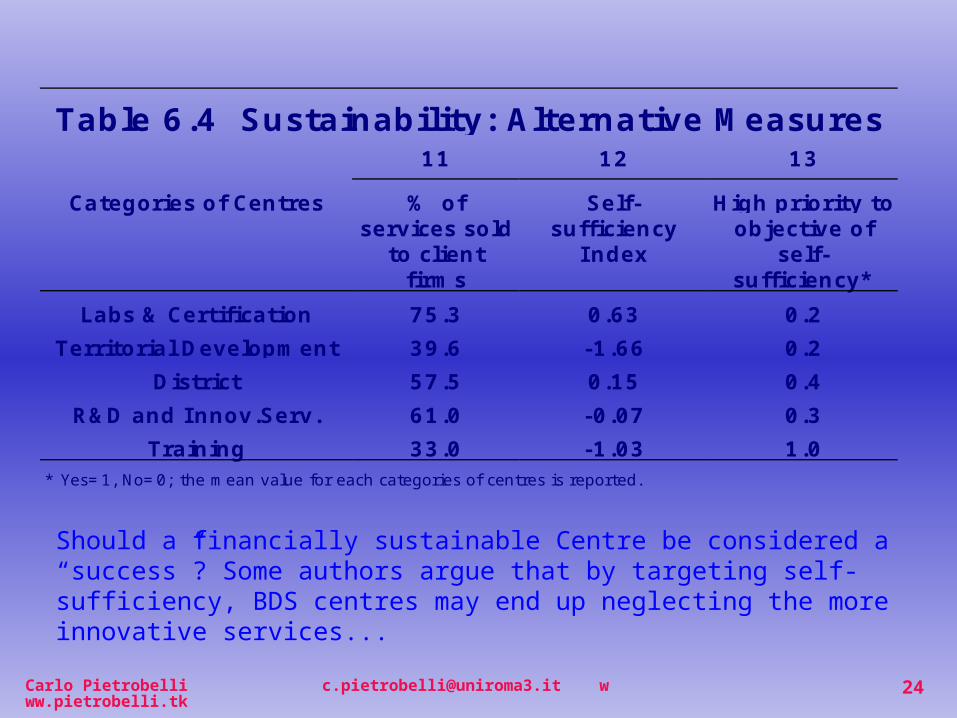
Table 6.4 Sustainability: Alternative Measures11 12 13
Categories of Centres % ofservices sold
to clientfirms
Self-sufficiency
I ndex
High priority toobjective of
self-sufficiency*
Labs & Certification 75.3 0.63 0.2
Territorial Development 39.6 -1.66 0.2
District 57.5 0.15 0.4
R&D and Innov.Serv. 61.0 -0.07 0.3
Training 33.0 -1.03 1.0* Yes=1, No=0; the mean value for each categories of centres is reported.
Should a financially sustainable Centre be considered a “success”? Some authors argue that by targeting self-sufficiency, BDS centres may end up neglecting the more innovative services...
Carlo Pietrobelli [email protected] www.pietrobelli.tk
25
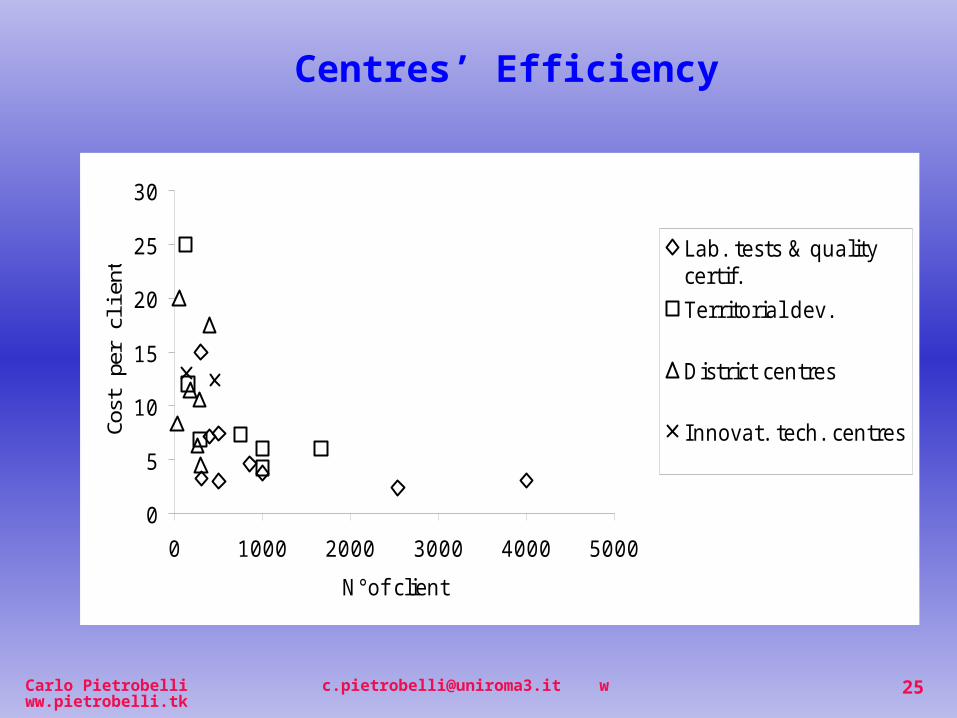
0
5
10
15
20
25
30
0 1000 2000 3000 4000 5000
N°of client
Cos
t pe
r cl
ient
Lab. tests & qualitycertif.
Territorial dev.
District centres
Innovat. tech. centres
Centres’ Efficiency
Carlo Pietrobelli [email protected] www.pietrobelli.tk
26
Centres’ Efficiency (and Economies of Scale)
Labs. & Quality Certification Centres
0246810121416
0 1000 2000 3000 4000 5000
N° of clients
Cost
per
clie
nt
Territorial Development Centres
0
5
10
15
20
25
30
0 500 1000 1500 2000
N° of clientsC
ost
per
clie
nt
Carlo Pietrobelli [email protected] www.pietrobelli.tk
27
the specific features of each case should be contemplated, such as:
The Centre’s specific objectives, which may differ
The local context, and whether a market for BDS exists or should be created
Stage of industrial development and historical considerations
Budget constraint considerations, often tighter in developing countries
Words of WARNING after an evaluation
Carlo Pietrobelli [email protected] www.pietrobelli.tk
28
Wide heterogeneity of the BDS centres in terms of size, specialisation, original initiative, turnover composition, dependence on public subsidies and linkages with firms and other institutions
Five categories identified
This variety is the coherent manifestation of the economic environment from which they originated, in a context characterised by a notable absence of a national policy in this field: not established within a national policy framework.
They are rather the result of very decentralised, bottom-up approaches, and of the collaboration among regional and local public institutions, very often jointly with the private sector: the expression of local specific needs.
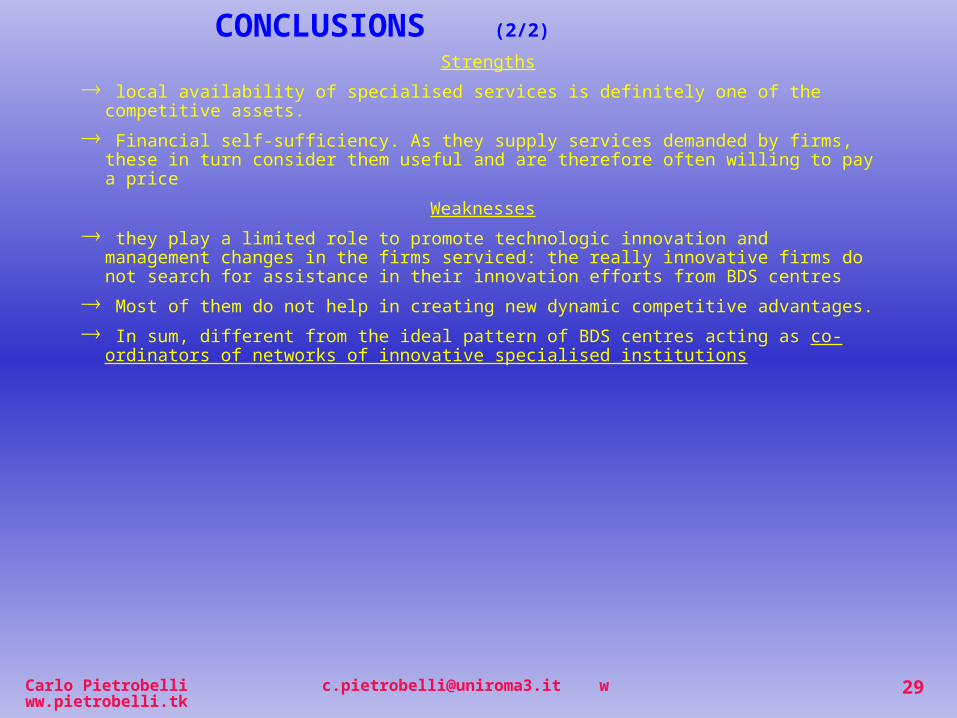
CONCLUSIONS (1/2)
Carlo Pietrobelli [email protected] www.pietrobelli.tk
29
Strengths
local availability of specialised services is definitely one of the competitive assets.
Financial self-sufficiency. As they supply services demanded by firms, these in turn consider them useful and are therefore often willing to pay a price
Weaknesses
they play a limited role to promote technologic innovation and management changes in the firms serviced: the really innovative firms do not search for assistance in their innovation efforts from BDS centres
Most of them do not help in creating new dynamic competitive advantages.
In sum, different from the ideal pattern of BDS centres acting as co-ordinators of networks of innovative specialised institutions
CONCLUSIONS (2/2)
Carlo Pietrobelli [email protected] www.pietrobelli.tk
30
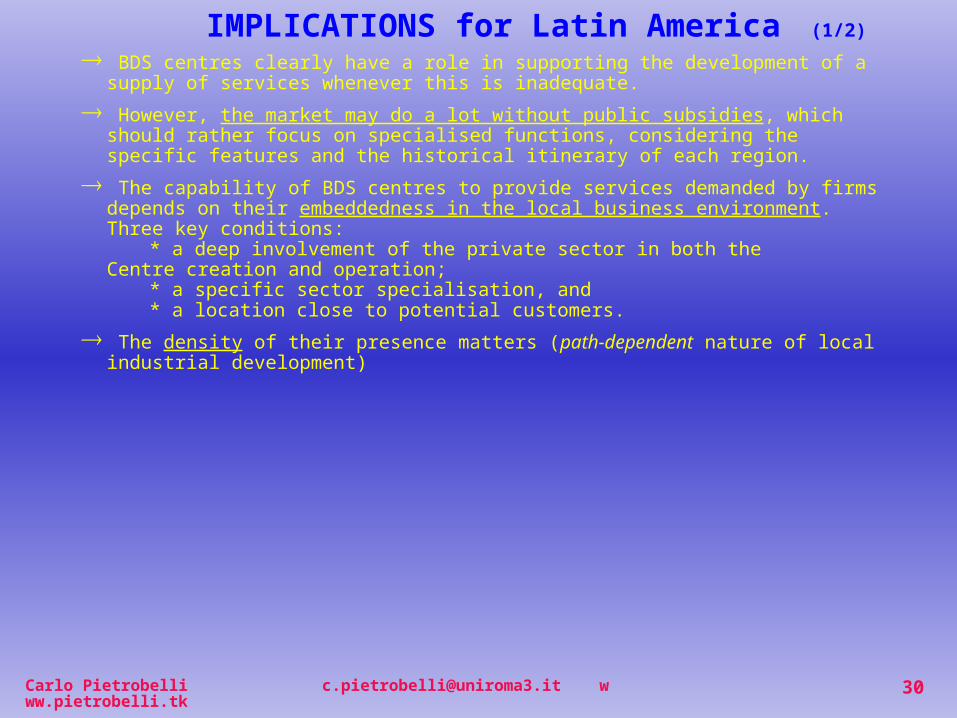
BDS centres clearly have a role in supporting the development of a supply of services whenever this is inadequate.
However, the market may do a lot without public subsidies, which should rather focus on specialised functions, considering the specific features and the historical itinerary of each region.
The capability of BDS centres to provide services demanded by firms depends on their embeddedness in the local business environment. Three key conditions:
* a deep involvement of the private sector in both the Centre creation and operation;
* a specific sector specialisation, and * a location close to potential customers.
The density of their presence matters (path-dependent nature of local industrial development)
IMPLICATIONS for Latin America (1/2)
Carlo Pietrobelli [email protected] www.pietrobelli.tk
31
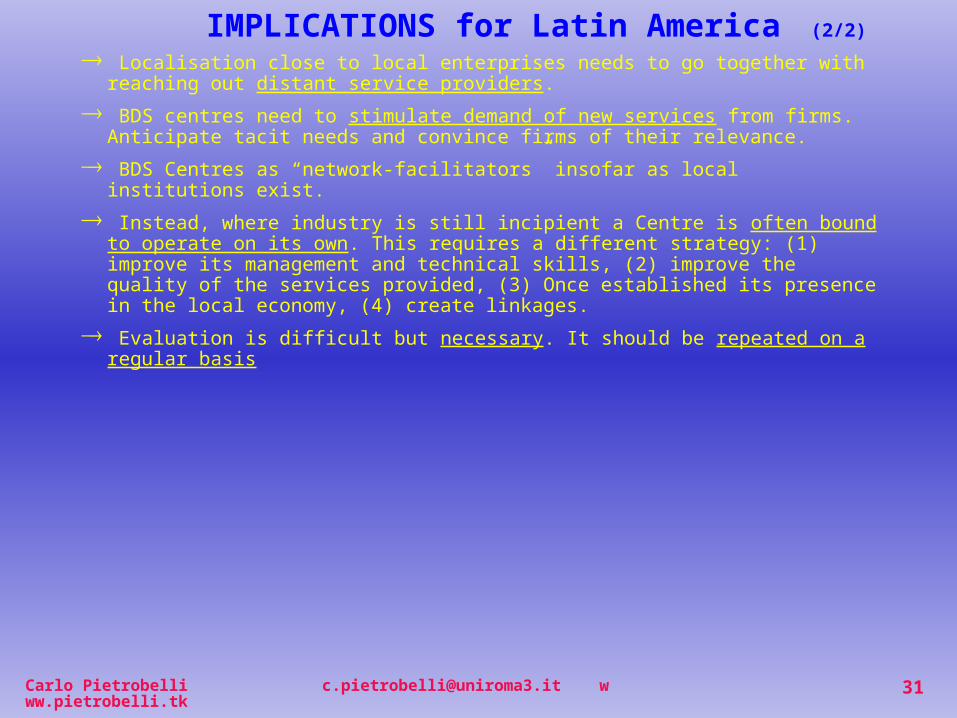
Localisation close to local enterprises needs to go together with reaching out distant service providers.
BDS centres need to stimulate demand of new services from firms. Anticipate tacit needs and convince firms of their relevance.
BDS Centres as “network-facilitators” insofar as local institutions exist.
Instead, where industry is still incipient a Centre is often bound to operate on its own. This requires a different strategy: (1) improve its management and technical skills, (2) improve the quality of the services provided, (3) Once established its presence in the local economy, (4) create linkages.
Evaluation is difficult but necessary. It should be repeated on a regular basis
IMPLICATIONS for Latin America (2/2)
Carlo Pietrobelli [email protected] www.pietrobelli.tk
32
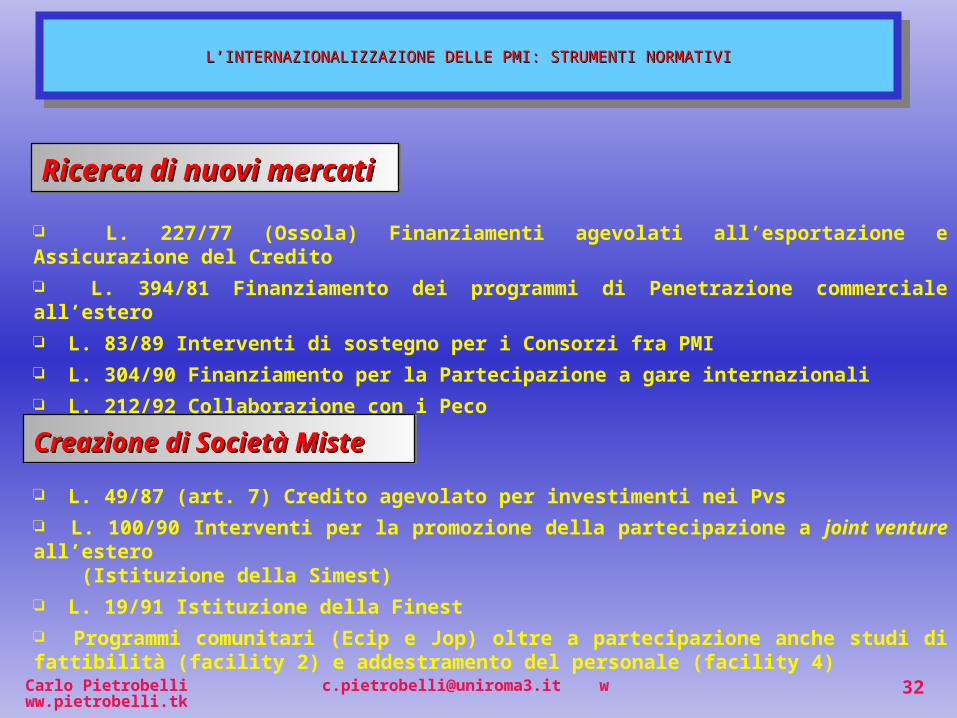
L’INTERNAZIONALIZZAZIONE DELLE PMI: STRUMENTI NORMATIVIL’INTERNAZIONALIZZAZIONE DELLE PMI: STRUMENTI NORMATIVIL’INTERNAZIONALIZZAZIONE DELLE PMI: STRUMENTI NORMATIVIL’INTERNAZIONALIZZAZIONE DELLE PMI: STRUMENTI NORMATIVI
Ricerca di nuovi Ricerca di nuovi mercatimercati Ricerca di nuovi Ricerca di nuovi mercatimercati
L. 227/77 (Ossola) Finanziamenti agevolati all’esportazione e Assicurazione del Credito L. 394/81 Finanziamento dei programmi di Penetrazione commerciale all’estero L. 83/89 Interventi di sostegno per i Consorzi fra PMI L. 304/90 Finanziamento per la Partecipazione a gare internazionali L. 212/92 Collaborazione con i Peco
Creazione di Società Creazione di Società MisteMiste Creazione di Società Creazione di Società MisteMiste L. 49/87 (art. 7) Credito agevolato per investimenti nei Pvs
L. 100/90 Interventi per la promozione della partecipazione a joint venture all’estero (Istituzione della Simest)
L. 19/91 Istituzione della Finest
Programmi comunitari (Ecip e Jop) oltre a partecipazione anche studi di fattibilità (facility 2) e addestramento del personale (facility 4)