Embed Size (px)
Citation preview
minerals
Article
Simulation-Based Analysis of Hydrometallurgical Processes.Case Study: Small-Scale Gold Mining in Ecuador
Santiago D. Salas 1,* , Yris González 1, Pamela Cango 1 , Jean Carlos Gómez 1 , Ronald Koepke 2
and Elizabeth Peña-Carpio 3
�����������������
Citation: Salas, S.D.; González, Y.;
Cango, P.; Gómez, J.C.; Koepke, R.;
Peña-Carpio, E. Simulation-Based
Analysis of Hydrometallurgical
Processes. Case Study: Small-Scale
Gold Mining in Ecuador. Minerals
2021, 11, 534. https://doi.org/
10.3390/min11050534
Academic Editors: Sehliselo Ndlovu
and Abhilash
Received: 12 April 2021
Accepted: 14 May 2021
Published: 19 May 2021
Publisher’s Note: MDPI stays neutral
with regard to jurisdictional claims in
published maps and institutional affil-
iations.
Copyright: © 2021 by the authors.
Licensee MDPI, Basel, Switzerland.
This article is an open access article
distributed under the terms and
conditions of the Creative Commons
Attribution (CC BY) license (https://
creativecommons.org/licenses/by/
4.0/).
1 Escuela Superior Politécnica del Litoral, ESPOL, Facultad de Ciencias Naturales y Matemáticas,Campus Gustavo Galindo, Km. 30.5 Vía Perimetral, Guayaquil P.O. Box 09-01-5863, Ecuador;[email protected] (Y.G.); [email protected] (P.C.); [email protected] (J.C.G.)
2 Independent Consultant, Stapenhorststrasse 65, 33615 Bielefeld, Germany; [email protected] Escuela Superior Politécnica del Litoral, ESPOL, Facultad de Ingeniería en Ciencias de la Tierra,
Campus Gustavo Galindo, Km. 30.5 Vía Perimetral, Guayaquil P.O. Box 09-01-5863, Ecuador;[email protected]
* Correspondence: [email protected]
Abstract: In this work, two hydrometallurgical processes for gold recovery are explored for a small-scale gold mining case study located at Ponce Enriquez, Azuay, Ecuador. The hydrometallurgicalsystems consider the use of sodium cyanide and sodium thiosulfate as leaching agents, with andwithout the incorporation of a subsystem for residual mercury removal. The proposed processes aremodelled using the commercial simulator PRO/II interconnected with a Python scientific computingenvironment for performing stochastic simulations. Monte Carlo simulations, in which the conversionof the main units and the prices of gold vary following a random uniform distribution, permitobserving the effects of these uncertainties on key recovery and economic indicators. The resultsfacilitate the correlation between the inputs and outputs of interest as well as the visualization of theoutputs variability for an adequate assessment of the systems under study by following a technicaland social responsibility approach.
Keywords: Ecuador; small-scale gold mining; gold hydrometallurgy; simulation-based; social responsibility
1. Introduction
The COVID-19 outbreak during 2020–2021 has placed Latin America as one of themost affected regions, because of not only the casualties, but also the economic impact [1].In this context, Ecuador has faced a GDP contraction along with the drop of oil pricesworldwide, requiring foreseeing medium- and long-term economic recovery alternatives.Gold mining appears to be a reasonable path to follow with the intention of improvingthe economy of the country. On 15 October 2020, Ecuador was accepted as a memberof the Extractive Industries Transparency Initiative (EITI), which paves the path in thedirection of improving transparency and accountability in the extractive sector [2]. Inthe case of gold mining, it is imperative to promote its technification, particularly for theartisanal and small-scale gold mining (ASGM) sector of the country. From exploration tocommercialization, the ASGM operations influence the perspective of the public opiniontowards the mining industry [3]. Ecuador has been promoting its modernization to increasetax collection and to reduce the associated environmental impact [4]. Even though thereare some unresolved issues, this sector has exposed benefits for rural citizens and thegovernment along with activating local networks and economic activities [5]. Therefore,the development of technically oriented frameworks for decision-making in small-scalegold mining operations has relevant importance.
ASGM processors are important actors in the extraction and processing of gold ores.Indeed, they contribute with 85% of the total gold produced in Ecuador. Small operations
Minerals 2021, 11, 534. https://doi.org/10.3390/min11050534 https://www.mdpi.com/journal/minerals
Minerals 2021, 11, 534 2 of 17
distinguish for being rudimentary, which characterizes the ASGM. On the other hand,small-scale mining plants are not always artisanal. The terms “artisanal” and “small-scale”are commonly used reciprocally, but they refer to rudimentary practices and the size ofoperation, respectively [6]. Indeed, both actors (artisanal and small-scale processors) worktypically together. For instance, in the Zaruma–Portovelo mining district (Ecuador), 87 goldprocessing facilities were reported in 2017 as small-scale mining plants. These facilitiesoffer crushing, grinding, amalgamating, and leaching with cyanide as services for localartisanal miners. In 2015, it was reported that 95% of these plants used cyanidation and65% of them used amalgamation in their operations. Treating tailings that contain residualmercury/amalgams with cyanide is a practice that has been increasing over the years. Eventhough this methodology increases gold recovery, it provokes a serious environmentalimpact [6]. Moreover, because of concerns generated by cyanide contaminated effluents,the literature reports processes that study alternative hydrometallurgical recovery methods,among which the use of sodium thiosulfate as a leaching agent seems to be a feasibleapproach [7].
Computer-aided tools are of remarkable importance in minerals processing [8]. Dif-ferent studies involving the modelling of gold recovery applying conventional and novelhydrometallurgical paths have been proposed [9–13]. Nevertheless, these approachesanalyze the main unit operations and involved processes separately. There are few studiesreporting the use of commercial simulators handling solids and minerals. Nikkhah andAnderson [14] studied the use of simulation software in mineral processing. The packageJKSimMet evaluated the sizing of mineral processing units while METSIM and IDEAS com-puted energy and mass balances. Lv et al. [15] addressed the use of the package METSIMfor the resolution of mass and energy balances in different units, studying the extractionof vanadium, chromium, and silicon. Okudan et al. [16] utilized the process simulatorSuperPro Designer for vanadium recovery along with experimental studies. More recently,Saidi and Kadkhodayan [17] employed the simulator Aspen Plus for a joint experimentaland computational study of copper recovery by implementing optimization and sensitivityanalyses of the leaching processes. Elomaa et al. [18] implemented a life cycle assessmentusing a cyanide-free cupric chloride leaching process for gold recovery, using the HSC-Simprocess simulation module. To the best of our knowledge, the process simulator PRO/IIhas not been reported in the literature for hydrometallurgical processes of gold recovery.
In this work, four different steady-state simulations of hydrometallurgical processesfor gold recovery are studied. The models are developed using the commercial simulatorPRO/II. The proposed framework incorporates the abovementioned simulator and aPython environment. Both platforms are interconnected with the Python COM interface.Uncertainties are included in the conversions of the main processing units and the prices ofgold. The considered hydrometallurgical processes include the use of sodium cyanide andsodium thiosulfate as leaching agents. Because of common practices evinced in small-scalegold mining operations, in which the raw mineral is previously exposed to mercury, thiswork incorporates a unit for residual mercury removal. The main aim of such a designproposal is to minimize the further environmental impact mercury has demonstrated tohave in water bodies [19]. Monte Carlo simulations are carried out for visualizing theimpact of the uncertainties in three key indicators. Finally, by combining a technical andsocial responsibility assessment, some perspectives are drawn, emphasizing the potentialimpact the proposed framework has for the small-scale gold mining case study.
2. Process Description
2.1. Leaching, Adsorption, and Elution Processes
2.1.1. Via Sodium Cyanide
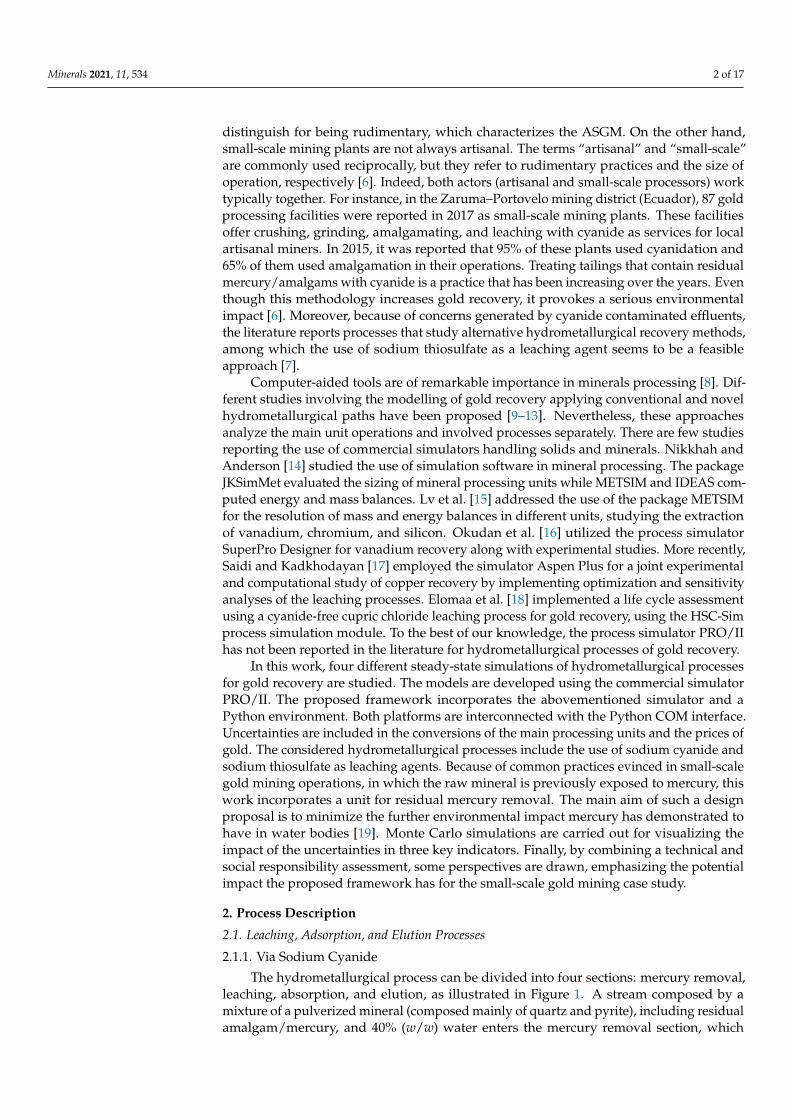
The hydrometallurgical process can be divided into four sections: mercury removal,leaching, absorption, and elution, as illustrated in Figure 1. A stream composed by amixture of a pulverized mineral (composed mainly of quartz and pyrite), including residualamalgam/mercury, and 40% (w/w) water enters the mercury removal section, which
Minerals 2021, 11, 534 3 of 17
consists of the conical bottom repulper TK-101 and the hydro-separator TK-102. The systemrecovers 96% of the existing mercury and amalgams through gravimetric separation, forlater sending them to the retort furnace H-101 where the stream is heated up to 700 K. Atthis temperature, mercury evaporates and separates from gold, facilitating the recoveryof both. The vaporized mercury passes through the condenser E-101, and it is recoveredin the liquid phase for its further use. This approach permits recovering up to 77% of theremnant mercury.
Minerals 2021, 11, x FOR PEER REVIEW 3 of 18
2. Process Description
2.1. Leaching, Adsorption, and Elution Processes
2.1.1. Via Sodium Cyanide
The hydrometallurgical process can be divided into four sections: mercury removal,
leaching, absorption, and elution, as illustrated in Figure 1. A stream composed by a
mixture of a pulverized mineral (composed mainly of quartz and pyrite), including re-
sidual amalgam/mercury, and 40% (w/w) water enters the mercury removal section,
which consists of the conical bottom repulper TK-101 and the hydro-separator TK-102.
The system recovers 96% of the existing mercury and amalgams through gravimetric
separation, for later sending them to the retort furnace H-101 where the stream is heated
up to 700 K. At this temperature, mercury evaporates and separates from gold, facilitat-
ing the recovery of both. The vaporized mercury passes through the condenser E-101,
and it is recovered in the liquid phase for its further use. This approach permits recov-
ering up to 77% of the remnant mercury.
Figure 1. Process flow diagram for hydrometallurgical gold recovery using sodium cyanide as a
leaching agent.
The stream coming from the hydro-separator TK-102 has a set point of 50% (w/w)
water. This stream is referred to as a pulp and passes through two stirred tanks in series
R-101 and R-102, where the leaching process included in Section 2 takes place. Here, the
pulp is conditioned by adding calcium hydroxide to increase its pH to 11. Sodium cya-
nide is then added as a complexing agent, until it reaches a concentration of 0.15 M. To-
gether with gold, it forms a soluble and recoverable compound. Air is injected into the
reactors keeping the oxygen concentration at 8.2 mg/L to ensure slightly oxidizing con-
ditions required for leaching. The leaching reaction that takes place inside the tanks is
denoted as Equation (1) [20]:
4 Au + 8 CN− + O2 + 2 H2O ↔ 4 Au(CN)2− + 4 OH−. (1)
Section 3 corresponds to an adsorption system that uses activated carbon with a ra-
tio of 20 kg per ton of mineral [20]. The system works in a counter current arrangement
and includes three stages represented by TK-103, TK-104, and TK-105. Here, the gold
complex is retained. It is assumed that the carbon adsorbs the complex until it reaches
TK-103 and that in TK-105 the solution no longer contains gold. Thus, it is sent to a
treatment system.
Figure 1. Process flow diagram for hydrometallurgical gold recovery using sodium cyanide as aleaching agent.
The stream coming from the hydro-separator TK-102 has a set point of 50% (w/w)water. This stream is referred to as a pulp and passes through two stirred tanks in seriesR-101 and R-102, where the leaching process included in Section 2 takes place. Here, thepulp is conditioned by adding calcium hydroxide to increase its pH to 11. Sodium cyanideis then added as a complexing agent, until it reaches a concentration of 0.15 M. Togetherwith gold, it forms a soluble and recoverable compound. Air is injected into the reactorskeeping the oxygen concentration at 8.2 mg/L to ensure slightly oxidizing conditionsrequired for leaching. The leaching reaction that takes place inside the tanks is denoted asEquation (1) [20]:
4 Au + 8 CN− + O2 + 2 H2O ↔ 4 Au(CN)−2 + 4 OH−. (1)
Section 3 corresponds to an adsorption system that uses activated carbon with a ratioof 20 kg per ton of mineral [20]. The system works in a counter current arrangement andincludes three stages represented by TK-103, TK-104, and TK-105. Here, the gold complexis retained. It is assumed that the carbon adsorbs the complex until it reaches TK-103 andthat in TK-105 the solution no longer contains gold. Thus, it is sent to a treatment system.
The carbon loaded with gold is retained due to its particle size in TK-103 with filters.Thereafter, it is sent to the elution column T-101 in Section 4. In this column, a solutioncomposed of sodium cyanide, ethanol, and sodium hydroxide is fed at a rate of 2 thebed’s volume. The mixture, known as the elution solution, is heated up to 353 K in E-101.When the loaded carbon is put in contact with the solution, it causes the release of the goldcomplex by diluting it. The resultant electrolytic solution is sent to the electroplating unitto obtain the final gold product, while the utilized carbon is regenerated.
Minerals 2021, 11, 534 4 of 17
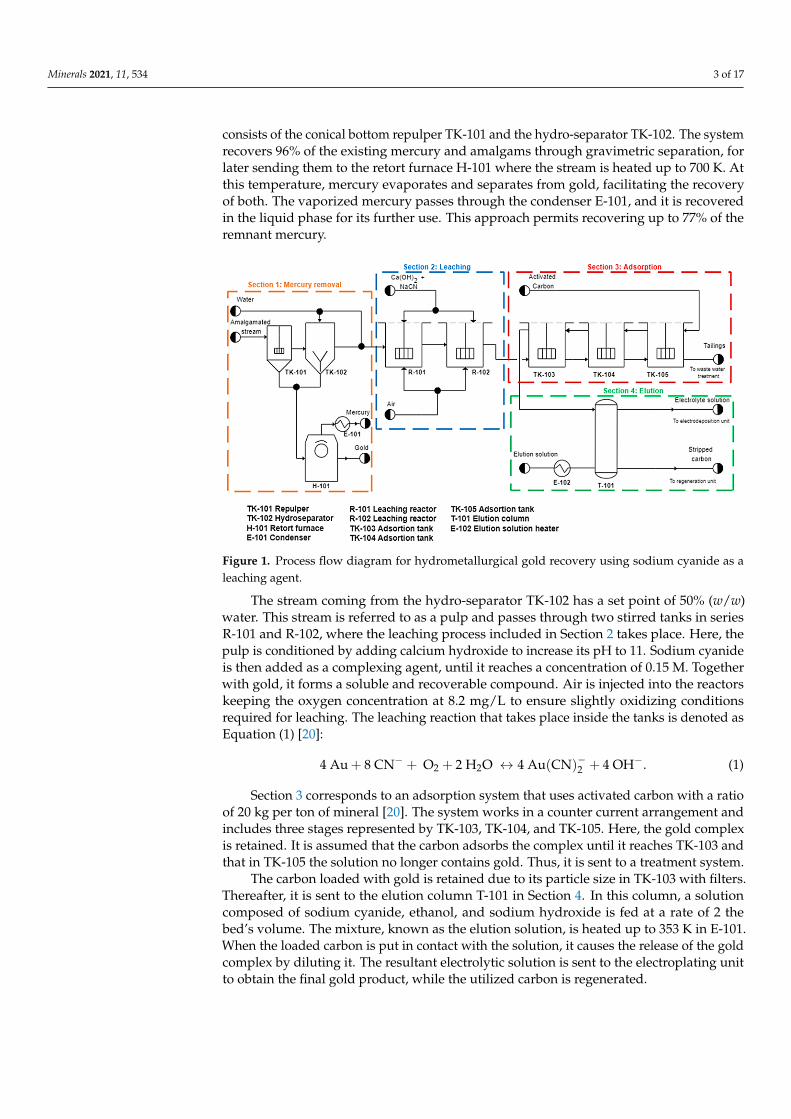
2.1.2. Via Sodium Thiosulfate
In the case of using sodium thiosulfate as the leaching agent, some modifications areincluded as observed in Figure 2. This system is analogous the one presented in Figure 1.However, in R-101, sodium thiosulfate is added as the leaching agent, and the ammoniadose is adjusted for reaching a 10.5 pH value. The reactor uses copper sulfate as catalyst ata concentration of 1.5 g/L. Later, it is regenerated by reducing the dissolved oxygen.
Minerals 2021, 11, x FOR PEER REVIEW 4 of 18
The carbon loaded with gold is retained due to its particle size in TK-103 with filters.
Thereafter, it is sent to the elution column T-101 in Section 4. In this column, a solution
composed of sodium cyanide, ethanol, and sodium hydroxide is fed at a rate of 2 the
bed’s volume. The mixture, known as the elution solution, is heated up to 353 K in E-101.
When the loaded carbon is put in contact with the solution, it causes the release of the
gold complex by diluting it. The resultant electrolytic solution is sent to the electroplating
unit to obtain the final gold product, while the utilized carbon is regenerated.
2.1.2. Via Sodium Thiosulfate
In the case of using sodium thiosulfate as the leaching agent, some modifications are
included as observed in Figure 2. This system is analogous the one presented in Figure 1.
However, in R-101, sodium thiosulfate is added as the leaching agent, and the ammonia
dose is adjusted for reaching a 10.5 pH value. The reactor uses copper sulfate as catalyst
at a concentration of 1.5 g/L. Later, it is regenerated by reducing the dissolved oxygen.
Figure 2. Process flow diagram for hydrometallurgical gold recovery using sodium thiosulfate as a
leaching agent.
The leaching reaction for the dissolution of gold [7,21] is represented as Equation (2):
2 Au + 10 S2O32− + 2 Cu(NH3)4
2+ ↔ 2 Au(S2O3)23− + 8 NH3 + 2 Cu(S2O3)3
5−. (2)
Section 3 represents the carbon absorption system. It consists of three parallel tanks
TK-103, TK-104, and TK-105. This arrangement provides a prolonged contact between
the gold ion and the contact surface. Finally, in Section 4, a mixture of ammonia and so-
dium thiosulfate is used as an elution solution for T-101.
2.2. Hydrometallurgical Process Simulation
All the simulations follow a similar methodology. The components are added using
the PRO/II OLILIB library, which allows working with pure electrolytes and minerals, as
those found in the studied systems. For simulating the raw mineral, samples processed in
a small-scale mining plant located at Ponce Enriquez, Azuay, Ecuador were considered.
Different physical and chemical analyses were performed to determine the mineral
properties and its composition. Such analyses are important to understand the ore’s be-
havior during its processing. Physical techniques such as natural humidity and apparent
and real density were carried out. In addition, the samples were analyzed using a Flame
Atomic Absorption Spectrophotometer (210VGP, Buck Scientific Inc., East Norwalk, CT,
USA). The mineralogical composition of the raw material was evaluated by an X-ray
Figure 2. Process flow diagram for hydrometallurgical gold recovery using sodium thiosulfate as aleaching agent.
The leaching reaction for the dissolution of gold [7,21] is represented as Equation (2):
2 Au + 10 S2O2−3 + 2 Cu(NH3)
2+4 ↔ 2 Au(S2O3)
3−2 + 8 NH3 + 2 Cu(S2O3)
5−3 . (2)
Section 3 represents the carbon absorption system. It consists of three parallel tanksTK-103, TK-104, and TK-105. This arrangement provides a prolonged contact between thegold ion and the contact surface. Finally, in Section 4, a mixture of ammonia and sodiumthiosulfate is used as an elution solution for T-101.
2.2. Hydrometallurgical Process Simulation
All the simulations follow a similar methodology. The components are added usingthe PRO/II OLILIB library, which allows working with pure electrolytes and minerals, asthose found in the studied systems. For simulating the raw mineral, samples processed ina small-scale mining plant located at Ponce Enriquez, Azuay, Ecuador were considered.
Different physical and chemical analyses were performed to determine the mineralproperties and its composition. Such analyses are important to understand the ore’sbehavior during its processing. Physical techniques such as natural humidity and apparentand real density were carried out. In addition, the samples were analyzed using a FlameAtomic Absorption Spectrophotometer (210VGP, Buck Scientific Inc., East Norwalk, CT,USA). The mineralogical composition of the raw material was evaluated by an X-raydiffractometer instrument (X’Pert Pro, PANalytical, Almelo, The Netherlands). Finally, thegranulometric analyses of the material to be leached took place using a laser scatteringparticle size distribution analyzer (LA-300, HORIBA Scientific, Austin, TX, USA). Theinformation regarding the mineral composition of the studied material can be found inTable 1.
Minerals 2021, 11, 534 5 of 17
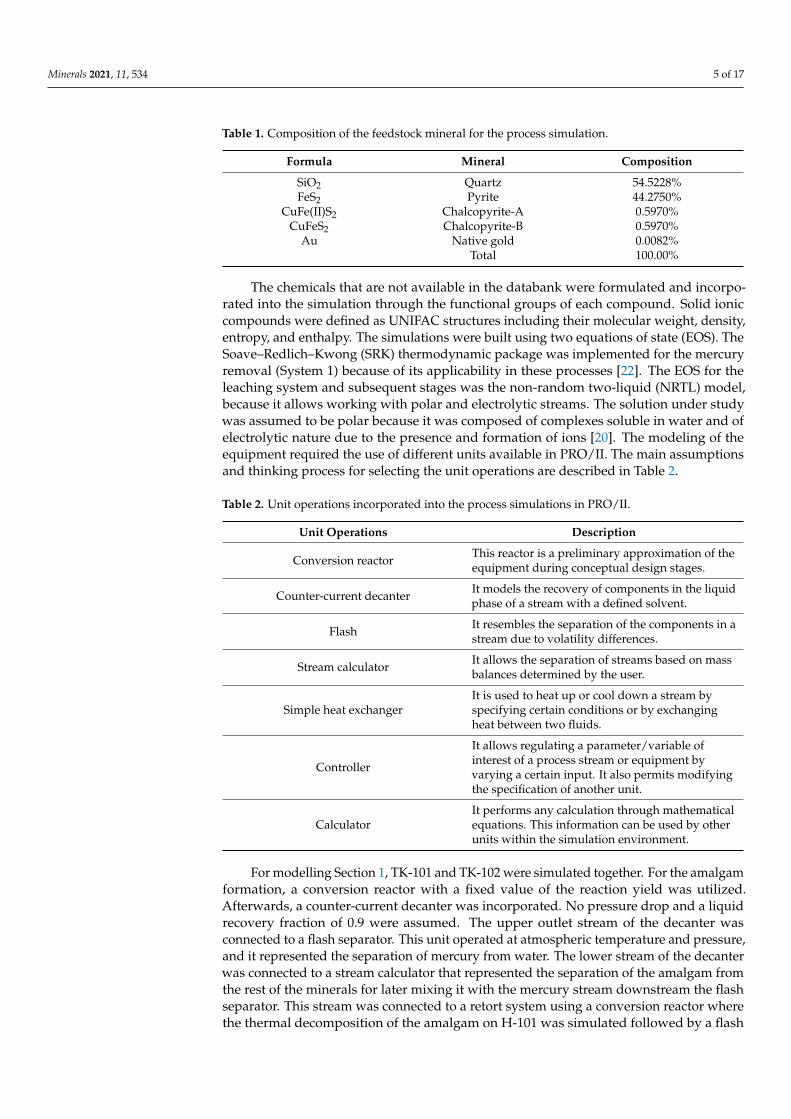
Table 1. Composition of the feedstock mineral for the process simulation.
Formula Mineral Composition
SiO2 Quartz 54.5228%FeS2 Pyrite 44.2750%
CuFe(II)S2 Chalcopyrite-A 0.5970%CuFeS2 Chalcopyrite-B 0.5970%
Au Native gold 0.0082%Total 100.00%
The chemicals that are not available in the databank were formulated and incorpo-rated into the simulation through the functional groups of each compound. Solid ioniccompounds were defined as UNIFAC structures including their molecular weight, density,entropy, and enthalpy. The simulations were built using two equations of state (EOS). TheSoave–Redlich–Kwong (SRK) thermodynamic package was implemented for the mercuryremoval (System 1) because of its applicability in these processes [22]. The EOS for theleaching system and subsequent stages was the non-random two-liquid (NRTL) model,because it allows working with polar and electrolytic streams. The solution under studywas assumed to be polar because it was composed of complexes soluble in water and ofelectrolytic nature due to the presence and formation of ions [20]. The modeling of theequipment required the use of different units available in PRO/II. The main assumptionsand thinking process for selecting the unit operations are described in Table 2.
Table 2. Unit operations incorporated into the process simulations in PRO/II.
Unit Operations Description
Conversion reactor This reactor is a preliminary approximation of theequipment during conceptual design stages.
Counter-current decanter It models the recovery of components in the liquidphase of a stream with a defined solvent.
Flash It resembles the separation of the components in astream due to volatility differences.
Stream calculator It allows the separation of streams based on massbalances determined by the user.
Simple heat exchangerIt is used to heat up or cool down a stream byspecifying certain conditions or by exchangingheat between two fluids.
Controller
It allows regulating a parameter/variable ofinterest of a process stream or equipment byvarying a certain input. It also permits modifyingthe specification of another unit.
CalculatorIt performs any calculation through mathematicalequations. This information can be used by otherunits within the simulation environment.
For modelling Section 1, TK-101 and TK-102 were simulated together. For the amalgamformation, a conversion reactor with a fixed value of the reaction yield was utilized.Afterwards, a counter-current decanter was incorporated. No pressure drop and a liquidrecovery fraction of 0.9 were assumed. The upper outlet stream of the decanter wasconnected to a flash separator. This unit operated at atmospheric temperature and pressure,and it represented the separation of mercury from water. The lower stream of the decanterwas connected to a stream calculator that represented the separation of the amalgam fromthe rest of the minerals for later mixing it with the mercury stream downstream the flashseparator. This stream was connected to a retort system using a conversion reactor wherethe thermal decomposition of the amalgam on H-101 was simulated followed by a flash
Minerals 2021, 11, 534 6 of 17
that separated gold and mercury in the vapor phase. E-101 was a heat exchanger in whichthe outlet temperature was specified at 298 K, ensuring a total condensation of the mercury.
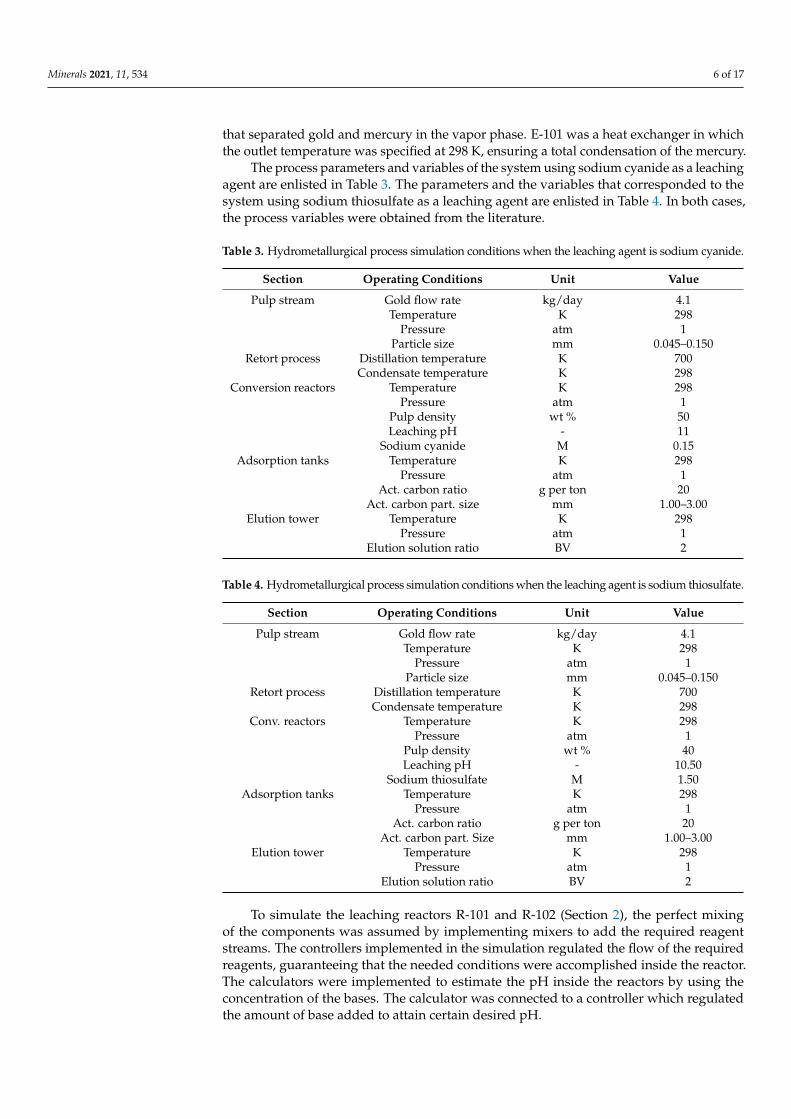
The process parameters and variables of the system using sodium cyanide as a leachingagent are enlisted in Table 3. The parameters and the variables that corresponded to thesystem using sodium thiosulfate as a leaching agent are enlisted in Table 4. In both cases,the process variables were obtained from the literature.
Table 3. Hydrometallurgical process simulation conditions when the leaching agent is sodium cyanide.
Section Operating Conditions Unit Value
Pulp stream Gold flow rate kg/day 4.1Temperature K 298
Pressure atm 1Particle size mm 0.045–0.150
Retort process Distillation temperature K 700Condensate temperature K 298
Conversion reactors Temperature K 298Pressure atm 1
Pulp density wt % 50Leaching pH - 11
Sodium cyanide M 0.15Adsorption tanks Temperature K 298
Pressure atm 1Act. carbon ratio g per ton 20
Act. carbon part. size mm 1.00–3.00Elution tower Temperature K 298
Pressure atm 1Elution solution ratio BV 2
Table 4. Hydrometallurgical process simulation conditions when the leaching agent is sodium thiosulfate.
Section Operating Conditions Unit Value
Pulp stream Gold flow rate kg/day 4.1Temperature K 298
Pressure atm 1Particle size mm 0.045–0.150
Retort process Distillation temperature K 700Condensate temperature K 298
Conv. reactors Temperature K 298Pressure atm 1
Pulp density wt % 40Leaching pH - 10.50
Sodium thiosulfate M 1.50Adsorption tanks Temperature K 298
Pressure atm 1Act. carbon ratio g per ton 20
Act. carbon part. Size mm 1.00–3.00Elution tower Temperature K 298
Pressure atm 1Elution solution ratio BV 2
To simulate the leaching reactors R-101 and R-102 (Section 2), the perfect mixingof the components was assumed by implementing mixers to add the required reagentstreams. The controllers implemented in the simulation regulated the flow of the requiredreagents, guaranteeing that the needed conditions were accomplished inside the reactor.The calculators were implemented to estimate the pH inside the reactors by using theconcentration of the bases. The calculator was connected to a controller which regulatedthe amount of base added to attain certain desired pH.
Minerals 2021, 11, 534 7 of 17
The counter-current adsorption tank system in Section 3 was simulated using a con-version reactor and a molar equivalency of the ion attached to the carbon. In this case, theadsorption yield was utilized as a conversion value. A stream calculator was responsiblefor separating the activated carbon from the rest of the components, once the adsorptionfinished. The three adsorption stages, established in TK-103, TK-104, and TK-105, were sim-ulated as one, considering the overall performance of the process. Equation (3) representsthe absorption equivalence reaction for the sodium cyanide system:
Mn+ + n Au(CN)−2 ↔ Mn+ [Au(CN)−2 ]n. (3)
For the T-101 elution tower, a heat exchanger adjusted the elution solution to a desiredtemperature, followed by a conversion reactor that used the same base in adsorption butthis time with the elution yield. Likewise, a stream calculator was implemented for thedeactivated carbon separated from the electrolytic current. Equation (4) represents themolar equivalency for the elution of the sodium cyanide system [20]:
Mn+ + [Au(CN)−2 ]n ↔ Mn+ + n·Au(CN)−2 . (4)
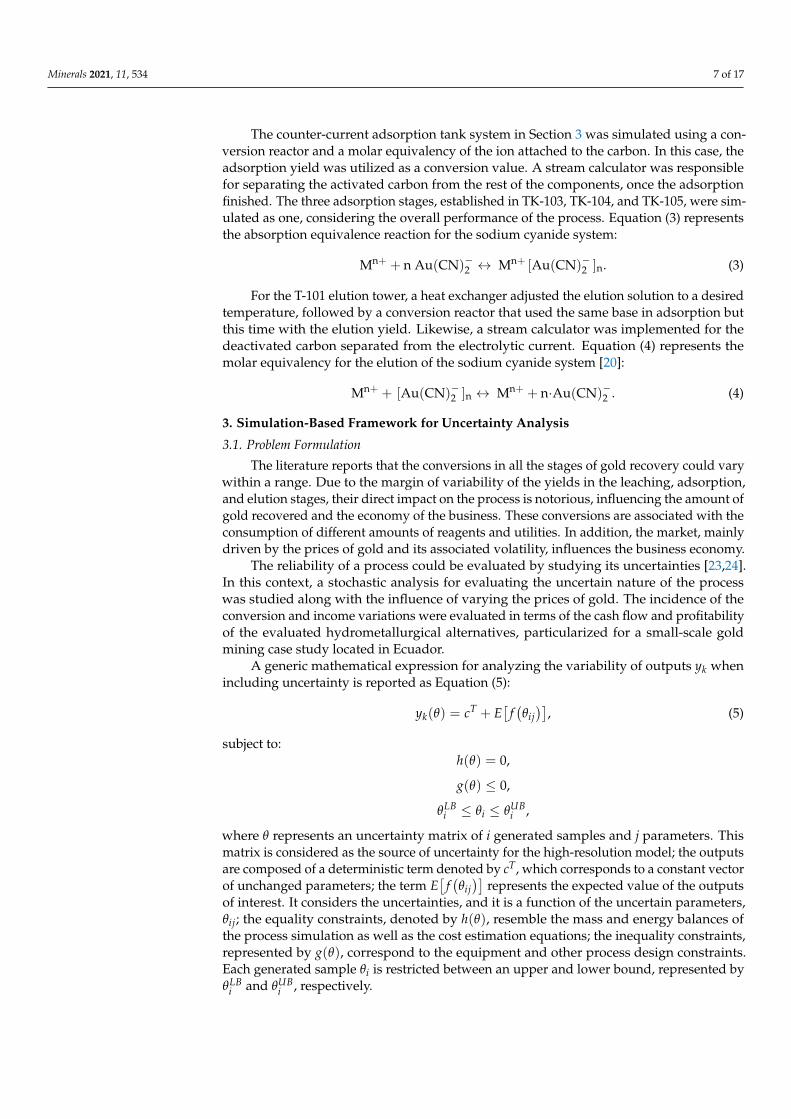
3. Simulation-Based Framework for Uncertainty Analysis
3.1. Problem Formulation
The literature reports that the conversions in all the stages of gold recovery could varywithin a range. Due to the margin of variability of the yields in the leaching, adsorption,and elution stages, their direct impact on the process is notorious, influencing the amount ofgold recovered and the economy of the business. These conversions are associated with theconsumption of different amounts of reagents and utilities. In addition, the market, mainlydriven by the prices of gold and its associated volatility, influences the business economy.
The reliability of a process could be evaluated by studying its uncertainties [23,24].In this context, a stochastic analysis for evaluating the uncertain nature of the processwas studied along with the influence of varying the prices of gold. The incidence of theconversion and income variations were evaluated in terms of the cash flow and profitabilityof the evaluated hydrometallurgical alternatives, particularized for a small-scale goldmining case study located in Ecuador.
A generic mathematical expression for analyzing the variability of outputs yk whenincluding uncertainty is reported as Equation (5):
yk(θ) = cT + E[
f(θij
)], (5)
subject to:h(θ) = 0,
g(θ) ≤ 0,
θLBi ≤ θi ≤ θUB
i ,
where θ represents an uncertainty matrix of i generated samples and j parameters. Thismatrix is considered as the source of uncertainty for the high-resolution model; the outputsare composed of a deterministic term denoted by cT, which corresponds to a constant vectorof unchanged parameters; the term E
[f(θij
)]represents the expected value of the outputs
of interest. It considers the uncertainties, and it is a function of the uncertain parameters,θij; the equality constraints, denoted by h(θ), resemble the mass and energy balances ofthe process simulation as well as the cost estimation equations; the inequality constraints,represented by g(θ), correspond to the equipment and other process design constraints.Each generated sample θi is restricted between an upper and lower bound, represented byθLB
i and θUBi , respectively.
Minerals 2021, 11, 534 8 of 17
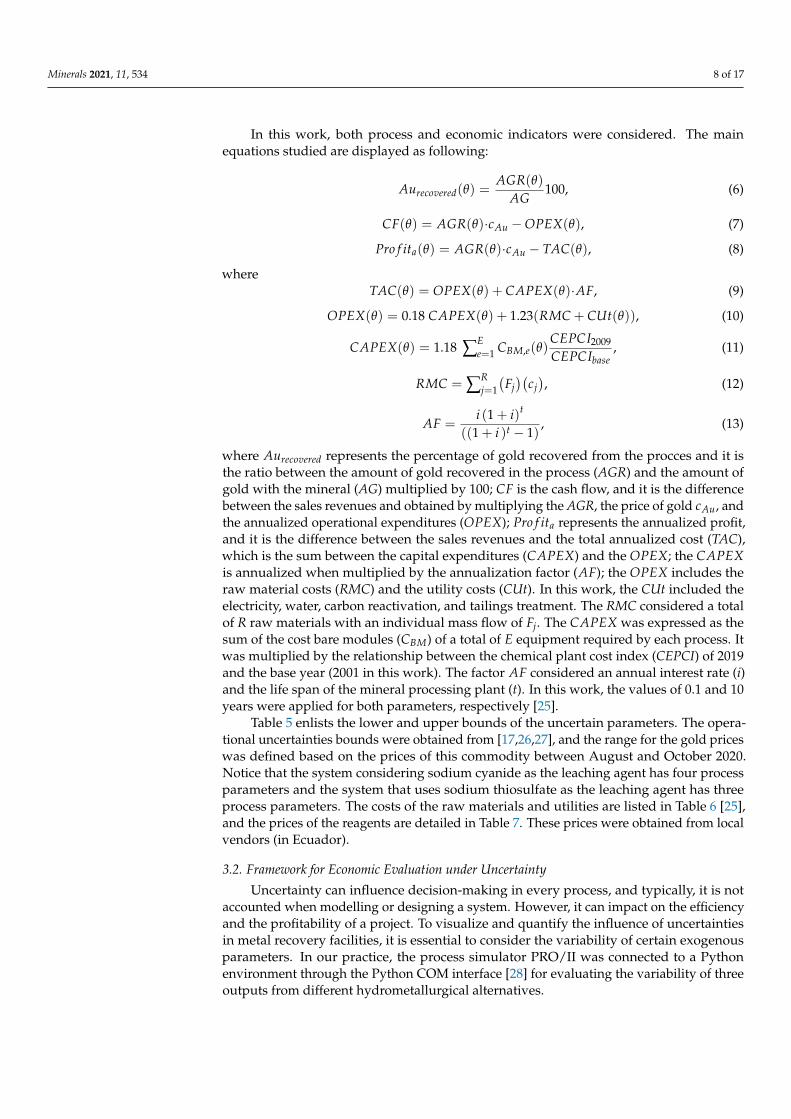
In this work, both process and economic indicators were considered. The mainequations studied are displayed as following:
Aurecovered(θ) =AGR(θ)
AG100, (6)
CF(θ) = AGR(θ)·cAu −OPEX(θ), (7)
Pro f ita(θ) = AGR(θ)·cAu − TAC(θ), (8)
whereTAC(θ) = OPEX(θ) + CAPEX(θ)·AF, (9)
OPEX(θ) = 0.18 CAPEX(θ) + 1.23(RMC + CUt(θ)), (10)
CAPEX(θ) = 1.18 ∑Ee=1 CBM,e(θ)
CEPCI2009
CEPCIbase, (11)
RMC = ∑Rj=1
(Fj)(
cj), (12)
AF =i (1 + i)t
((1 + i )t − 1), (13)
where Aurecovered represents the percentage of gold recovered from the procces and it isthe ratio between the amount of gold recovered in the process (AGR) and the amount ofgold with the mineral (AG) multiplied by 100; CF is the cash flow, and it is the differencebetween the sales revenues and obtained by multiplying the AGR, the price of gold cAu, andthe annualized operational expenditures (OPEX); Pro f ita represents the annualized profit,and it is the difference between the sales revenues and the total annualized cost (TAC),which is the sum between the capital expenditures (CAPEX) and the OPEX; the CAPEXis annualized when multiplied by the annualization factor (AF); the OPEX includes theraw material costs (RMC) and the utility costs (CUt). In this work, the CUt included theelectricity, water, carbon reactivation, and tailings treatment. The RMC considered a totalof R raw materials with an individual mass flow of Fj. The CAPEX was expressed as thesum of the cost bare modules (CBM) of a total of E equipment required by each process. Itwas multiplied by the relationship between the chemical plant cost index (CEPCI) of 2019and the base year (2001 in this work). The factor AF considered an annual interest rate (i)and the life span of the mineral processing plant (t). In this work, the values of 0.1 and 10years were applied for both parameters, respectively [25].
Table 5 enlists the lower and upper bounds of the uncertain parameters. The opera-tional uncertainties bounds were obtained from [17,26,27], and the range for the gold priceswas defined based on the prices of this commodity between August and October 2020.Notice that the system considering sodium cyanide as the leaching agent has four processparameters and the system that uses sodium thiosulfate as the leaching agent has threeprocess parameters. The costs of the raw materials and utilities are listed in Table 6 [25],and the prices of the reagents are detailed in Table 7. These prices were obtained from localvendors (in Ecuador).
3.2. Framework for Economic Evaluation under Uncertainty
Uncertainty can influence decision-making in every process, and typically, it is notaccounted when modelling or designing a system. However, it can impact on the efficiencyand the profitability of a project. To visualize and quantify the influence of uncertaintiesin metal recovery facilities, it is essential to consider the variability of certain exogenousparameters. In our practice, the process simulator PRO/II was connected to a Pythonenvironment through the Python COM interface [28] for evaluating the variability of threeoutputs from different hydrometallurgical alternatives.
Minerals 2021, 11, 534 9 of 17
Table 5. Lower and upper bounds of parameters including uncertainty.
Parameters θLBi θUB
i Units
Sodium cyanide as the leaching agent
Leaching conversion(Reactor 1 and 2) 0.88 0.90 -
Adsorption conversion 0.87 0.89 -Elution process conversion 0.90 0.95 -
Sodium thiosulfate as the leaching agent
Leaching conversion 0.75 0.85 -Adsorption conversion 0.85 0.95 -Elution process conversion 0.70 0.75 -
Market uncertainty
Price of gold 60 65 USD/g
Table 6. Prices of utilities and raw materials.
Description Value Units
Pulverized mineral(royalties, transport, and grinding) 105 USD/ton
Waste treatment(solid and liquid effluents) 200 USD/ton
Activated carbon 1896 USD/tonWater for use in the processes 0.067 USD/1000 kgElectric consumption 0.06 USD/kWh
Table 7. Prices of reagents and other required chemicals.
Description Cost Units
Sodium cyanide 3.10 USD/kgCalcium hydroxide 0.32 USD/kgActivated carbon 5500 USD/tonSodium hydroxide 4.62 USD/kgEthyl alcohol 6.33 USD/kgIndustrial ammonia 1.50 USD/kgSodium thiosulfate 4.08 USD/kgCopper sulphate 3.50 USD/kg
The framework utilized the packages PRO/II Process Engineering 10.2 (64 bit) andSpyder (Python 3.7). The experiments in this work were performed in a laptop PC IntelCore™ i7-8565U CPU @ 1.80 GHz with 16.00 GB of installed RAM. To test the framework,1200 simulations of each hydrometallurgical configurations were evaluated.
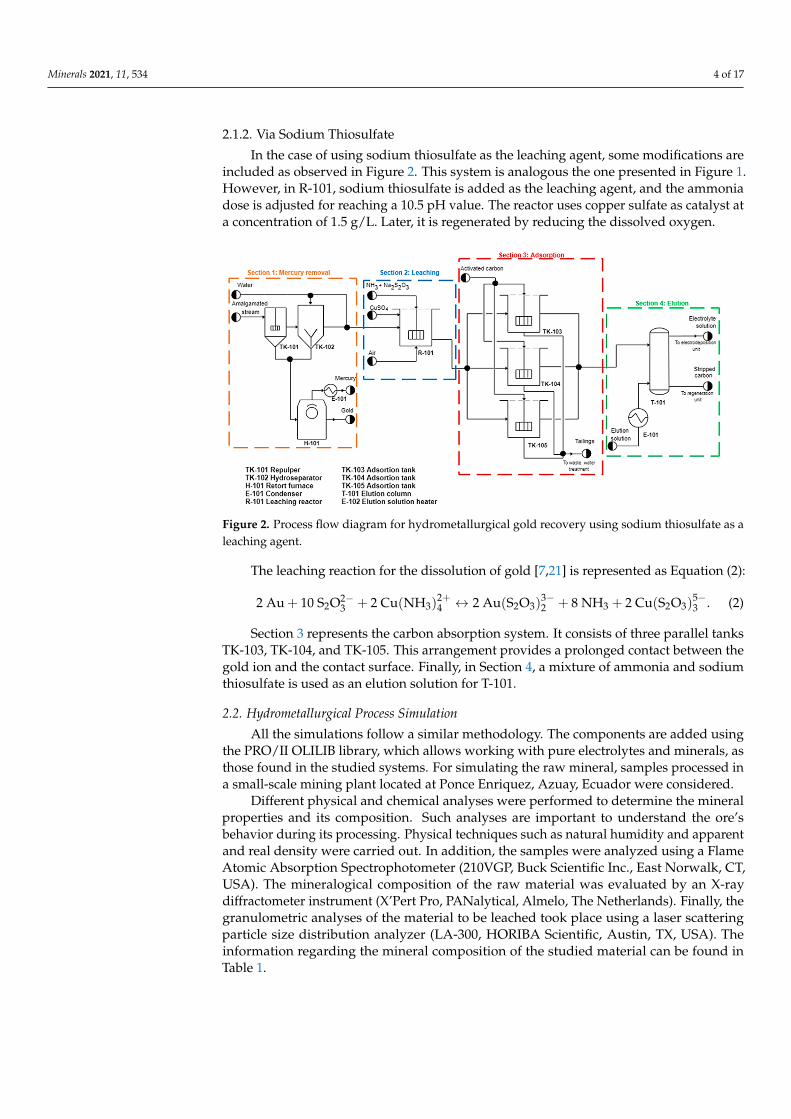
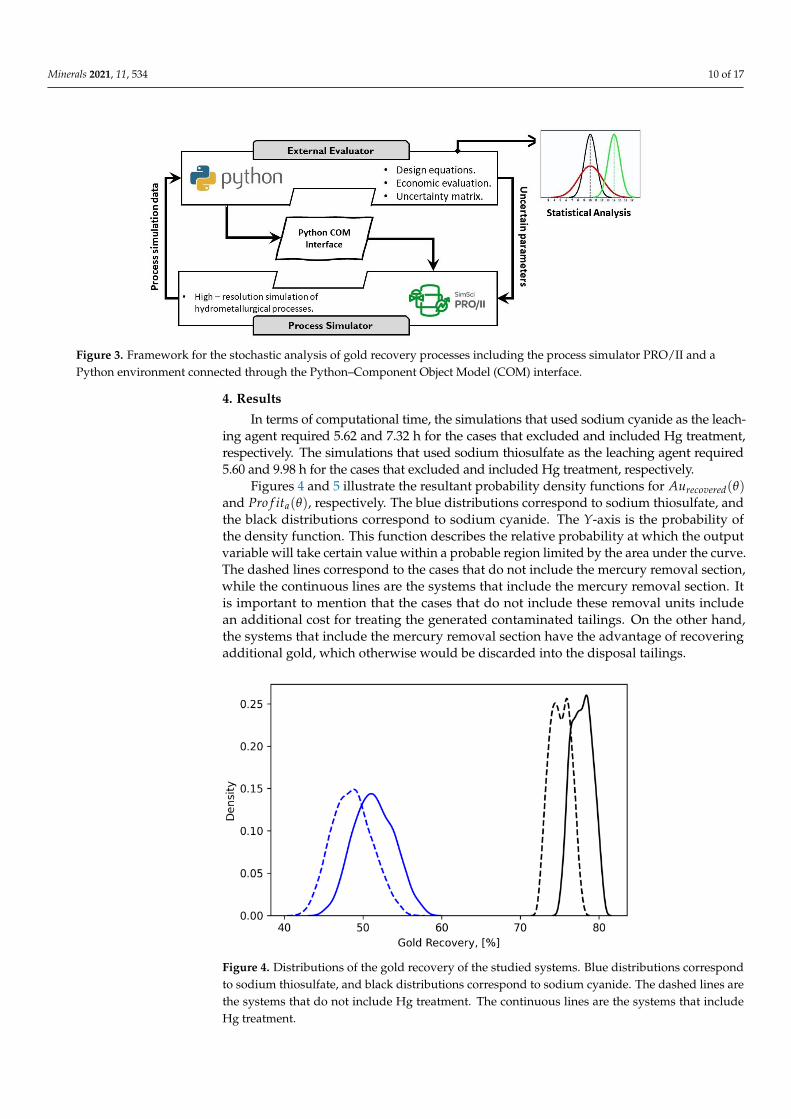
A schematic of the framework is included in Figure 3. The proposed approach adoptsa simulation-based paradigm that exploits the accuracy of the high-resolution model, andit is based on the methodology proposed in [29]. The benefits of the process simulatorinclude the reliability of internal mass and energy balances as well as internally built-incomputations. The interface with Python was set as an external evaluator tool.
The connection between Python and PRO/II was established through the ComponentObject Model (COM) command which allows a bi-directional communication betweenPython and PRO/II. PyWin32, an extension package for Windows available in Python,allows accessing the COM to manipulate other applications while using the Python pro-gramming interpreter. Once the communication between both platforms is established,the PRO/II COM server allows access to the process simulation model to read and writevalues on the simulation’s objects and streams. This promotes a continuous and iterativeinteraction between the process simulation and Python.
Minerals 2021, 11, 534 10 of 17Minerals 2021, 11, x FOR PEER REVIEW 10 of 18
Figure 3. Framework for the stochastic analysis of gold recovery processes including the process
simulator PRO/II and a Python environment connected through the Python–Component Object
Model (COM) interface.
The connection between Python and PRO/II was established through the Compo-
nent Object Model (COM) command which allows a bi-directional communication be-
tween Python and PRO/II. PyWin32, an extension package for Windows available in Py-
thon, allows accessing the COM to manipulate other applications while using the Python
programming interpreter. Once the communication between both platforms is estab-
lished, the PRO/II COM server allows access to the process simulation model to read and
write values on the simulation’s objects and streams. This promotes a continuous and it-
erative interaction between the process simulation and Python.
4. Results
In terms of computational time, the simulations that used sodium cyanide as the
leaching agent required 5.62 and 7.32 h for the cases that excluded and included Hg
treatment, respectively. The simulations that used sodium thiosulfate as the leaching
agent required 5.60 and 9.98 h for the cases that excluded and included Hg treatment,
respectively.
Figures 4 and 5 illustrate the resultant probability density functions for
𝐴𝑢𝑟𝑒𝑐𝑜𝑣𝑒𝑟𝑒𝑑(𝜃) and 𝑃𝑟𝑜𝑓𝑖𝑡𝑎(𝜃), respectively. The blue distributions correspond to so-
dium thiosulfate, and the black distributions correspond to sodium cyanide. The Y-axis is
the probability of the density function. This function describes the relative probability at
which the output variable will take certain value within a probable region limited by the
area under the curve. The dashed lines correspond to the cases that do not include the
mercury removal section, while the continuous lines are the systems that include the
mercury removal section. It is important to mention that the cases that do not include
these removal units include an additional cost for treating the generated contaminated
tailings. On the other hand, the systems that include the mercury removal section have
the advantage of recovering additional gold, which otherwise would be discarded into
the disposal tailings.
When analyzing the probability density function in Figures 4 and 5, it was observed
that the greatest existing risk fell in the processes that used sodium thiosulfate. This ob-
servation showed a greater degree of variability/dispersion through the widening of its
distributions when compared to the processes using sodium cyanide, in which the po-
tential risk was lower.
Figure 3. Framework for the stochastic analysis of gold recovery processes including the process simulator PRO/II and aPython environment connected through the Python–Component Object Model (COM) interface.
4. Results
In terms of computational time, the simulations that used sodium cyanide as the leach-ing agent required 5.62 and 7.32 h for the cases that excluded and included Hg treatment,respectively. The simulations that used sodium thiosulfate as the leaching agent required5.60 and 9.98 h for the cases that excluded and included Hg treatment, respectively.
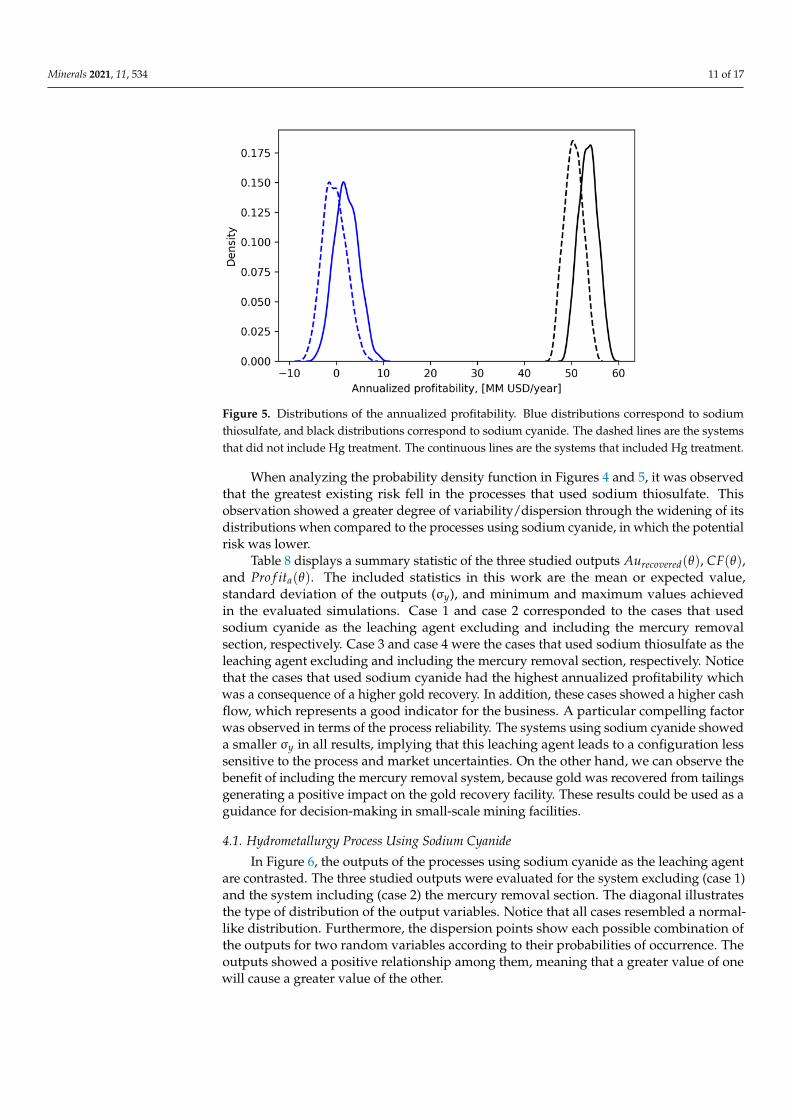
Figures 4 and 5 illustrate the resultant probability density functions for Aurecovered(θ)and Pro f ita(θ), respectively. The blue distributions correspond to sodium thiosulfate, andthe black distributions correspond to sodium cyanide. The Y-axis is the probability ofthe density function. This function describes the relative probability at which the outputvariable will take certain value within a probable region limited by the area under the curve.The dashed lines correspond to the cases that do not include the mercury removal section,while the continuous lines are the systems that include the mercury removal section. Itis important to mention that the cases that do not include these removal units includean additional cost for treating the generated contaminated tailings. On the other hand,the systems that include the mercury removal section have the advantage of recoveringadditional gold, which otherwise would be discarded into the disposal tailings.
Minerals 2021, 11, x FOR PEER REVIEW 11 of 18
Figure 4. Distributions of the gold recovery of the studied systems. Blue distributions correspond
to sodium thiosulfate, and black distributions correspond to sodium cyanide. The dashed lines are
the systems that do not include Hg treatment. The continuous lines are the systems that include Hg
treatment.
Figure 5. Distributions of the annualized profitability. Blue distributions correspond to sodium
thiosulfate, and black distributions correspond to sodium cyanide. The dashed lines are the sys-
tems that did not include Hg treatment. The continuous lines are the systems that included Hg
treatment.
Table 8 displays a summary statistic of the three studied outputs 𝐴𝑢𝑟𝑒𝑐𝑜𝑣𝑒𝑟𝑒𝑑(𝜃),
𝐶𝐹(𝜃), and 𝑃𝑟𝑜𝑓𝑖𝑡𝑎(𝜃). The included statistics in this work are the mean or expected
value, standard deviation of the outputs (σ𝑦 ), and minimum and maximum values
achieved in the evaluated simulations. Case 1 and case 2 corresponded to the cases that
used sodium cyanide as the leaching agent excluding and including the mercury removal
section, respectively. Case 3 and case 4 were the cases that used sodium thiosulfate as the
leaching agent excluding and including the mercury removal section, respectively. No-
tice that the cases that used sodium cyanide had the highest annualized profitability
which was a consequence of a higher gold recovery. In addition, these cases showed a
higher cash flow, which represents a good indicator for the business. A particular com-
pelling factor was observed in terms of the process reliability. The systems using sodium
cyanide showed a smaller σ𝑦 in all results, implying that this leaching agent leads to a
configuration less sensitive to the process and market uncertainties. On the other hand,
we can observe the benefit of including the mercury removal system, because gold was
Figure 4. Distributions of the gold recovery of the studied systems. Blue distributions correspondto sodium thiosulfate, and black distributions correspond to sodium cyanide. The dashed lines arethe systems that do not include Hg treatment. The continuous lines are the systems that includeHg treatment.
Minerals 2021, 11, 534 11 of 17
Minerals 2021, 11, x FOR PEER REVIEW 11 of 18
Figure 4. Distributions of the gold recovery of the studied systems. Blue distributions correspond
to sodium thiosulfate, and black distributions correspond to sodium cyanide. The dashed lines are
the systems that do not include Hg treatment. The continuous lines are the systems that include Hg
treatment.
Figure 5. Distributions of the annualized profitability. Blue distributions correspond to sodium
thiosulfate, and black distributions correspond to sodium cyanide. The dashed lines are the sys-
tems that did not include Hg treatment. The continuous lines are the systems that included Hg
treatment.
Table 8 displays a summary statistic of the three studied outputs 𝐴𝑢𝑟𝑒𝑐𝑜𝑣𝑒𝑟𝑒𝑑(𝜃),
𝐶𝐹(𝜃), and 𝑃𝑟𝑜𝑓𝑖𝑡𝑎(𝜃). The included statistics in this work are the mean or expected
value, standard deviation of the outputs (σ𝑦 ), and minimum and maximum values
achieved in the evaluated simulations. Case 1 and case 2 corresponded to the cases that
used sodium cyanide as the leaching agent excluding and including the mercury removal
section, respectively. Case 3 and case 4 were the cases that used sodium thiosulfate as the
leaching agent excluding and including the mercury removal section, respectively. No-
tice that the cases that used sodium cyanide had the highest annualized profitability
which was a consequence of a higher gold recovery. In addition, these cases showed a
higher cash flow, which represents a good indicator for the business. A particular com-
pelling factor was observed in terms of the process reliability. The systems using sodium
cyanide showed a smaller σ𝑦 in all results, implying that this leaching agent leads to a
configuration less sensitive to the process and market uncertainties. On the other hand,
we can observe the benefit of including the mercury removal system, because gold was
Figure 5. Distributions of the annualized profitability. Blue distributions correspond to sodiumthiosulfate, and black distributions correspond to sodium cyanide. The dashed lines are the systemsthat did not include Hg treatment. The continuous lines are the systems that included Hg treatment.
When analyzing the probability density function in Figures 4 and 5, it was observedthat the greatest existing risk fell in the processes that used sodium thiosulfate. Thisobservation showed a greater degree of variability/dispersion through the widening of itsdistributions when compared to the processes using sodium cyanide, in which the potentialrisk was lower.
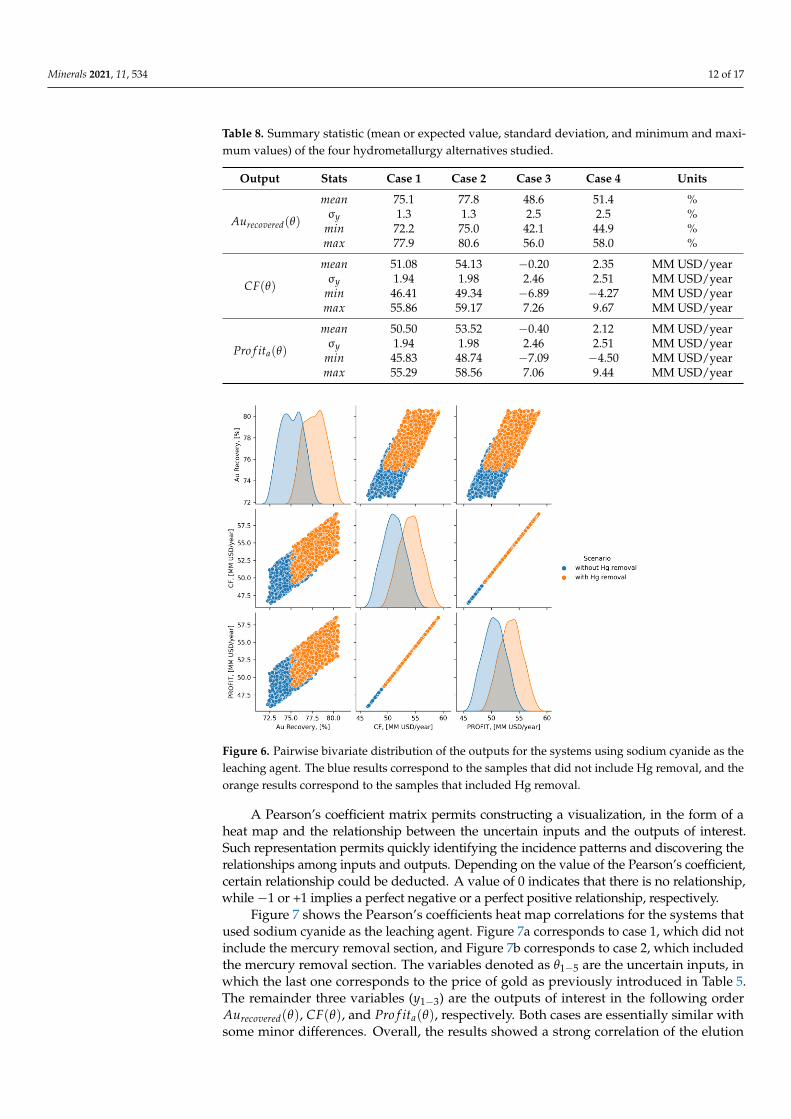
Table 8 displays a summary statistic of the three studied outputs Aurecovered(θ), CF(θ),and Pro f ita(θ). The included statistics in this work are the mean or expected value,standard deviation of the outputs (σy), and minimum and maximum values achievedin the evaluated simulations. Case 1 and case 2 corresponded to the cases that usedsodium cyanide as the leaching agent excluding and including the mercury removalsection, respectively. Case 3 and case 4 were the cases that used sodium thiosulfate as theleaching agent excluding and including the mercury removal section, respectively. Noticethat the cases that used sodium cyanide had the highest annualized profitability whichwas a consequence of a higher gold recovery. In addition, these cases showed a higher cashflow, which represents a good indicator for the business. A particular compelling factorwas observed in terms of the process reliability. The systems using sodium cyanide showeda smaller σy in all results, implying that this leaching agent leads to a configuration lesssensitive to the process and market uncertainties. On the other hand, we can observe thebenefit of including the mercury removal system, because gold was recovered from tailingsgenerating a positive impact on the gold recovery facility. These results could be used as aguidance for decision-making in small-scale mining facilities.
4.1. Hydrometallurgy Process Using Sodium Cyanide
In Figure 6, the outputs of the processes using sodium cyanide as the leaching agentare contrasted. The three studied outputs were evaluated for the system excluding (case 1)and the system including (case 2) the mercury removal section. The diagonal illustratesthe type of distribution of the output variables. Notice that all cases resembled a normal-like distribution. Furthermore, the dispersion points show each possible combination ofthe outputs for two random variables according to their probabilities of occurrence. Theoutputs showed a positive relationship among them, meaning that a greater value of onewill cause a greater value of the other.
Minerals 2021, 11, 534 12 of 17
Table 8. Summary statistic (mean or expected value, standard deviation, and minimum and maxi-mum values) of the four hydrometallurgy alternatives studied.
Output Stats Case 1 Case 2 Case 3 Case 4 Units
Aurecovered(θ)
mean 75.1 77.8 48.6 51.4 %σy 1.3 1.3 2.5 2.5 %
min 72.2 75.0 42.1 44.9 %max 77.9 80.6 56.0 58.0 %
CF(θ)
mean 51.08 54.13 −0.20 2.35 MM USD/yearσy 1.94 1.98 2.46 2.51 MM USD/year
min 46.41 49.34 −6.89 −4.27 MM USD/yearmax 55.86 59.17 7.26 9.67 MM USD/year
Pro f ita(θ)
mean 50.50 53.52 −0.40 2.12 MM USD/yearσy 1.94 1.98 2.46 2.51 MM USD/year
min 45.83 48.74 −7.09 −4.50 MM USD/yearmax 55.29 58.56 7.06 9.44 MM USD/year
Minerals 2021, 11, x FOR PEER REVIEW 12 of 18
recovered from tailings generating a positive impact on the gold recovery facility. These
results could be used as a guidance for decision-making in small-scale mining facilities.
Table 8. Summary statistic (mean or expected value, standard deviation, and minimum and maximum values) of the four
hydrometallurgy alternatives studied.
Output Stats Case 1 Case 2 Case 3 Case 4 Units
𝐴𝑢𝑟𝑒𝑐𝑜𝑣𝑒𝑟𝑒𝑑(𝜃)
𝑚𝑒𝑎𝑛 75.1 77.8 48.6 51.4 % σ𝑦 1.3 1.3 2.5 2.5 %
𝑚𝑖𝑛 72.2 75.0 42.1 44.9 %
𝑚𝑎𝑥 77.9 80.6 56.0 58.0 %
𝐶𝐹(𝜃)
𝑚𝑒𝑎𝑛 51.08 54.13 −0.20 2.35 MM USD/year σ𝑦 1.94 1.98 2.46 2.51 MM USD/year
𝑚𝑖𝑛 46.41 49.34 −6.89 -4.27 MM USD/year
𝑚𝑎𝑥 55.86 59.17 7.26 9.67 MM USD/year
𝑃𝑟𝑜𝑓𝑖𝑡𝑎(𝜃)
𝑚𝑒𝑎𝑛 50.50 53.52 −0.40 2.12 MM USD/year
σ𝑦 1.94 1.98 2.46 2.51 MM USD/year
𝑚𝑖𝑛 45.83 48.74 −7.09 -4.50 MM USD/year
𝑚𝑎𝑥 55.29 58.56 7.06 9.44 MM USD/year
4.1. Hydrometallurgy Process Using Sodium Cyanide
In Figure 6, the outputs of the processes using sodium cyanide as the leaching agent
are contrasted. The three studied outputs were evaluated for the system excluding (case
1) and the system including (case 2) the mercury removal section. The diagonal illustrates
the type of distribution of the output variables. Notice that all cases resembled a nor-
mal-like distribution. Furthermore, the dispersion points show each possible combina-
tion of the outputs for two random variables according to their probabilities of occur-
rence. The outputs showed a positive relationship among them, meaning that a greater
value of one will cause a greater value of the other.
Figure 6. Pairwise bivariate distribution of the outputs for the systems using sodium cyanide as the
leaching agent. The blue results correspond to the samples that did not include Hg removal, and
the orange results correspond to the samples that included Hg removal.
Figure 6. Pairwise bivariate distribution of the outputs for the systems using sodium cyanide as theleaching agent. The blue results correspond to the samples that did not include Hg removal, and theorange results correspond to the samples that included Hg removal.
A Pearson’s coefficient matrix permits constructing a visualization, in the form of aheat map and the relationship between the uncertain inputs and the outputs of interest.Such representation permits quickly identifying the incidence patterns and discovering therelationships among inputs and outputs. Depending on the value of the Pearson’s coefficient,certain relationship could be deducted. A value of 0 indicates that there is no relationship,while −1 or +1 implies a perfect negative or a perfect positive relationship, respectively.
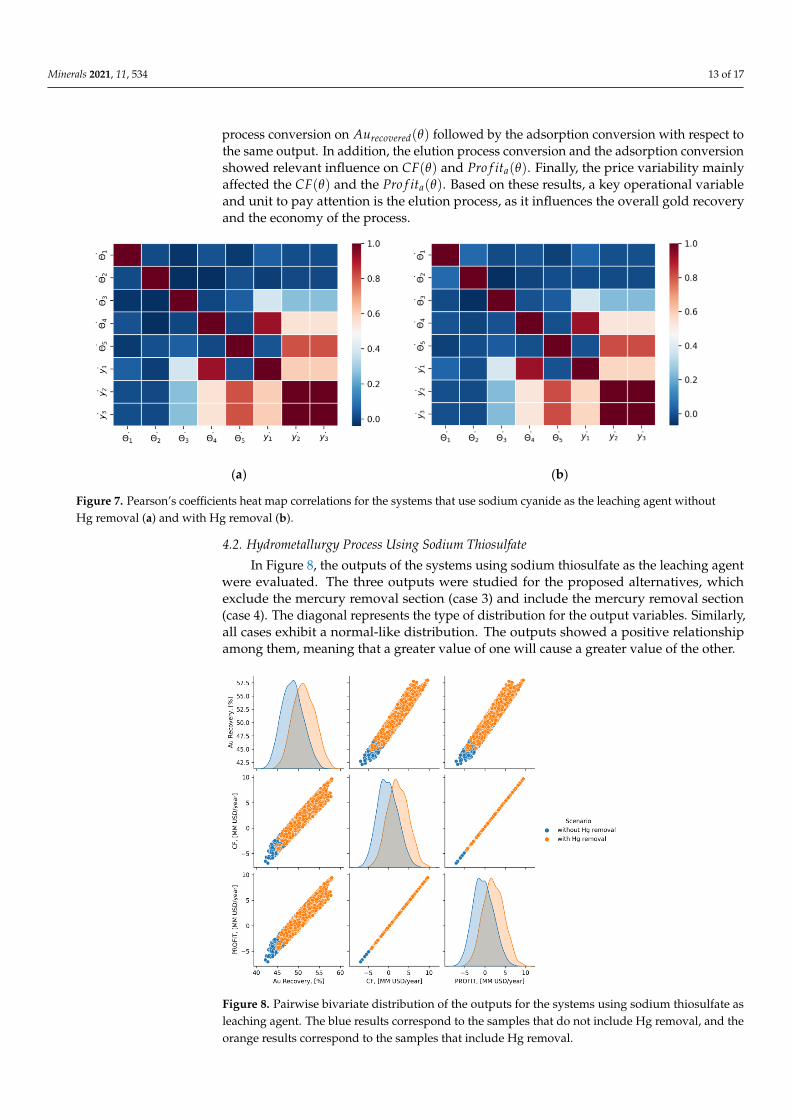
Figure 7 shows the Pearson’s coefficients heat map correlations for the systems thatused sodium cyanide as the leaching agent. Figure 7a corresponds to case 1, which did notinclude the mercury removal section, and Figure 7b corresponds to case 2, which includedthe mercury removal section. The variables denoted as θ1−5 are the uncertain inputs, inwhich the last one corresponds to the price of gold as previously introduced in Table 5.The remainder three variables (y1−3) are the outputs of interest in the following orderAurecovered(θ), CF(θ), and Pro f ita(θ), respectively. Both cases are essentially similar withsome minor differences. Overall, the results showed a strong correlation of the elution
Minerals 2021, 11, 534 13 of 17
process conversion on Aurecovered(θ) followed by the adsorption conversion with respect tothe same output. In addition, the elution process conversion and the adsorption conversionshowed relevant influence on CF(θ) and Pro f ita(θ). Finally, the price variability mainlyaffected the CF(θ) and the Pro f ita(θ). Based on these results, a key operational variableand unit to pay attention is the elution process, as it influences the overall gold recoveryand the economy of the process.
Minerals 2021, 11, x FOR PEER REVIEW 13 of 18
A Pearson’s coefficient matrix permits constructing a visualization, in the form of a
heat map and the relationship between the uncertain inputs and the outputs of interest.
Such representation permits quickly identifying the incidence patterns and discovering
the relationships among inputs and outputs. Depending on the value of the Pearson’s
coefficient, certain relationship could be deducted. A value of 0 indicates that there is no
relationship, while −1 or +1 implies a perfect negative or a perfect positive relationship,
respectively.
Figure 7 shows the Pearson’s coefficients heat map correlations for the systems that
used sodium cyanide as the leaching agent. Figure 7a corresponds to case 1, which did
not include the mercury removal section, and Figure 7b corresponds to case 2, which in-
cluded the mercury removal section. The variables denoted as 𝜃1−5 are the uncertain
inputs, in which the last one corresponds to the price of gold as previously introduced in
Table 5. The remainder three variables (𝑦1−3) are the outputs of interest in the following
order 𝐴𝑢𝑟𝑒𝑐𝑜𝑣𝑒𝑟𝑒𝑑(𝜃), 𝐶𝐹(𝜃) , and 𝑃𝑟𝑜𝑓𝑖𝑡𝑎(𝜃) , respectively. Both cases are essentially
similar with some minor differences. Overall, the results showed a strong correlation of
the elution process conversion on 𝐴𝑢𝑟𝑒𝑐𝑜𝑣𝑒𝑟𝑒𝑑(𝜃) followed by the adsorption conversion
with respect to the same output. In addition, the elution process conversion and the ad-
sorption conversion showed relevant influence on 𝐶𝐹(𝜃) and 𝑃𝑟𝑜𝑓𝑖𝑡𝑎(𝜃). Finally, the
price variability mainly affected the 𝐶𝐹(𝜃) and the 𝑃𝑟𝑜𝑓𝑖𝑡𝑎(𝜃). Based on these results, a
key operational variable and unit to pay attention is the elution process, as it influences
the overall gold recovery and the economy of the process.
(a) (b)
Figure 7. Pearson’s coefficients heat map correlations for the systems that use sodium cyanide as the leaching agent
without Hg removal (a) and with Hg removal (b).
4.2. Hydrometallurgy Process Using Sodium Thiosulfate
In Figure 8, the outputs of the systems using sodium thiosulfate as the leaching
agent were evaluated. The three outputs were studied for the proposed alternatives,
which exclude the mercury removal section (case 3) and include the mercury removal
section (case 4). The diagonal represents the type of distribution for the output variables.
Similarly, all cases exhibit a normal-like distribution. The outputs showed a positive re-
lationship among them, meaning that a greater value of one will cause a greater value of
the other.
Figure 7. Pearson’s coefficients heat map correlations for the systems that use sodium cyanide as the leaching agent withoutHg removal (a) and with Hg removal (b).
4.2. Hydrometallurgy Process Using Sodium Thiosulfate
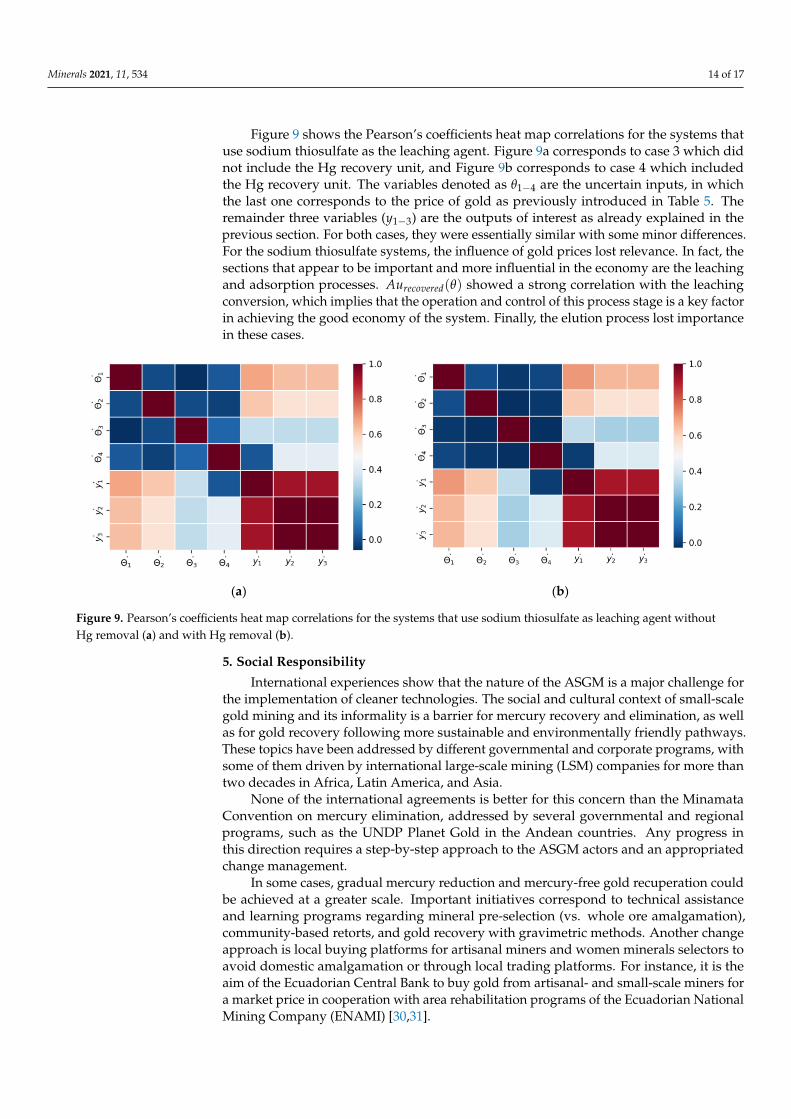
In Figure 8, the outputs of the systems using sodium thiosulfate as the leaching agentwere evaluated. The three outputs were studied for the proposed alternatives, whichexclude the mercury removal section (case 3) and include the mercury removal section(case 4). The diagonal represents the type of distribution for the output variables. Similarly,all cases exhibit a normal-like distribution. The outputs showed a positive relationshipamong them, meaning that a greater value of one will cause a greater value of the other.
Minerals 2021, 11, x FOR PEER REVIEW 14 of 18
Figure 8. Pairwise bivariate distribution of the outputs for the systems using sodium thiosulfate as
leaching agent. The blue results correspond to the samples that do not include Hg removal, and the
orange results correspond to the samples that include Hg removal.
Figure 9 shows the Pearson’s coefficients heat map correlations for the systems that
use sodium thiosulfate as the leaching agent. Figure 9a corresponds to case 3 which did
not include the Hg recovery unit, and Figure 9b corresponds to case 4 which included the
Hg recovery unit. The variables denoted as 𝜃1−4 are the uncertain inputs, in which the
last one corresponds to the price of gold as previously introduced in Table 5. The re-
mainder three variables (𝑦1−3) are the outputs of interest as already explained in the
previous section. For both cases, they were essentially similar with some minor differ-
ences. For the sodium thiosulfate systems, the influence of gold prices lost relevance. In
fact, the sections that appear to be important and more influential in the economy are the
leaching and adsorption processes. 𝐴𝑢𝑟𝑒𝑐𝑜𝑣𝑒𝑟𝑒𝑑(𝜃) showed a strong correlation with the
leaching conversion, which implies that the operation and control of this process stage is
a key factor in achieving the good economy of the system. Finally, the elution process lost
importance in these cases.
(a) (b)
Figure 8. Pairwise bivariate distribution of the outputs for the systems using sodium thiosulfate asleaching agent. The blue results correspond to the samples that do not include Hg removal, and theorange results correspond to the samples that include Hg removal.
Minerals 2021, 11, 534 14 of 17
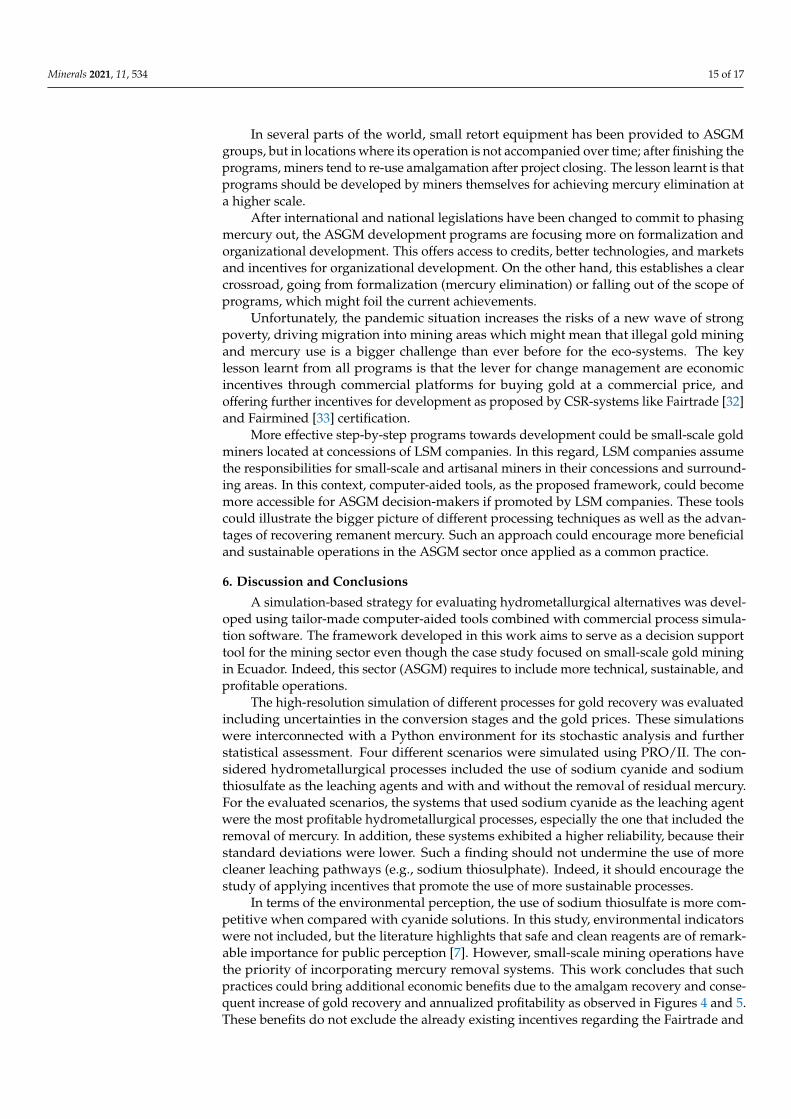
Figure 9 shows the Pearson’s coefficients heat map correlations for the systems thatuse sodium thiosulfate as the leaching agent. Figure 9a corresponds to case 3 which didnot include the Hg recovery unit, and Figure 9b corresponds to case 4 which includedthe Hg recovery unit. The variables denoted as θ1−4 are the uncertain inputs, in whichthe last one corresponds to the price of gold as previously introduced in Table 5. Theremainder three variables (y1−3) are the outputs of interest as already explained in theprevious section. For both cases, they were essentially similar with some minor differences.For the sodium thiosulfate systems, the influence of gold prices lost relevance. In fact, thesections that appear to be important and more influential in the economy are the leachingand adsorption processes. Aurecovered(θ) showed a strong correlation with the leachingconversion, which implies that the operation and control of this process stage is a key factorin achieving the good economy of the system. Finally, the elution process lost importancein these cases.
Minerals 2021, 11, x FOR PEER REVIEW 14 of 18
Figure 8. Pairwise bivariate distribution of the outputs for the systems using sodium thiosulfate as
leaching agent. The blue results correspond to the samples that do not include Hg removal, and the
orange results correspond to the samples that include Hg removal.
Figure 9 shows the Pearson’s coefficients heat map correlations for the systems that
use sodium thiosulfate as the leaching agent. Figure 9a corresponds to case 3 which did
not include the Hg recovery unit, and Figure 9b corresponds to case 4 which included the
Hg recovery unit. The variables denoted as 𝜃1−4 are the uncertain inputs, in which the
last one corresponds to the price of gold as previously introduced in Table 5. The re-
mainder three variables (𝑦1−3) are the outputs of interest as already explained in the
previous section. For both cases, they were essentially similar with some minor differ-
ences. For the sodium thiosulfate systems, the influence of gold prices lost relevance. In
fact, the sections that appear to be important and more influential in the economy are the
leaching and adsorption processes. 𝐴𝑢𝑟𝑒𝑐𝑜𝑣𝑒𝑟𝑒𝑑(𝜃) showed a strong correlation with the
leaching conversion, which implies that the operation and control of this process stage is
a key factor in achieving the good economy of the system. Finally, the elution process lost
importance in these cases.
(a) (b)
Figure 9. Pearson’s coefficients heat map correlations for the systems that use sodium thiosulfate as leaching agent withoutHg removal (a) and with Hg removal (b).
5. Social Responsibility
International experiences show that the nature of the ASGM is a major challenge forthe implementation of cleaner technologies. The social and cultural context of small-scalegold mining and its informality is a barrier for mercury recovery and elimination, as wellas for gold recovery following more sustainable and environmentally friendly pathways.These topics have been addressed by different governmental and corporate programs, withsome of them driven by international large-scale mining (LSM) companies for more thantwo decades in Africa, Latin America, and Asia.
None of the international agreements is better for this concern than the MinamataConvention on mercury elimination, addressed by several governmental and regionalprograms, such as the UNDP Planet Gold in the Andean countries. Any progress inthis direction requires a step-by-step approach to the ASGM actors and an appropriatedchange management.
In some cases, gradual mercury reduction and mercury-free gold recuperation couldbe achieved at a greater scale. Important initiatives correspond to technical assistanceand learning programs regarding mineral pre-selection (vs. whole ore amalgamation),community-based retorts, and gold recovery with gravimetric methods. Another changeapproach is local buying platforms for artisanal miners and women minerals selectors toavoid domestic amalgamation or through local trading platforms. For instance, it is theaim of the Ecuadorian Central Bank to buy gold from artisanal- and small-scale miners fora market price in cooperation with area rehabilitation programs of the Ecuadorian NationalMining Company (ENAMI) [30,31].
Minerals 2021, 11, 534 15 of 17
In several parts of the world, small retort equipment has been provided to ASGMgroups, but in locations where its operation is not accompanied over time; after finishing theprograms, miners tend to re-use amalgamation after project closing. The lesson learnt is thatprograms should be developed by miners themselves for achieving mercury elimination ata higher scale.
After international and national legislations have been changed to commit to phasingmercury out, the ASGM development programs are focusing more on formalization andorganizational development. This offers access to credits, better technologies, and marketsand incentives for organizational development. On the other hand, this establishes a clearcrossroad, going from formalization (mercury elimination) or falling out of the scope ofprograms, which might foil the current achievements.
Unfortunately, the pandemic situation increases the risks of a new wave of strongpoverty, driving migration into mining areas which might mean that illegal gold miningand mercury use is a bigger challenge than ever before for the eco-systems. The keylesson learnt from all programs is that the lever for change management are economicincentives through commercial platforms for buying gold at a commercial price, andoffering further incentives for development as proposed by CSR-systems like Fairtrade [32]and Fairmined [33] certification.
More effective step-by-step programs towards development could be small-scale goldminers located at concessions of LSM companies. In this regard, LSM companies assumethe responsibilities for small-scale and artisanal miners in their concessions and surround-ing areas. In this context, computer-aided tools, as the proposed framework, could becomemore accessible for ASGM decision-makers if promoted by LSM companies. These toolscould illustrate the bigger picture of different processing techniques as well as the advan-tages of recovering remanent mercury. Such an approach could encourage more beneficialand sustainable operations in the ASGM sector once applied as a common practice.
6. Discussion and Conclusions
A simulation-based strategy for evaluating hydrometallurgical alternatives was devel-oped using tailor-made computer-aided tools combined with commercial process simula-tion software. The framework developed in this work aims to serve as a decision supporttool for the mining sector even though the case study focused on small-scale gold miningin Ecuador. Indeed, this sector (ASGM) requires to include more technical, sustainable, andprofitable operations.
The high-resolution simulation of different processes for gold recovery was evaluatedincluding uncertainties in the conversion stages and the gold prices. These simulationswere interconnected with a Python environment for its stochastic analysis and furtherstatistical assessment. Four different scenarios were simulated using PRO/II. The con-sidered hydrometallurgical processes included the use of sodium cyanide and sodiumthiosulfate as the leaching agents and with and without the removal of residual mercury.For the evaluated scenarios, the systems that used sodium cyanide as the leaching agentwere the most profitable hydrometallurgical processes, especially the one that included theremoval of mercury. In addition, these systems exhibited a higher reliability, because theirstandard deviations were lower. Such a finding should not undermine the use of morecleaner leaching pathways (e.g., sodium thiosulphate). Indeed, it should encourage thestudy of applying incentives that promote the use of more sustainable processes.
In terms of the environmental perception, the use of sodium thiosulfate is more com-petitive when compared with cyanide solutions. In this study, environmental indicatorswere not included, but the literature highlights that safe and clean reagents are of remark-able importance for public perception [7]. However, small-scale mining operations havethe priority of incorporating mercury removal systems. This work concludes that suchpractices could bring additional economic benefits due to the amalgam recovery and conse-quent increase of gold recovery and annualized profitability as observed in Figures 4 and 5.These benefits do not exclude the already existing incentives regarding the Fairtrade and
Minerals 2021, 11, 534 16 of 17
the Fairmined certification for gold commercialization. Overall, the combination of betterand more sustainable practices, guided by technologically oriented frameworks as theproposed one, have the potential of improving the ASGM sector in Ecuador and to bringbenefits for all the actors.
Author Contributions: Conceptualization: S.D.S.; methodology, S.D.S. and Y.G.; software, P.C. andJ.C.G.; validation, S.D.S. and E.P.-C.; formal analysis, S.D.S. and Y.G.; writing of the original draftpreparation, P.C. and J.C.G.; writing of review and editing, S.D.S., Y.G., E.P.-C., and R.K.; visualization,S.D.S. and J.C.G. All authors have read and agreed to the published version of the manuscript.
Funding: This research received no external funding.
Institutional Review Board Statement: Not applicable.
Informed Consent Statement: Not applicable.
Data Availability Statement: Data regarding the results of the simulations of the studied hydromet-allurgical processes are available in the following repository: https://github.com/RockyRambo/Simulation-Based-Analysis-of-Hydrometallurgical-Processes.git (accessed on 13 May 2021).
Acknowledgments: The authors would like to acknowledge AVEVA for facilitating the processsimulator PRO/II 10.2 under the academic program license for its use at the Polytechnic University ofthe Coast (ESPOL), Guayaquil, Ecuador. In addition, thanks are given to Juan M. Menéndez-Aguadofrom the Polytechnic University of Mieres, University of Oviedo, for providing important suggestionsand comments on this manuscript.
Conflicts of Interest: The authors declare no conflict of interest.
References1. Hevia, C.; Neumeyer, A. A Conceptual Framework for Analyzing the Economic Impact of COVID-19 and its Policy Implications.
UNDP LAC441 COVID-19 Policy Doc. Ser. 1 2020, 1, 29.2. EITI. Extractive Industries Transparency Initiative—Ecuador. Available online: https://eiti.org/es/implementing_country/98
(accessed on 11 May 2021).3. Velásquez-López, P.C.; Páez-Varas, C.; Benavides-Zúñiga, X.; Gallegos, F.; Fallon, G. Women mine-rock waste collectors in
artisanal and small-scale mining in Ecuador: Challenges and opportunities. Extr. Ind. Soc. 2020, 7, 1579–1586. [CrossRef]4. Thomas, M.J. Ecuador Gold Supply Chain: Analysis of Government Intervention in the Artisanal Mining Sector. Ph.D. Thesis,
The University of British Columbia, Vancouver, BC, Canada, 2019.5. Gaudry, K.H.; Charro, D.M.; Villacreses, G.; Castillo, W.; Shaban, A. Estimating scales of gold ore production and processing
in Zaruma and La Merced de Buenos Aires, Ecuador: Electrical power consumption as an indirect metric. Extr. Ind. Soc.2020, 7, 847–854. [CrossRef]
6. Gonçalves, A.O.; Marshall, B.G.; Kaplan, R.J.; Moreno-Chavez, J.; Veiga, M.M. Evidence of reduced mercury loss and increaseduse of cyanidation at gold processing centers in southern Ecuador. J. Clean. Prod. 2017, 165, 836–845. [CrossRef]
7. Aylmore, M.G. Thiosulfate as an Alternative Lixiviant to Cyanide for Gold Ores; Elsevier B.V.: Amsterdam, The Netherlands, 2016;ISBN 9780444636584.
8. Cisternas, L.A.; Lucay, F.A.; Botero, Y.L. Trends in modeling, design, and optimization of multiphase systems in mineralsprocessing. Minerals 2020, 10, 22. [CrossRef]
9. Ahmed, F.E.; Young, B.D.; Bryson, A.W. Comparison and modelling of the adsorption kinetics of gold cyanide onto activatedcarbon and resin in a silica slurry. Hydrometallurgy 1992, 30, 257–275. [CrossRef]
10. Yin, X.; Opara, A.; Du, H.; Miller, J.D. Molecular dynamics simulations of metal-cyanide complexes: Fundamental considerationsin gold hydrometallurgy. Hydrometallurgy 2011, 106, 64–70. [CrossRef]
11. Khalesi, M.R.; Zarei, M.J.; Sayadi, A.R.; Khoshnam, F.; Hemmati Chegeni, M. Development of a techno-economic simulation toolfor an improved mineral processing plant design. Miner. Eng. 2015, 81, 103–108. [CrossRef]
12. Karrech, A.; Attar, M.; Oraby, E.A.; Eksteen, J.J.; Elchalakani, M.; Seibi, A.C. Modelling of multicomponent reactive transport infinite columns—Application to gold recovery using iodide ligands. Hydrometallurgy 2018, 178, 43–53. [CrossRef]
13. Jun, Z.; Hua, Y.; Hongxia, Y.; Zhongda, T.; Runda, J. Gold recovery modeling based on interval prediction for a gold cyanidationleaching plant. IEEE Access 2019, 7, 71511–71528. [CrossRef]
14. Nikkhah, K. Role of Simulation Software in Design and Operation of Metallurgical Plants: A Case Study. Availableonline: https://www.andritz.com/resource/blob/14794/3d282780924827727a1efc8a5953f0dc/aa-automation-simulation-metallurgical-plants-data.pdf (accessed on 15 May 2021).
15. Lv, Y.; Zheng, S.; Du, H.; Wang, S.; Zhang, Y. The application of metsim in hydrometallurgy process: A case study. Adv. Mater. Res.2012, 581–582, 988–995. [CrossRef]
Minerals 2021, 11, 534 17 of 17
16. Okudan, M.D.; Akcil, A.; Tuncuk, A.; Deveci, H. Effect of parameters on vanadium recovery from by-products of the Bayerprocess. Hydrometallurgy 2015, 152, 76–83. [CrossRef]
17. Saidi, M.; Kadkhodayan, H. Experimental and simulation study of copper recovery process from copper oxide ore using aspenplus software: Optimization and sensitivity analysis of effective parameters. J. Environ. Chem. Eng. 2020, 8, 103772. [CrossRef]
18. Elomaa, H.; Rintala, L.; Aromaa, J.; Lundström, M. Process simulation based life cycle assessment of cyanide-free refractory goldconcentrate processing—Case study: Cupric chloride leaching. Miner. Eng. 2020, 157, 106559. [CrossRef]
19. Pesantes, A.A.; Carpio, E.P.; Vitvar, T.; López, M.M.M.; Menéndez-Aguado, J.M. A multi-index analysis approach to heavy metalpollution assessment in river sediments in the Ponce Enríquez Area, Ecuador. Water 2019, 11, 590. [CrossRef]
20. Marsden, J.O.; House, C.I. The Chemistry of Gold Extraction, 2nd ed.; Society for Mining, Metallurgy, and Exploration (SME):Englewood, Colorado, 2005; ISBN 9780873352741.
21. Zhang, S.; Nicol, M.J. An electrochemical study of the dissolution of gold in thiosulfate solutions. Part II. Effect of Copper.J. Appl. Electrochem. 2005, 35, 339–345. [CrossRef]
22. Khalifa, M.; Lue, L. A group contribution method for predicting the solubility of mercury. Fluid Phase Equilib. 2017, 432, 76–84.[CrossRef]
23. Geraili, A.; Salas, S.; Romagnoli, J.A. A Decision Support Tool for Optimal Design of Integrated Biorefineries under Strategic andOperational Level Uncertainties. Ind. Eng. Chem. Res. 2016, 55, 1667–1676. [CrossRef]
24. Salas, S.D.; Geraili, A.; Romagnoli, J.A. Optimization of Renewable Energy Businesses under Operational Level Uncertaintiesthrough Extensive Sensitivity Analysis and Stochastic Global Optimization. Ind. Eng. Chem. Res. 2017, 56, 3360–3372. [CrossRef]
25. Turton, R.; Bailie, R.C.; Whiying, W.B.; Shaeiwitz, J.A. Analysis, Synthesis, and Design of Chemical Processes, 3rd ed.; PearsonEducation, Inc.: London, UK, 2008; ISBN 9780132618120.
26. Khosravi, R.; Azizi, A.; Ghaedrahmati, R.; Gupta, V.K.; Agarwal, S. Adsorption of gold from cyanide leaching solution onto acti-vated carbon originating from coconut shell—Optimization, kinetics and equilibrium studies. J. Ind. Eng. Chem. 2017, 54, 464–471.[CrossRef]
27. Cango Siguencia, P.L.; Gómez Ordoñez, J.C. Techno-Economic Analysis of Sustainable Hydrometallurgical Alternatives for Gold RecoveryFocused on Small-Scale Mining Processes; Escuela Superior Politécnica del Litoral: Guayaquil, Ecuador, 2020.
28. Jones, M.N.; Frutiger, J.; Ince, N.G.; Sin, G. The Monte Carlo driven and machine learning enhanced process simulator.Comput. Chem. Eng. 2019, 125, 324–338. [CrossRef]
29. Salas, S.D.; Contreras-Salas, L.; Rubio-Dueñas, P.; Chebeir, J.; Romagnoli, J.A. A Multi-Objective Evolutionary OptimizationFramework for a Natural Gas Liquids Recovery Unit. Comput. Chem. Eng. 2021, 107363. [CrossRef]
30. Banco Central del Ecuador. Comercialización de Oro. Available online: https://www.bce.fin.ec/index.php/comercializacion-de-oro(accessed on 11 April 2021).
31. ENAMI, EP. Empresa Nacional Minera de Ecuador. Available online: https://www.enamiep.gob.ec (accessed on 11 April 2021).32. Fairtrade International. Criterio Fairtrade para el Oro y los Metales Preciosos Asociados para la Minería Artesanal y en Pequeña Escala.
Available online: https://files.fairtrade.net/standards/Gold-and-Precious-Metals_SP.pdf (accessed on 15 May 2021).33. Alianza por la Minería Responsable & Fairmined. Estándar Fairmined para Oro de Minería Artesanal y de Pequeña Escala, Incluyendo
Metales Preciosos Asociados. Available online: http://www.responsiblemines.org/wp-content/uploads/2017/05/Est%C3%A1ndar-Fairmined-2.0_2014_-1.pdf (accessed on 15 May 2021).